

Compact Muon Solenoid
LHC, CERN
| CMS-HIN-14-016 ; CERN-PH-EP-2015-329 | ||
| Correlations between jets and charged particles in PbPb and pp collisions at $\sqrt{s_{\mathrm{NN}}} =$ 2.76 TeV | ||
| CMS Collaboration | ||
| 1 January 2016 | ||
| J. High Energy Phys. 02 (2016) 156 | ||
| Abstract: The quark-gluon plasma is studied via medium-induced changes to correlations between jets and charged particles in PbPb collisions compared to pp reference data. This analysis uses data sets from PbPb and pp collisions with integrated luminosities of 166 $\mu$b$^{-1}$ and 5.3 pb$^{-1}$, respectively, collected at $\sqrt{s_{\mathrm{NN}}} =$ 2.76 TeV. The angular distributions of charged particles are studied as a function of relative pseudorapidity ($\Delta\eta$) and relative azimuthal angle ($\Delta\phi$) with respect to reconstructed jet directions. Charged particles are correlated with all jets with transverse momentum ($p_{\mathrm{T}}$) above 120 GeV, and with the leading and subleading jets (the highest and second-highest in $p_{\mathrm{T}}$, respectively) in a selection of back-to-back dijet events. Modifications in PbPb data relative to pp reference data are characterized as a function of PbPb collision centrality and charged particle $p_{\mathrm{T}}$. A centrality-dependent excess of low-$p_{\mathrm{T}}$ particles is present for all jets studied, and is most pronounced in the most central events. This excess of low-$p_{\mathrm{T}}$ particles follows a Gaussian-like distribution around the jet axis, and extends to large relative angles of $\Delta\eta\approx 1$ and $\Delta\phi\approx 1$. | ||
| Links: e-print arXiv:1601.00079 [nucl-ex] (PDF) ; CDS record ; inSPIRE record ; HepData record ; CADI line (restricted) ; | ||
| Figures | |
png pdf |
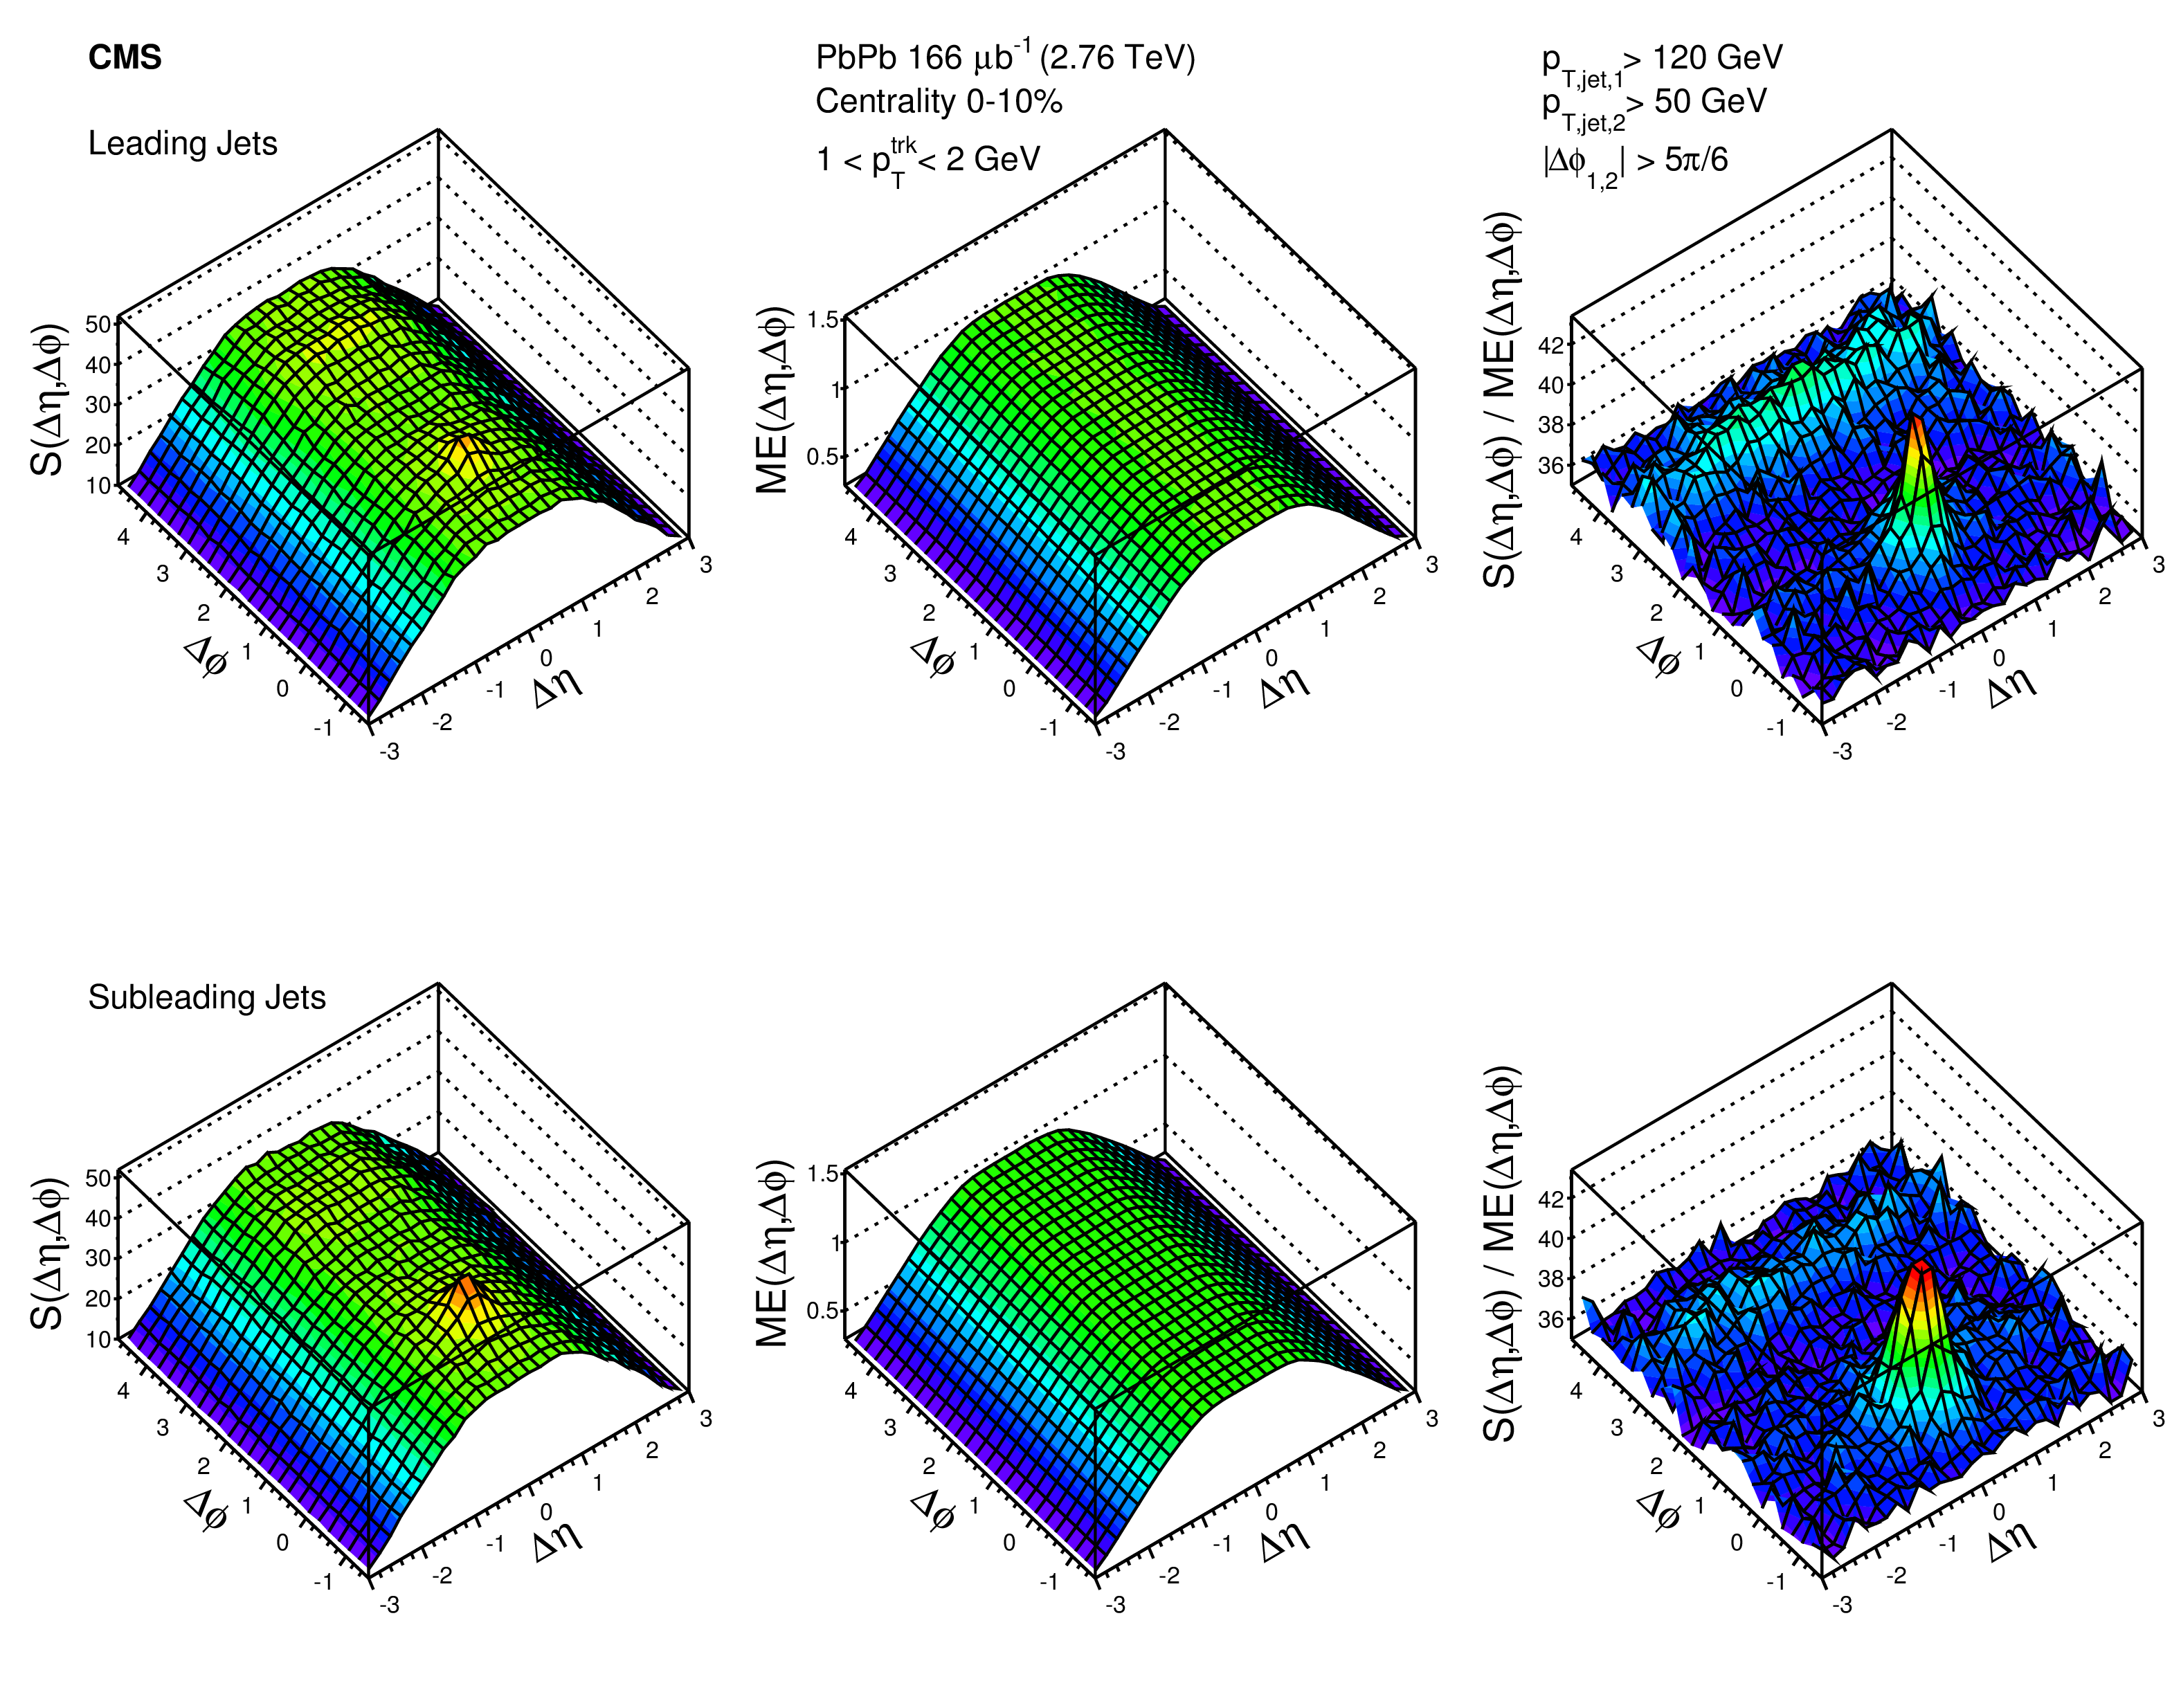
Figure 1:
Jet-track correlation signal shape $S(\Delta \eta ,\Delta \phi )$ for tracks with 1 $ < {p_{\mathrm {T}}} ^\text {trk} < $ 2 GeV in 0-10% central events (left), and corresponding mixed event shape $ME(\Delta \eta ,\Delta \phi )$ for the same centrality and $ {p_{\mathrm {T}}} ^\text {trk}$ bin (center). Their ratio gives the acceptance-corrected yield (right). The top row shows the correlation between leading jets (with $p_{\mathrm {T},\text {jet1}}> $ 120 GeV ) and all tracks, while the bottom row shows the correlation between subleading jets (with $p_{\mathrm {T},\text {jet2}}>$ 50 GeV ) and all tracks. |
png pdf |
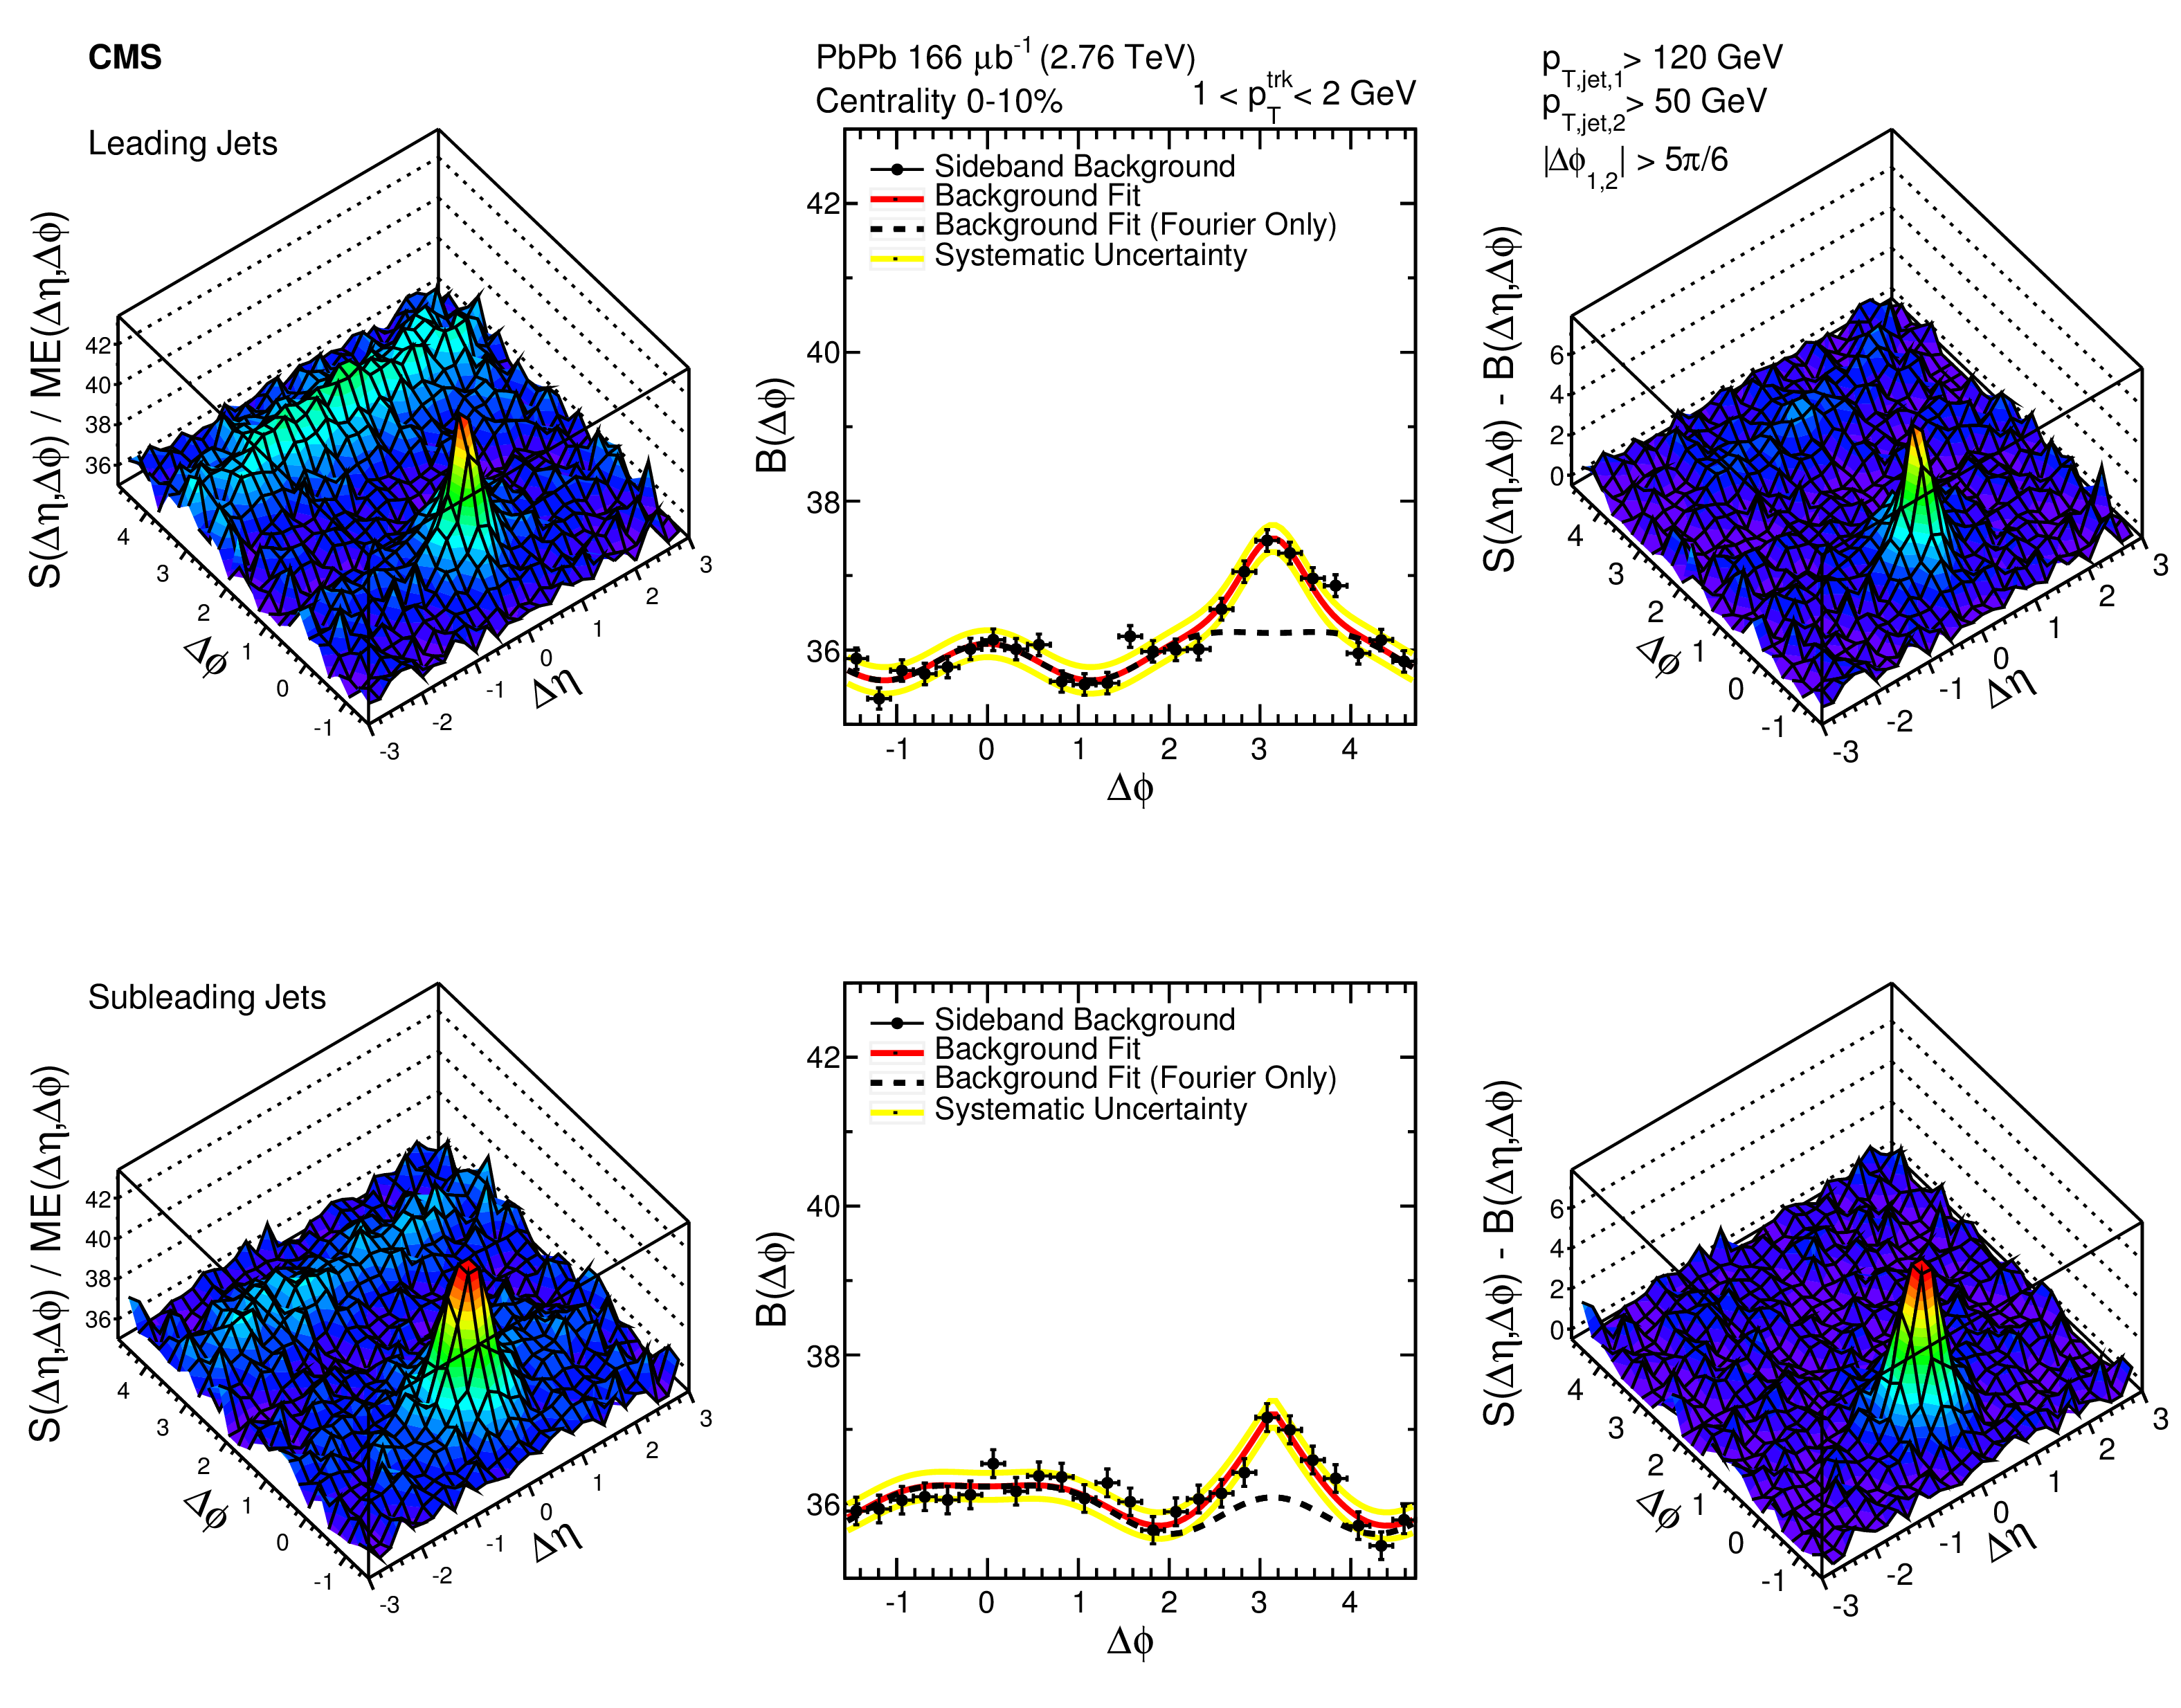
Figure 2:
Acceptance-corrected 2D jet-track correlation yield (left) is projected over the range 1.5 $< {| \Delta \eta | }<$ 3.0, producing a 1D background distribution (center). The fit to this distribution (indicated with a red dark line) is subtracted from the total yield to obtain the 2D background-subtracted yield shown on the right (for tracks with 1 $ < {p_{\mathrm {T}}} ^\text {trk} < $ 2 GeV). The black dashed line shows the background level and Fourier flow harmonic components of the fit only, excluding the away-side peak. Yellow lines in the $B(\Delta \phi )$ plot (middle panel) indicate the systematic uncertainty assigned to the background subtraction. |

png pdf |
Figure 3:
Symmetrized $\Delta \eta $ distributions (projected over $ {| \Delta \phi | } <$ 1) of background-subtracted particle yields correlated to PbPb and pp inclusive jets with $ {p_{\mathrm {T}}} >$ 120 GeV are shown in the top panels for tracks with 1 $ < p_{T}^\text {trk} < $ 2 GeV . The difference in PbPb and pp per-jet yields is shown in the bottom panels. The total systematic uncertainties are shown as shaded boxes, and statistical uncertainties are shown as vertical bars (often smaller than the symbol size). |
png pdf |
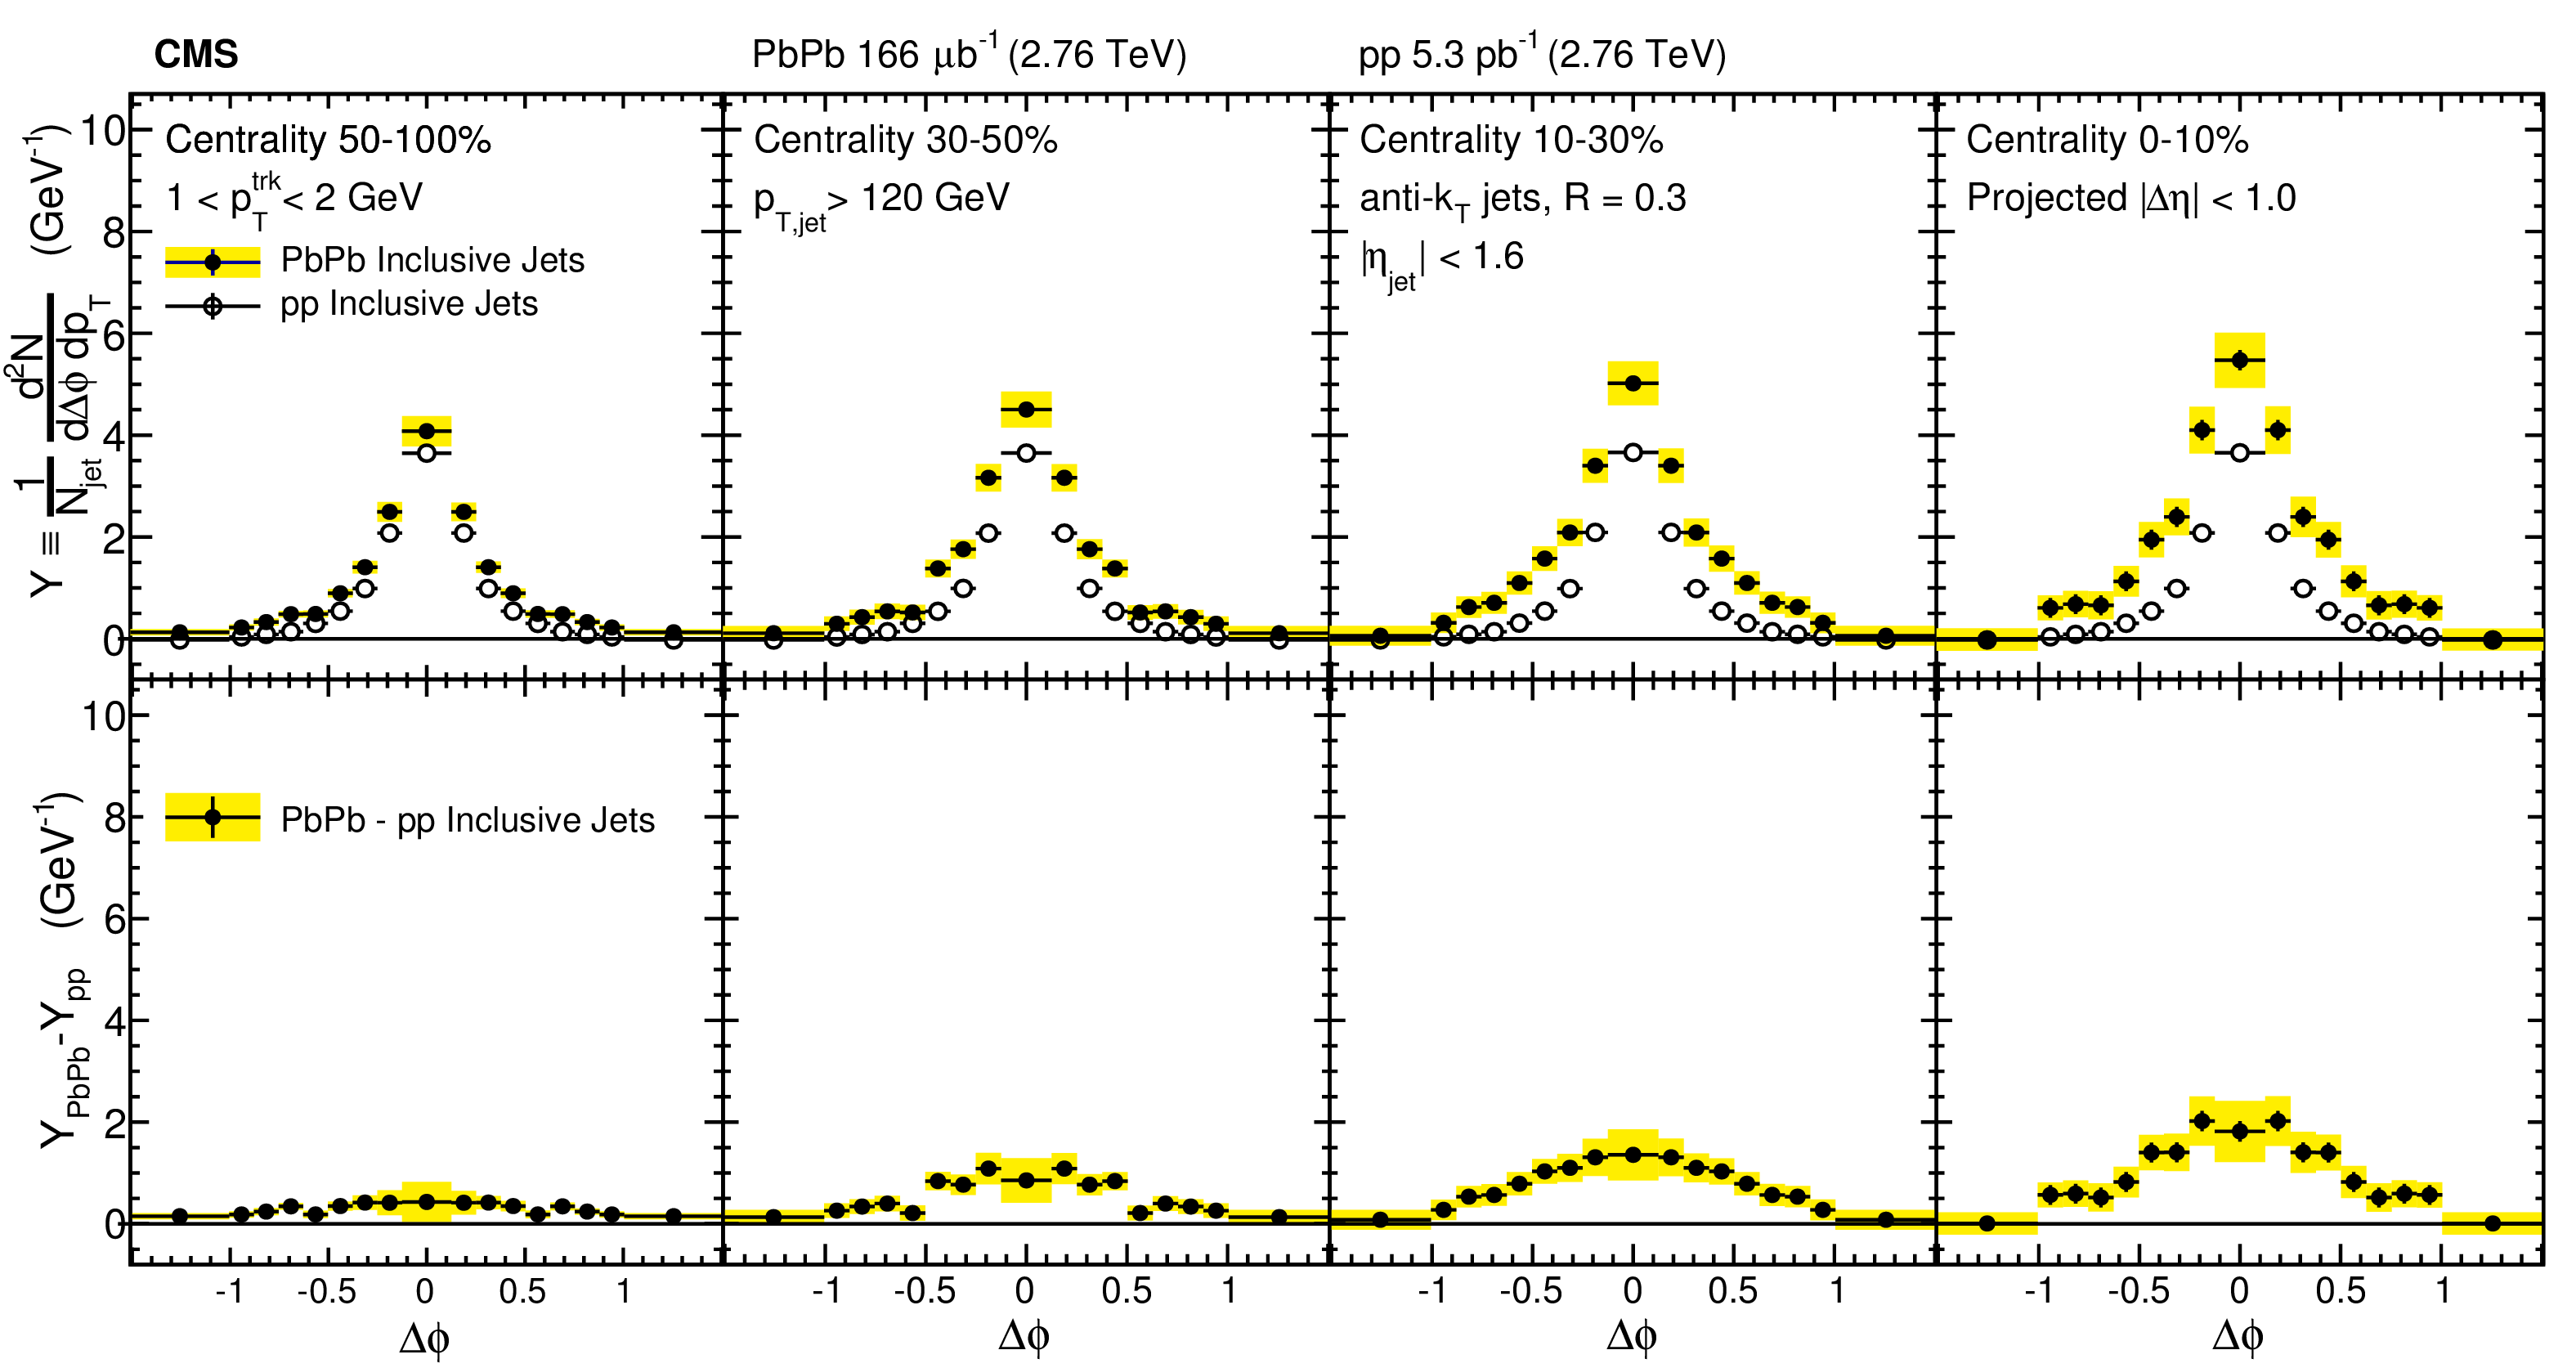
Figure 4:
Symmetrized $\Delta \phi $ distributions (projected over $ {| \Delta \eta | } <$ 1) of background-subtracted particle yields correlated to PbPb and pp inclusive jets with $ {p_{\mathrm {T}}} >$ 120 GeV are shown in the top panels for tracks with 1 $ < p_{T}^\text {trk} < $ 2 GeV . The difference in PbPb and pp per-jet yields is shown in the bottom panels. The total systematic uncertainties are shown as shaded boxes, and statistical uncertainties are shown as vertical bars (often smaller than the symbol size). |
png pdf |
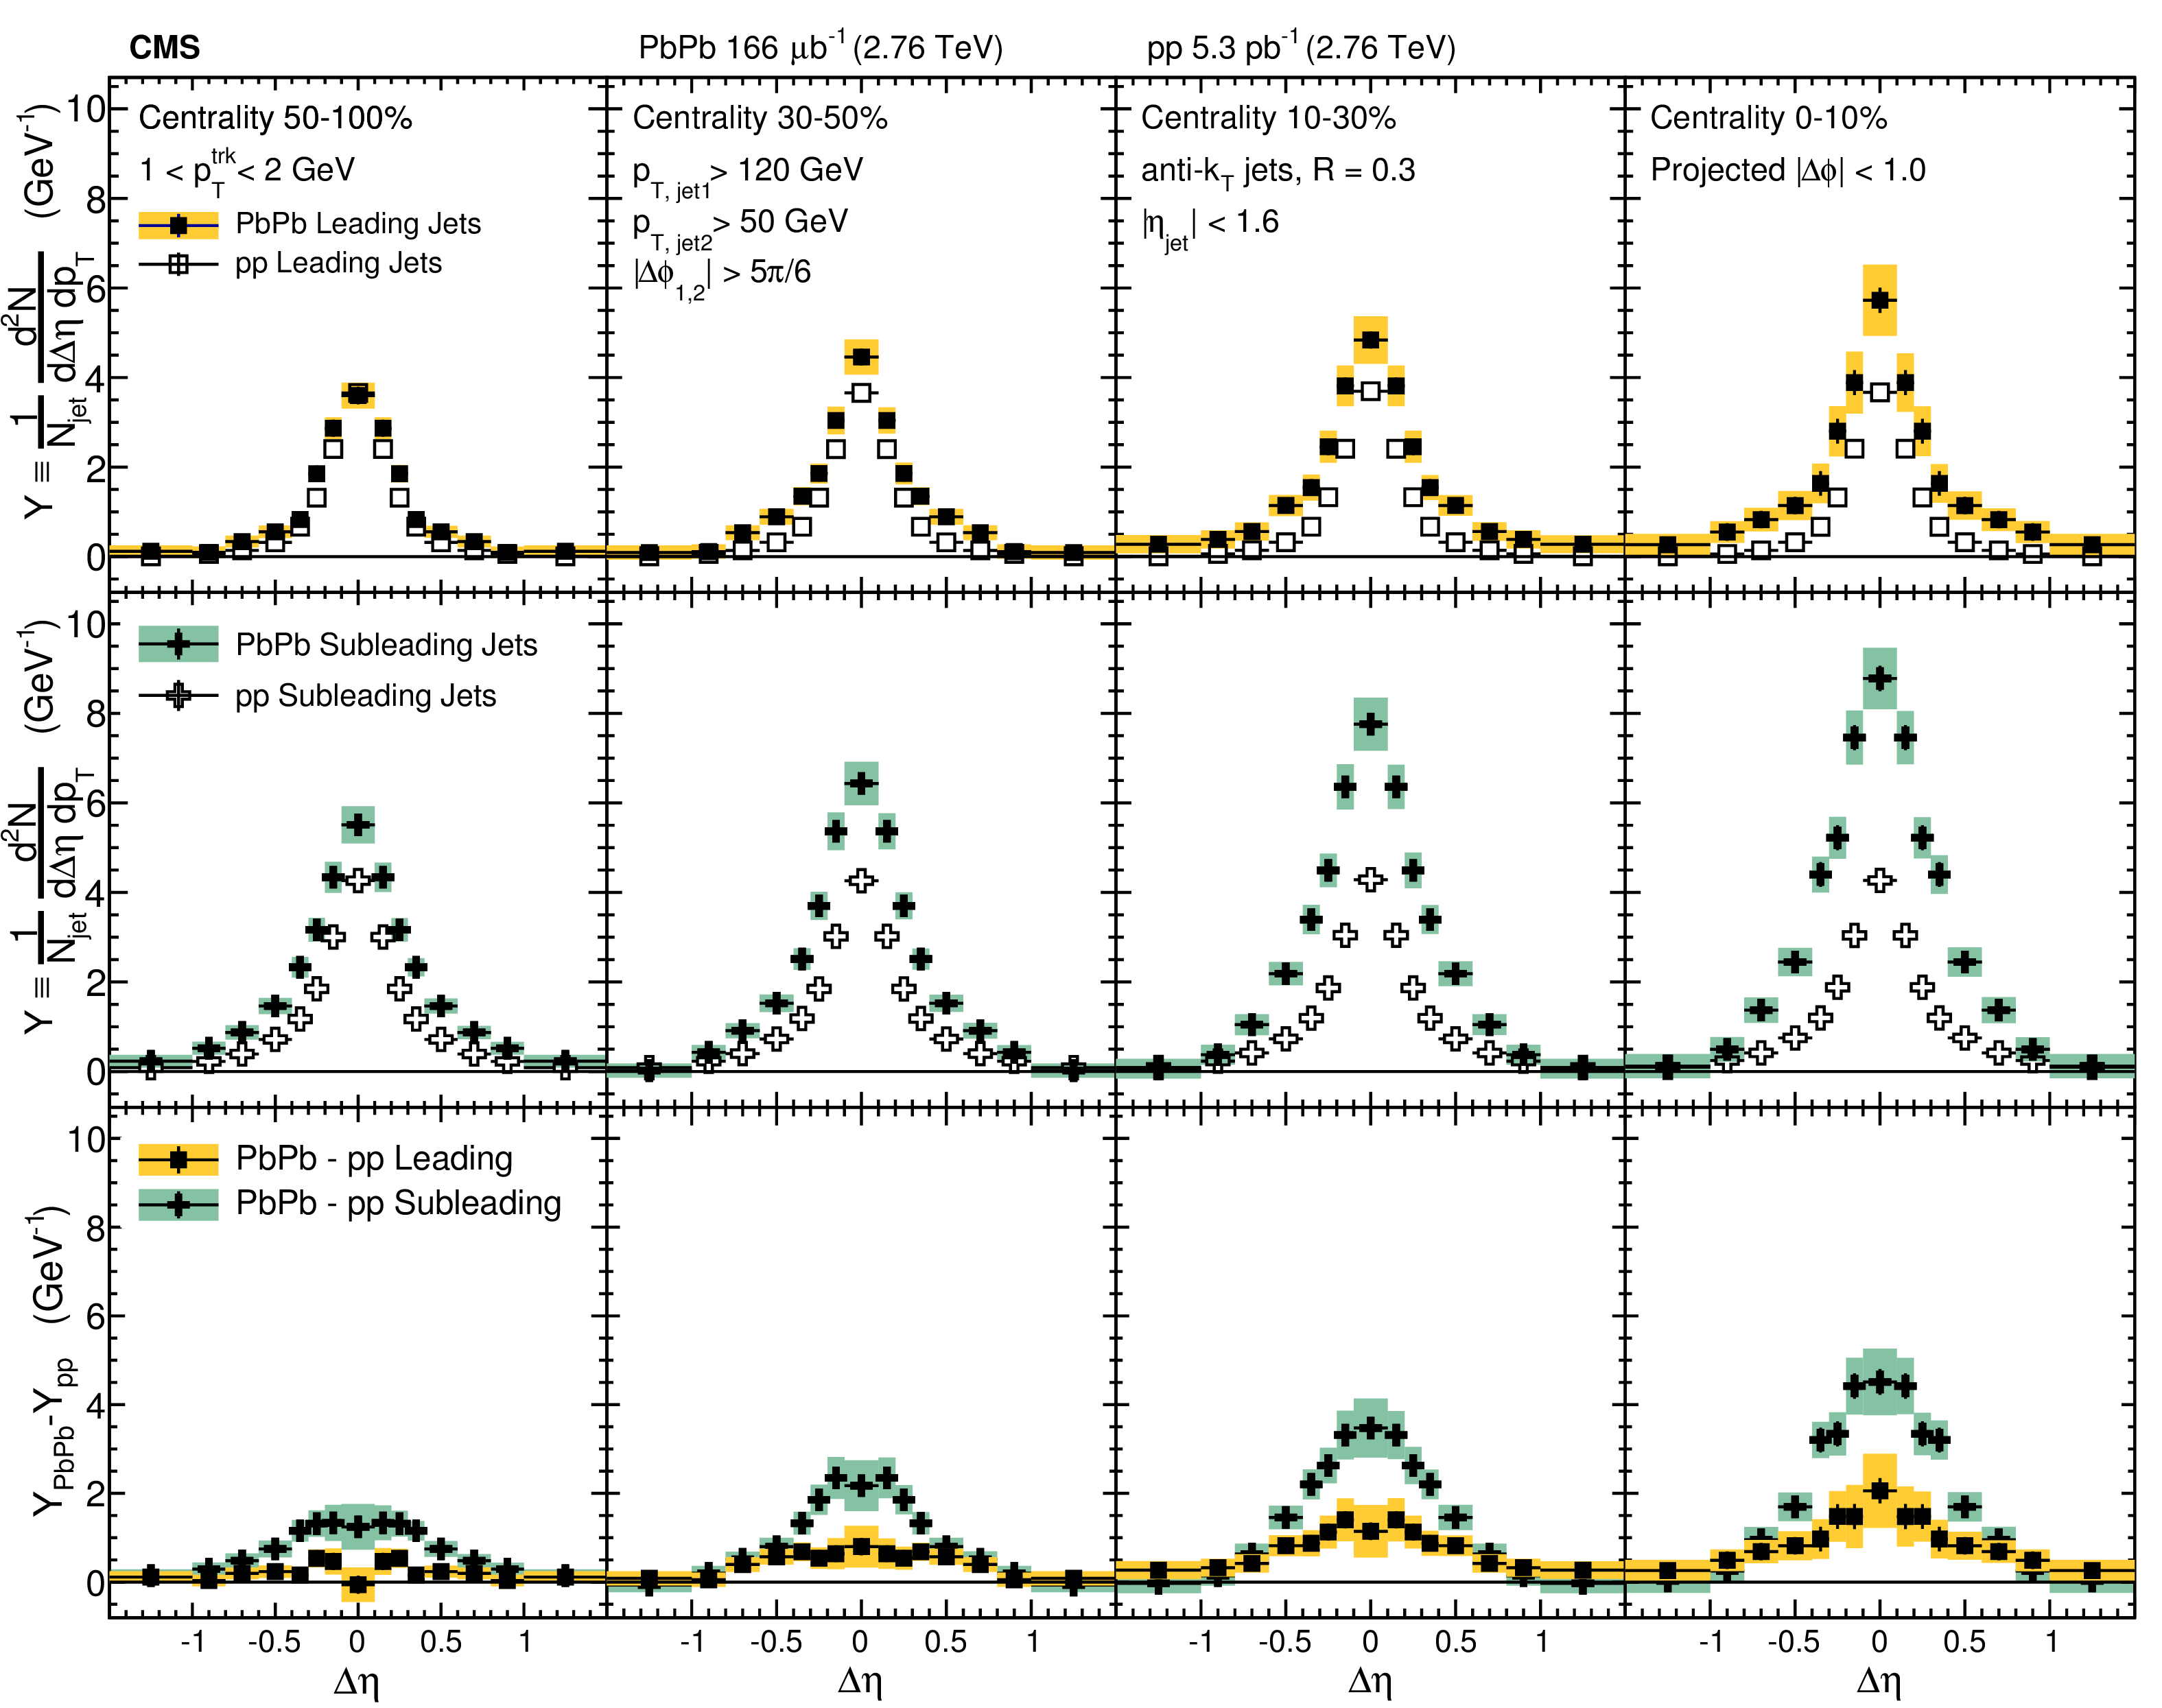
Figure 5:
The top panels show the $\Delta \eta $ distributions (projected over $ {| \Delta \phi | } <$ 1) of charged-particle background-subtracted yields correlated to PbPb and pp leading jets with $p_{\mathrm {T},\text {jet1}}>$ 120 GeV. The middle panels show the same distributions for subleading jets with $p_{\mathrm {T},\text {jet2}}>$ 50 GeV, and the bottom panels show the difference PbPb minus pp for both leading and subleading jets. The total systematic uncertainties are shown as shaded boxes, and statistical uncertainties are shown as vertical bars (often smaller than the symbol size). |
png pdf |
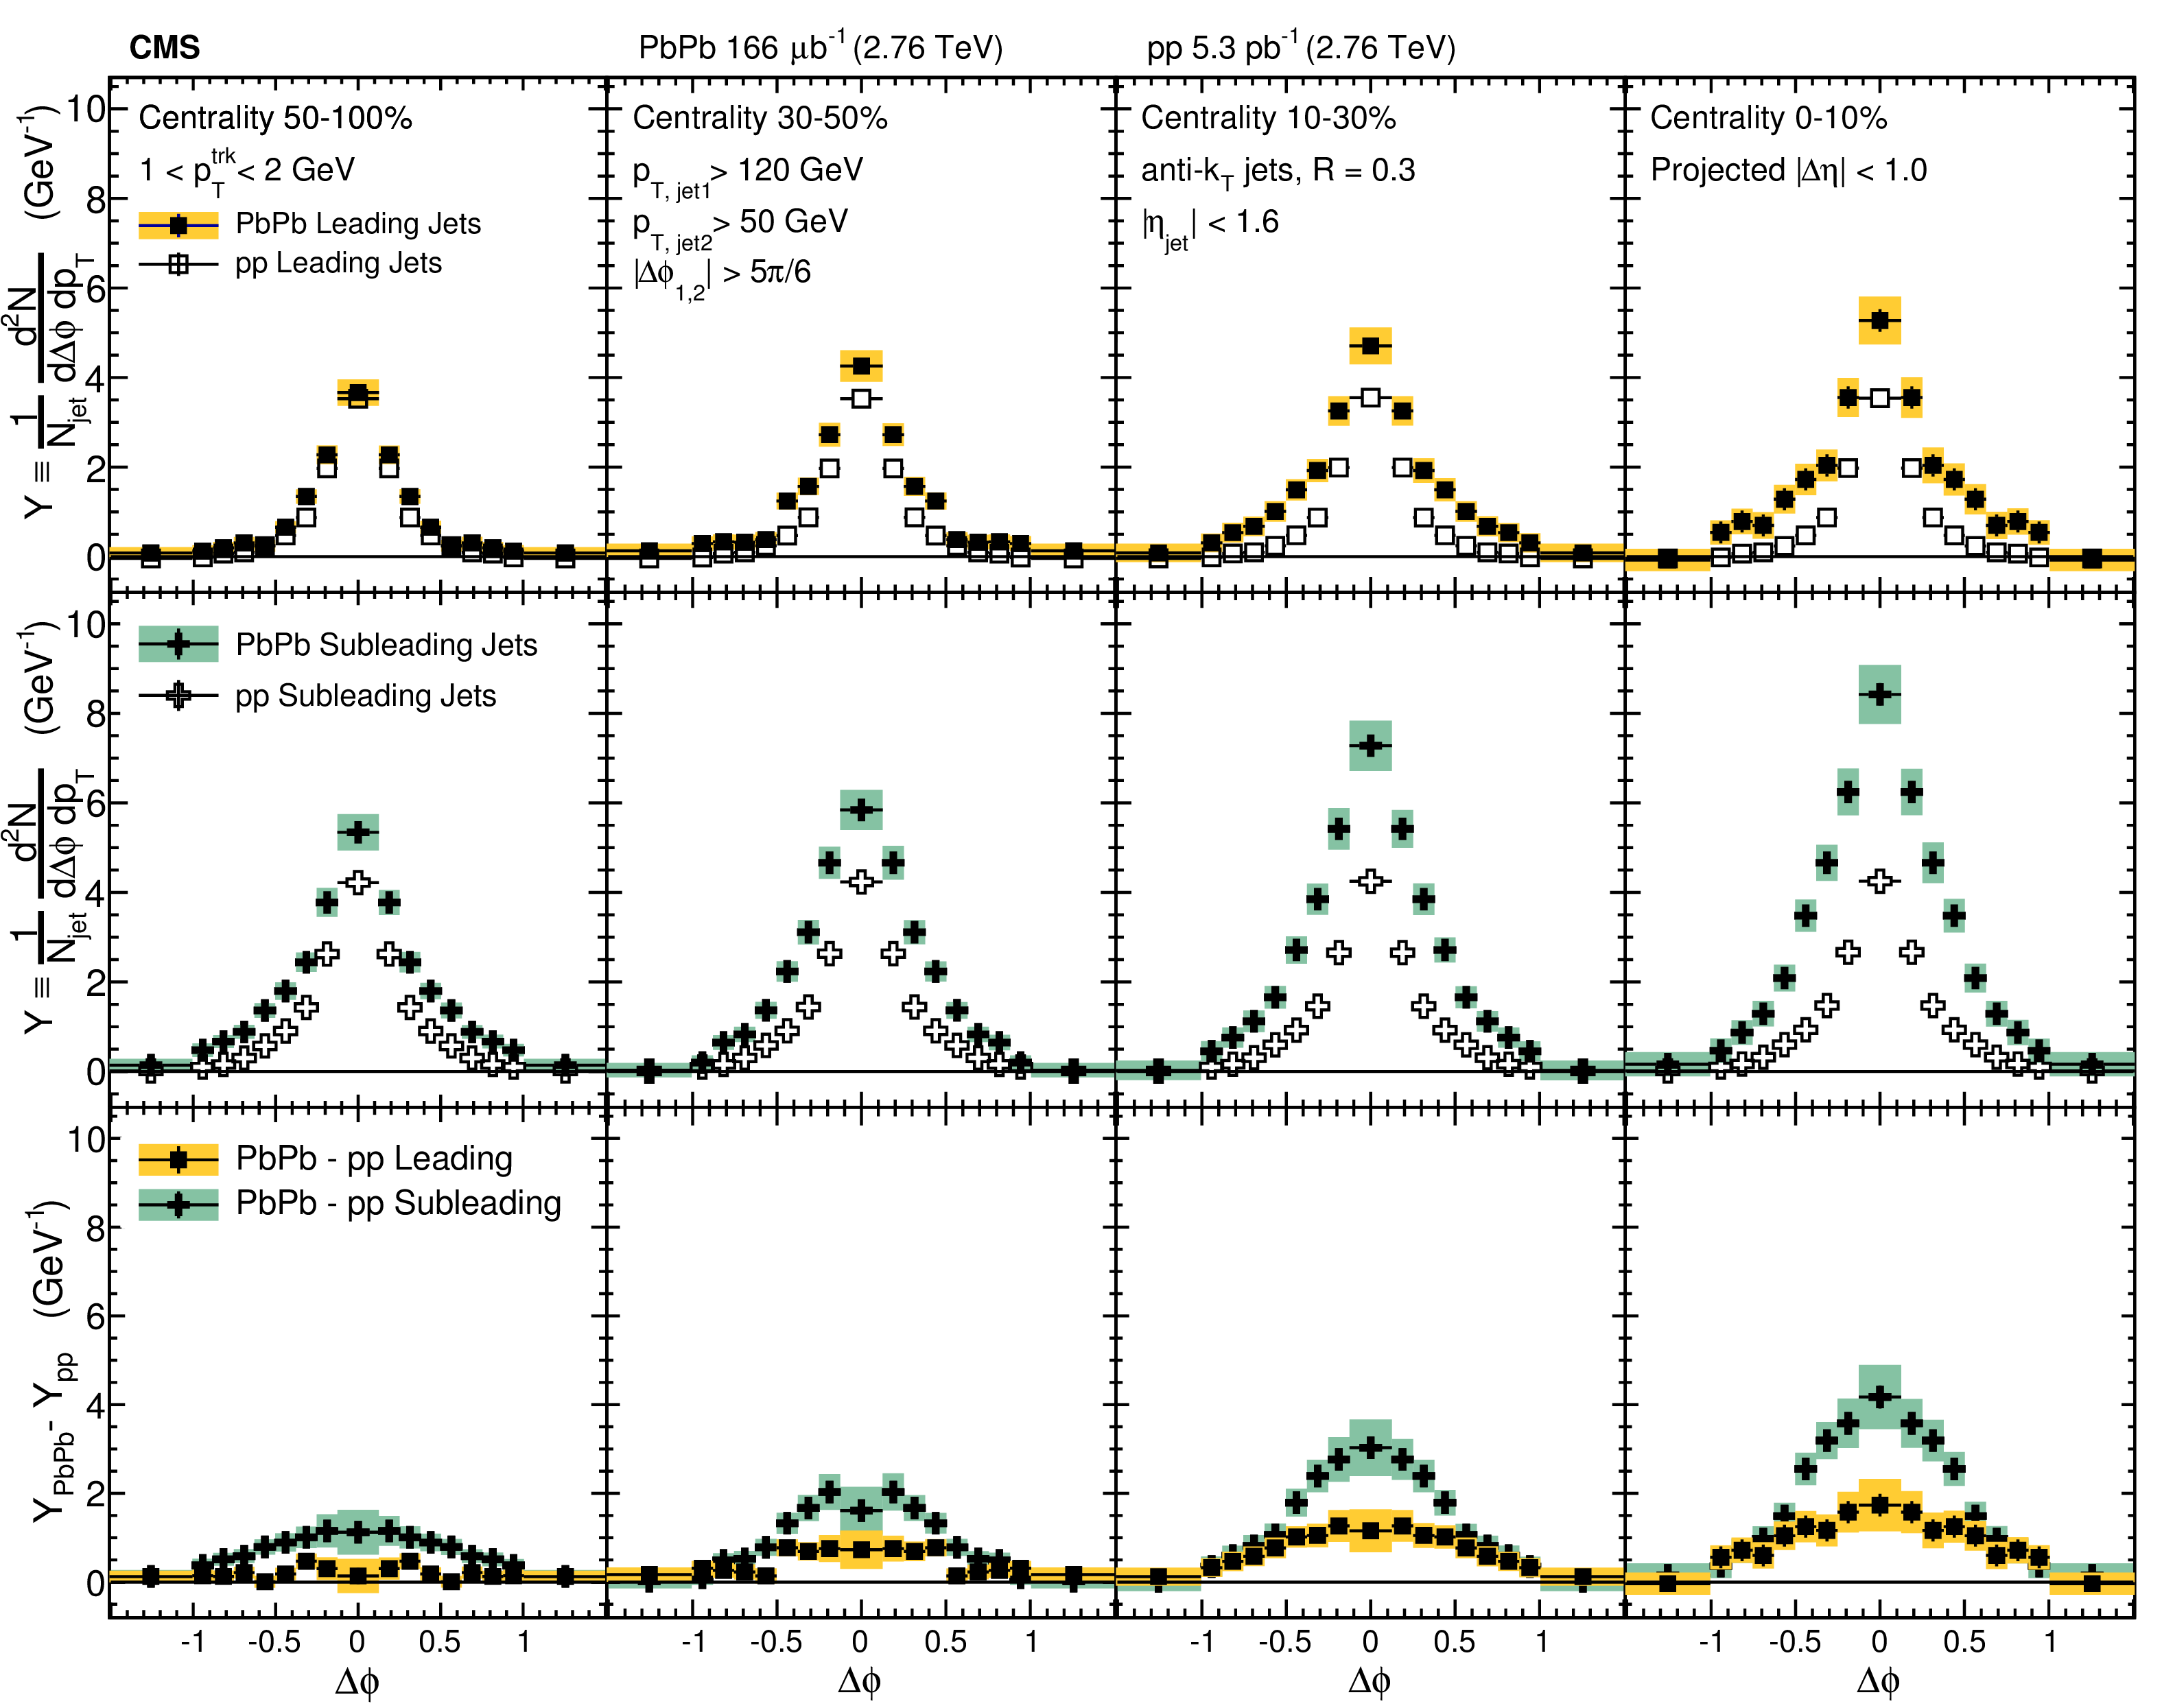
Figure 6:
The top panels show the $\Delta \phi $ distributions (projected over $|\Delta \eta <$ 1) of charged-particle background-subtracted yields correlated to PbPb and pp leading jets with $p_{\mathrm {T},\text {jet1}}>$ 120 GeV. The middle panels show the same distributions for subleading jets with $p_{\mathrm {T},\text {jet2}}>$ 50 GeV, and the bottom panels show the difference PbPb minus pp for both leading and subleading jets. The total systematic uncertainties are shown as shaded boxes, and statistical uncertainties are shown as vertical bars (often smaller than the symbol size). |

png pdf |
Figure 7:
Total excess correlated yield observed in the PbPb data with respect to the reference measured in pp collisions, shown as a function of track $ {p_{\mathrm {T}}} $ in four different centrality intervals (0-10%, 10-30%, 30-50%, 50-100%) for both leading jets with $p_{\mathrm {T},\text {jet1}}> $ 120 GeV and subleading jets with $p_{\mathrm {T},\text {jet2}}>$ 50 GeV. The total systematic uncertainties are shown as shaded boxes, and statistical uncertainties are shown as vertical bars (often smaller than the symbol size). |
png pdf |
Figure 8:
Comparison of the widths in PbPb and pp of the $\Delta \eta $ charged-particle distributions correlated to leading jets with $p_{\mathrm {T},\text {jet1}}>$ 120 GeV, as a function of $ {p_{\mathrm {T}}} ^\text {trk}$. The bottom row shows the difference of the widths in PbPb and pp data. The shaded band corresponds to systematic uncertainty, and statistical uncertainties are smaller than symbol size. |

png pdf |
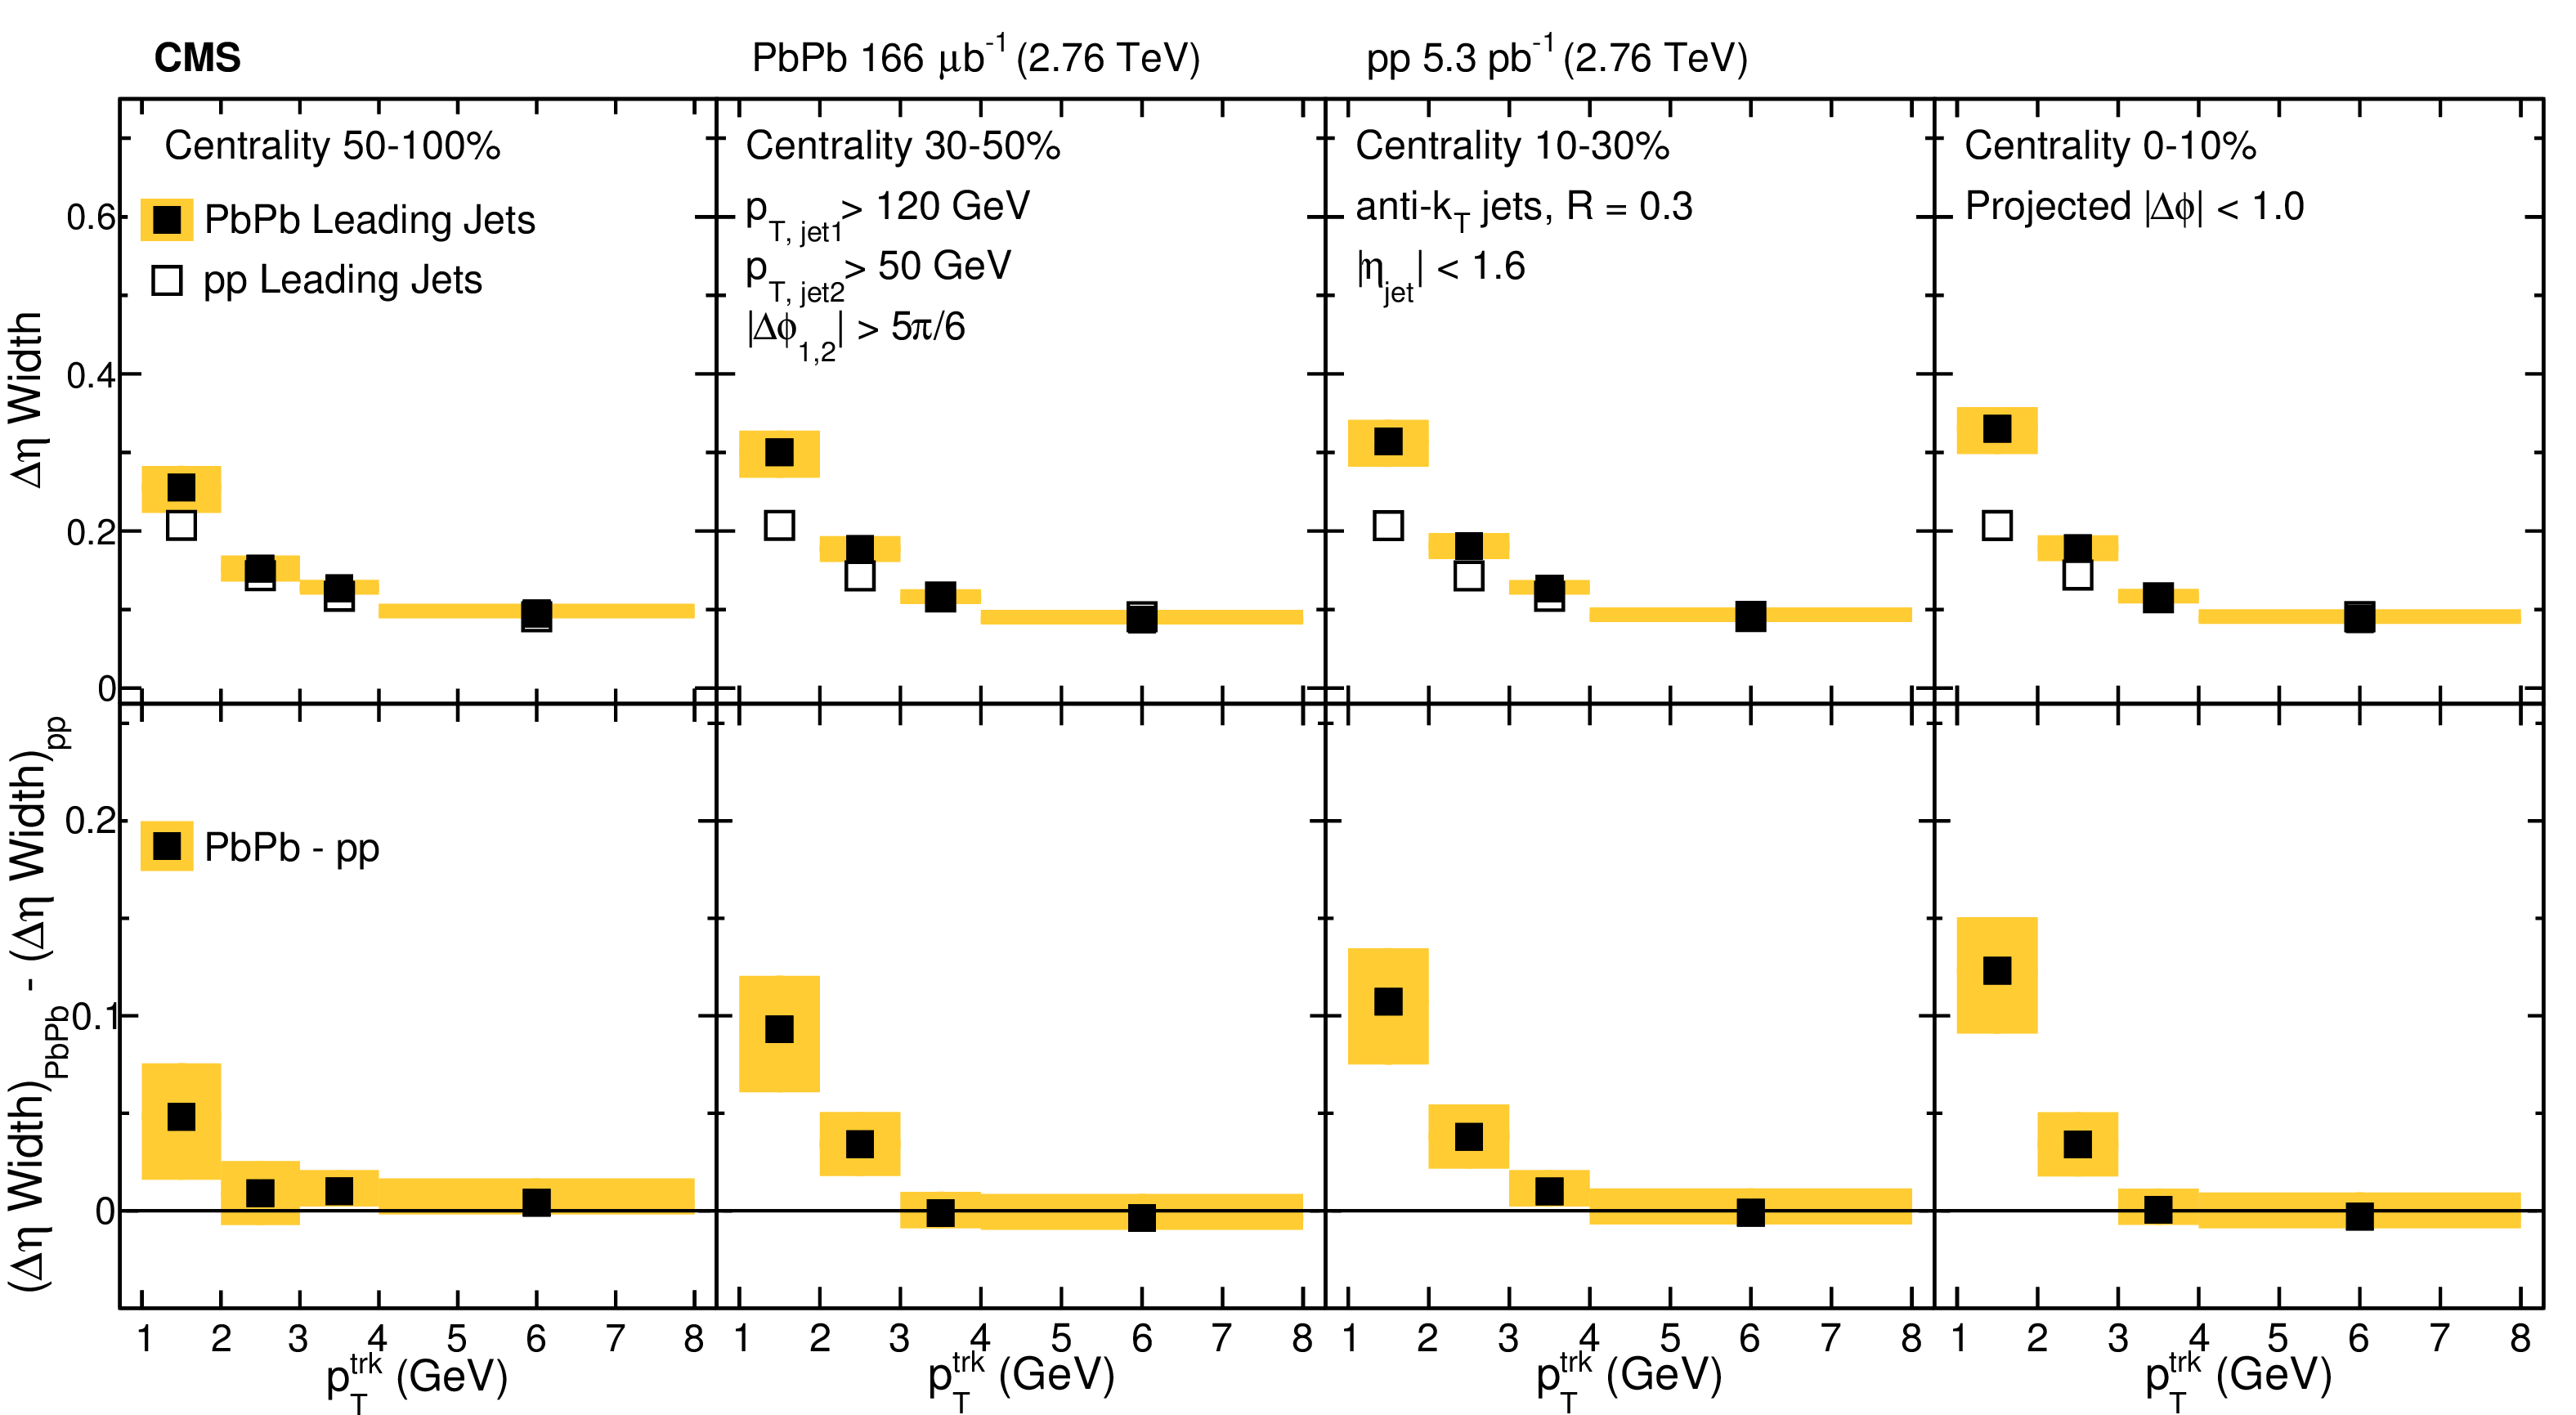
Figure 9:
Comparison of the widths in PbPb and pp of the $\Delta \phi $ charged-particle distributions correlated to leading jets with $p_{\mathrm {T},\text {jet1}}>$ 120 GeV, as a function of $ {p_{\mathrm {T}}} ^\text {trk}$. The bottom row shows the difference of the widths in PbPb and pp data. The shaded band corresponds to systematic uncertainty, and statistical uncertainties are smaller than symbol size. |
png pdf |
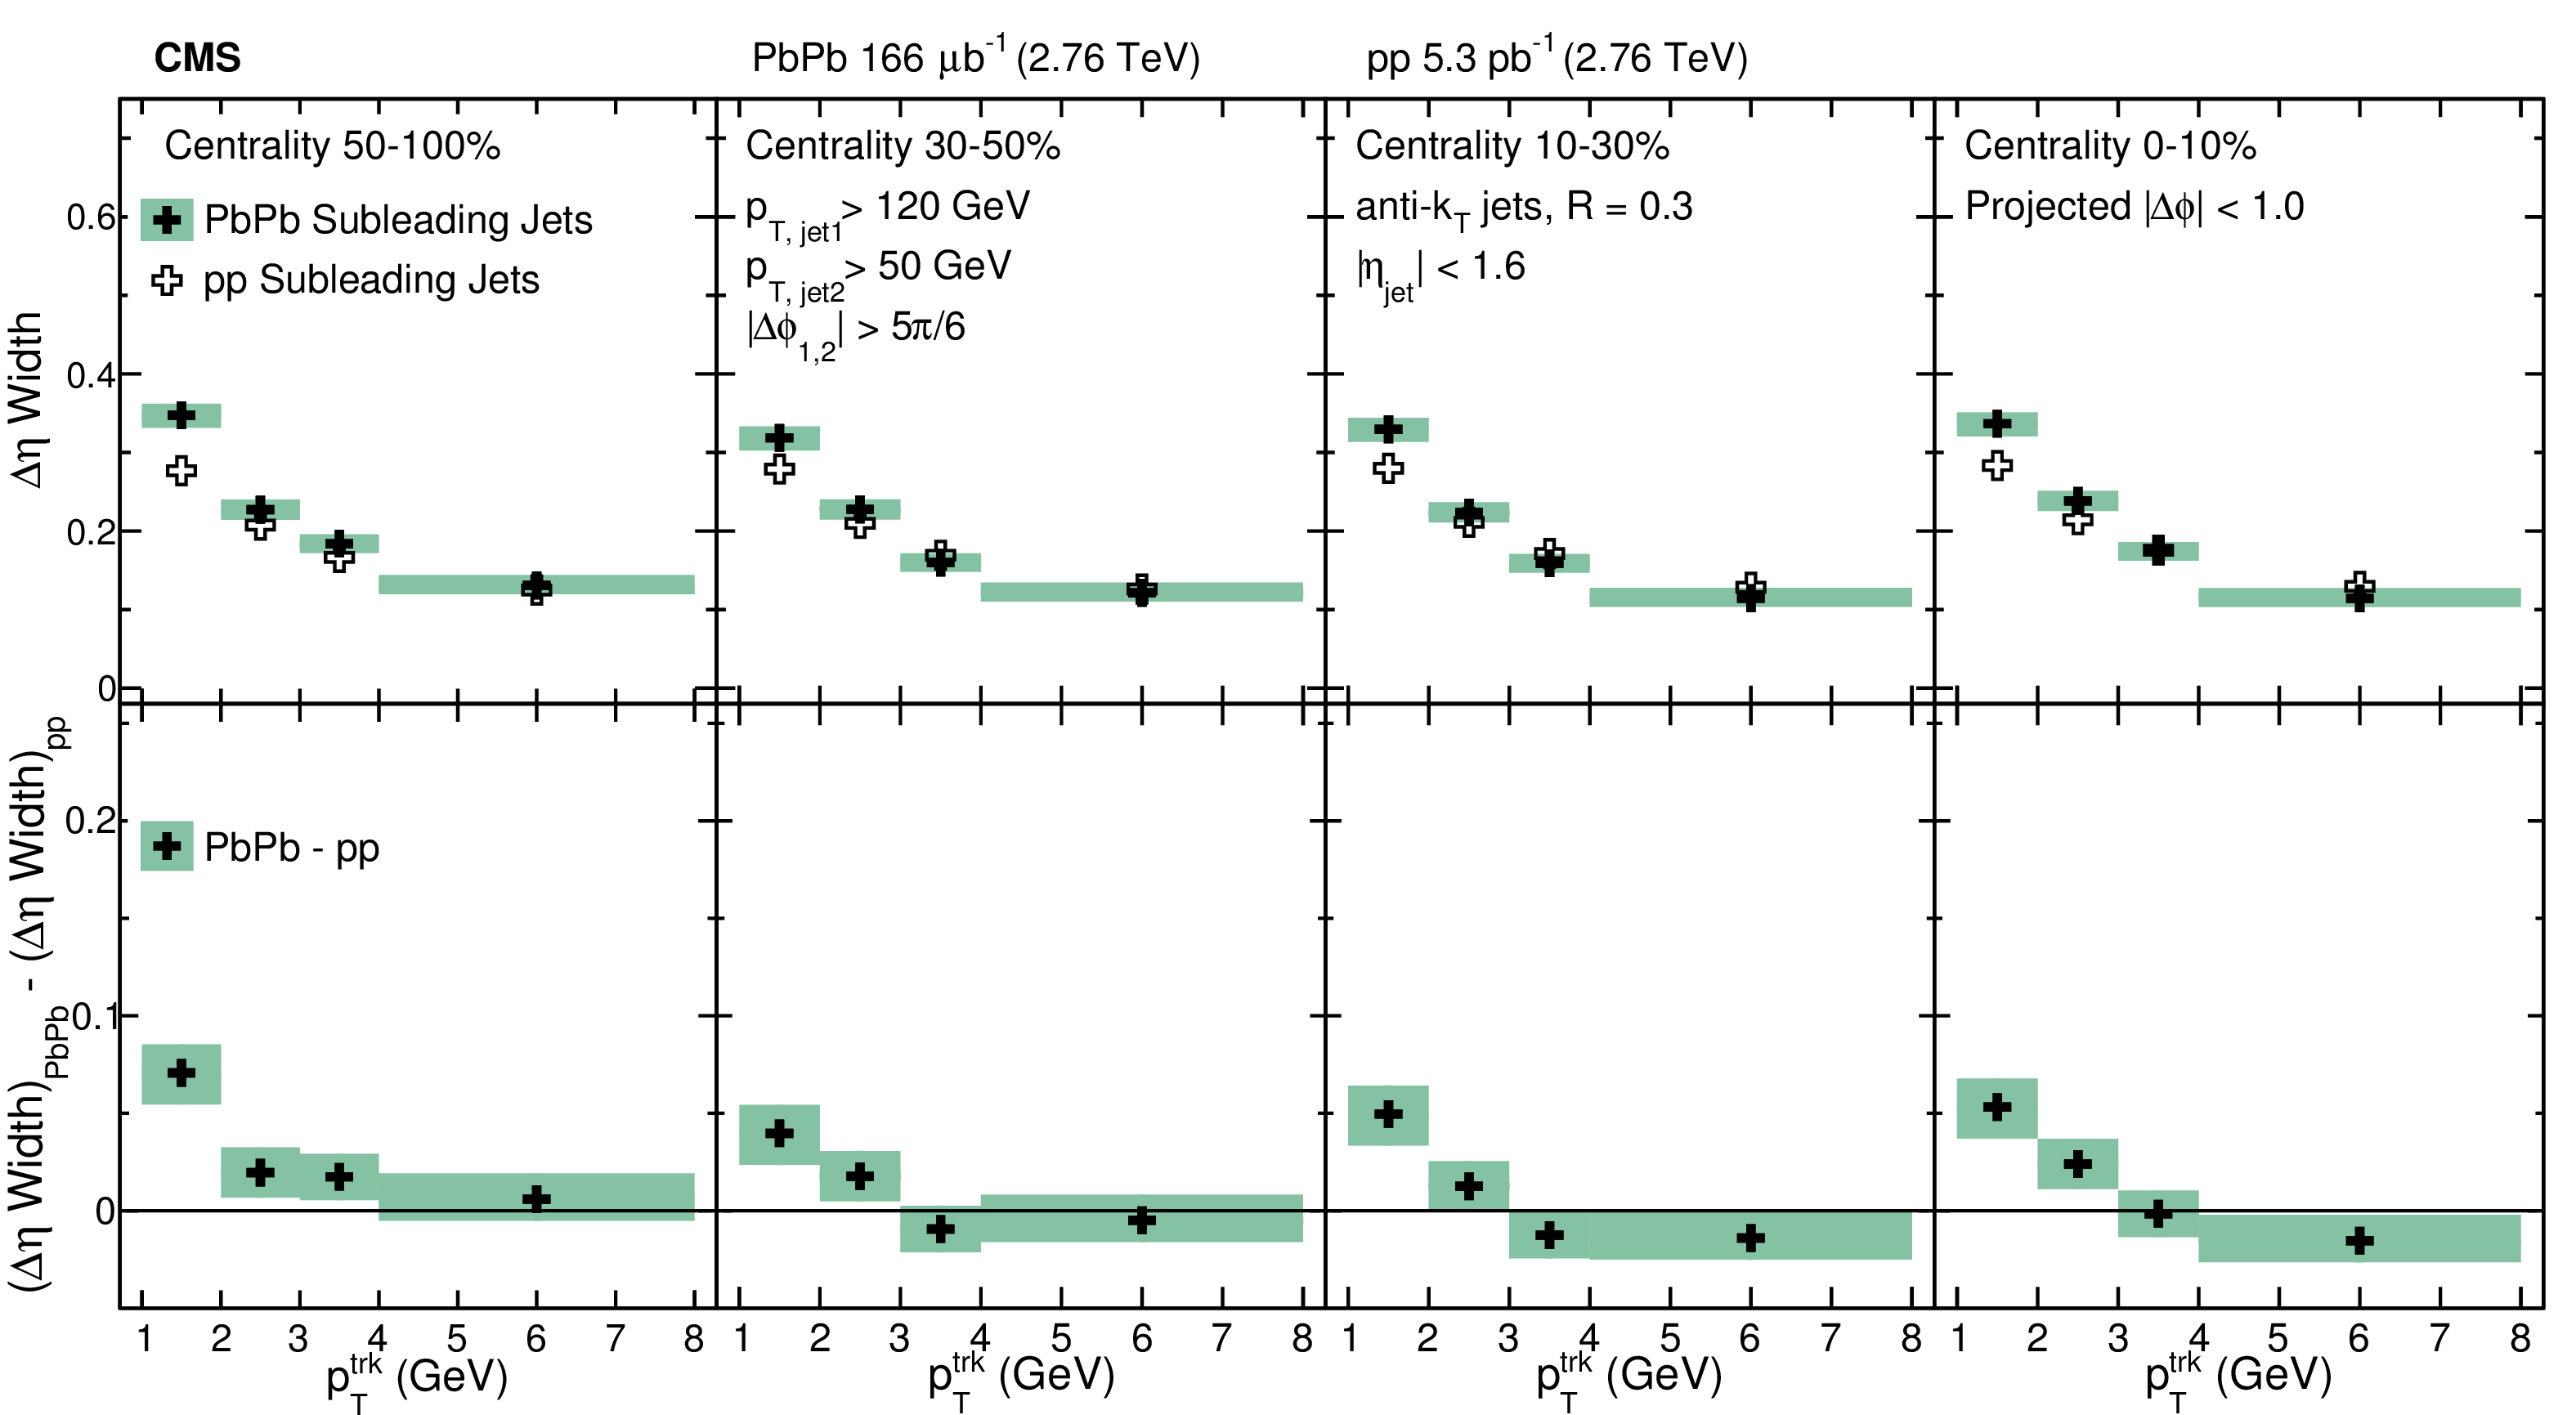
Figure 10:
Comparison of the widths in PbPb and pp of the $\Delta \eta $ charged-particle distributions correlated to leading jets with $p_{\mathrm {T},\text {jet2}}>$ 50 GeV, as a function of $ {p_{\mathrm {T}}} ^\text {trk}$. The bottom row shows the difference of the widths in PbPb and pp data. The shaded band corresponds to systematic uncertainty, and statistical uncertainties are smaller than symbol size. |

png pdf |
Figure 11:
Comparison of the widths in PbPb and pp of the $\Delta \phi $ charged-particle distributions correlated to leading jets with $p_{\mathrm {T},\text {jet2}}>$ 50 GeV, as a function of $ {p_{\mathrm {T}}} ^\text {trk}$. The bottom row shows the difference of the widths in PbPb and pp data. The shaded band corresponds to systematic uncertainty, and statistical uncertainties are smaller than symbol size. |
| Tables | |
png pdf |
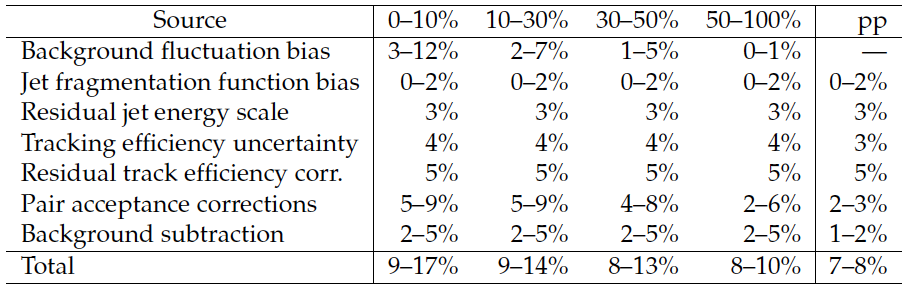
Table 1:
Systematic uncertainties in the measurement of the jet-track correlations in PbPb and pp collisions, as percentage of the total measured correlated yield. The numbers presented in this table summarize the range of values of systematic uncertainty (as a function of $ {p_{\mathrm {T}}} ^\text {trk}$) for different centrality bins. |
| Summary |
| In this analysis, jet-track correlations have been studied as a function of $\Delta\eta$ and $\Delta\phi$ with respect to the jet axis in PbPb and pp collisions at $\sqrt{s_{\mathrm{NN}}} =$ 2.76 TeV. Two-dimensional angular correlations have been considered for charged particles with $p_{\mathrm{T}}^\text{trk}>$ 1 GeV as a function of $p_{\mathrm{T}}^\text{trk}$ and collision centrality for two jet selections. A sample of inclusive jets above the jet momentum threshold of 120 GeV was studied, as well as a sample of dijet events selected to include a leading jet with $p_{\mathrm{T}}>$ 120 GeV and a subleading jet with $p_{\mathrm{T}}>$ 50 GeV. In all cases, an excess of soft particle yields was observed in central PbPb collisions with respect to pp reference data, similar for inclusive and leading jet samples and larger for the (more-quenched) subleading jet sample. The low-$p_{\mathrm{T}}^\text{trk}$ (1-3 GeV) excess-yield distributions were studied individually and, in both $\Delta\eta$ and $\Delta\phi$, they exhibit similar Gaussian-like distributions out to large relative angles ($\Delta\eta\approx$ 1 and $\Delta\phi\approx$ 1) from the jet axis. The excess was found to be largest at the lowest $p_{\mathrm{T}}^\text{trk}$ (1-2 GeV) in the most central (0-10%) PbPb data, and to decrease gradually with centrality. For peripheral (50-100%) PbPb collisions, correlated low-$p_{\mathrm{T}}^\text{trk}$ particle yields are only slightly larger than those for the pp reference. The excess also gradually decreases with increasing $p_{\mathrm{T}}^\text{trk}$ until yields of particles with $p_{\mathrm{T}}^\text{trk}>$ 4 GeV are similar to pp reference data, consistent with the results of a previous CMS jet quenching study. This new correlation analysis provides a comprehensive evaluation of medium effects on jet properties, extending information about jet shapes to large angles away from the jet axis. |
|
|
Compact Muon Solenoid LHC, CERN |
|

|

|

|

|

|