

Compact Muon Solenoid
LHC, CERN
| CMS-QCD-11-004 ; CERN-PH-EP-2012-343 | ||
| Measurements of differential jet cross sections in proton-proton collisions at $\sqrt{s}$ = 7 TeV with the CMS detector | ||
| CMS Collaboration | ||
| 29 December 2012 | ||
| Phys. Rev. D 87 (2013) 112002 | ||
| Abstract: Measurements of inclusive jet and dijet production cross sections are presented. Data from LHC proton-proton collisions at $\sqrt{s}$ = 7 TeV, corresponding to 5.0 inverse femtobarns of integrated luminosity, have been collected with the CMS detector. Jets are reconstructed up to rapidity 2.5, transverse momentum 2 TeV, and dijet invariant mass 5 TeV, using the anti-kt clustering algorithm with distance parameter R=0.7. The measured cross sections are corrected for detector effects and compared to perturbative QCD predictions at next-to-leading order, using five sets of parton distribution functions. | ||
| Links: e-print arXiv:1212.6660 [hep-ex] (PDF) ; CDS record ; inSPIRE record ; Public twiki page ; Rivet record ; HepData record ; CADI line (restricted) ; | ||
| Figures | |
png pdf |
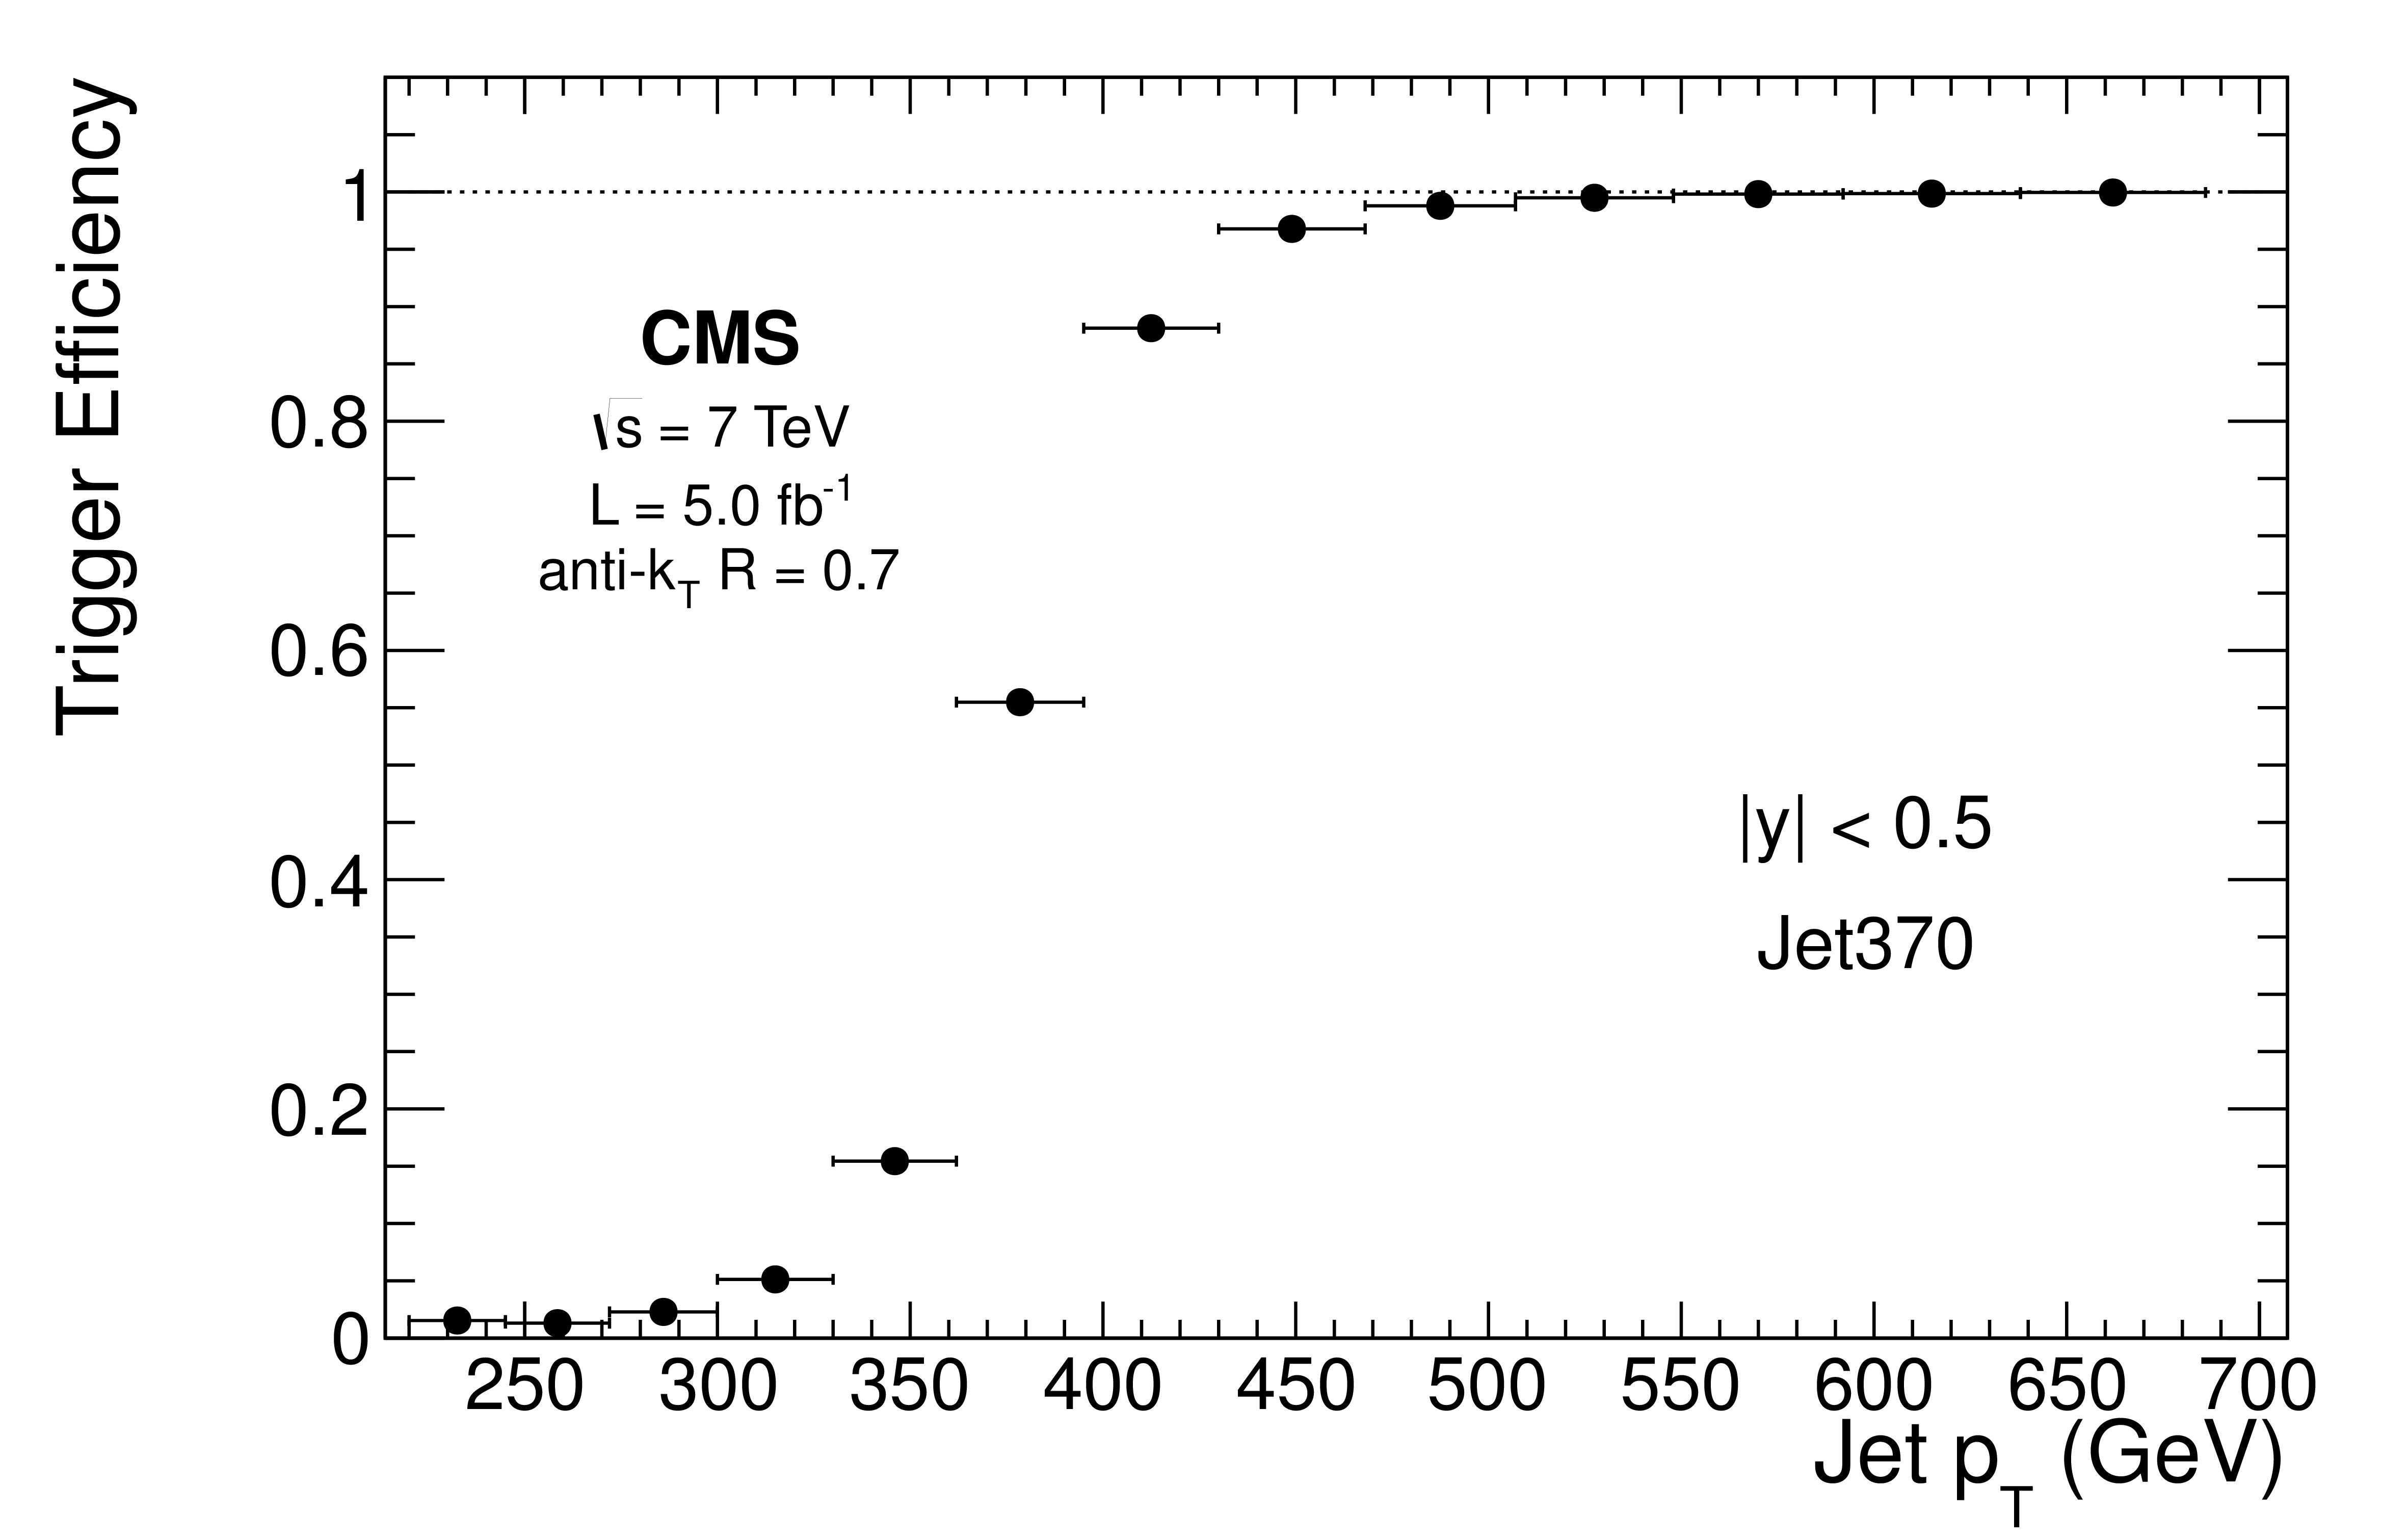
Figure 1-a:
Trigger efficiency as a function of the jet $ {p_{\mathrm {T}}} $ (a) and dijet mass $ {M_\text {jj}} $ (b) for the 370 GeV single-jet trigger and for the central rapidity bins. |
png pdf |
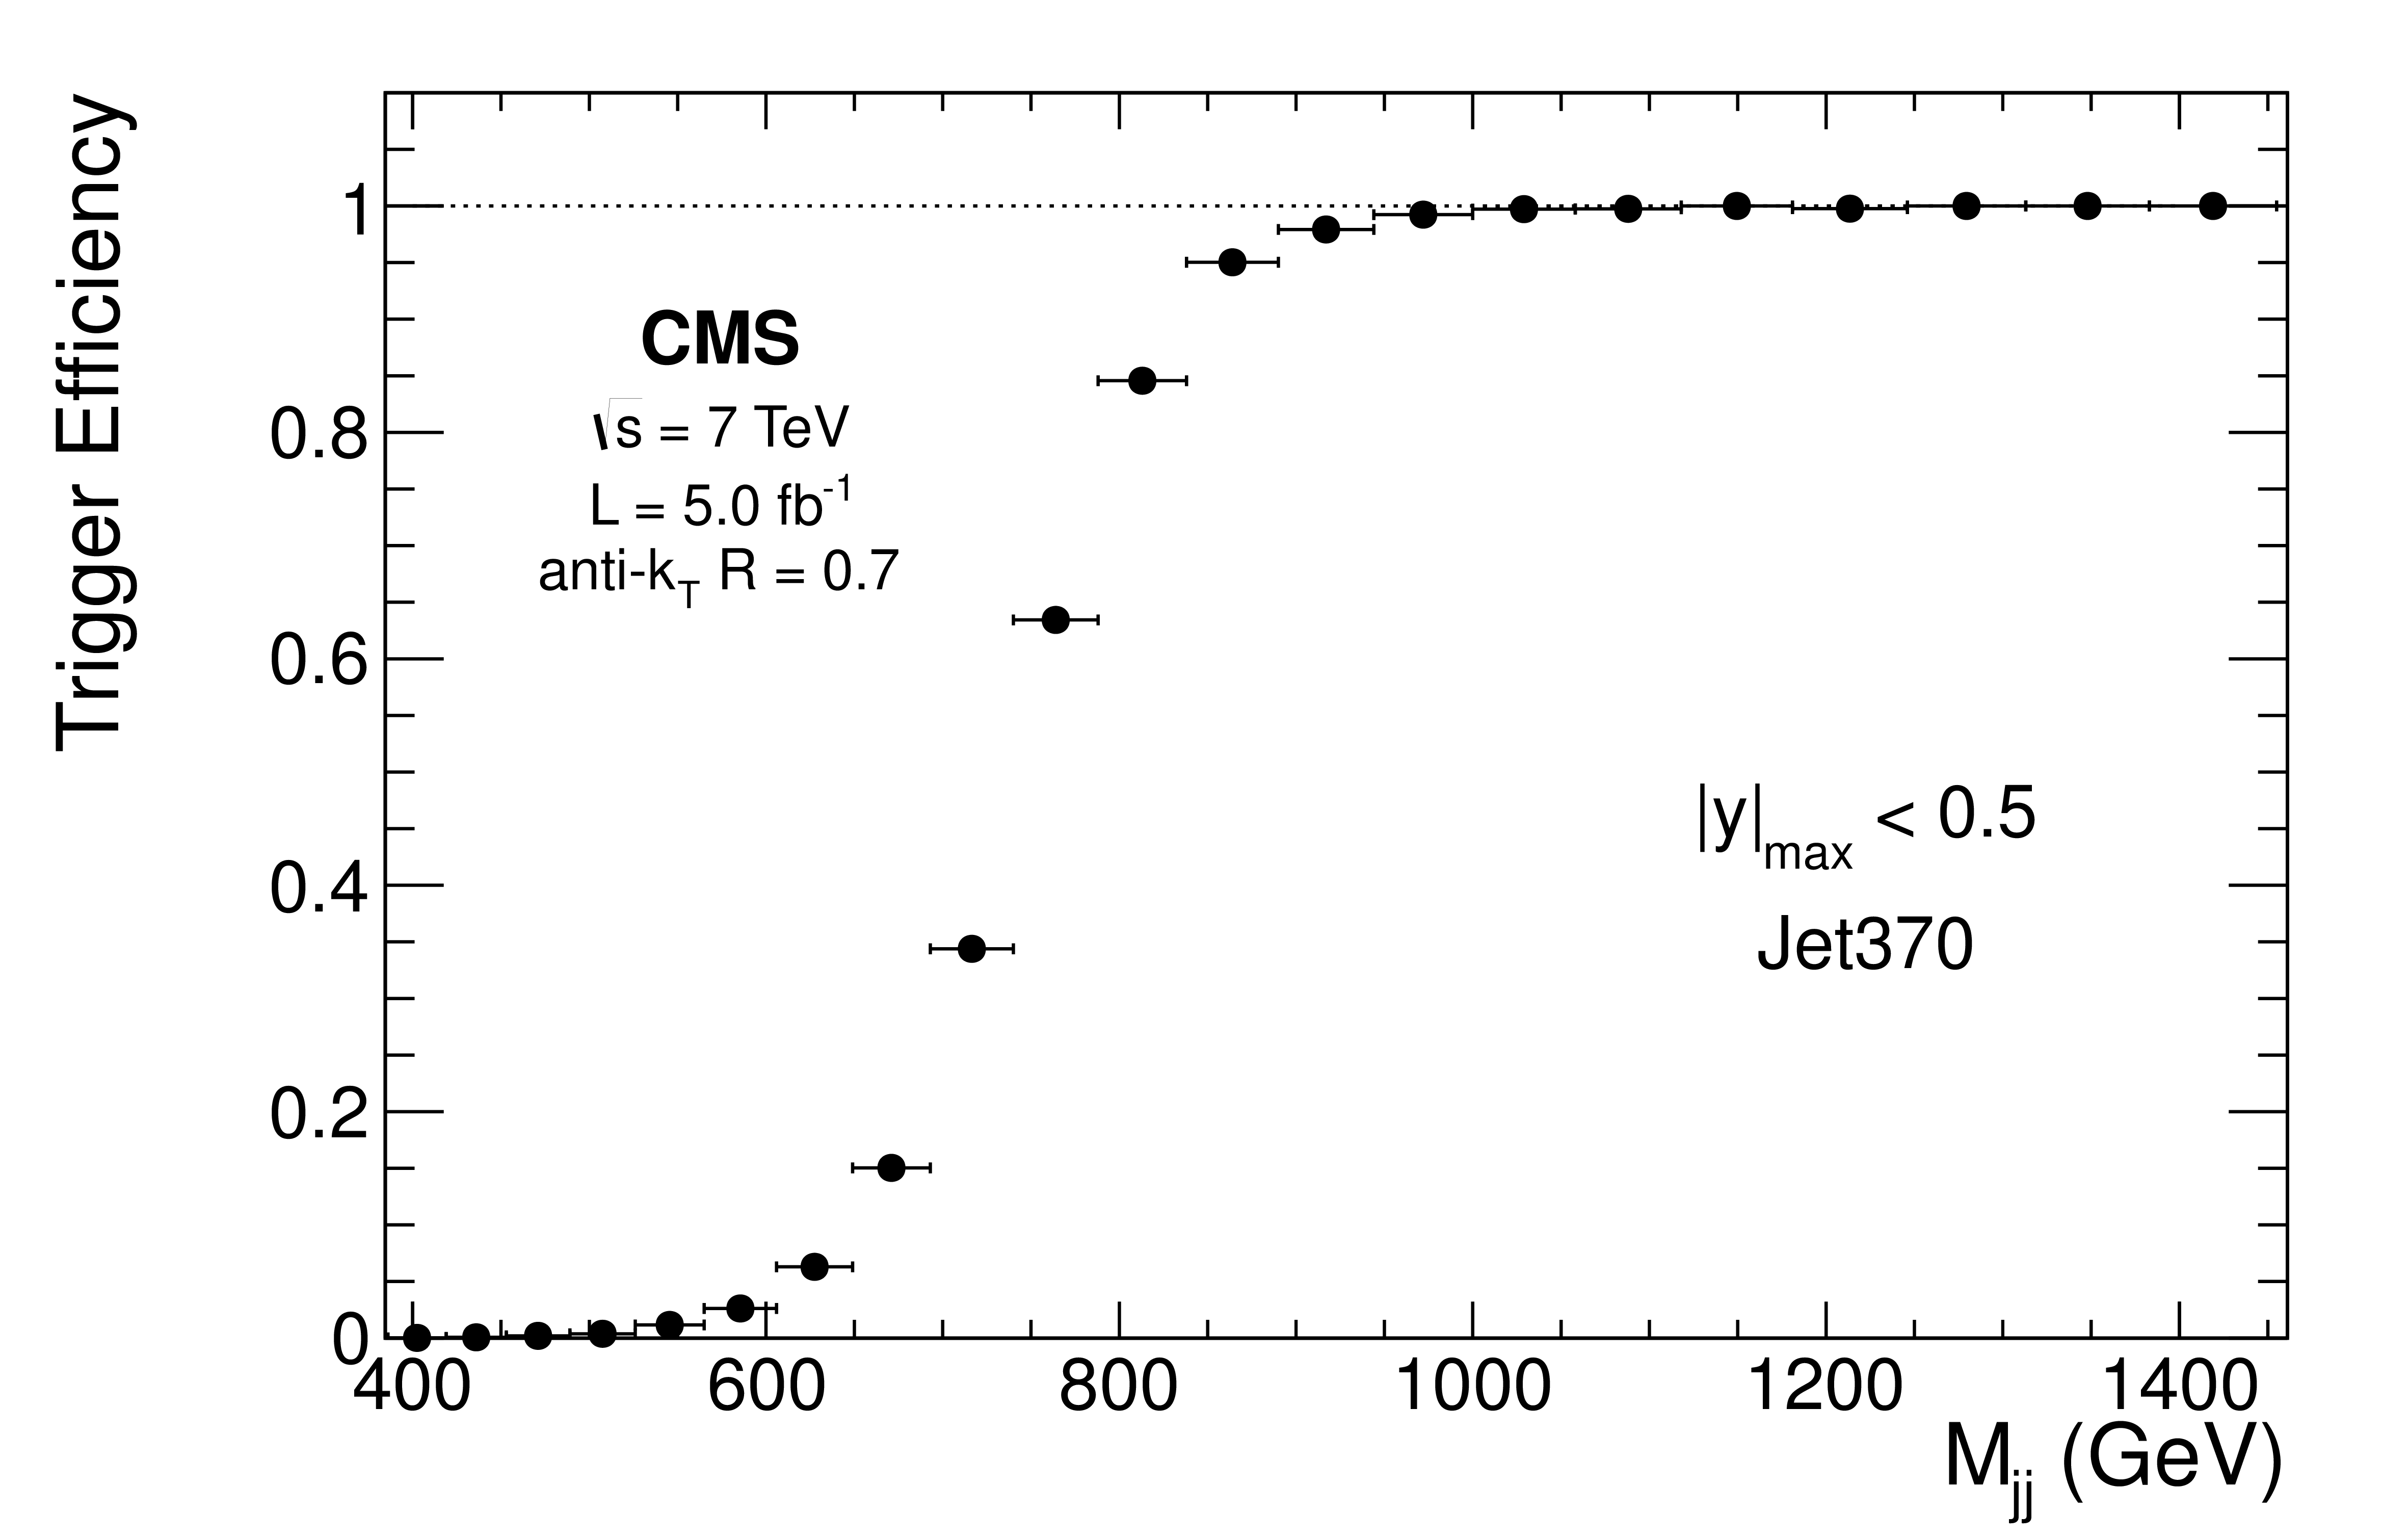
Figure 1-b:
Trigger efficiency as a function of the jet $ {p_{\mathrm {T}}} $ (a) and dijet mass $ {M_\text {jj}} $ (b) for the 370 GeV single-jet trigger and for the central rapidity bins. |

png pdf |
Figure 2-a:
Distribution of $ {E_{\mathrm {T}}^{\text {miss}}} /\Sigma + {E_{\mathrm {T}}} $ for data events (black points) and simulated QCD events (continuous line) with at least one jet with $ {p_{\mathrm {T}}} > $ 510 GeV (a) and for dijet events with $|y|_\text {max}< $ 2.5 and $ {M_\text {jj}} >$ 910 GeV (b), collected with the 370 GeV single-jet trigger. The distribution from the inclusive-jet selection is shown before the offline selection $ {E_{\mathrm {T}}^{\text {miss}}} /\Sigma + {E_{\mathrm {T}}} < $ 0.3. The larger tail in the data is caused by other processes with true $ {E_{\mathrm {T}}^{\text {miss}}} $ (such as Z+jet(s), where the Z boson decays to neutrinos, and W+jet(s), where the W boson decays to leptons). |
png pdf |
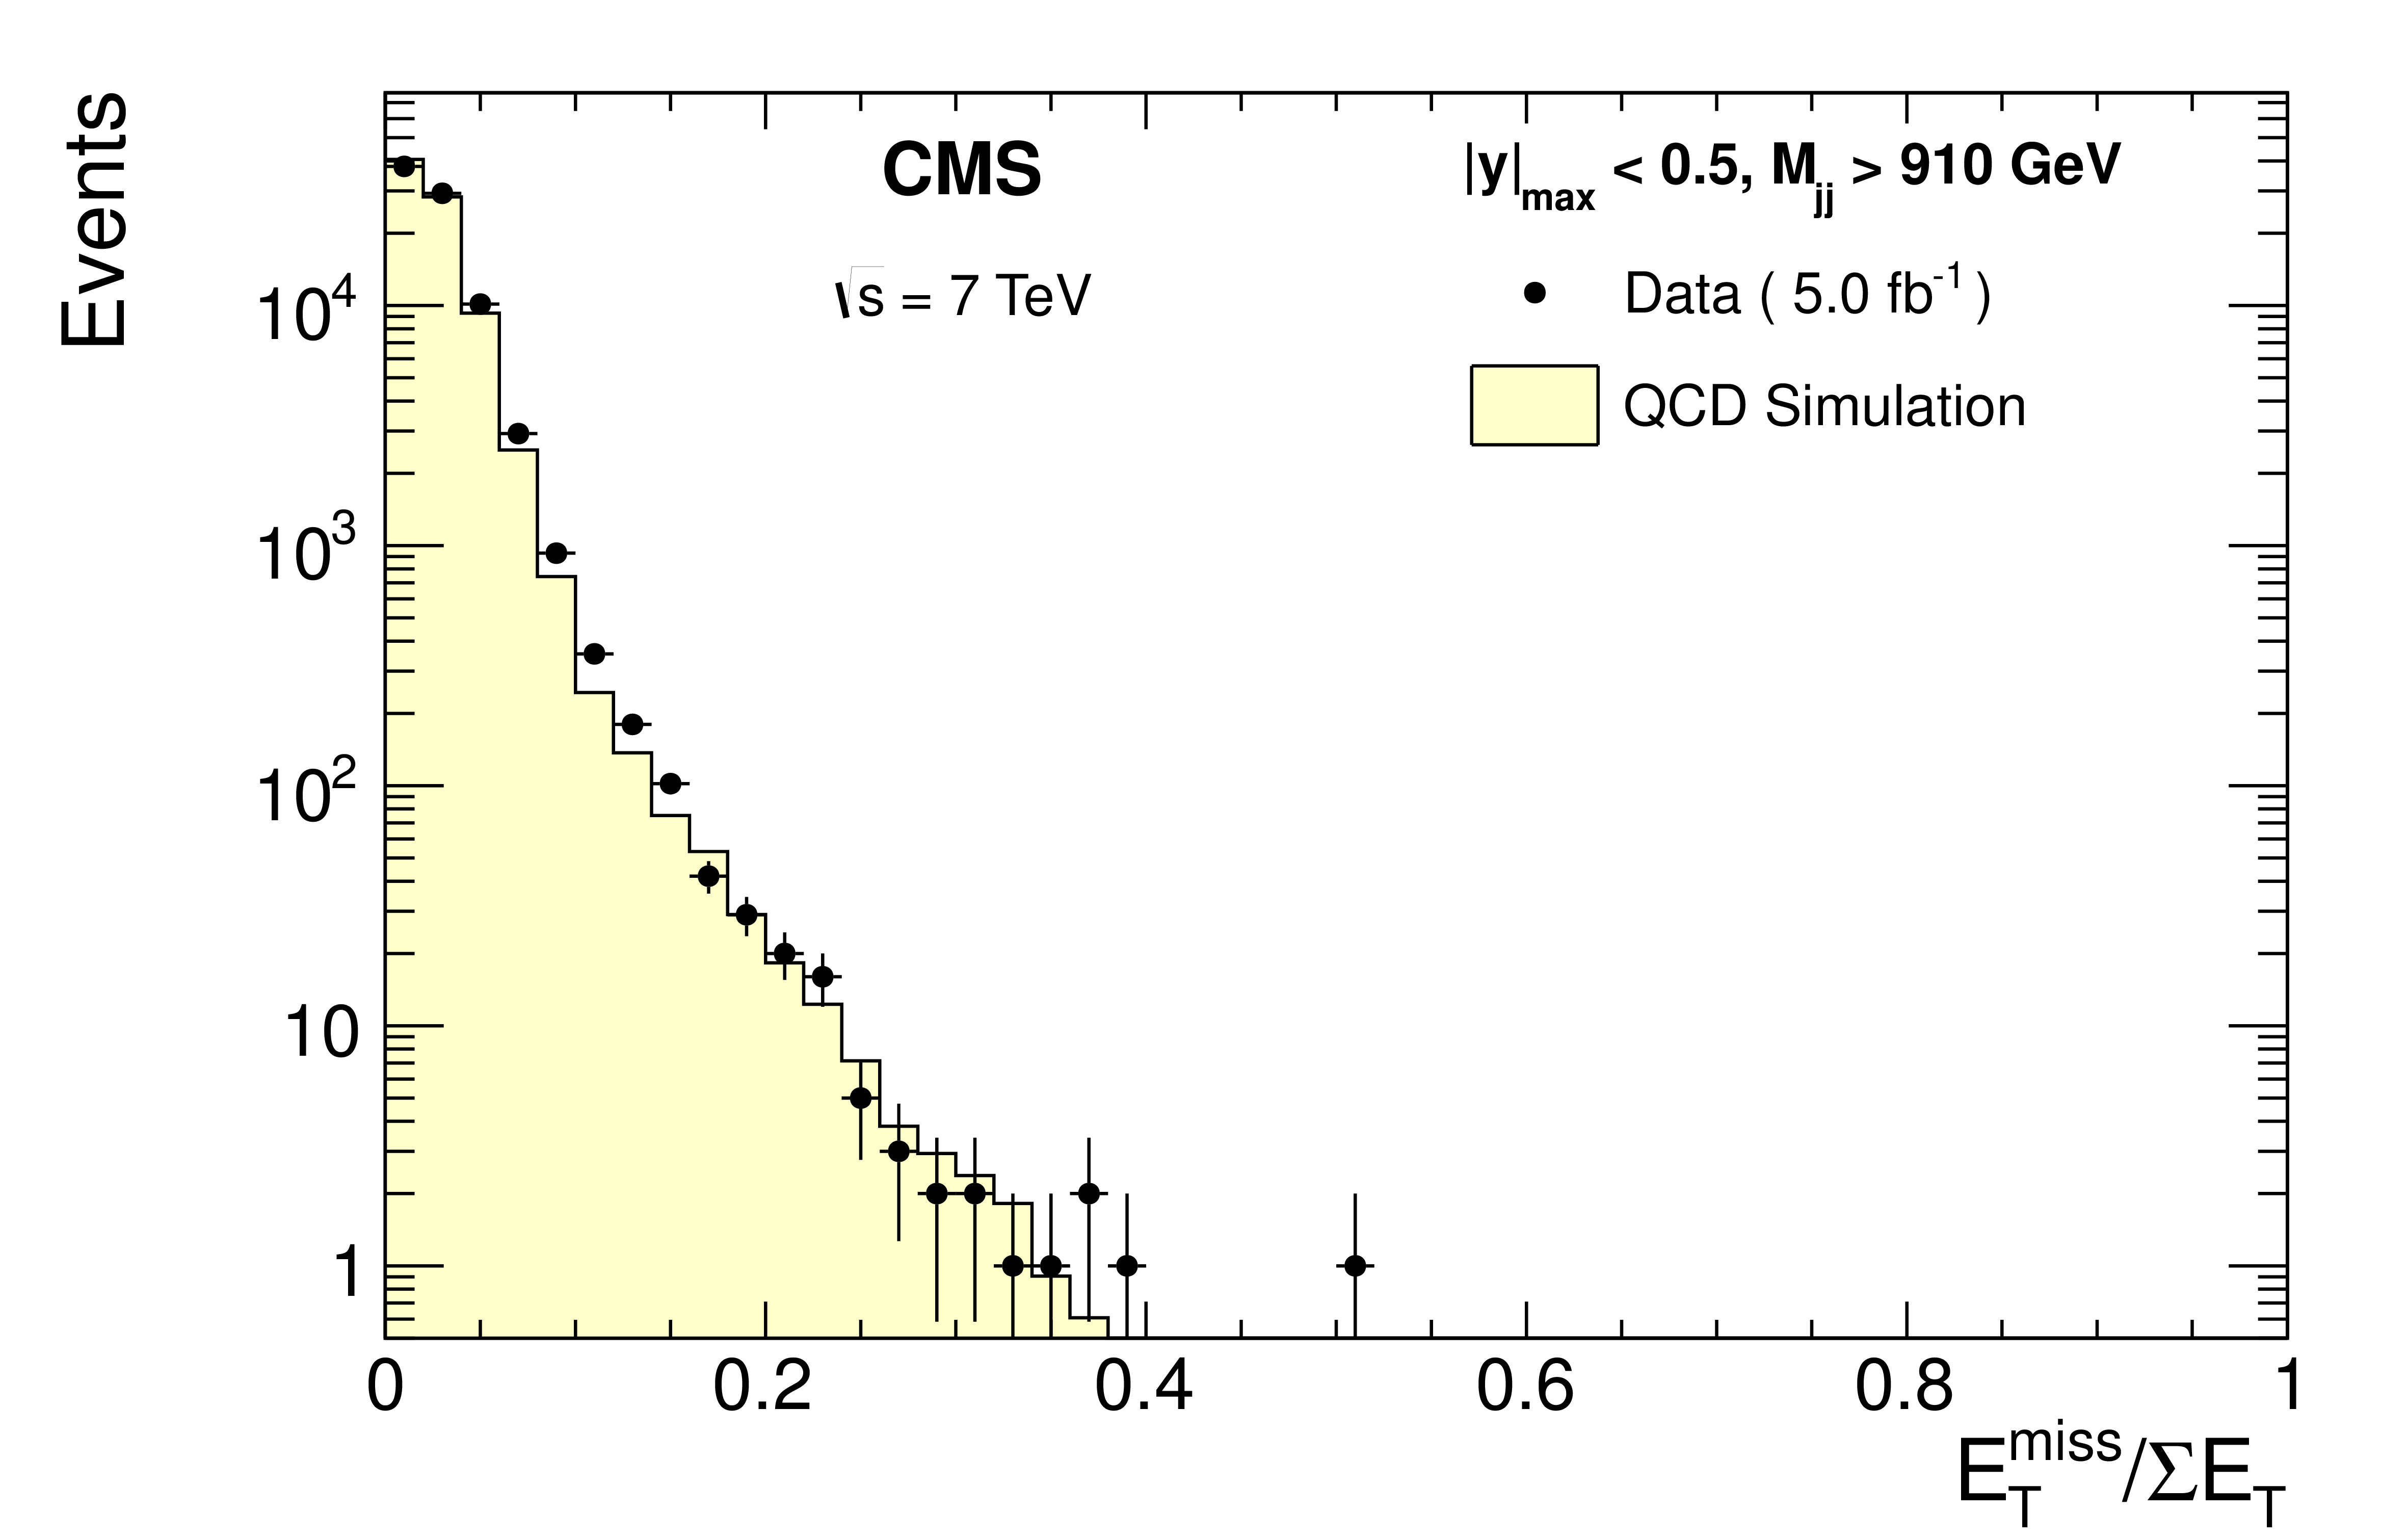
Figure 2-b:
Distribution of $ {E_{\mathrm {T}}^{\text {miss}}} /\Sigma + {E_{\mathrm {T}}} $ for data events (black points) and simulated QCD events (continuous line) with at least one jet with $ {p_{\mathrm {T}}} > $ 510 GeV (a) and for dijet events with $|y|_\text {max}< $ 2.5 and $ {M_\text {jj}} >$ 910 GeV (b), collected with the 370 GeV single-jet trigger. The distribution from the inclusive-jet selection is shown before the offline selection $ {E_{\mathrm {T}}^{\text {miss}}} /\Sigma + {E_{\mathrm {T}}} < $ 0.3. The larger tail in the data is caused by other processes with true $ {E_{\mathrm {T}}^{\text {miss}}} $ (such as Z+jet(s), where the Z boson decays to neutrinos, and W+jet(s), where the W boson decays to leptons). |

png pdf |
Figure 3-a:
Spectrum construction from individual trigger paths. a: inclusive jet $ {p_{\mathrm {T}}}$ spectrum for $|y|<$ 0.5. b: dijet mass spectrum for $|y|_\text {max}<$ 0.5. The different markers indicate different trigger paths. |
png pdf |
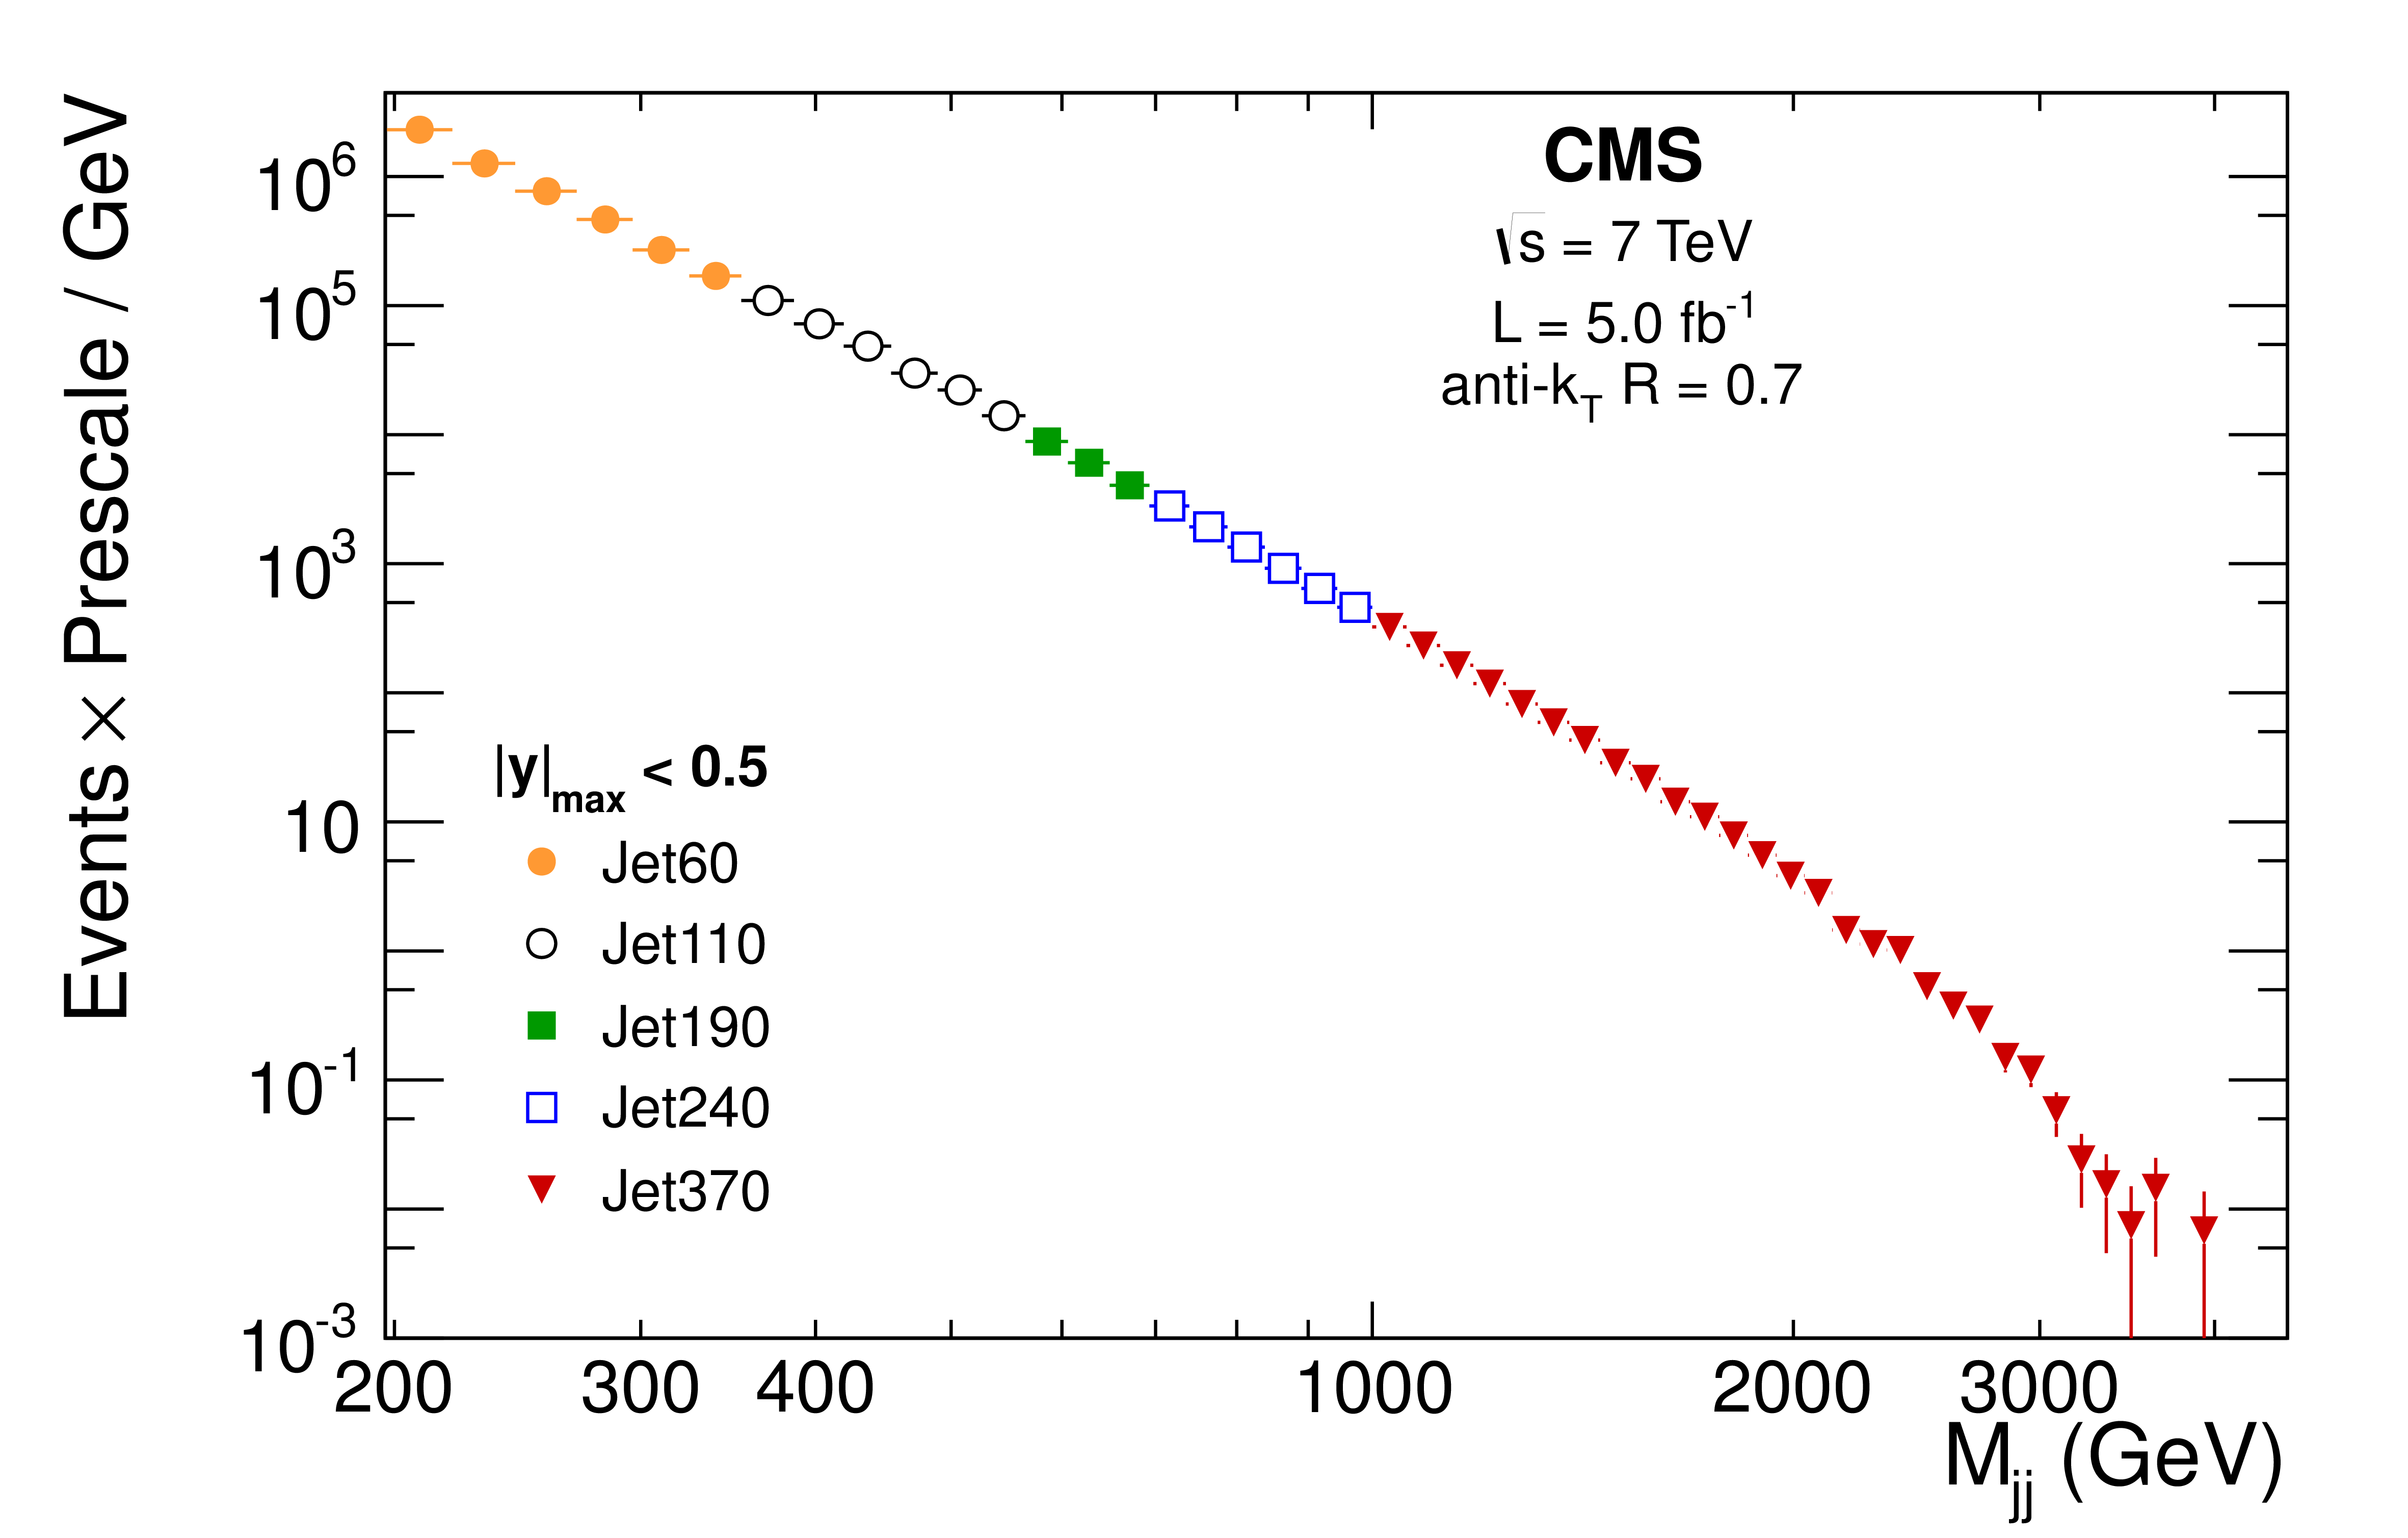
Figure 3-b:
Spectrum construction from individual trigger paths. a: inclusive jet $ {p_{\mathrm {T}}}$ spectrum for $|y|<$ 0.5. b: dijet mass spectrum for $|y|_\text {max}<$ 0.5. The different markers indicate different trigger paths. |
png pdf |
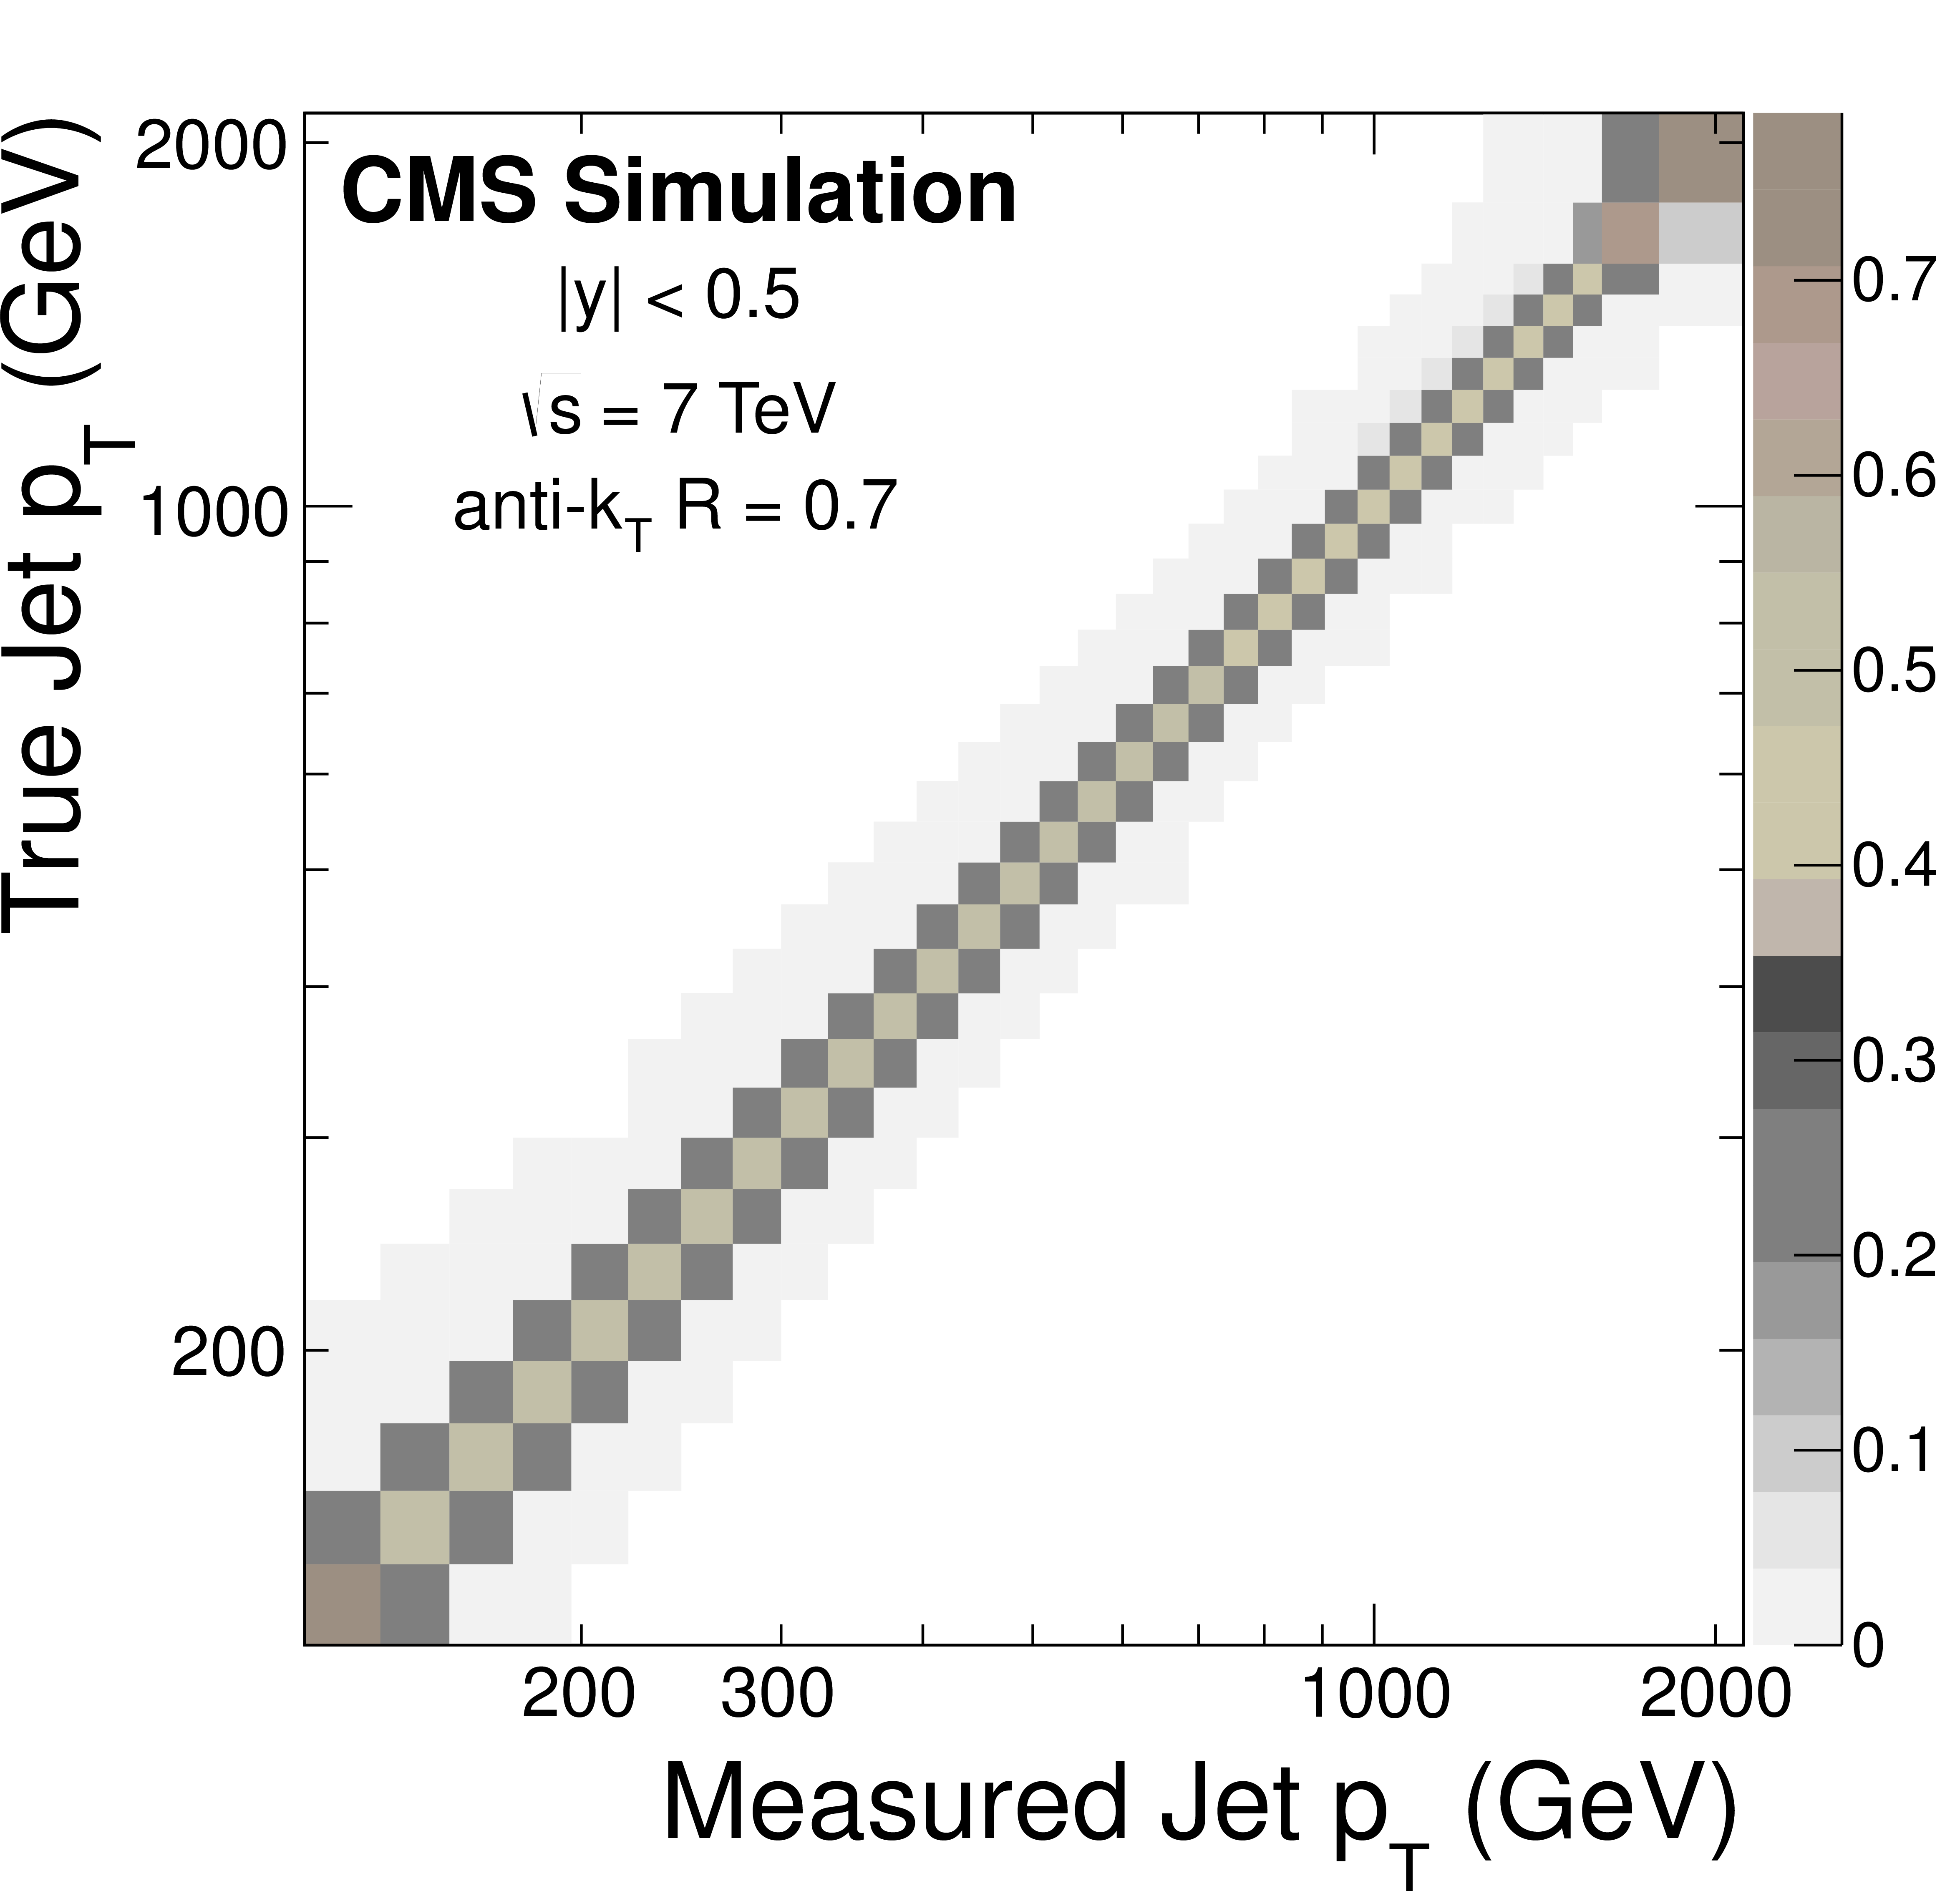
Figure 4-a:
Response matrices for the inclusive jet $ {p_{\mathrm {T}}} $ spectrum (a) and the dijet mass spectrum (b) in the central rapidity bins. |

png pdf |
Figure 4-b:
Response matrices for the inclusive jet $ {p_{\mathrm {T}}} $ spectrum (a) and the dijet mass spectrum (b) in the central rapidity bins. |
png pdf |
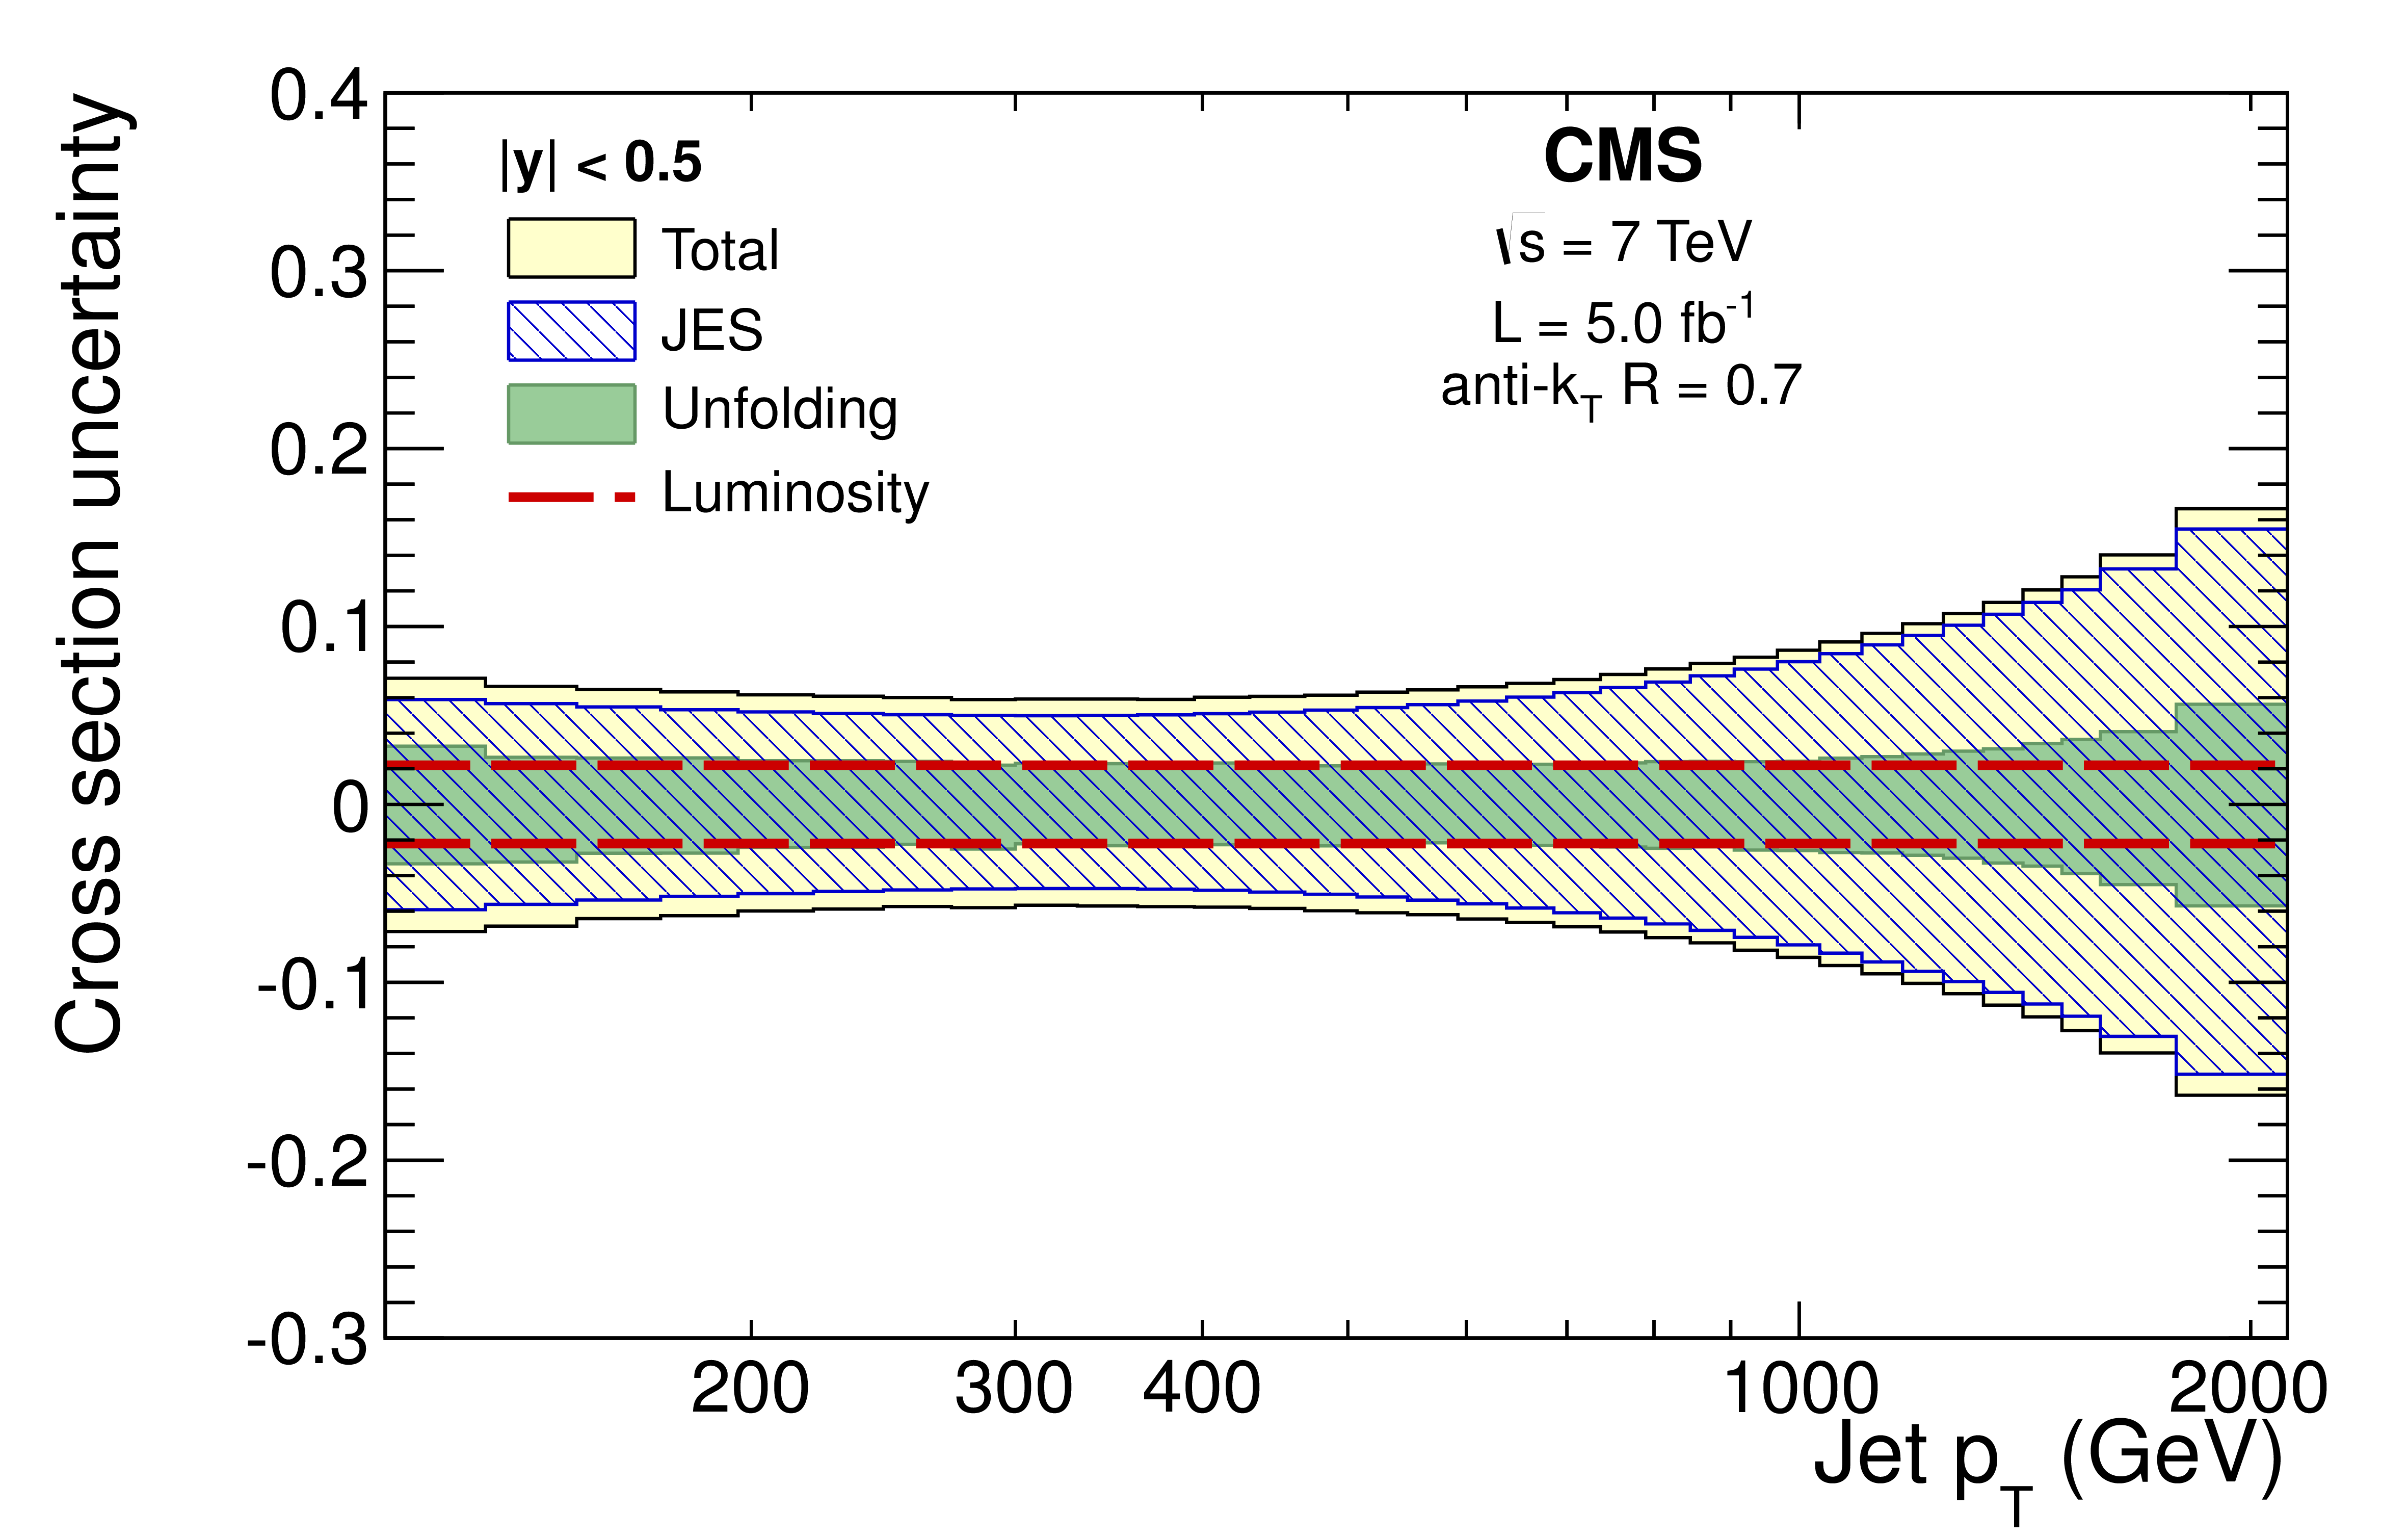
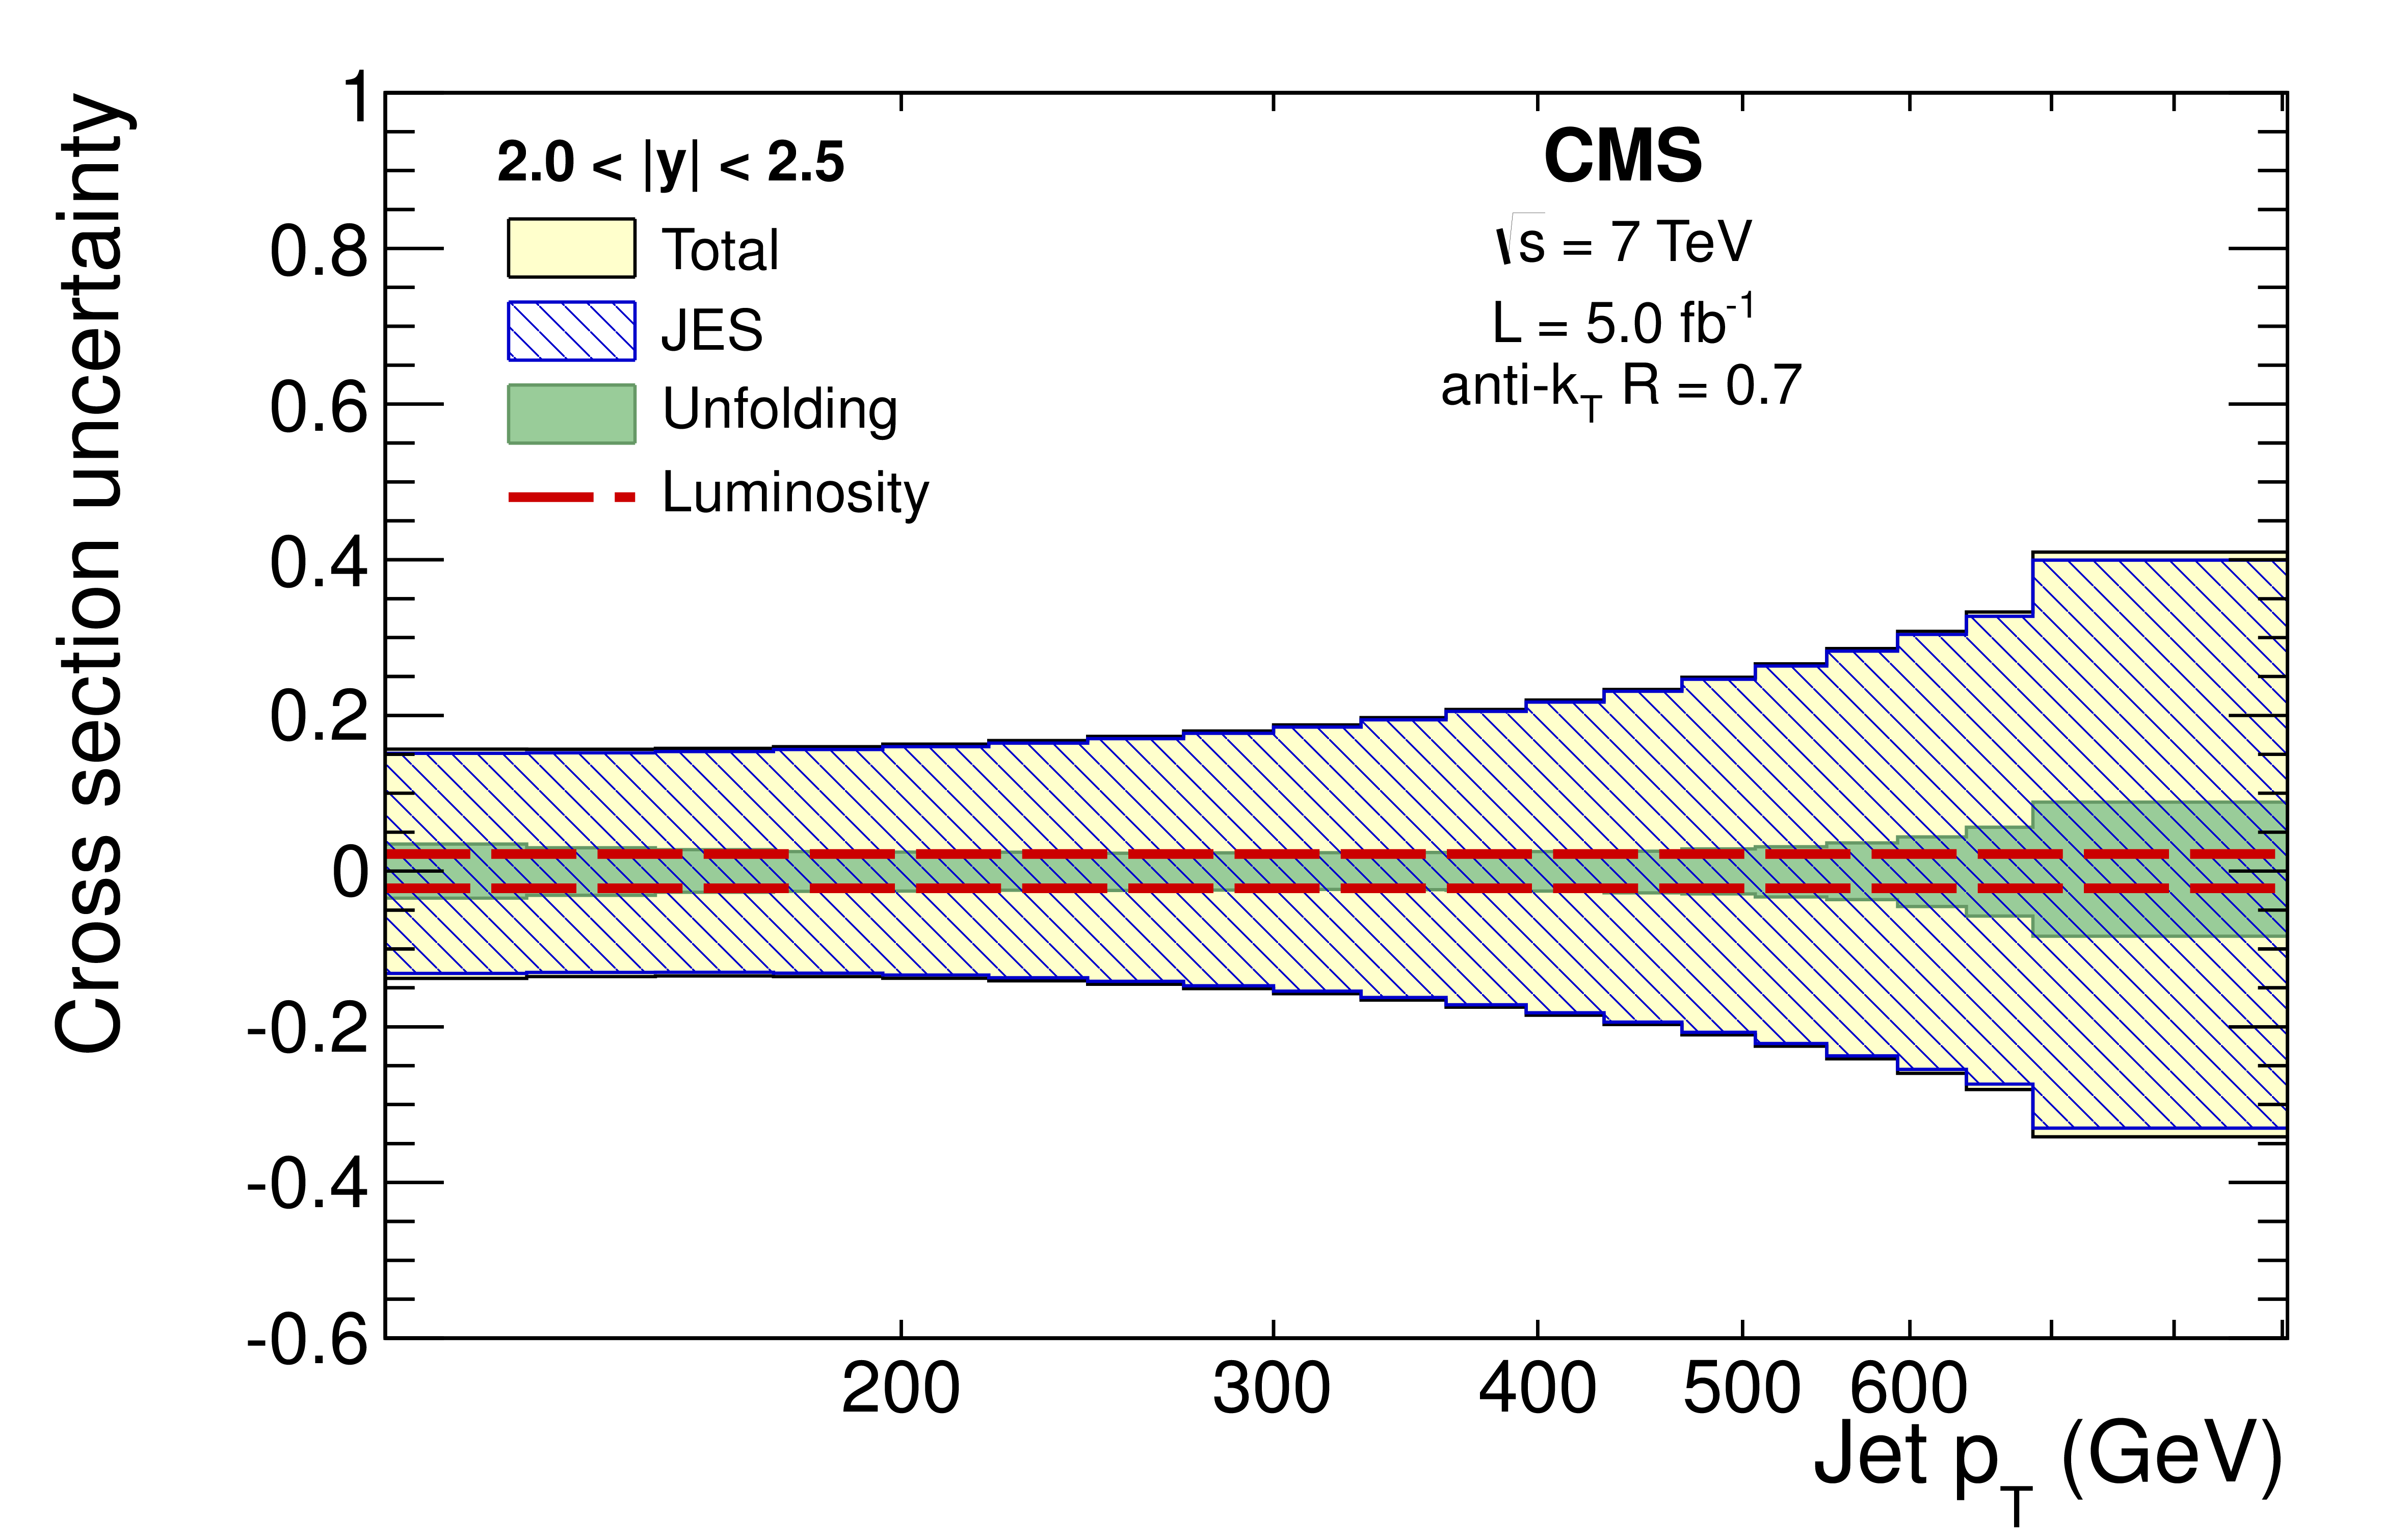
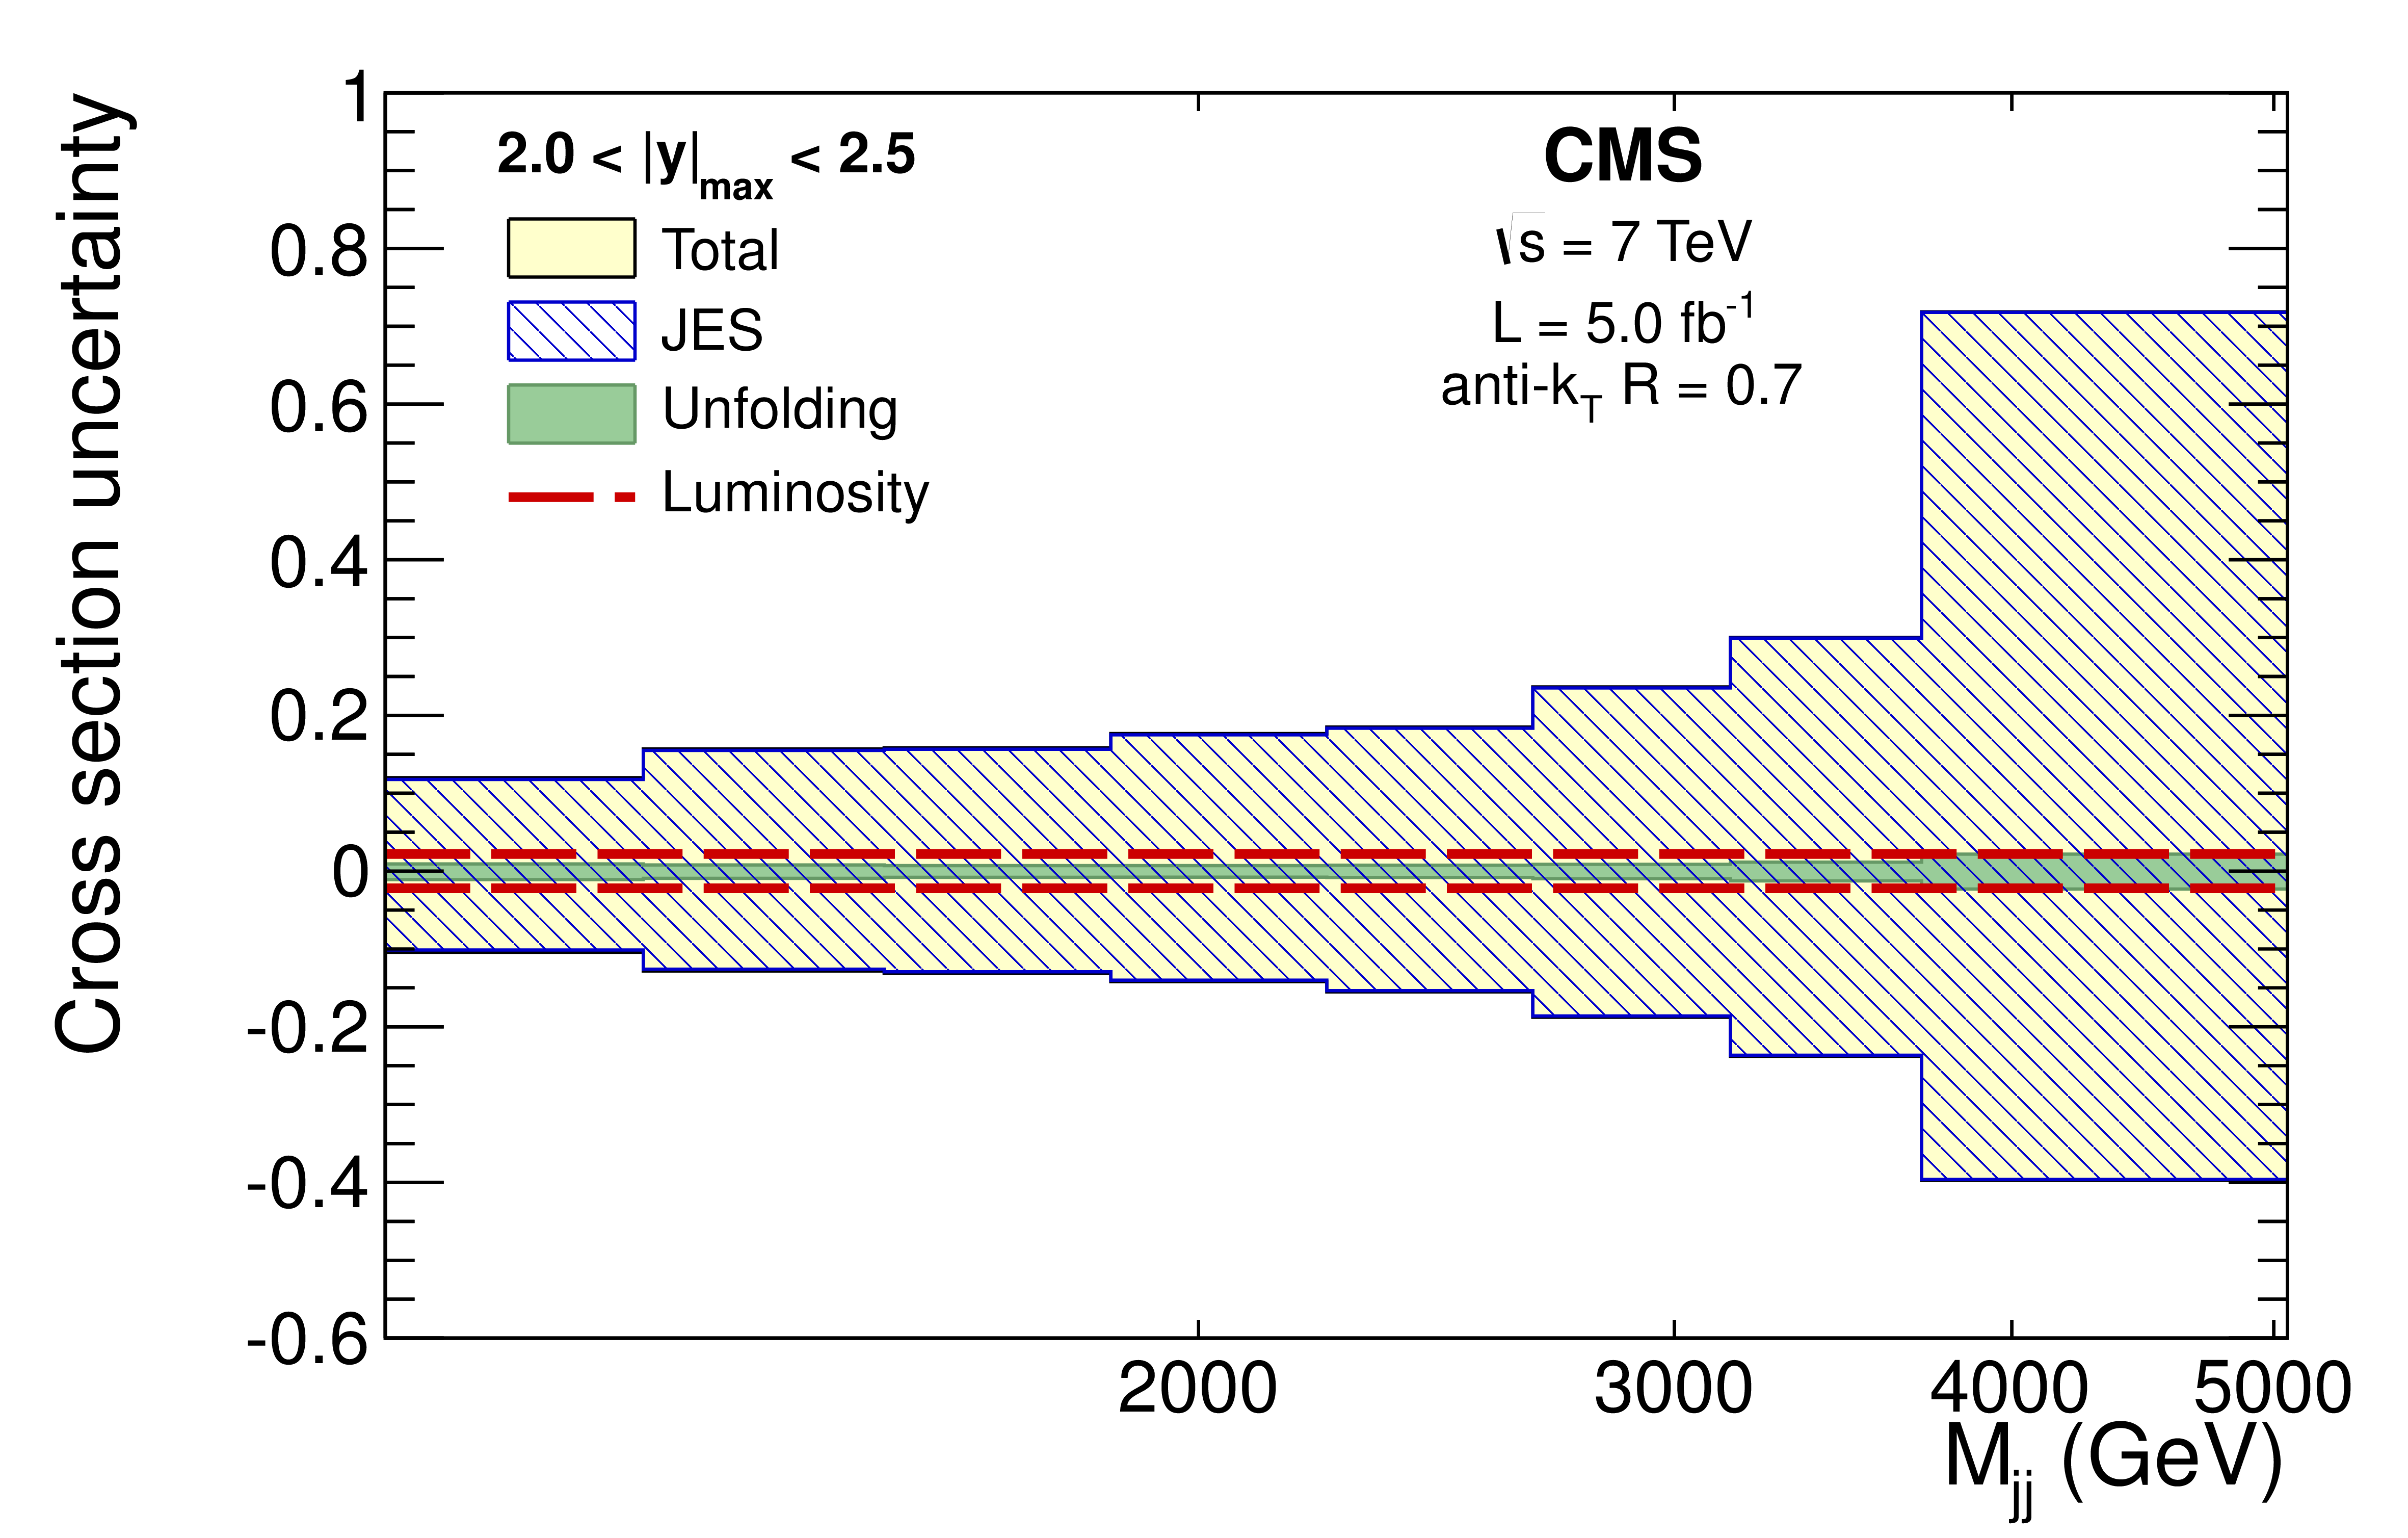
Figure 5-a:
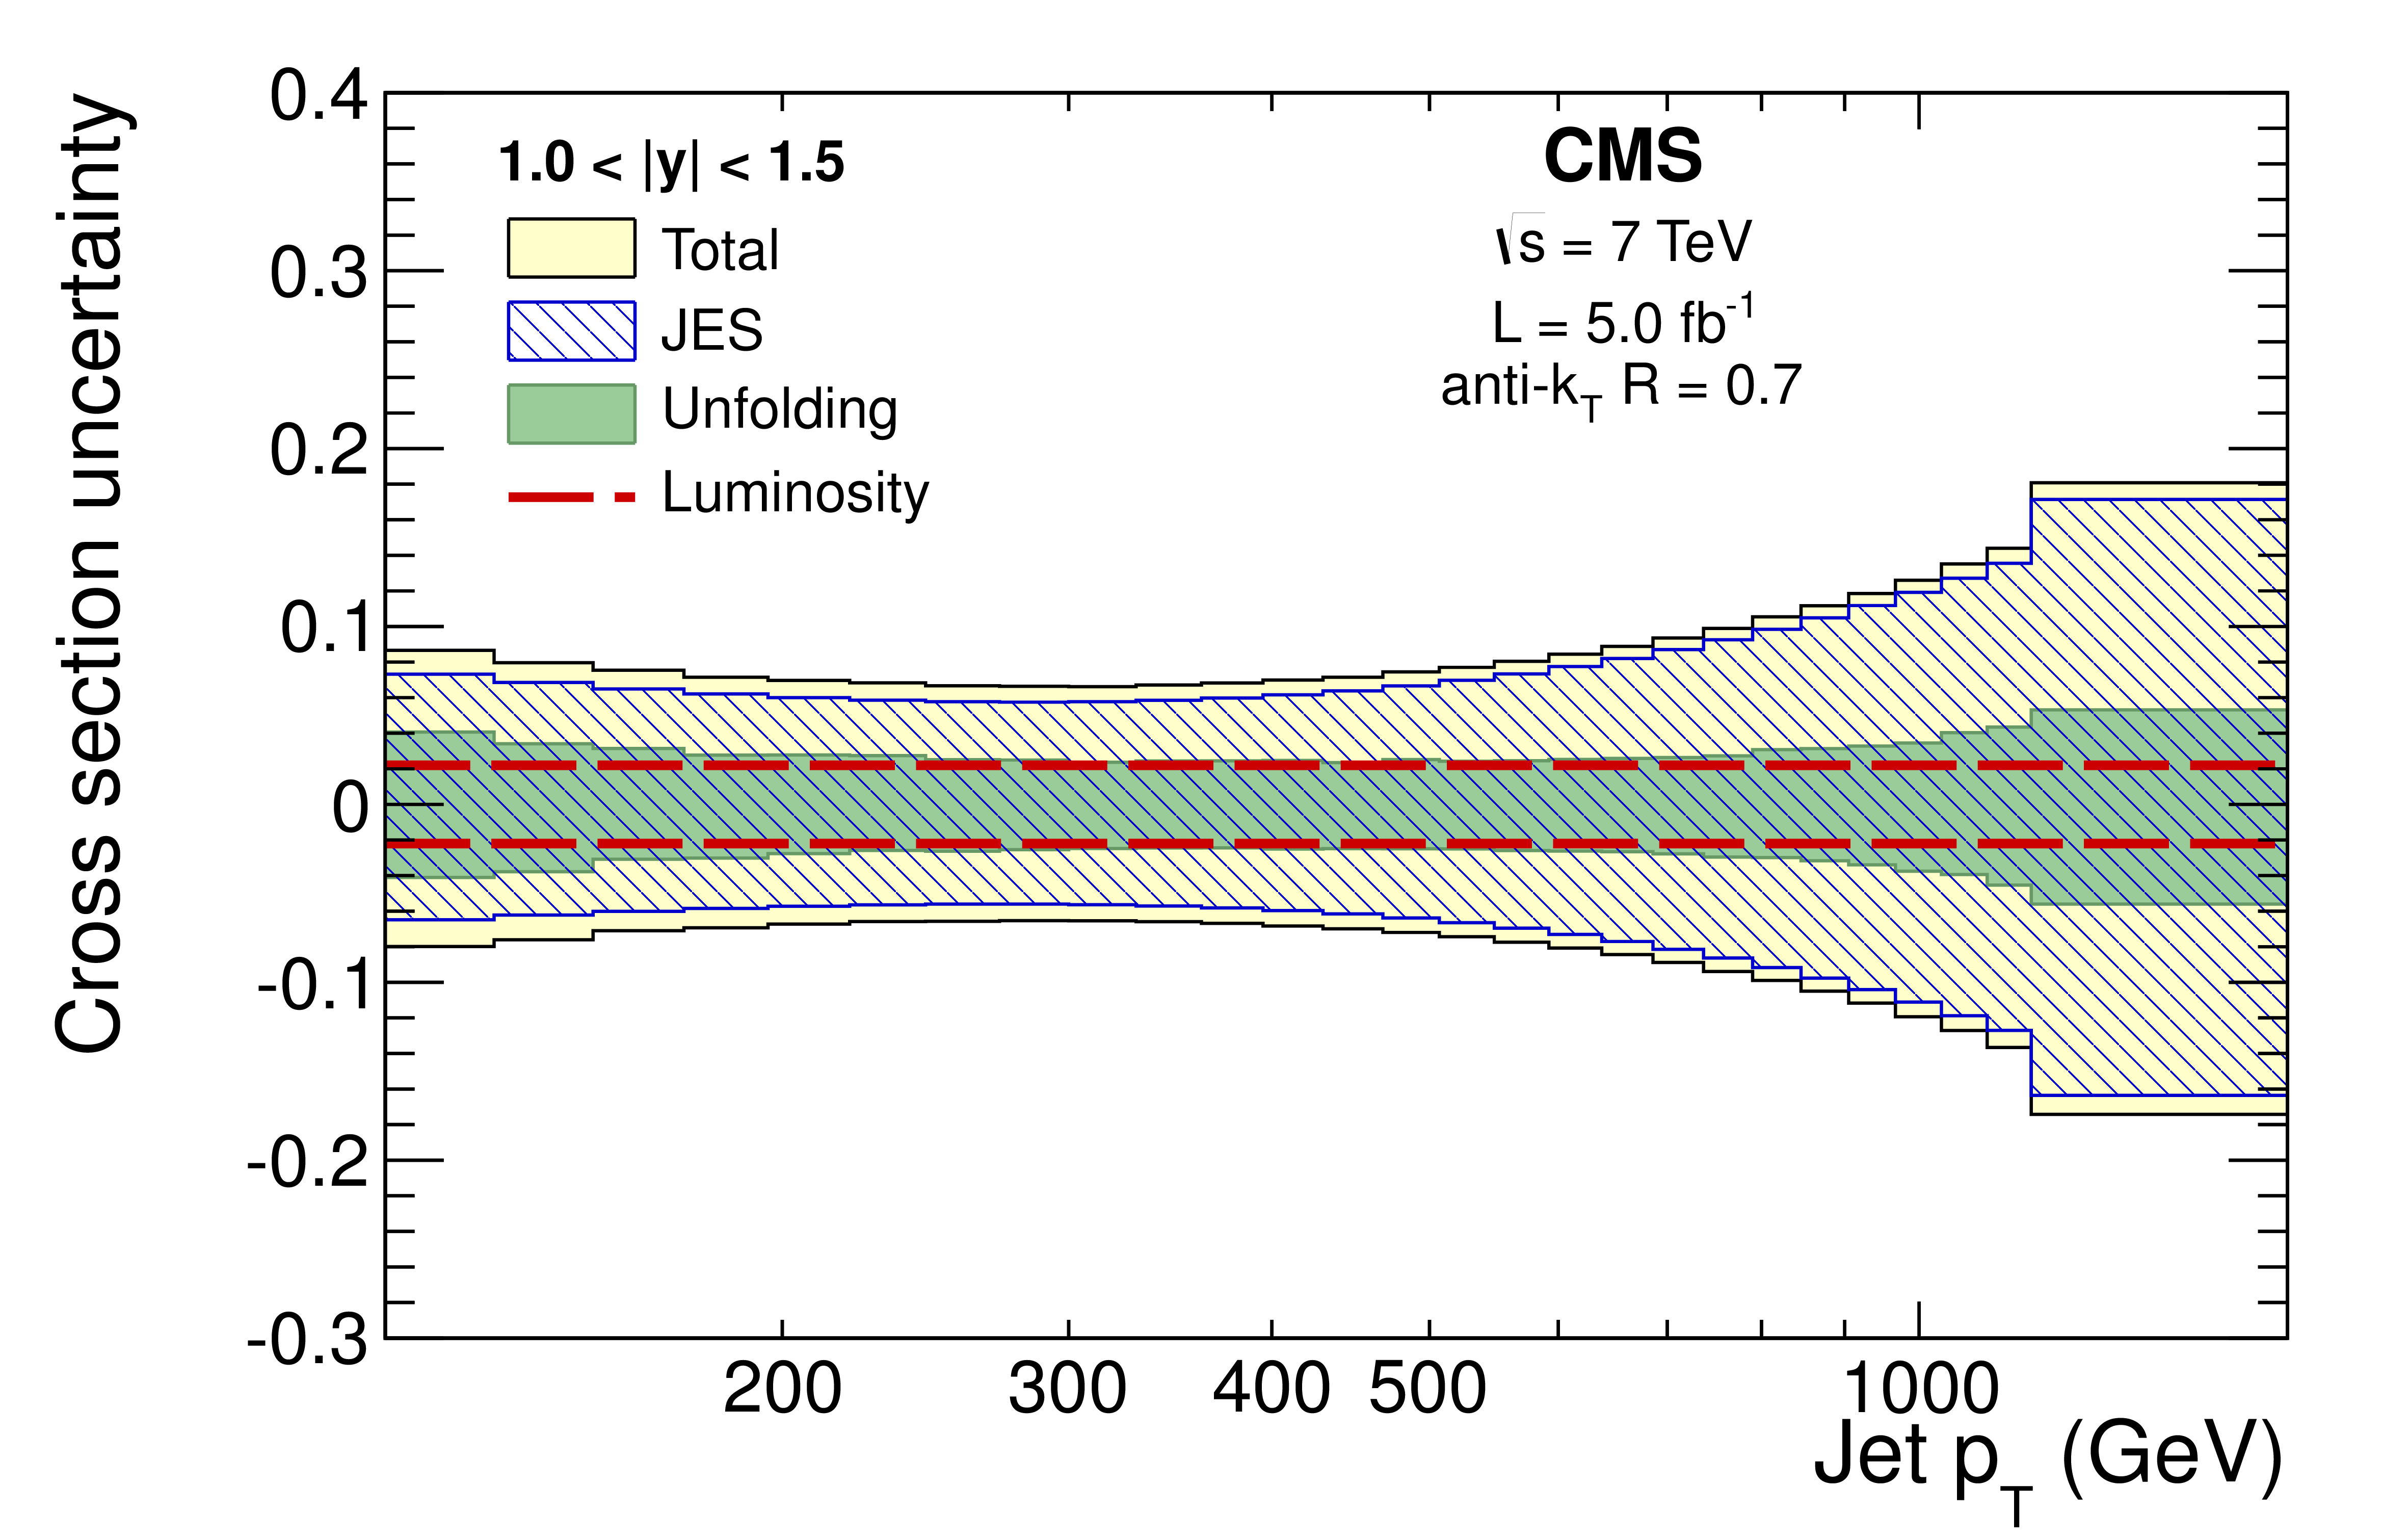
Effect of the relative experimental uncertainties for the inclusive jet (a,c,e,g,i) and dijet (b,d,f,h,j) cross section measurements, and for all five $|y|$ and $|y|_\text {max}$ bins, respectively. The upward and downward uncertainties are estimated separately. |
png pdf |
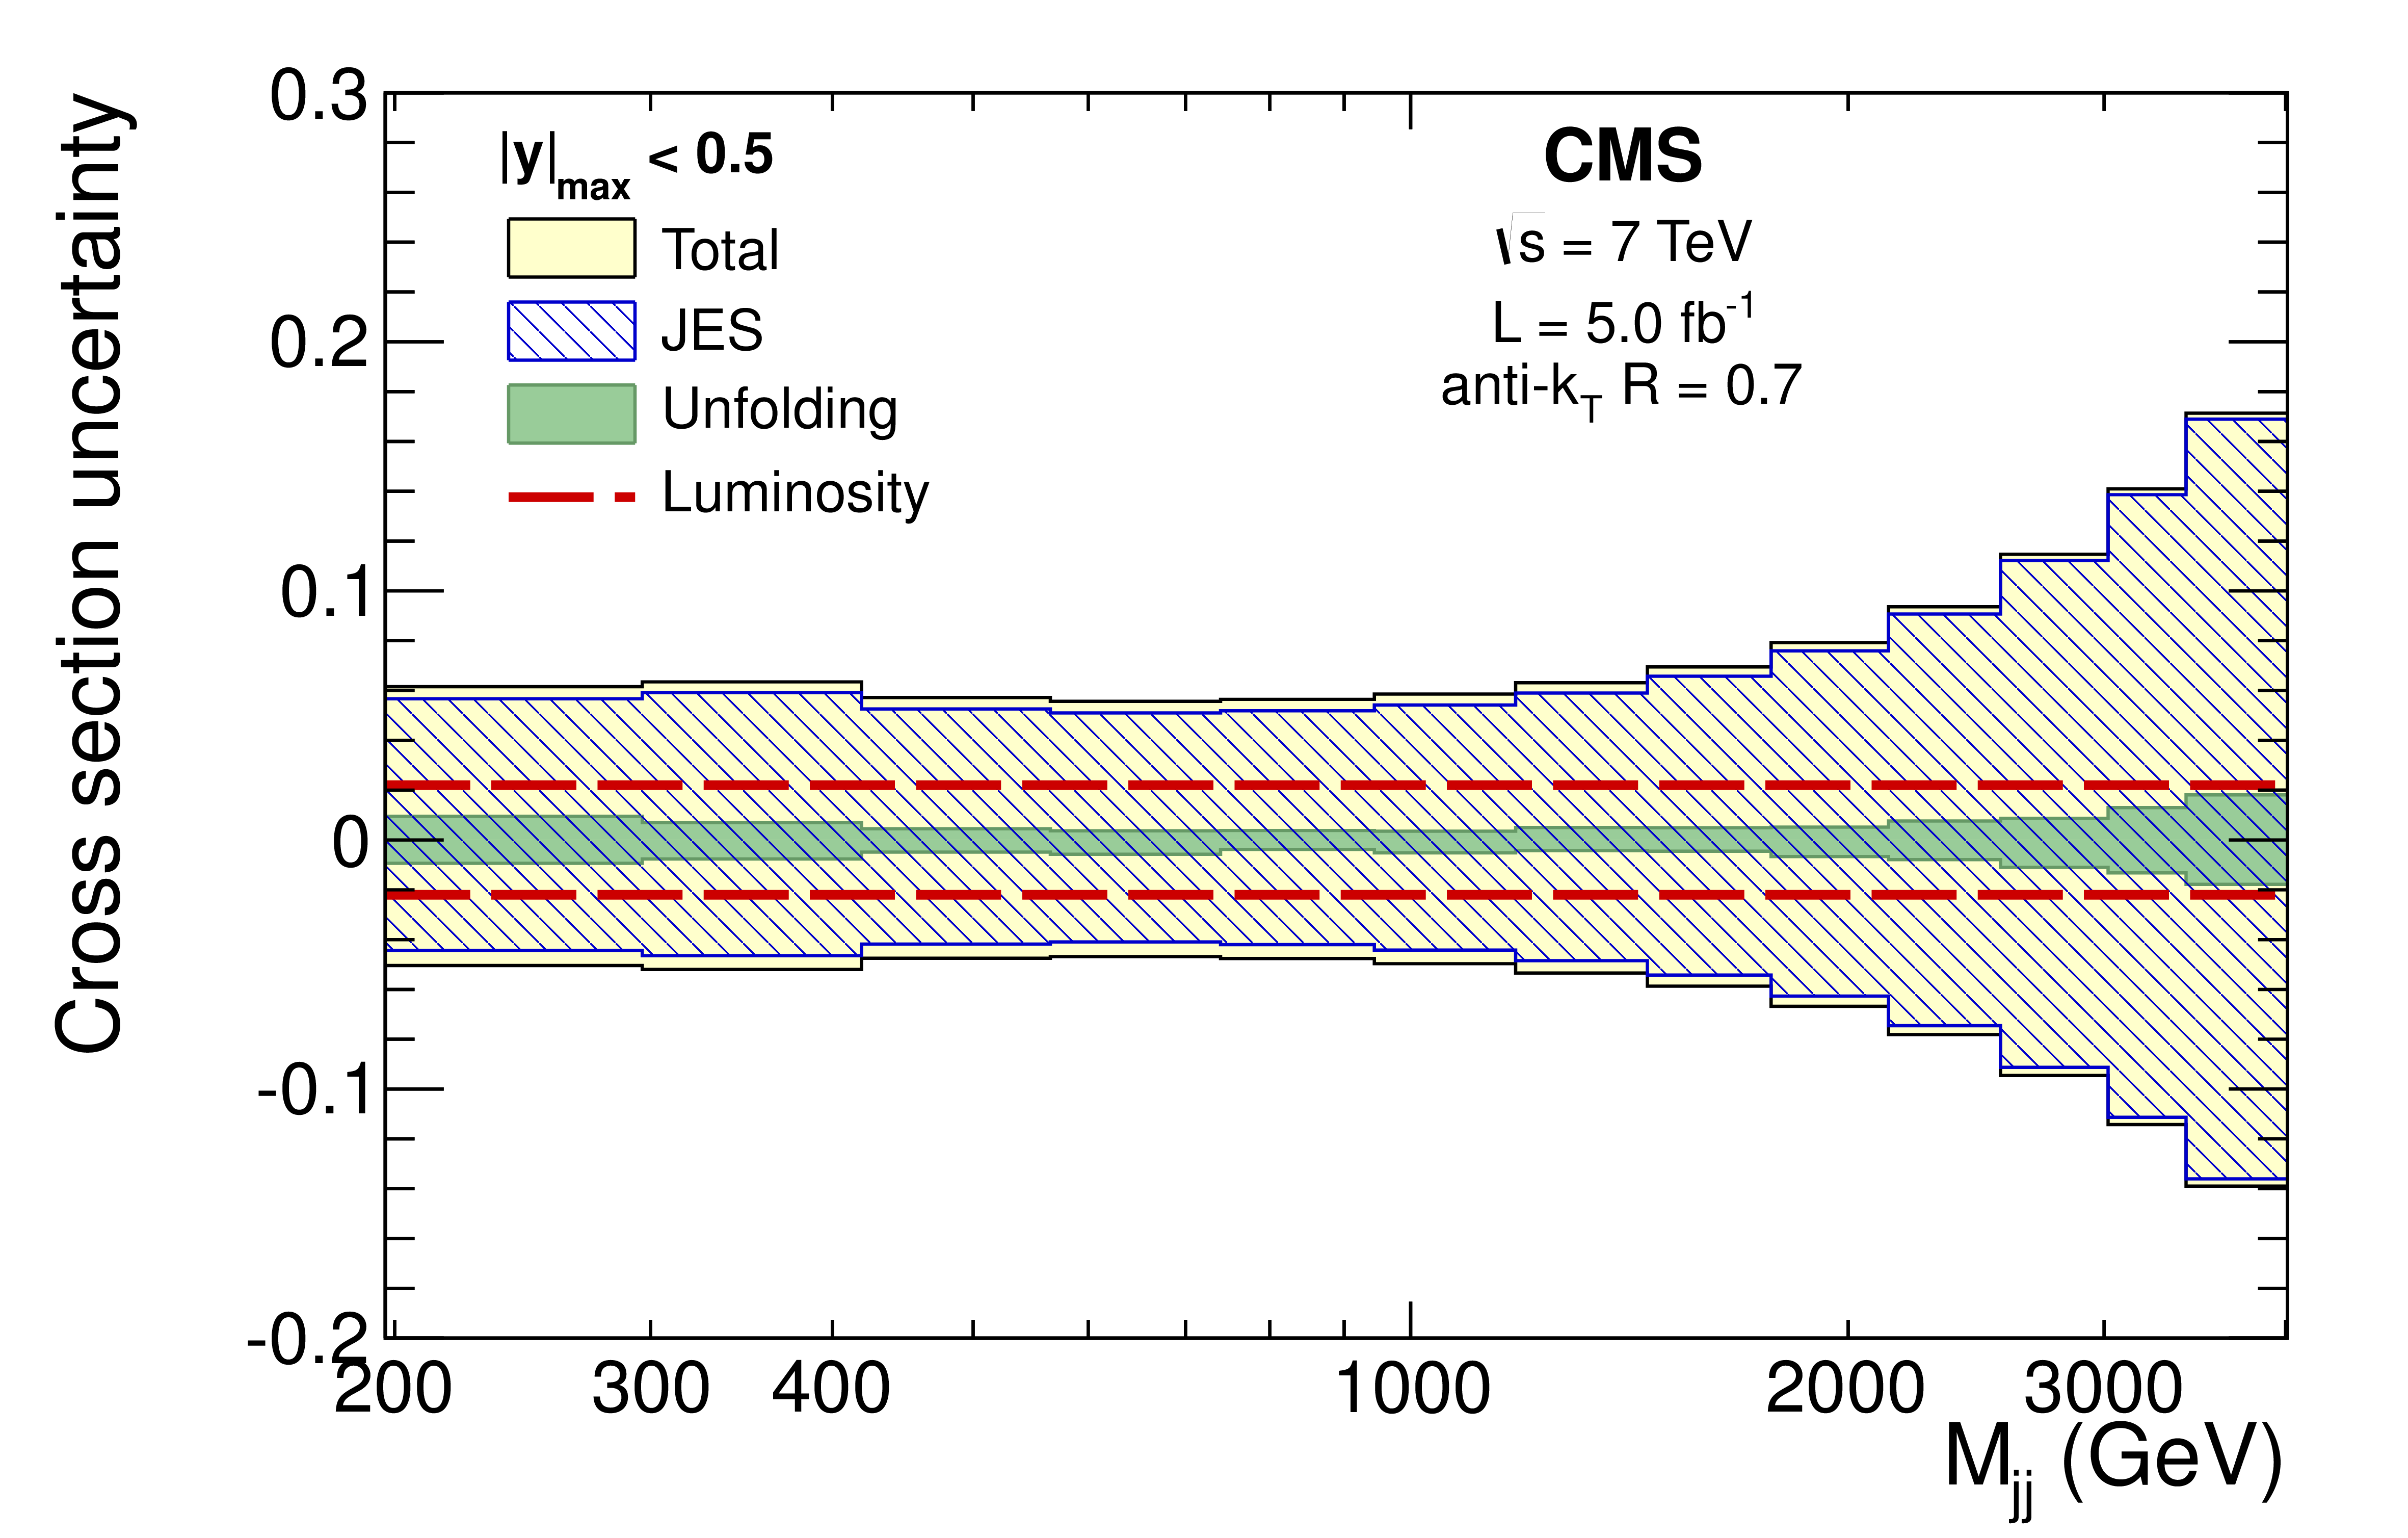
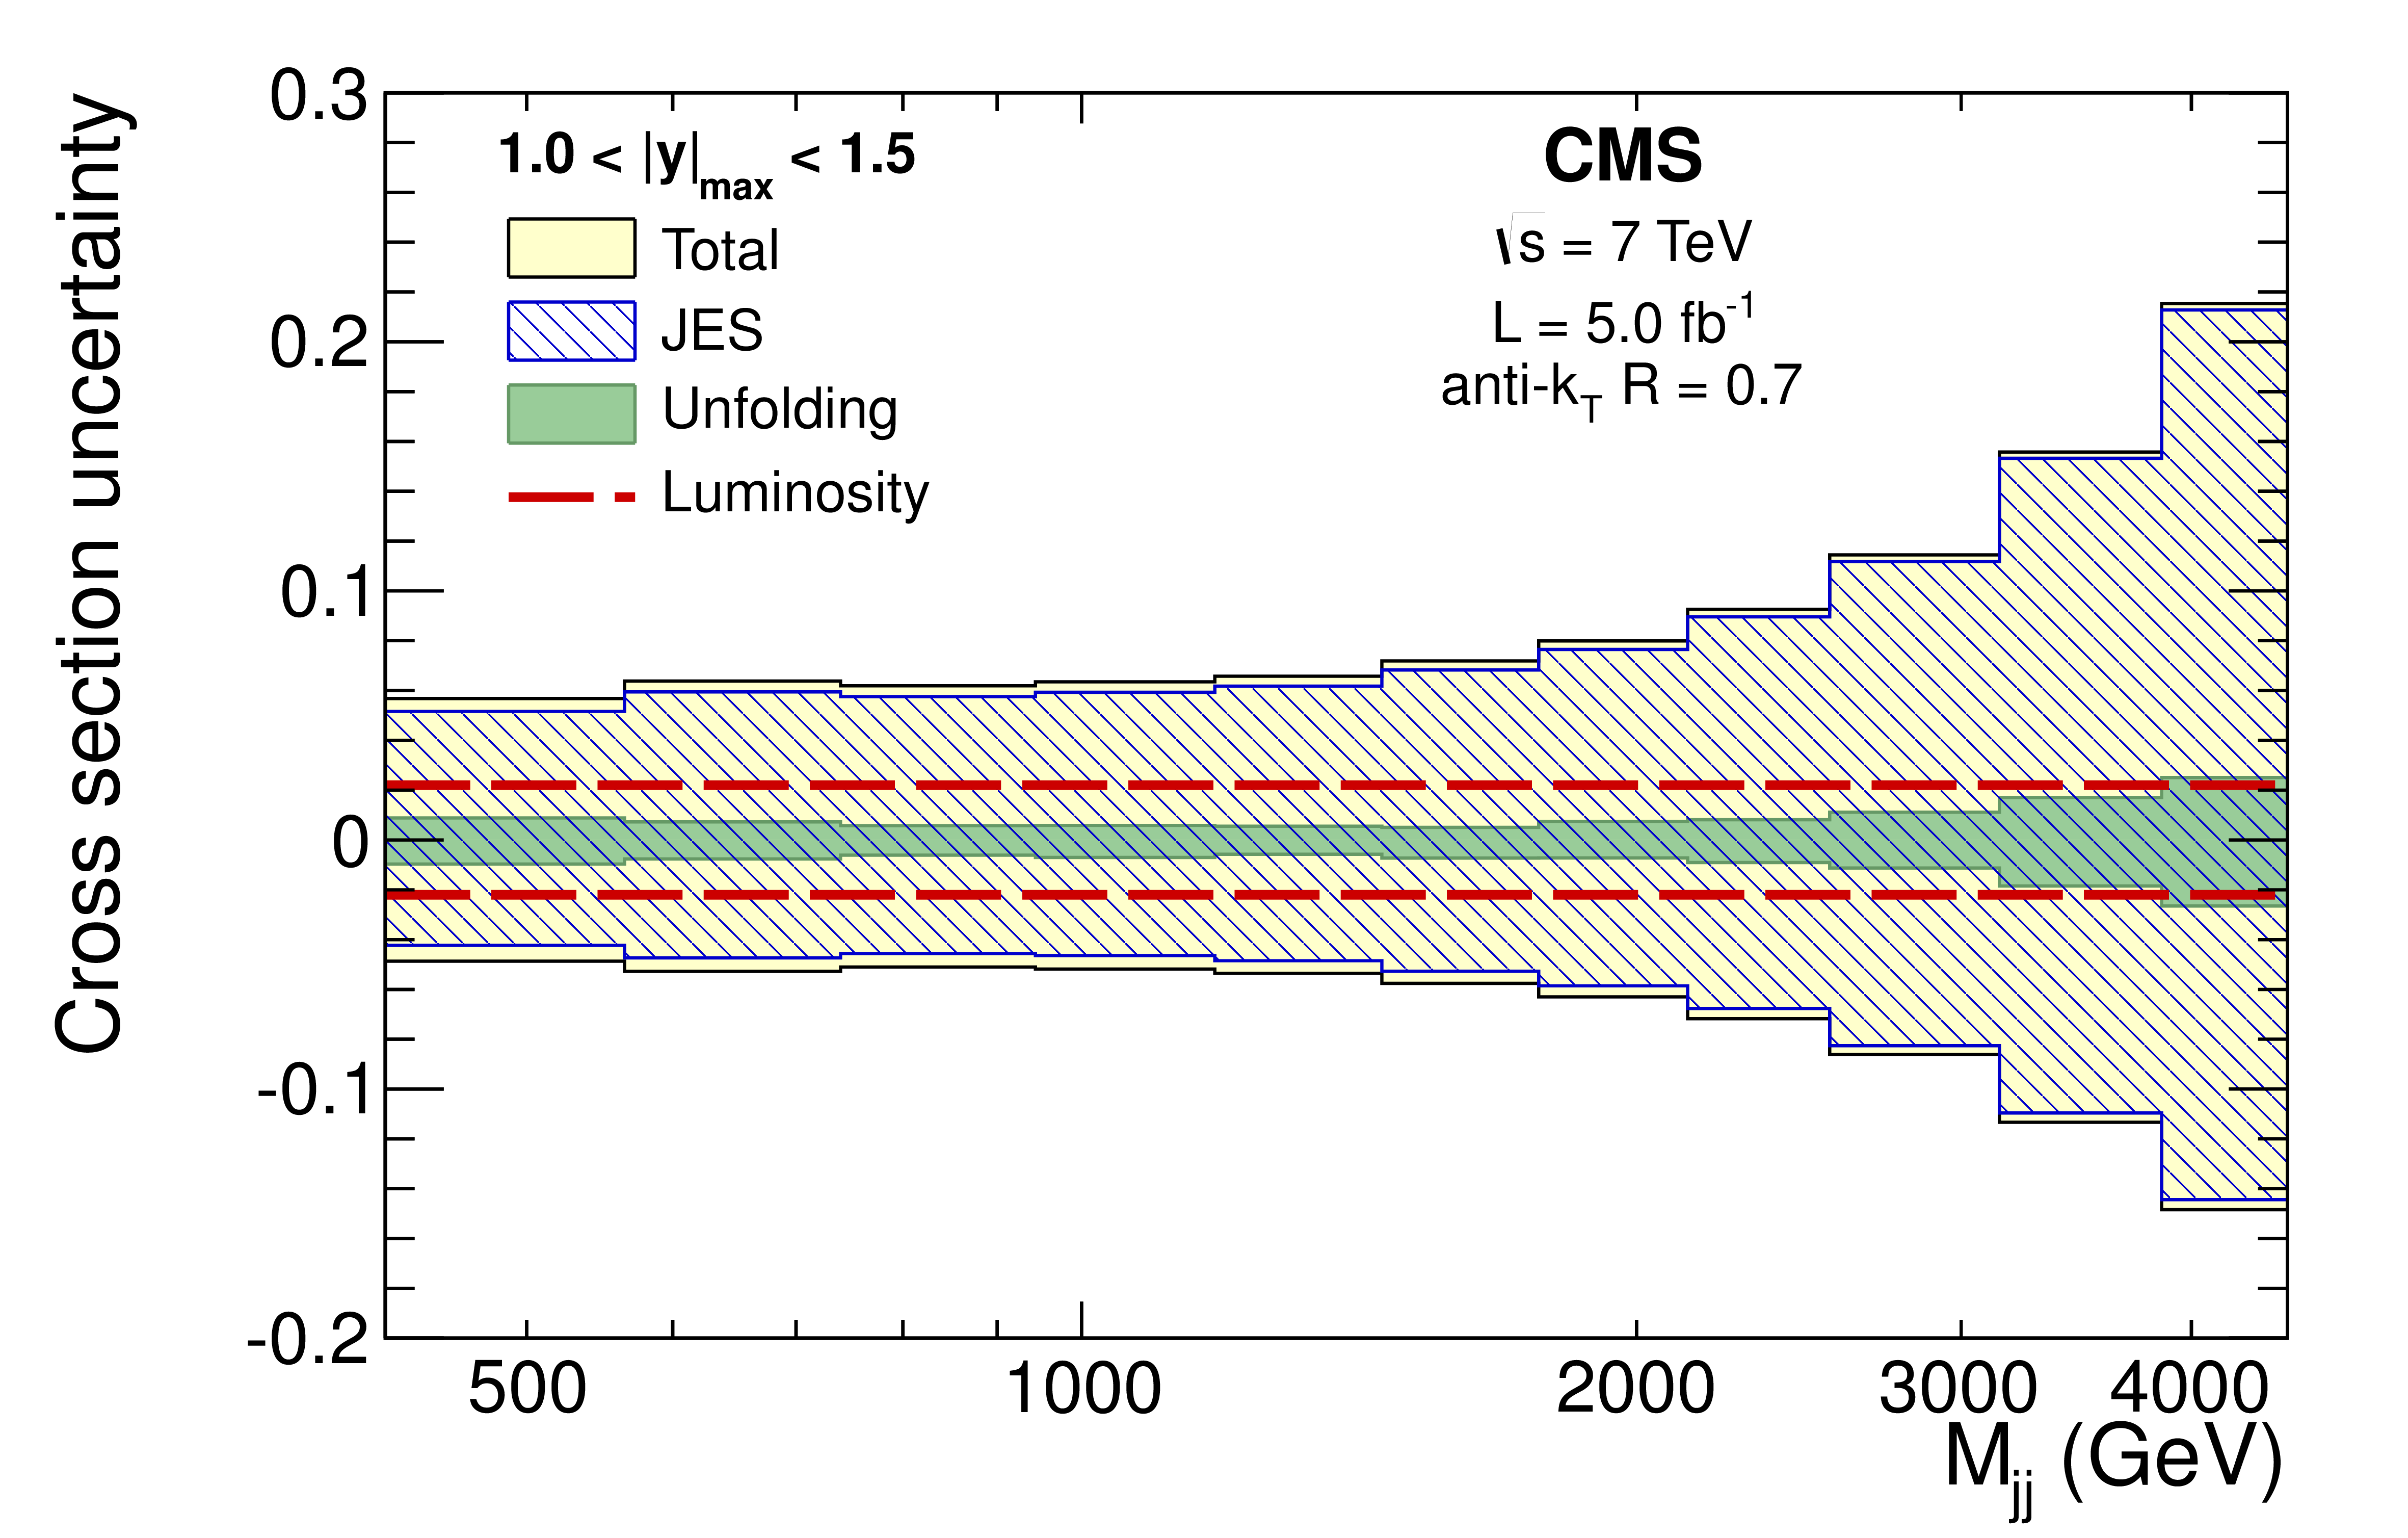
Figure 5-b:
Effect of the relative experimental uncertainties for the inclusive jet (a,c,e,g,i) and dijet (b,d,f,h,j) cross section measurements, and for all five $|y|$ and $|y|_\text {max}$ bins, respectively. The upward and downward uncertainties are estimated separately. |
png pdf |
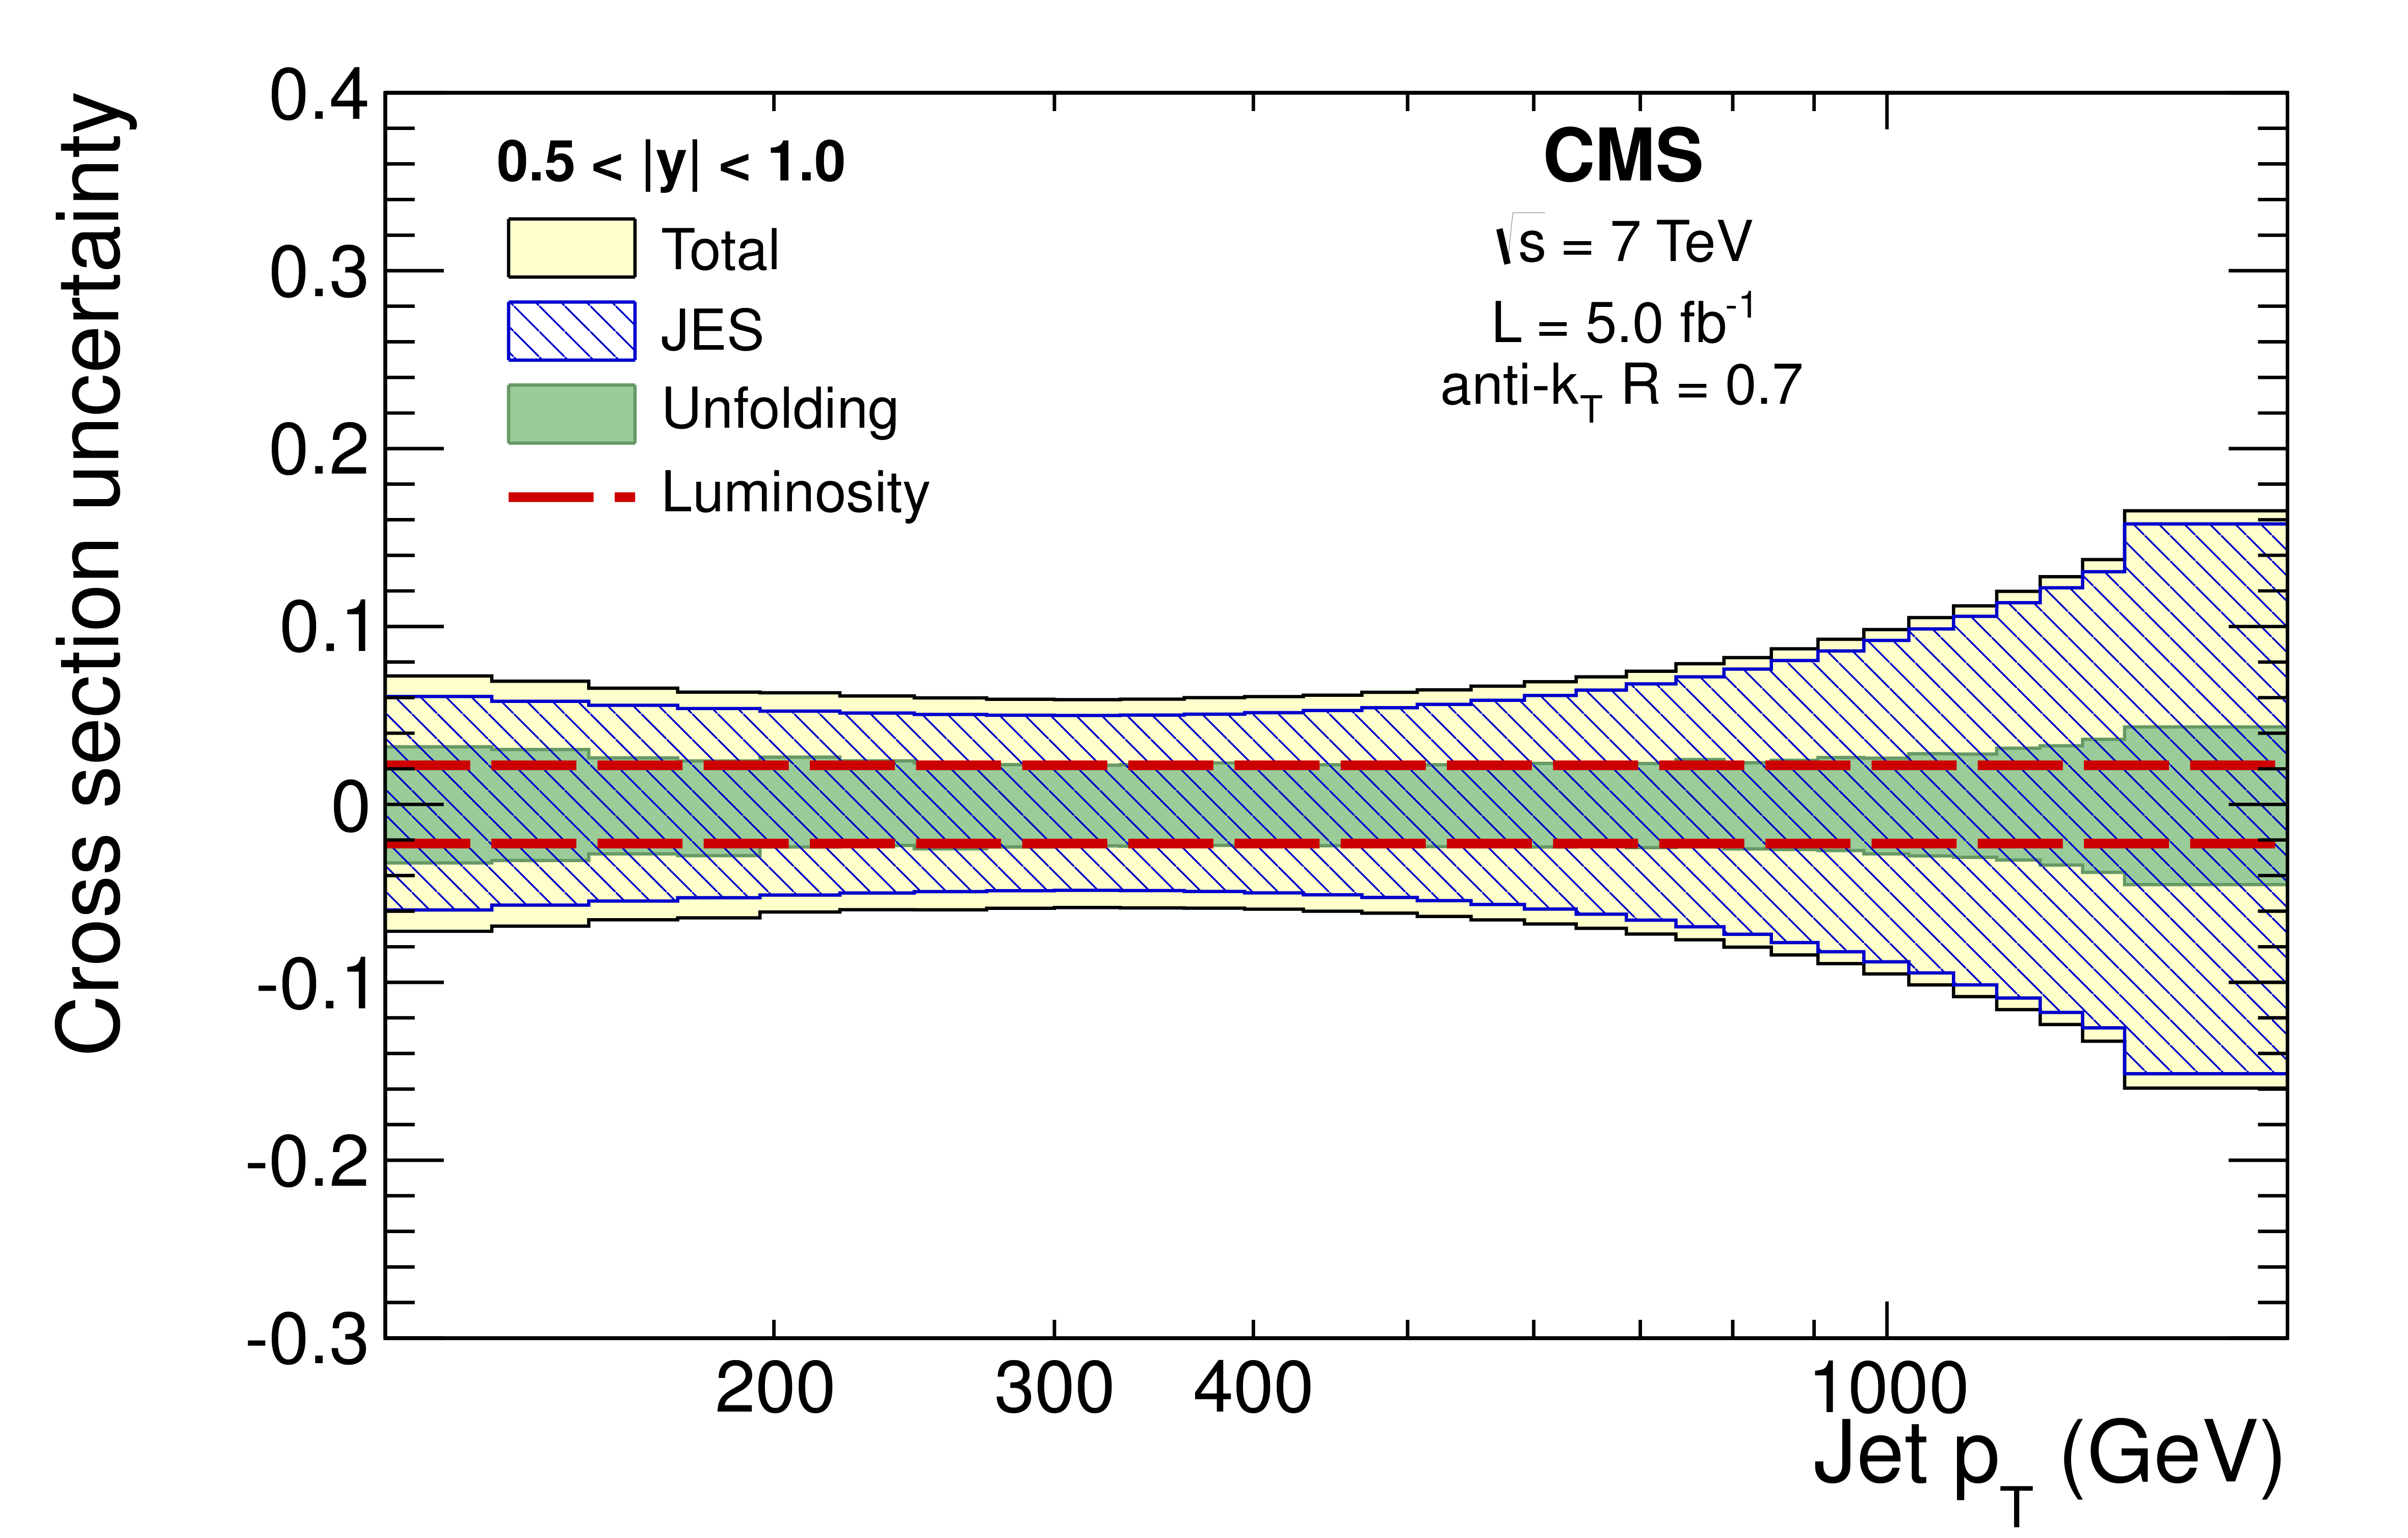
Figure 5-c:
Effect of the relative experimental uncertainties for the inclusive jet (a,c,e,g,i) and dijet (b,d,f,h,j) cross section measurements, and for all five $|y|$ and $|y|_\text {max}$ bins, respectively. The upward and downward uncertainties are estimated separately. |

png pdf |
Figure 5-d:
Effect of the relative experimental uncertainties for the inclusive jet (a,c,e,g,i) and dijet (b,d,f,h,j) cross section measurements, and for all five $|y|$ and $|y|_\text {max}$ bins, respectively. The upward and downward uncertainties are estimated separately. |
png pdf |
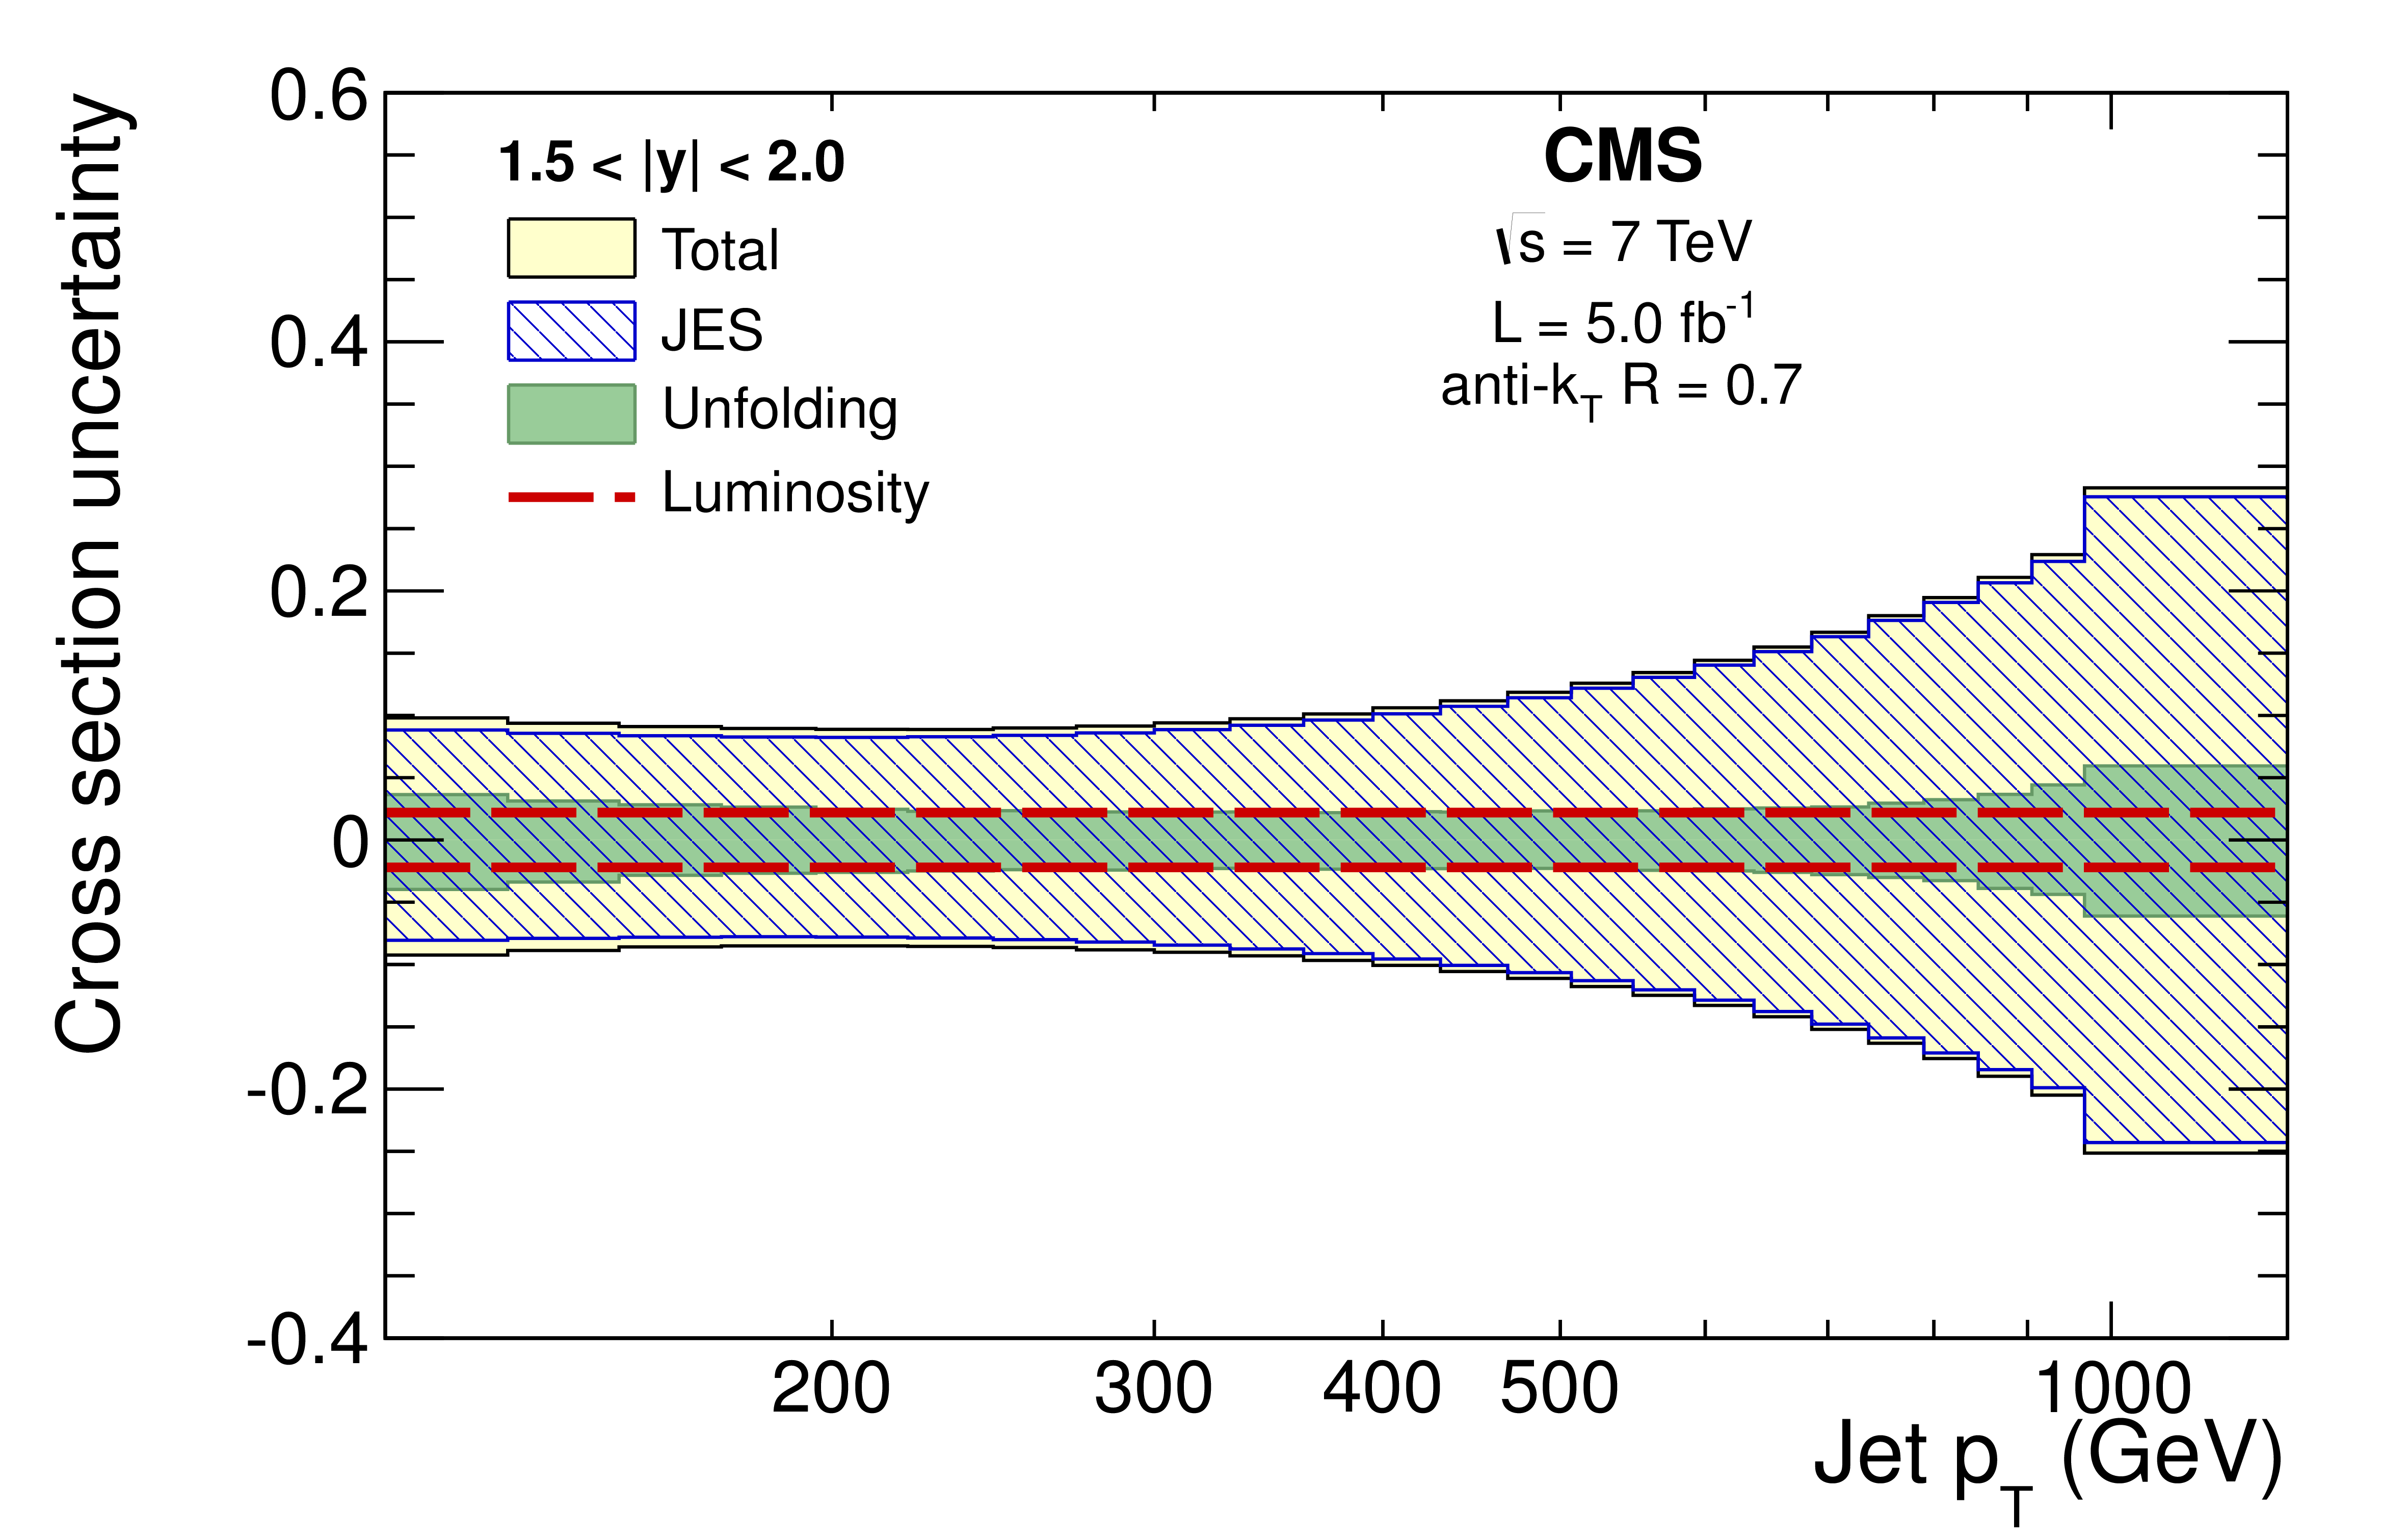
Figure 5-e:
Effect of the relative experimental uncertainties for the inclusive jet (a,c,e,g,i) and dijet (b,d,f,h,j) cross section measurements, and for all five $|y|$ and $|y|_\text {max}$ bins, respectively. The upward and downward uncertainties are estimated separately. |
png pdf |
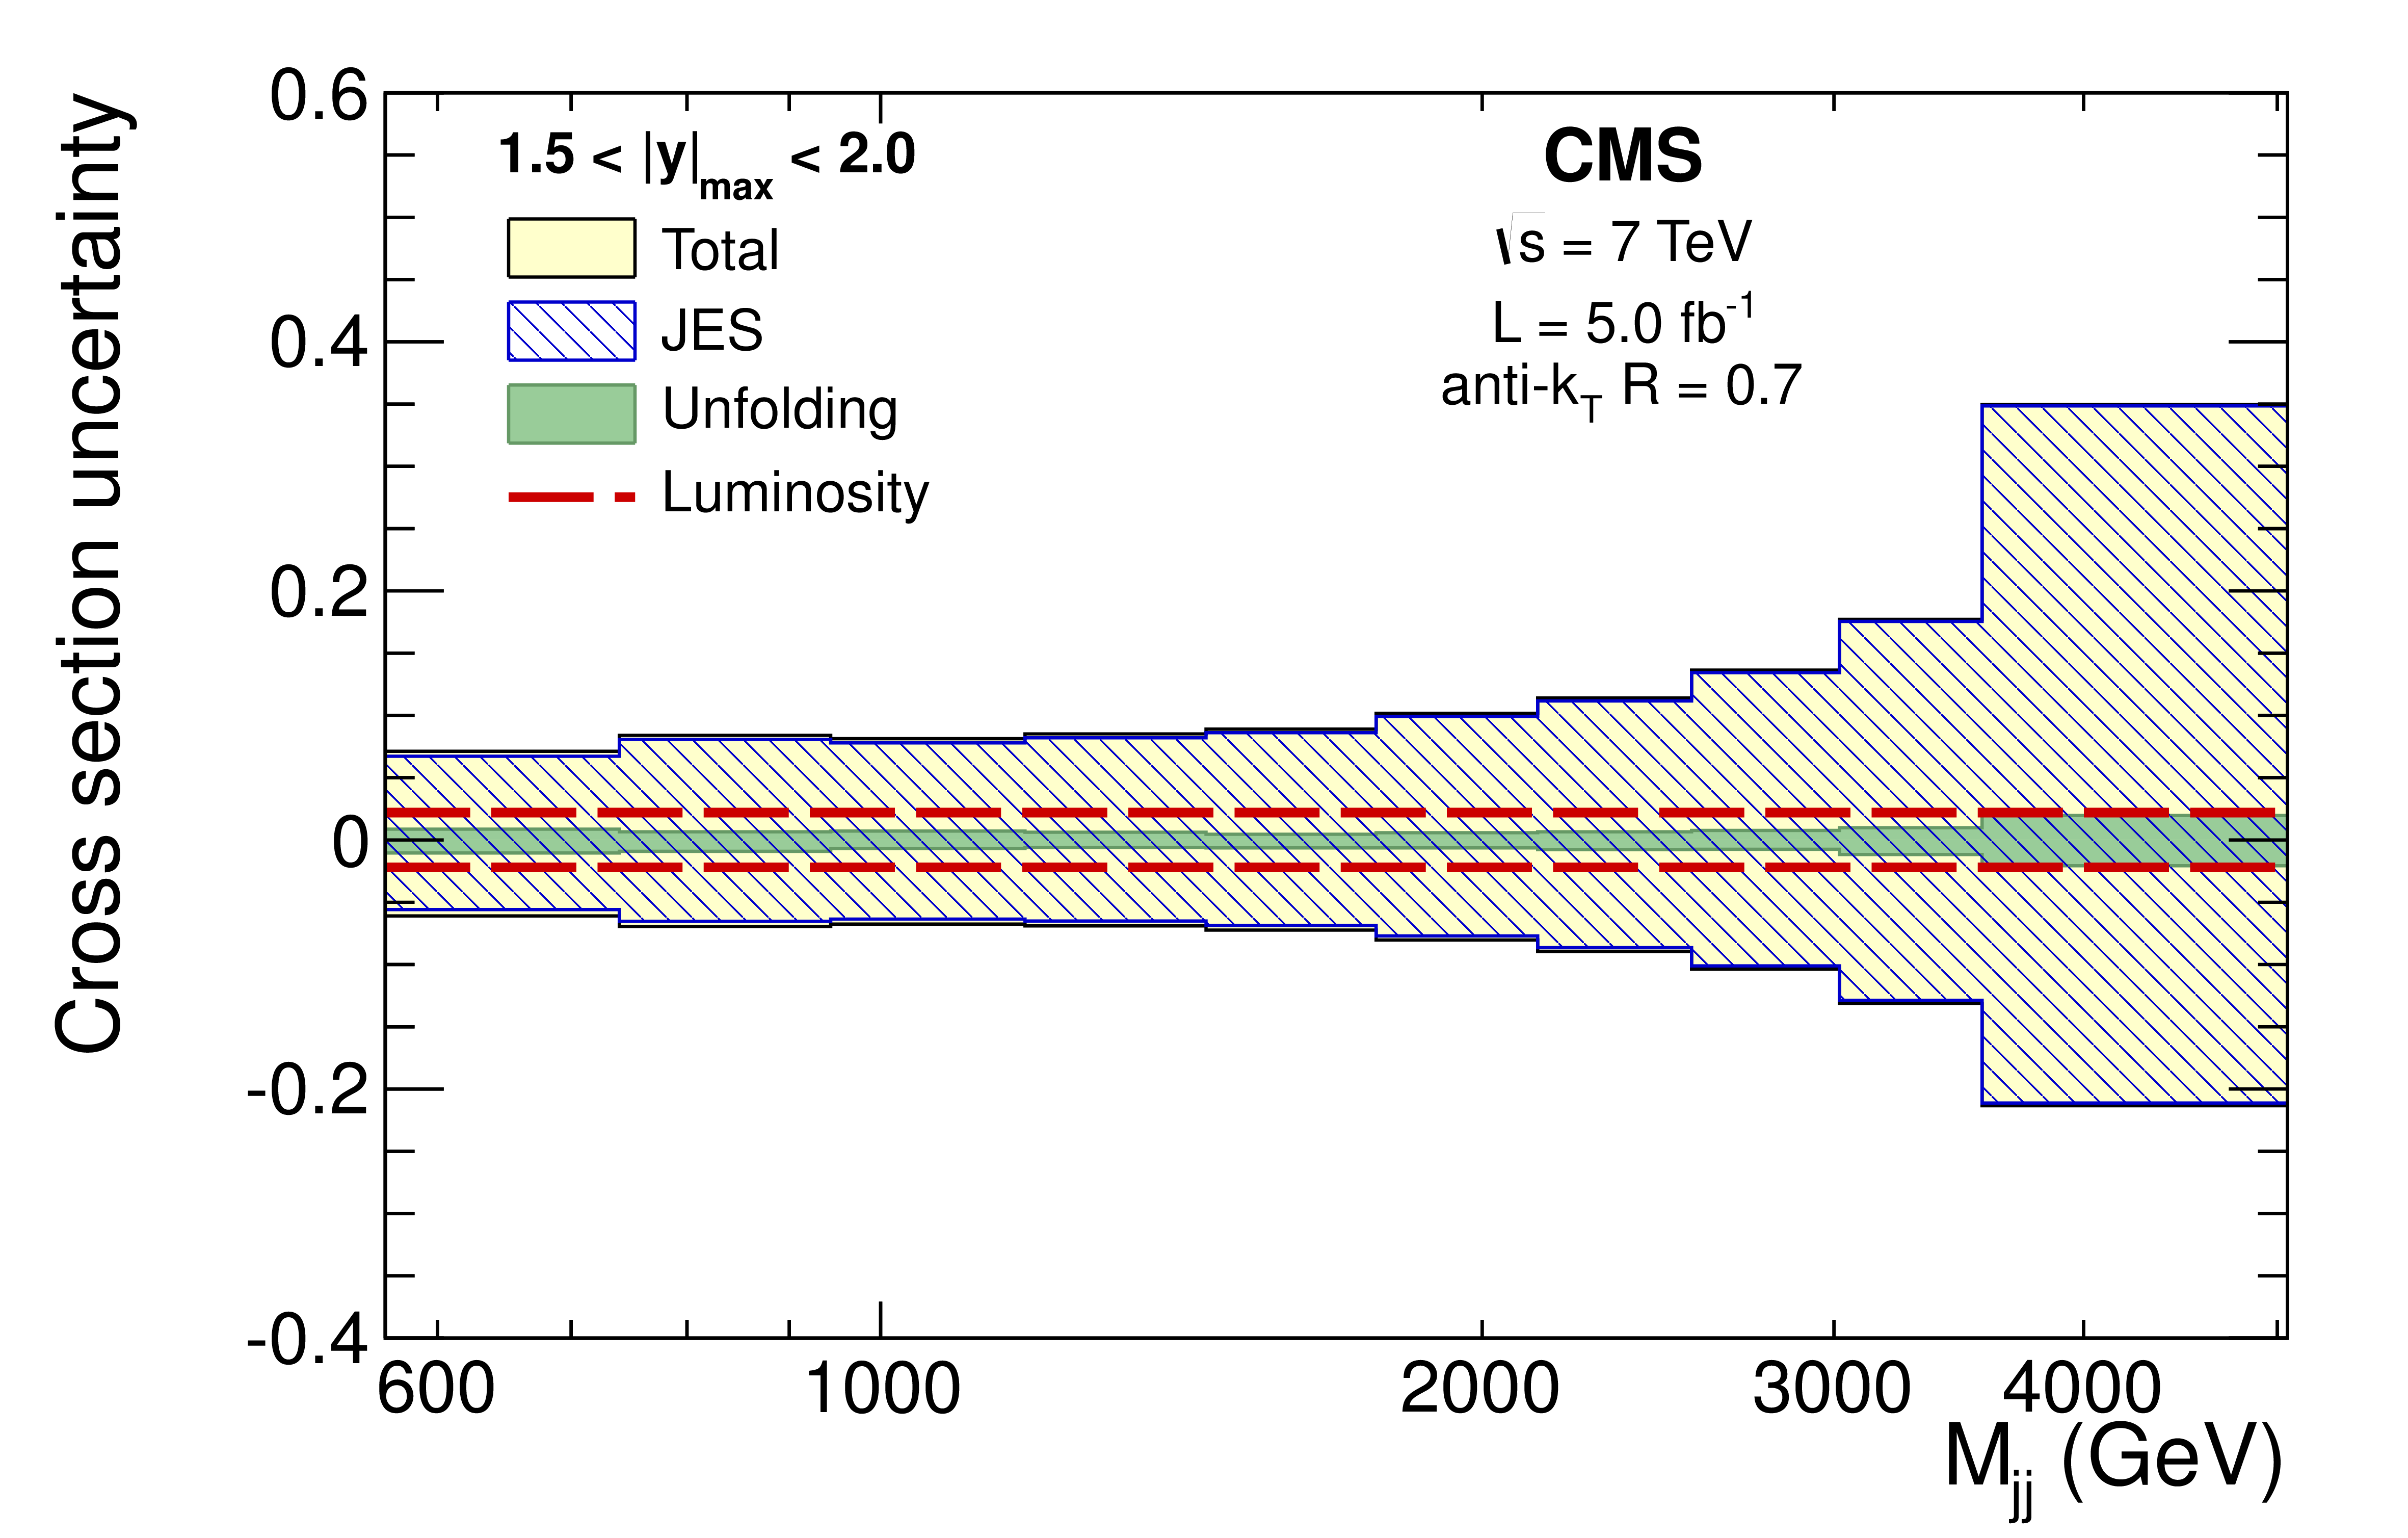
Figure 5-f:
Effect of the relative experimental uncertainties for the inclusive jet (a,c,e,g,i) and dijet (b,d,f,h,j) cross section measurements, and for all five $|y|$ and $|y|_\text {max}$ bins, respectively. The upward and downward uncertainties are estimated separately. |
png pdf |
Figure 5-g:
Effect of the relative experimental uncertainties for the inclusive jet (a,c,e,g,i) and dijet (b,d,f,h,j) cross section measurements, and for all five $|y|$ and $|y|_\text {max}$ bins, respectively. The upward and downward uncertainties are estimated separately. |
png pdf |
Figure 5-h:
Effect of the relative experimental uncertainties for the inclusive jet (a,c,e,g,i) and dijet (b,d,f,h,j) cross section measurements, and for all five $|y|$ and $|y|_\text {max}$ bins, respectively. The upward and downward uncertainties are estimated separately. |
png pdf |
Figure 5-i:
Effect of the relative experimental uncertainties for the inclusive jet (a,c,e,g,i) and dijet (b,d,f,h,j) cross section measurements, and for all five $|y|$ and $|y|_\text {max}$ bins, respectively. The upward and downward uncertainties are estimated separately. |
png pdf |
Figure 5-j:
Effect of the relative experimental uncertainties for the inclusive jet (a,c,e,g,i) and dijet (b,d,f,h,j) cross section measurements, and for all five $|y|$ and $|y|_\text {max}$ bins, respectively. The upward and downward uncertainties are estimated separately. |
png pdf |
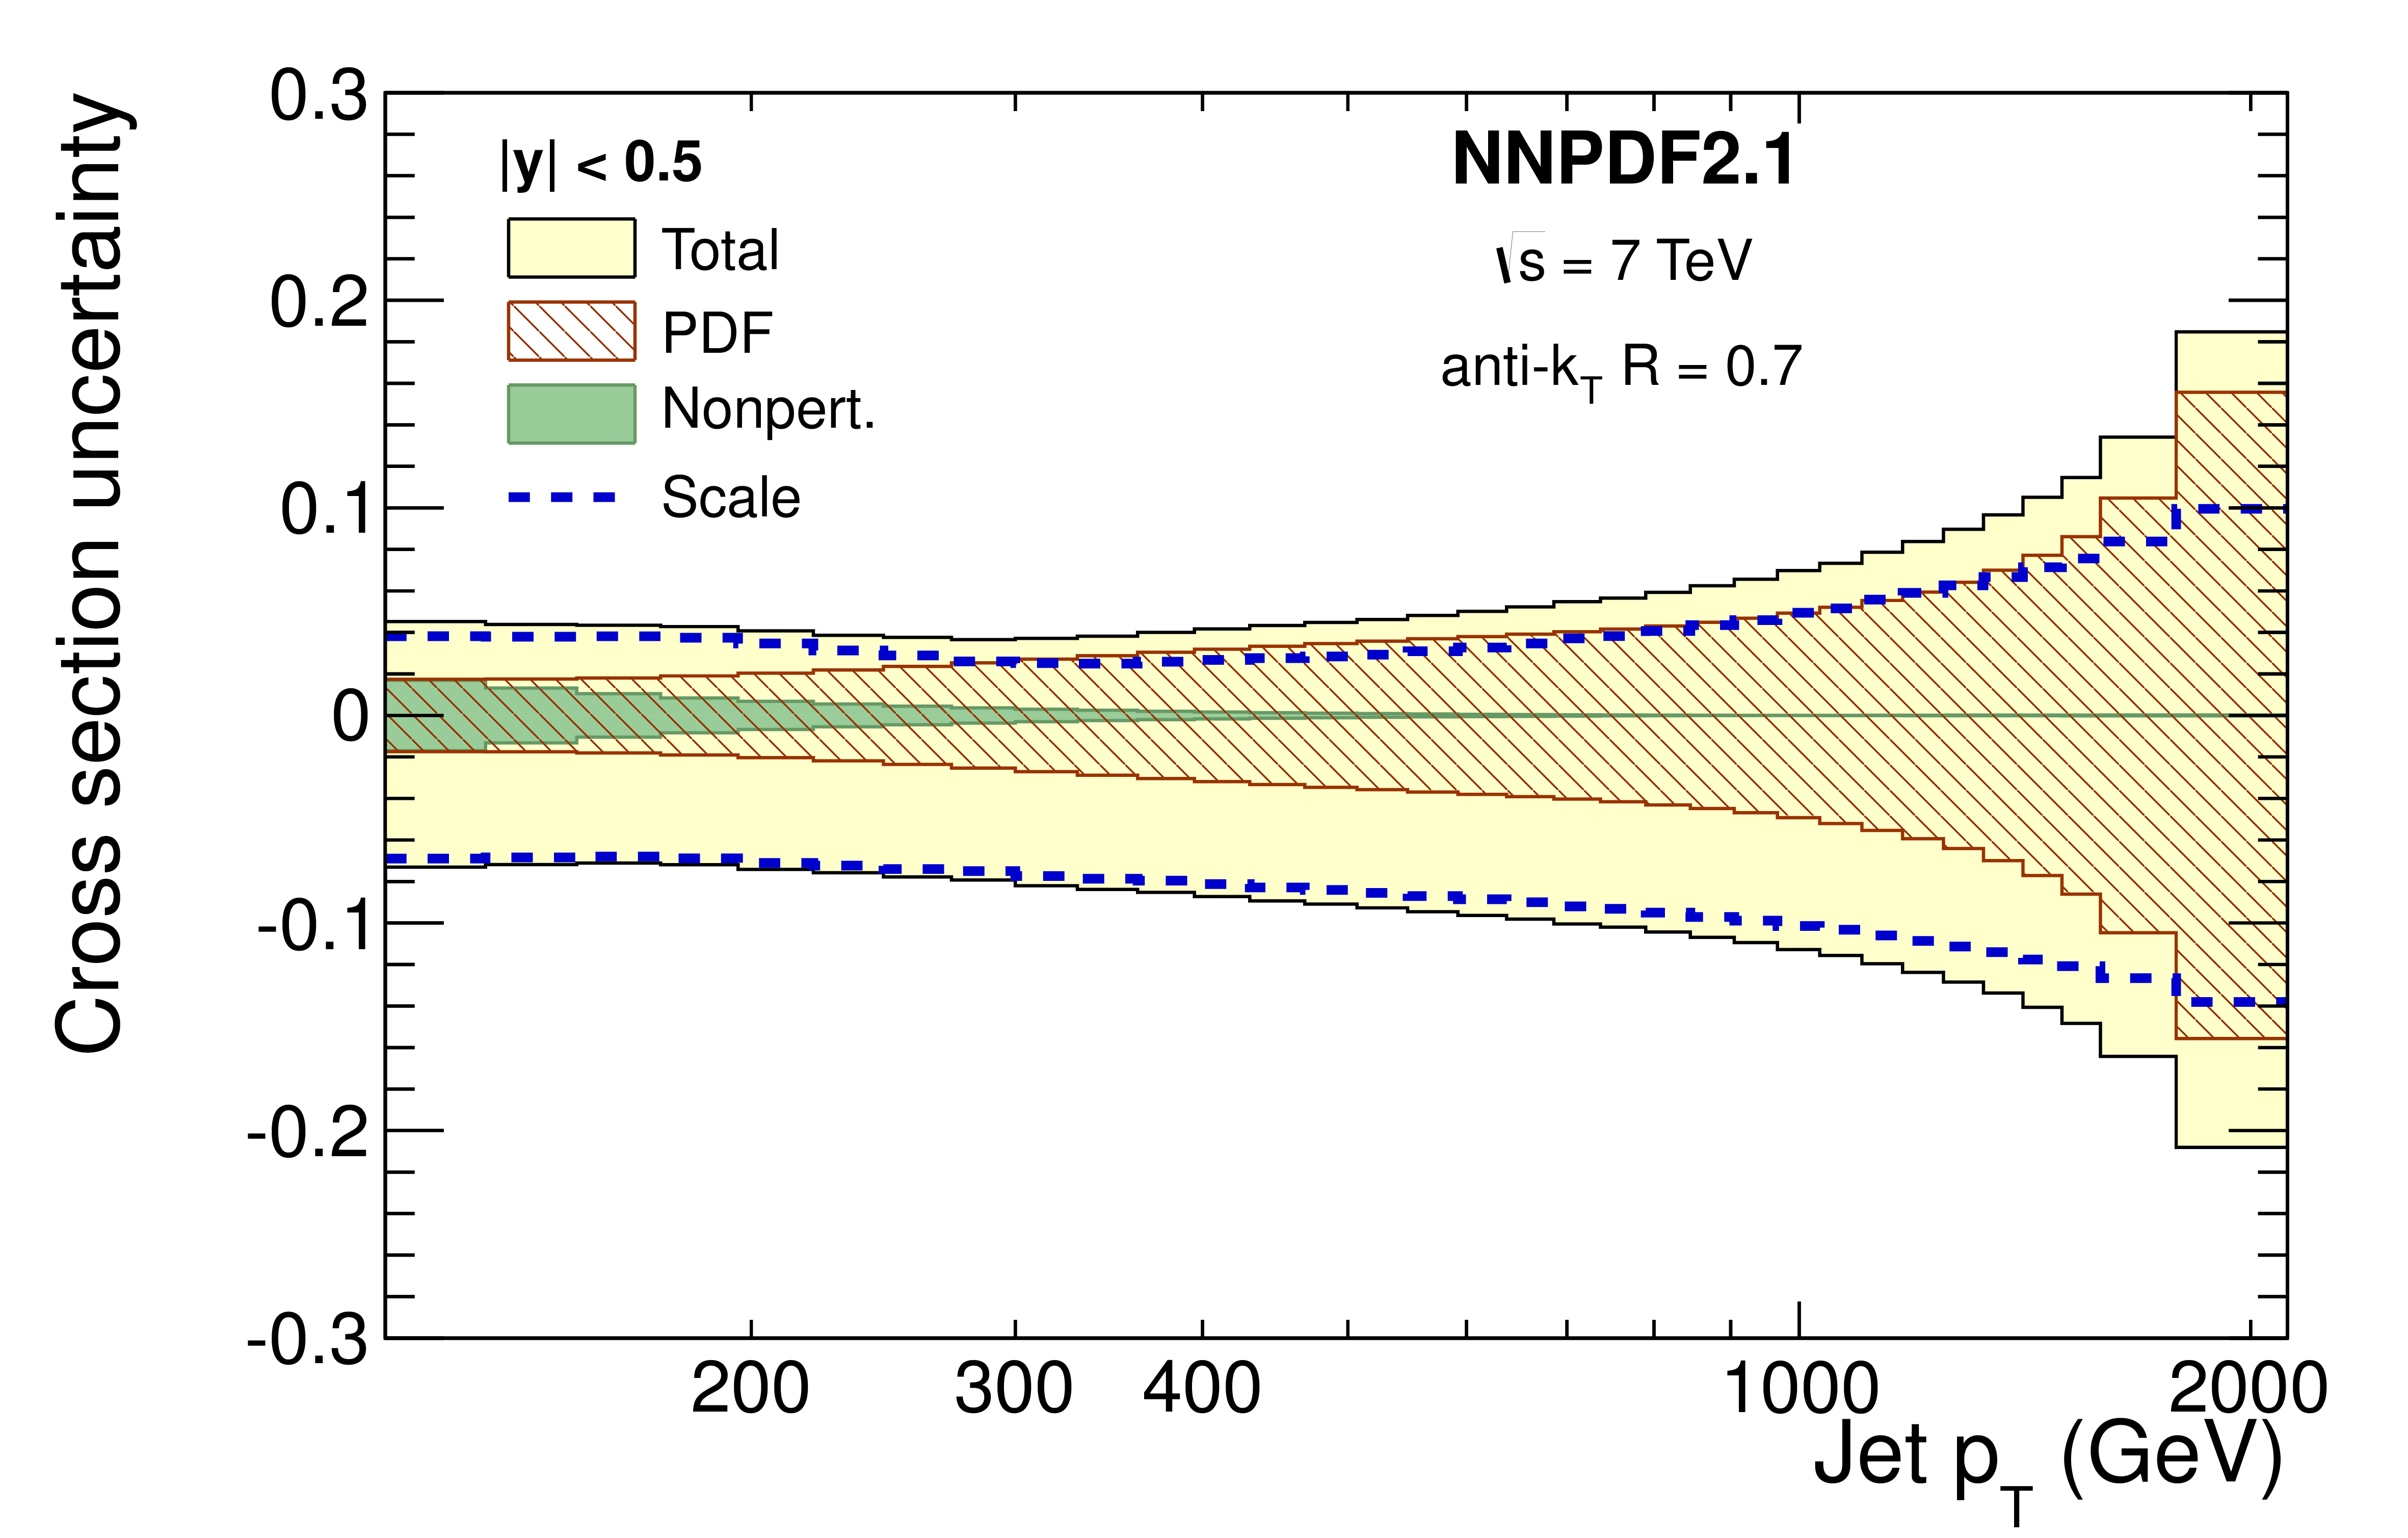
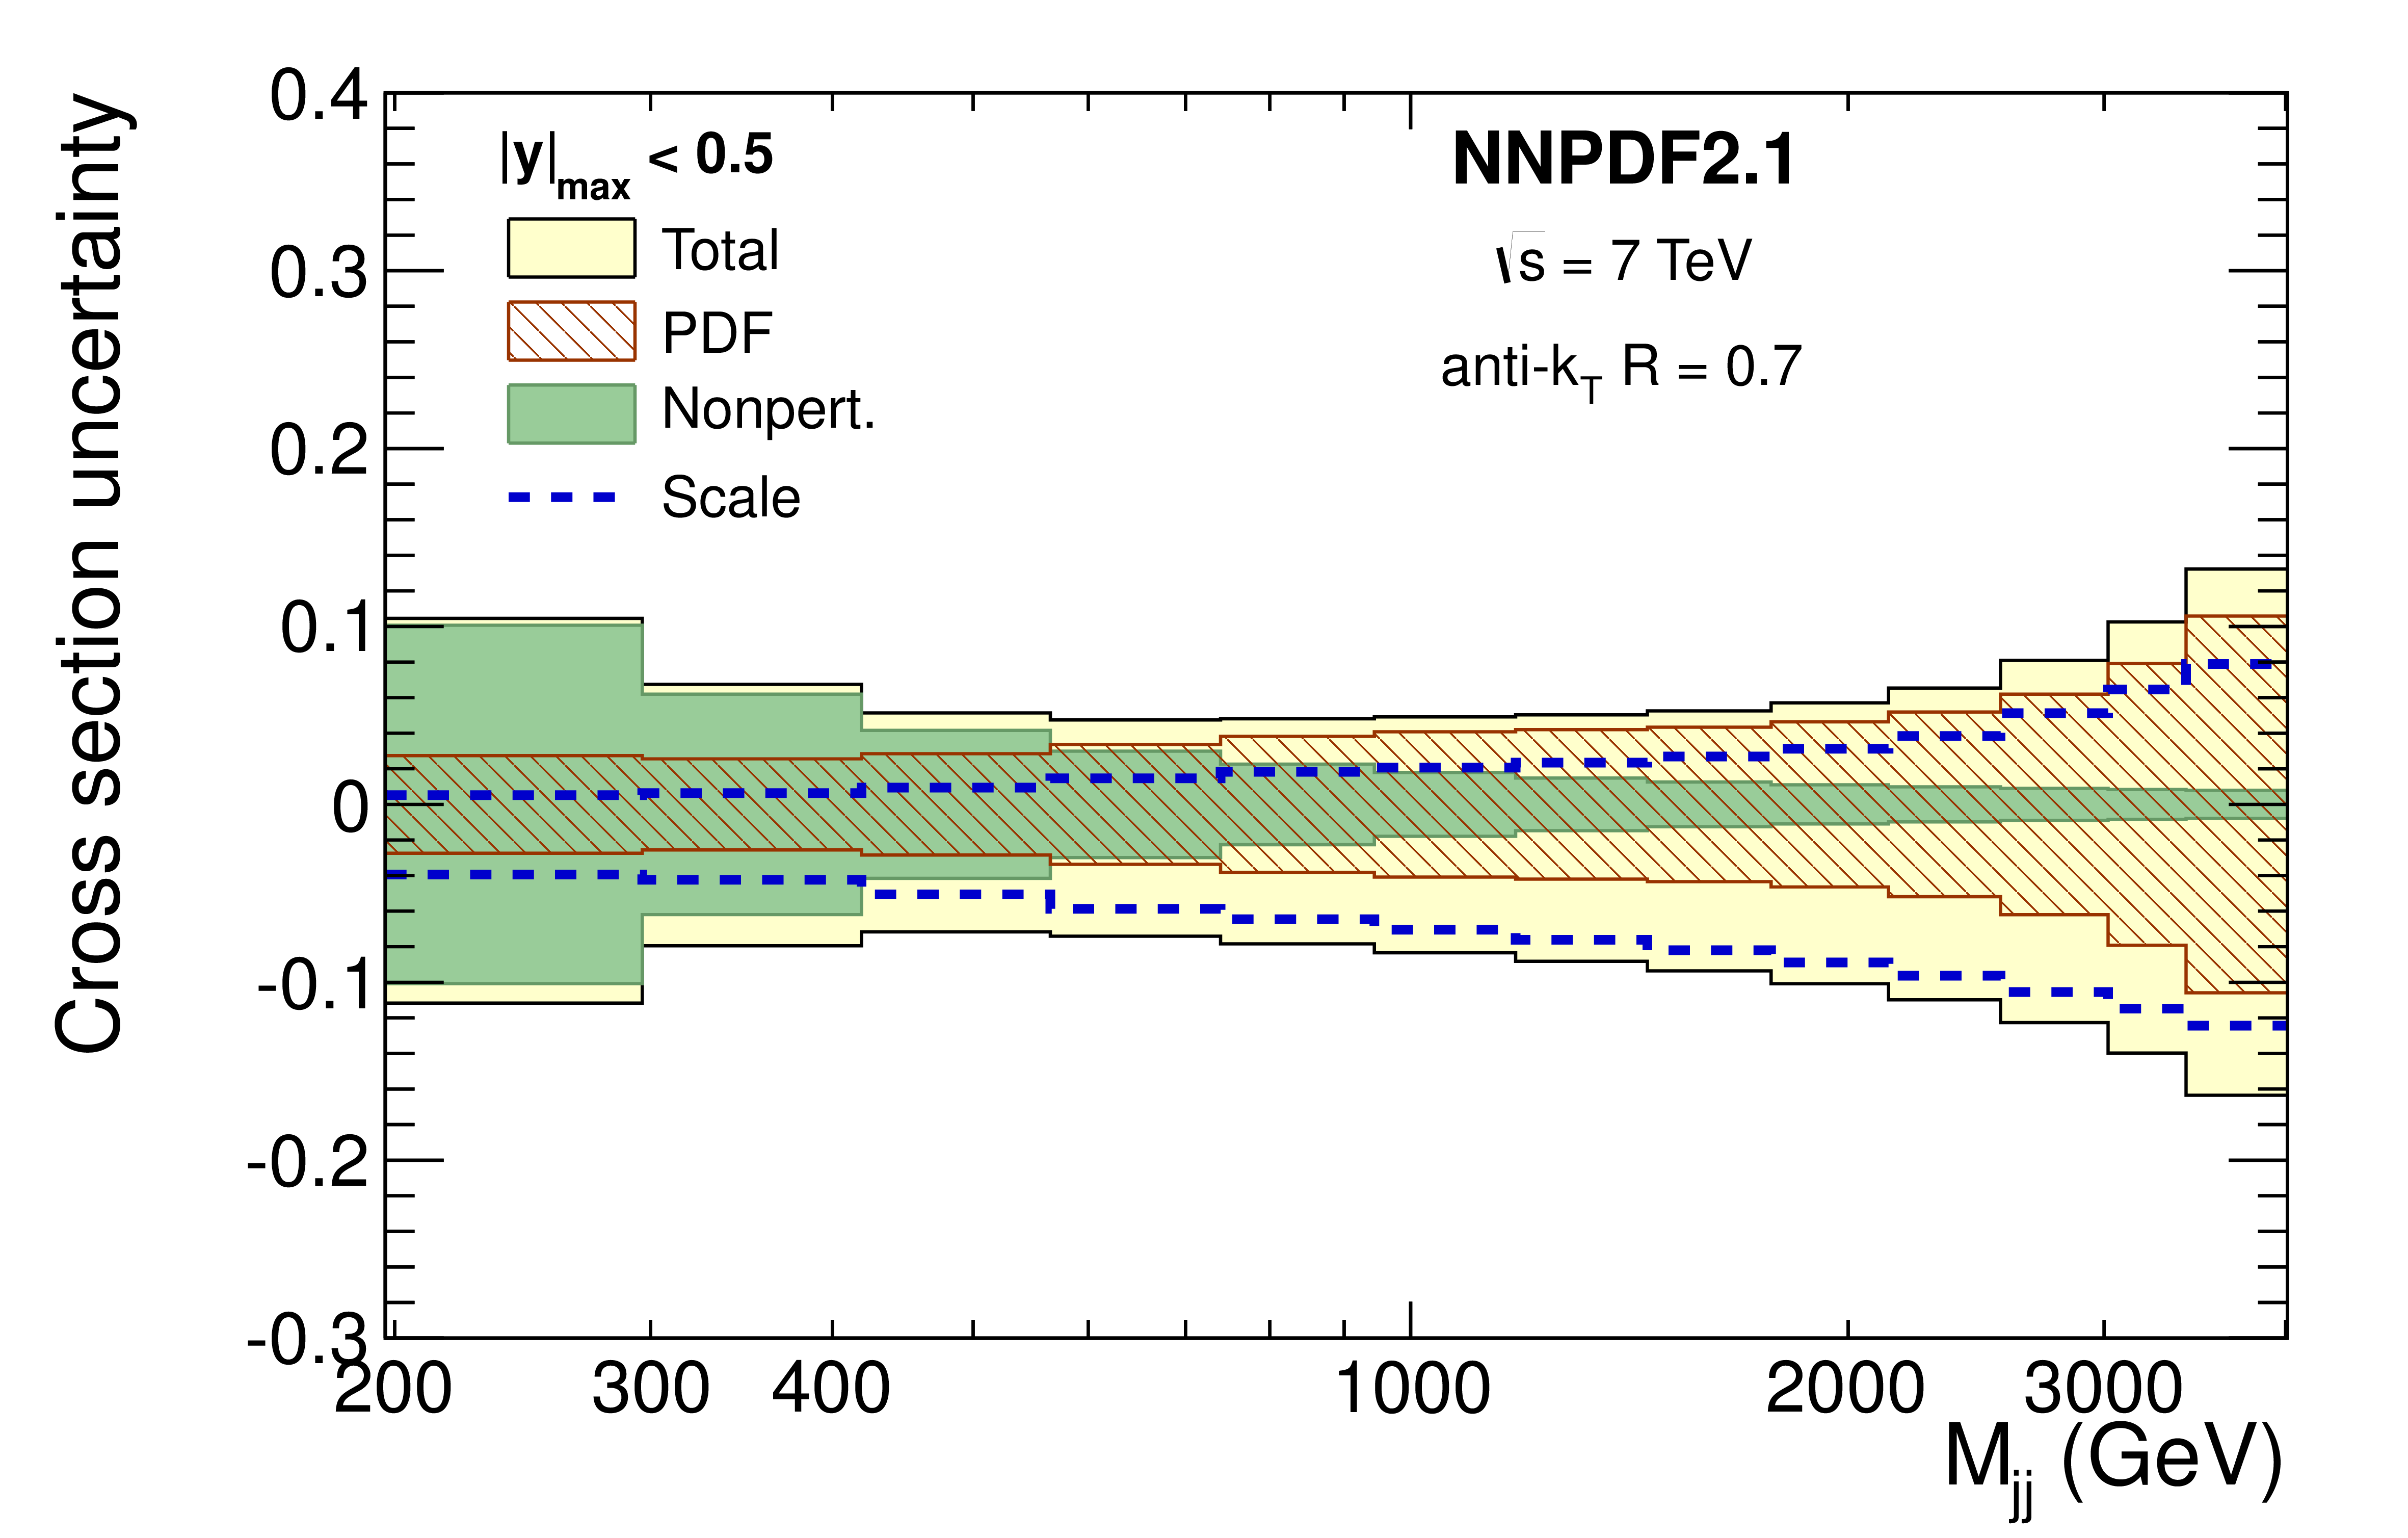
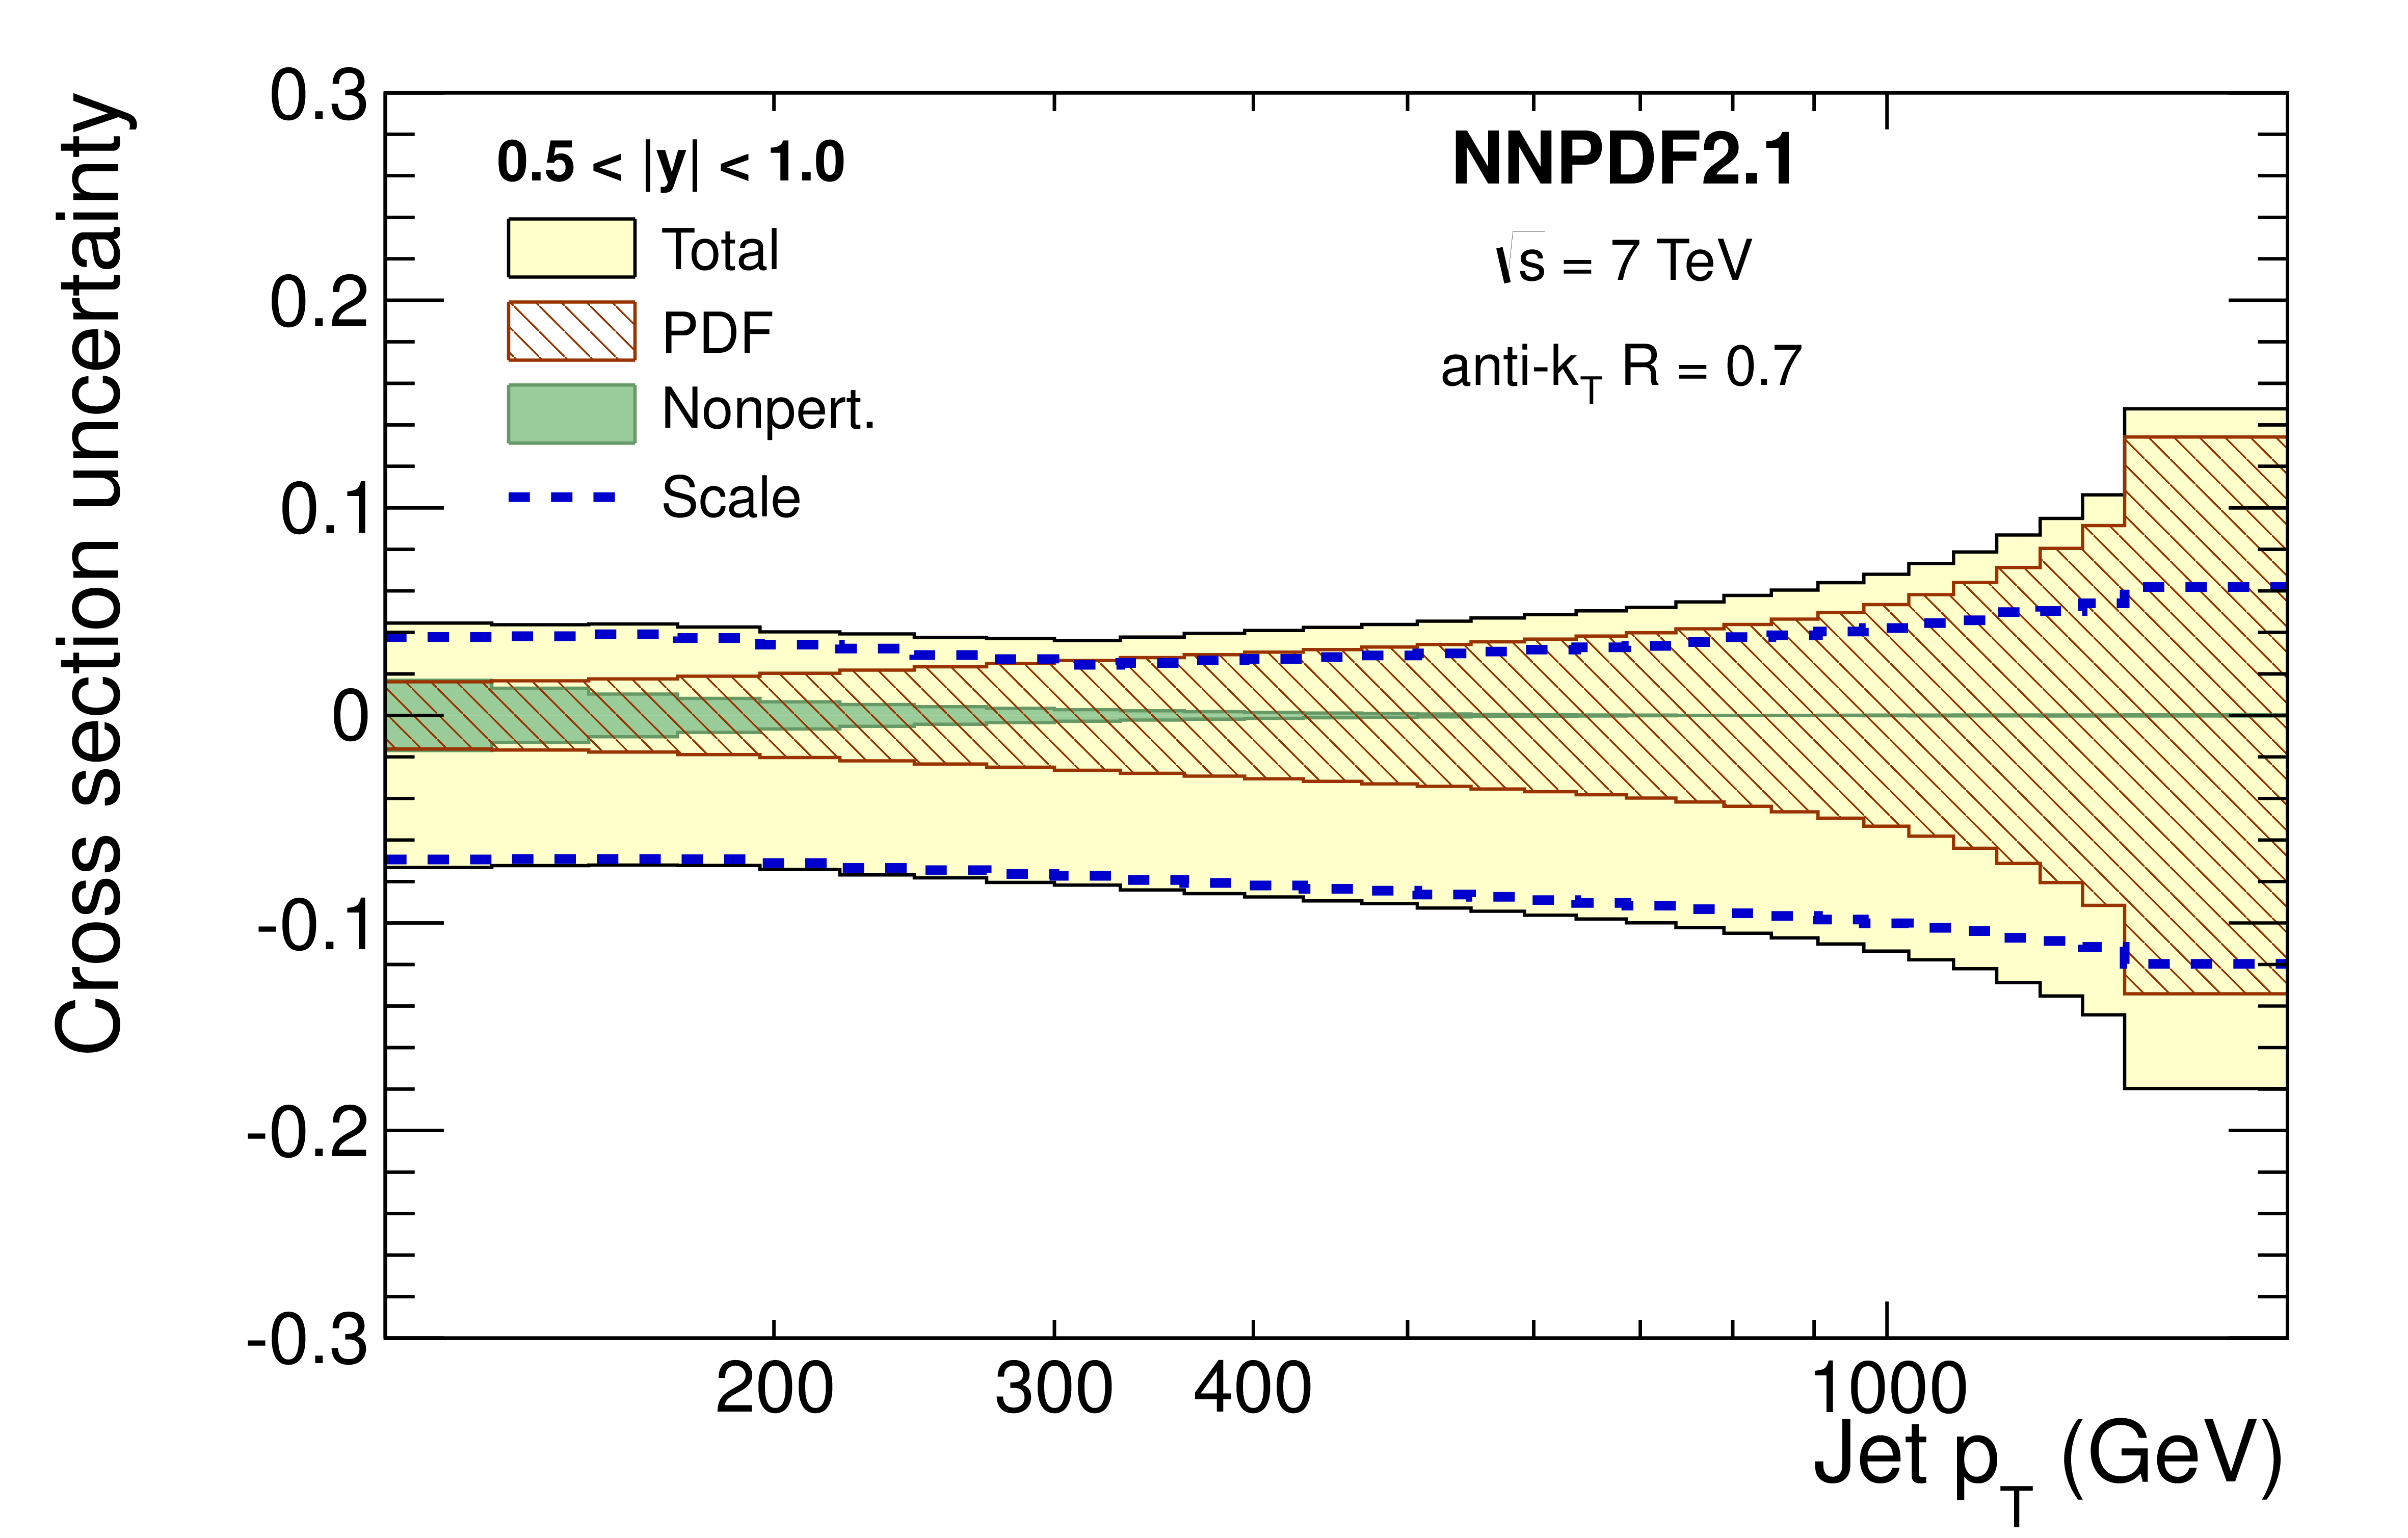
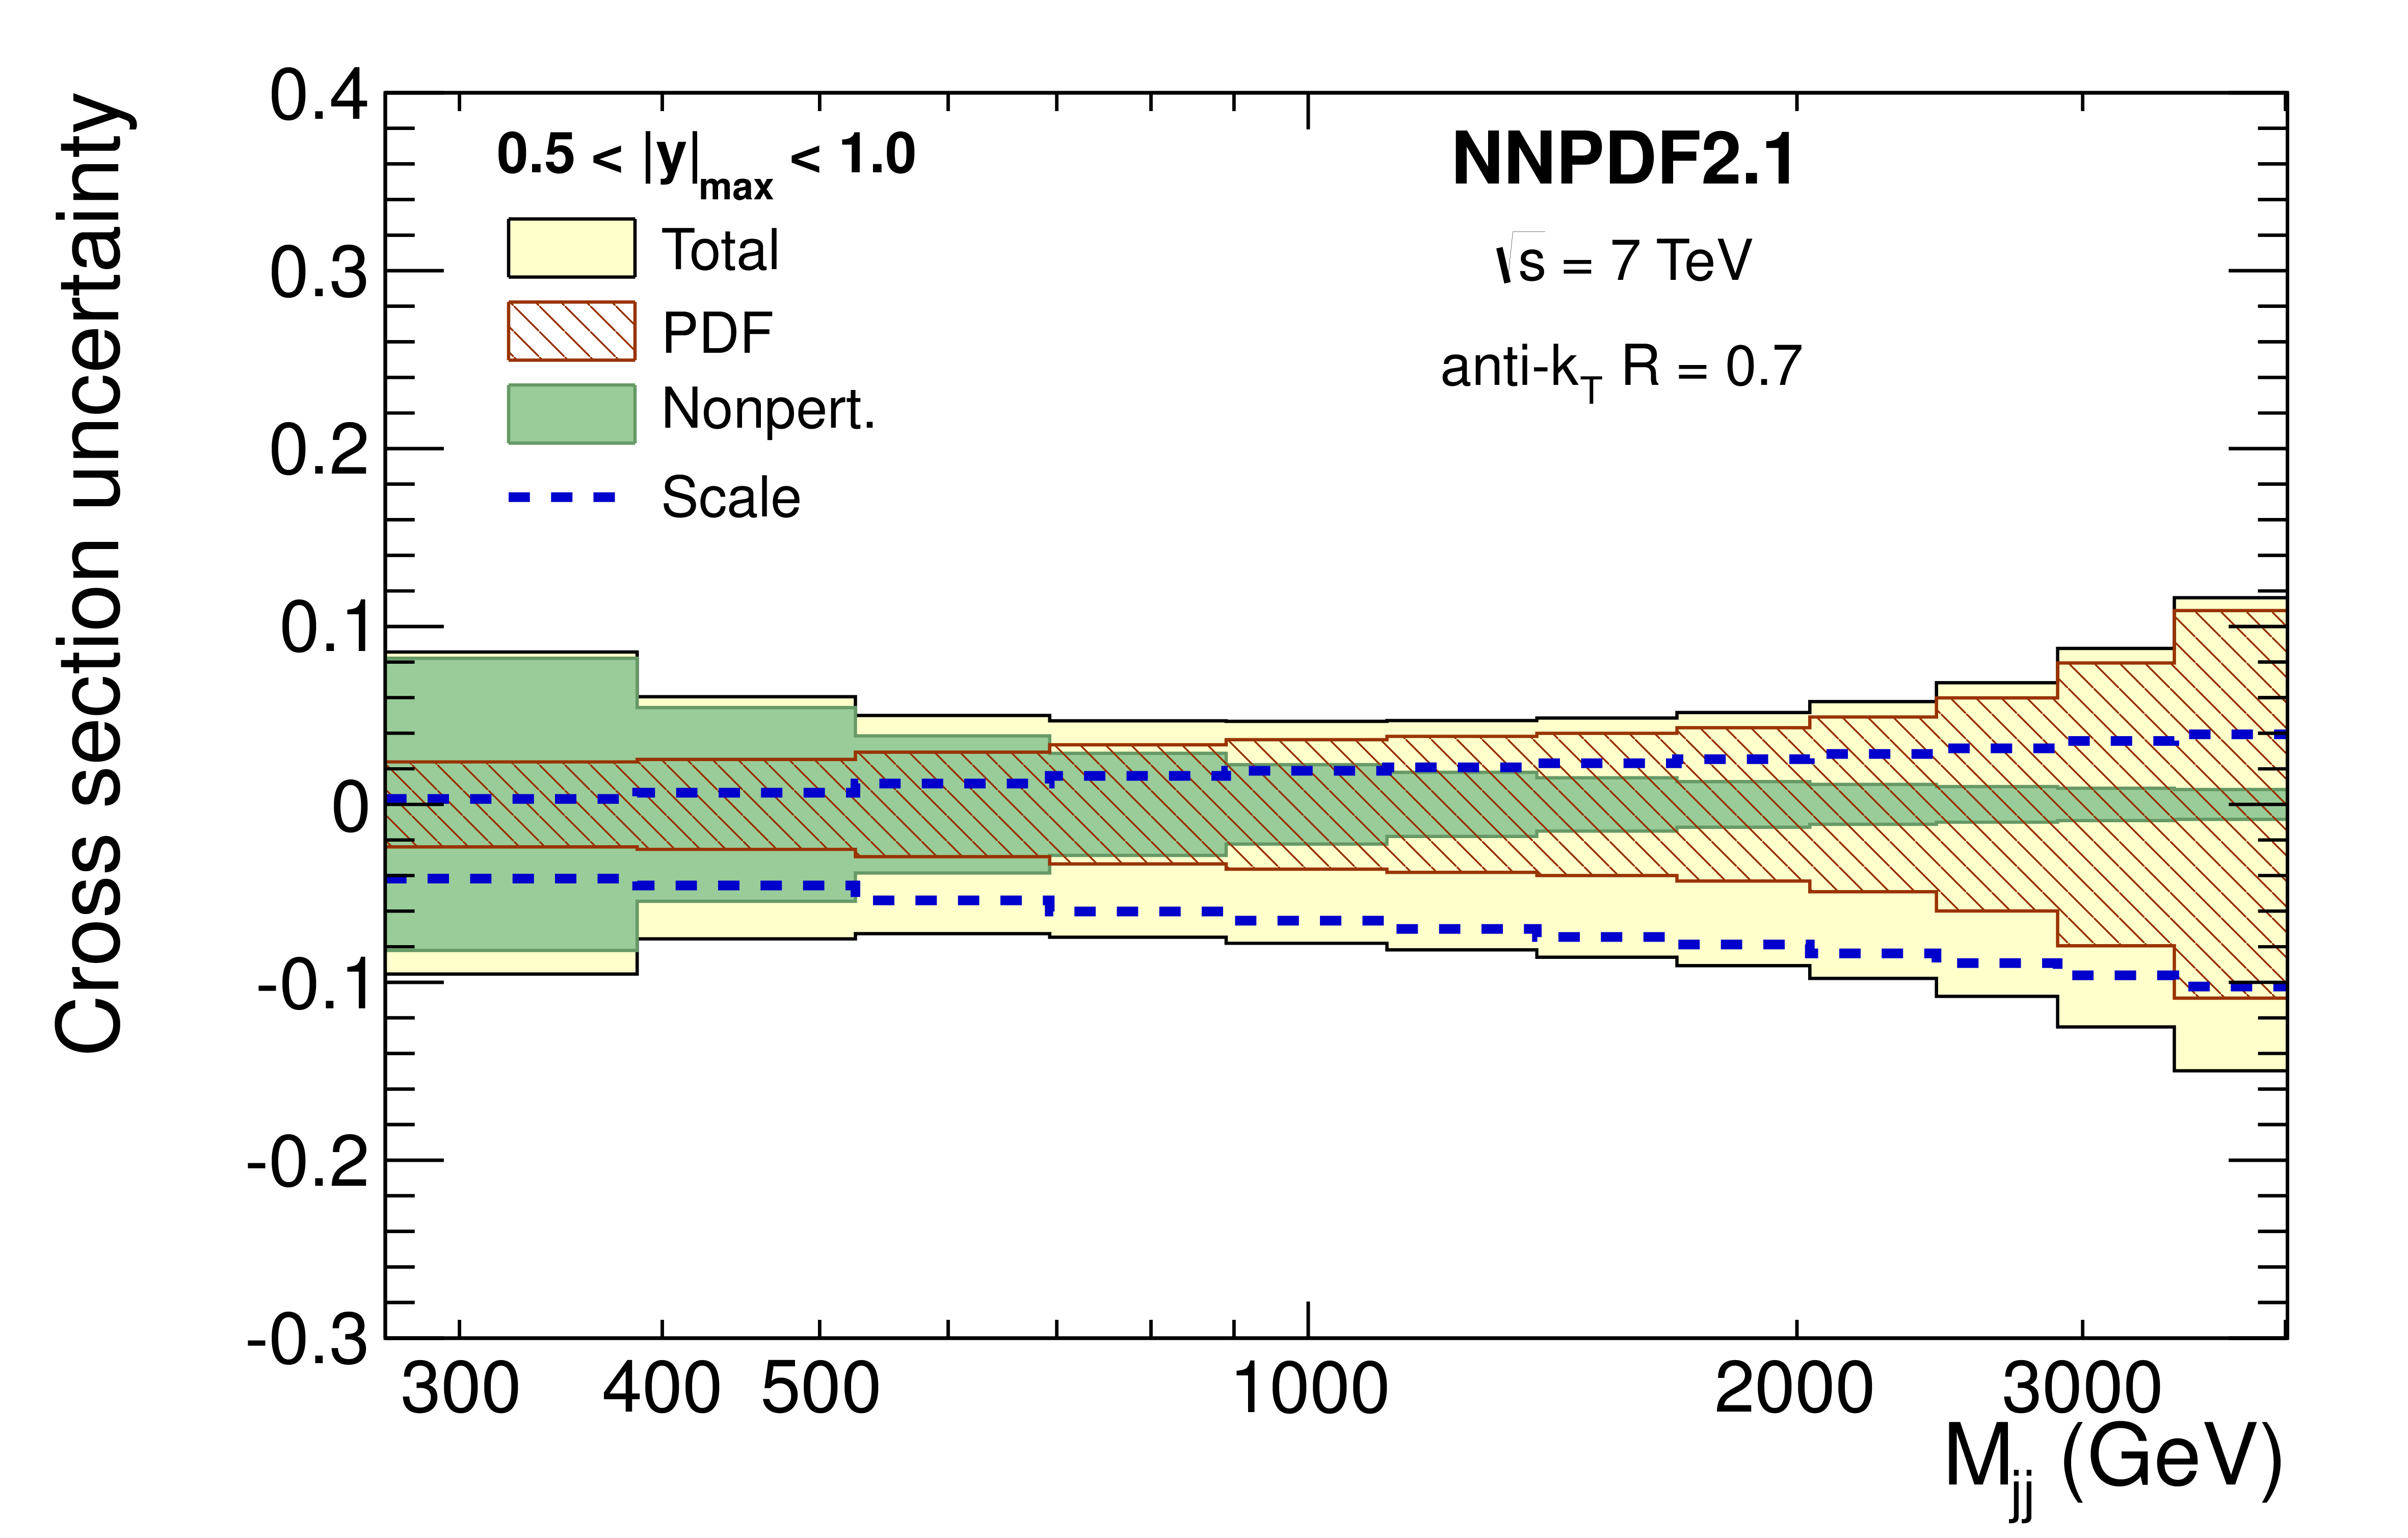
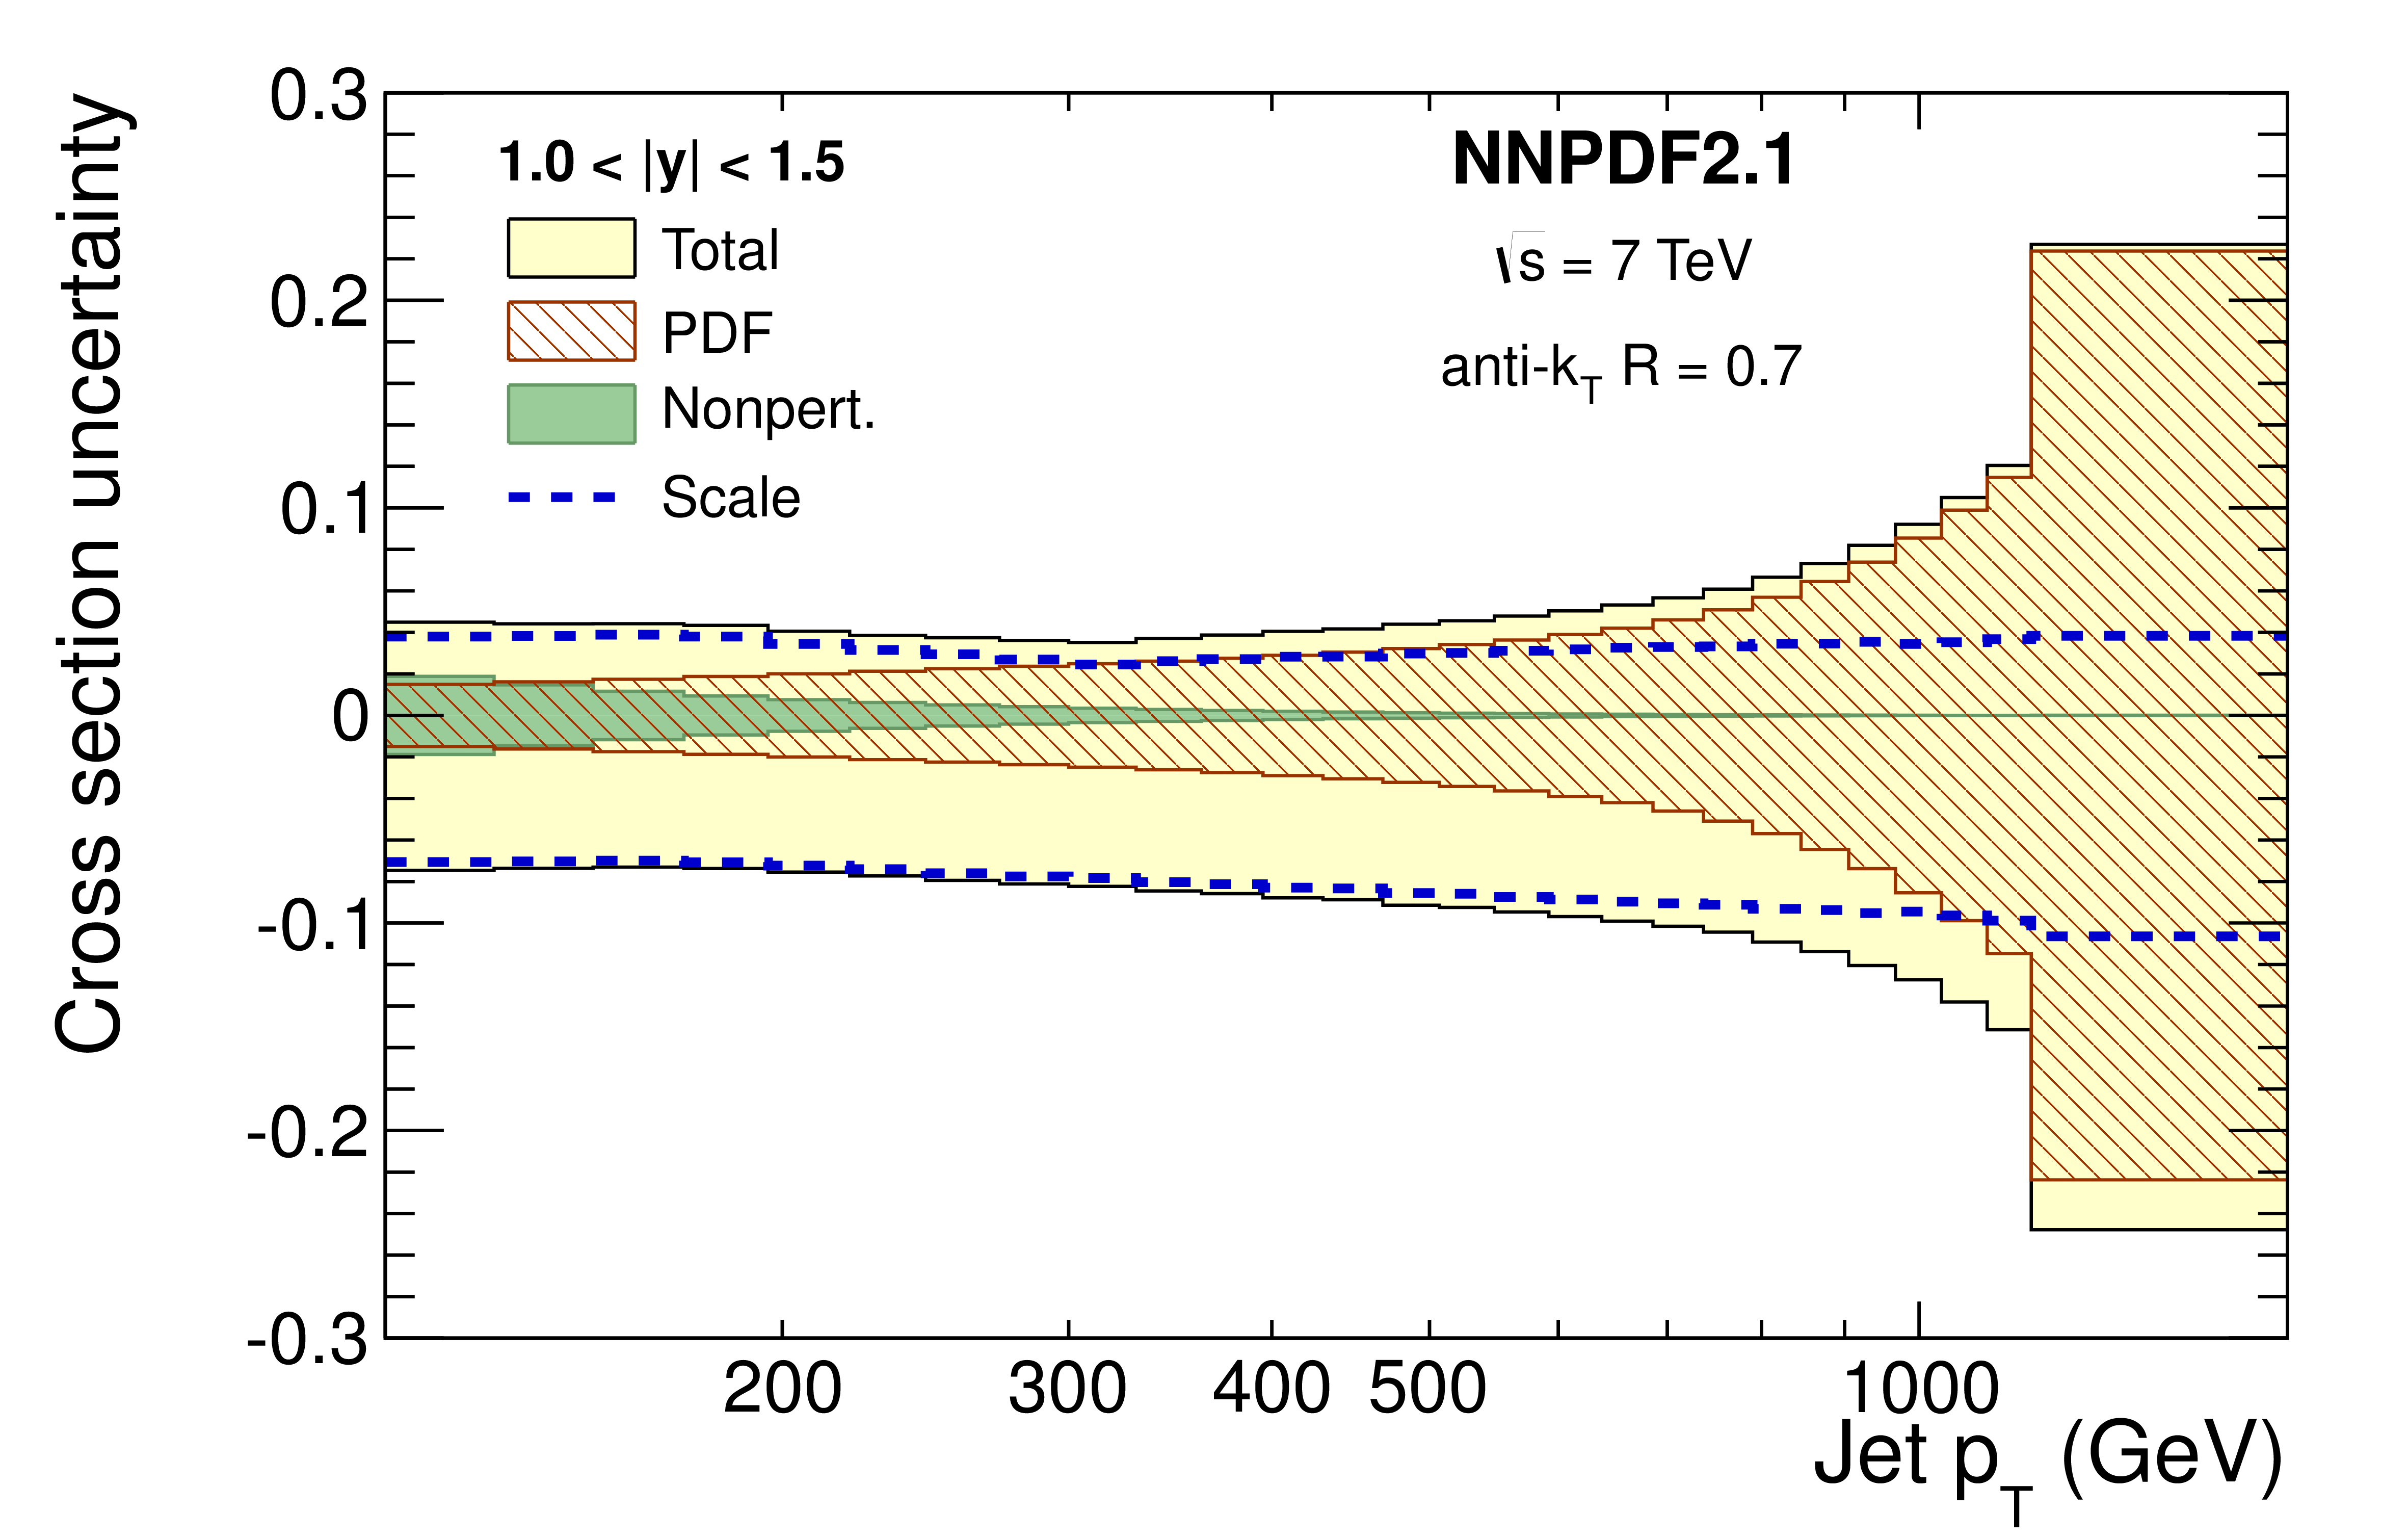
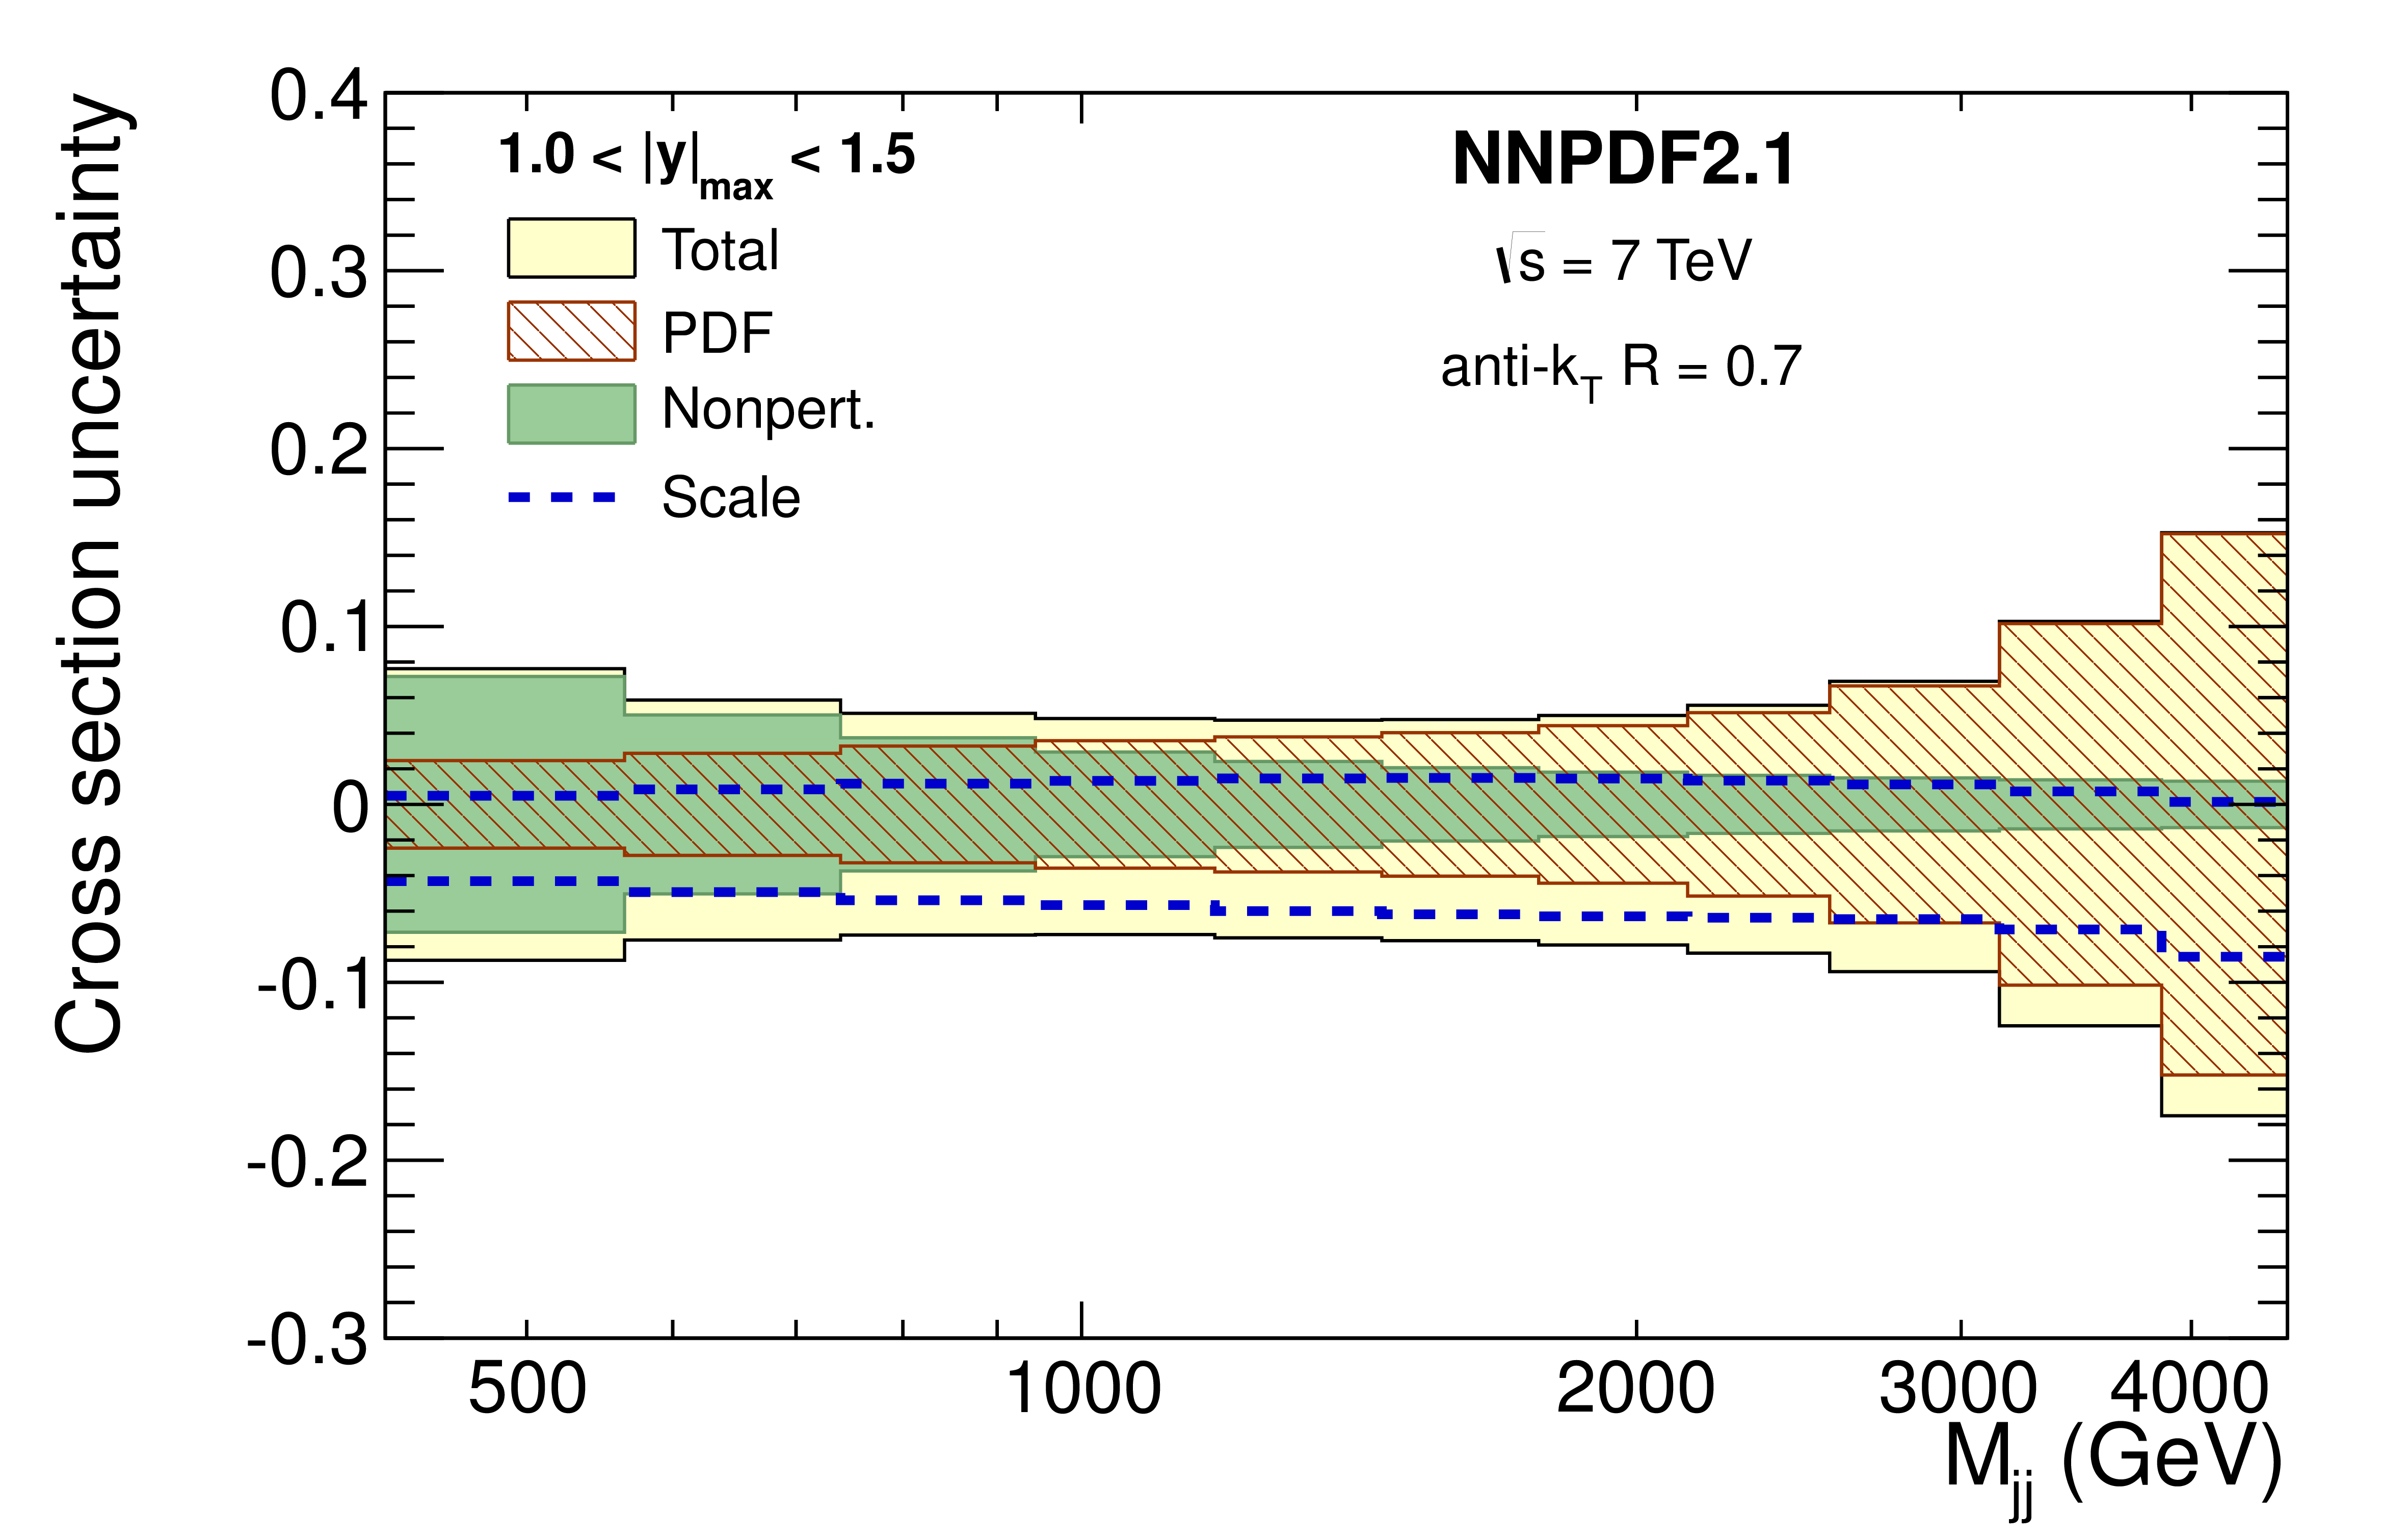
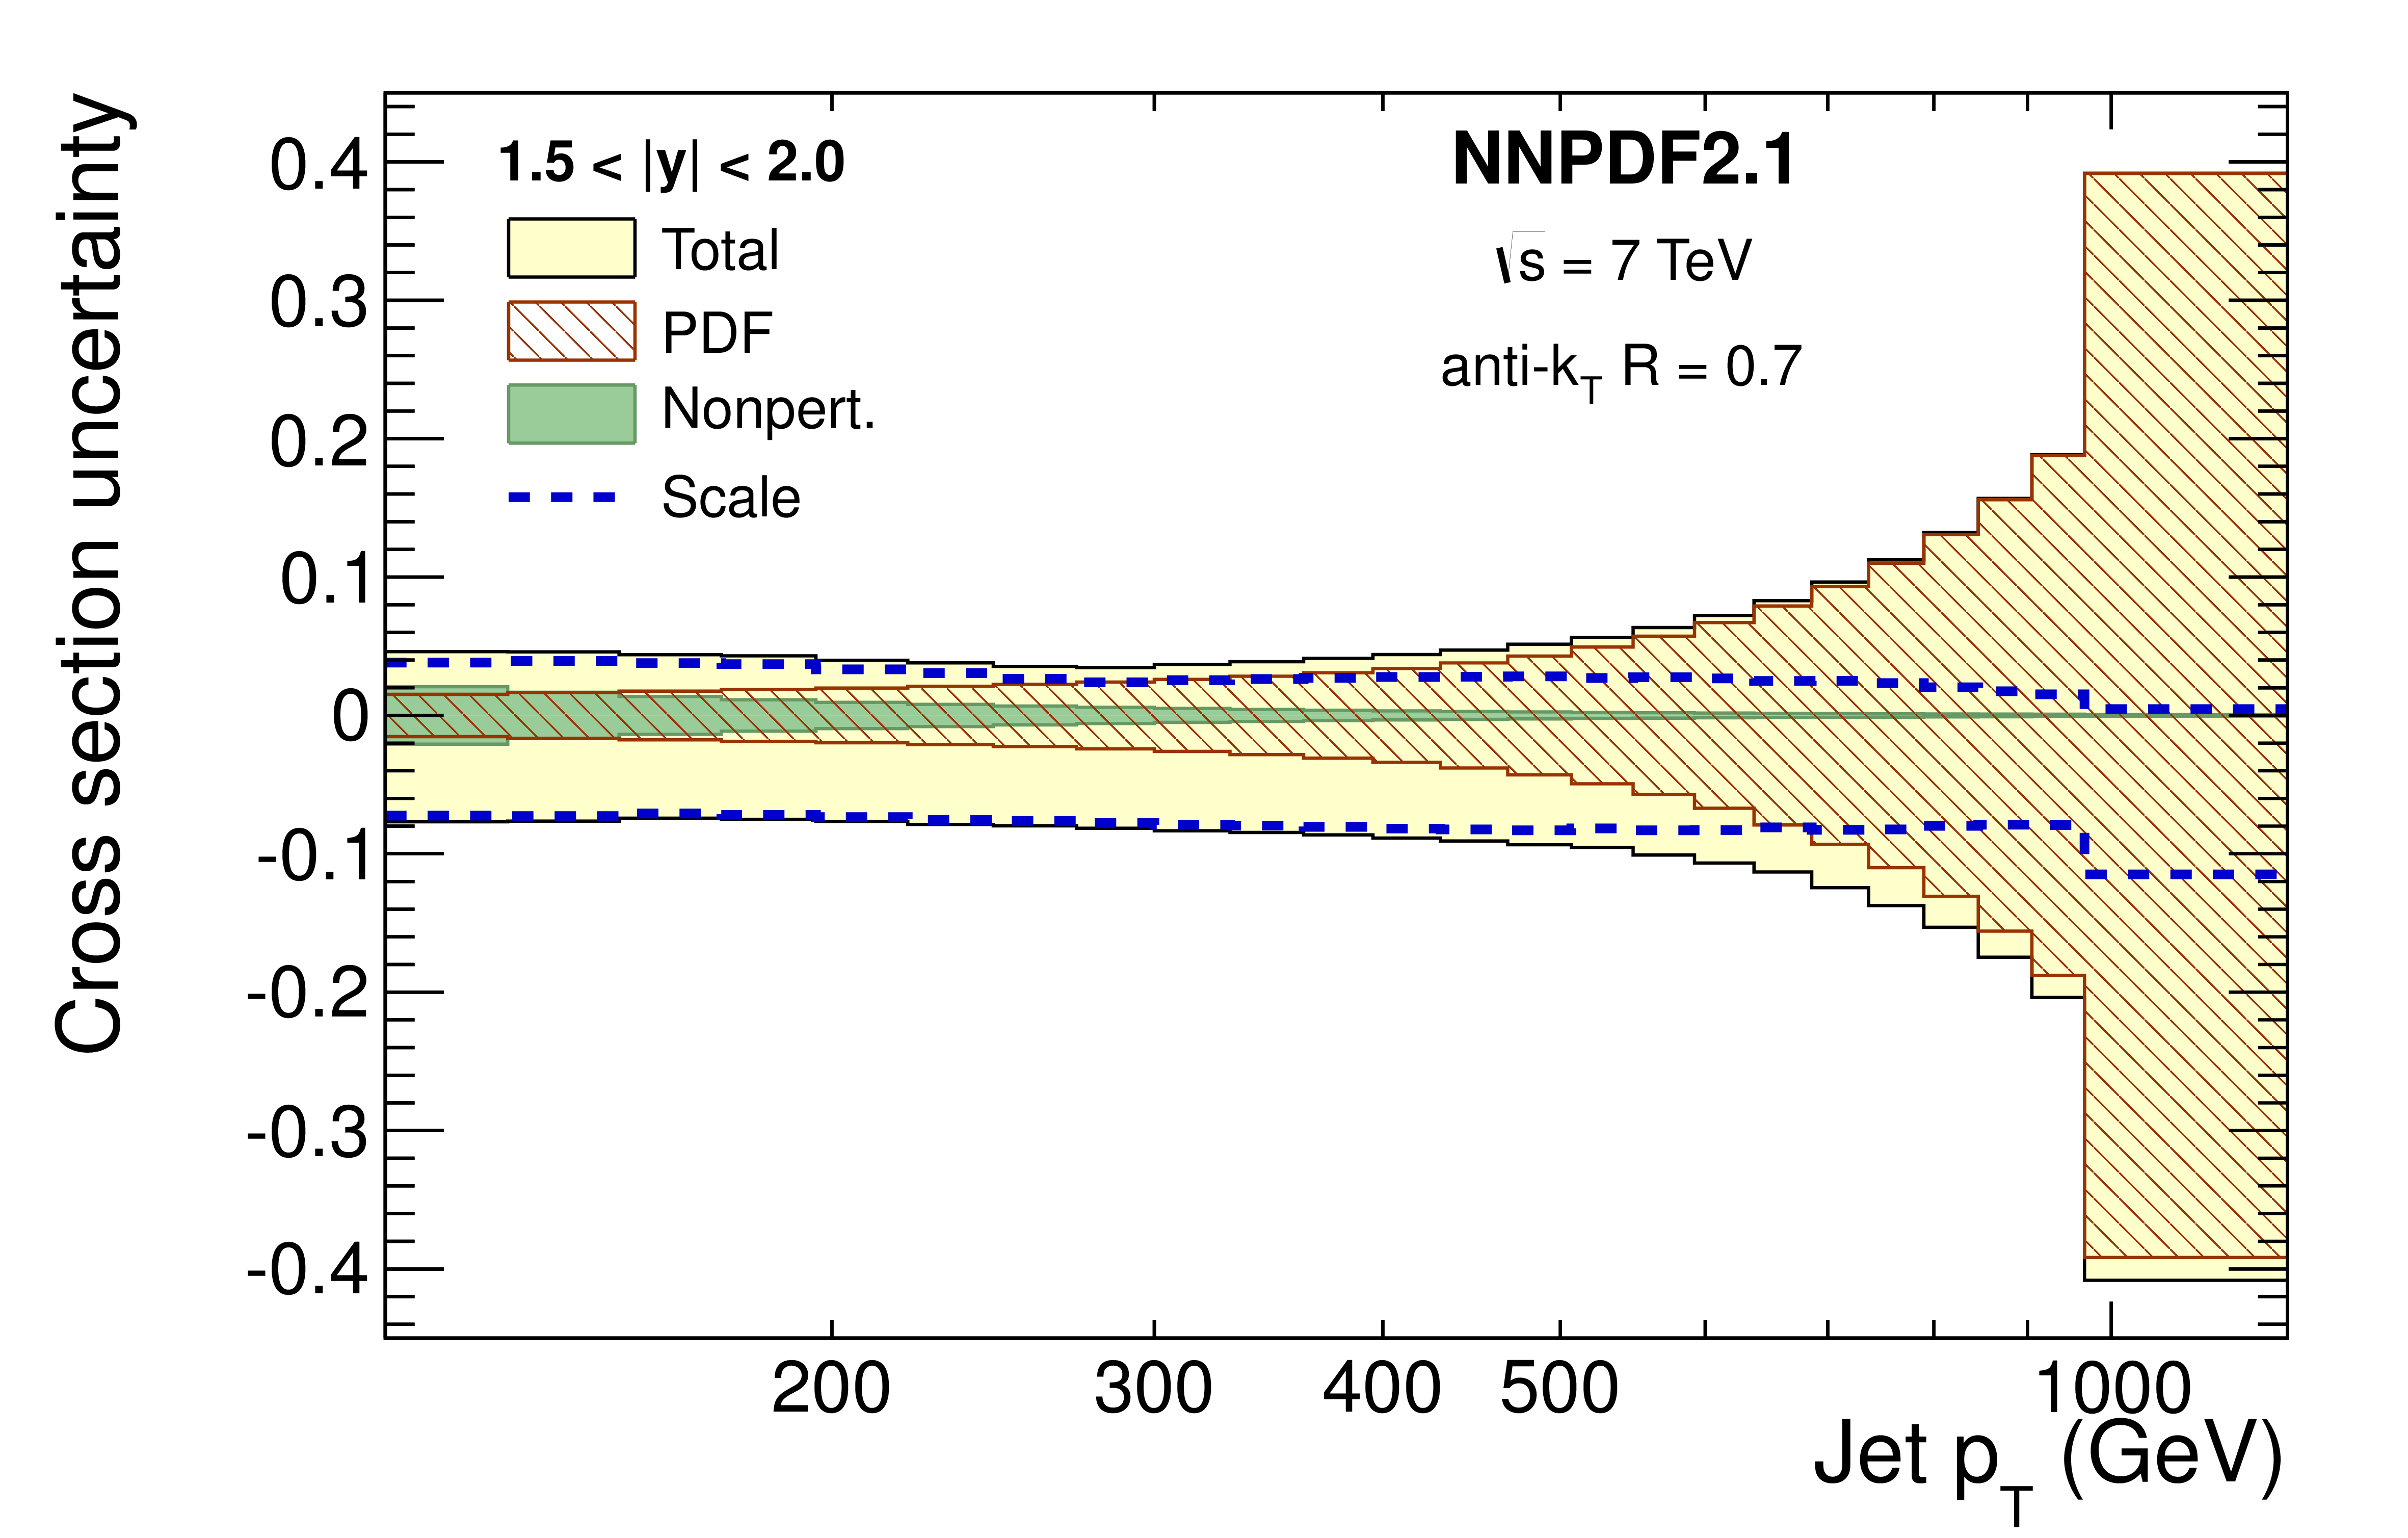
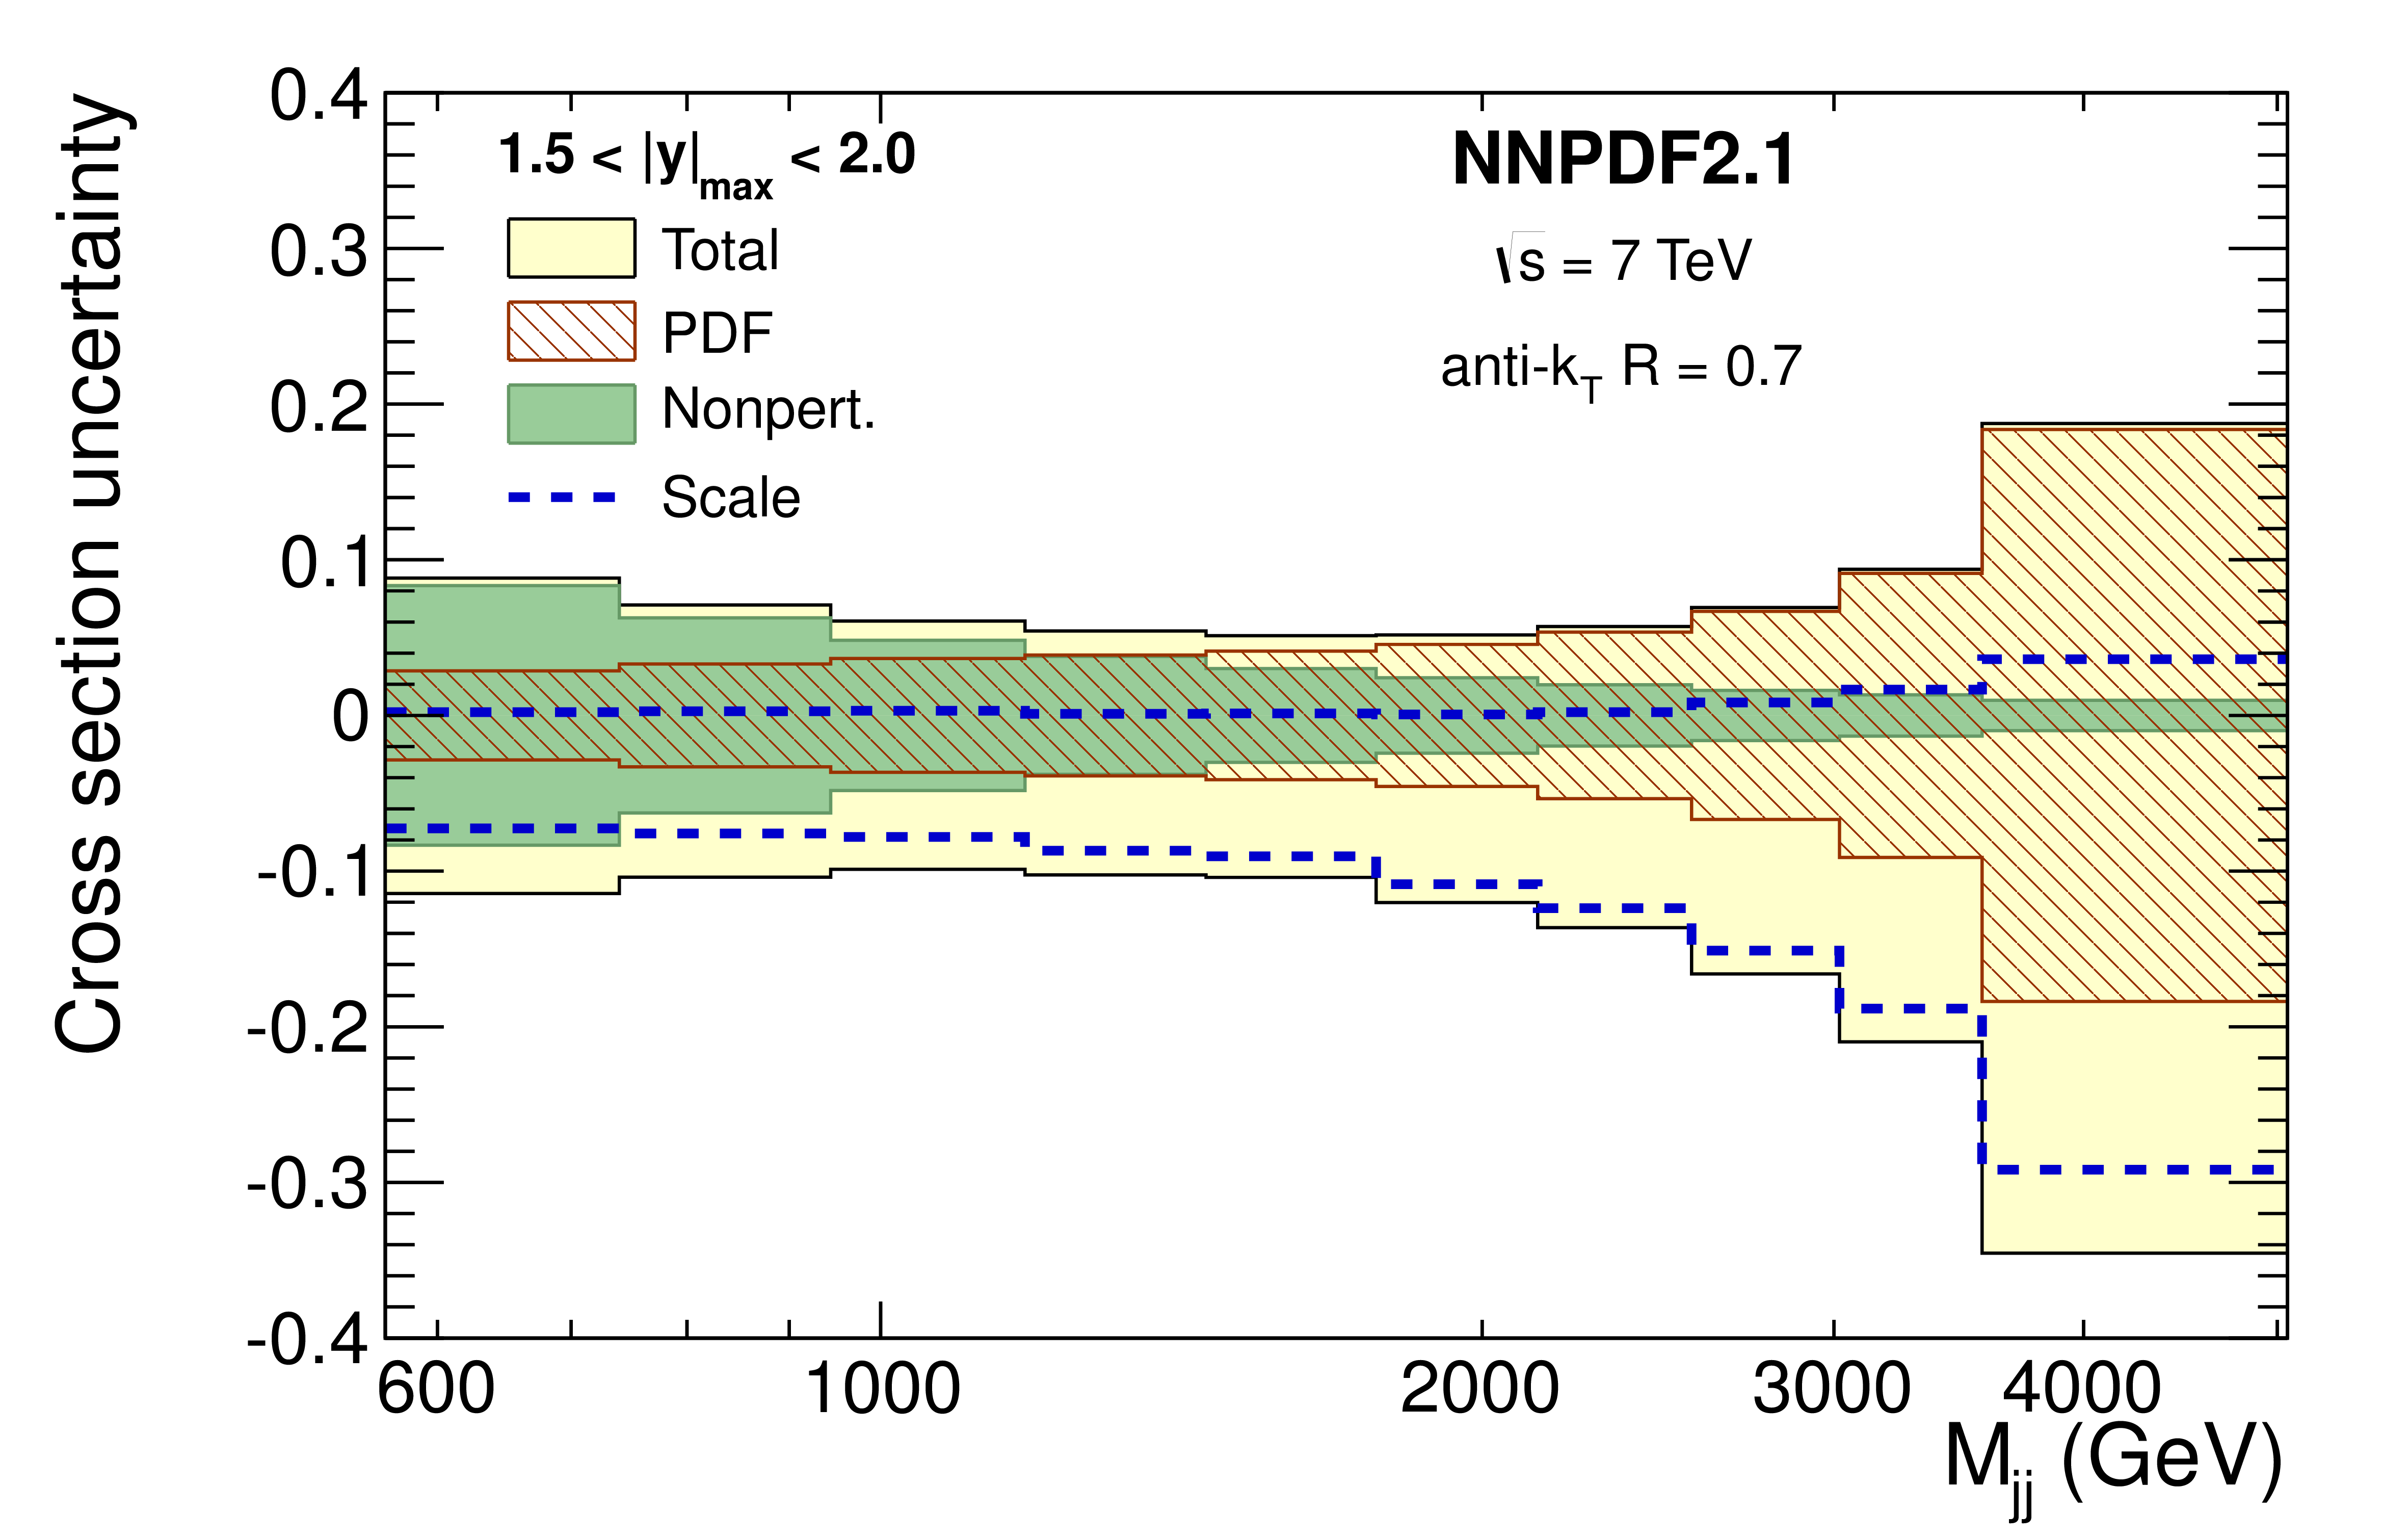
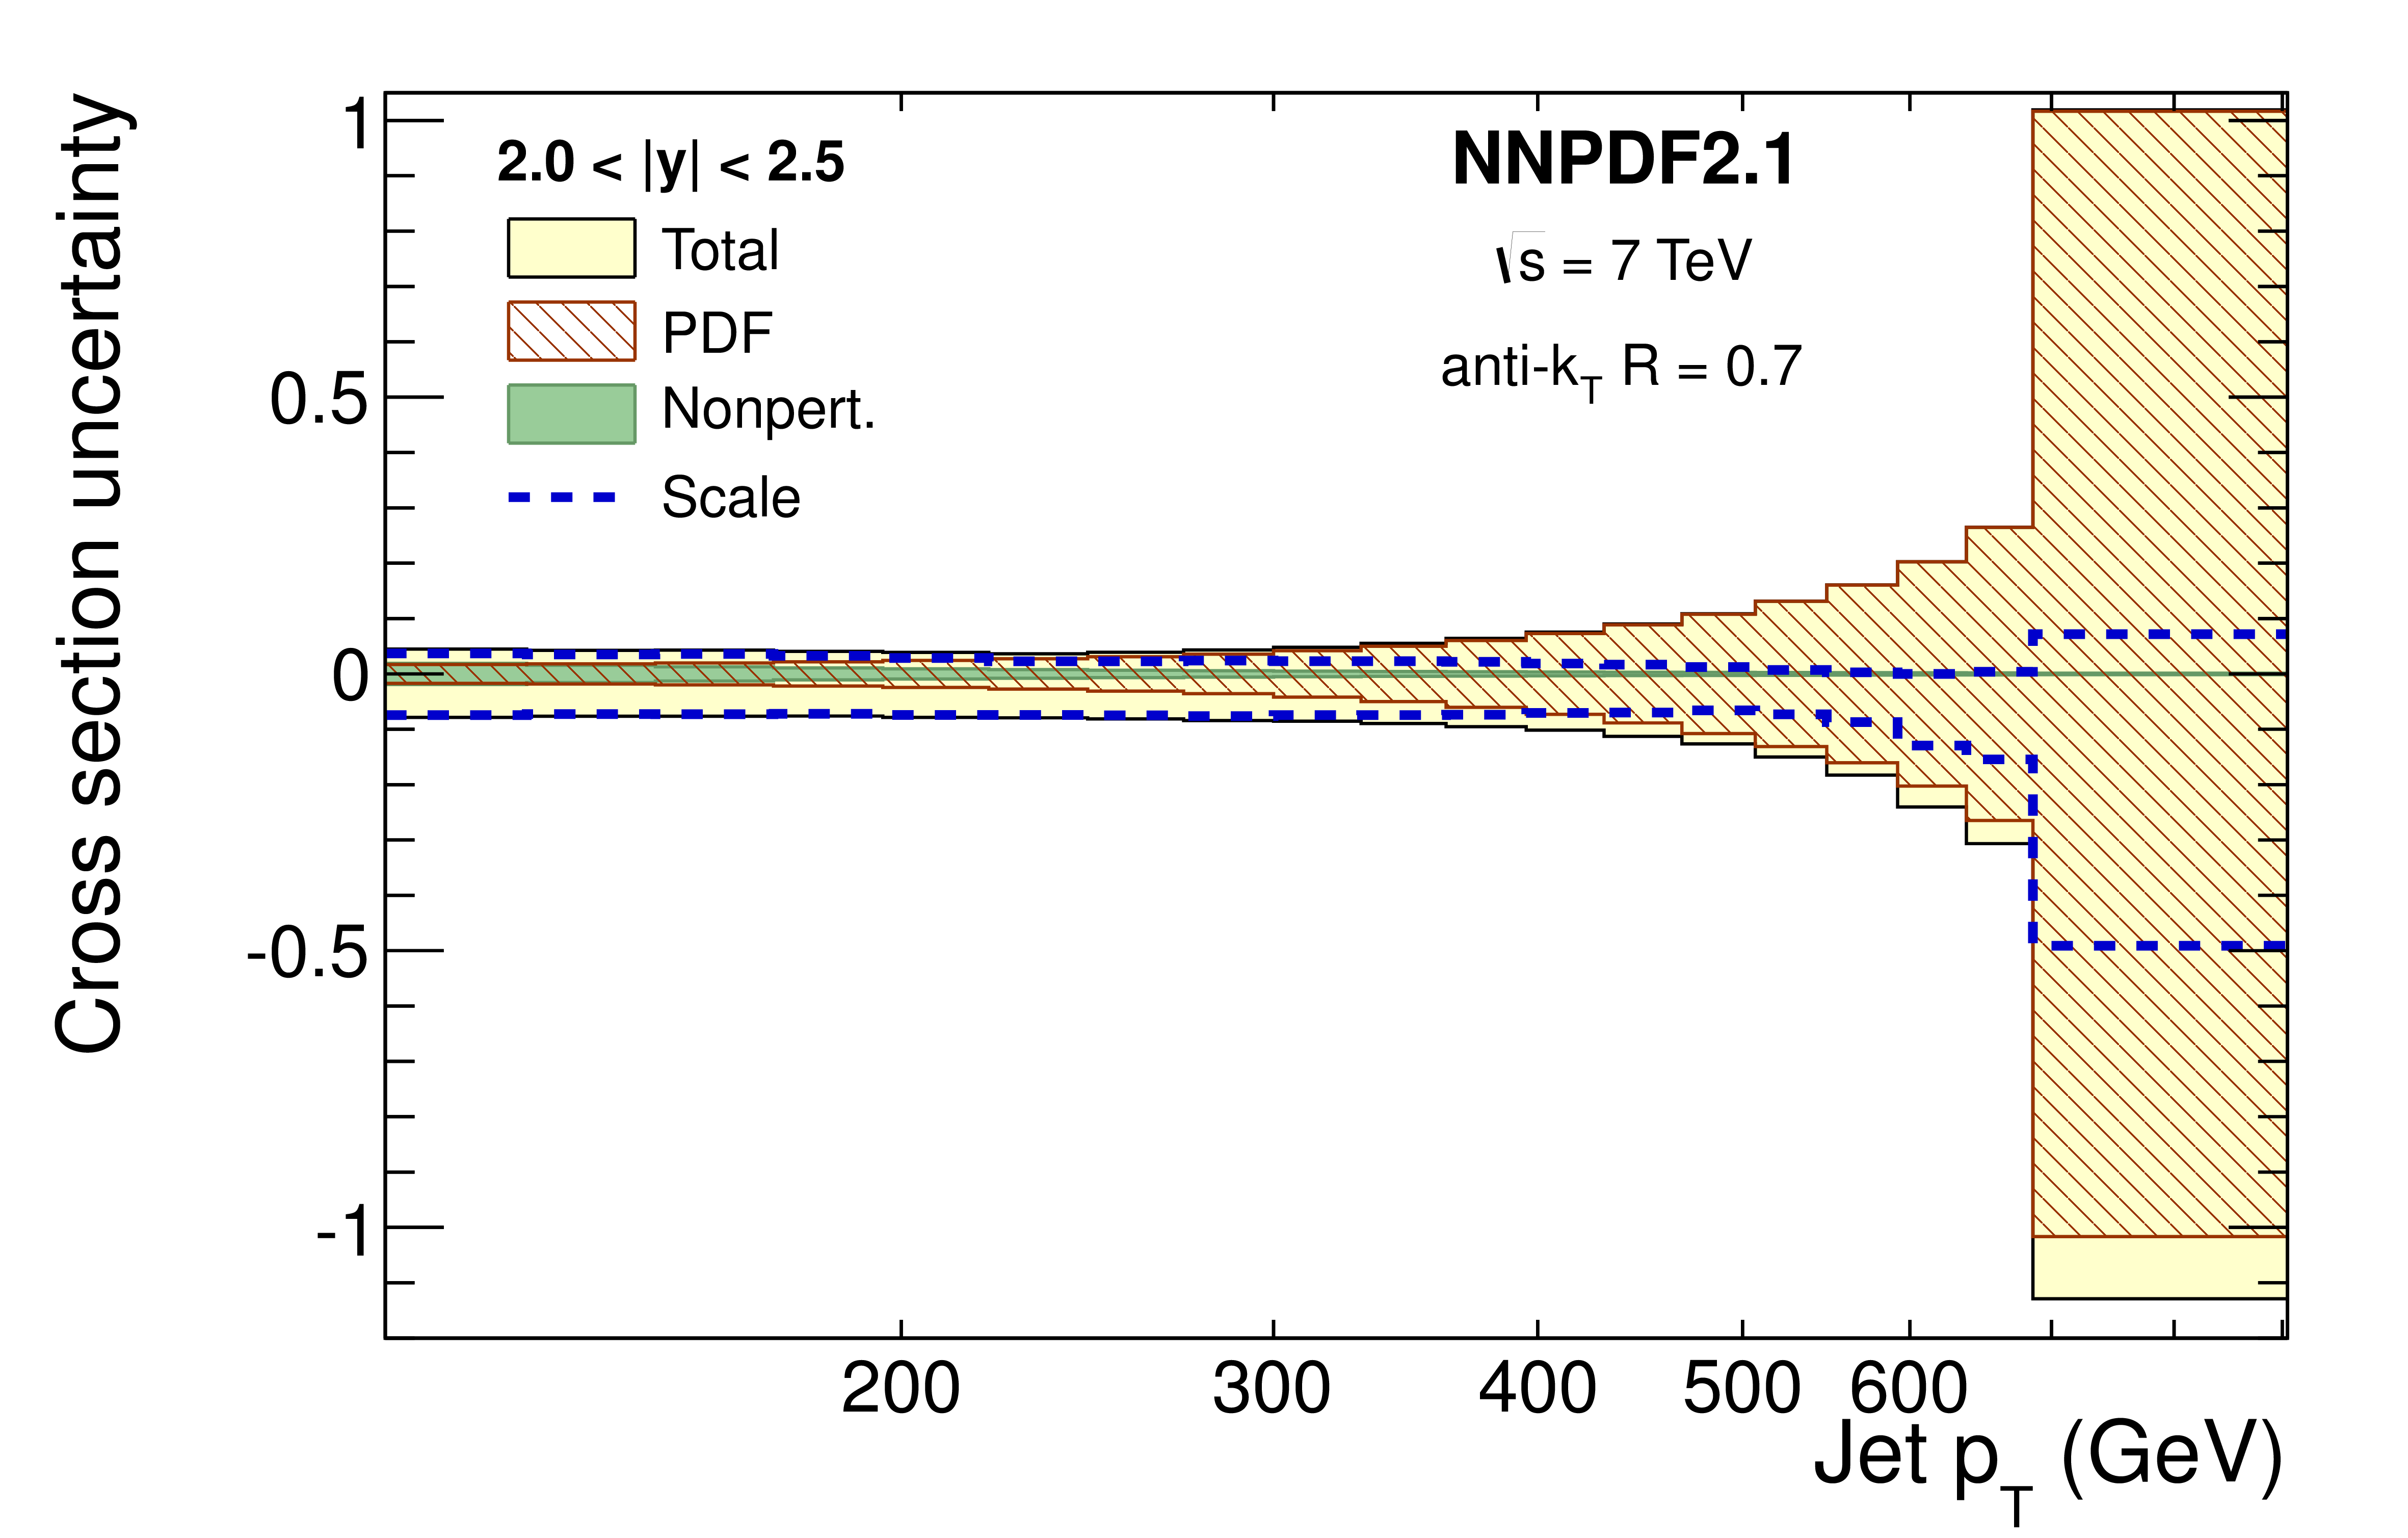
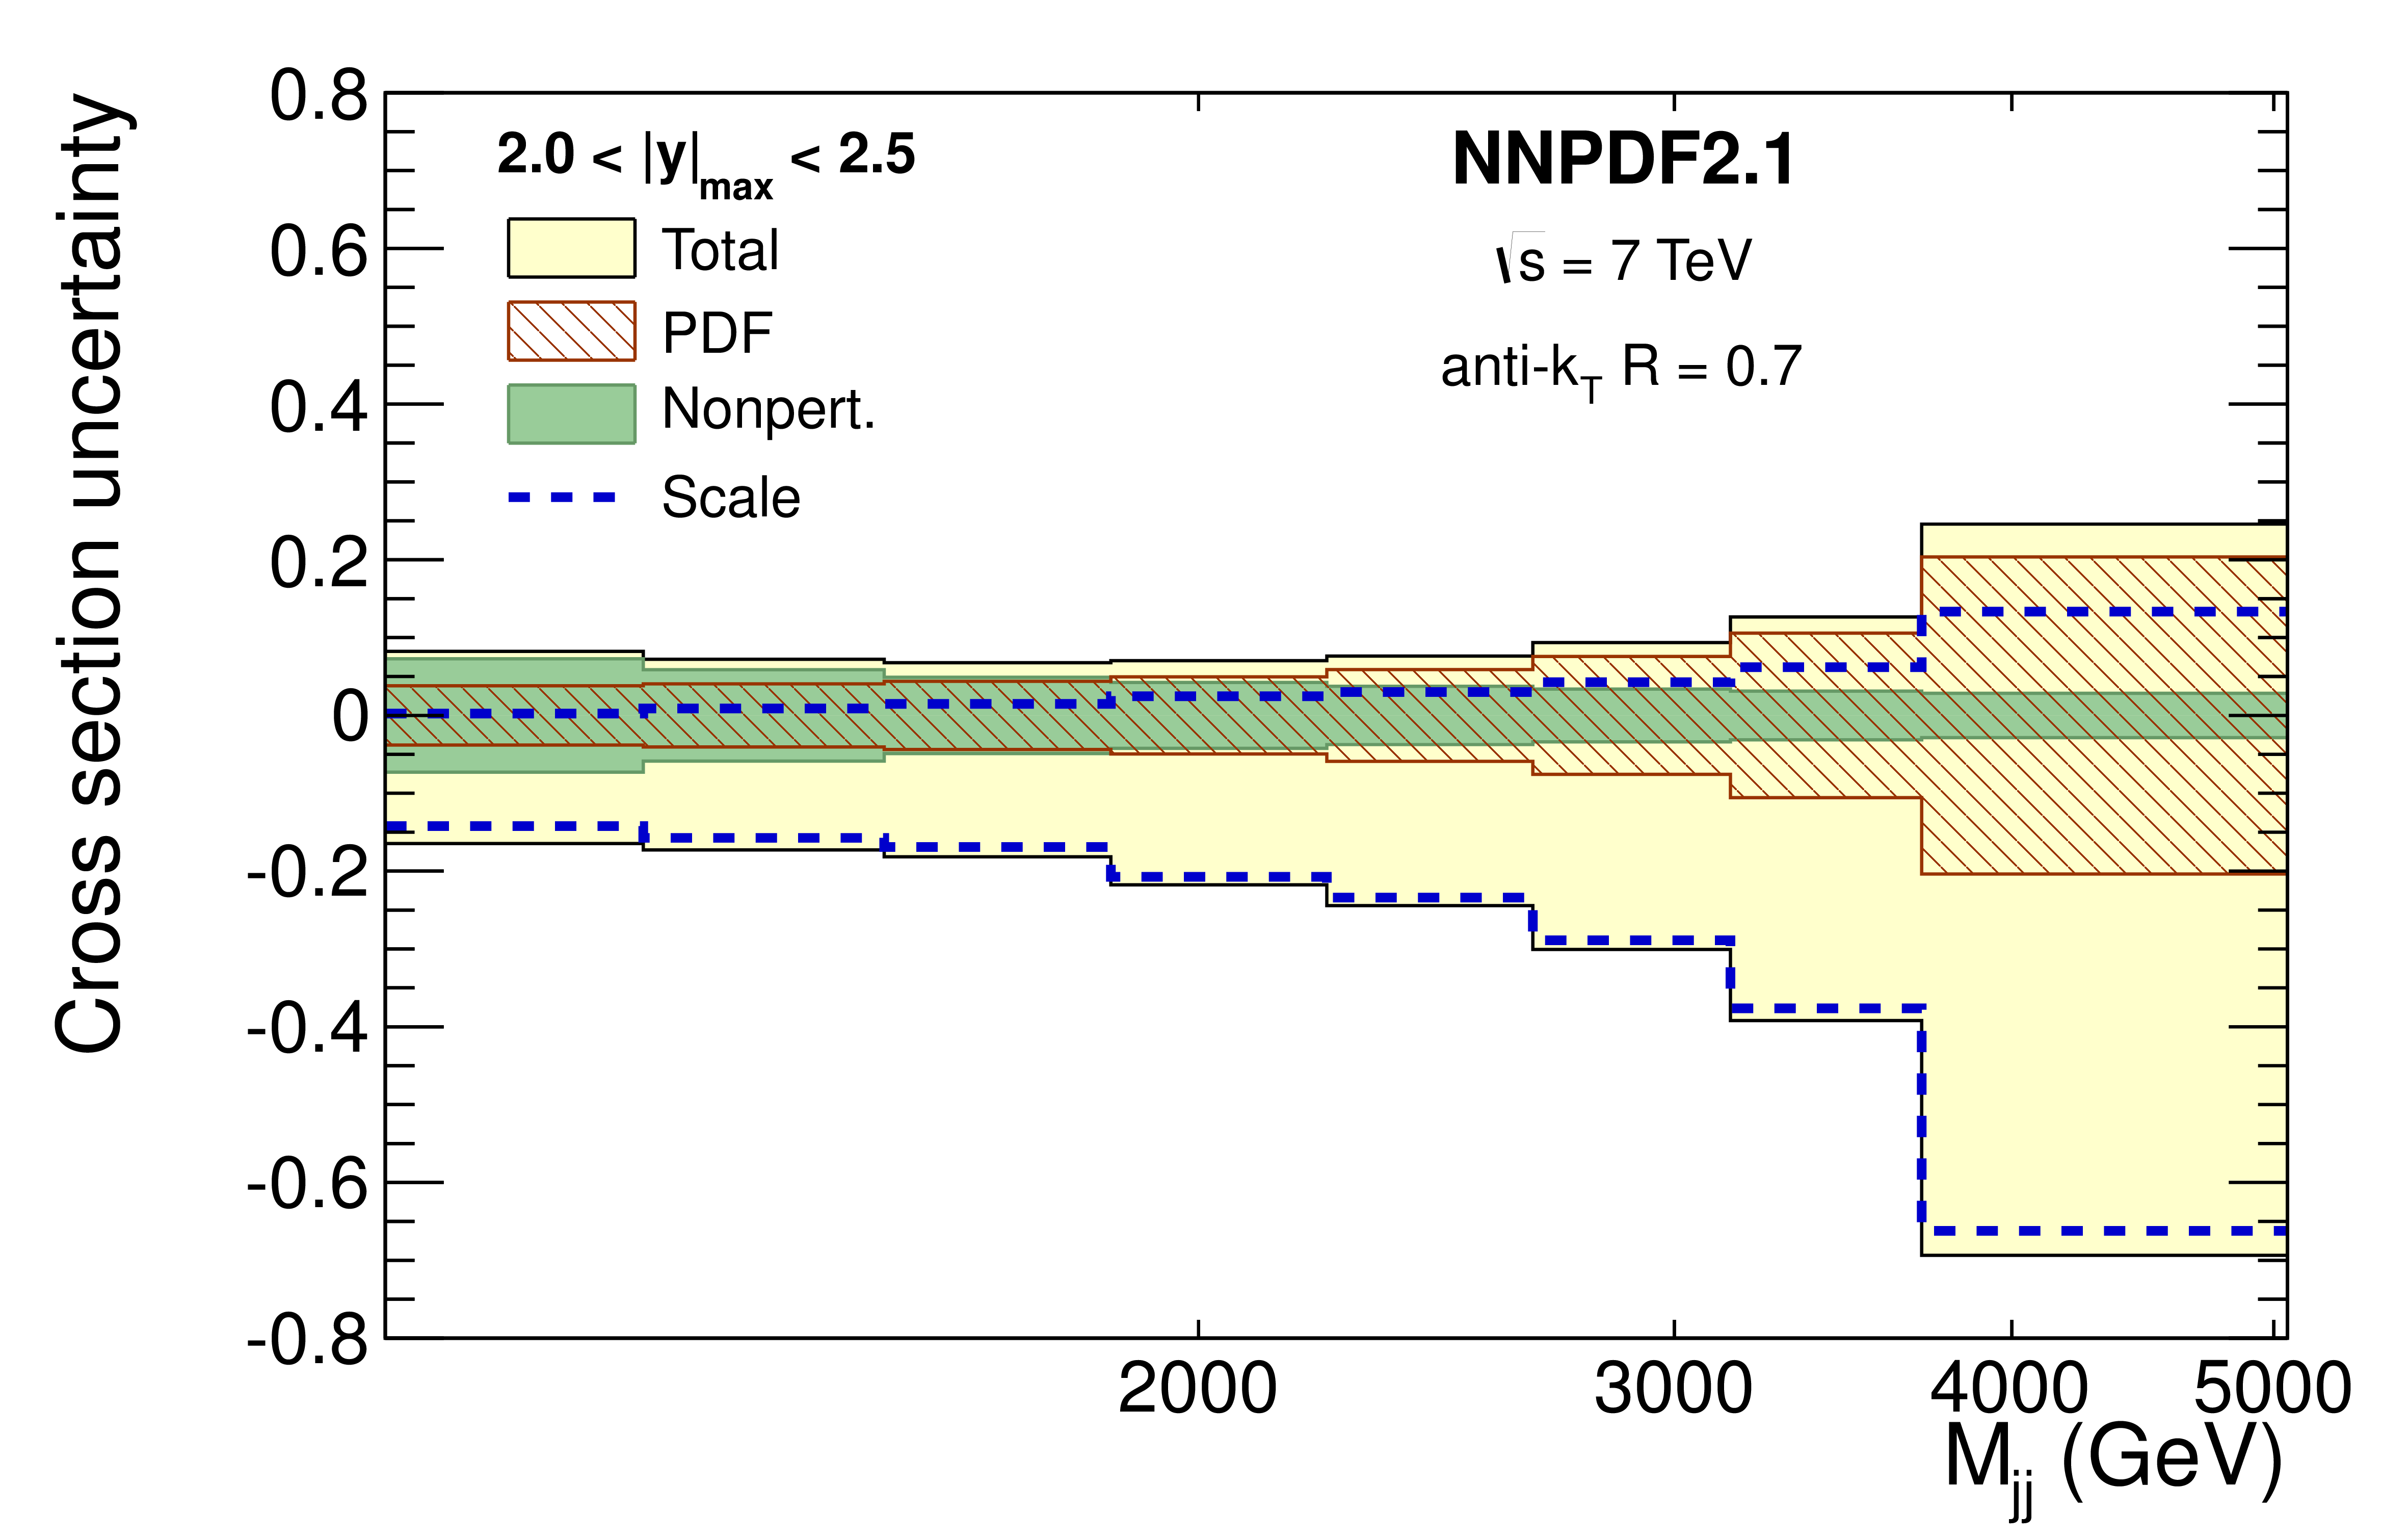
Figure 6-a:
Effect of the relative theoretical uncertainties for the inclusive jet (a,c,e,g,i) and dijet (b,d,f,h,j) cross section measurements for all five $|y|$ and $|y|_\text {max}$ bins, respectively. The upward and downward uncertainties are estimated separately. |
png pdf |
Figure 6-b:
Effect of the relative theoretical uncertainties for the inclusive jet (a,c,e,g,i) and dijet (b,d,f,h,j) cross section measurements for all five $|y|$ and $|y|_\text {max}$ bins, respectively. The upward and downward uncertainties are estimated separately. |
png pdf |
Figure 6-c:
Effect of the relative theoretical uncertainties for the inclusive jet (a,c,e,g,i) and dijet (b,d,f,h,j) cross section measurements for all five $|y|$ and $|y|_\text {max}$ bins, respectively. The upward and downward uncertainties are estimated separately. |
png pdf |
Figure 6-d:
Effect of the relative theoretical uncertainties for the inclusive jet (a,c,e,g,i) and dijet (b,d,f,h,j) cross section measurements for all five $|y|$ and $|y|_\text {max}$ bins, respectively. The upward and downward uncertainties are estimated separately. |
png pdf |
Figure 6-e:
Effect of the relative theoretical uncertainties for the inclusive jet (a,c,e,g,i) and dijet (b,d,f,h,j) cross section measurements for all five $|y|$ and $|y|_\text {max}$ bins, respectively. The upward and downward uncertainties are estimated separately. |
png pdf |
Figure 6-f:
Effect of the relative theoretical uncertainties for the inclusive jet (a,c,e,g,i) and dijet (b,d,f,h,j) cross section measurements for all five $|y|$ and $|y|_\text {max}$ bins, respectively. The upward and downward uncertainties are estimated separately. |
png pdf |
Figure 6-g:
Effect of the relative theoretical uncertainties for the inclusive jet (a,c,e,g,i) and dijet (b,d,f,h,j) cross section measurements for all five $|y|$ and $|y|_\text {max}$ bins, respectively. The upward and downward uncertainties are estimated separately. |
png pdf |
Figure 6-h:
Effect of the relative theoretical uncertainties for the inclusive jet (a,c,e,g,i) and dijet (b,d,f,h,j) cross section measurements for all five $|y|$ and $|y|_\text {max}$ bins, respectively. The upward and downward uncertainties are estimated separately. |
png pdf |
Figure 6-i:
Effect of the relative theoretical uncertainties for the inclusive jet (a,c,e,g,i) and dijet (b,d,f,h,j) cross section measurements for all five $|y|$ and $|y|_\text {max}$ bins, respectively. The upward and downward uncertainties are estimated separately. |
png pdf |
Figure 6-j:
Effect of the relative theoretical uncertainties for the inclusive jet (a,c,e,g,i) and dijet (b,d,f,h,j) cross section measurements for all five $|y|$ and $|y|_\text {max}$ bins, respectively. The upward and downward uncertainties are estimated separately. |
png pdf |
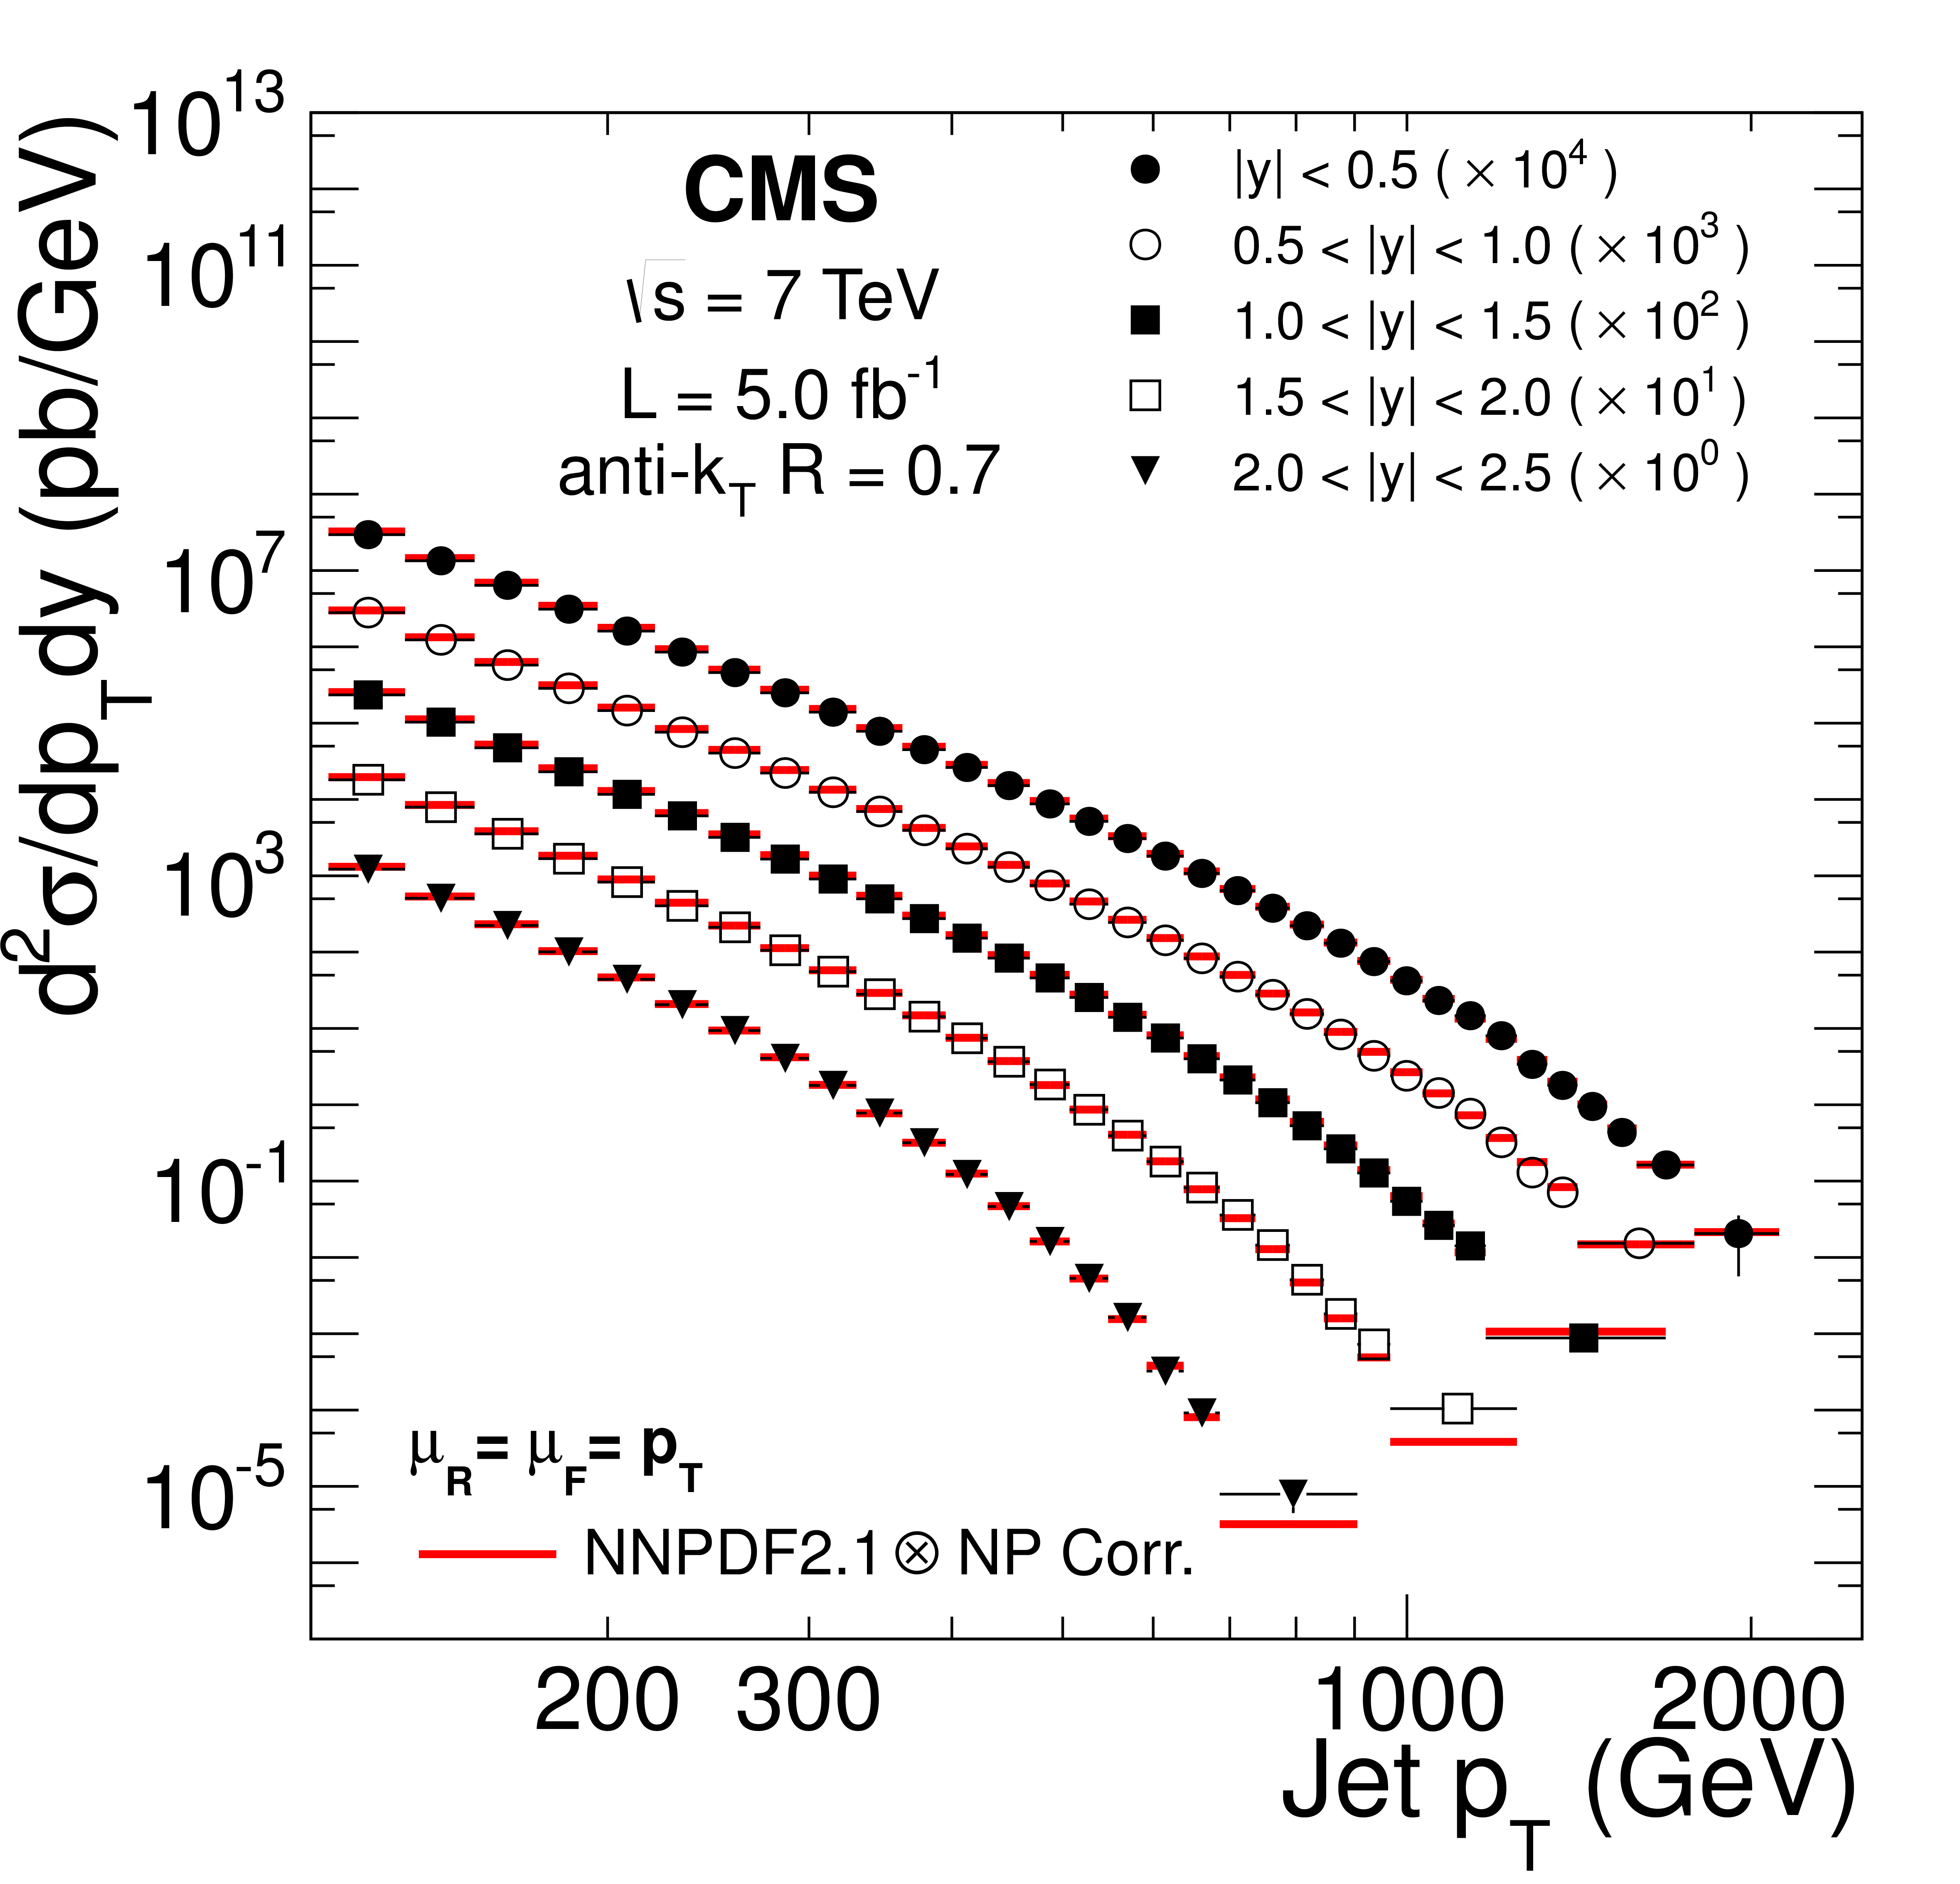
Figure 7-a:
Inclusive jet (a) and dijet (b) cross sections for the five different rapidity bins, for data (markers) and theory (thick lines) using the NNPDF2.1 PDF set. |
png pdf |
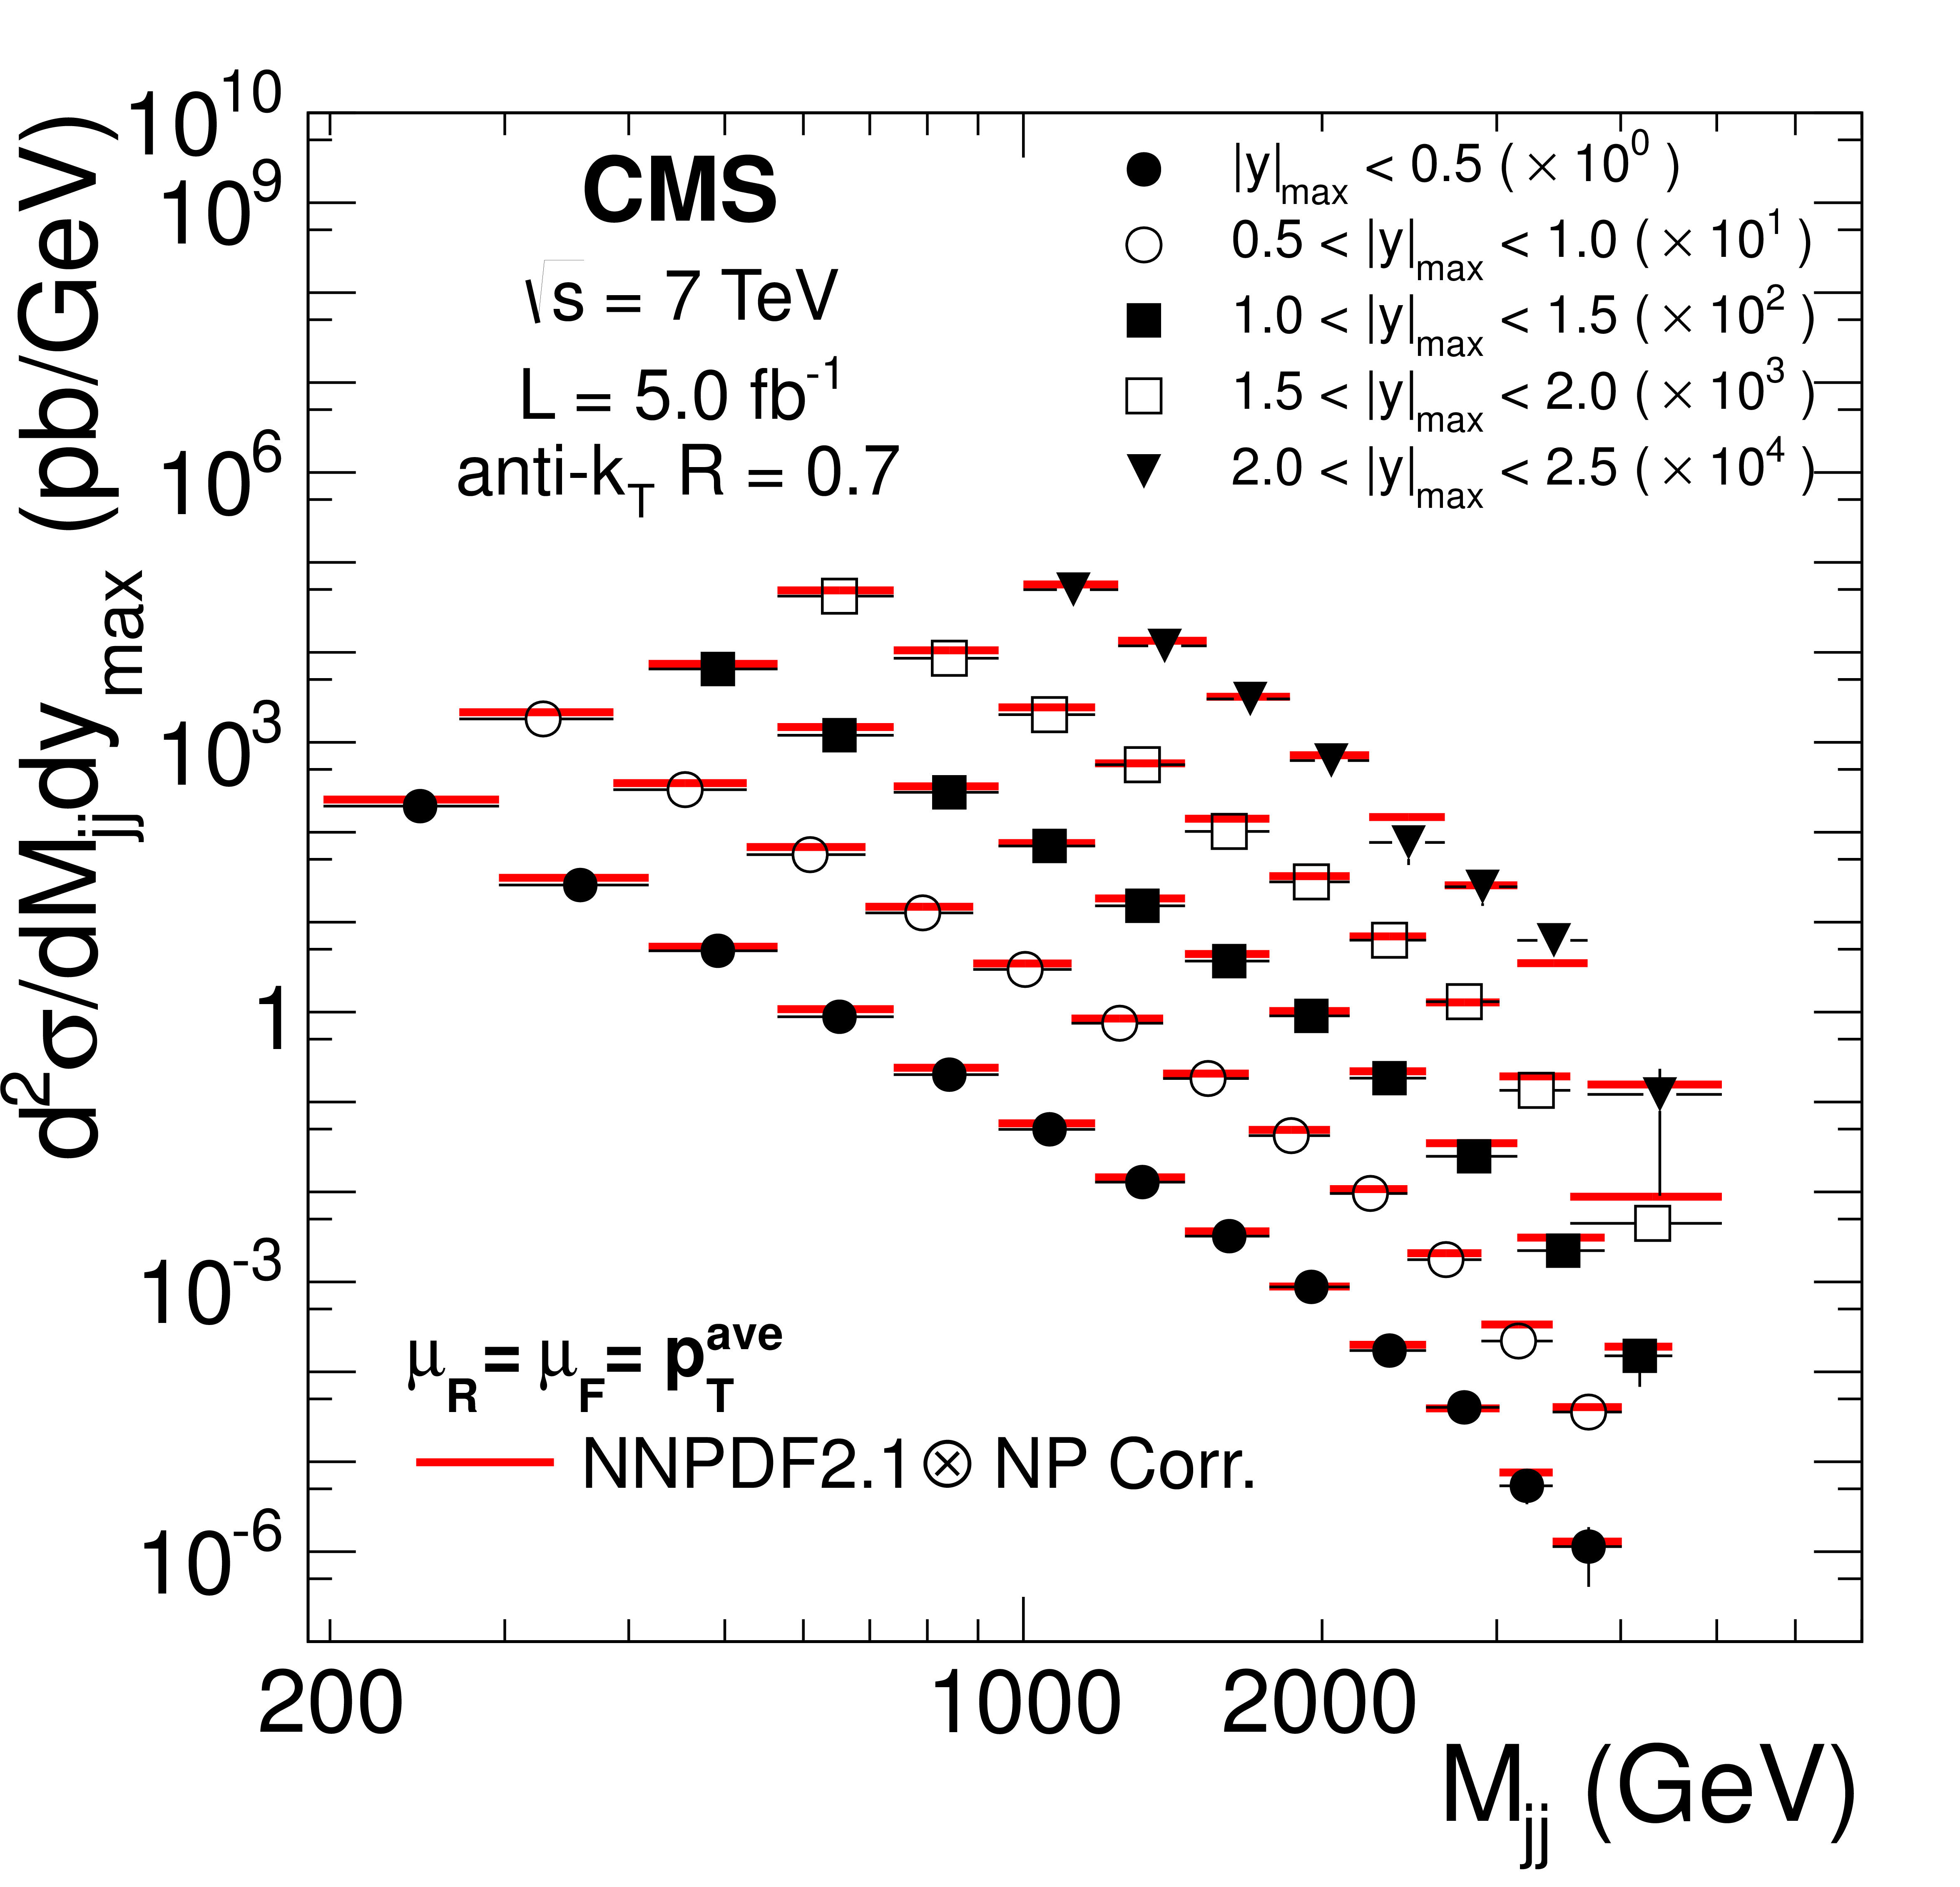
Figure 7-b:
Inclusive jet (a) and dijet (b) cross sections for the five different rapidity bins, for data (markers) and theory (thick lines) using the NNPDF2.1 PDF set. |
png pdf |
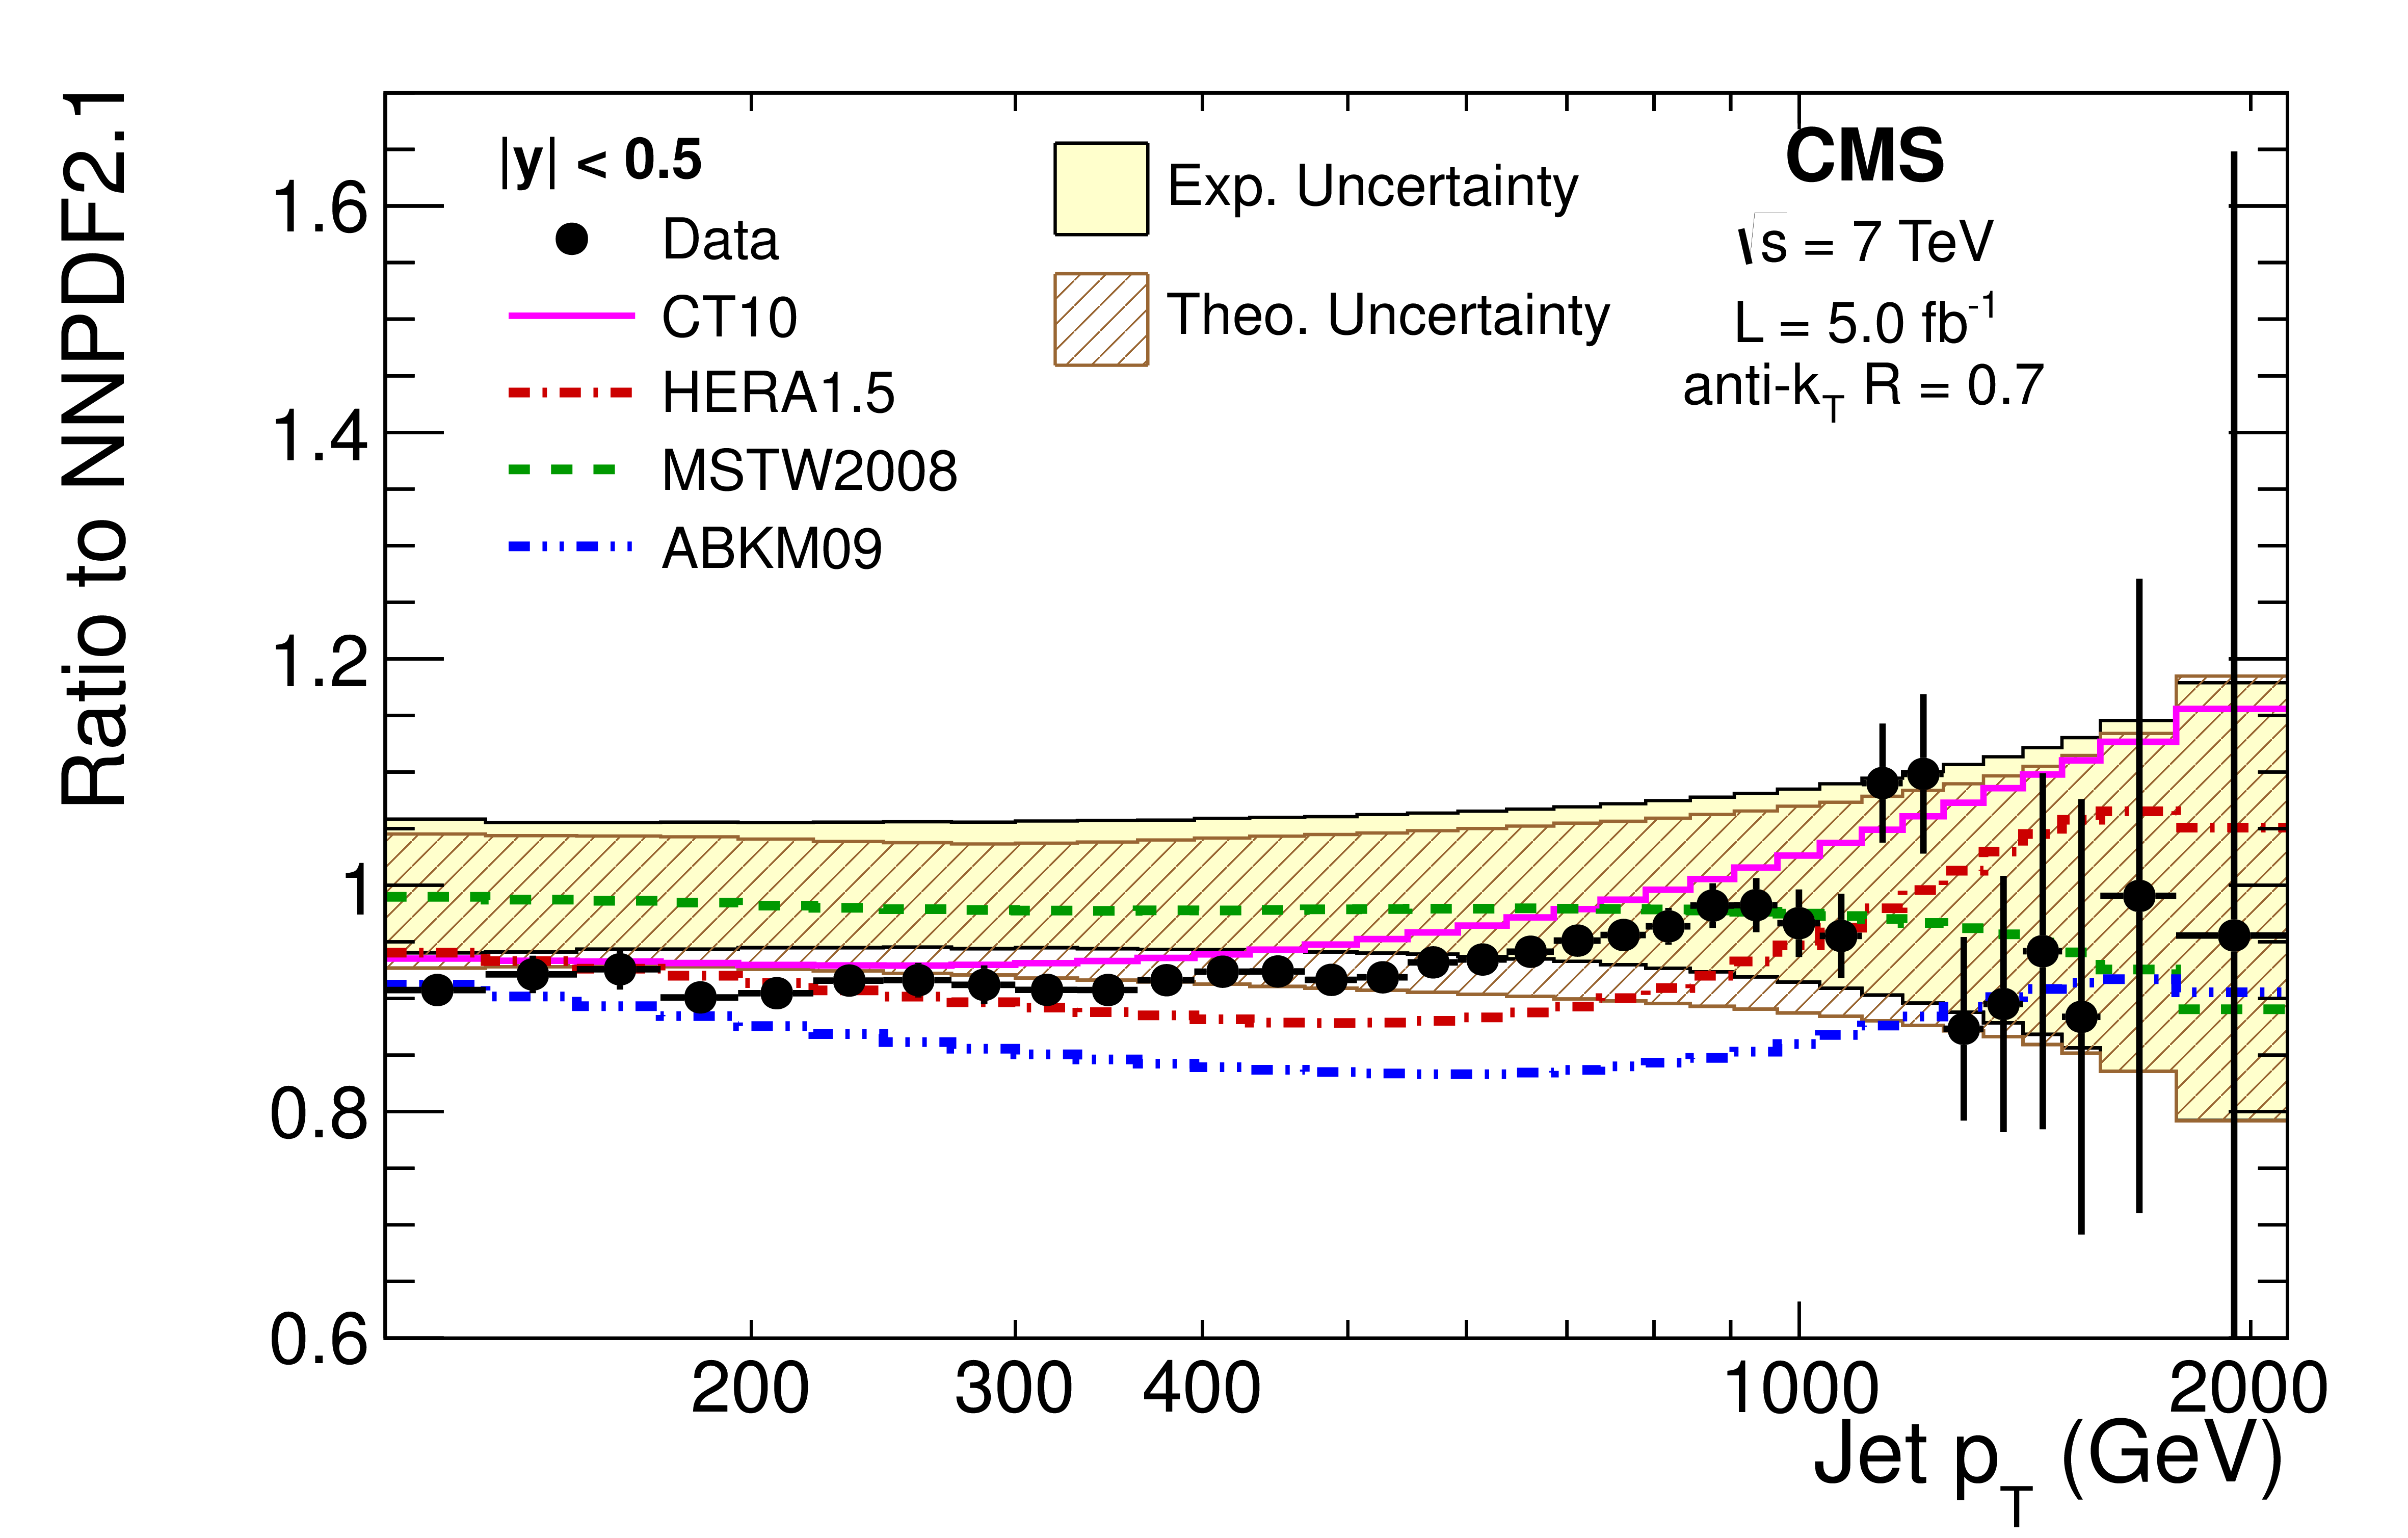
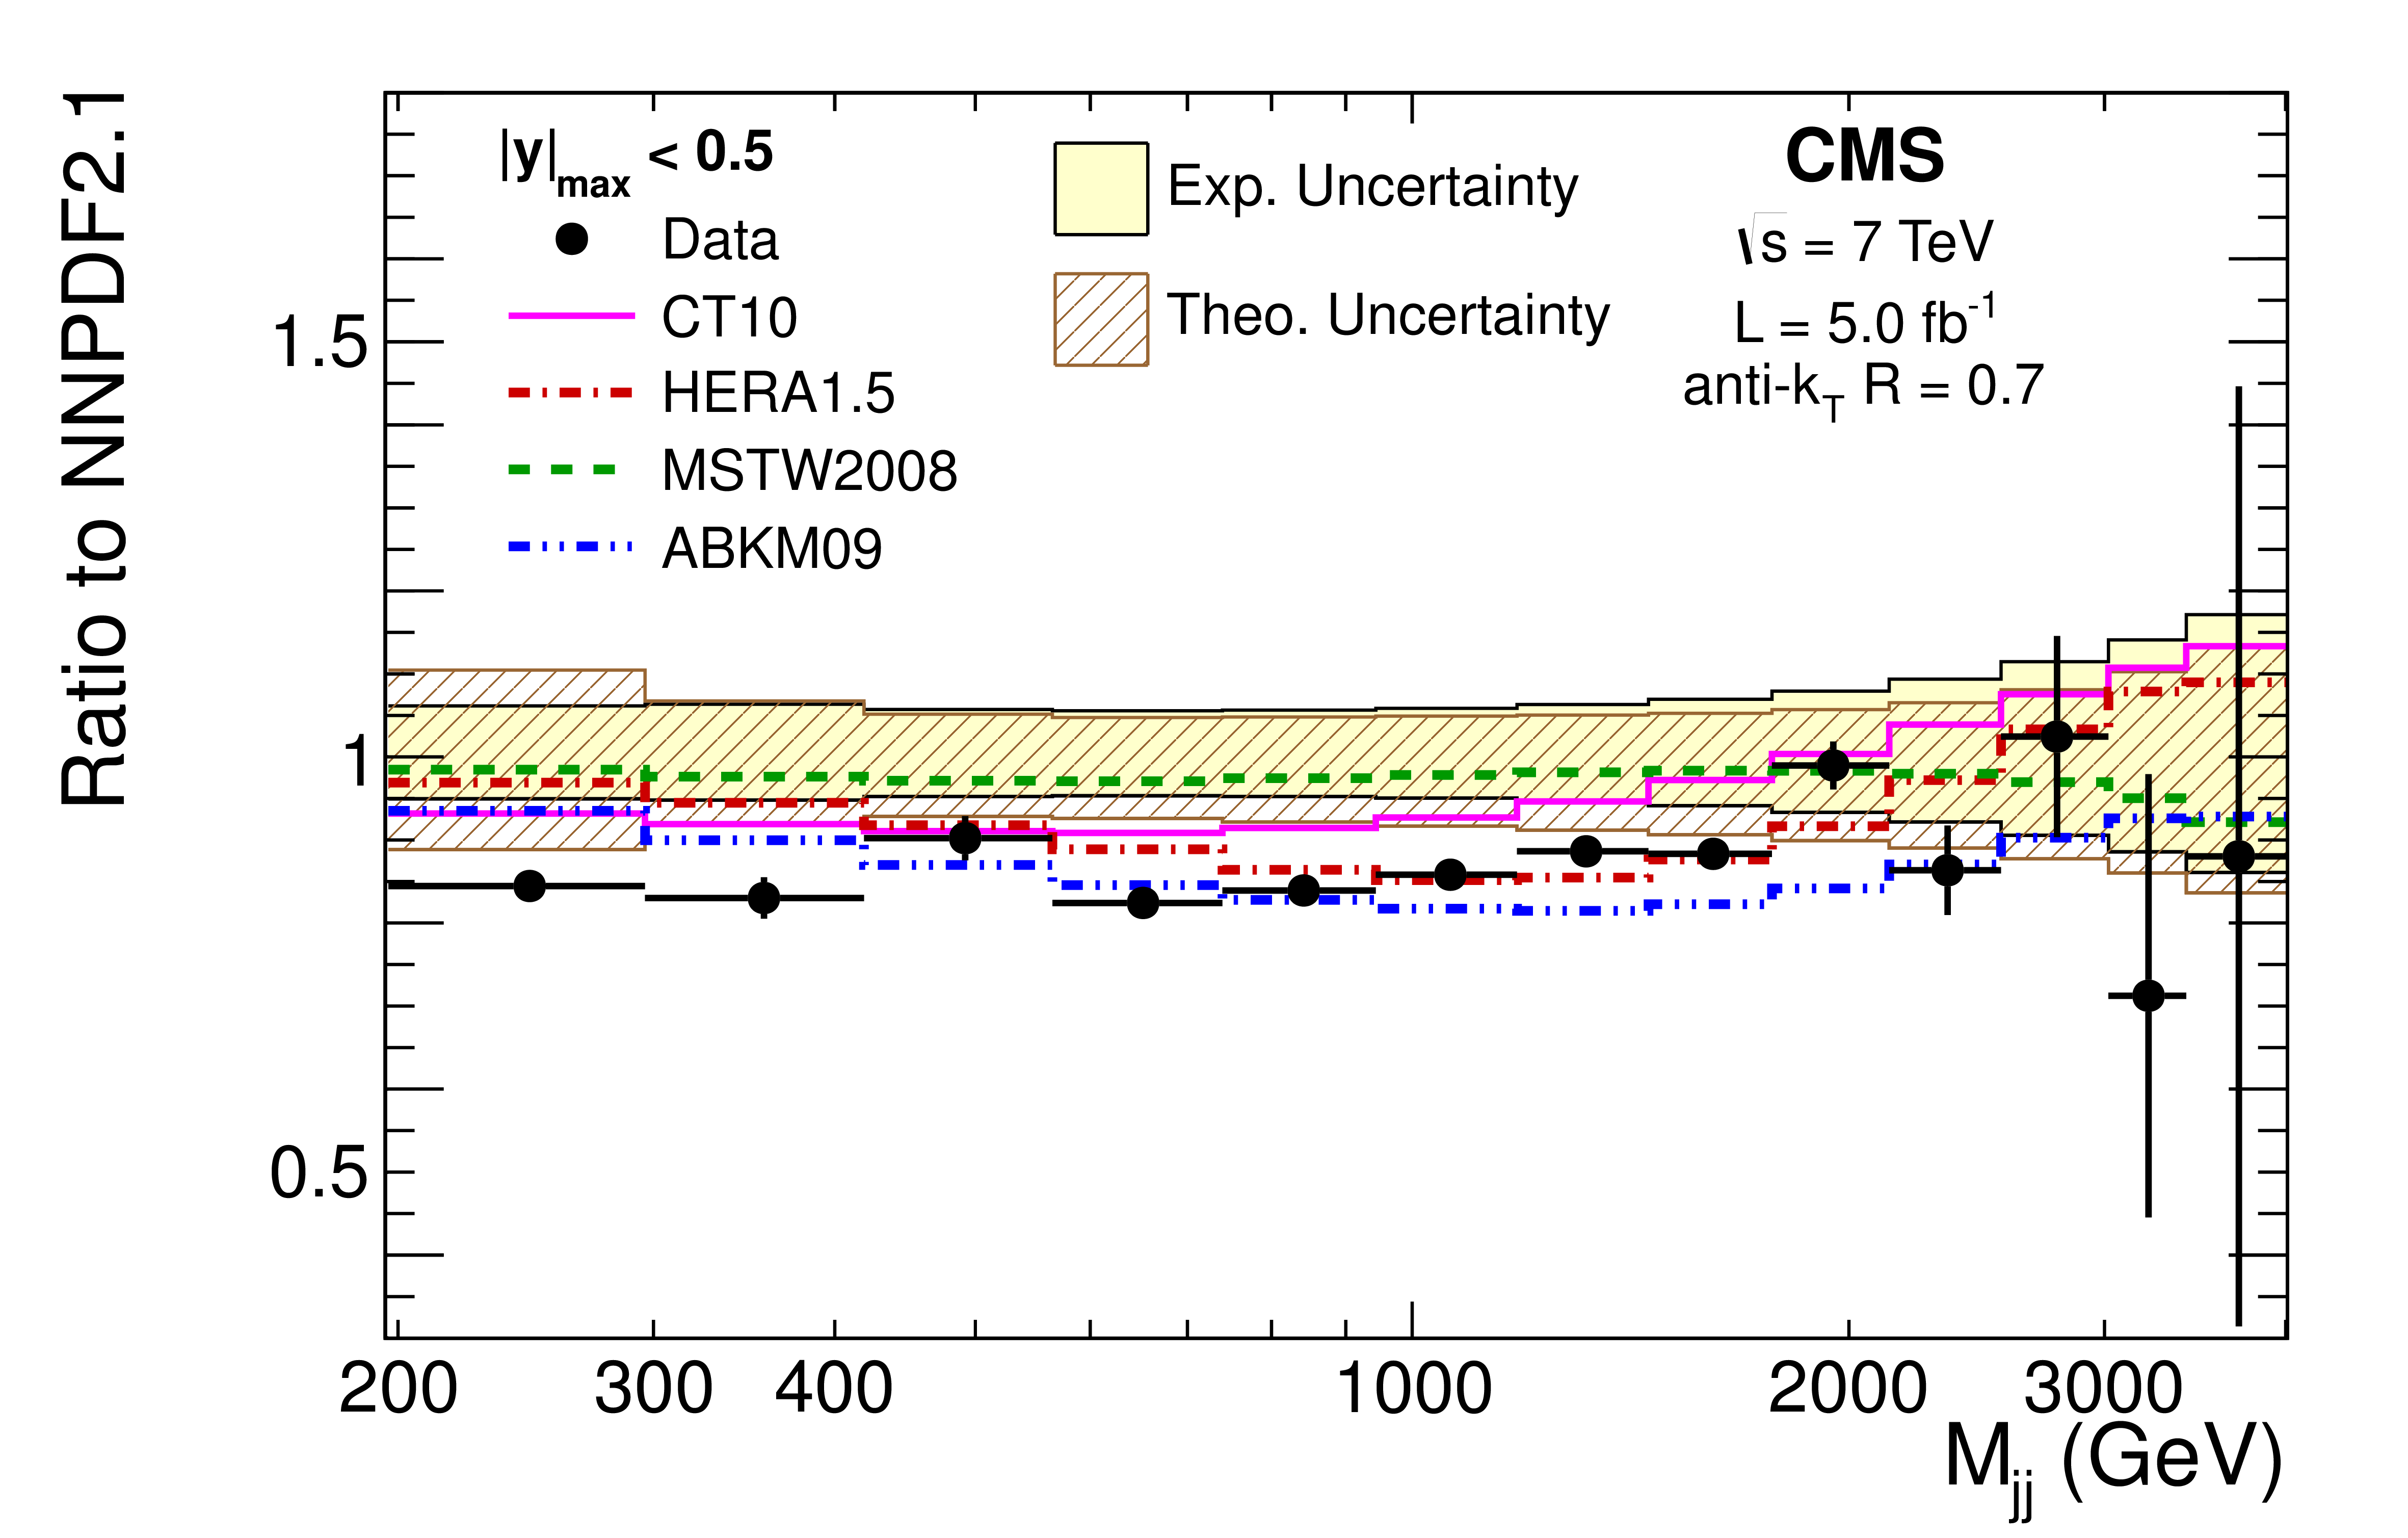
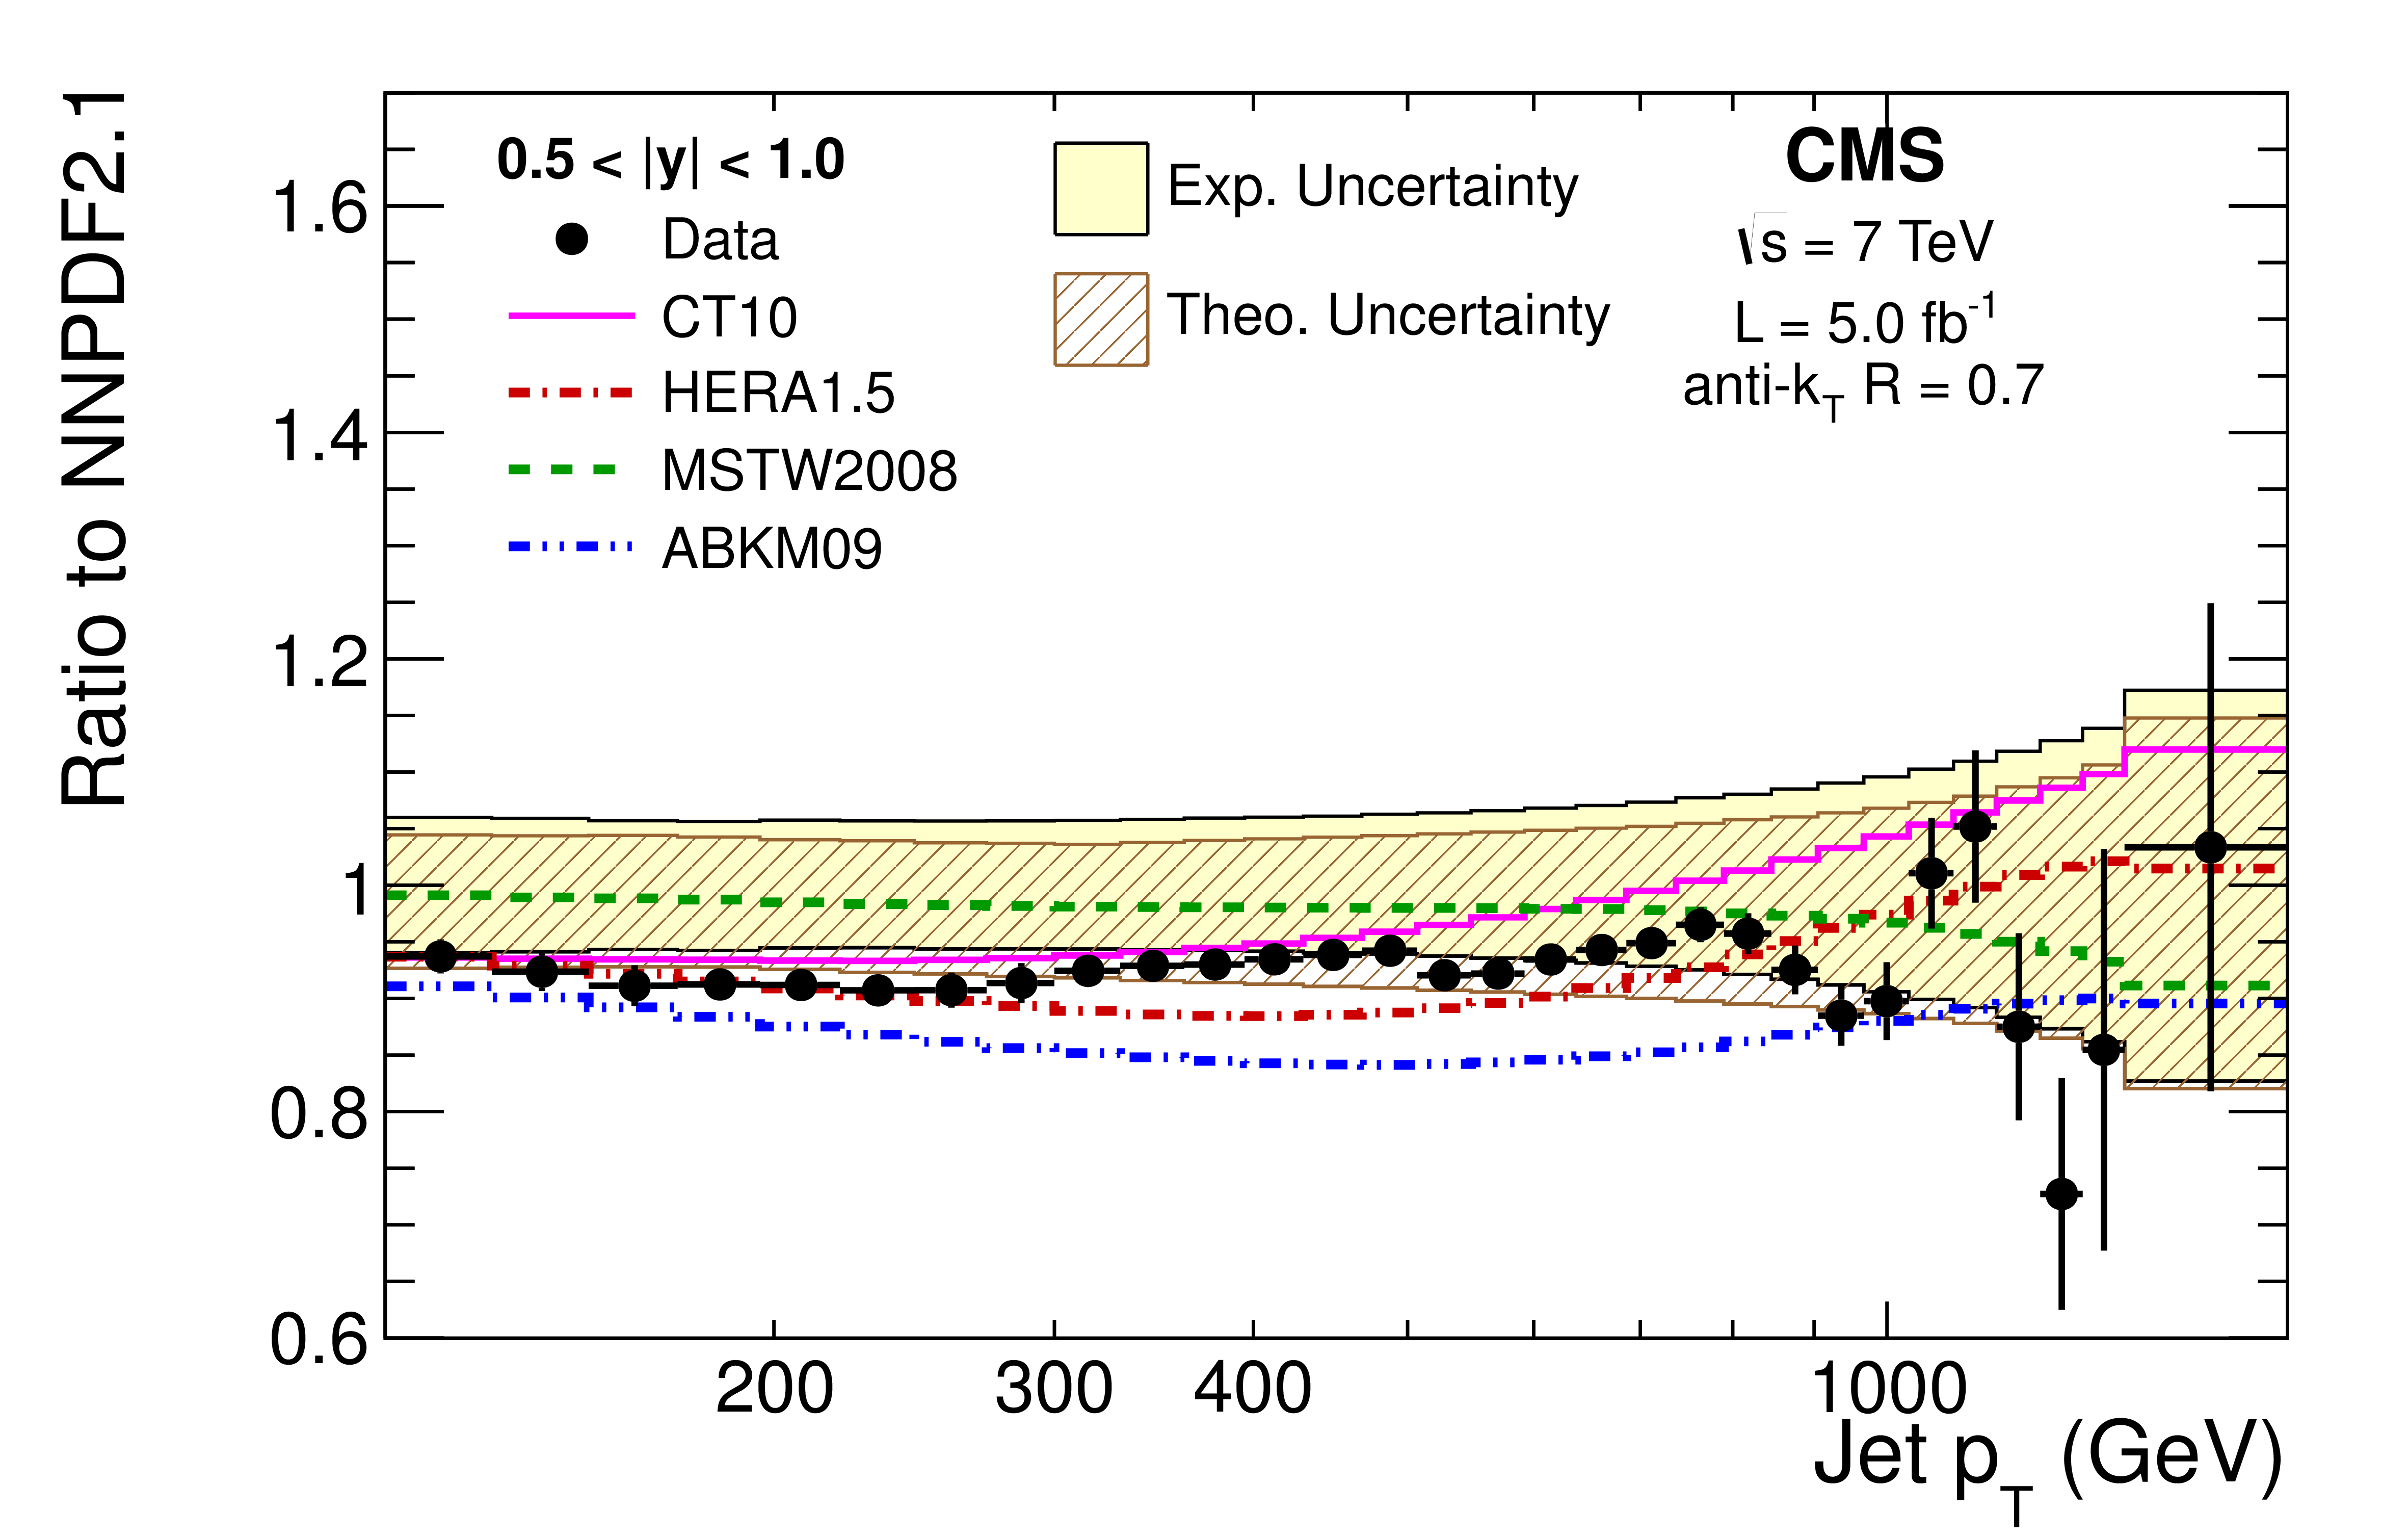
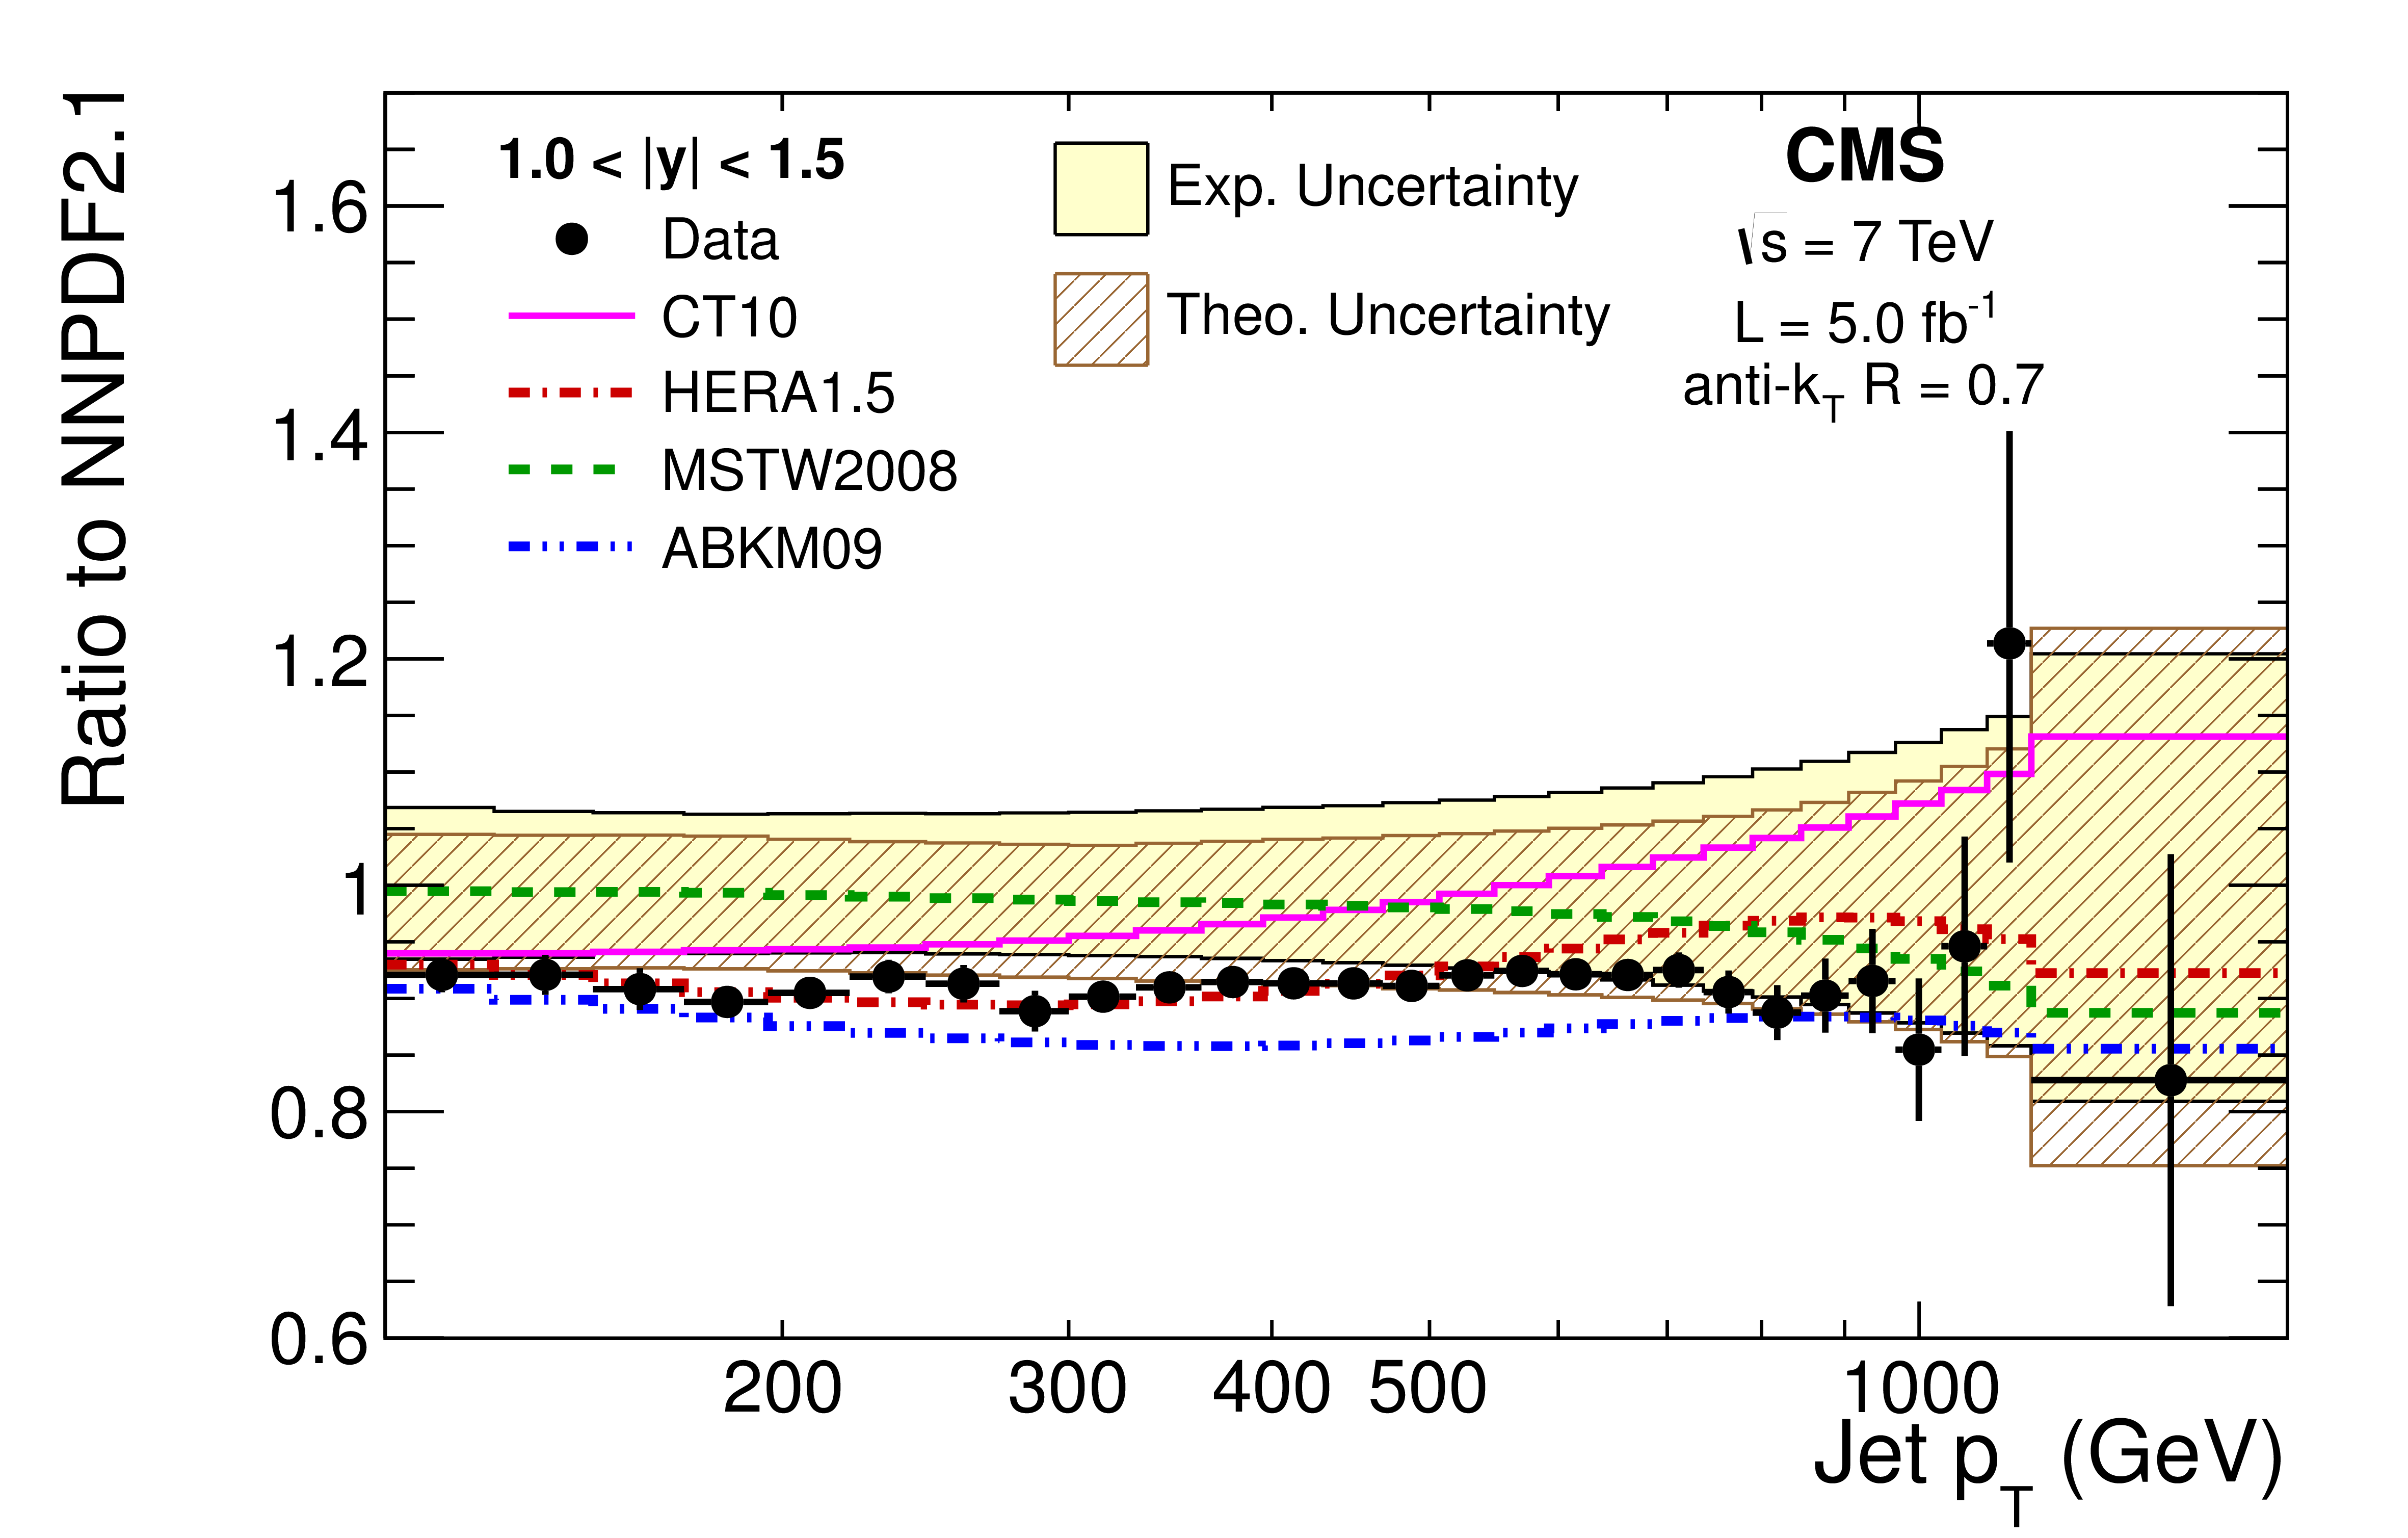
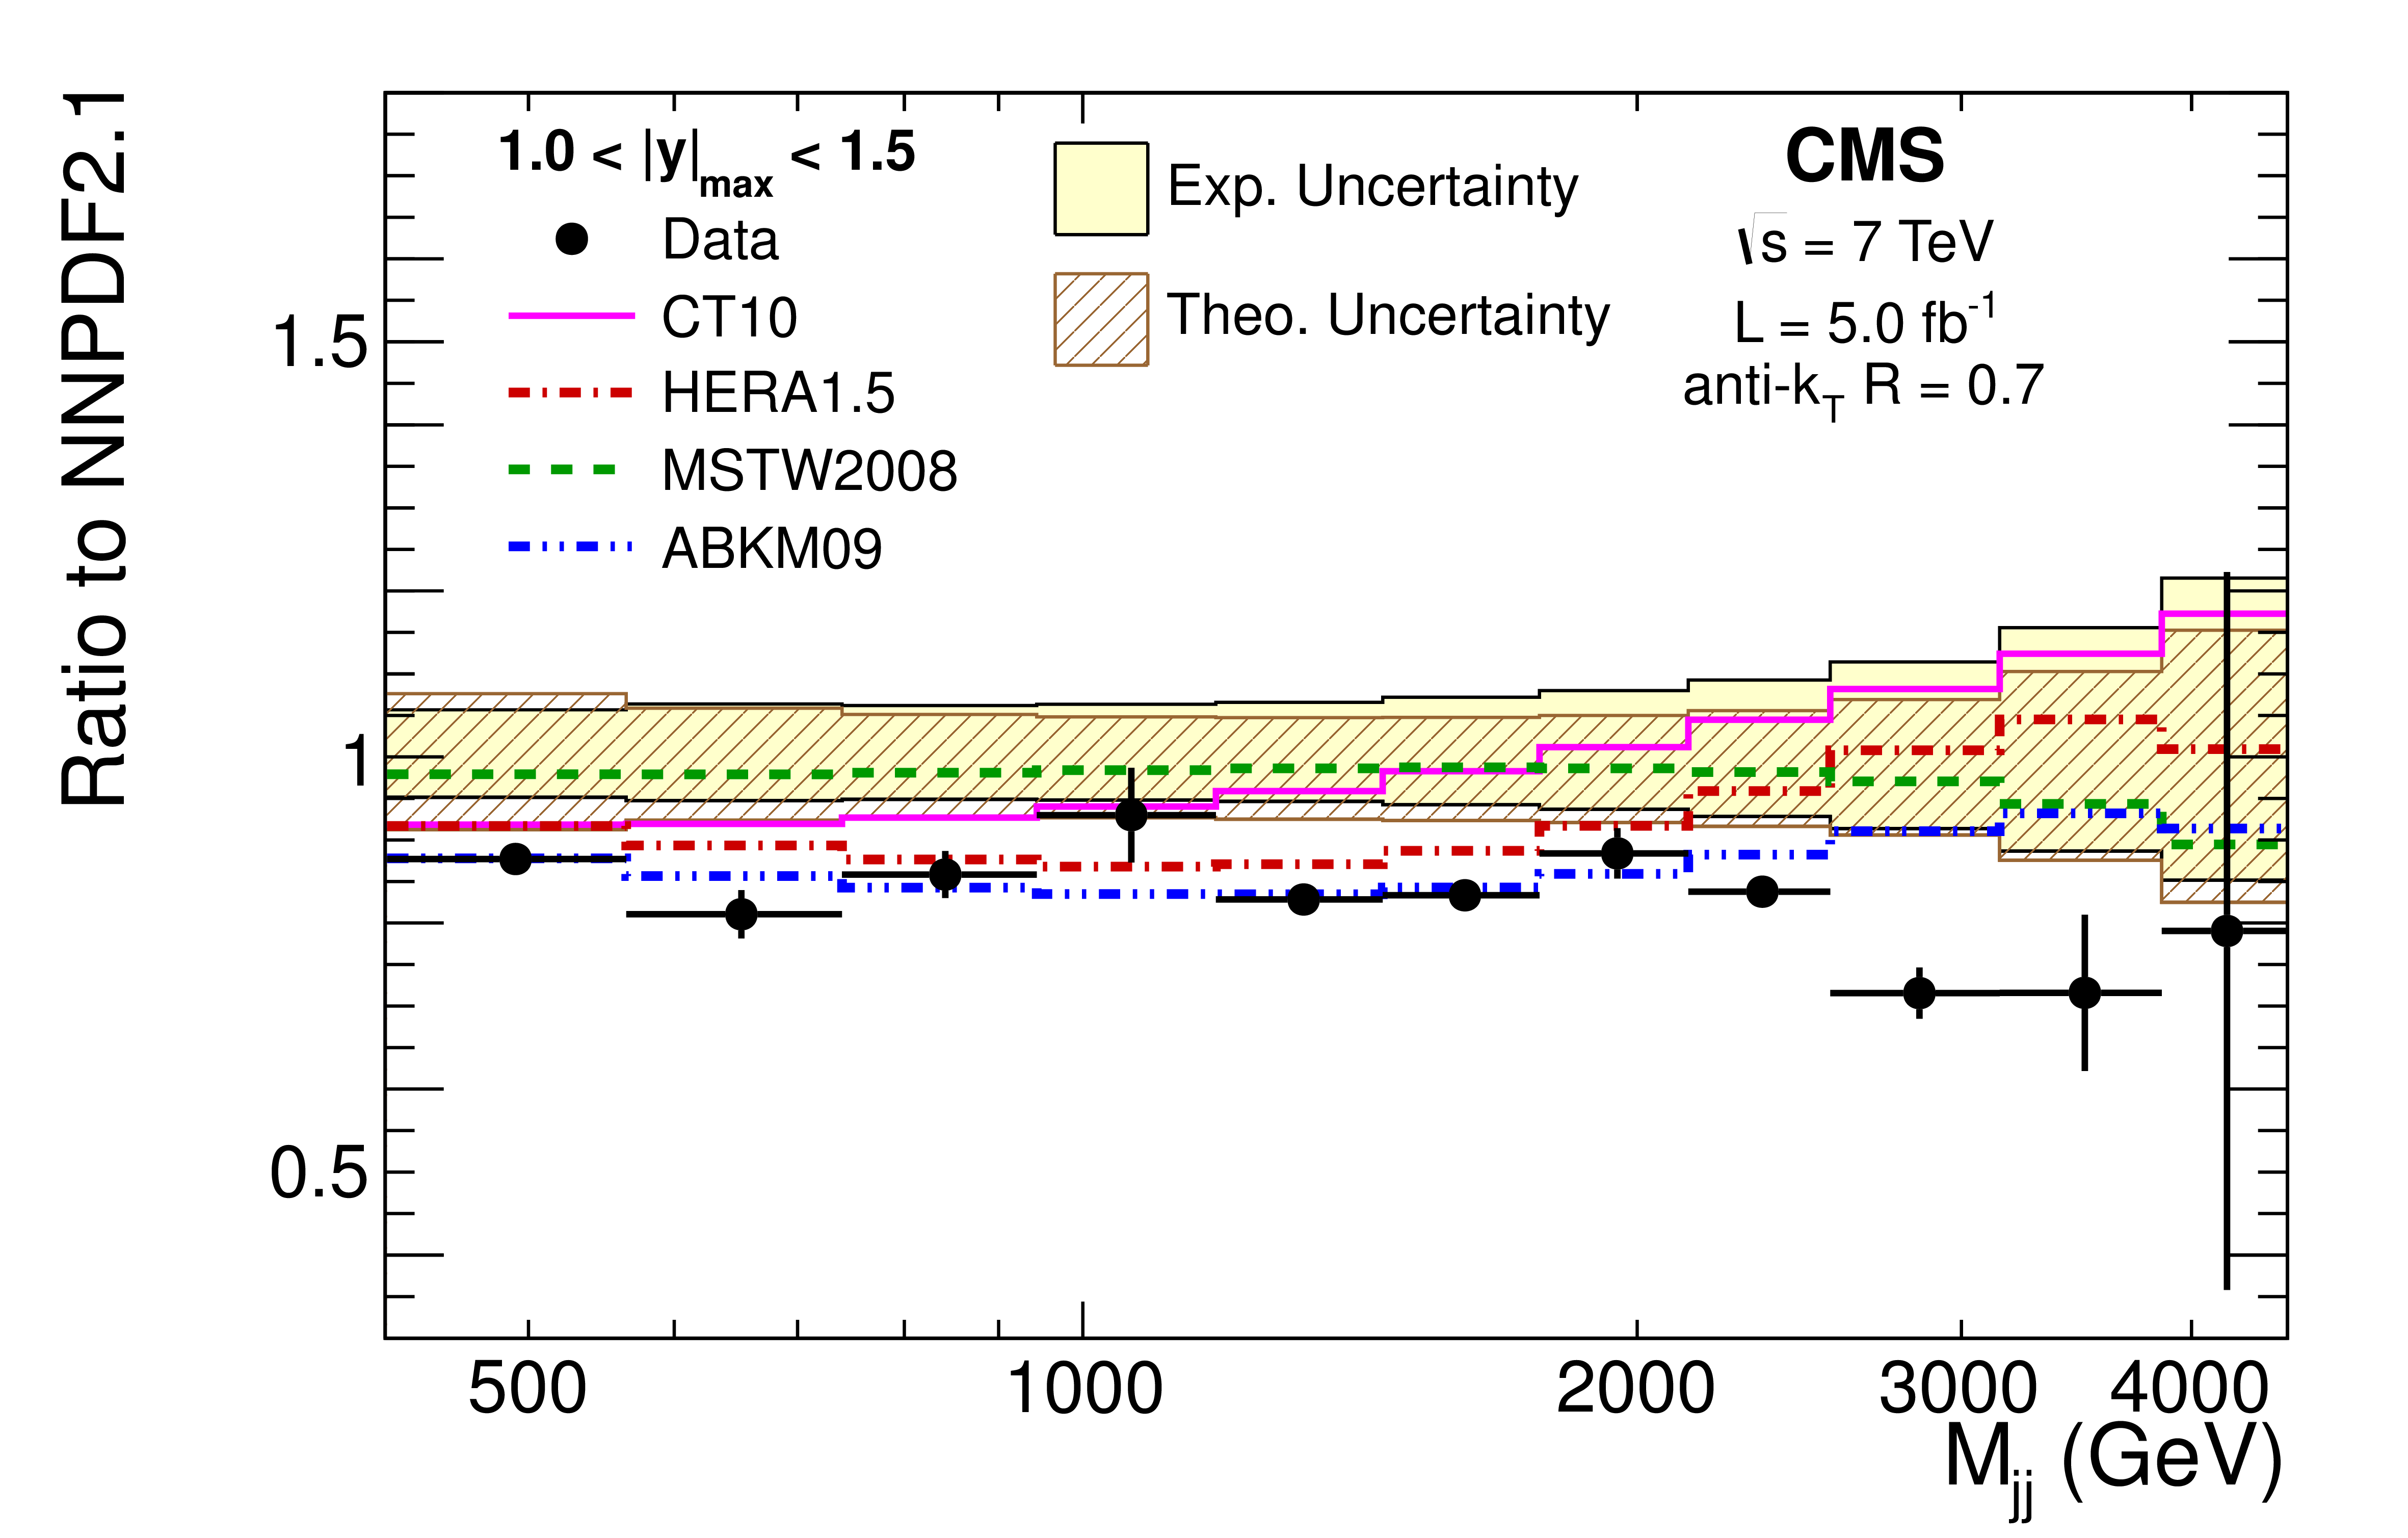
Figure 8-a:
Ratio of inclusive jet (a) and dijet (b) cross sections to the theoretical prediction using the central value of the NNPDF2.1 PDF set for the first three $|y|$ and $|y|_\text {max}$ bins respectively. The solid histograms show the ratio of the cross sections calculated with the other PDF sets to that calculated with NNPDF2.1. The experimental and theoretical systematic uncertainties are represented by the continuous and hatched bands, respectively. |
png pdf |
Figure 8-b:
Ratio of inclusive jet (a) and dijet (b) cross sections to the theoretical prediction using the central value of the NNPDF2.1 PDF set for the first three $|y|$ and $|y|_\text {max}$ bins respectively. The solid histograms show the ratio of the cross sections calculated with the other PDF sets to that calculated with NNPDF2.1. The experimental and theoretical systematic uncertainties are represented by the continuous and hatched bands, respectively. |
png pdf |
Figure 8-c:
Ratio of inclusive jet (a) and dijet (b) cross sections to the theoretical prediction using the central value of the NNPDF2.1 PDF set for the first three $|y|$ and $|y|_\text {max}$ bins respectively. The solid histograms show the ratio of the cross sections calculated with the other PDF sets to that calculated with NNPDF2.1. The experimental and theoretical systematic uncertainties are represented by the continuous and hatched bands, respectively. |

png pdf |
Figure 8-d:
Ratio of inclusive jet (a) and dijet (b) cross sections to the theoretical prediction using the central value of the NNPDF2.1 PDF set for the first three $|y|$ and $|y|_\text {max}$ bins respectively. The solid histograms show the ratio of the cross sections calculated with the other PDF sets to that calculated with NNPDF2.1. The experimental and theoretical systematic uncertainties are represented by the continuous and hatched bands, respectively. |
png pdf |
Figure 8-e:
Ratio of inclusive jet (a) and dijet (b) cross sections to the theoretical prediction using the central value of the NNPDF2.1 PDF set for the first three $|y|$ and $|y|_\text {max}$ bins respectively. The solid histograms show the ratio of the cross sections calculated with the other PDF sets to that calculated with NNPDF2.1. The experimental and theoretical systematic uncertainties are represented by the continuous and hatched bands, respectively. |
png pdf |
Figure 8-f:
Ratio of inclusive jet (a) and dijet (b) cross sections to the theoretical prediction using the central value of the NNPDF2.1 PDF set for the first three $|y|$ and $|y|_\text {max}$ bins respectively. The solid histograms show the ratio of the cross sections calculated with the other PDF sets to that calculated with NNPDF2.1. The experimental and theoretical systematic uncertainties are represented by the continuous and hatched bands, respectively. |
png pdf |
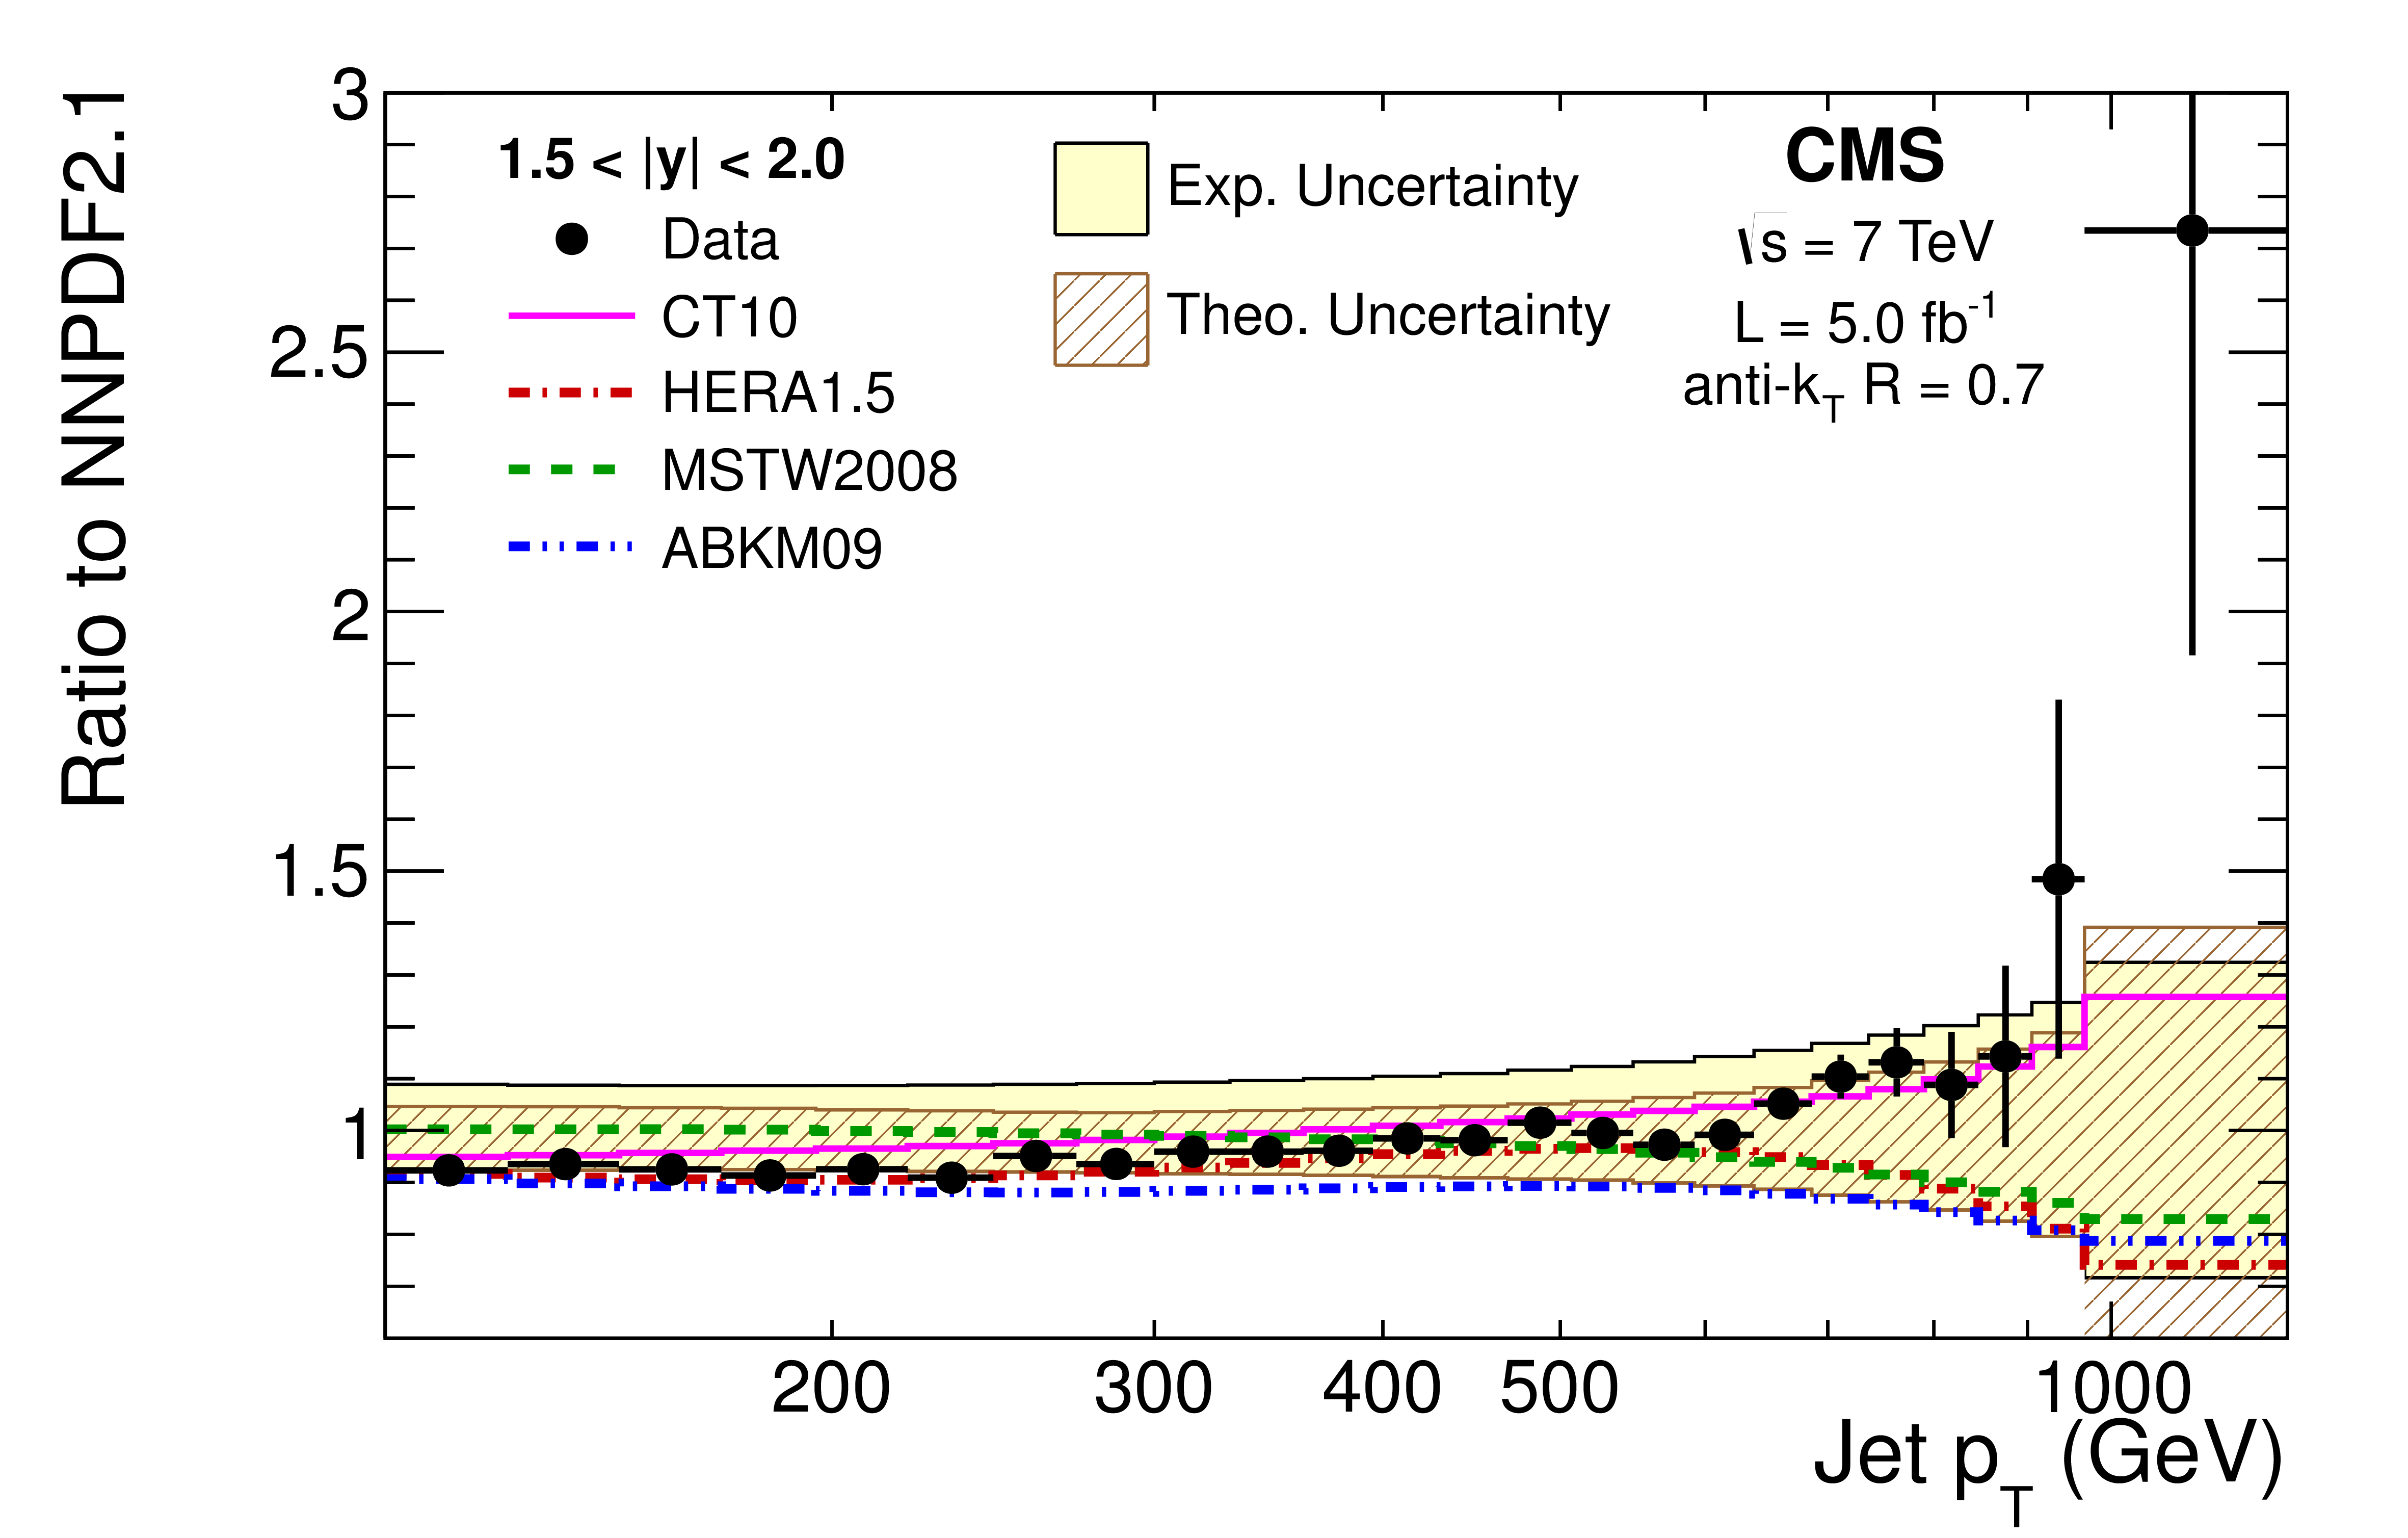
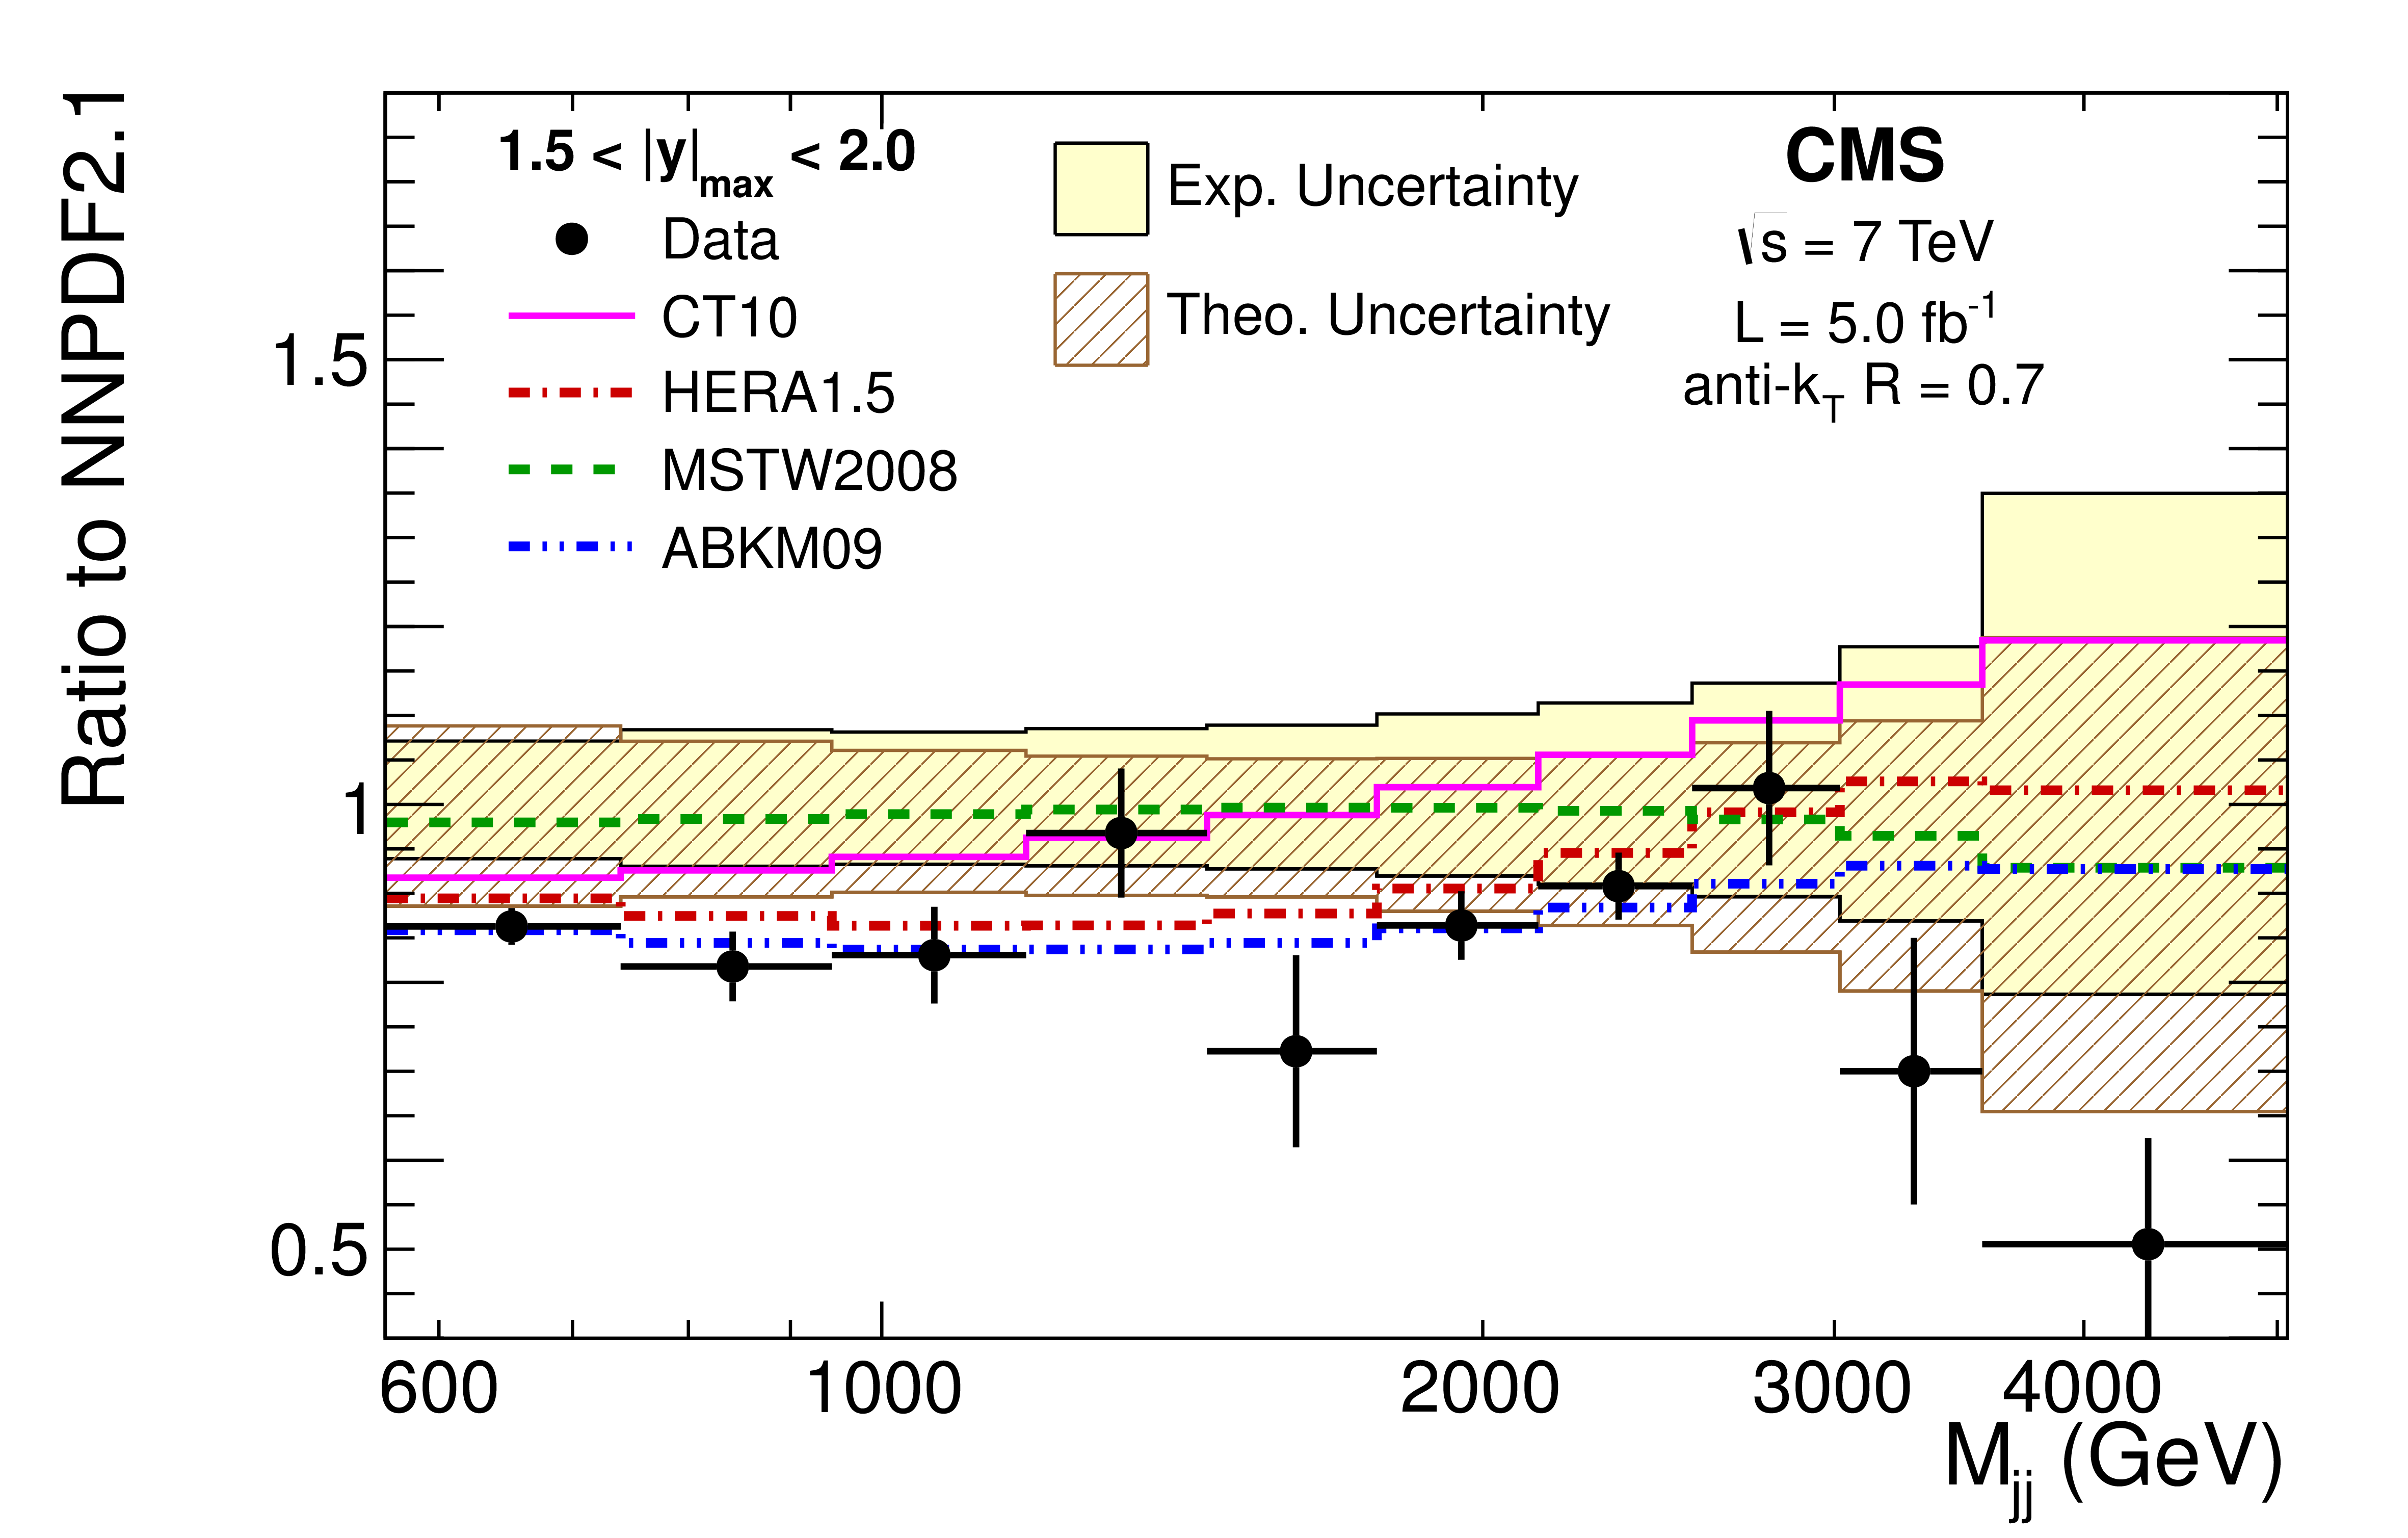
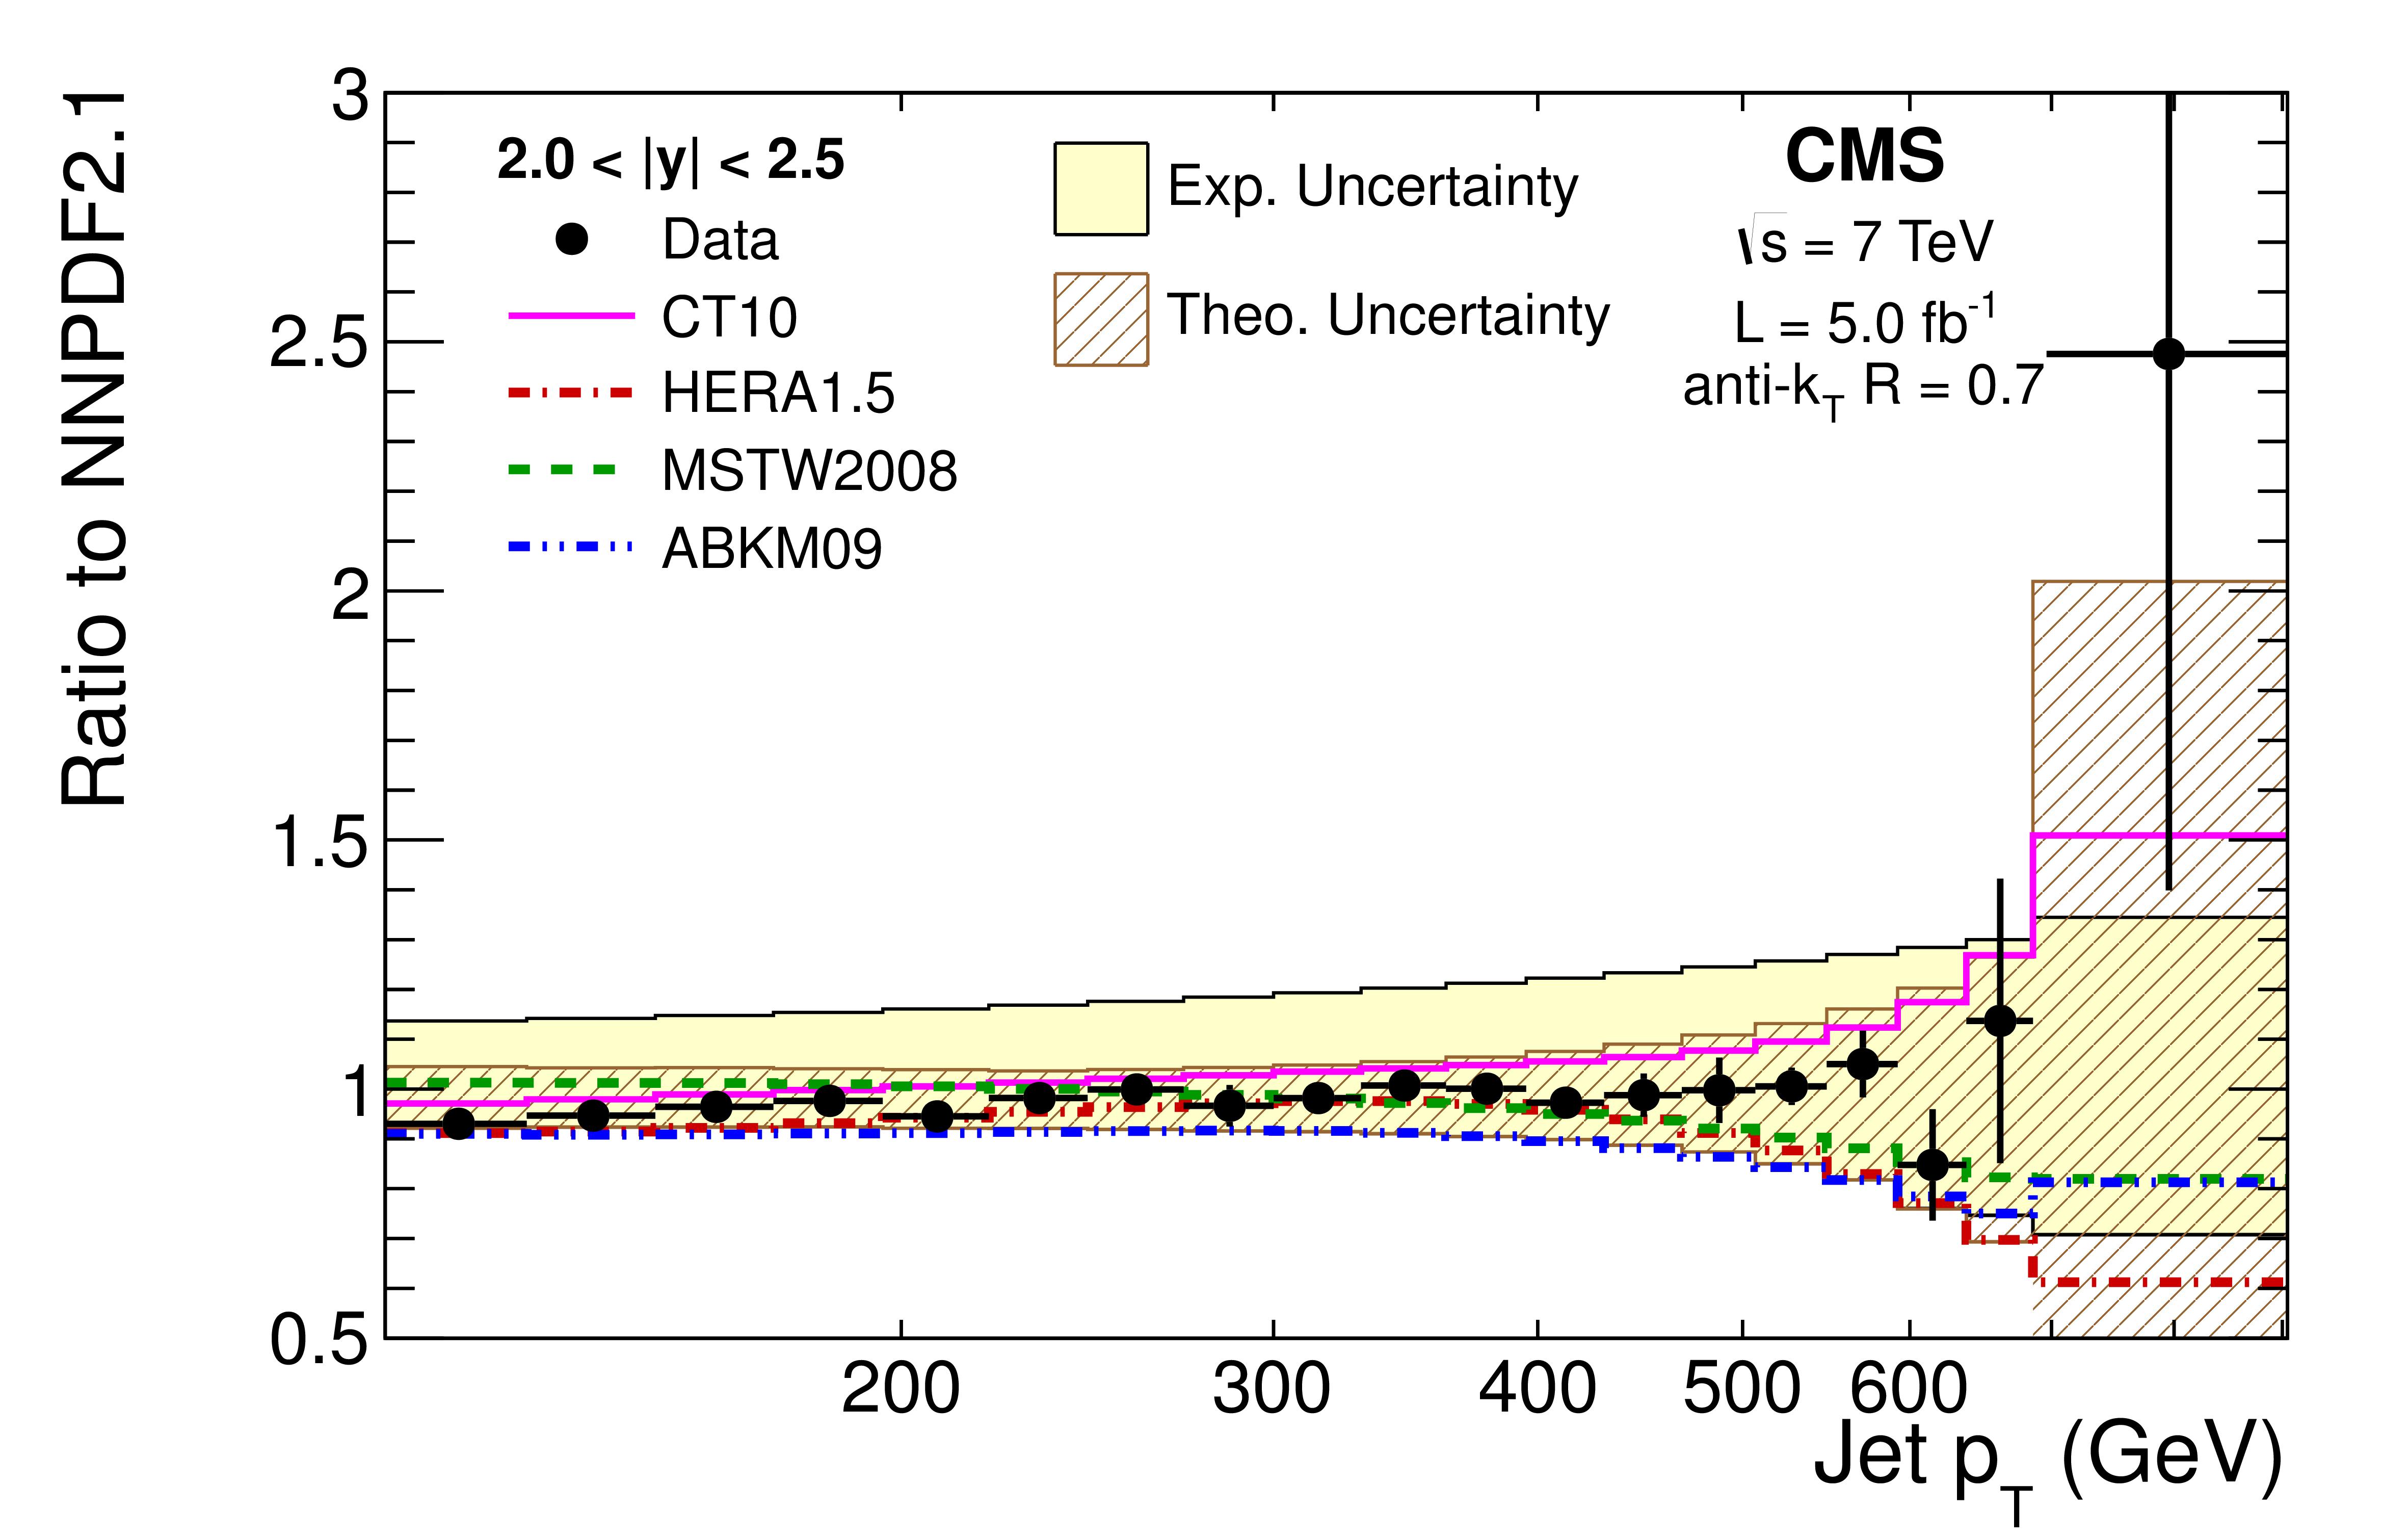
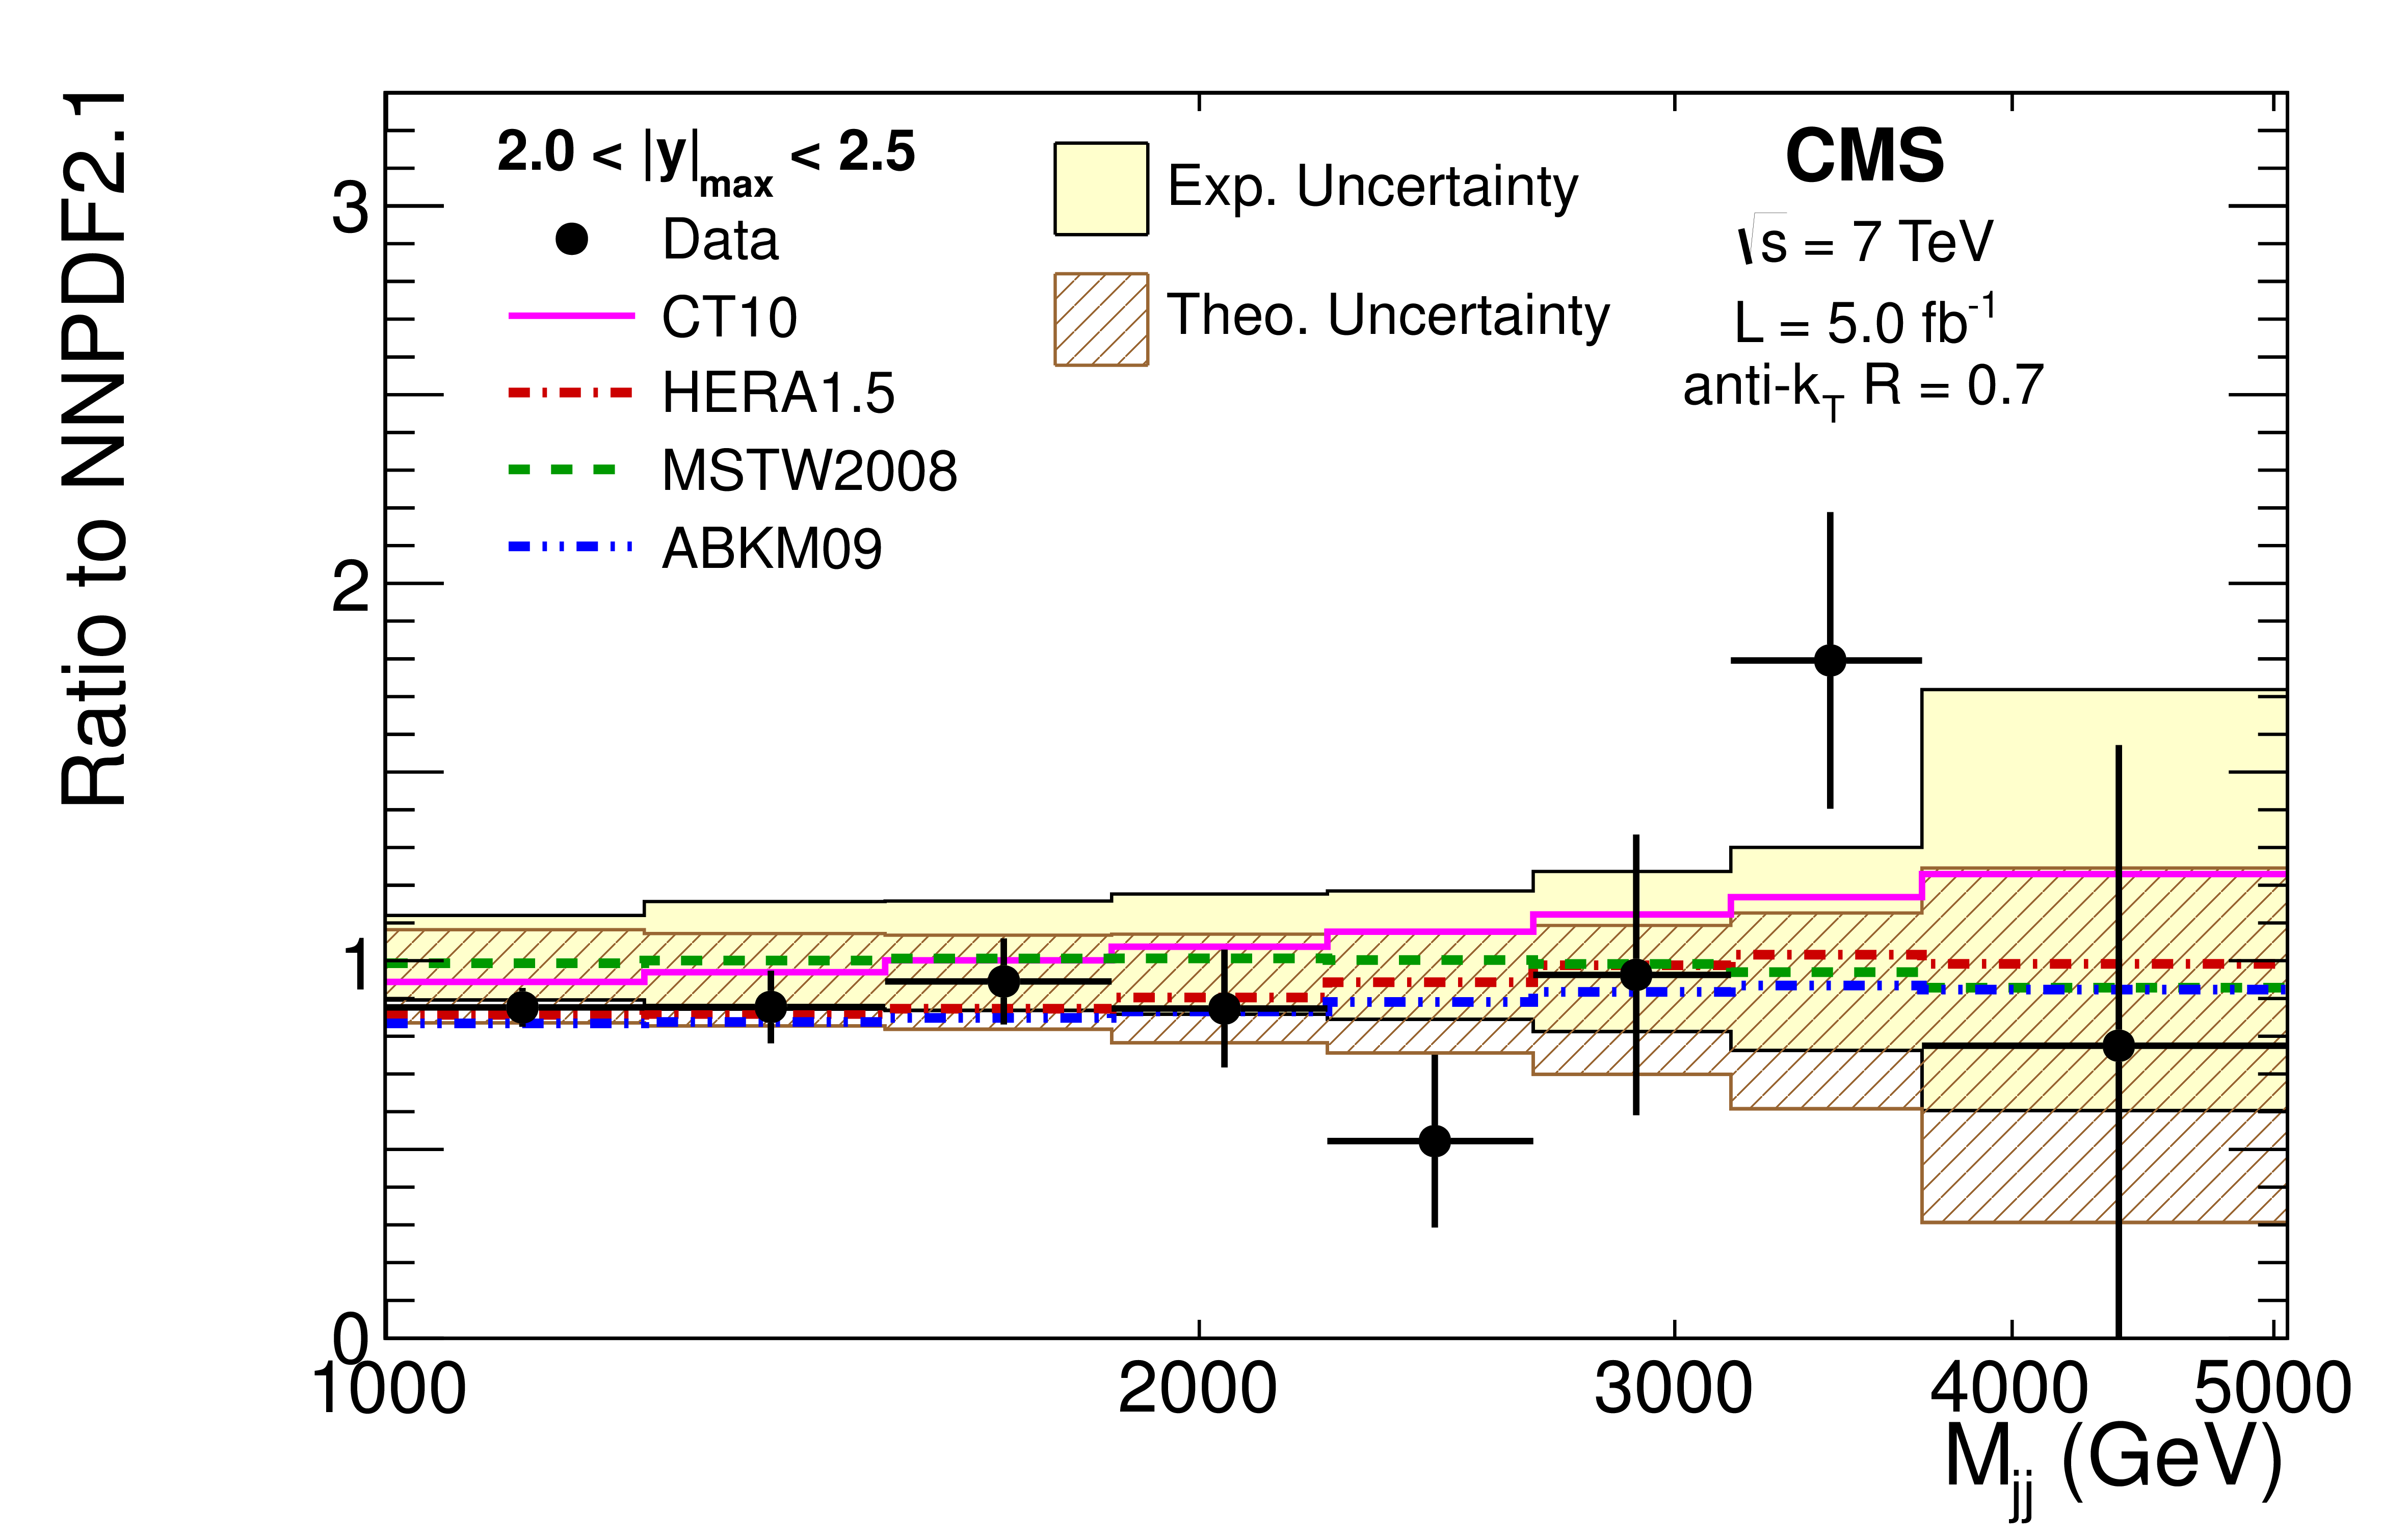
Figure 9-a:
Ratio of inclusive jet (a) and dijet (b) cross sections to the theoretical prediction using the central value of the NNPDF2.1 PDF set for the last two $|y|$ and $|y|_\text {max}$ bins respectively. The solid histograms show the ratio of the cross sections calculated with the other PDF sets to that calculated with NNPDF2.1. The experimental and theoretical systematic uncertainties are represented by the continuous and hatched bands, respectively. |
png pdf |
Figure 9-b:
Ratio of inclusive jet (a) and dijet (b) cross sections to the theoretical prediction using the central value of the NNPDF2.1 PDF set for the last two $|y|$ and $|y|_\text {max}$ bins respectively. The solid histograms show the ratio of the cross sections calculated with the other PDF sets to that calculated with NNPDF2.1. The experimental and theoretical systematic uncertainties are represented by the continuous and hatched bands, respectively. |
png pdf |
Figure 9-c:
Ratio of inclusive jet (a) and dijet (b) cross sections to the theoretical prediction using the central value of the NNPDF2.1 PDF set for the last two $|y|$ and $|y|_\text {max}$ bins respectively. The solid histograms show the ratio of the cross sections calculated with the other PDF sets to that calculated with NNPDF2.1. The experimental and theoretical systematic uncertainties are represented by the continuous and hatched bands, respectively. |
png pdf |
Figure 9-d:
Ratio of inclusive jet (a) and dijet (b) cross sections to the theoretical prediction using the central value of the NNPDF2.1 PDF set for the last two $|y|$ and $|y|_\text {max}$ bins respectively. The solid histograms show the ratio of the cross sections calculated with the other PDF sets to that calculated with NNPDF2.1. The experimental and theoretical systematic uncertainties are represented by the continuous and hatched bands, respectively. |
|
|
Compact Muon Solenoid LHC, CERN |
|

|

|

|

|

|