

Compact Muon Solenoid
LHC, CERN
| CMS-SMP-12-016 ; CERN-PH-EP-2015-029 | ||
| Measurements of the ZZ production cross sections in the $ 2 \ell 2 \nu$ channel in proton-proton collisions at $\sqrt{s} =$ 7 and 8 TeV and combined constraints on triple gauge couplings | ||
| CMS Collaboration | ||
| 18 March 2015 | ||
| Eur. Phys. J. C 75 (2015) 511 | ||
| Abstract: Measurements of the ZZ production cross sections in proton-proton collisions at center-of-mass energies of 7 and 8 TeV are presented. Candidate events for the leptonic decay mode $ \mathrm{ZZ} \to 2 \ell 2 \nu $, where $ \ell $ denotes an electron or a muon, are reconstructed and selected from data corresponding to an integrated luminosity of 5.1 (19.6) fb$^{-1}$ at 7 (8) TeV collected with the CMS experiment. The measured cross sections, $ \sigma ( \mathrm{ pp \to ZZ } ) =$ 5.1$_{-1.4}^{+1.5}$ (stat) $_{-1.1}^{+1.4}$ (syst) $ \pm $ 0.1 (lumi) pb at 7 TeV, and 7.2$_{-0.8}^{+0.8}$ (stat) $_{-1.5}^{+1.9}$ (syst) $ \pm $ 0.2 (lumi) pb at 8 TeV, are in good agreement with the standard model predictions with next-to-leading-order accuracy. The selected data are analyzed to search for anomalous triple gauge couplings involving the ZZ final state. In the absence of any deviation from the standard model predictions, limits are set on the relevant parameters. These limits are then combined with the previously published CMS results for ZZ in 4$ \ell $ final states, yielding the most stringent constraints on the anomalous couplings. | ||
| Links: e-print arXiv:1503.05467 [hep-ex] (PDF) ; CDS record ; inSPIRE record ; Public twiki page ; HepData record ; CADI line (restricted) ; | ||
| Figures | |
png pdf |
Figure 1-a:
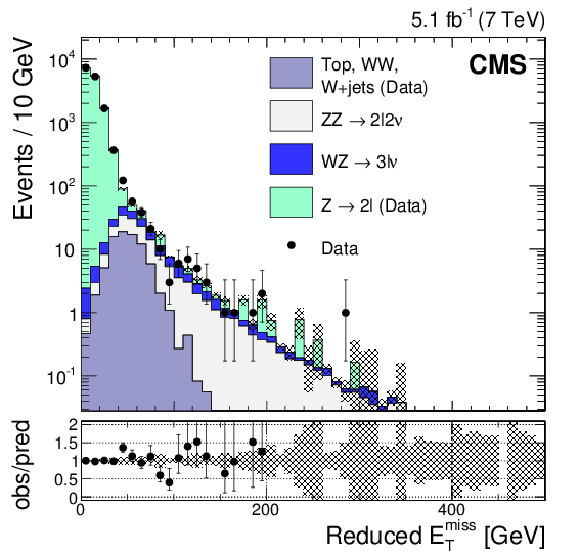
Reduced $ {E_{\mathrm {T}}^{\text {miss}}} $ spectrum in the inclusive $\ell \ell $ ($\ell = \mathrm{e} , \mu $) channel at 7 TeV (a) and 8 TeV (b), using the photon model to describe the DY contribution and NRB modeling for $\mathrm{W} \mathrm{W} $, $\mathrm{W} $ + jets, and top-quark production, after selections on the dilepton invariant mass and $ {p_{\mathrm {T}}} $, jet veto, b-tagged jet veto, third lepton veto, and $\Delta \phi $($\mathbf { {p_{\mathrm {T}}} ^{\text {miss}}}$,jet), as described in Section Selection. The gray error band represents the statistical uncertainty in the predicted yields. |

png pdf |
Figure 1-b:
Reduced $ {E_{\mathrm {T}}^{\text {miss}}} $ spectrum in the inclusive $\ell \ell $ ($\ell = \mathrm{e} , \mu $) channel at 7 TeV (a) and 8 TeV (b), using the photon model to describe the DY contribution and NRB modeling for $\mathrm{W} \mathrm{W} $, $\mathrm{W} $ + jets, and top-quark production, after selections on the dilepton invariant mass and $ {p_{\mathrm {T}}} $, jet veto, b-tagged jet veto, third lepton veto, and $\Delta \phi $($\mathbf { {p_{\mathrm {T}}} ^{\text {miss}}}$,jet), as described in Section Selection. The gray error band represents the statistical uncertainty in the predicted yields. |

png pdf |
Figure 2-a:
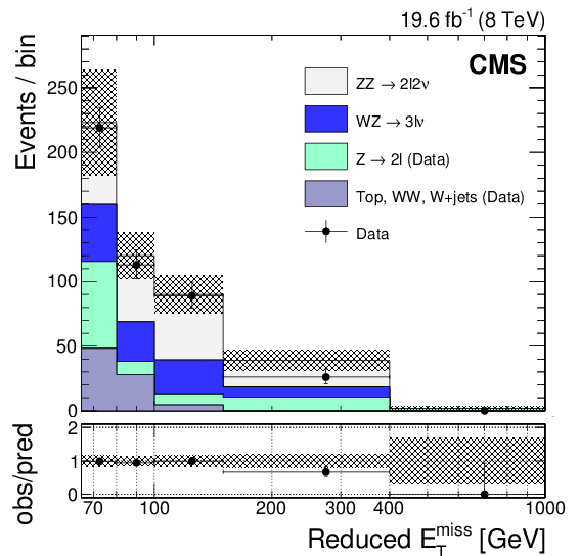
Reduced $ {E_{\mathrm {T}}^{\text {miss}}} $ distribution in $\ell \ell $ ($\ell = \mathrm{e} ,\mu $) channels, after the full selection, at 7 TeV (a) and 8 TeV (b). The DY and $\mathrm{W} \mathrm{W} $, $\mathrm{W} $+jets, and top backgrounds are estimated with data-driven methods. The gray error band includes statistical and systematic uncertainties in the predicted yields. In the bottom plots, vertical error bars and bands are relative to the total predicted yields. In all plots, horizontal error bars indicate the bin width. |
png pdf |
Figure 2-b:
Reduced $ {E_{\mathrm {T}}^{\text {miss}}} $ distribution in $\ell \ell $ ($\ell = \mathrm{e} ,\mu $) channels, after the full selection, at 7 TeV (a) and 8 TeV (b). The DY and $\mathrm{W} \mathrm{W} $, $\mathrm{W} $+jets, and top backgrounds are estimated with data-driven methods. The gray error band includes statistical and systematic uncertainties in the predicted yields. In the bottom plots, vertical error bars and bands are relative to the total predicted yields. In all plots, horizontal error bars indicate the bin width. |
png pdf |
Figure 3-a:
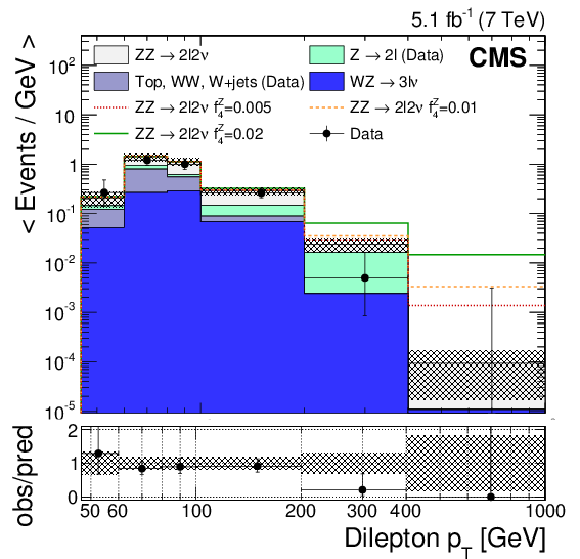
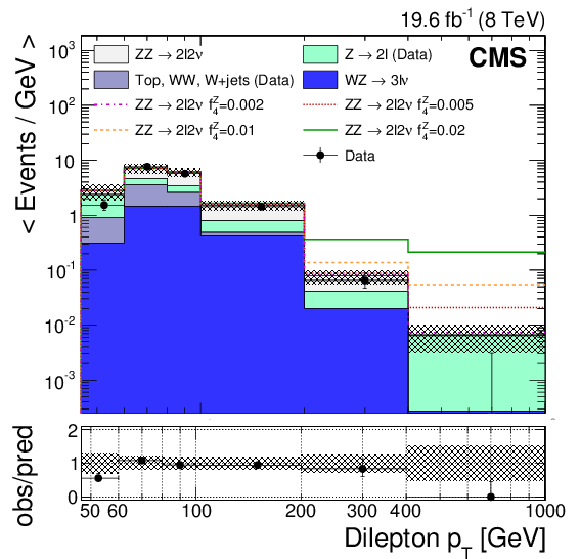
Dilepton ($\ell = \mathrm{e} , \mu $) transverse momentum distributions at 7 TeV (a) and 8 TeV (right). The DY and $\mathrm{W} \mathrm{W} $, $\mathrm{W} $+jets, and top backgrounds are estimated from control samples in data. The gray error band includes statistical and systematic uncertainties in the predicted yields. In the bottom plots, vertical error bars and bands are relative to the total predicted yields. In all plots, horizontal error bars indicate the bin width. |
png pdf |
Figure 3-b:
Dilepton ($\ell = \mathrm{e} , \mu $) transverse momentum distributions at 7 TeV (a) and 8 TeV (right). The DY and $\mathrm{W} \mathrm{W} $, $\mathrm{W} $+jets, and top backgrounds are estimated from control samples in data. The gray error band includes statistical and systematic uncertainties in the predicted yields. In the bottom plots, vertical error bars and bands are relative to the total predicted yields. In all plots, horizontal error bars indicate the bin width. |
| Tables | |

png pdf |
Table 1:
Summary of the optimal signal selection. |
png pdf |
Table 2:
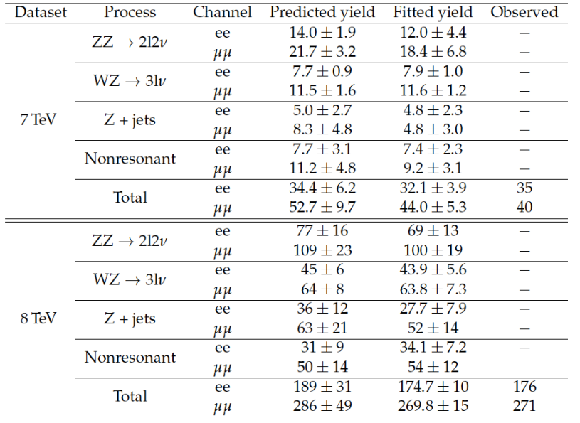
Predicted signal and background yields at 7 and 8 TeV , and corresponding values obtained from the combined maximum likelihood fit to the $\mathrm{e} \mathrm{e} $ and $\mu \mu $ channels. The uncertainties include both the statistical and systematic components. |

png pdf |
Table 3:
Cross sections (fb) for process $\mathrm{p} \mathrm{p} \to \mathrm{Z} \mathrm{Z} \to 2\ell 2\nu $ (where $\ell $ denotes a charged lepton of a given flavor, $\nu $ a neutrino of any flavor) at 7 and 8 TeV, with both $\mathrm{Z} $ boson masses in the range 60-120 GeV, measured in the $\mathrm{e} \mathrm{e} $ and $\mu \mu $ channels and the two channels combined. |

png pdf |
Table 4:
Systematic uncertainties in the cross sections due to each source separately, after the maximum likelihood fit to extract the $\mathrm{Z} \mathrm{Z} $ cross section. The uncertainties marked with an asterisk ($\ast $) are used as shape uncertainties in the fit. |

png pdf |
Table 5:
Summary of 95% CL intervals for the neutral ATGC coefficients, set by the $2\ell 2\nu $ final states using the 7 and 8 TeV CMS datasets. The expected 95% CL intervals obtained using the 7 and 8 TeV simulated samples are also shown. No form factor is used. |

png pdf |
Table 6:
Summary of 95% CL intervals for the neutral ATGC coefficients, set by the combined analysis of $4\ell $ and $2\ell 2\nu $ final states. The intervals obtained separately by the two analyses using the 7 and 8 TeV CMS data sets are shown, as well as their combination. The expected 95% CL intervals obtained using the 7 and 8 TeV simulated samples of both analyses are also shown. No form factor is used. |
| Summary |
|
We have measured the ZZ production cross section in the $2\ell2\nu$ channel in proton-proton collisions at center-of-mass energies of 7 and 8 TeV. The data samples selected for the study correspond to an integrated luminosity of 5.1 (19.6) fb$^{-1}$ at 7 (8) TeV. We have measured at 7 TeV, and at 8TeV, in agreement with theory calculations, 6.2$^{+0.3}_{-0.2}$ pb (7.6$^{+0.4}_{-0.3}$ pb) at 7 (8) TeV, which include NLO QCD corrections and NLO EW corrections. The selected data have also been analyzed to search for ATGCs involving the ZZ final state. In the absence of any observation of new physics, we have set the most stringent limits to date on the relevant ATGC parameters. In addition, by combining the selected data with the CMS data for the four-charged-lepton final state we have set even tighter constraints. |

|
Compact Muon Solenoid LHC, CERN |

|

|

|

|

|

|