

Compact Muon Solenoid
LHC, CERN
| CMS-SMP-12-017 ; CERN-PH-EP-2014-205 | ||
| Measurements of jet multiplicity and differential production cross sections of Z+jets events in proton-proton collisions at $\sqrt{s}$ = 7 TeV | ||
| CMS Collaboration | ||
| 13 August 2014 | ||
| Phys. Rev. D 91 (2015) 052008 | ||
| Abstract: Measurements of differential cross sections are presented for the production of a Z boson and at least one hadronic jet in proton-proton collisions at $\sqrt{s}$ = 7 TeV, recorded by the CMS detector, using a data sample corresponding to an integrated luminosity of 4.9 fb$^{-1}$. The jet multiplicity distribution is measured for up to six jets. The differential cross sections are measured as a function of jet transverse momentum and pseudorapidity for the four highest transverse momentum jets. The distribution of the scalar sum of jet transverse momenta is also measured as a function of the jet multiplicity. The measurements are compared with theoretical predictions at leading and next-to-leading order in perturbative QCD. | ||
| Links: e-print arXiv:1408.3104 [hep-ex] (PDF) ; CDS record ; inSPIRE record ; Public twiki page ; Rivet record ; HepData record ; CADI line (restricted) ; | ||
| Figures | |
png pdf |
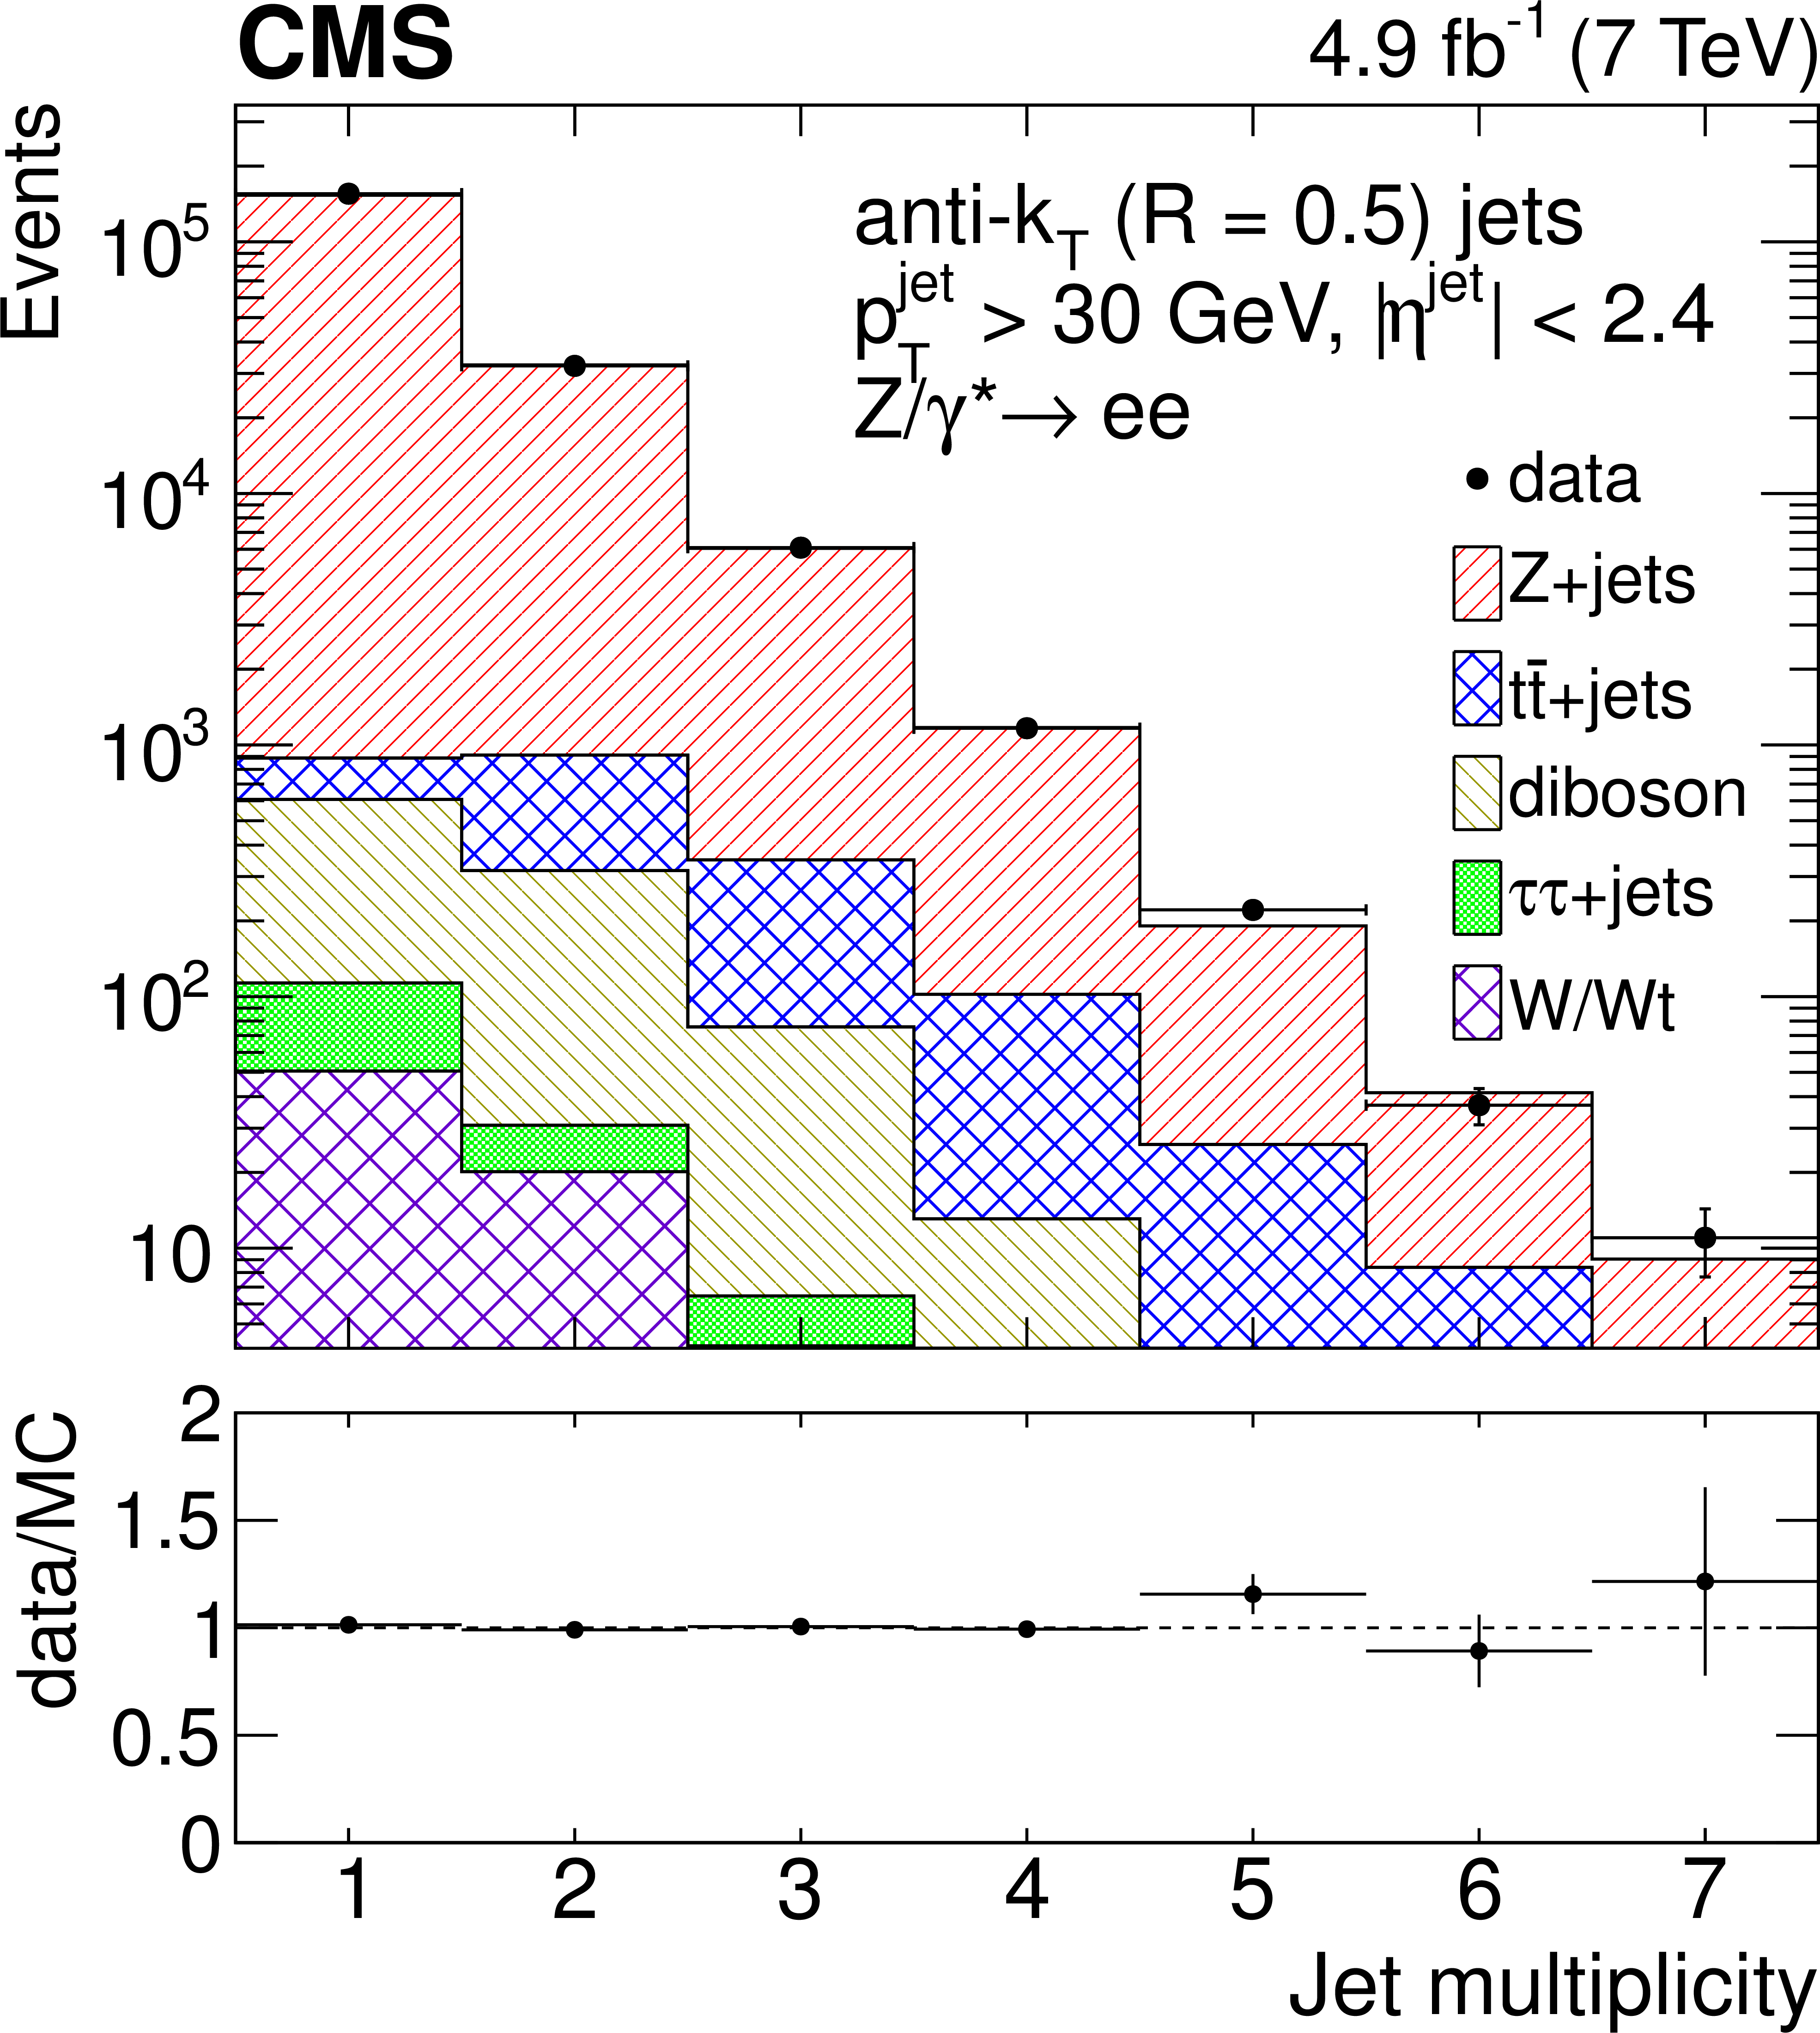
Figure 1-a:
Distributions of the exclusive jet multiplicity for the electron channel (a) and muon channel (b). Data are compared to the simulation, which is the sum of signal and background events. Scale factors have been used to correct simulation distributions for residual efficiency differences with respect to data. No unfolding procedure is applied. Only statistical uncertainties are shown. |
png pdf |
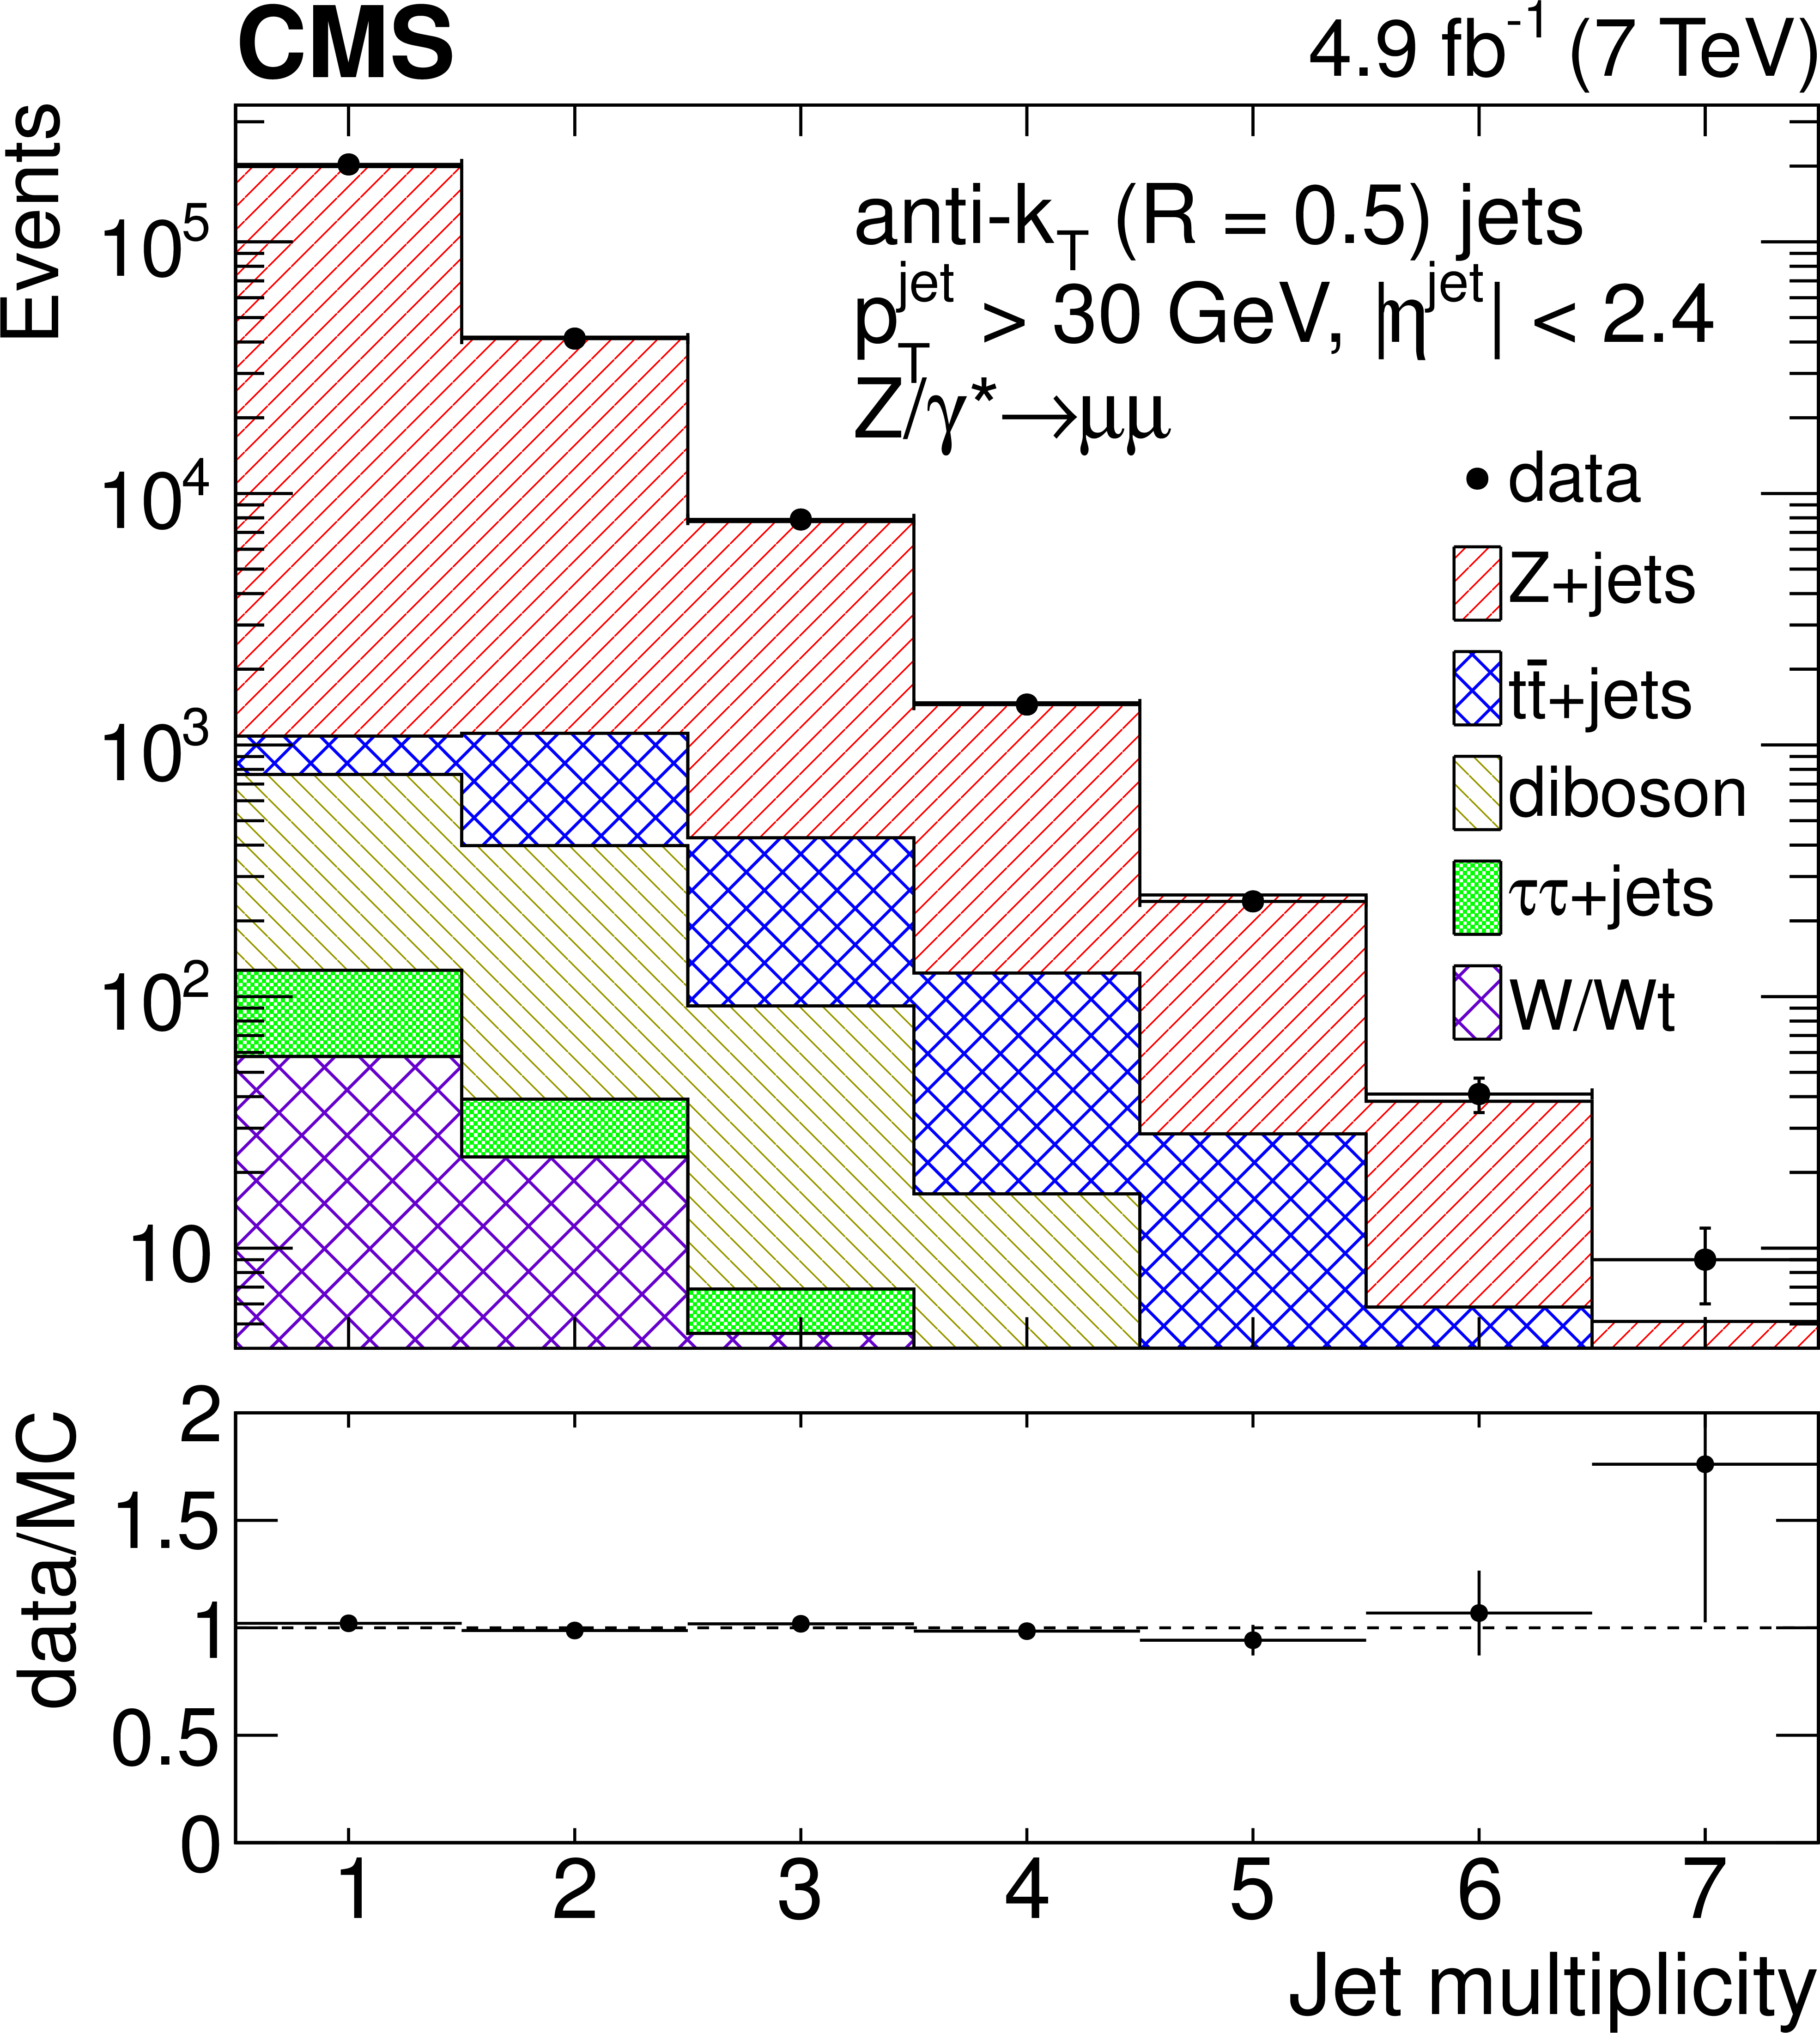
Figure 1-b:
Distributions of the exclusive jet multiplicity for the electron channel (a) and muon channel (b). Data are compared to the simulation, which is the sum of signal and background events. Scale factors have been used to correct simulation distributions for residual efficiency differences with respect to data. No unfolding procedure is applied. Only statistical uncertainties are shown. |
png pdf |
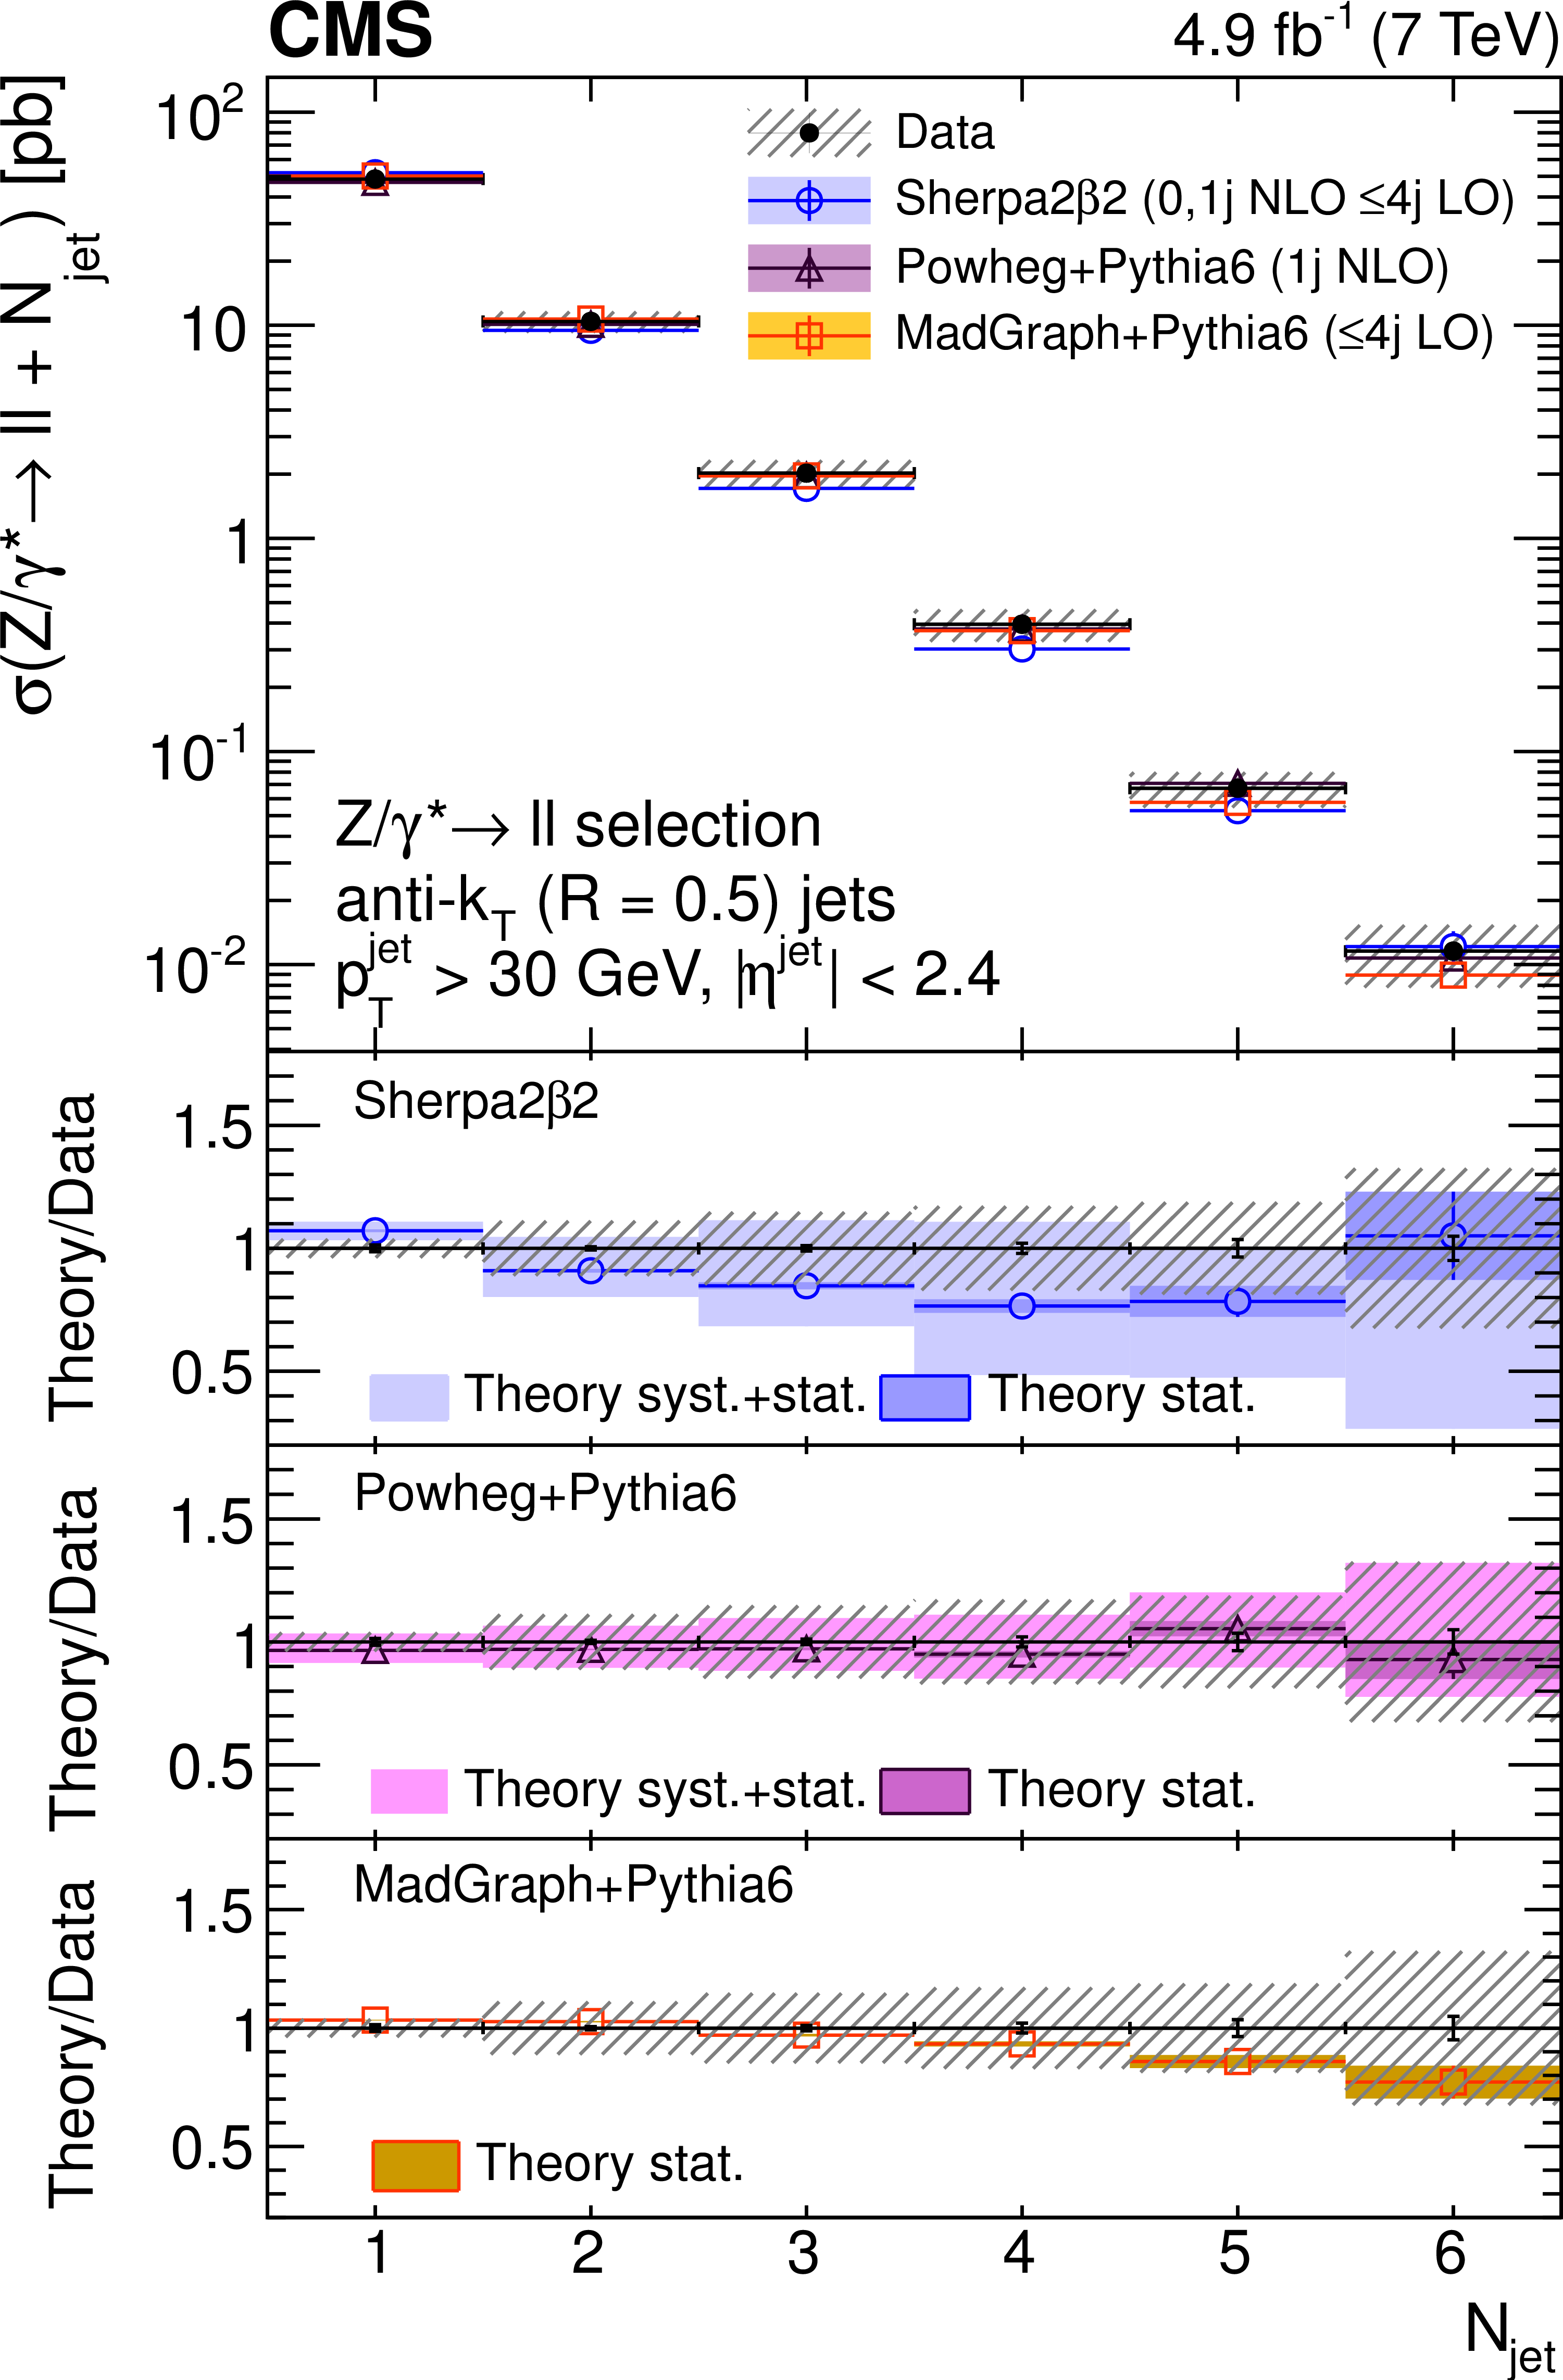
Figure 2-a:
Exclusive(a) and inclusive(b) jet multiplicity distributions, after the unfolding procedure, compared with SHERPA, POWHEG, and MADGRAPH predictions. Error bars around the experimental points represent the statistical uncertainty, while cross-hatched bands represent statistical plus systematic uncertainty. The bands around theory predictions correspond to the statistical uncertainty of the generated sample and, for NLO calculations, to its combination with the systematic uncertainty related to scale variations. |
png pdf |
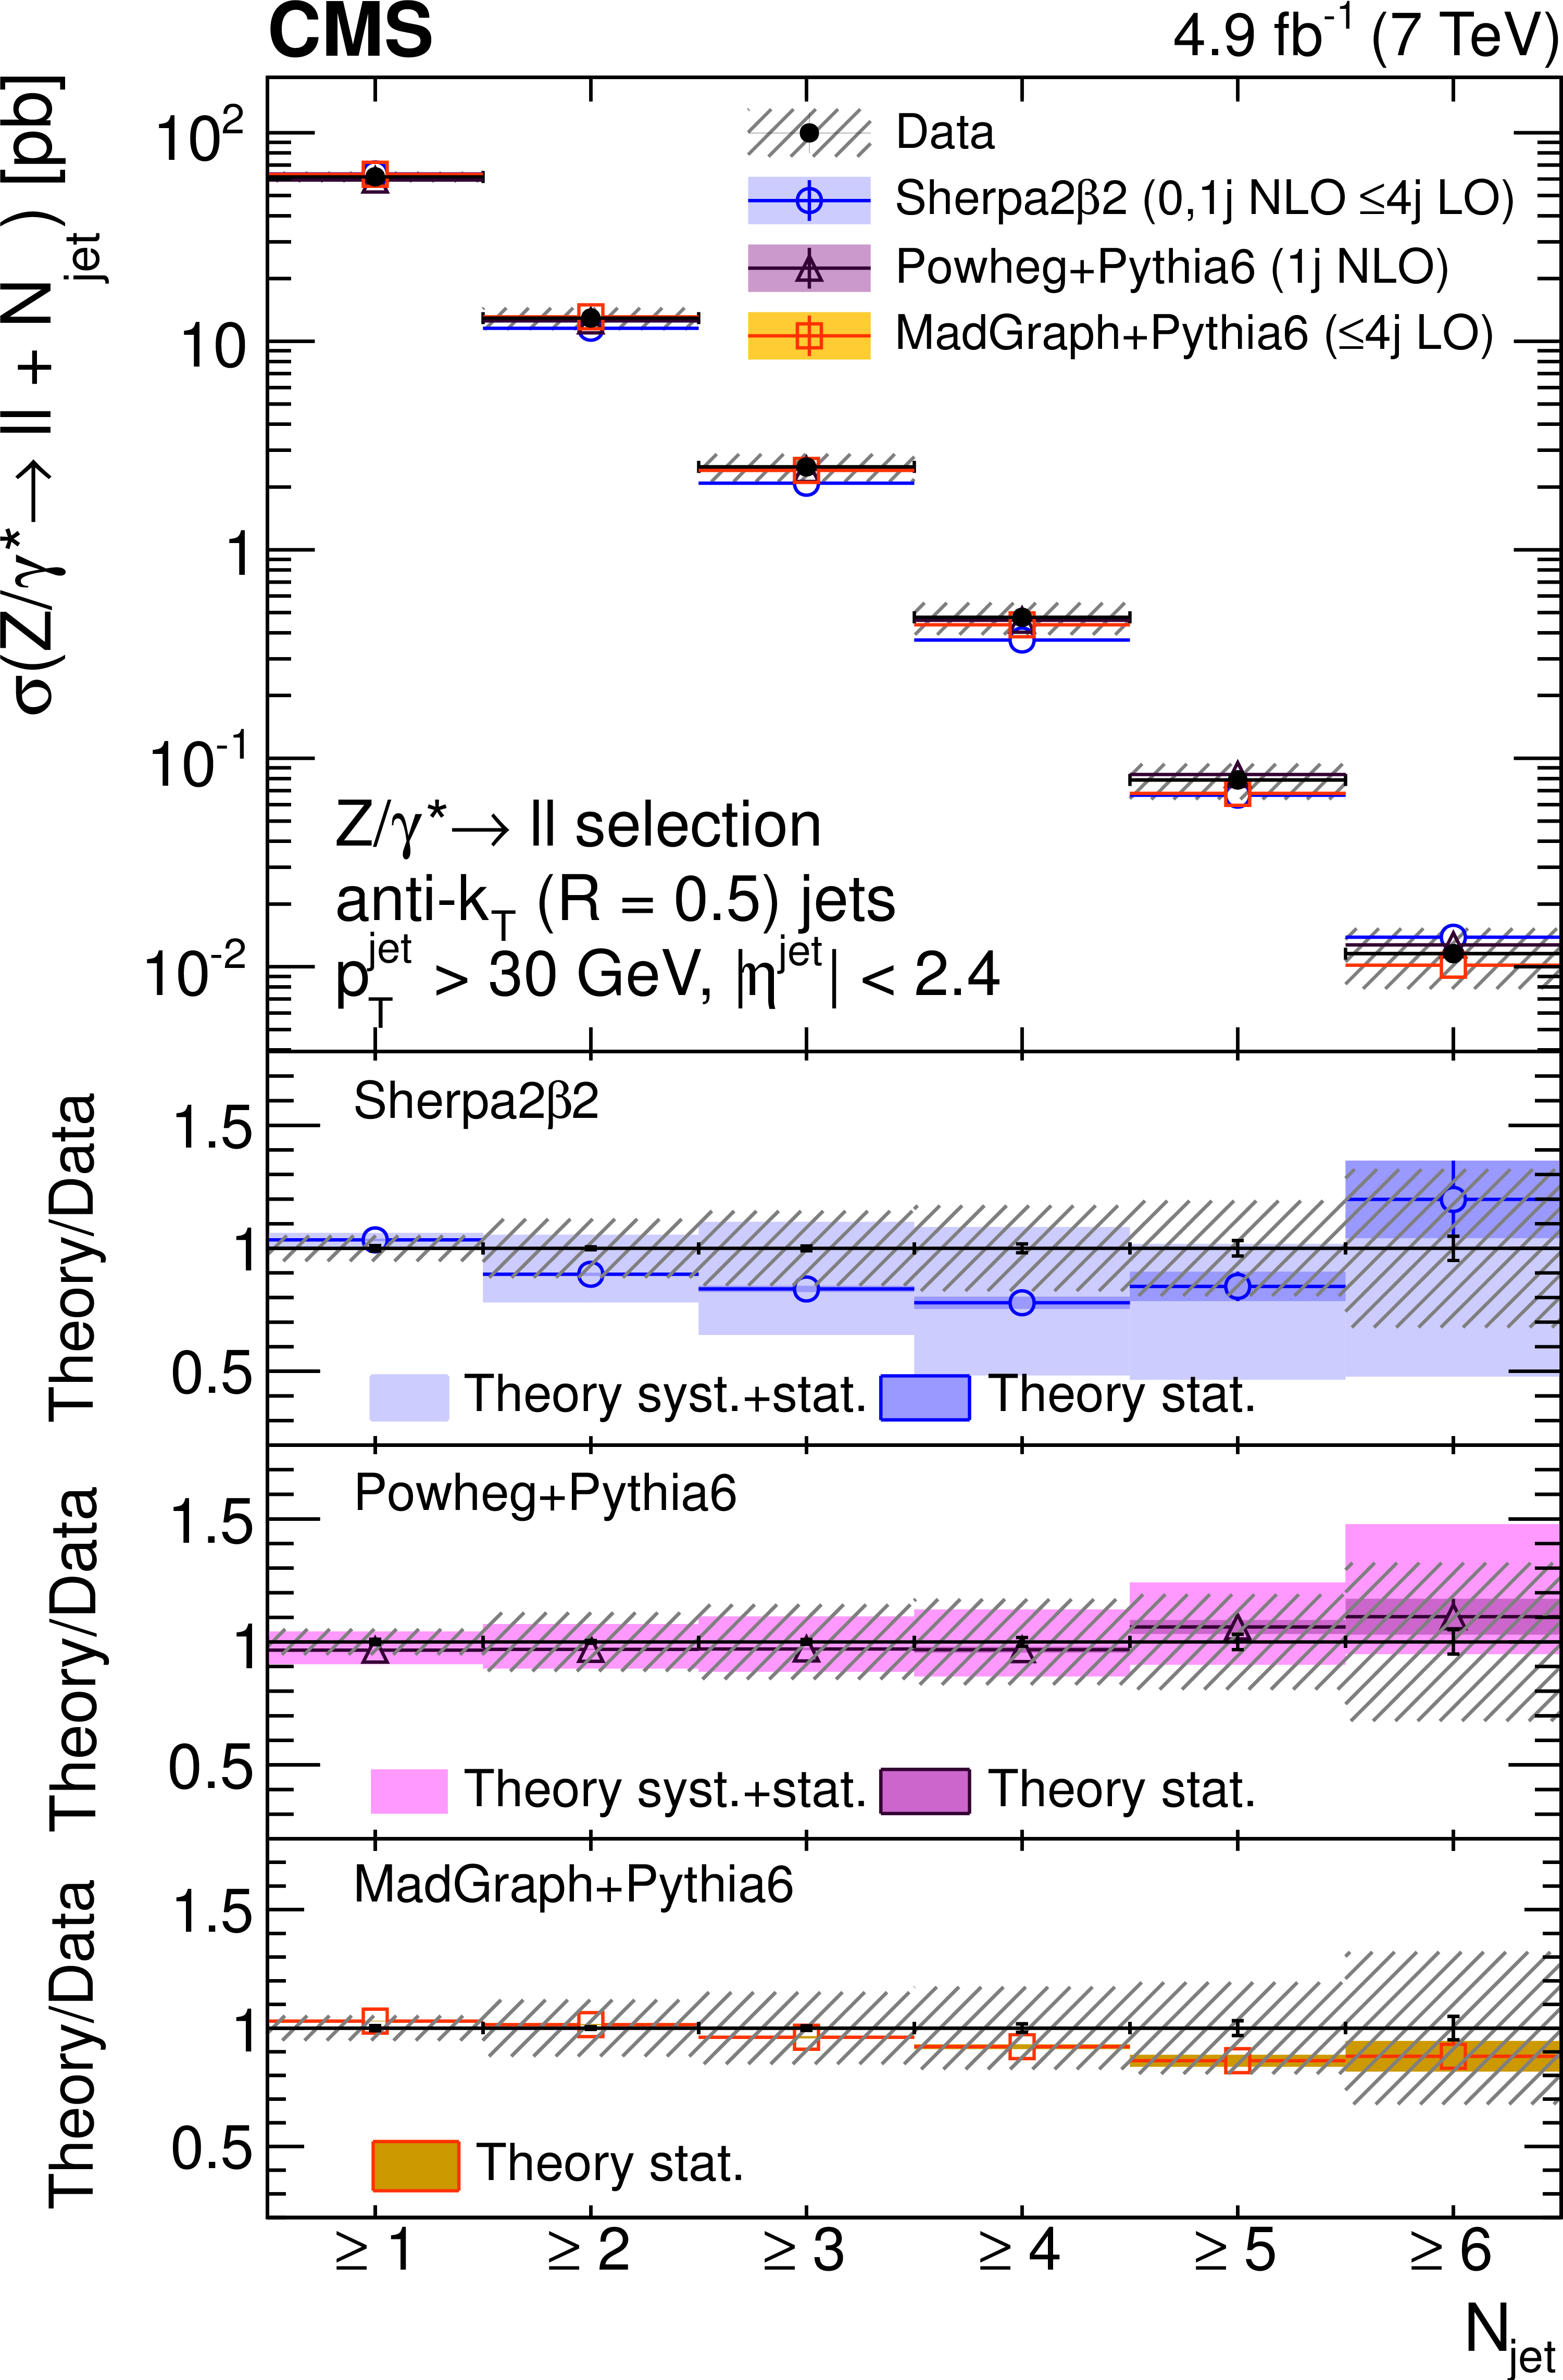
Figure 2-b:
Exclusive(a) and inclusive(b) jet multiplicity distributions, after the unfolding procedure, compared with SHERPA, POWHEG, and MADGRAPH predictions. Error bars around the experimental points represent the statistical uncertainty, while cross-hatched bands represent statistical plus systematic uncertainty. The bands around theory predictions correspond to the statistical uncertainty of the generated sample and, for NLO calculations, to its combination with the systematic uncertainty related to scale variations. |

png pdf |
Figure 3-a:
Unfolded differential cross section as a function of $ {p_{\mathrm {T}}} $ for the first (a), second (b), third (c), and fourth (d) highest $ {p_{\mathrm {T}}} $ jets, compared with SHERPA, POWHEG, and MADGRAPH predictions. Error bars around the experimental points represent the statistical uncertainty, while cross-hatched bands represent statistical plus systematic uncertainty. The bands around theory predictions correspond to the statistical uncertainty of the generated sample and, for NLO calculations, to its combination with systematic uncertainty related to scale variations. |
png pdf |
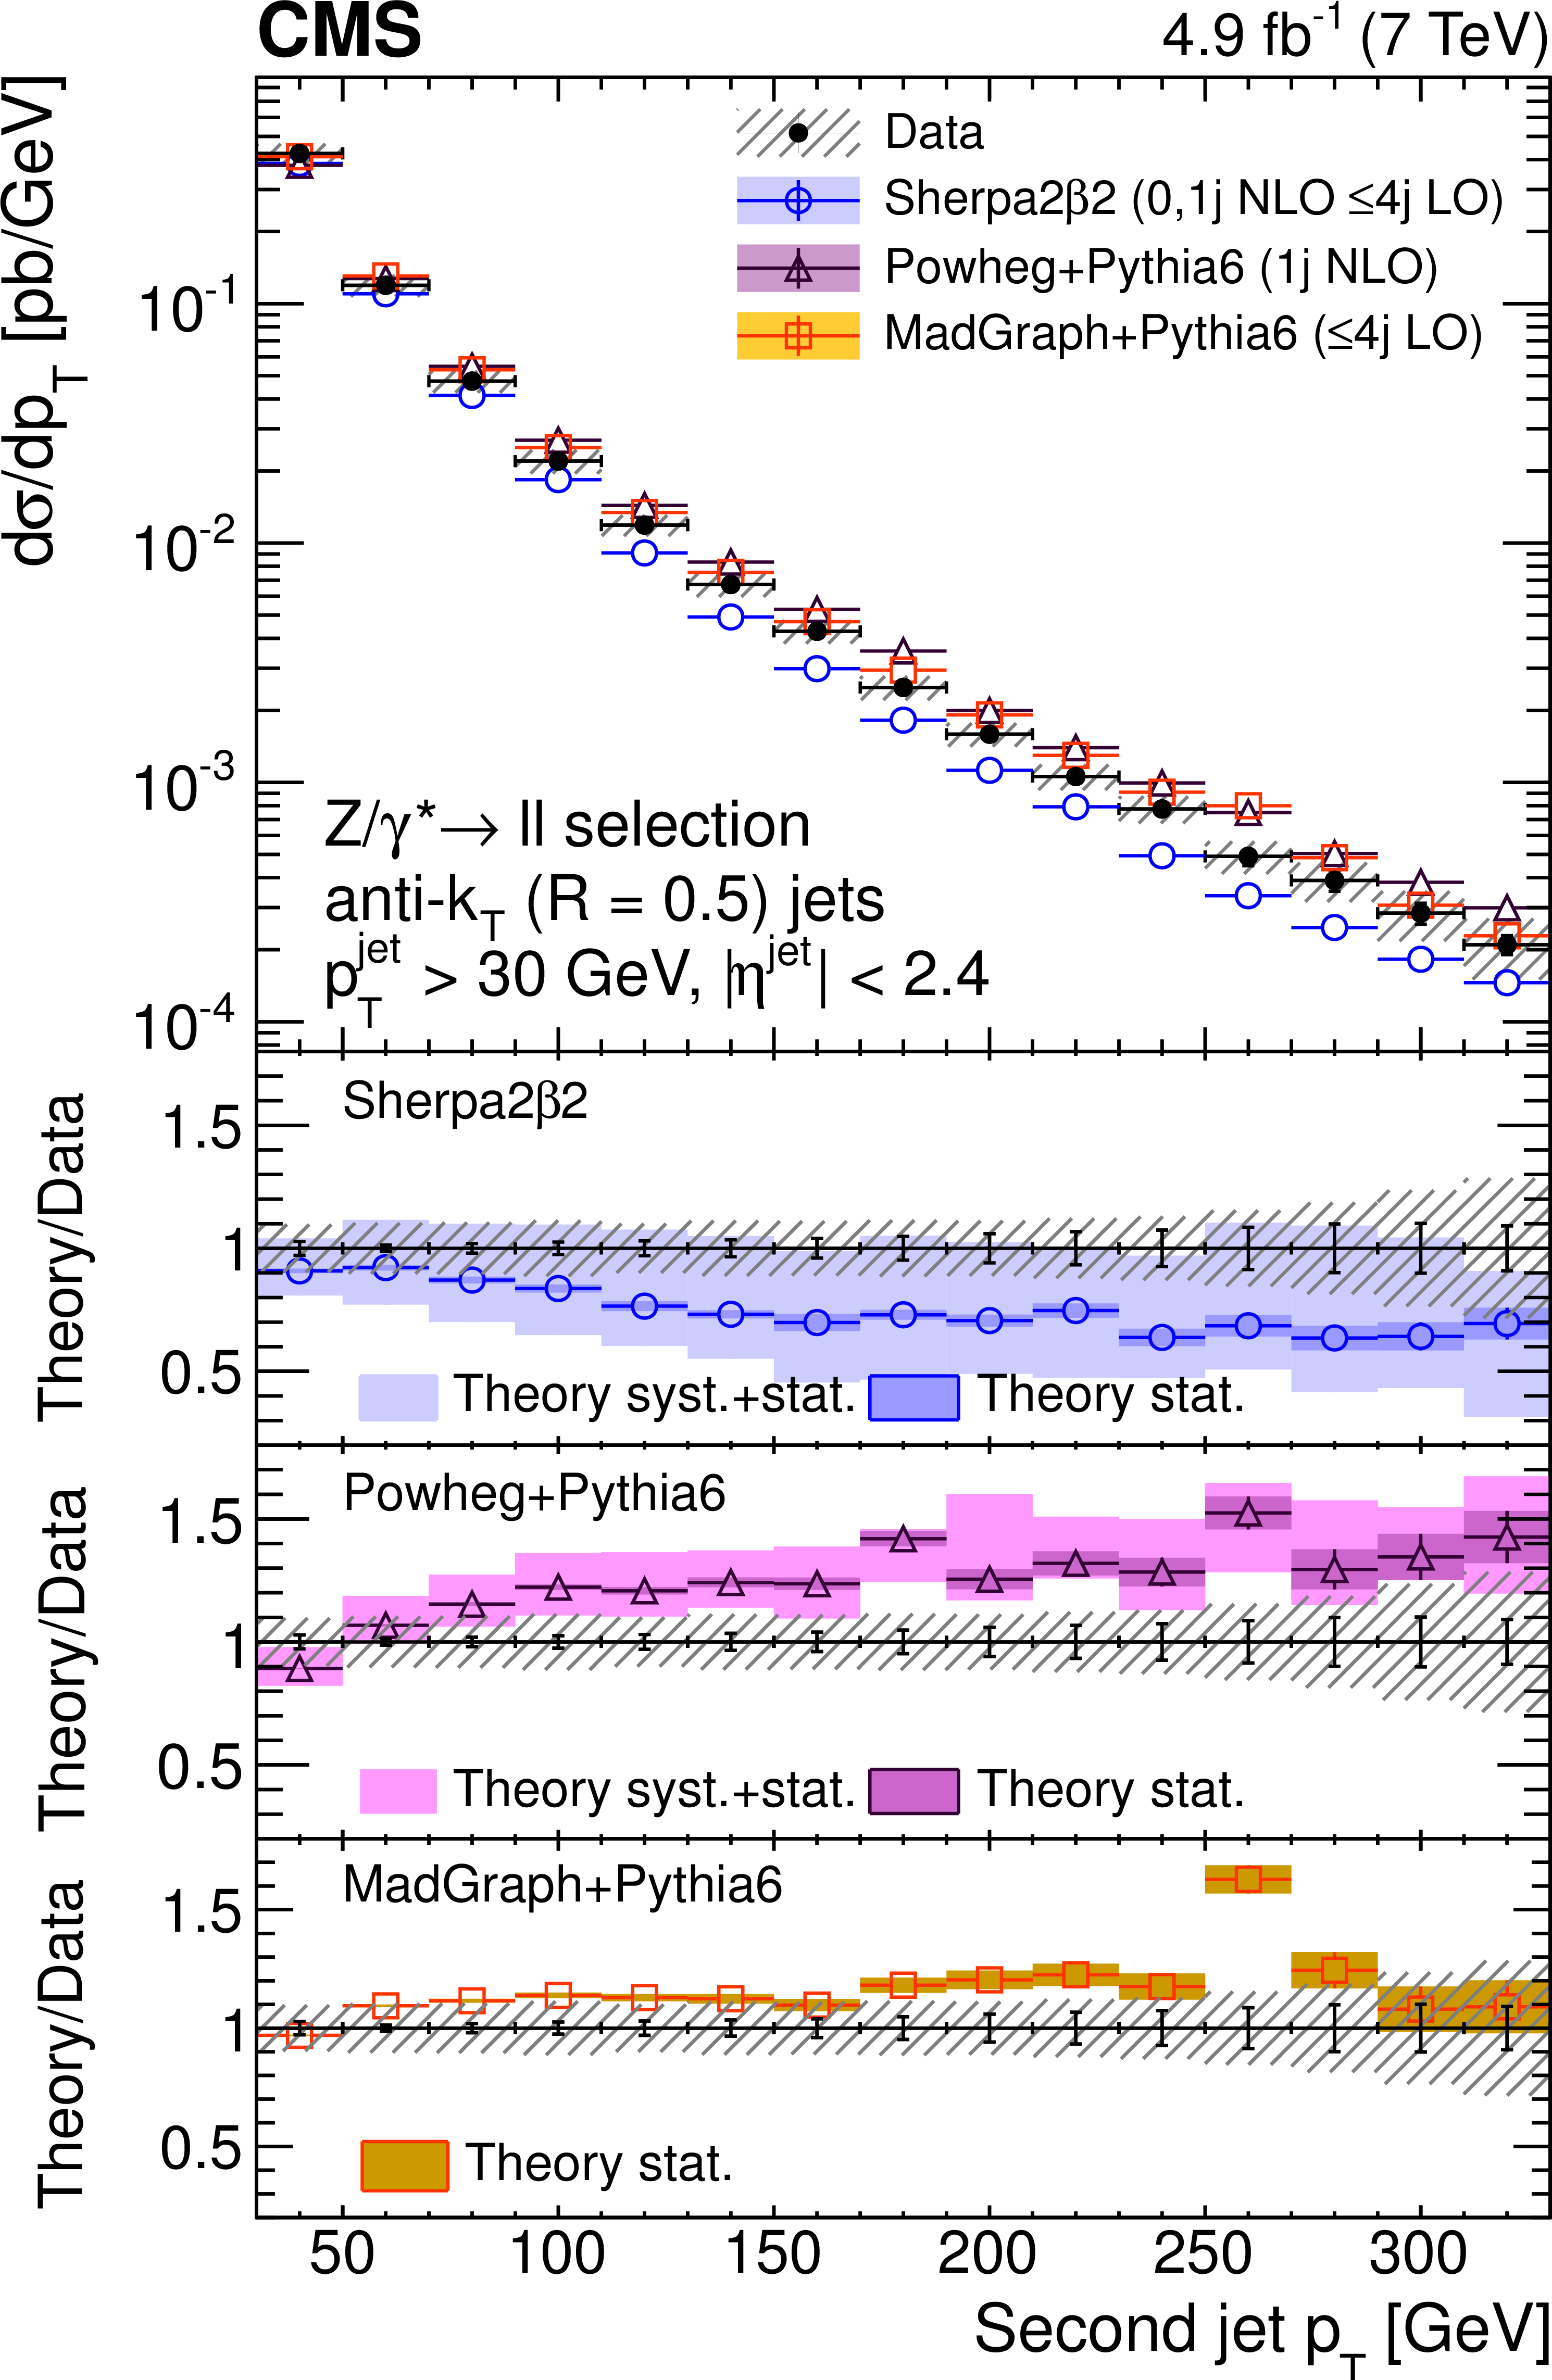
Figure 3-b:
Unfolded differential cross section as a function of $ {p_{\mathrm {T}}} $ for the first (a), second (b), third (c), and fourth (d) highest $ {p_{\mathrm {T}}} $ jets, compared with SHERPA, POWHEG, and MADGRAPH predictions. Error bars around the experimental points represent the statistical uncertainty, while cross-hatched bands represent statistical plus systematic uncertainty. The bands around theory predictions correspond to the statistical uncertainty of the generated sample and, for NLO calculations, to its combination with systematic uncertainty related to scale variations. |
png pdf |
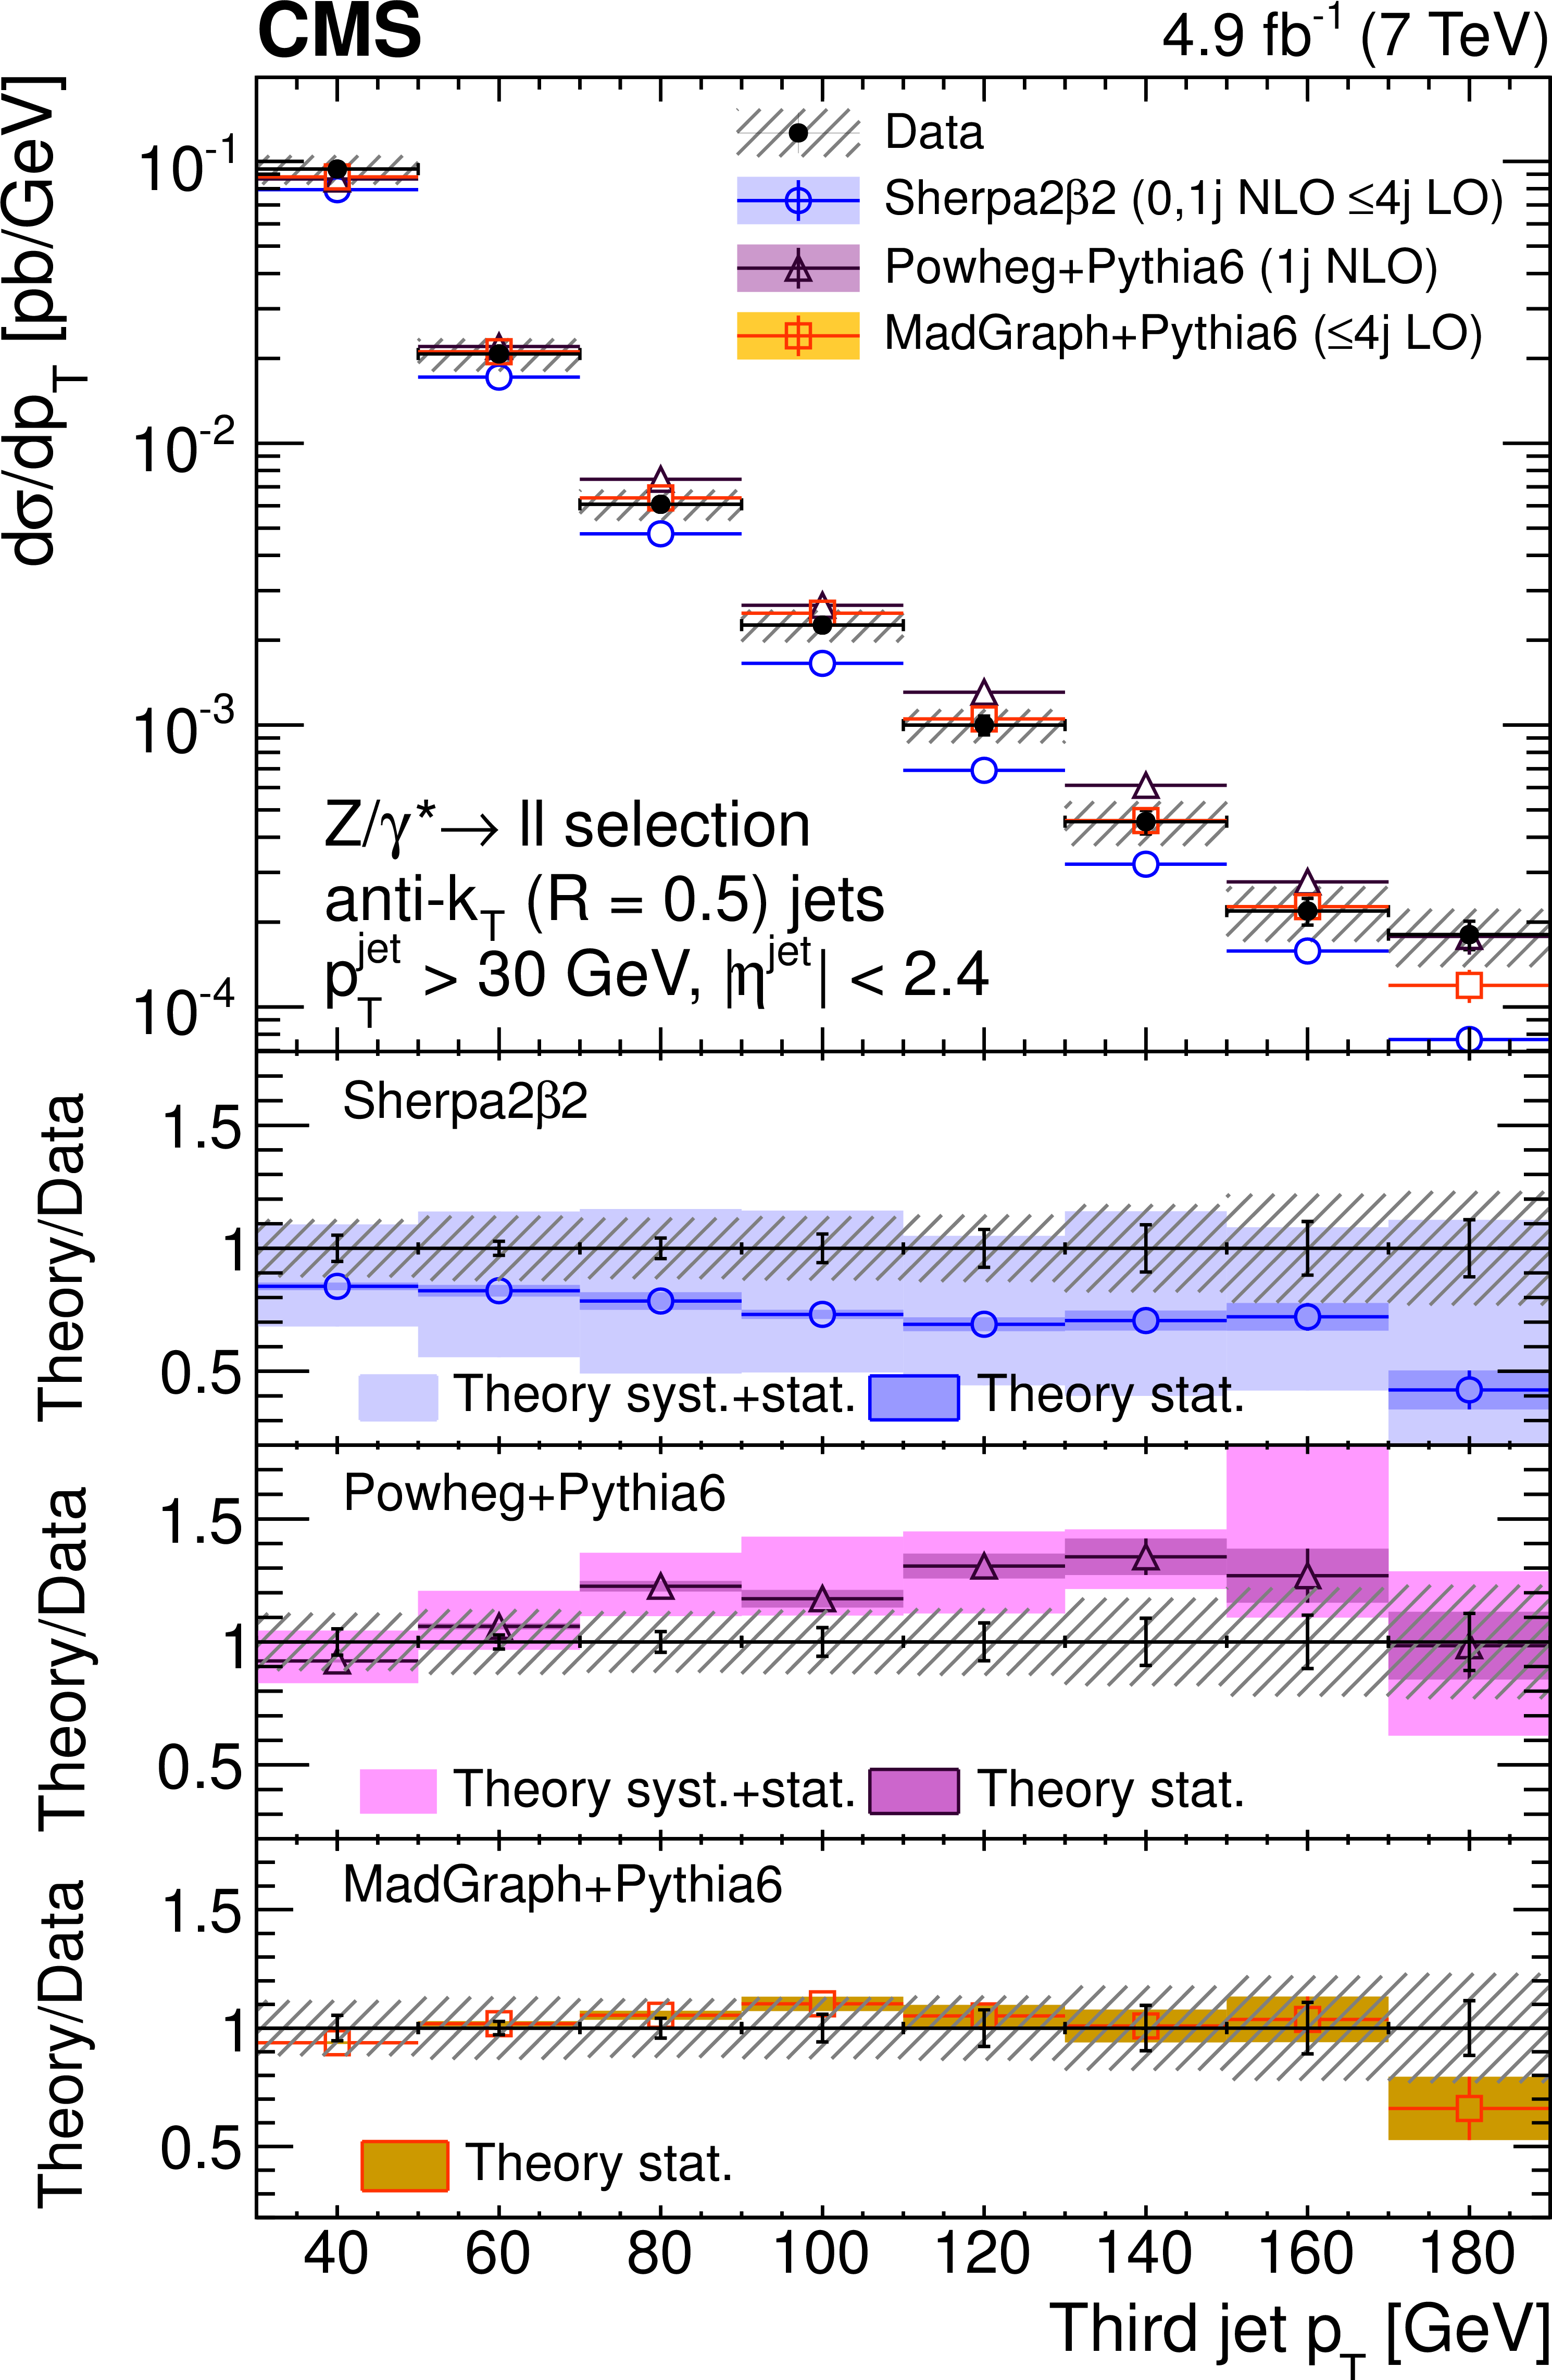
Figure 3-c:
Unfolded differential cross section as a function of $ {p_{\mathrm {T}}} $ for the first (a), second (b), third (c), and fourth (d) highest $ {p_{\mathrm {T}}} $ jets, compared with SHERPA, POWHEG, and MADGRAPH predictions. Error bars around the experimental points represent the statistical uncertainty, while cross-hatched bands represent statistical plus systematic uncertainty. The bands around theory predictions correspond to the statistical uncertainty of the generated sample and, for NLO calculations, to its combination with systematic uncertainty related to scale variations. |
png pdf |
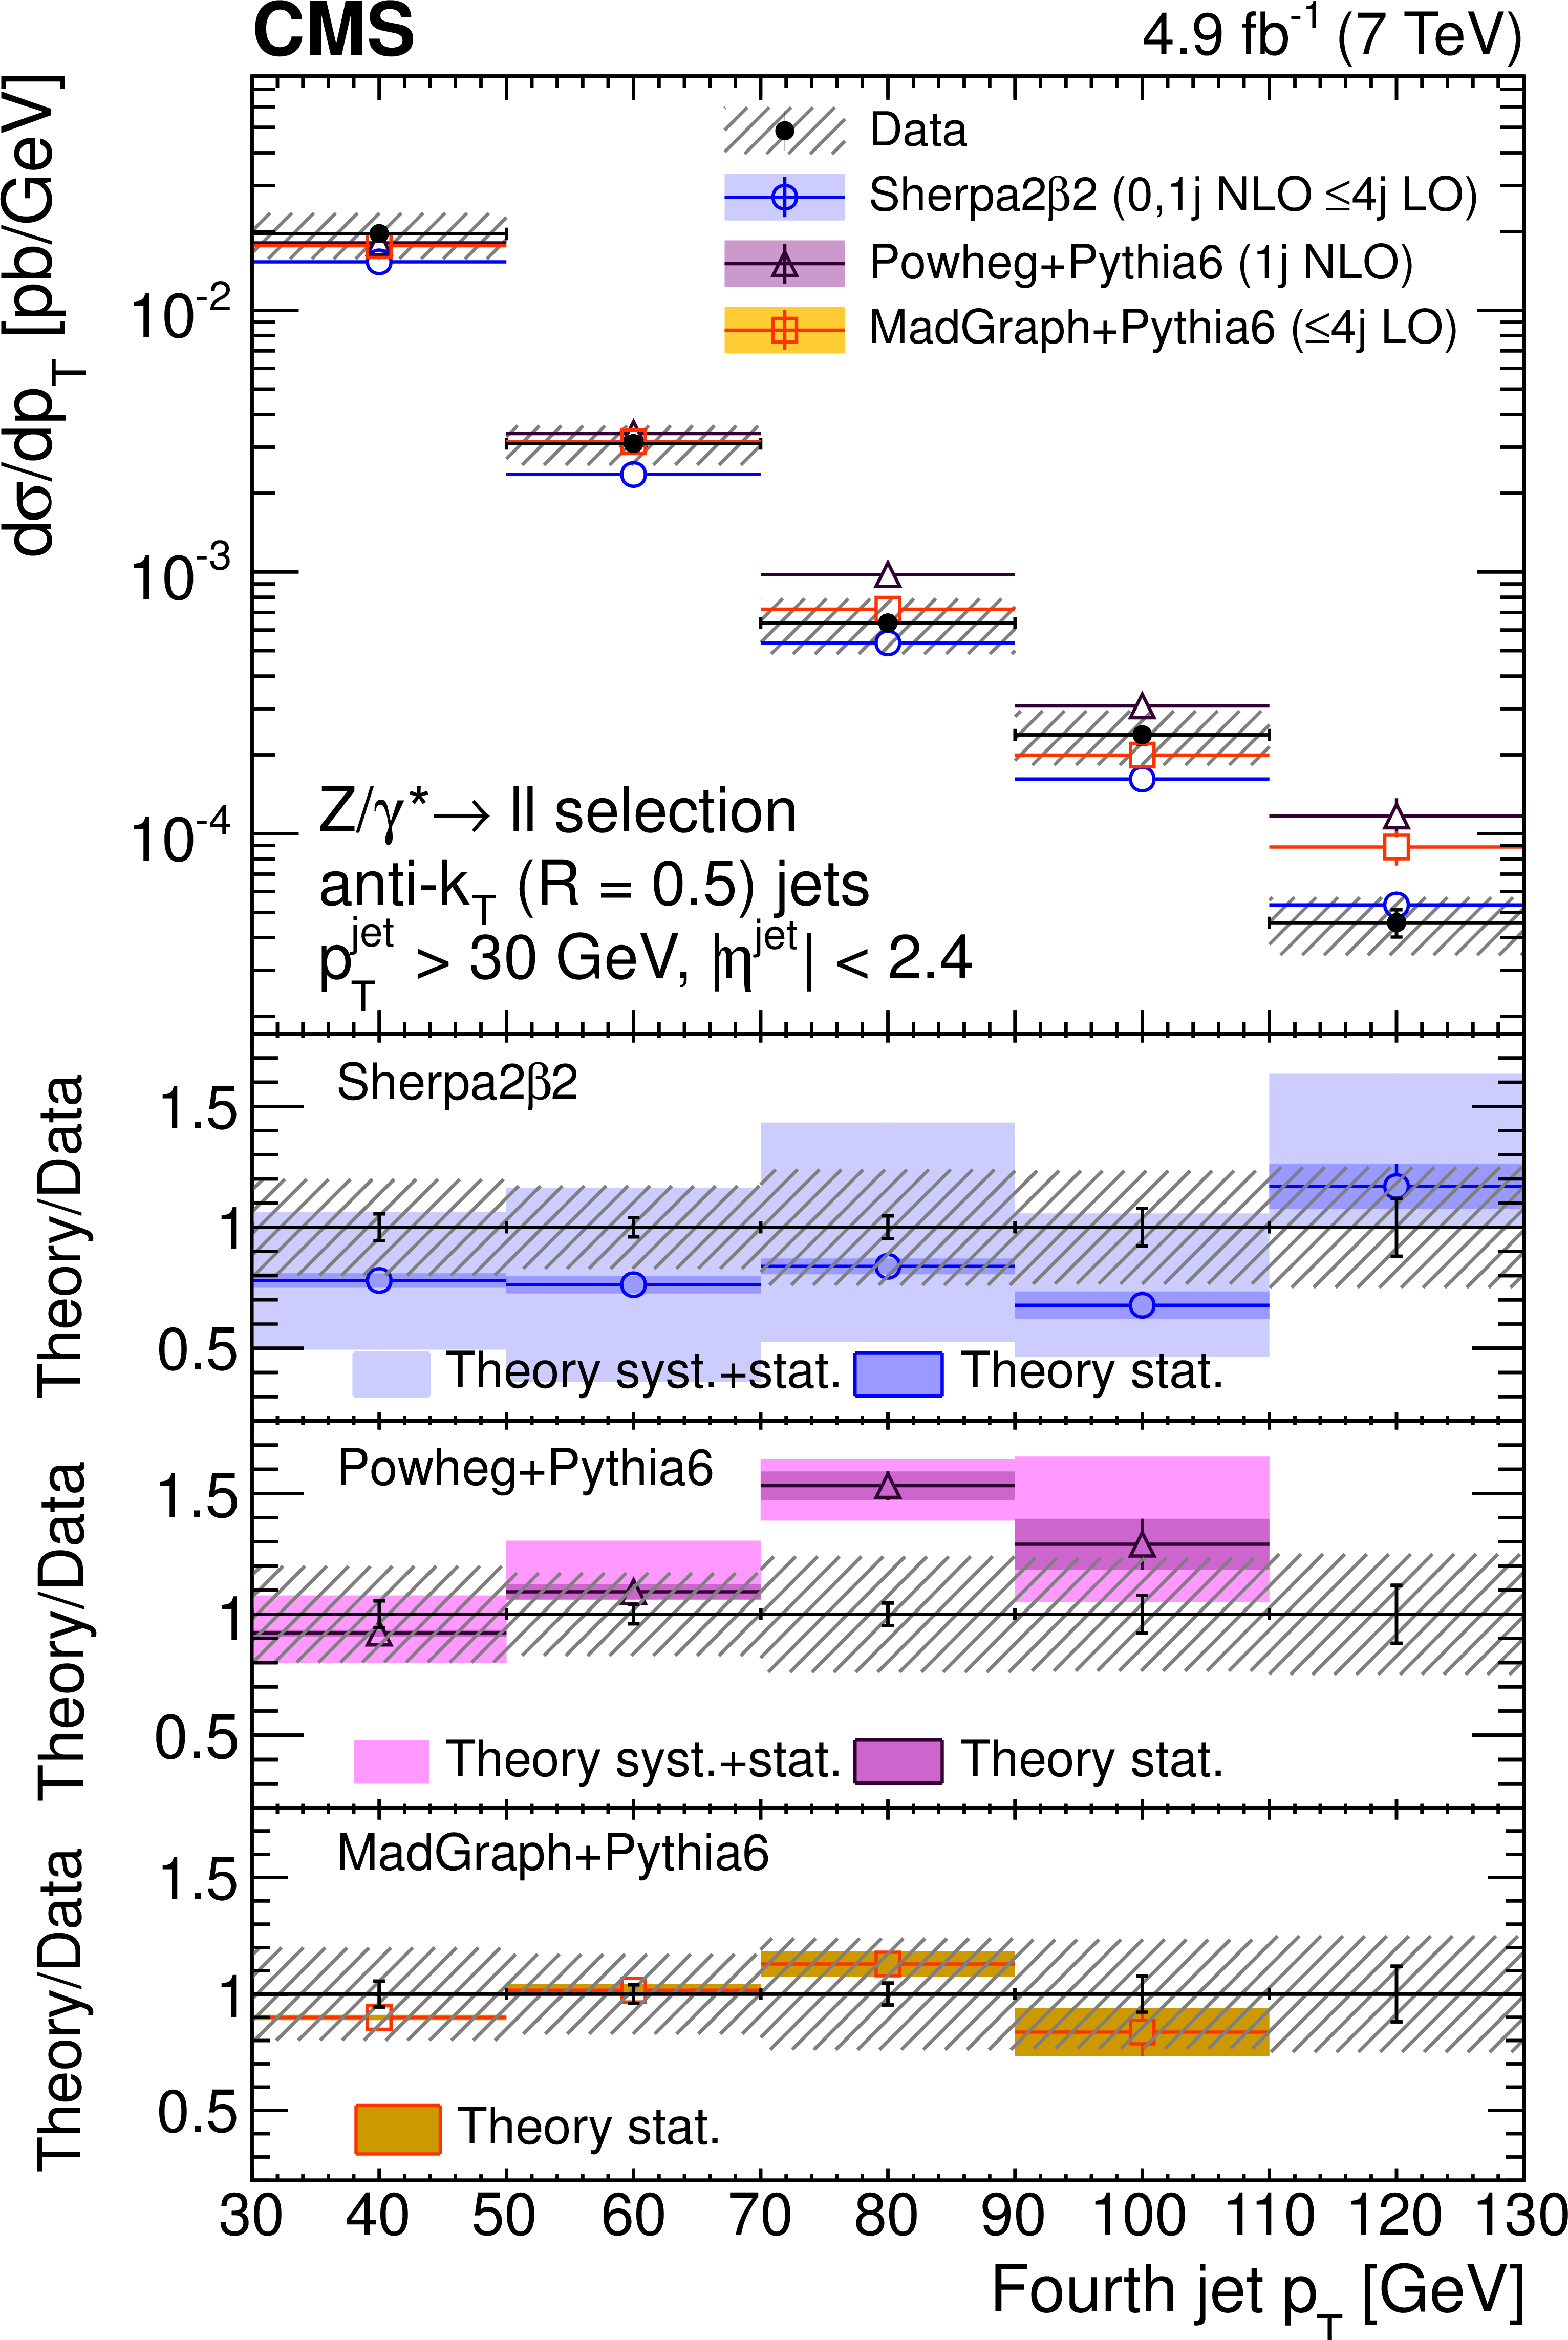
Figure 3-d:
Unfolded differential cross section as a function of $ {p_{\mathrm {T}}} $ for the first (a), second (b), third (c), and fourth (d) highest $ {p_{\mathrm {T}}} $ jets, compared with SHERPA, POWHEG, and MADGRAPH predictions. Error bars around the experimental points represent the statistical uncertainty, while cross-hatched bands represent statistical plus systematic uncertainty. The bands around theory predictions correspond to the statistical uncertainty of the generated sample and, for NLO calculations, to its combination with systematic uncertainty related to scale variations. |
png pdf |
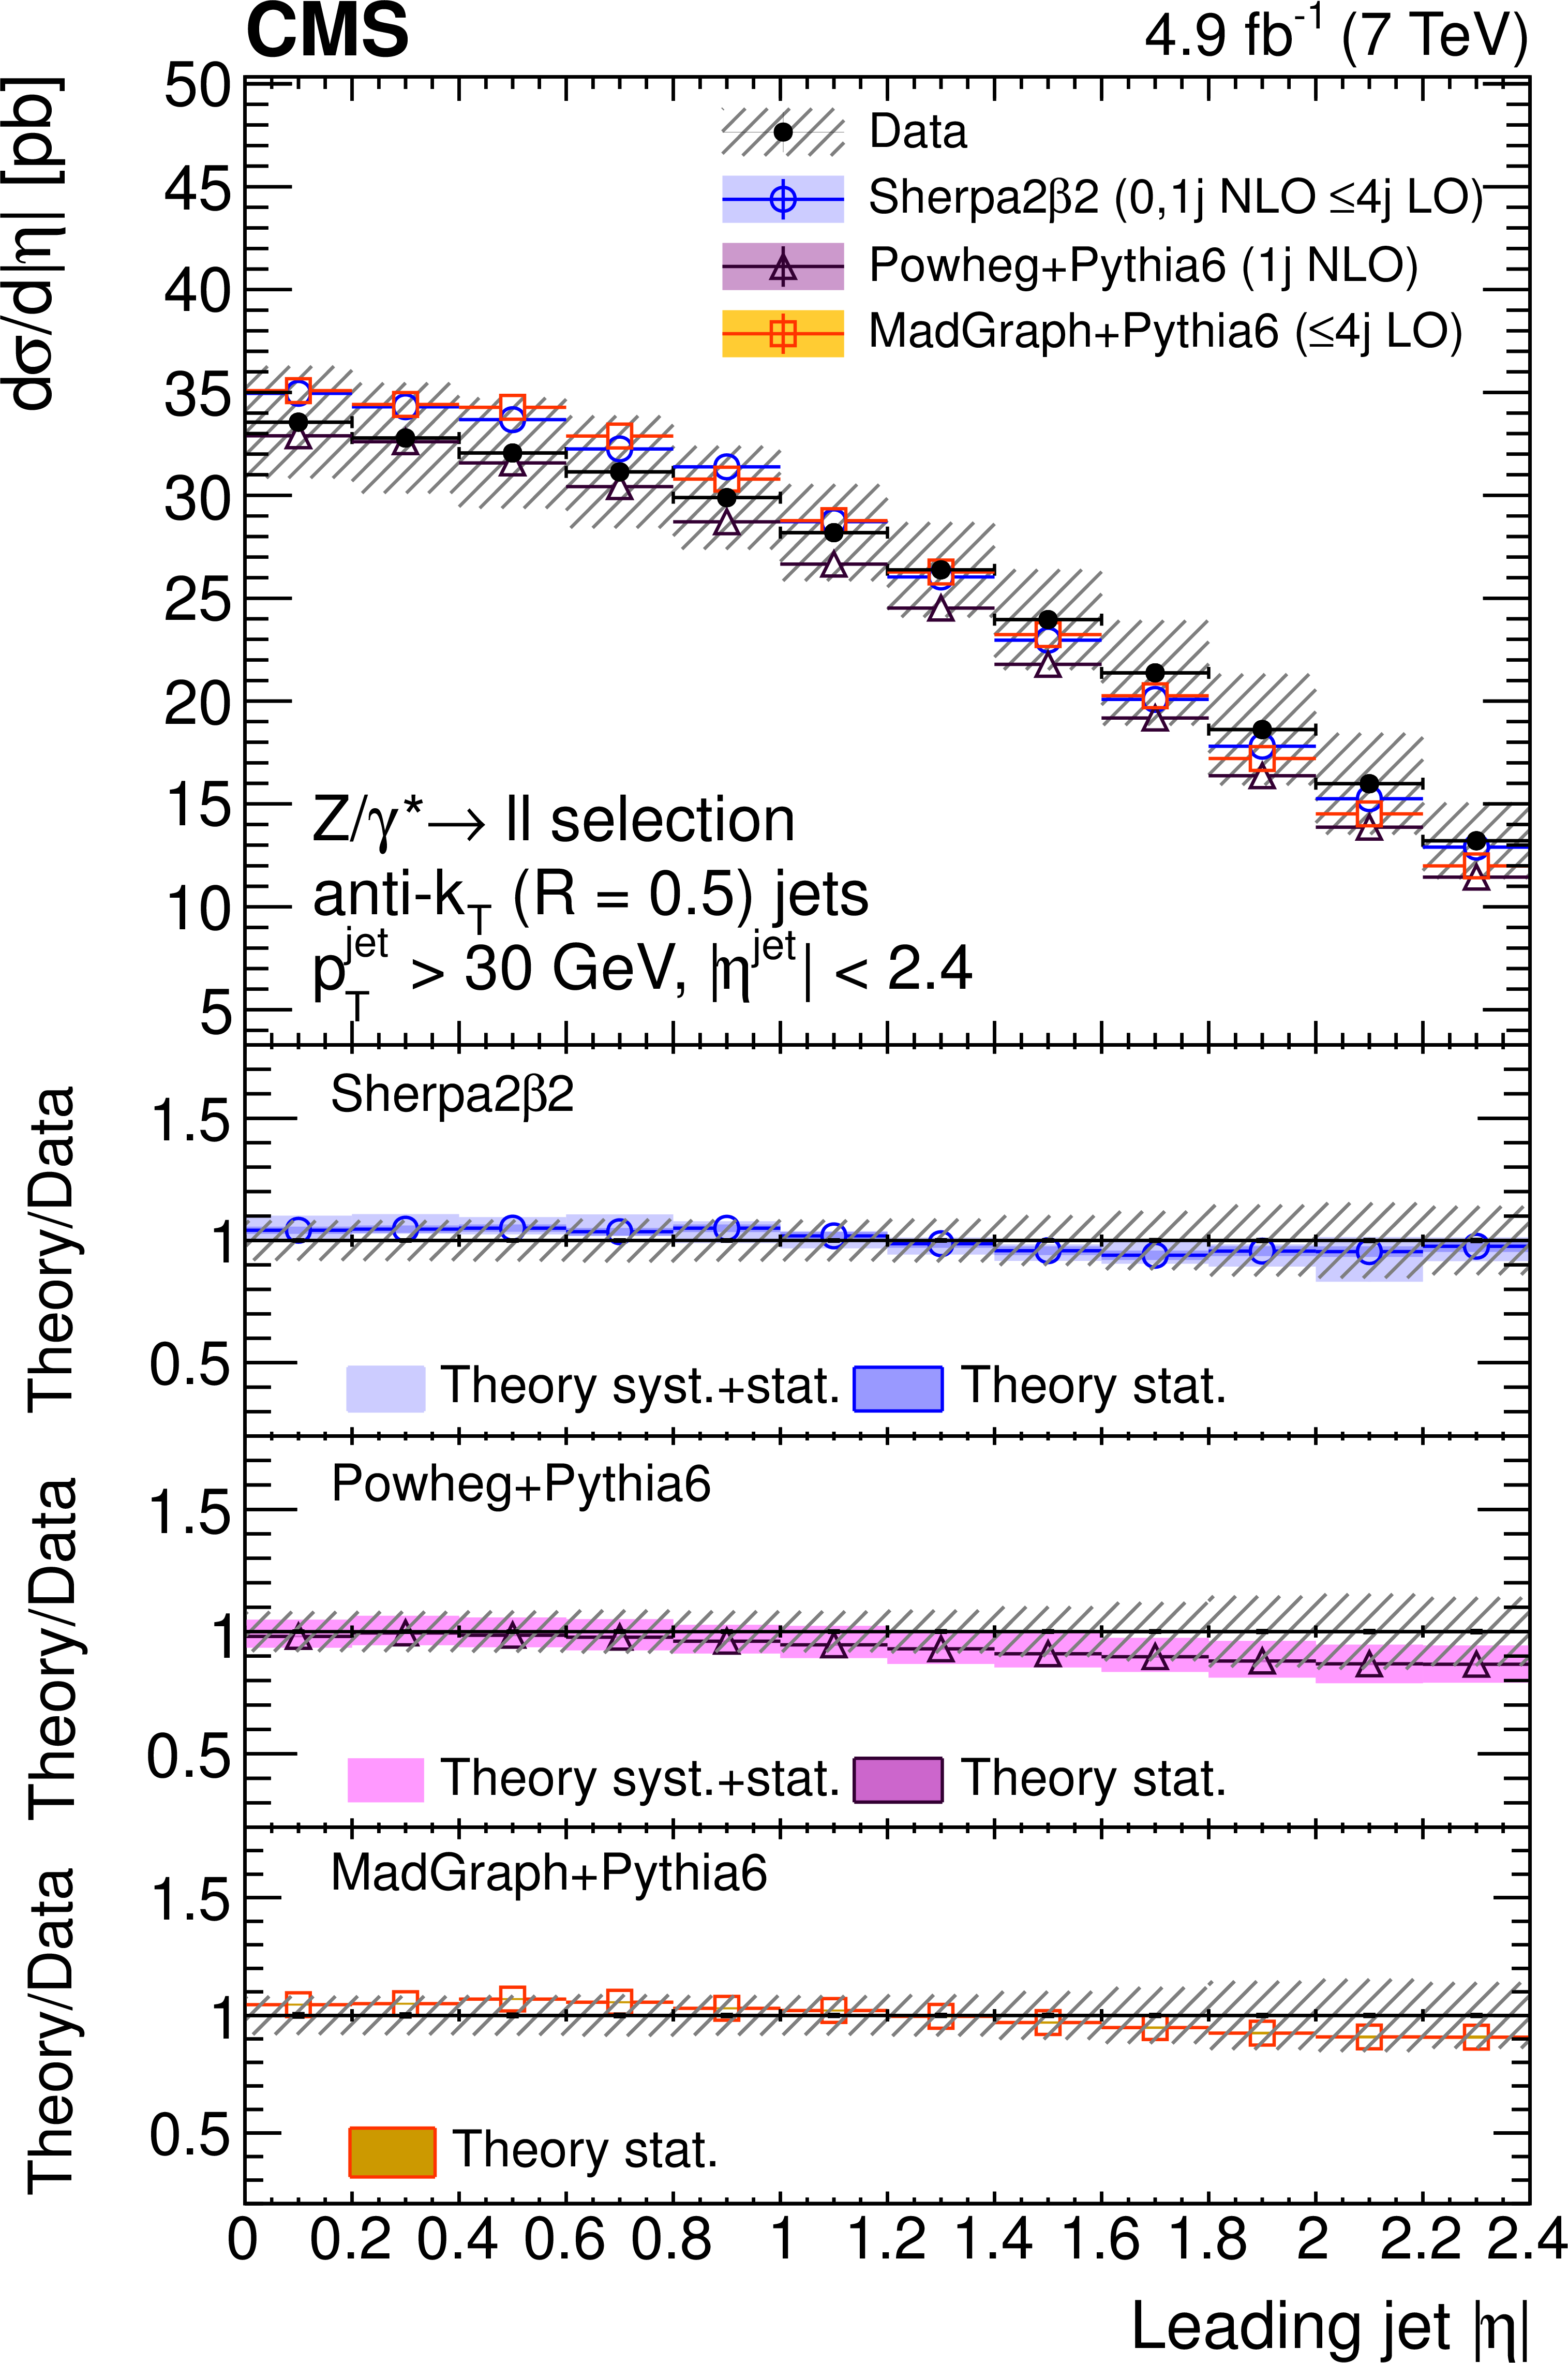
Figure 4-a:
Unfolded differential cross section as a function of the jet absolute pseudorapidity $ {| \eta | }$ for the first (a), second (b), third (c), and fourth (d) highest $ {p_{\mathrm {T}}} $ jets, compared with SHERPA , POWHEG, and MADGRAPH predictions. Error bars around the experimental points represent the statistical uncertainty, while cross-hatched bands represent statistical plus systematic uncertainty. The bands around theory predictions correspond to the statistical uncertainty of the generated sample and, for NLO calculations, to its combination with systematic uncertainty related to scale variations. |
png pdf |
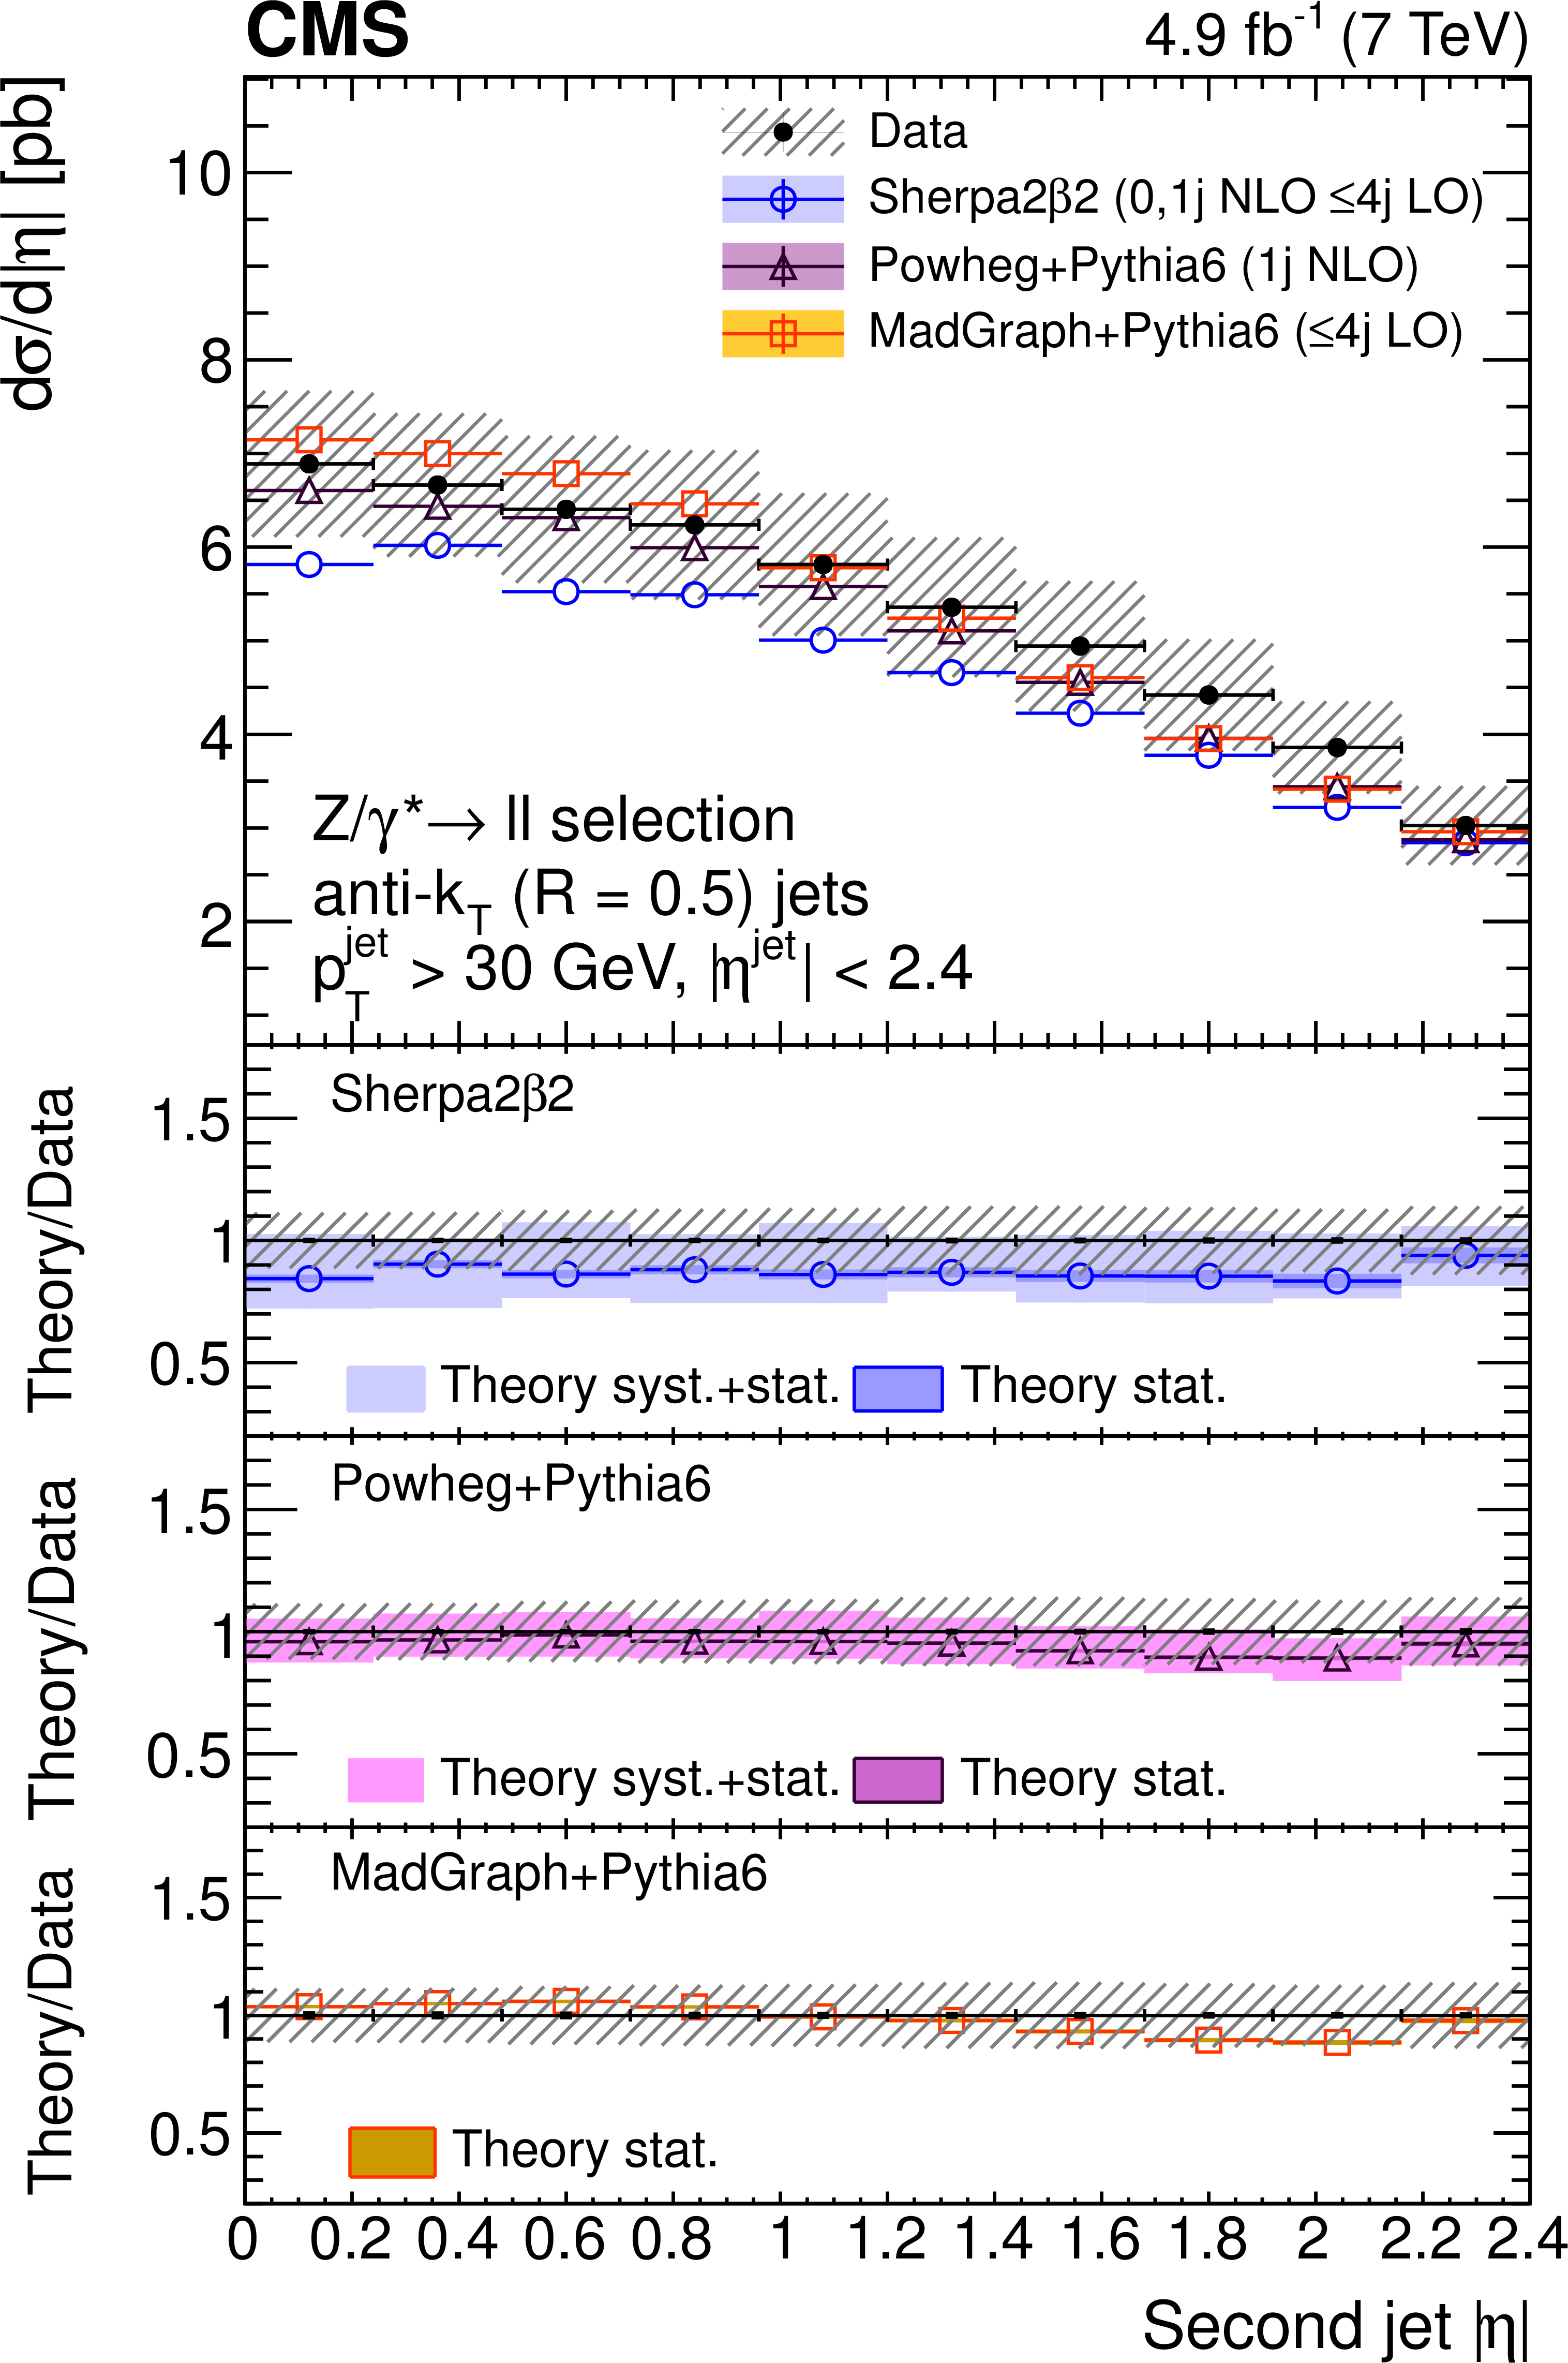
Figure 4-b:
Unfolded differential cross section as a function of the jet absolute pseudorapidity $ {| \eta | }$ for the first (a), second (b), third (c), and fourth (d) highest $ {p_{\mathrm {T}}} $ jets, compared with SHERPA , POWHEG, and MADGRAPH predictions. Error bars around the experimental points represent the statistical uncertainty, while cross-hatched bands represent statistical plus systematic uncertainty. The bands around theory predictions correspond to the statistical uncertainty of the generated sample and, for NLO calculations, to its combination with systematic uncertainty related to scale variations. |
png pdf |
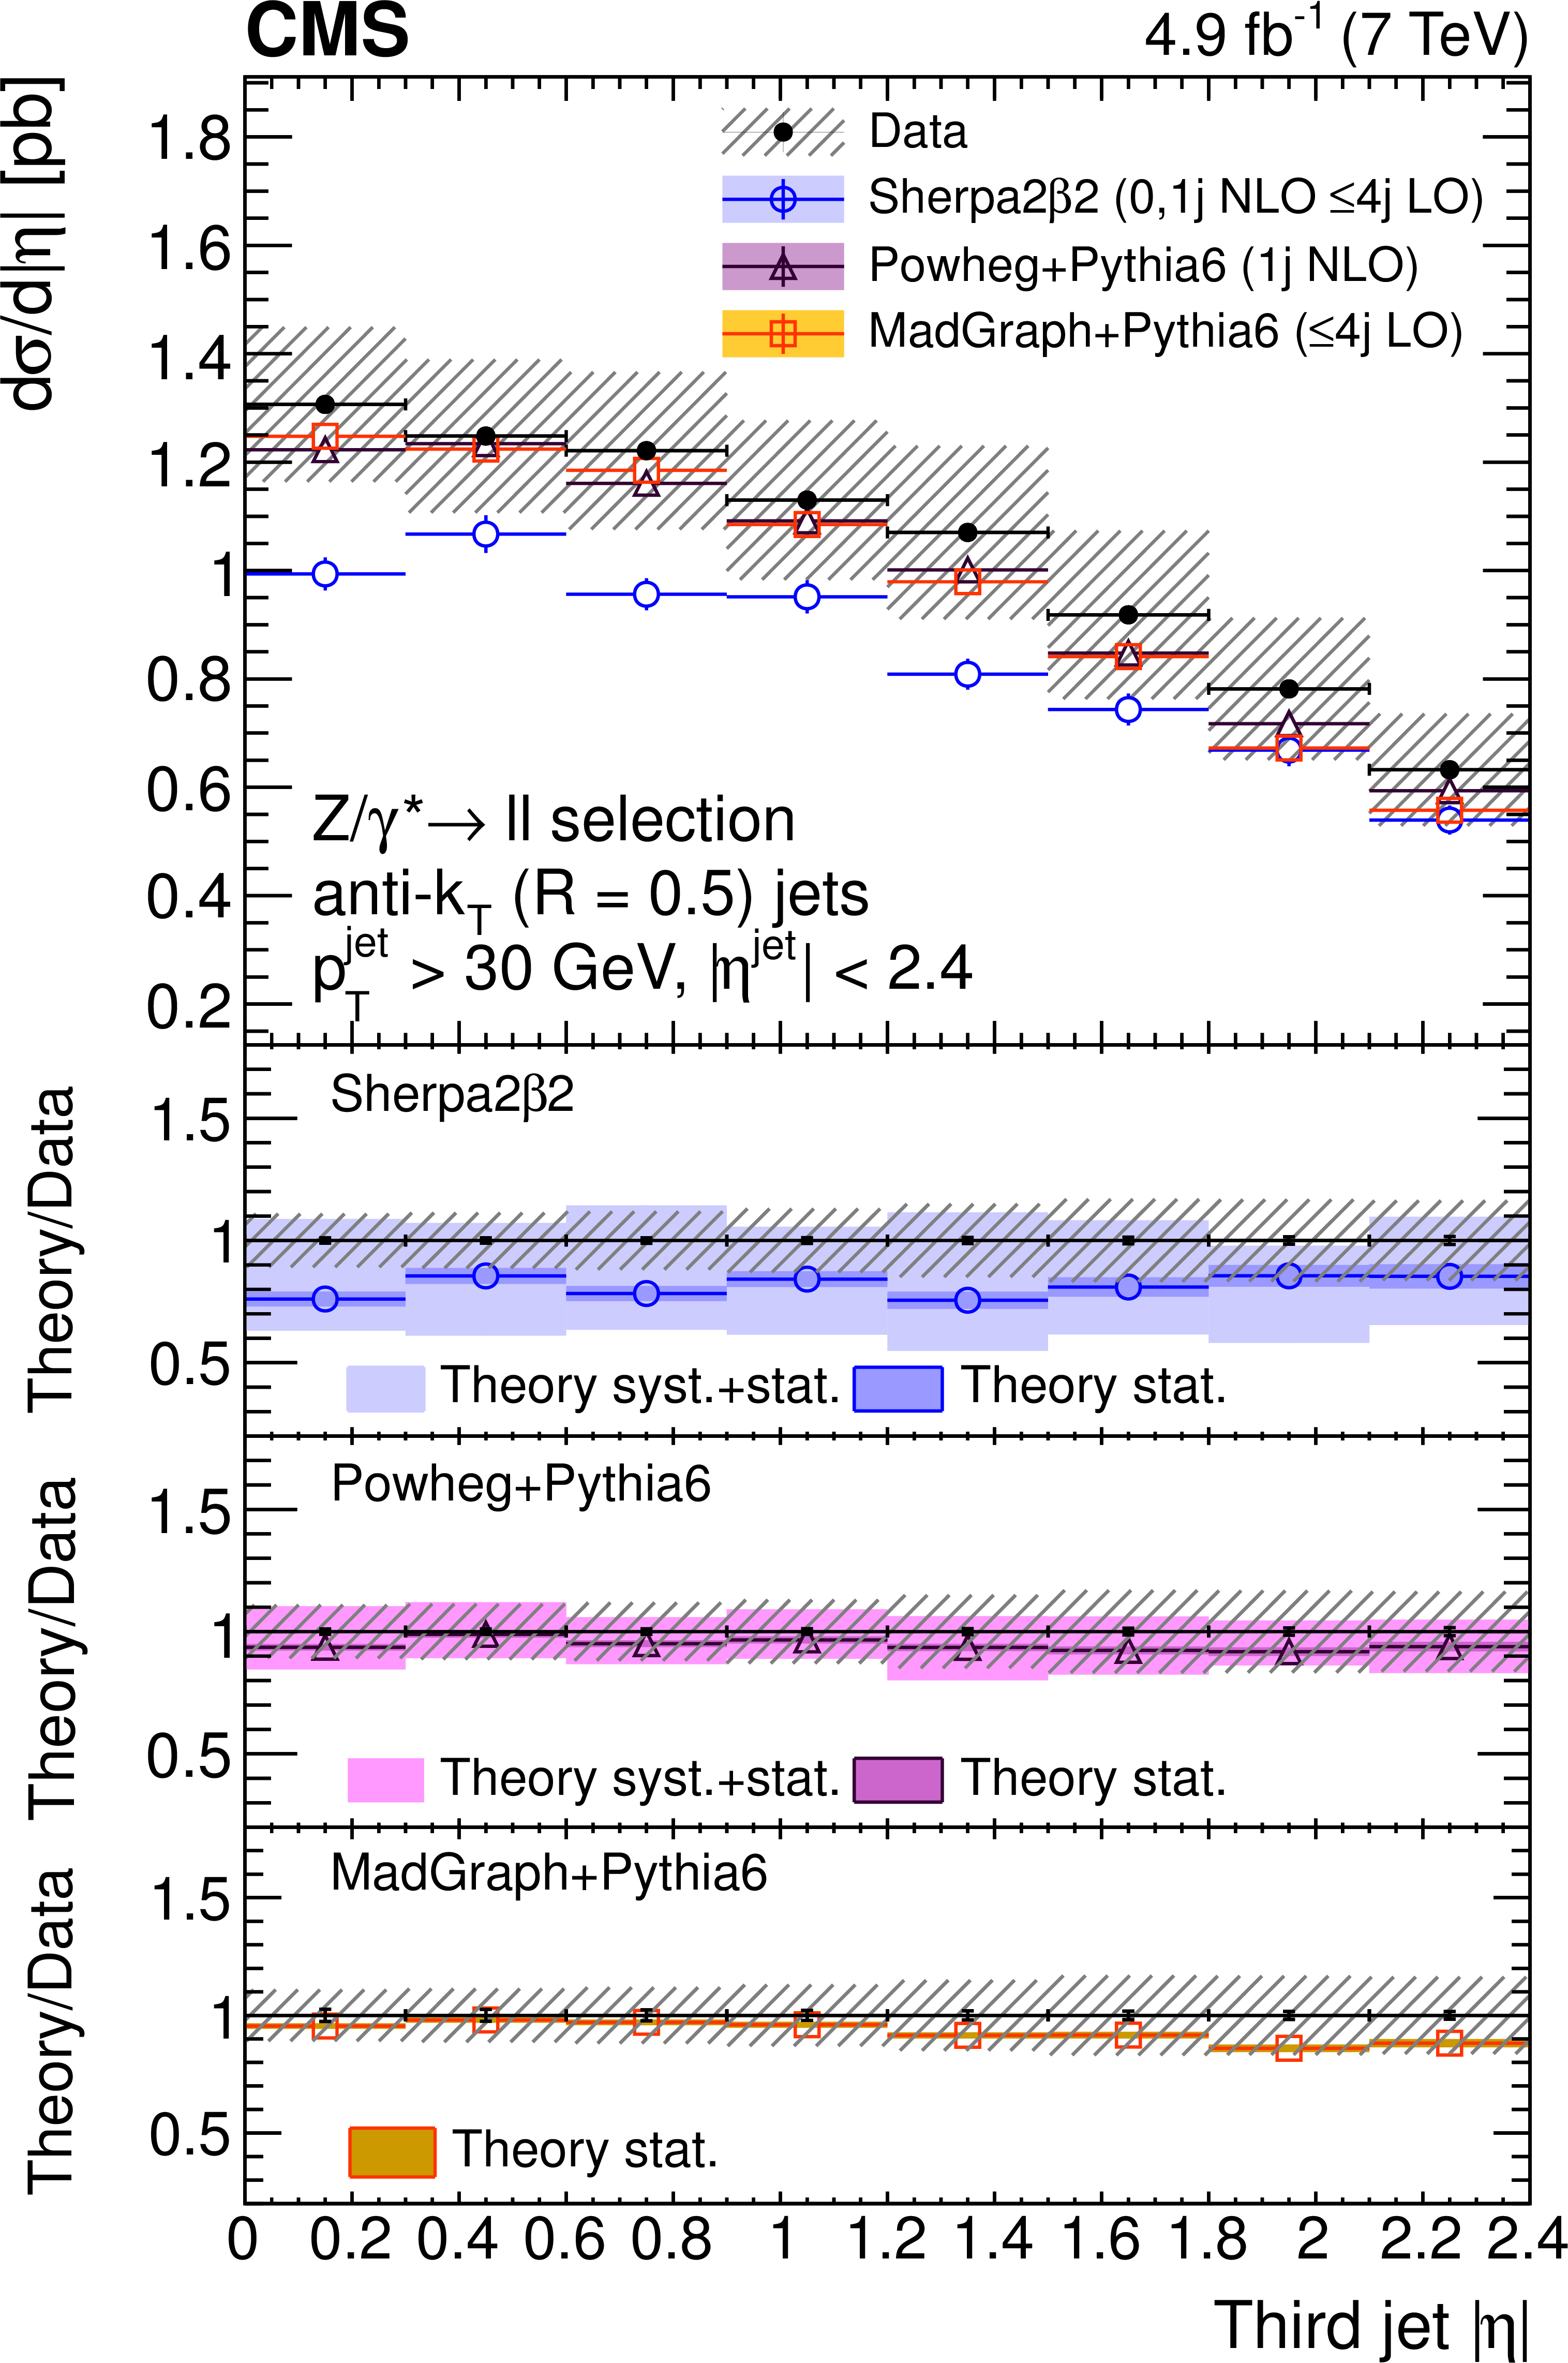
Figure 4-c:
Unfolded differential cross section as a function of the jet absolute pseudorapidity $ {| \eta | }$ for the first (a), second (b), third (c), and fourth (d) highest $ {p_{\mathrm {T}}} $ jets, compared with SHERPA , POWHEG, and MADGRAPH predictions. Error bars around the experimental points represent the statistical uncertainty, while cross-hatched bands represent statistical plus systematic uncertainty. The bands around theory predictions correspond to the statistical uncertainty of the generated sample and, for NLO calculations, to its combination with systematic uncertainty related to scale variations. |
png pdf |
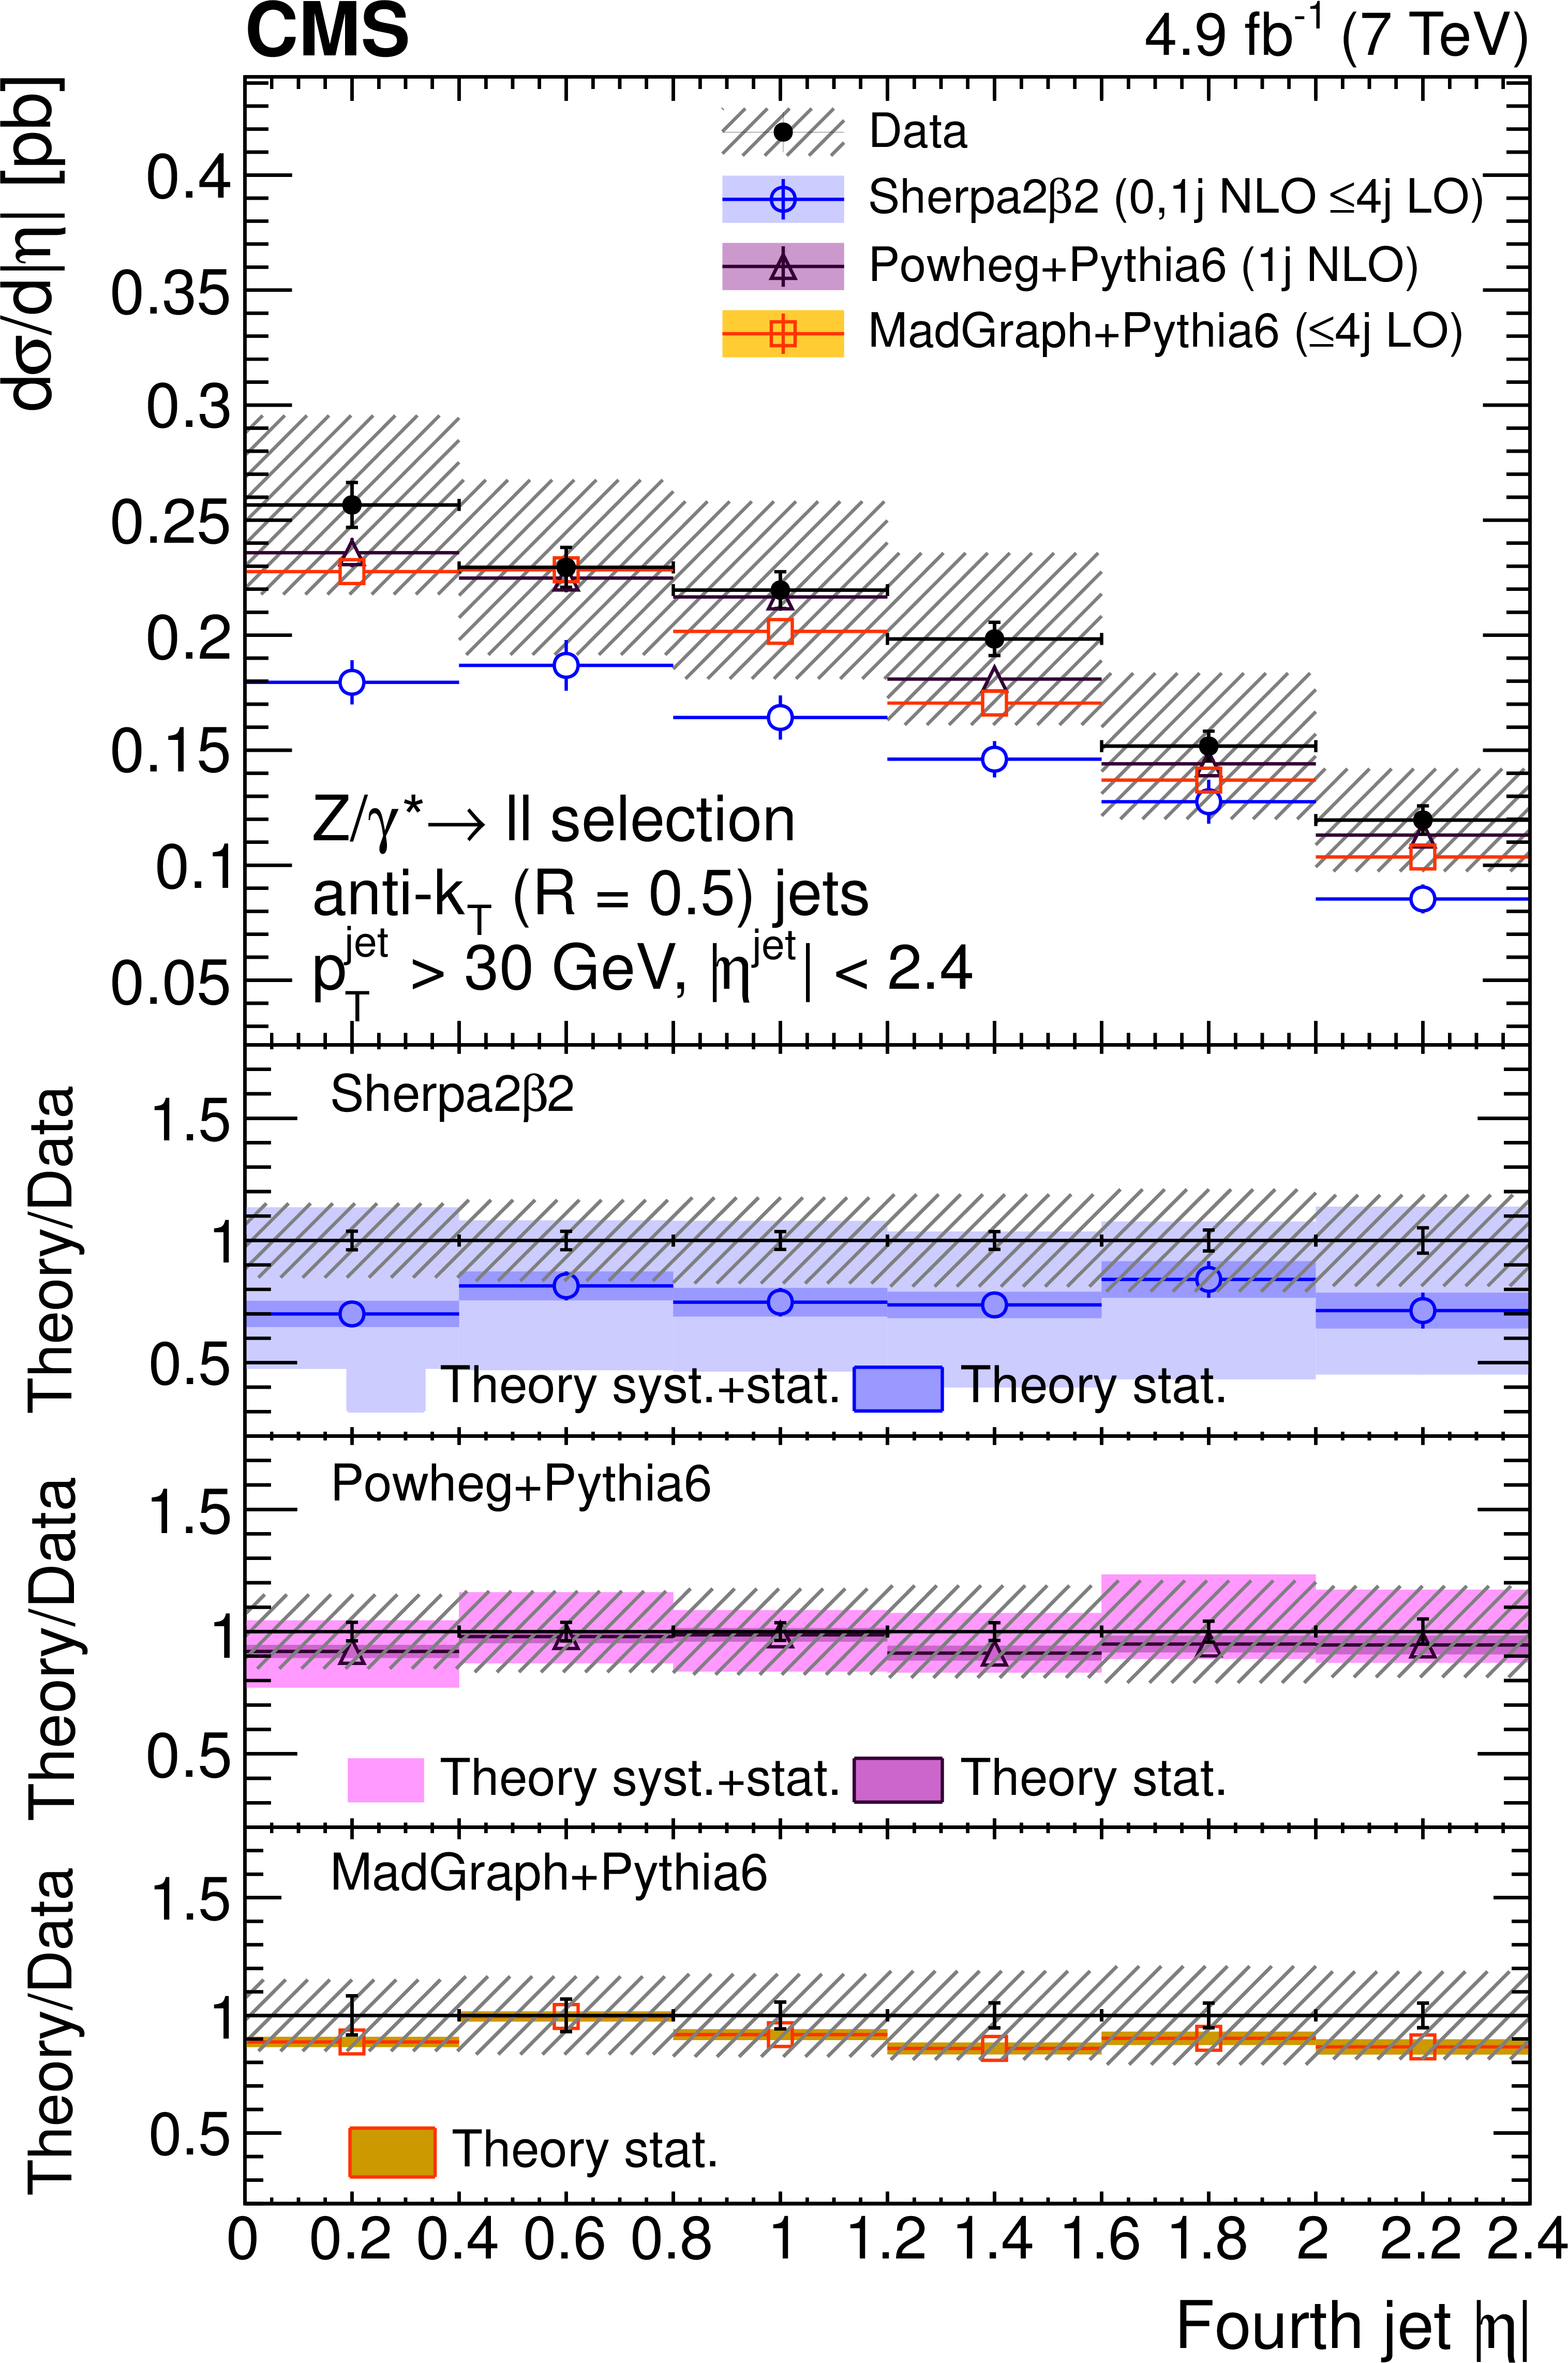
Figure 4-d:
Unfolded differential cross section as a function of the jet absolute pseudorapidity $ {| \eta | }$ for the first (a), second (b), third (c), and fourth (d) highest $ {p_{\mathrm {T}}} $ jets, compared with SHERPA , POWHEG, and MADGRAPH predictions. Error bars around the experimental points represent the statistical uncertainty, while cross-hatched bands represent statistical plus systematic uncertainty. The bands around theory predictions correspond to the statistical uncertainty of the generated sample and, for NLO calculations, to its combination with systematic uncertainty related to scale variations. |
png pdf |
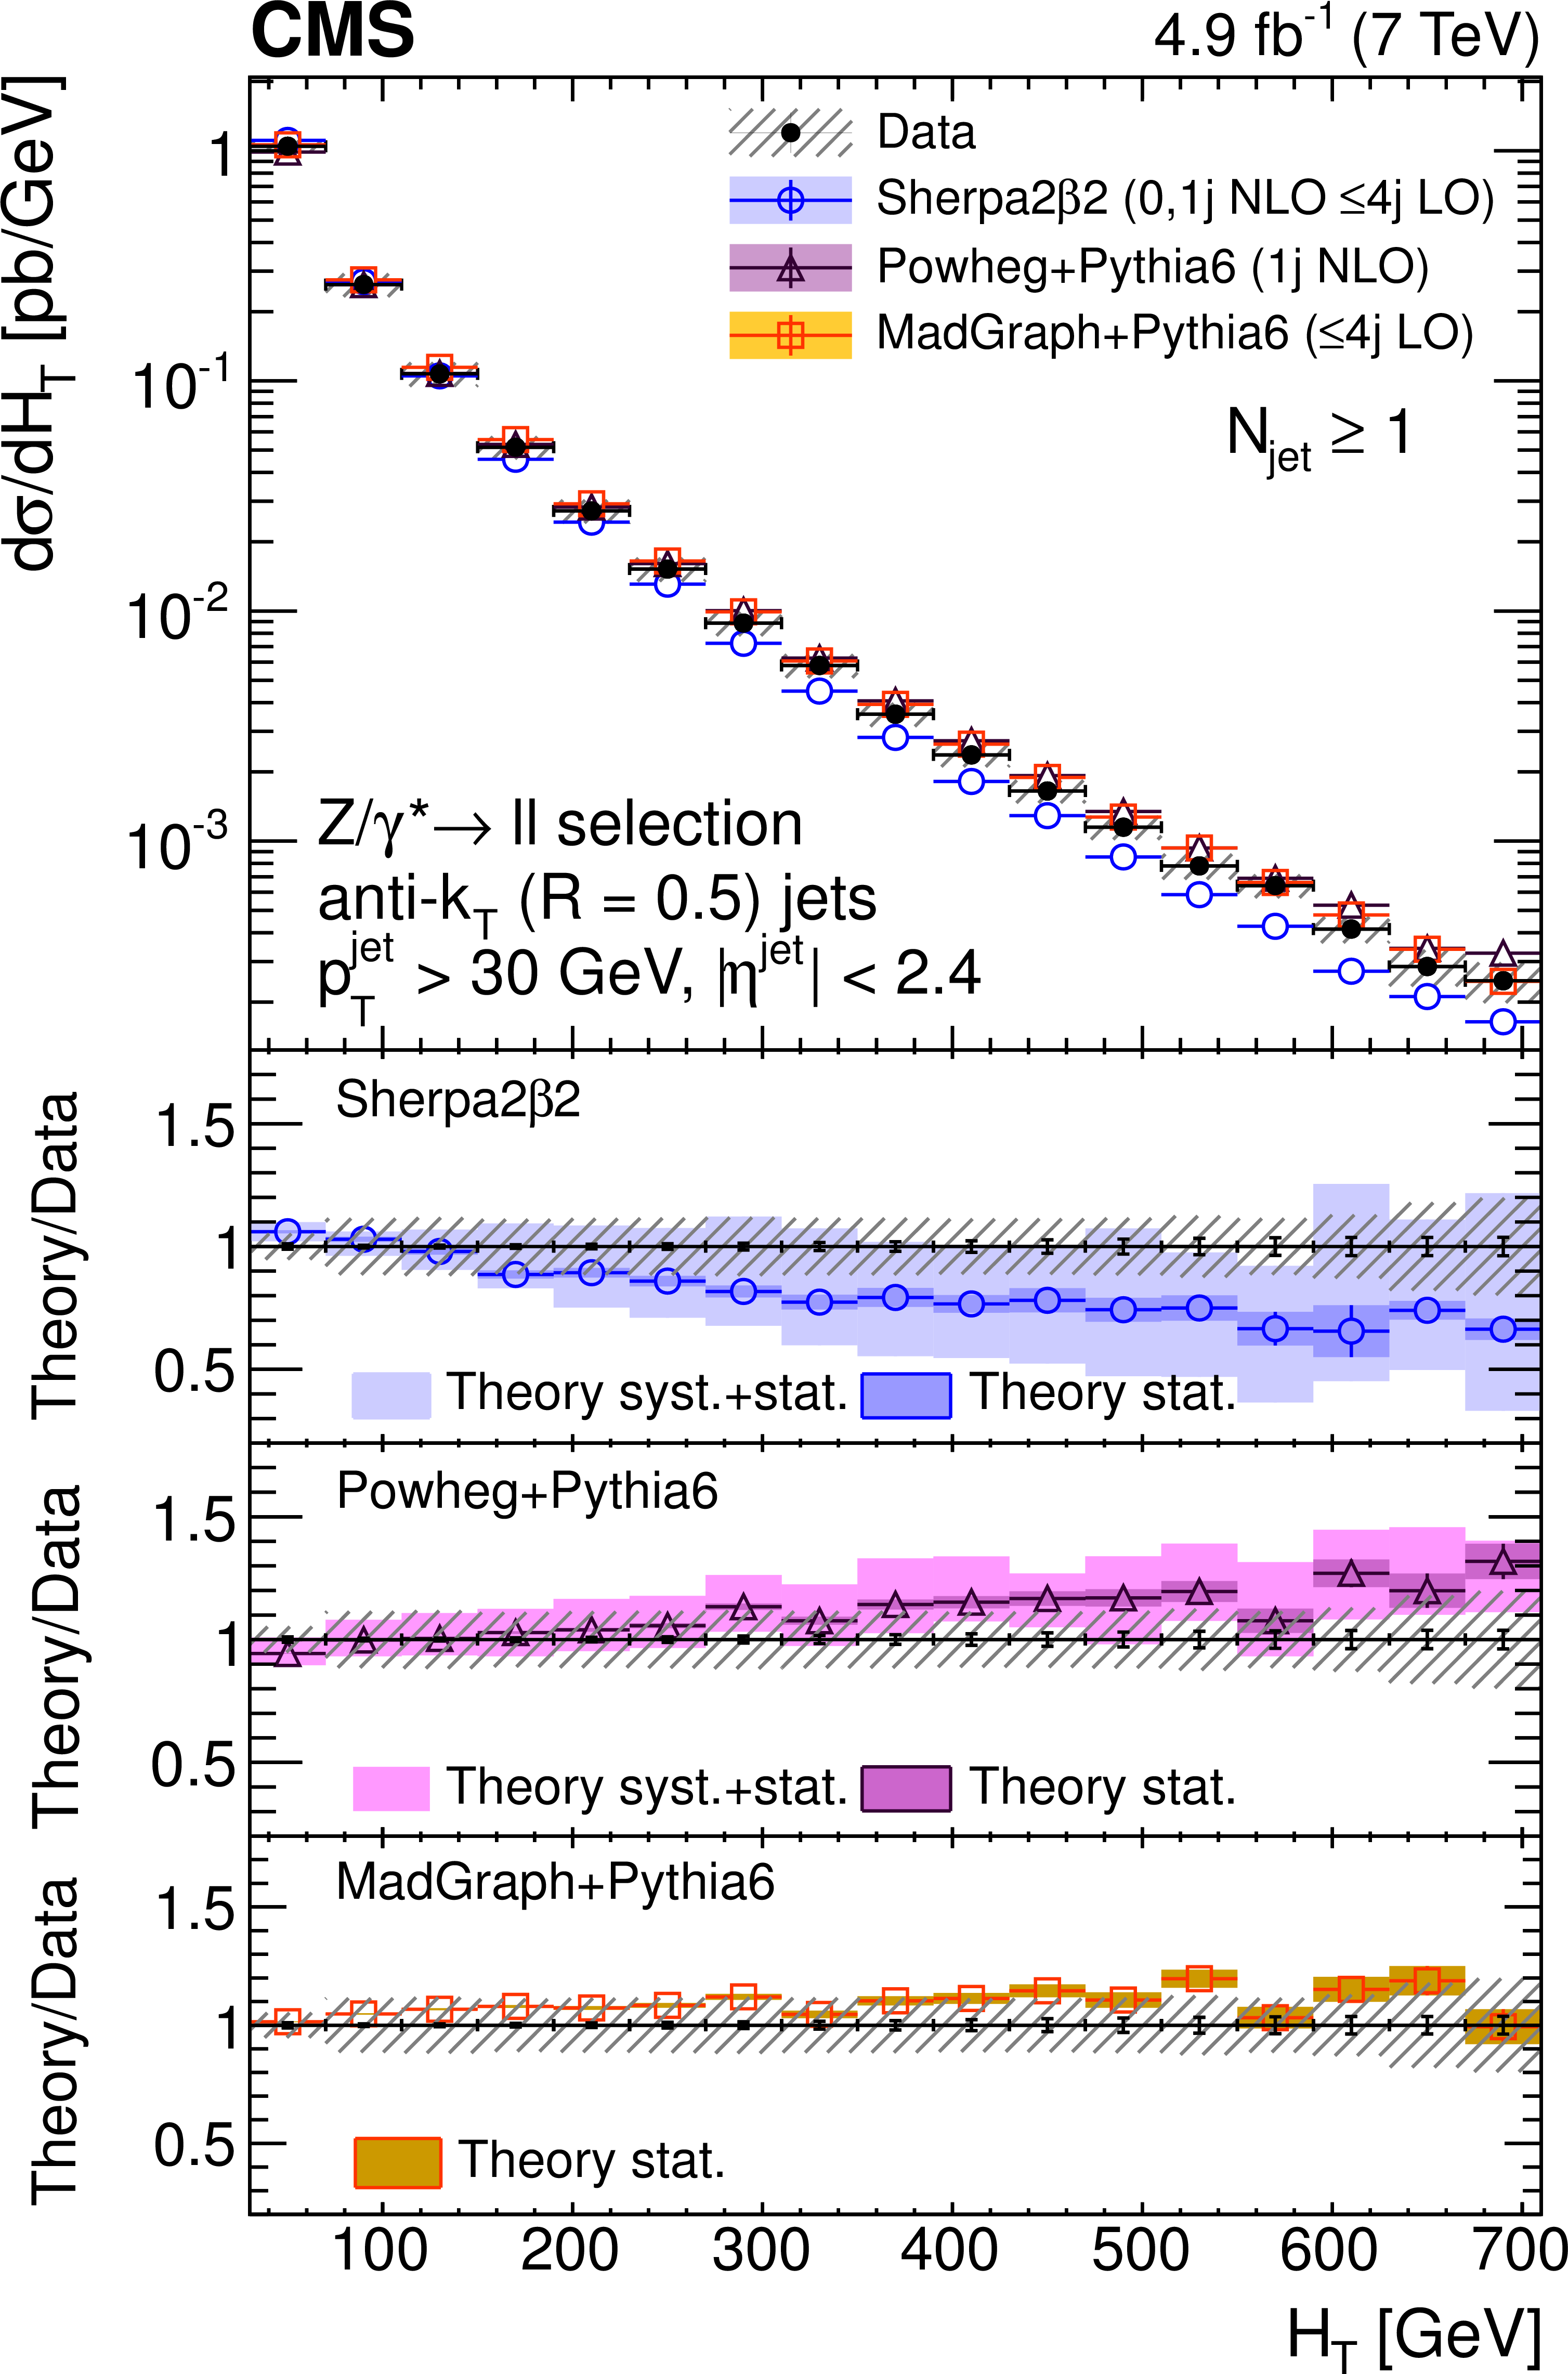
Figure 5-a:
Unfolded differential cross section as a function of $ {H_{\mathrm {T}}} $ for events with at least one (a), two (b), three (c), and four (d) jets compared with SHERPA, POWHEG, and MADGRAPH predictions. Error bars around the experimental points represent the statistical uncertainty, while cross-hatched bands represent statistical plus systematic uncertainty. The bands around theory predictions correspond to the statistical uncertainty of the generated sample and, for NLO calculations, to its combination with systematic uncertainty related to scale variations. |
png pdf |
Figure 5-b:
Unfolded differential cross section as a function of $ {H_{\mathrm {T}}} $ for events with at least one (a), two (b), three (c), and four (d) jets compared with SHERPA, POWHEG, and MADGRAPH predictions. Error bars around the experimental points represent the statistical uncertainty, while cross-hatched bands represent statistical plus systematic uncertainty. The bands around theory predictions correspond to the statistical uncertainty of the generated sample and, for NLO calculations, to its combination with systematic uncertainty related to scale variations. |

png pdf |
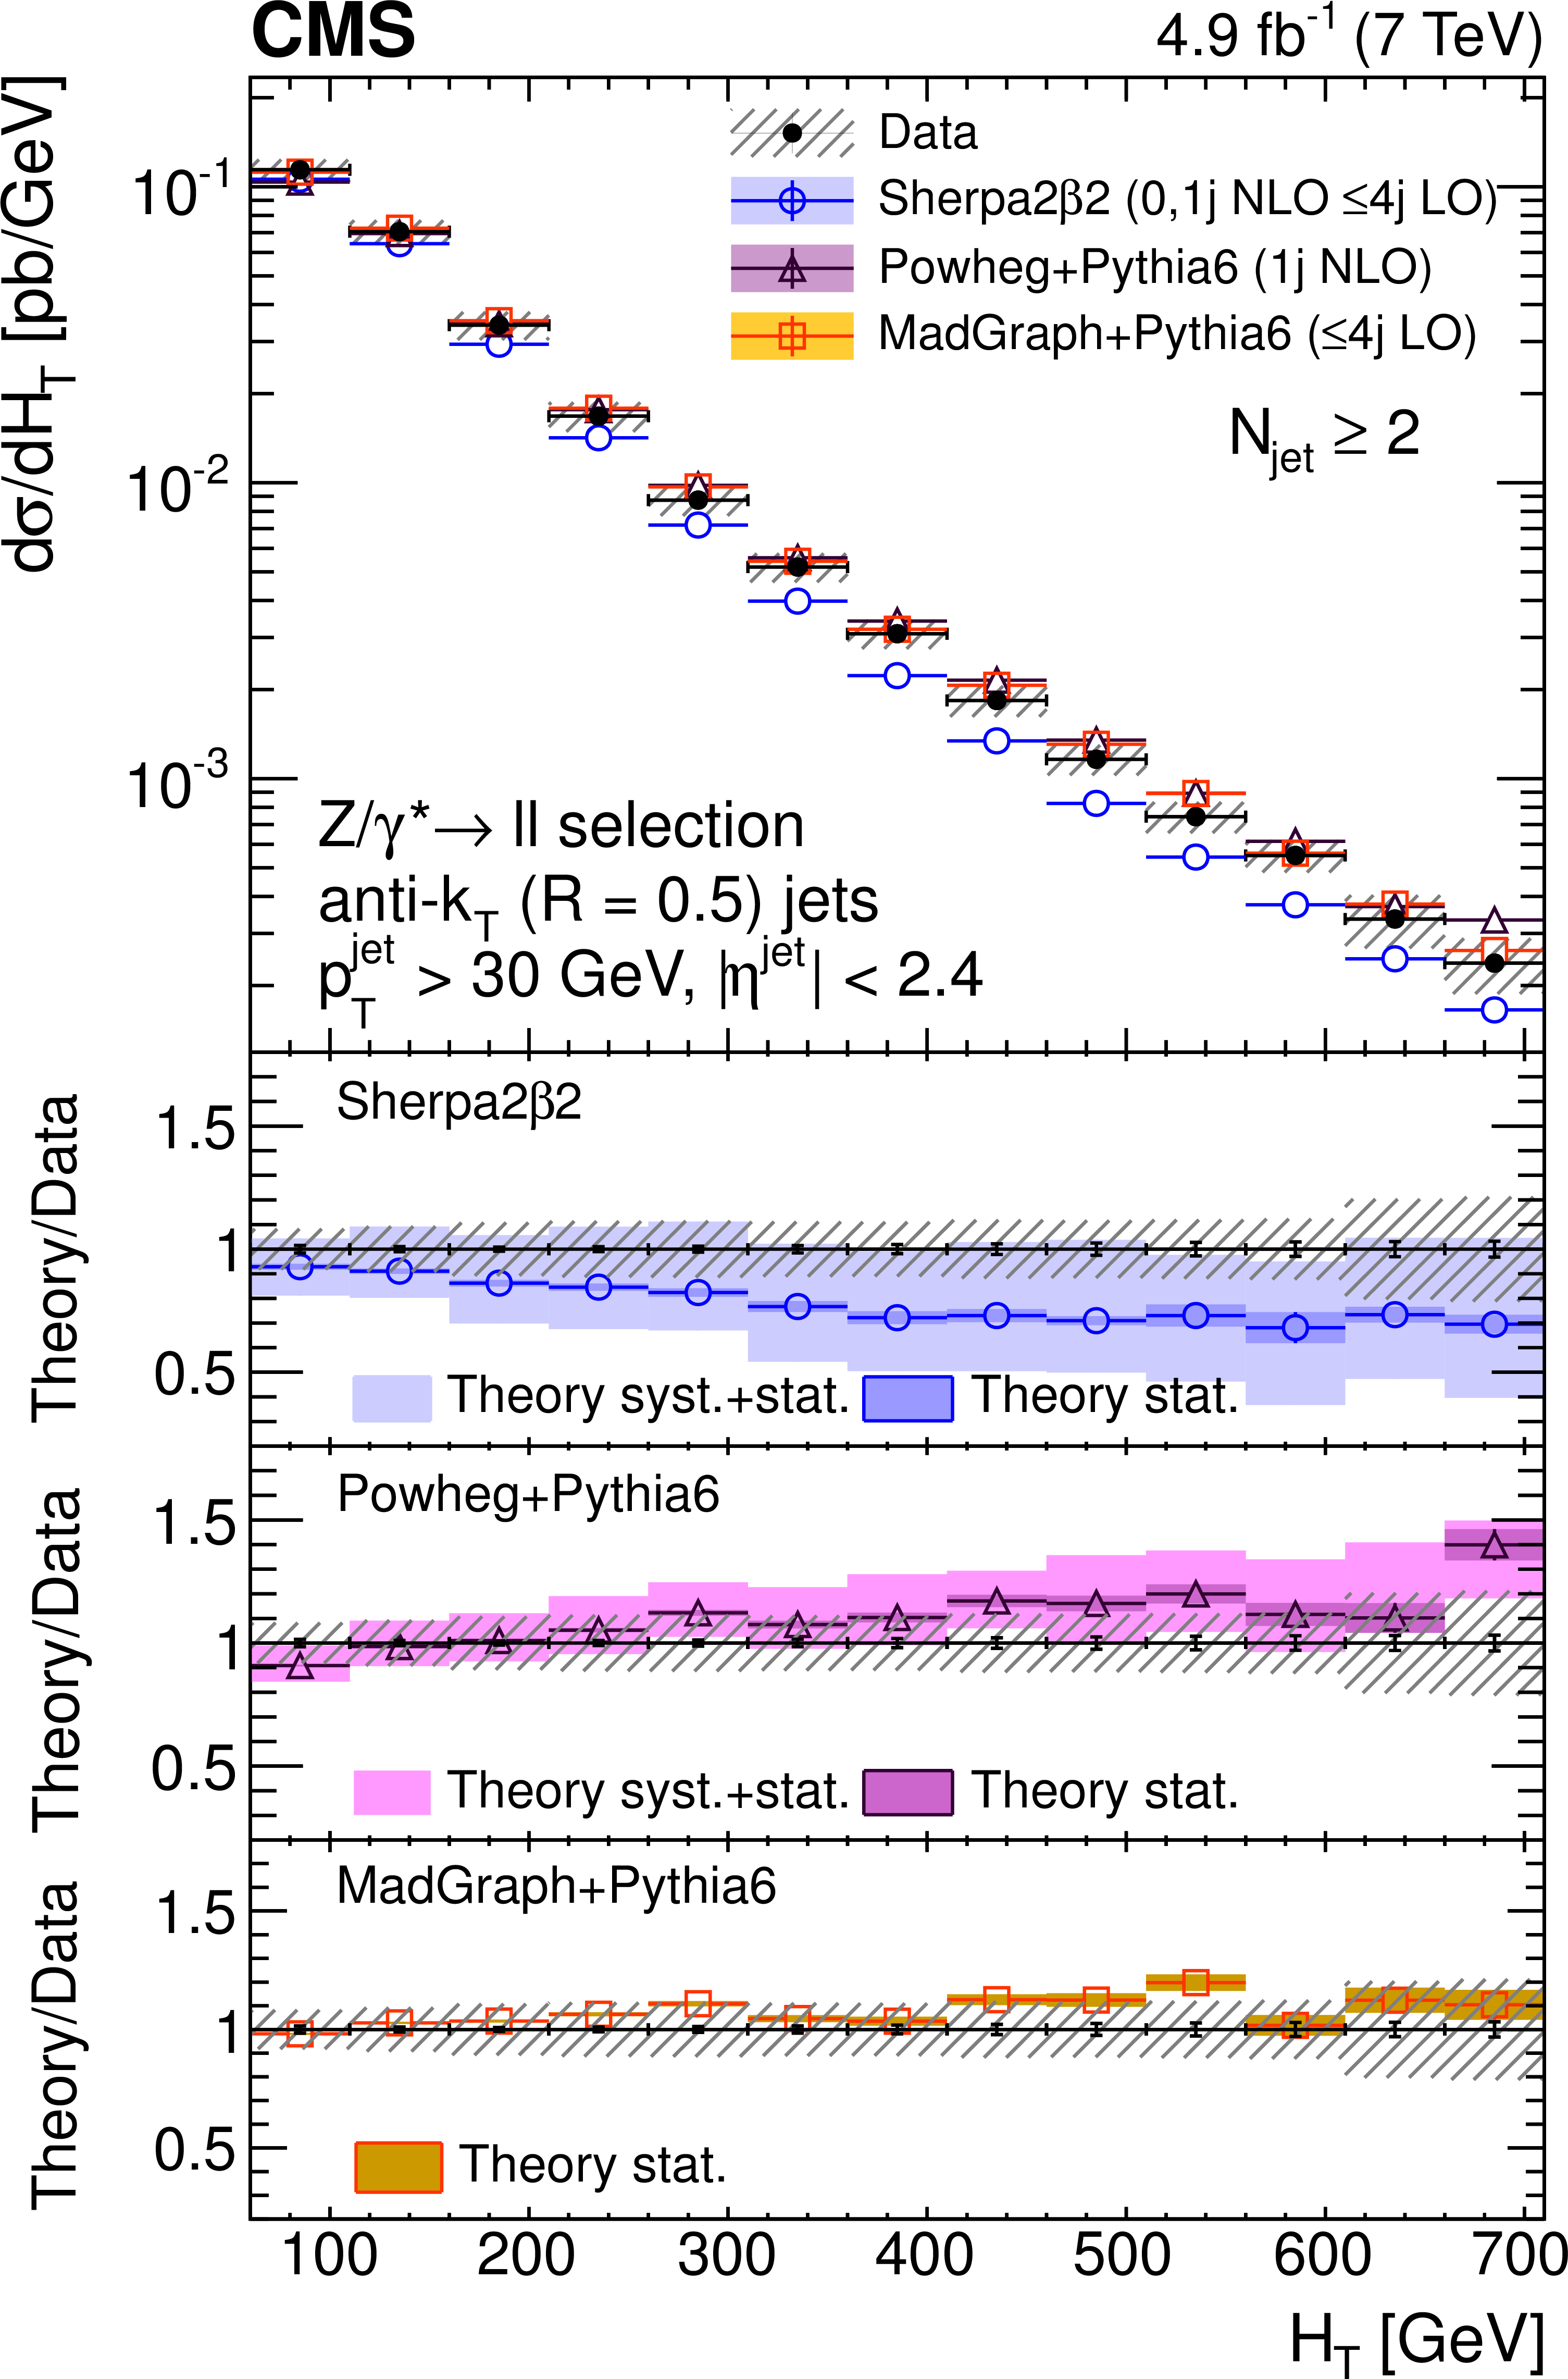
Figure 5-c:
Unfolded differential cross section as a function of $ {H_{\mathrm {T}}} $ for events with at least one (a), two (b), three (c), and four (d) jets compared with SHERPA, POWHEG, and MADGRAPH predictions. Error bars around the experimental points represent the statistical uncertainty, while cross-hatched bands represent statistical plus systematic uncertainty. The bands around theory predictions correspond to the statistical uncertainty of the generated sample and, for NLO calculations, to its combination with systematic uncertainty related to scale variations. |
png pdf |
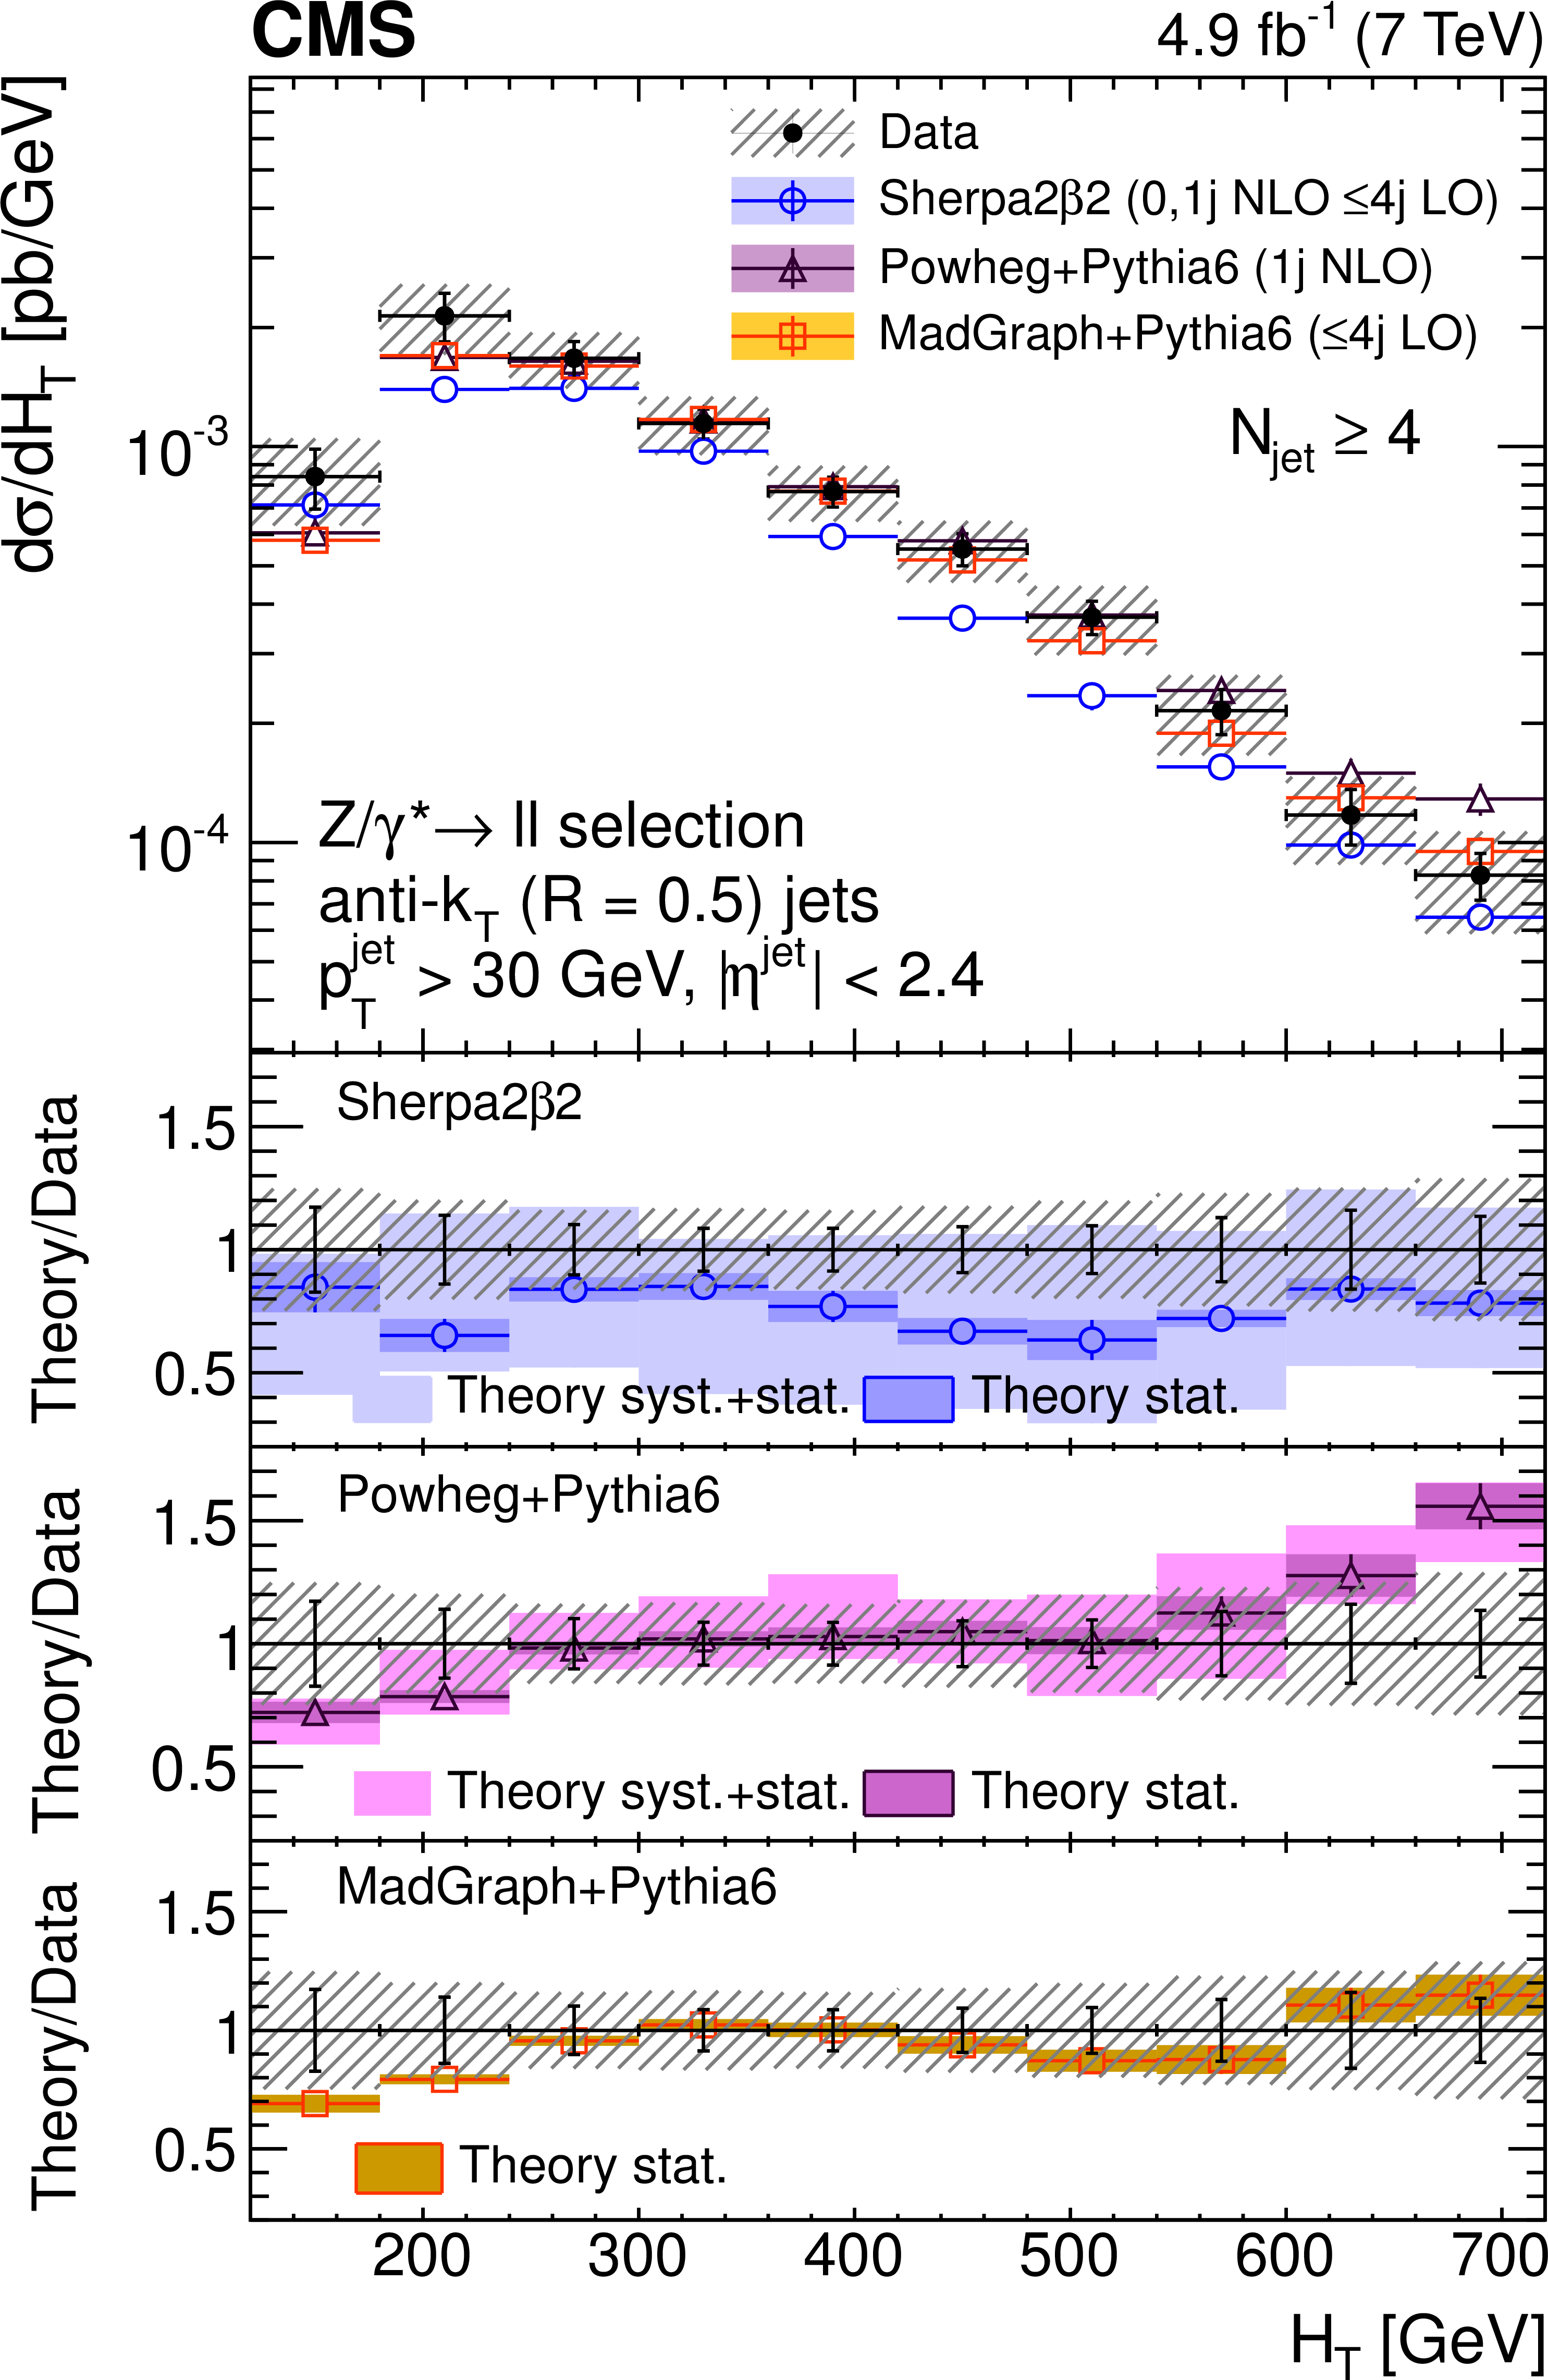
Figure 5-d:
Unfolded differential cross section as a function of $ {H_{\mathrm {T}}} $ for events with at least one (a), two (b), three (c), and four (d) jets compared with SHERPA, POWHEG, and MADGRAPH predictions. Error bars around the experimental points represent the statistical uncertainty, while cross-hatched bands represent statistical plus systematic uncertainty. The bands around theory predictions correspond to the statistical uncertainty of the generated sample and, for NLO calculations, to its combination with systematic uncertainty related to scale variations. |
png pdf |
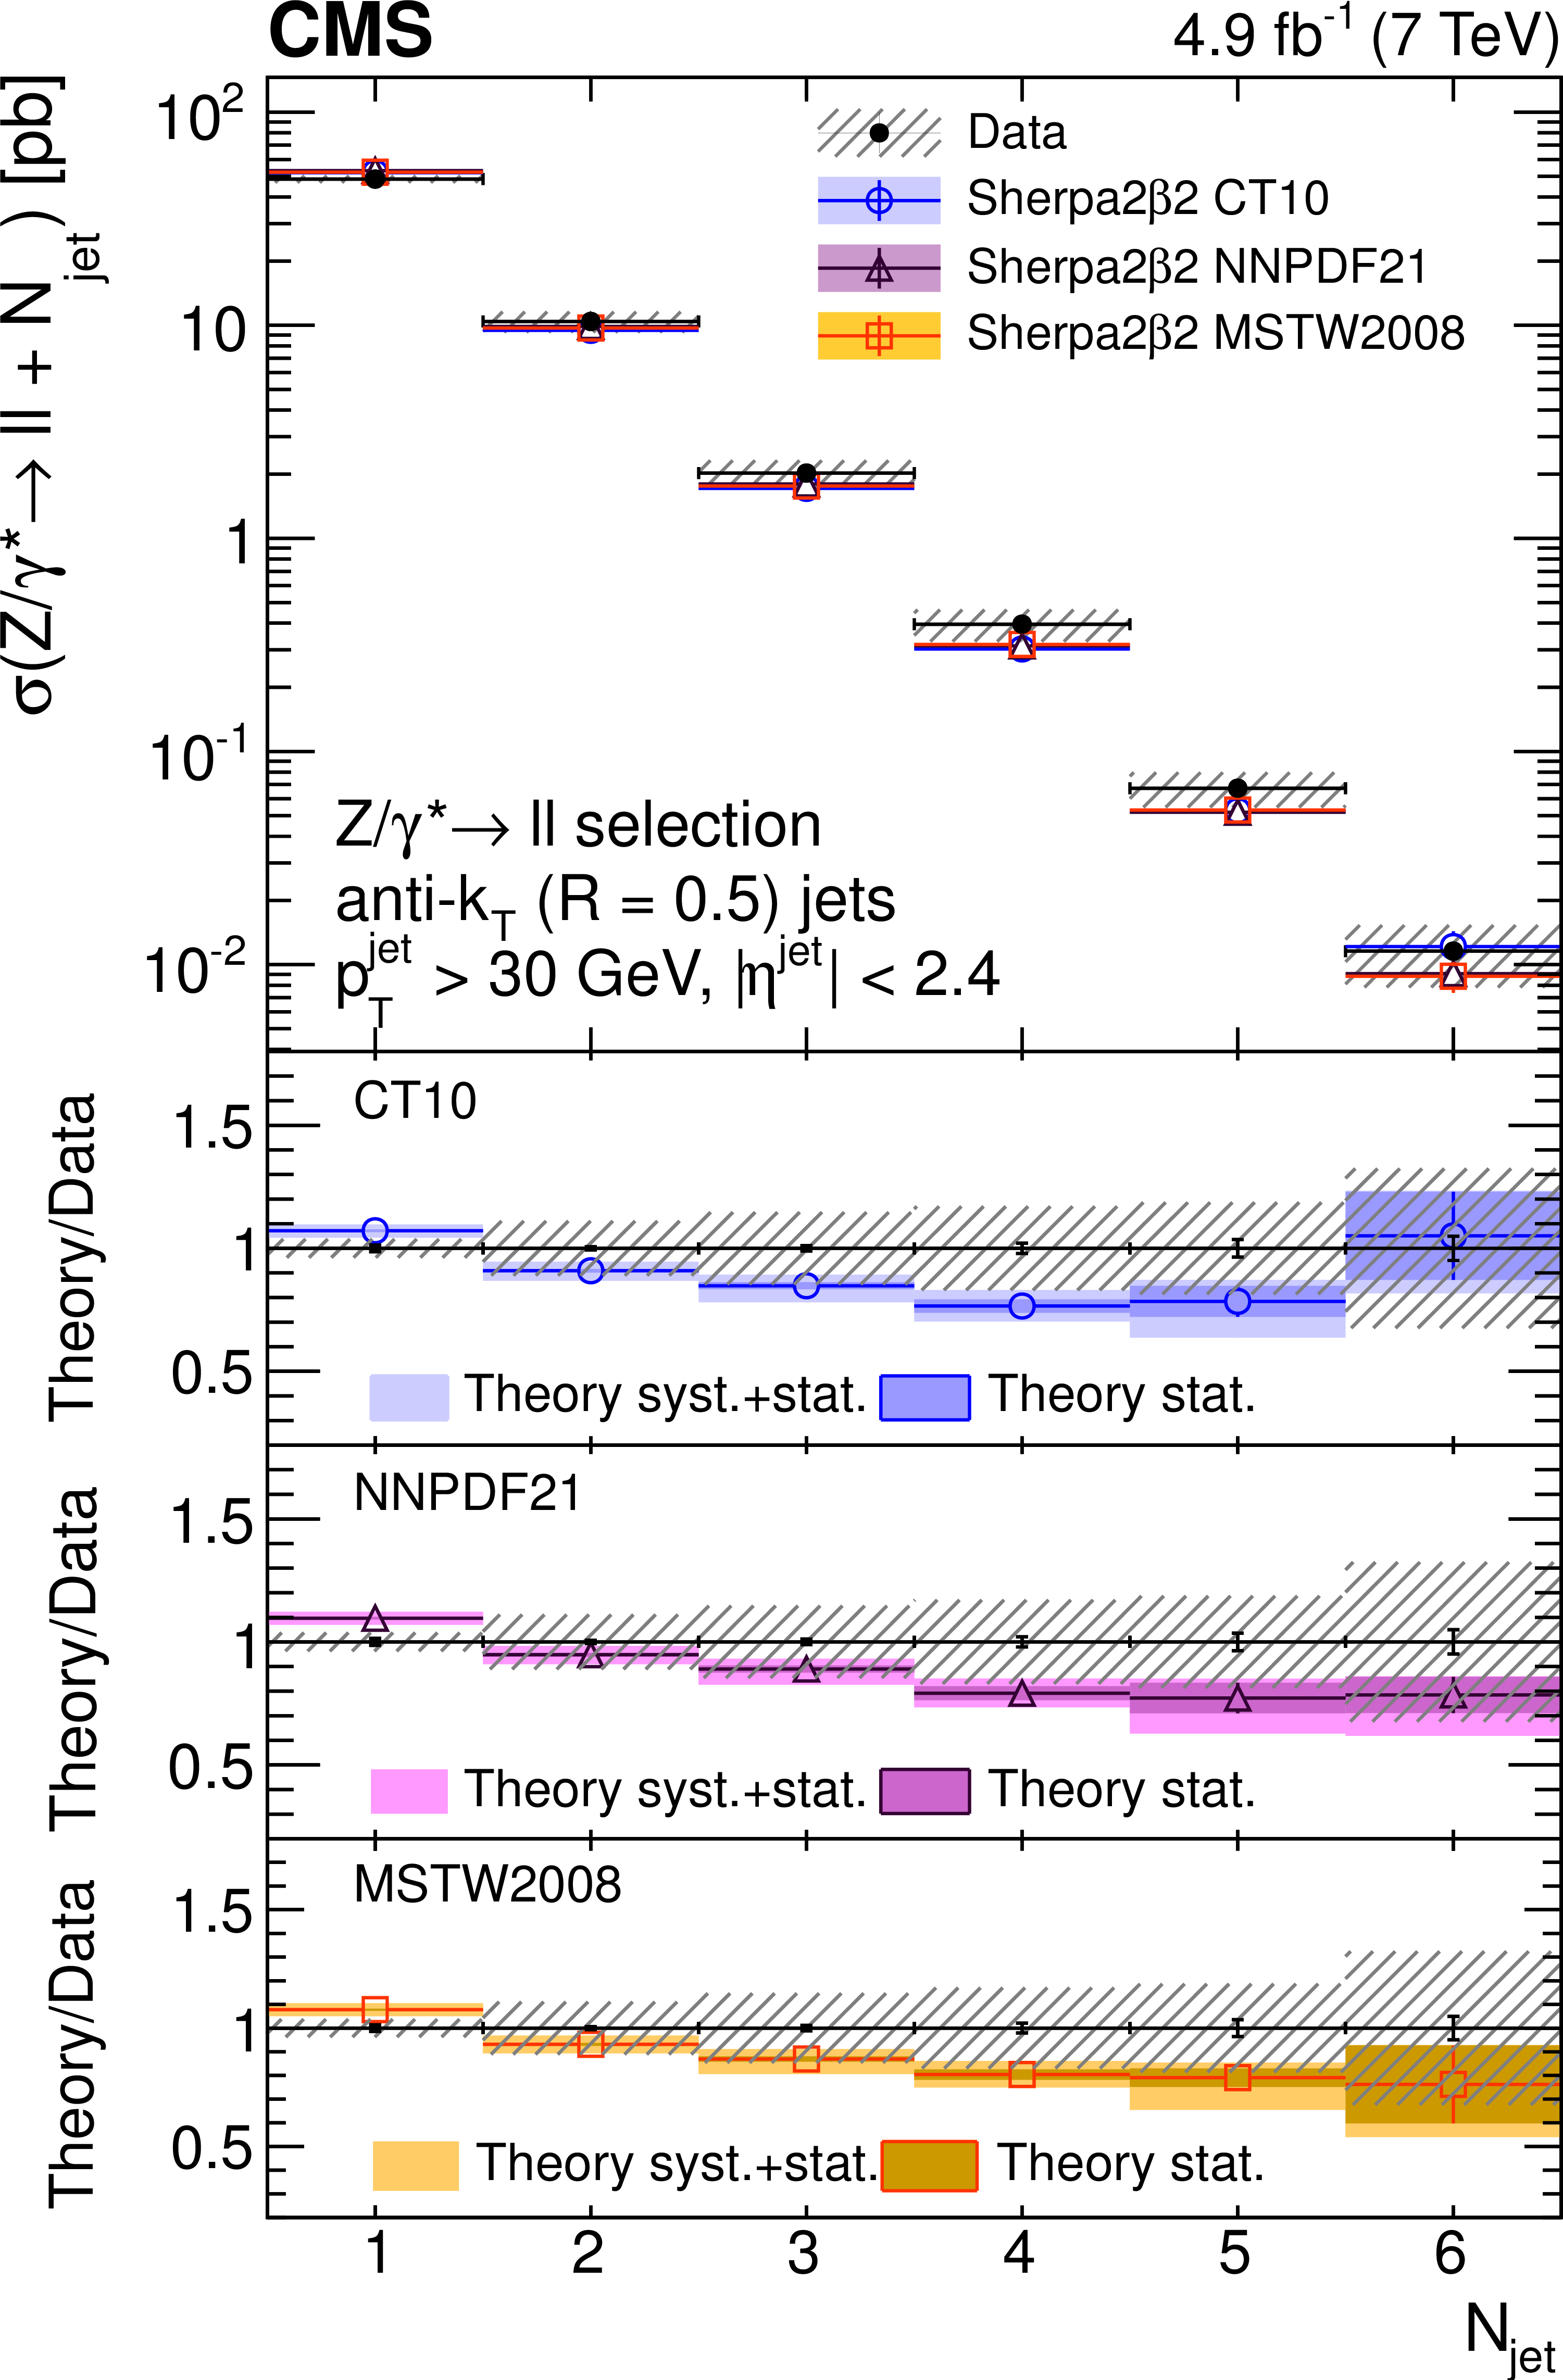
Figure 6-a:
Exclusive jet multiplicity distribution(a) and inclusive jet multiplicity distribution(b), after the unfolding procedure, compared with SHERPA predictions based on the PDF sets CT10, MSTW2008, and NNPDF2.1. Error bars around the experimental points represent the statistical uncertainty, while cross-hatched bands represent statistical plus systematic uncertainty. The bands around theory predictions correspond to the statistical uncertainty of the generated sample and to its combination with the theoretical PDF uncertainty. |
png pdf |
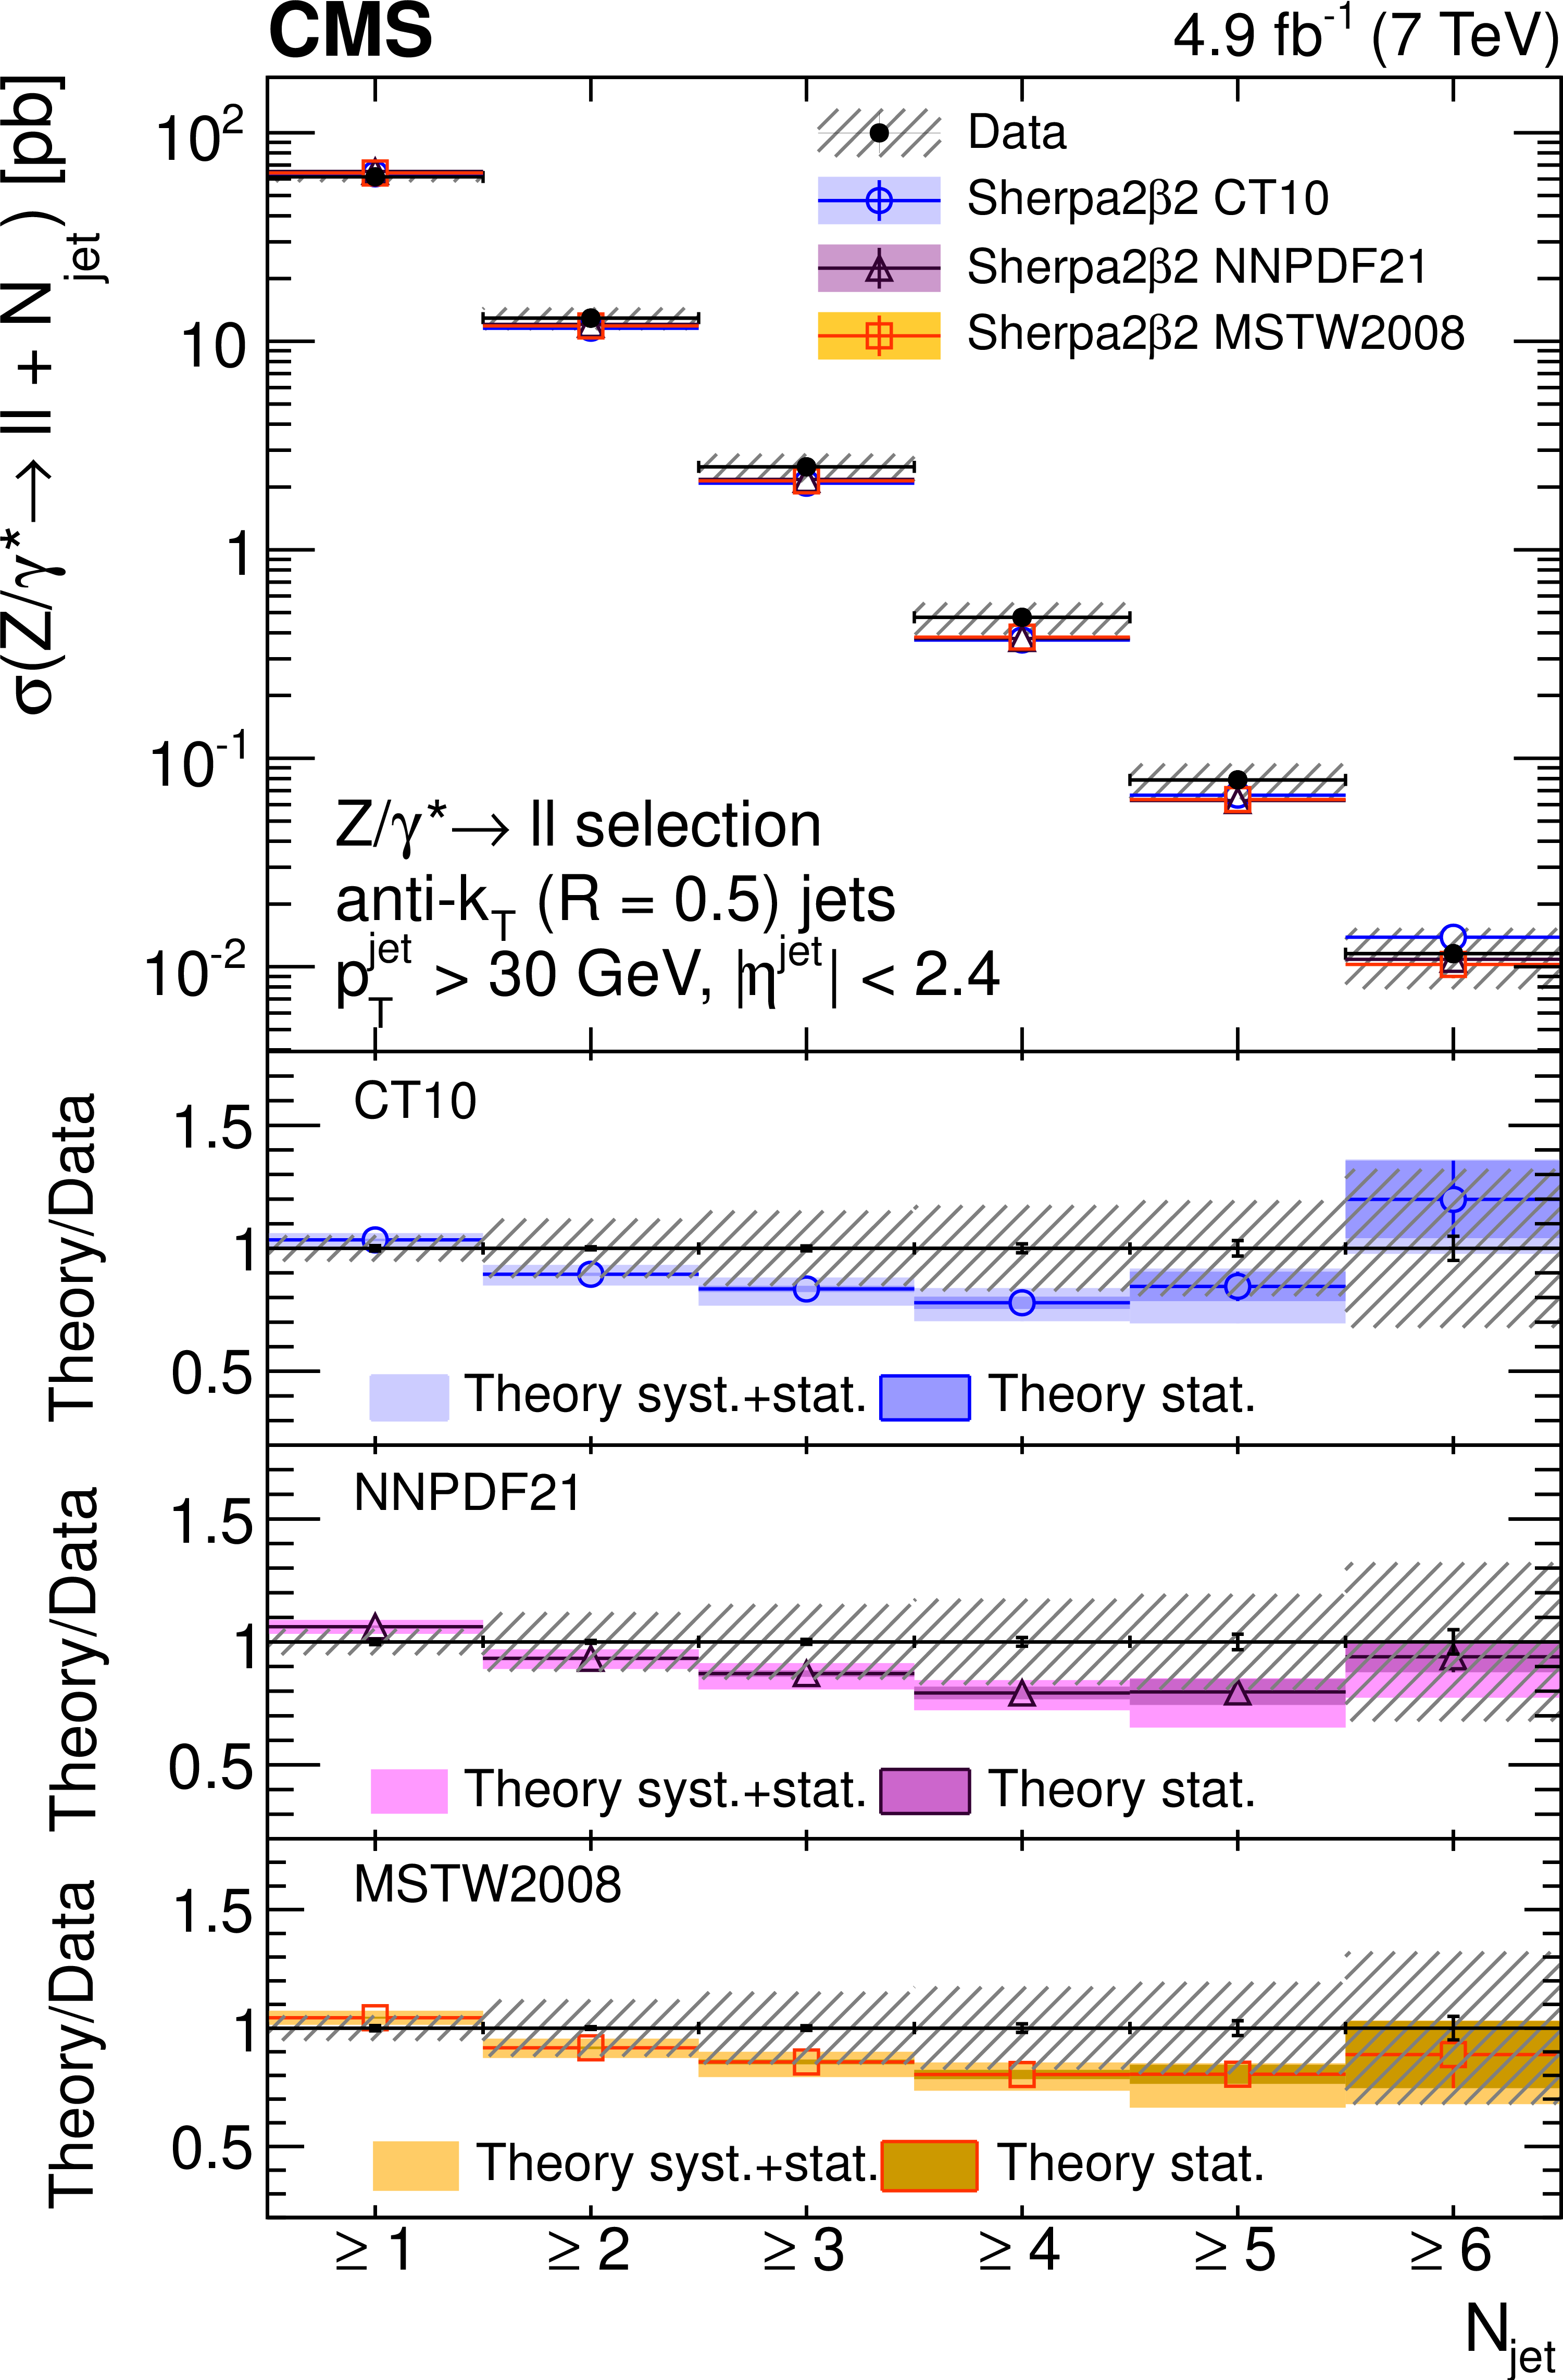
Figure 6-b:
Exclusive jet multiplicity distribution(a) and inclusive jet multiplicity distribution(b), after the unfolding procedure, compared with SHERPA predictions based on the PDF sets CT10, MSTW2008, and NNPDF2.1. Error bars around the experimental points represent the statistical uncertainty, while cross-hatched bands represent statistical plus systematic uncertainty. The bands around theory predictions correspond to the statistical uncertainty of the generated sample and to its combination with the theoretical PDF uncertainty. |

png pdf |
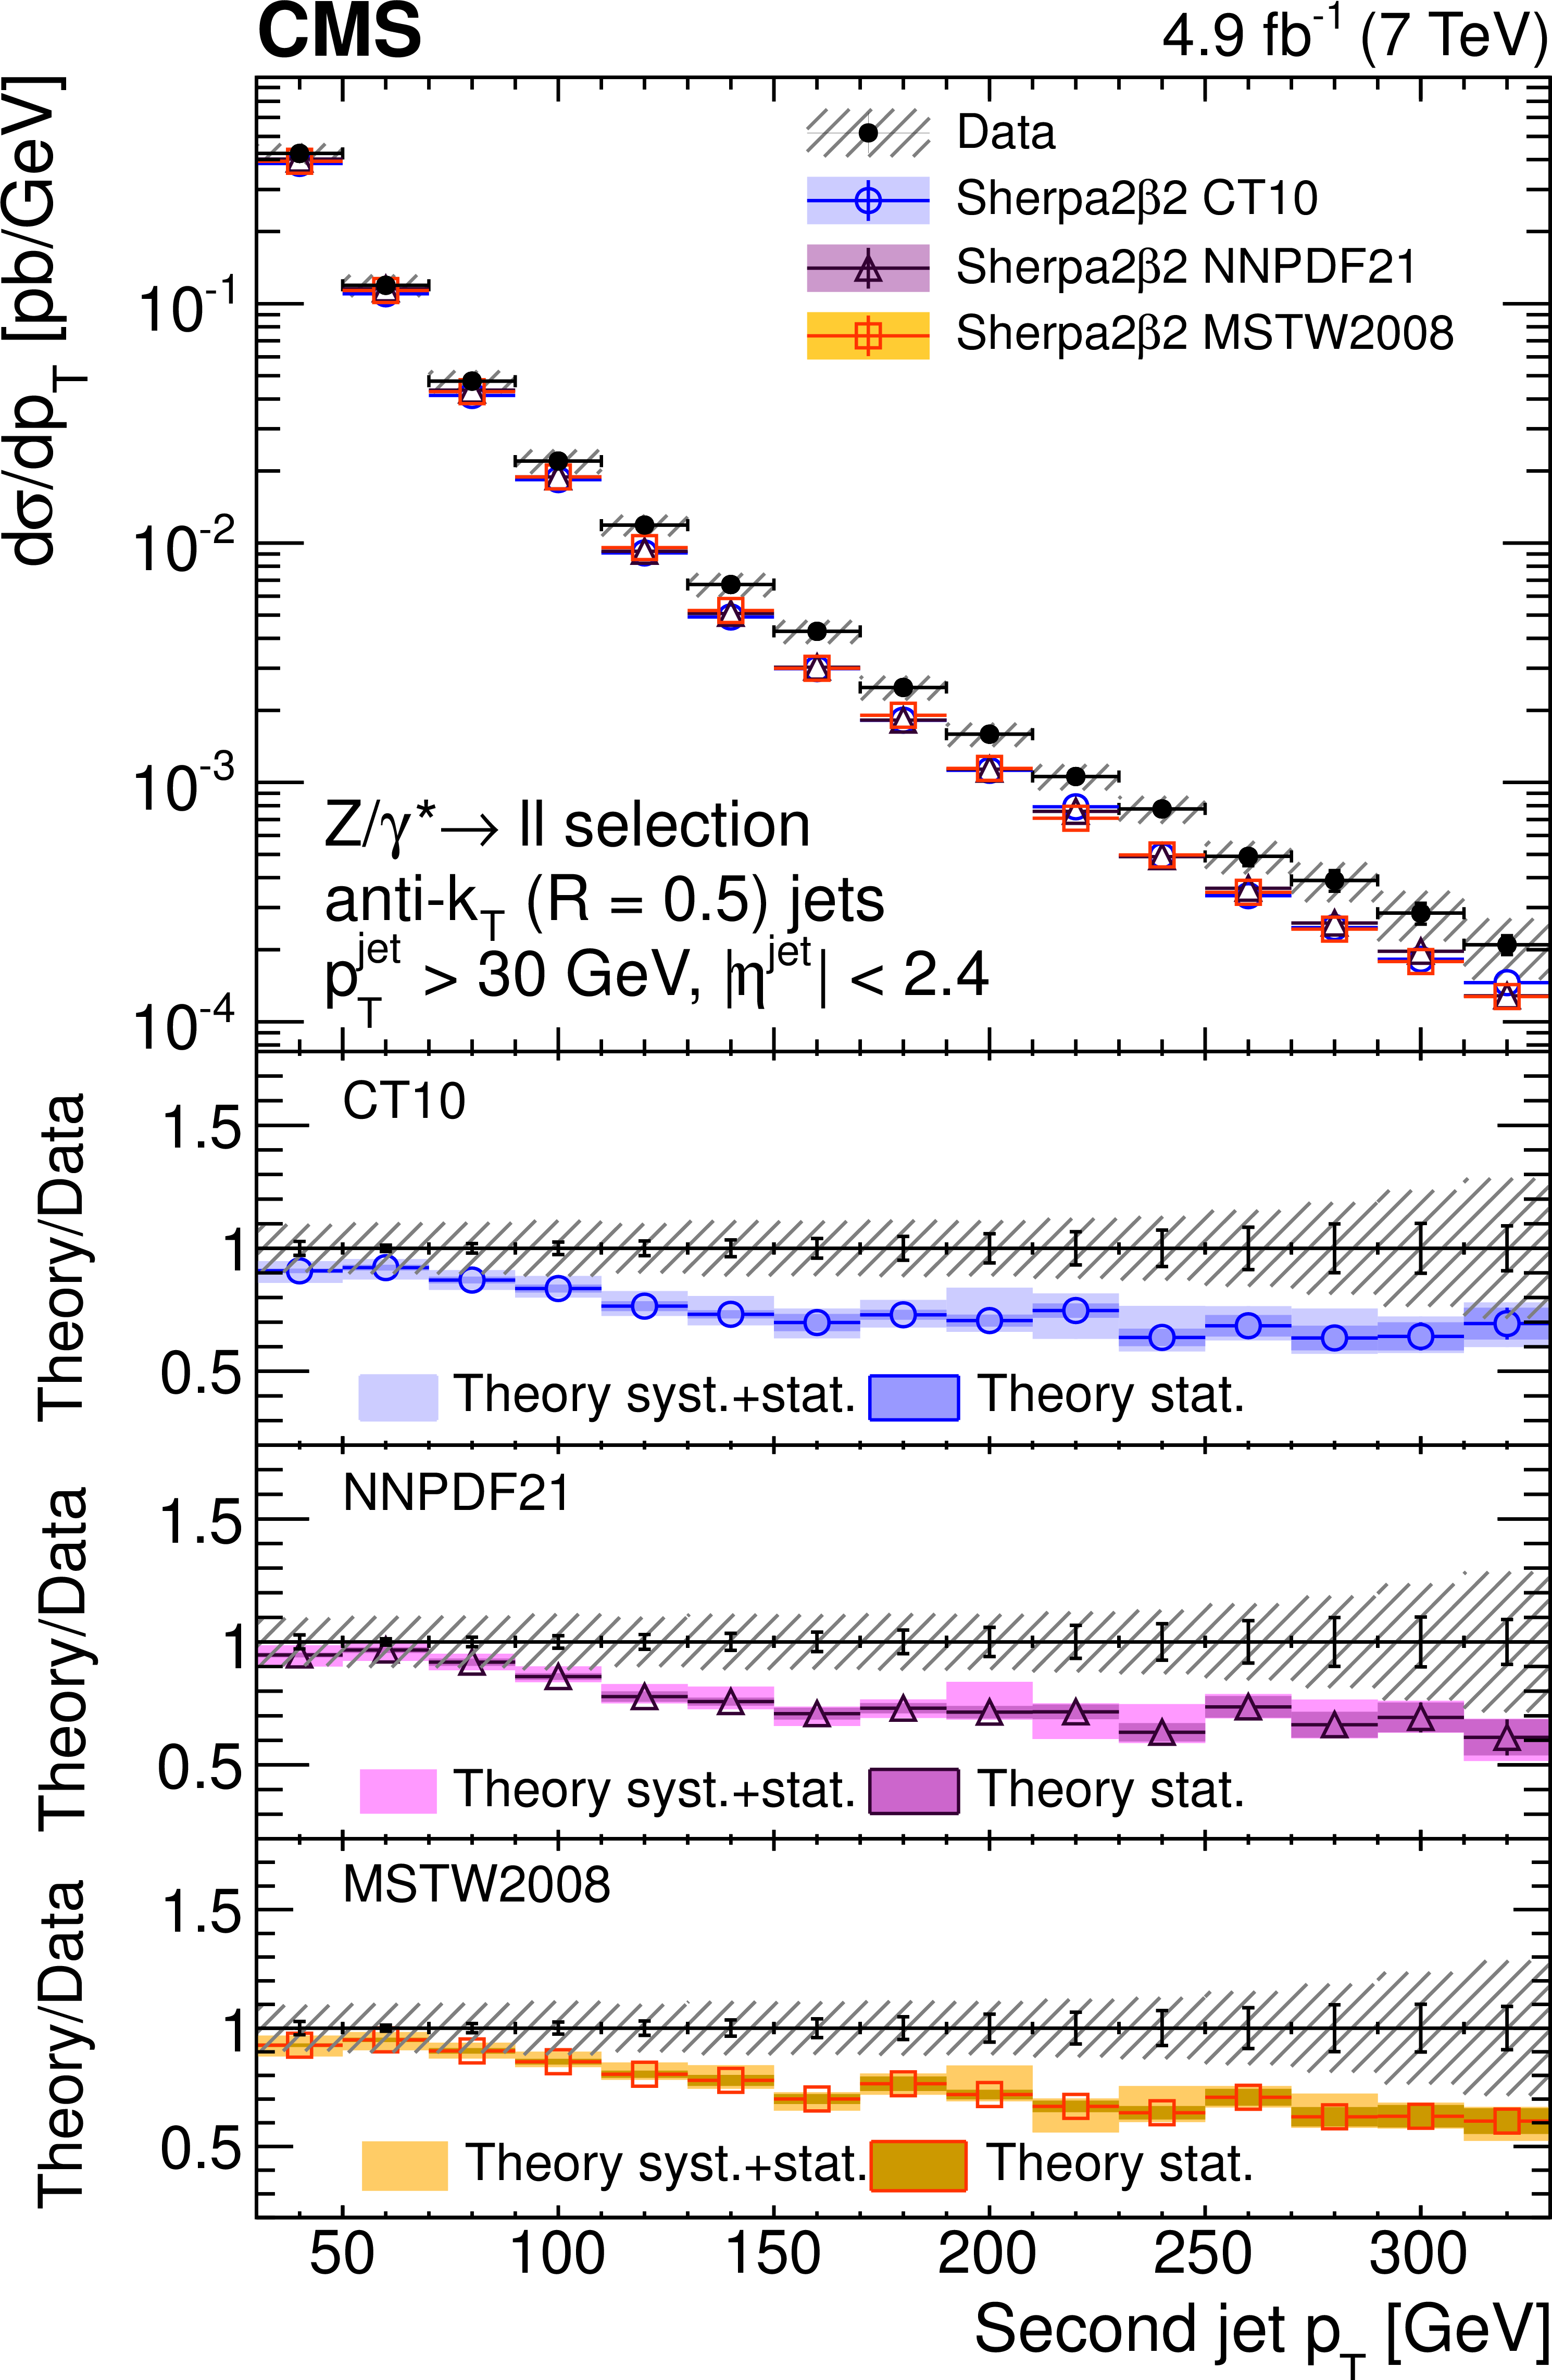
Figure 7-a:
Unfolded differential cross section as a function of $ {p_{\mathrm {T}}} $ for the first (a), second (b), third (c), and fourth (d) highest $ {p_{\mathrm {T}}} $ jets, compared with SHERPA predictions based on the PDF sets CT10, MSTW2008, and NNPDF2.1. Error bars around the experimental points represent the statistical uncertainty, while cross-hatched bands represent statistical plus systematic uncertainty. The bands around theory predictions correspond to the statistical uncertainty of the generated sample and to its combination with the theoretical PDF uncertainty. |
png pdf |
Figure 7-b:
Unfolded differential cross section as a function of $ {p_{\mathrm {T}}} $ for the first (a), second (b), third (c), and fourth (d) highest $ {p_{\mathrm {T}}} $ jets, compared with SHERPA predictions based on the PDF sets CT10, MSTW2008, and NNPDF2.1. Error bars around the experimental points represent the statistical uncertainty, while cross-hatched bands represent statistical plus systematic uncertainty. The bands around theory predictions correspond to the statistical uncertainty of the generated sample and to its combination with the theoretical PDF uncertainty. |
png pdf |
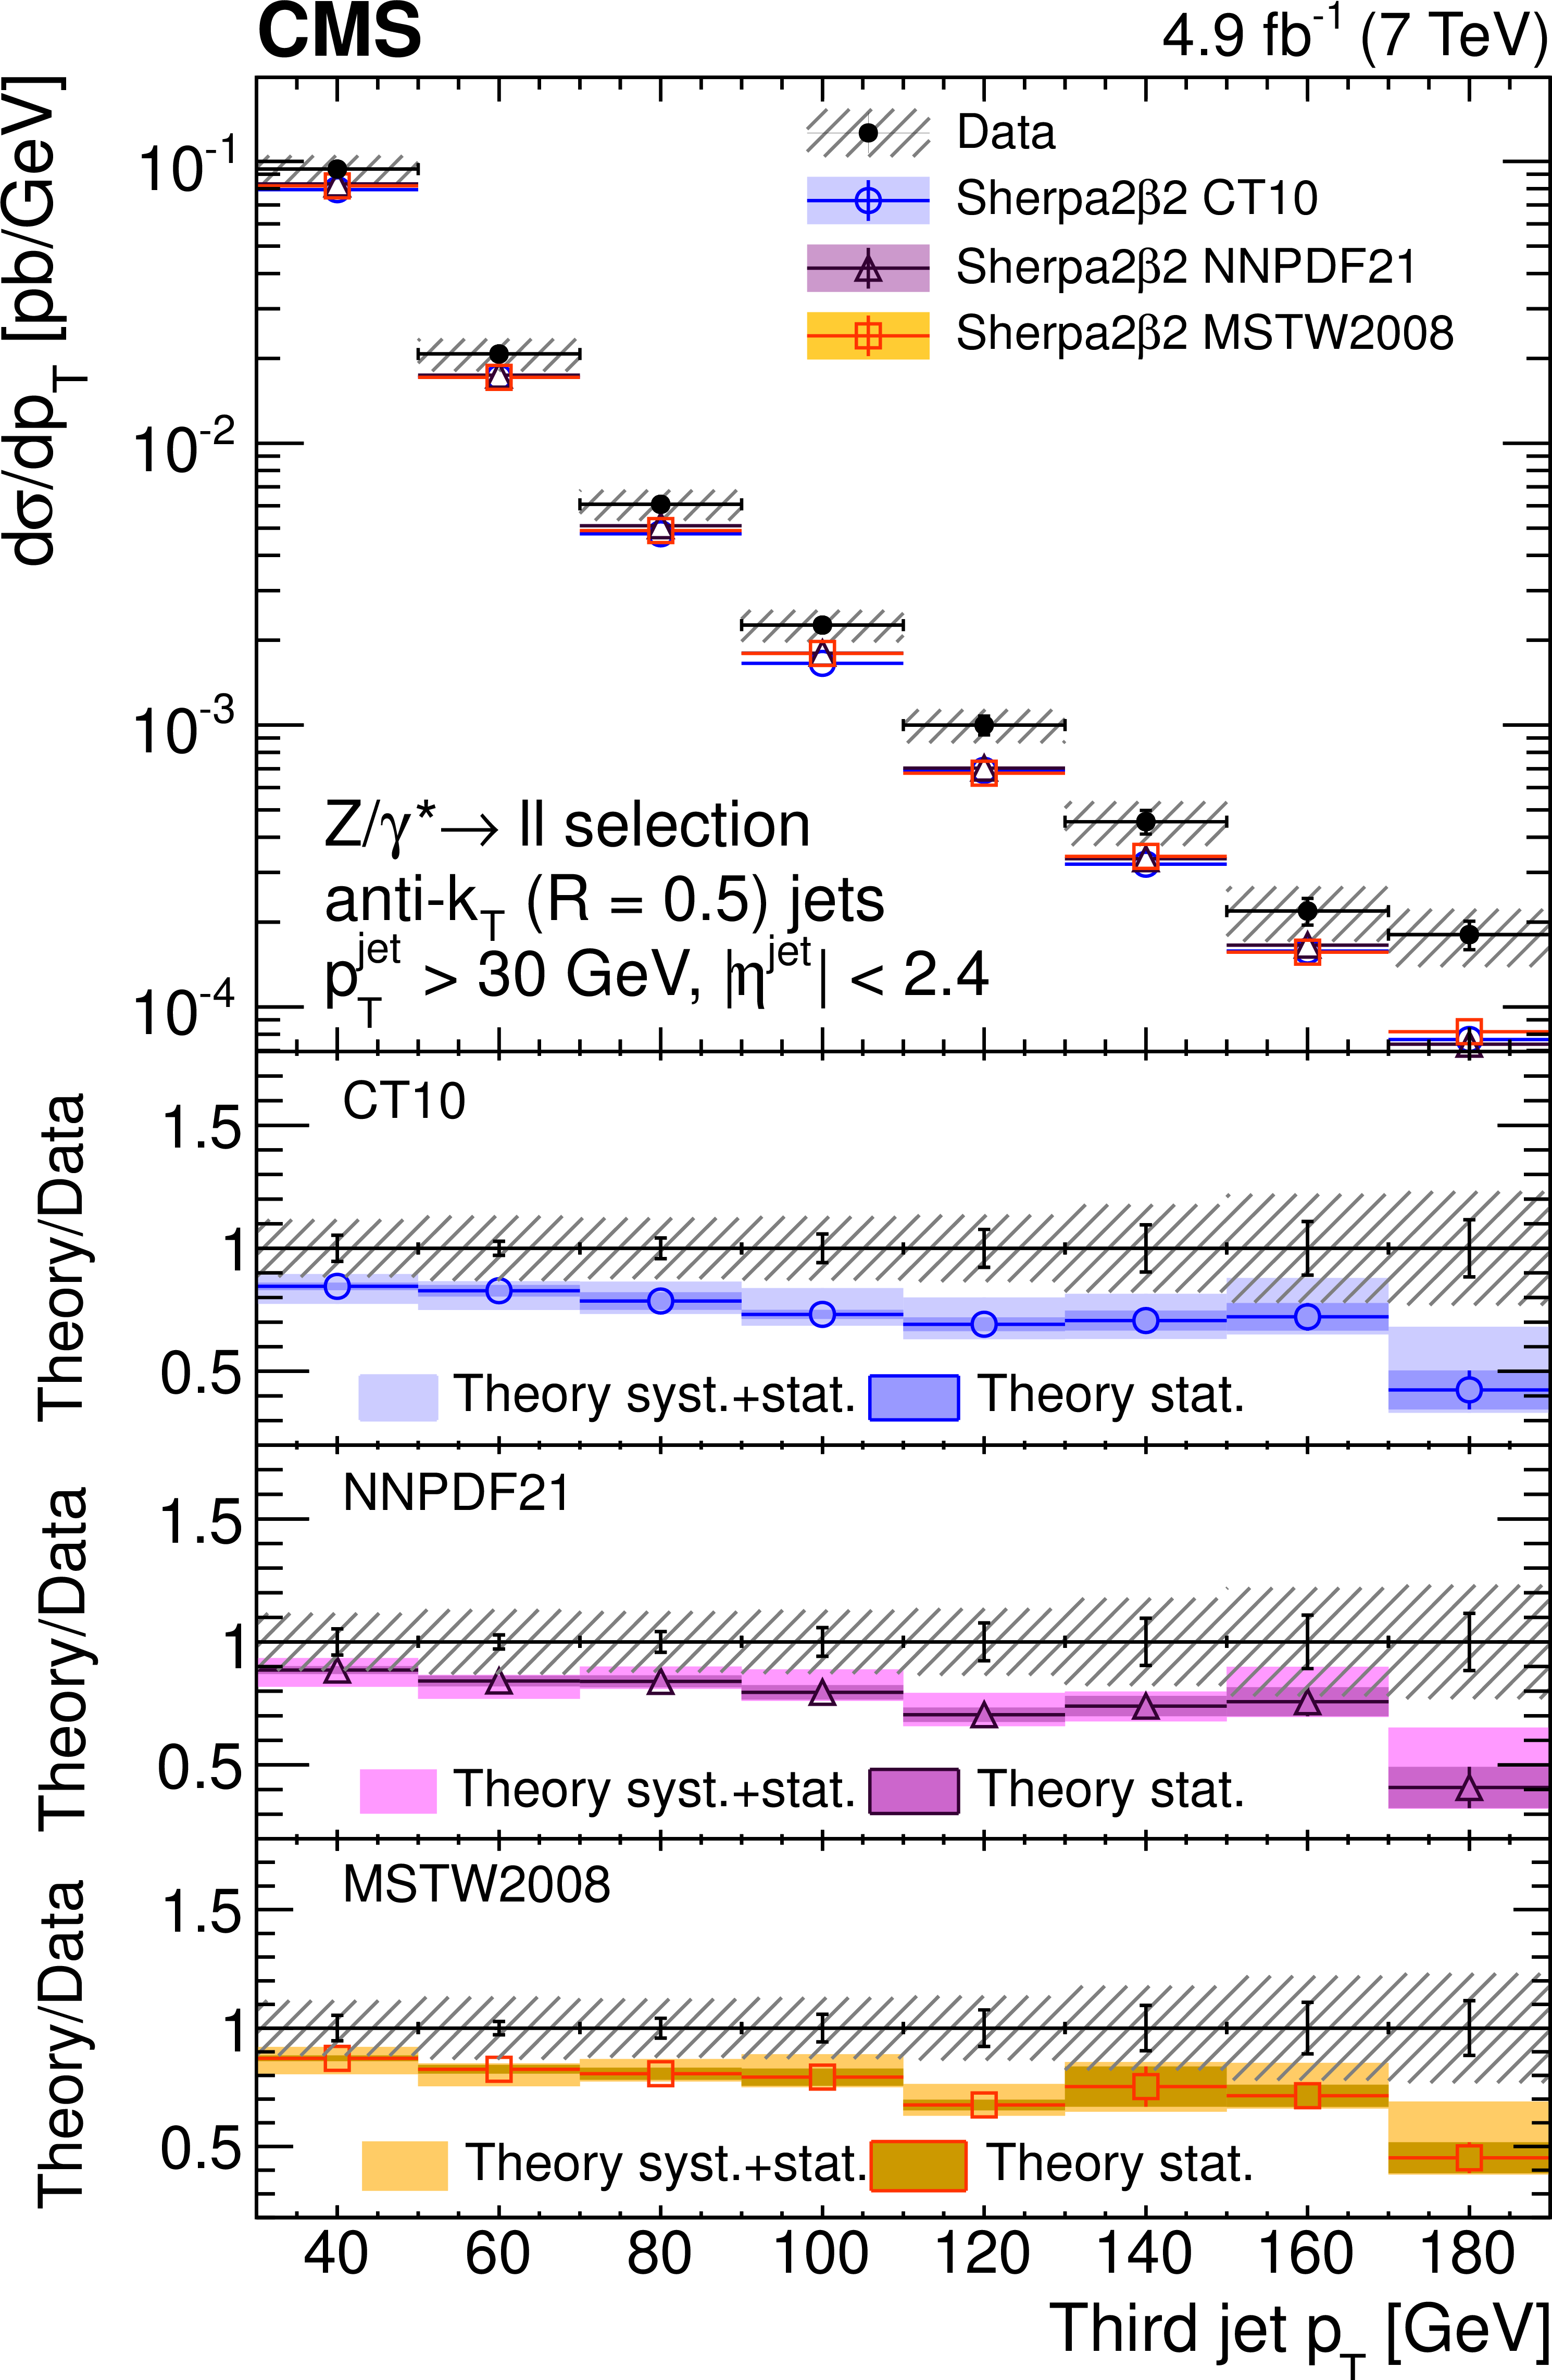
Figure 7-c:
Unfolded differential cross section as a function of $ {p_{\mathrm {T}}} $ for the first (a), second (b), third (c), and fourth (d) highest $ {p_{\mathrm {T}}} $ jets, compared with SHERPA predictions based on the PDF sets CT10, MSTW2008, and NNPDF2.1. Error bars around the experimental points represent the statistical uncertainty, while cross-hatched bands represent statistical plus systematic uncertainty. The bands around theory predictions correspond to the statistical uncertainty of the generated sample and to its combination with the theoretical PDF uncertainty. |
png pdf |
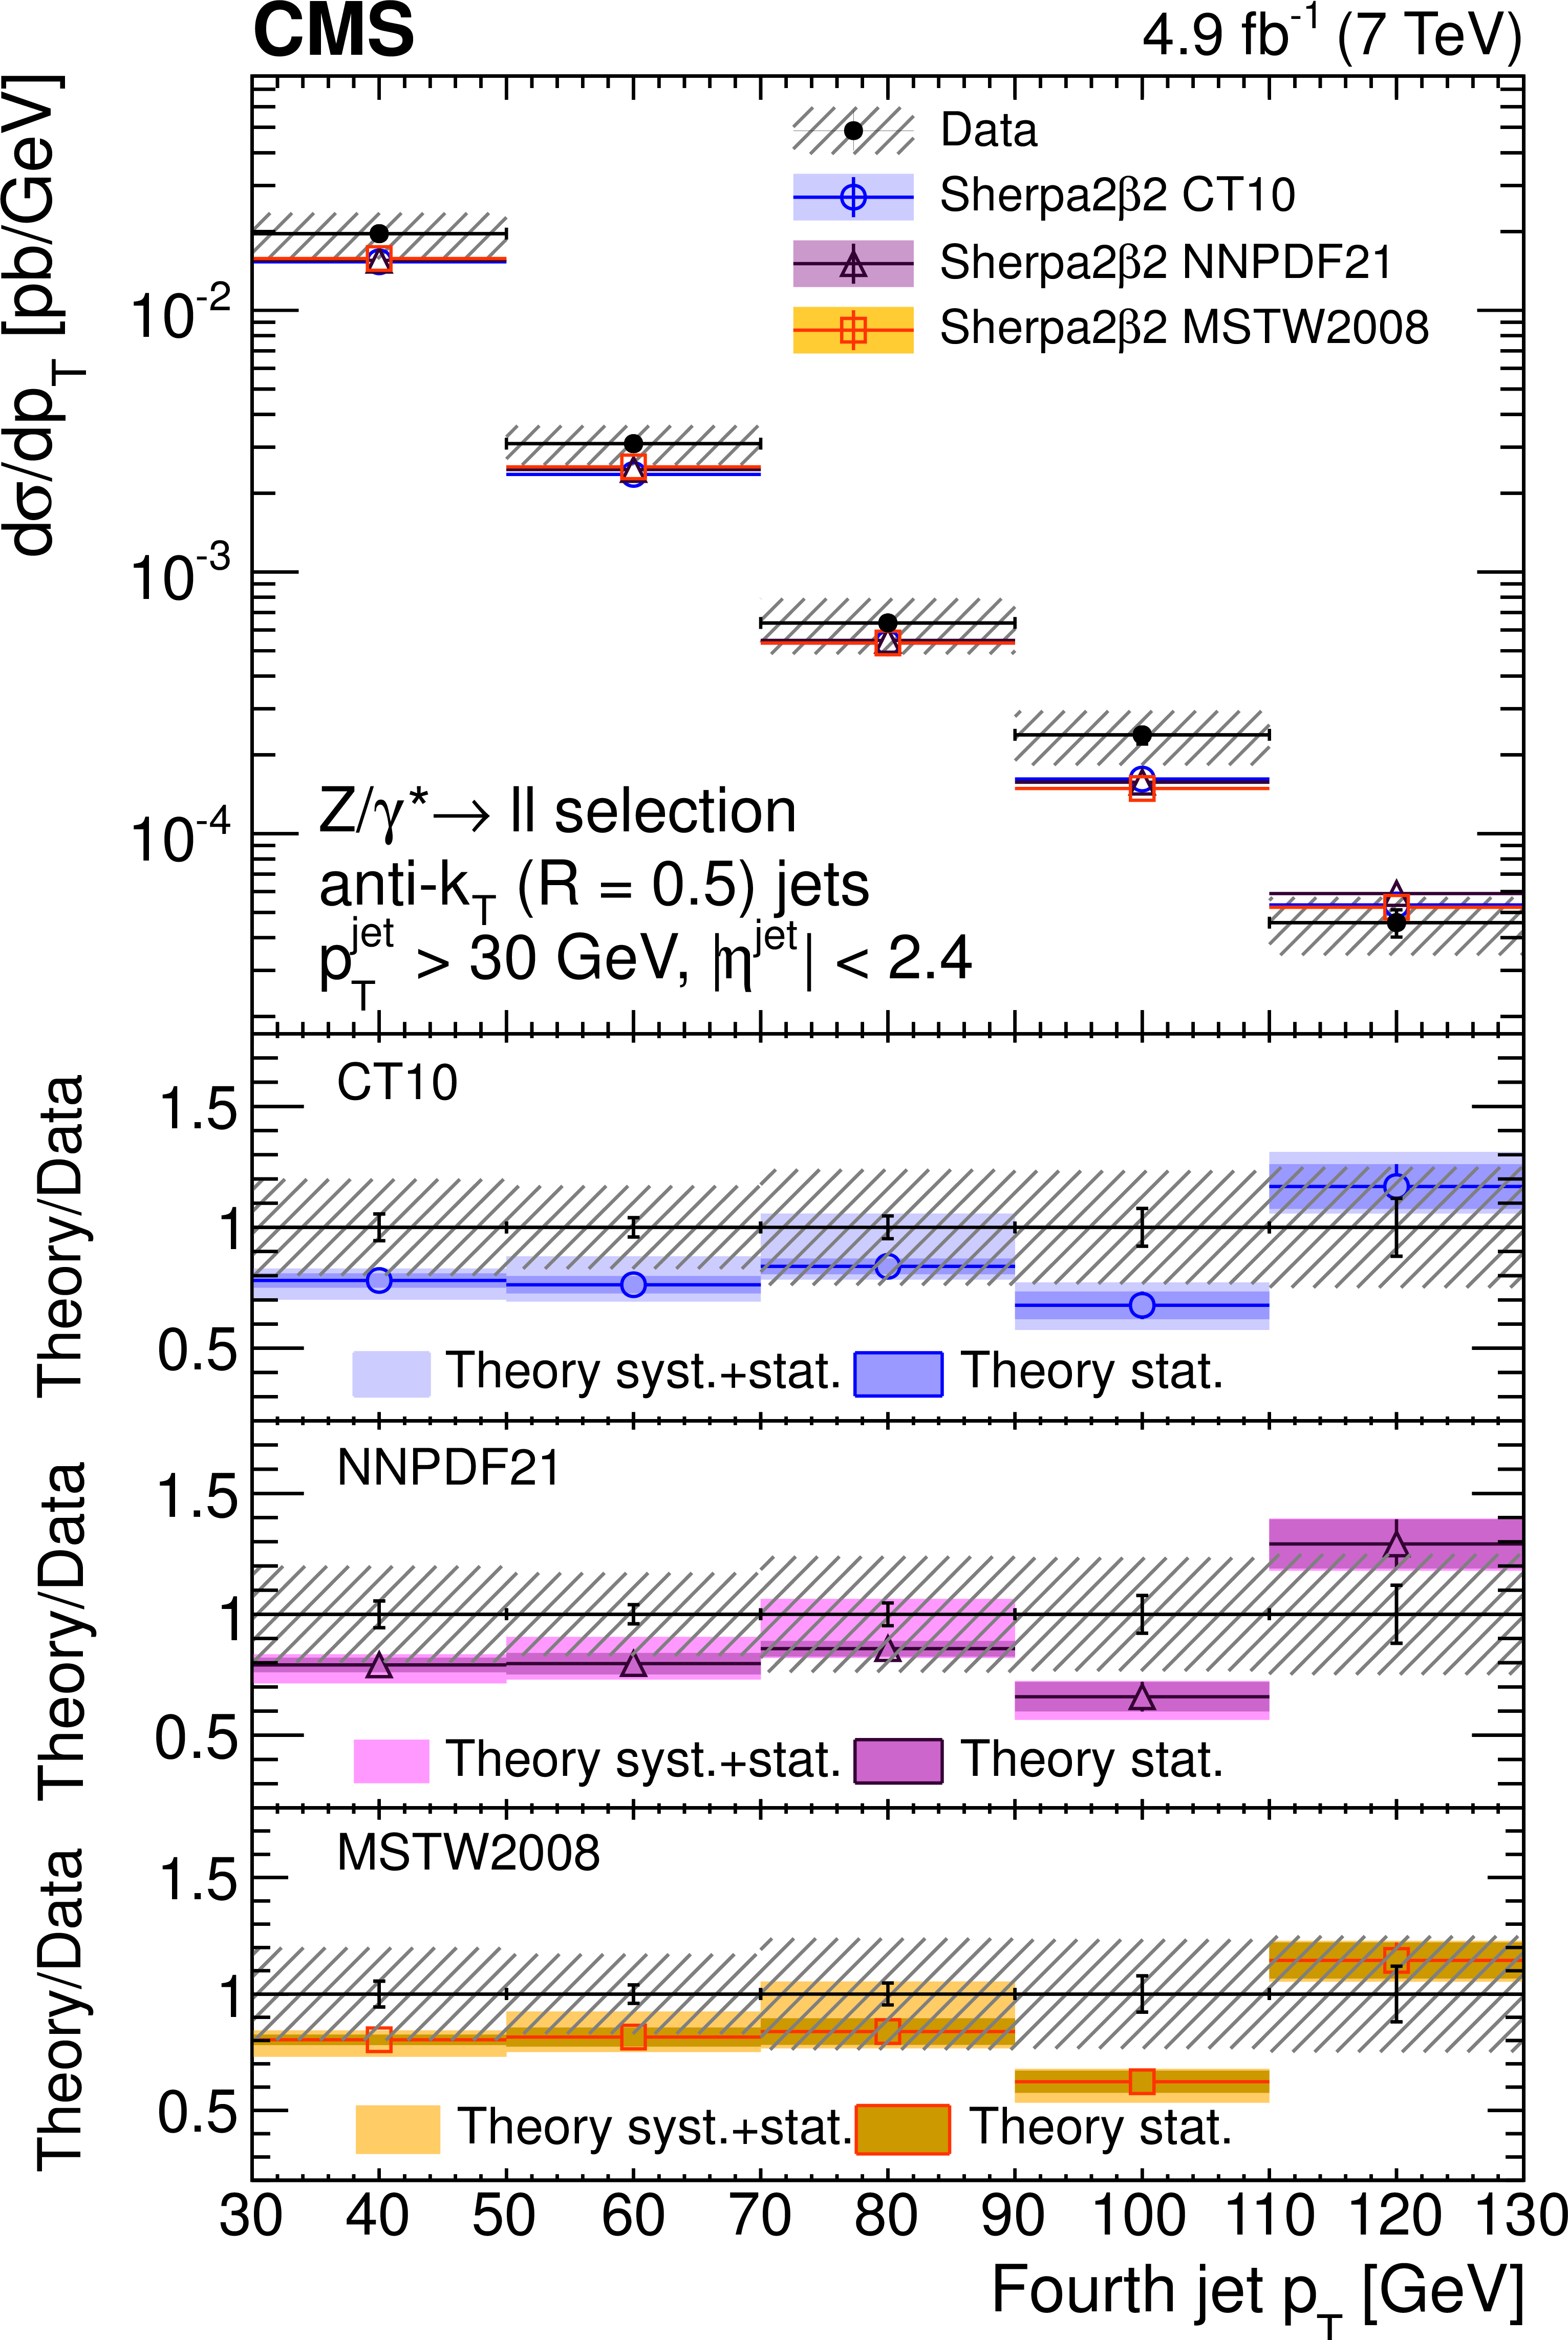
Figure 7-d:
Unfolded differential cross section as a function of $ {p_{\mathrm {T}}} $ for the first (a), second (b), third (c), and fourth (d) highest $ {p_{\mathrm {T}}} $ jets, compared with SHERPA predictions based on the PDF sets CT10, MSTW2008, and NNPDF2.1. Error bars around the experimental points represent the statistical uncertainty, while cross-hatched bands represent statistical plus systematic uncertainty. The bands around theory predictions correspond to the statistical uncertainty of the generated sample and to its combination with the theoretical PDF uncertainty. |
png pdf |
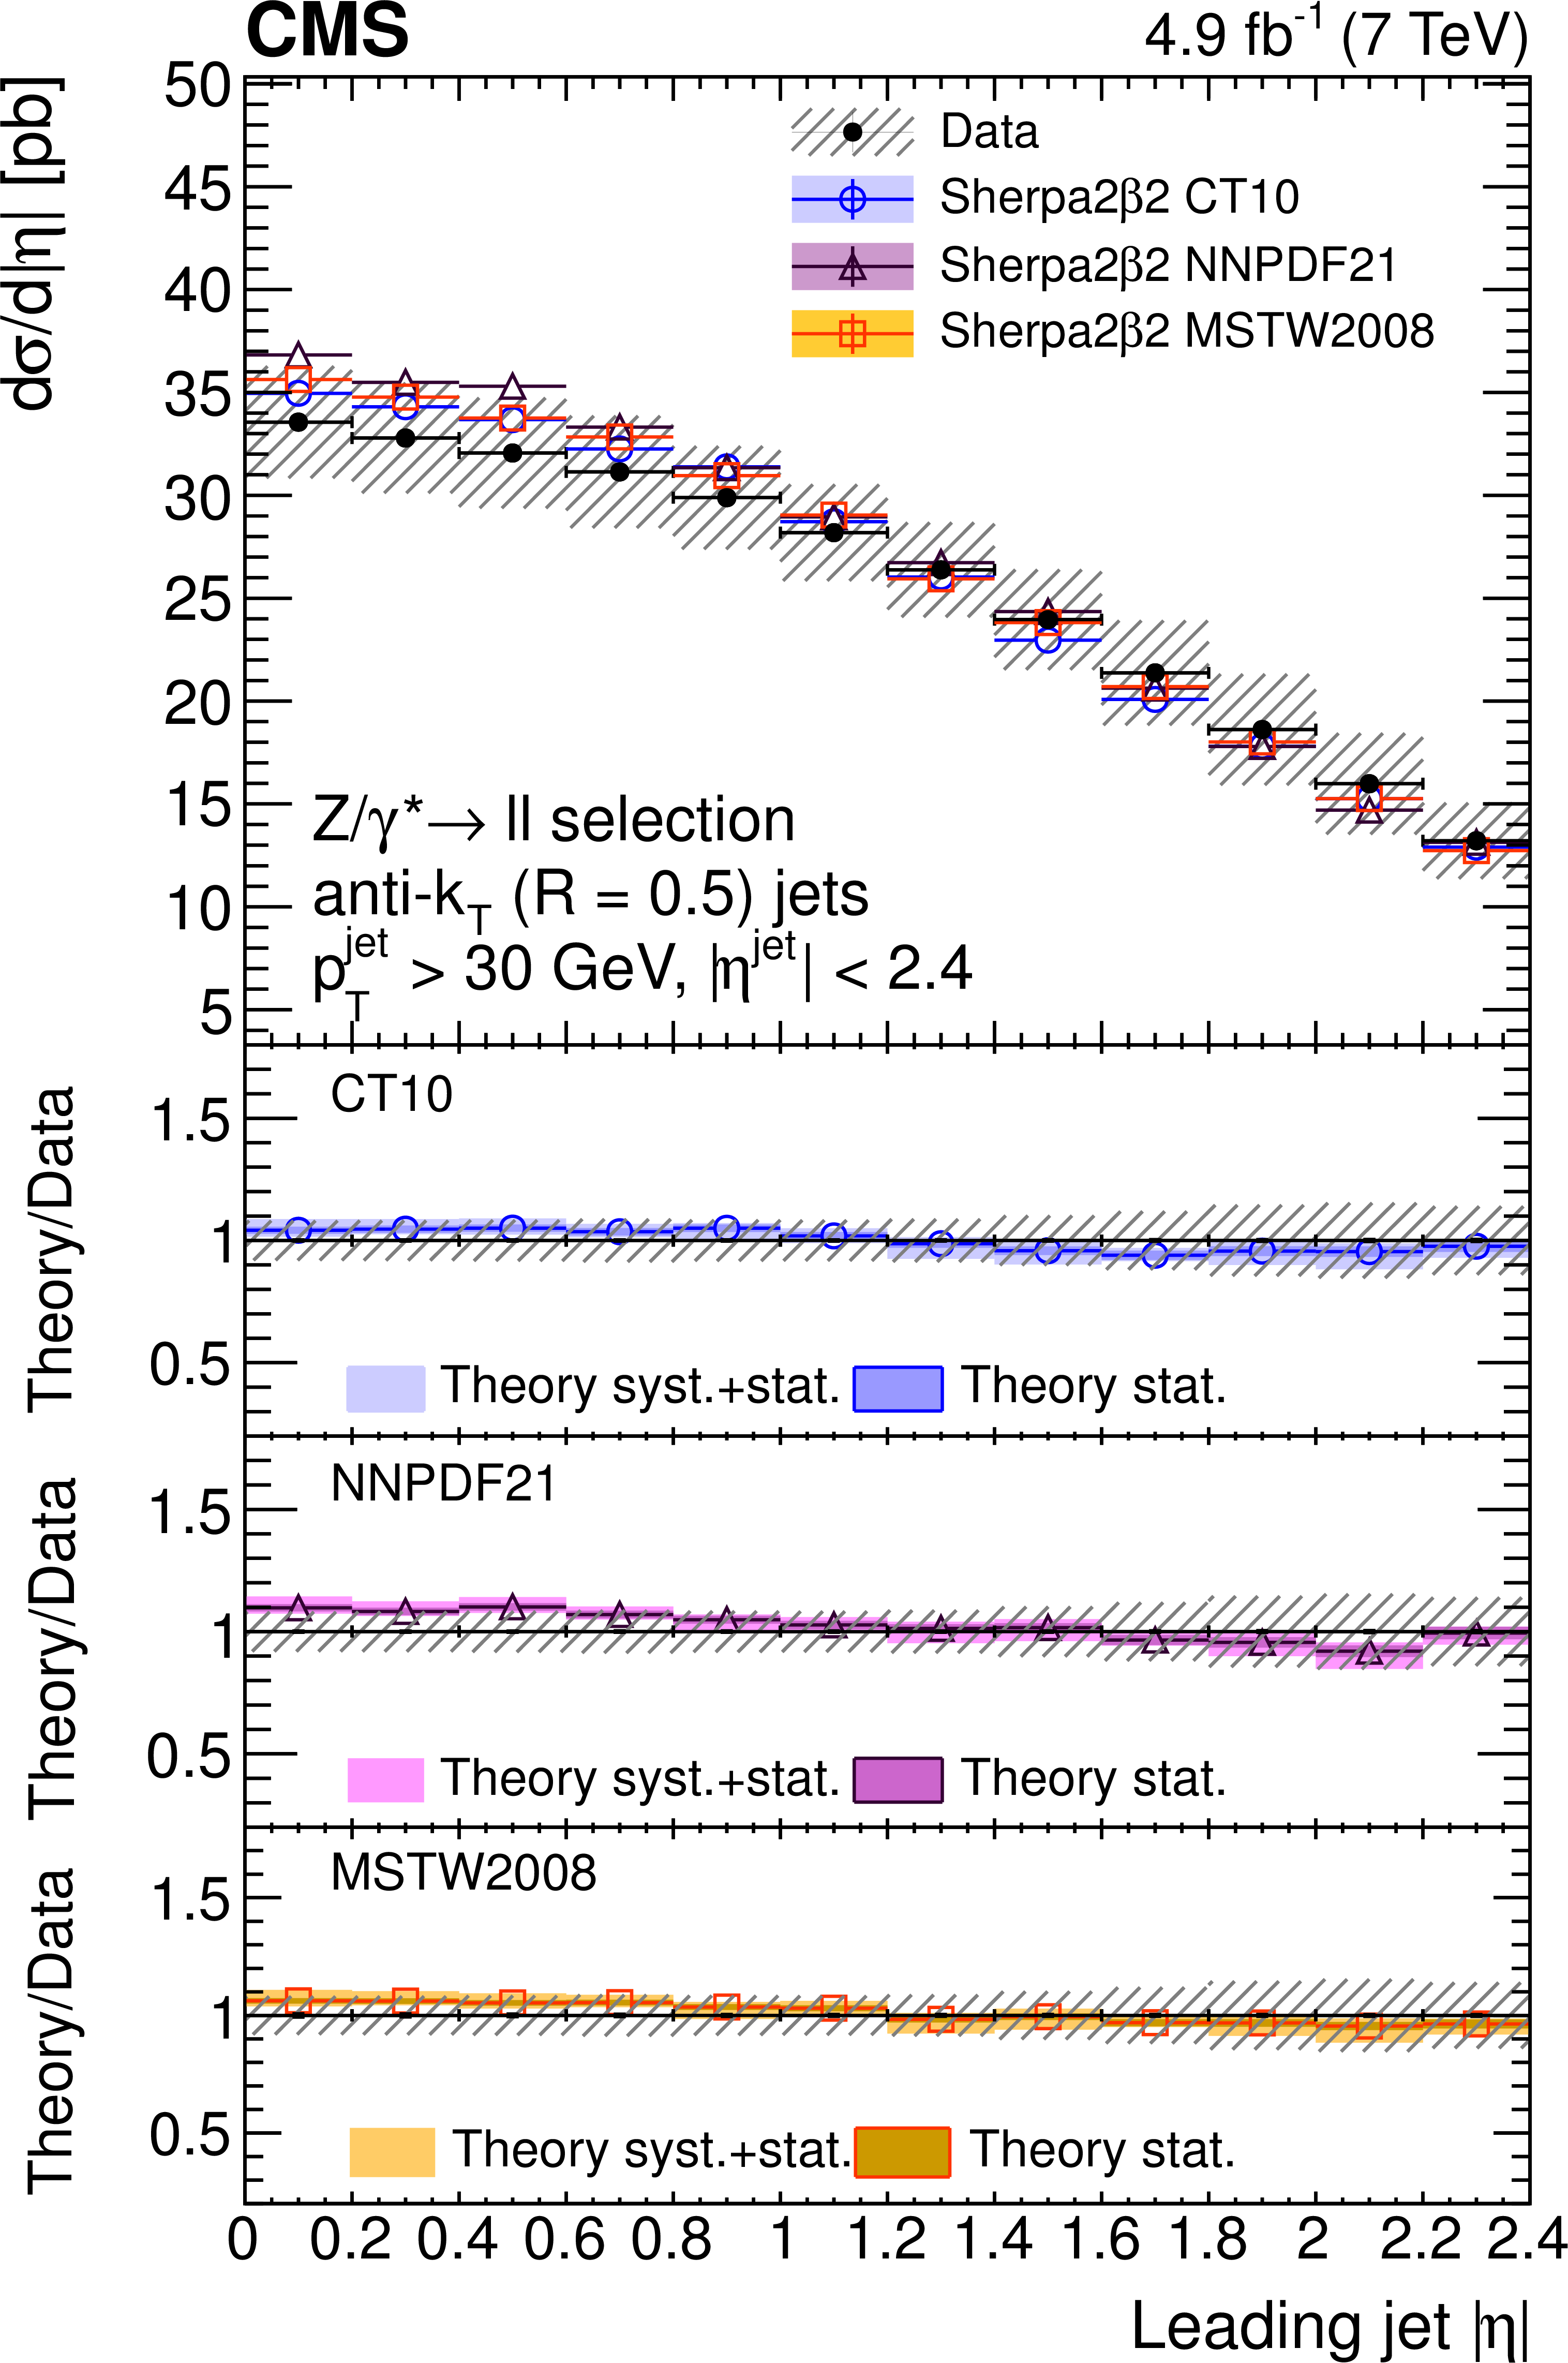
Figure 8-a:
Unfolded differential cross section as a function of the jet absolute pseudorapidity $ {| \eta | }$ for the first (a), second (b), third (c), and fourth (d) highest $ {p_{\mathrm {T}}} $ jets, compared with SHERPA predictions based on the PDF sets CT10, MSTW2008, and NNPDF2.1. Error bars around the experimental points represent the statistical uncertainty, while cross-hatched bands represent statistical plus systematic uncertainty. The bands around theory predictions correspond to the statistical uncertainty of the generated sample and to its combination with the theoretical PDF uncertainty. |
png pdf |
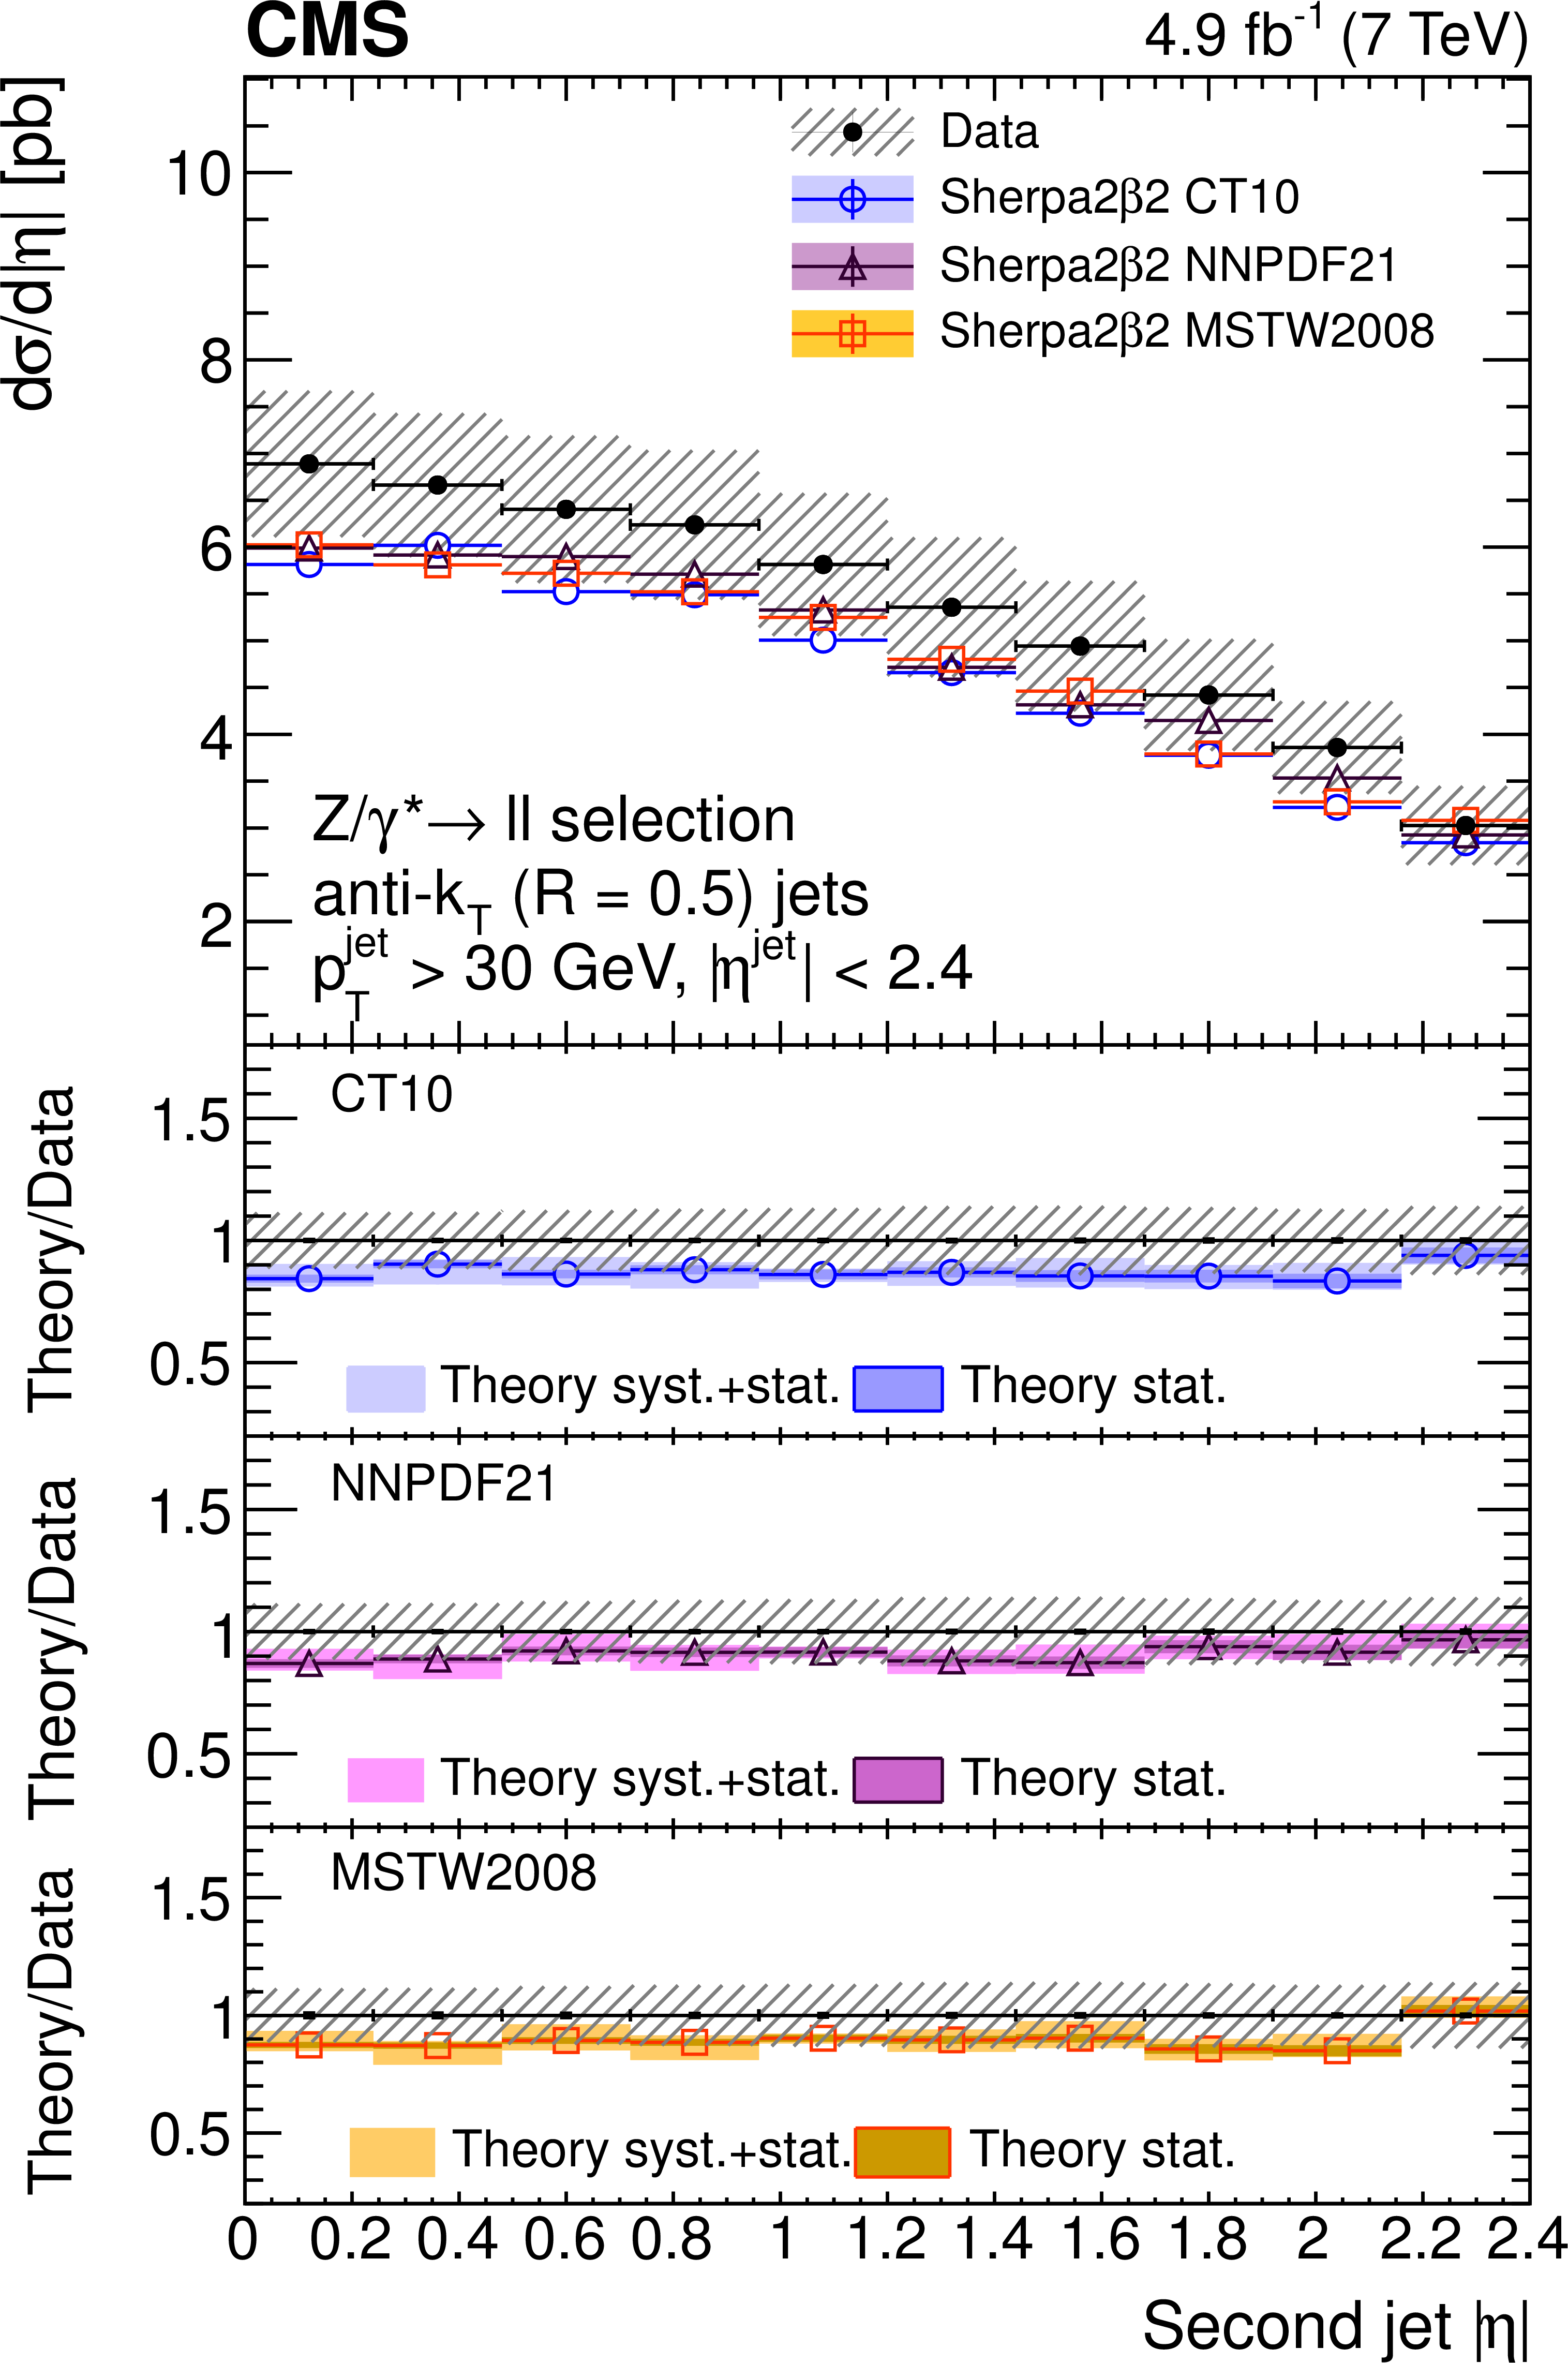
Figure 8-b:
Unfolded differential cross section as a function of the jet absolute pseudorapidity $ {| \eta | }$ for the first (a), second (b), third (c), and fourth (d) highest $ {p_{\mathrm {T}}} $ jets, compared with SHERPA predictions based on the PDF sets CT10, MSTW2008, and NNPDF2.1. Error bars around the experimental points represent the statistical uncertainty, while cross-hatched bands represent statistical plus systematic uncertainty. The bands around theory predictions correspond to the statistical uncertainty of the generated sample and to its combination with the theoretical PDF uncertainty. |
png pdf |
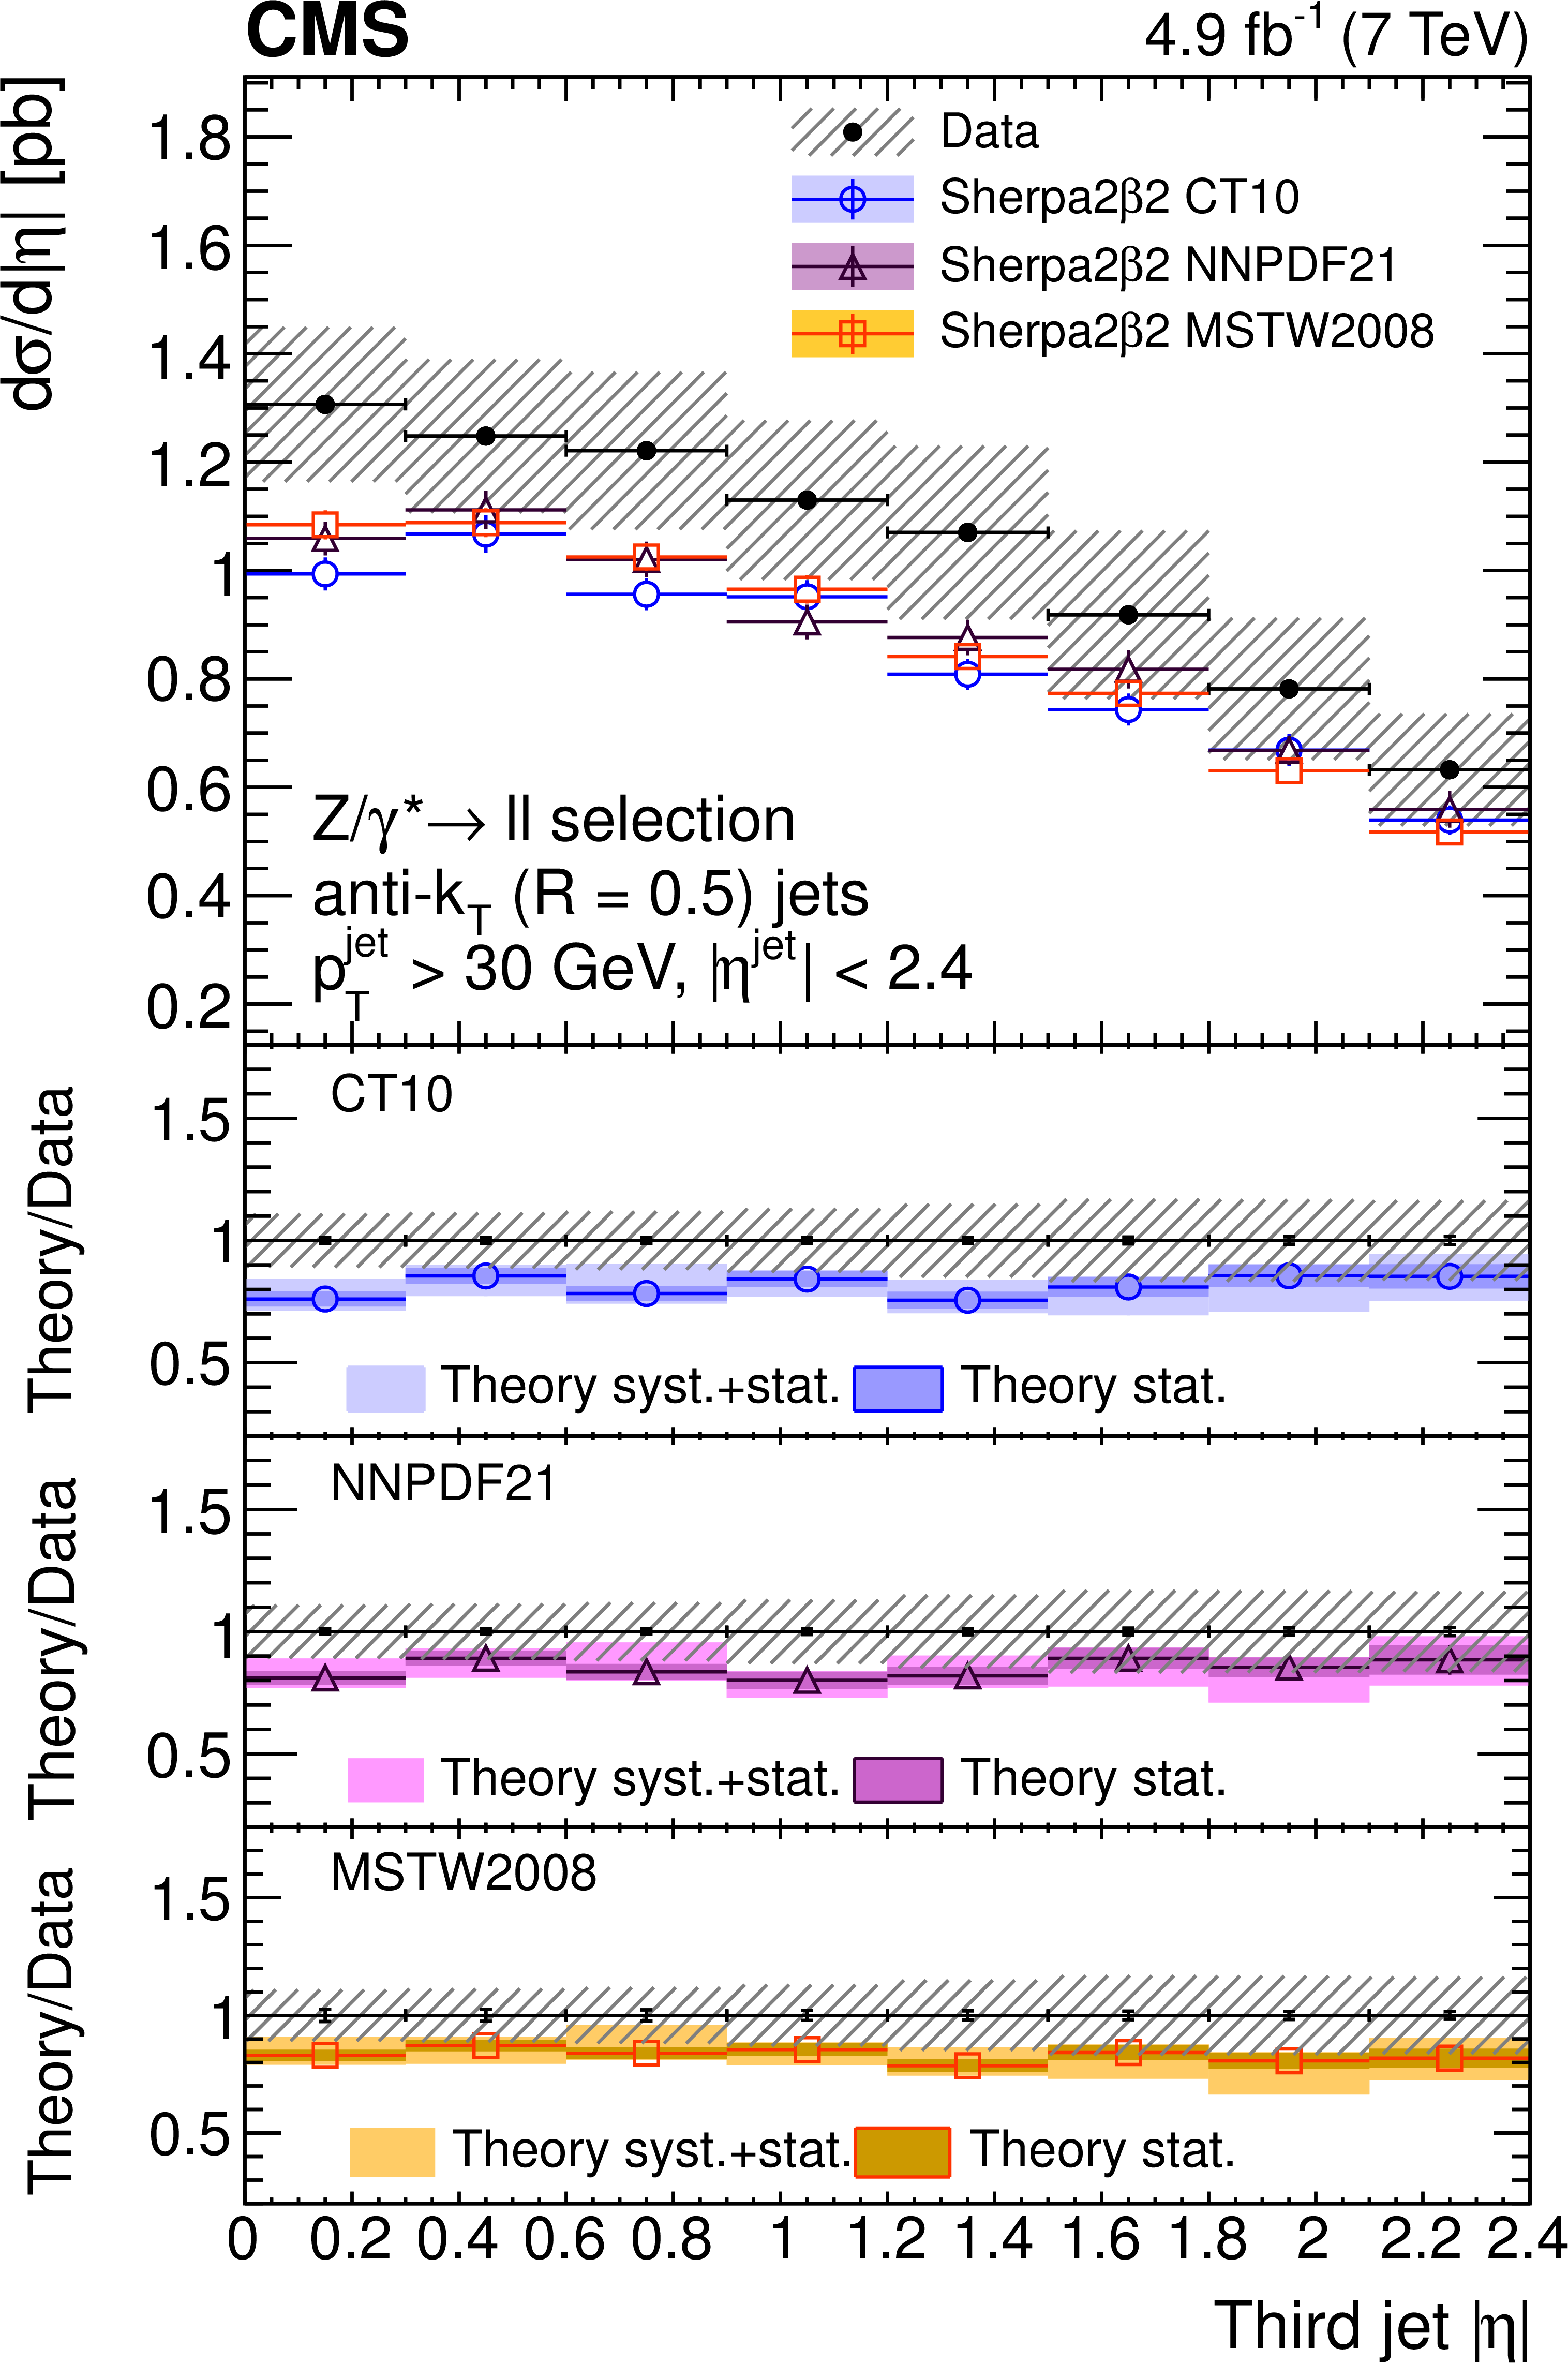
Figure 8-c:
Unfolded differential cross section as a function of the jet absolute pseudorapidity $ {| \eta | }$ for the first (a), second (b), third (c), and fourth (d) highest $ {p_{\mathrm {T}}} $ jets, compared with SHERPA predictions based on the PDF sets CT10, MSTW2008, and NNPDF2.1. Error bars around the experimental points represent the statistical uncertainty, while cross-hatched bands represent statistical plus systematic uncertainty. The bands around theory predictions correspond to the statistical uncertainty of the generated sample and to its combination with the theoretical PDF uncertainty. |
png pdf |
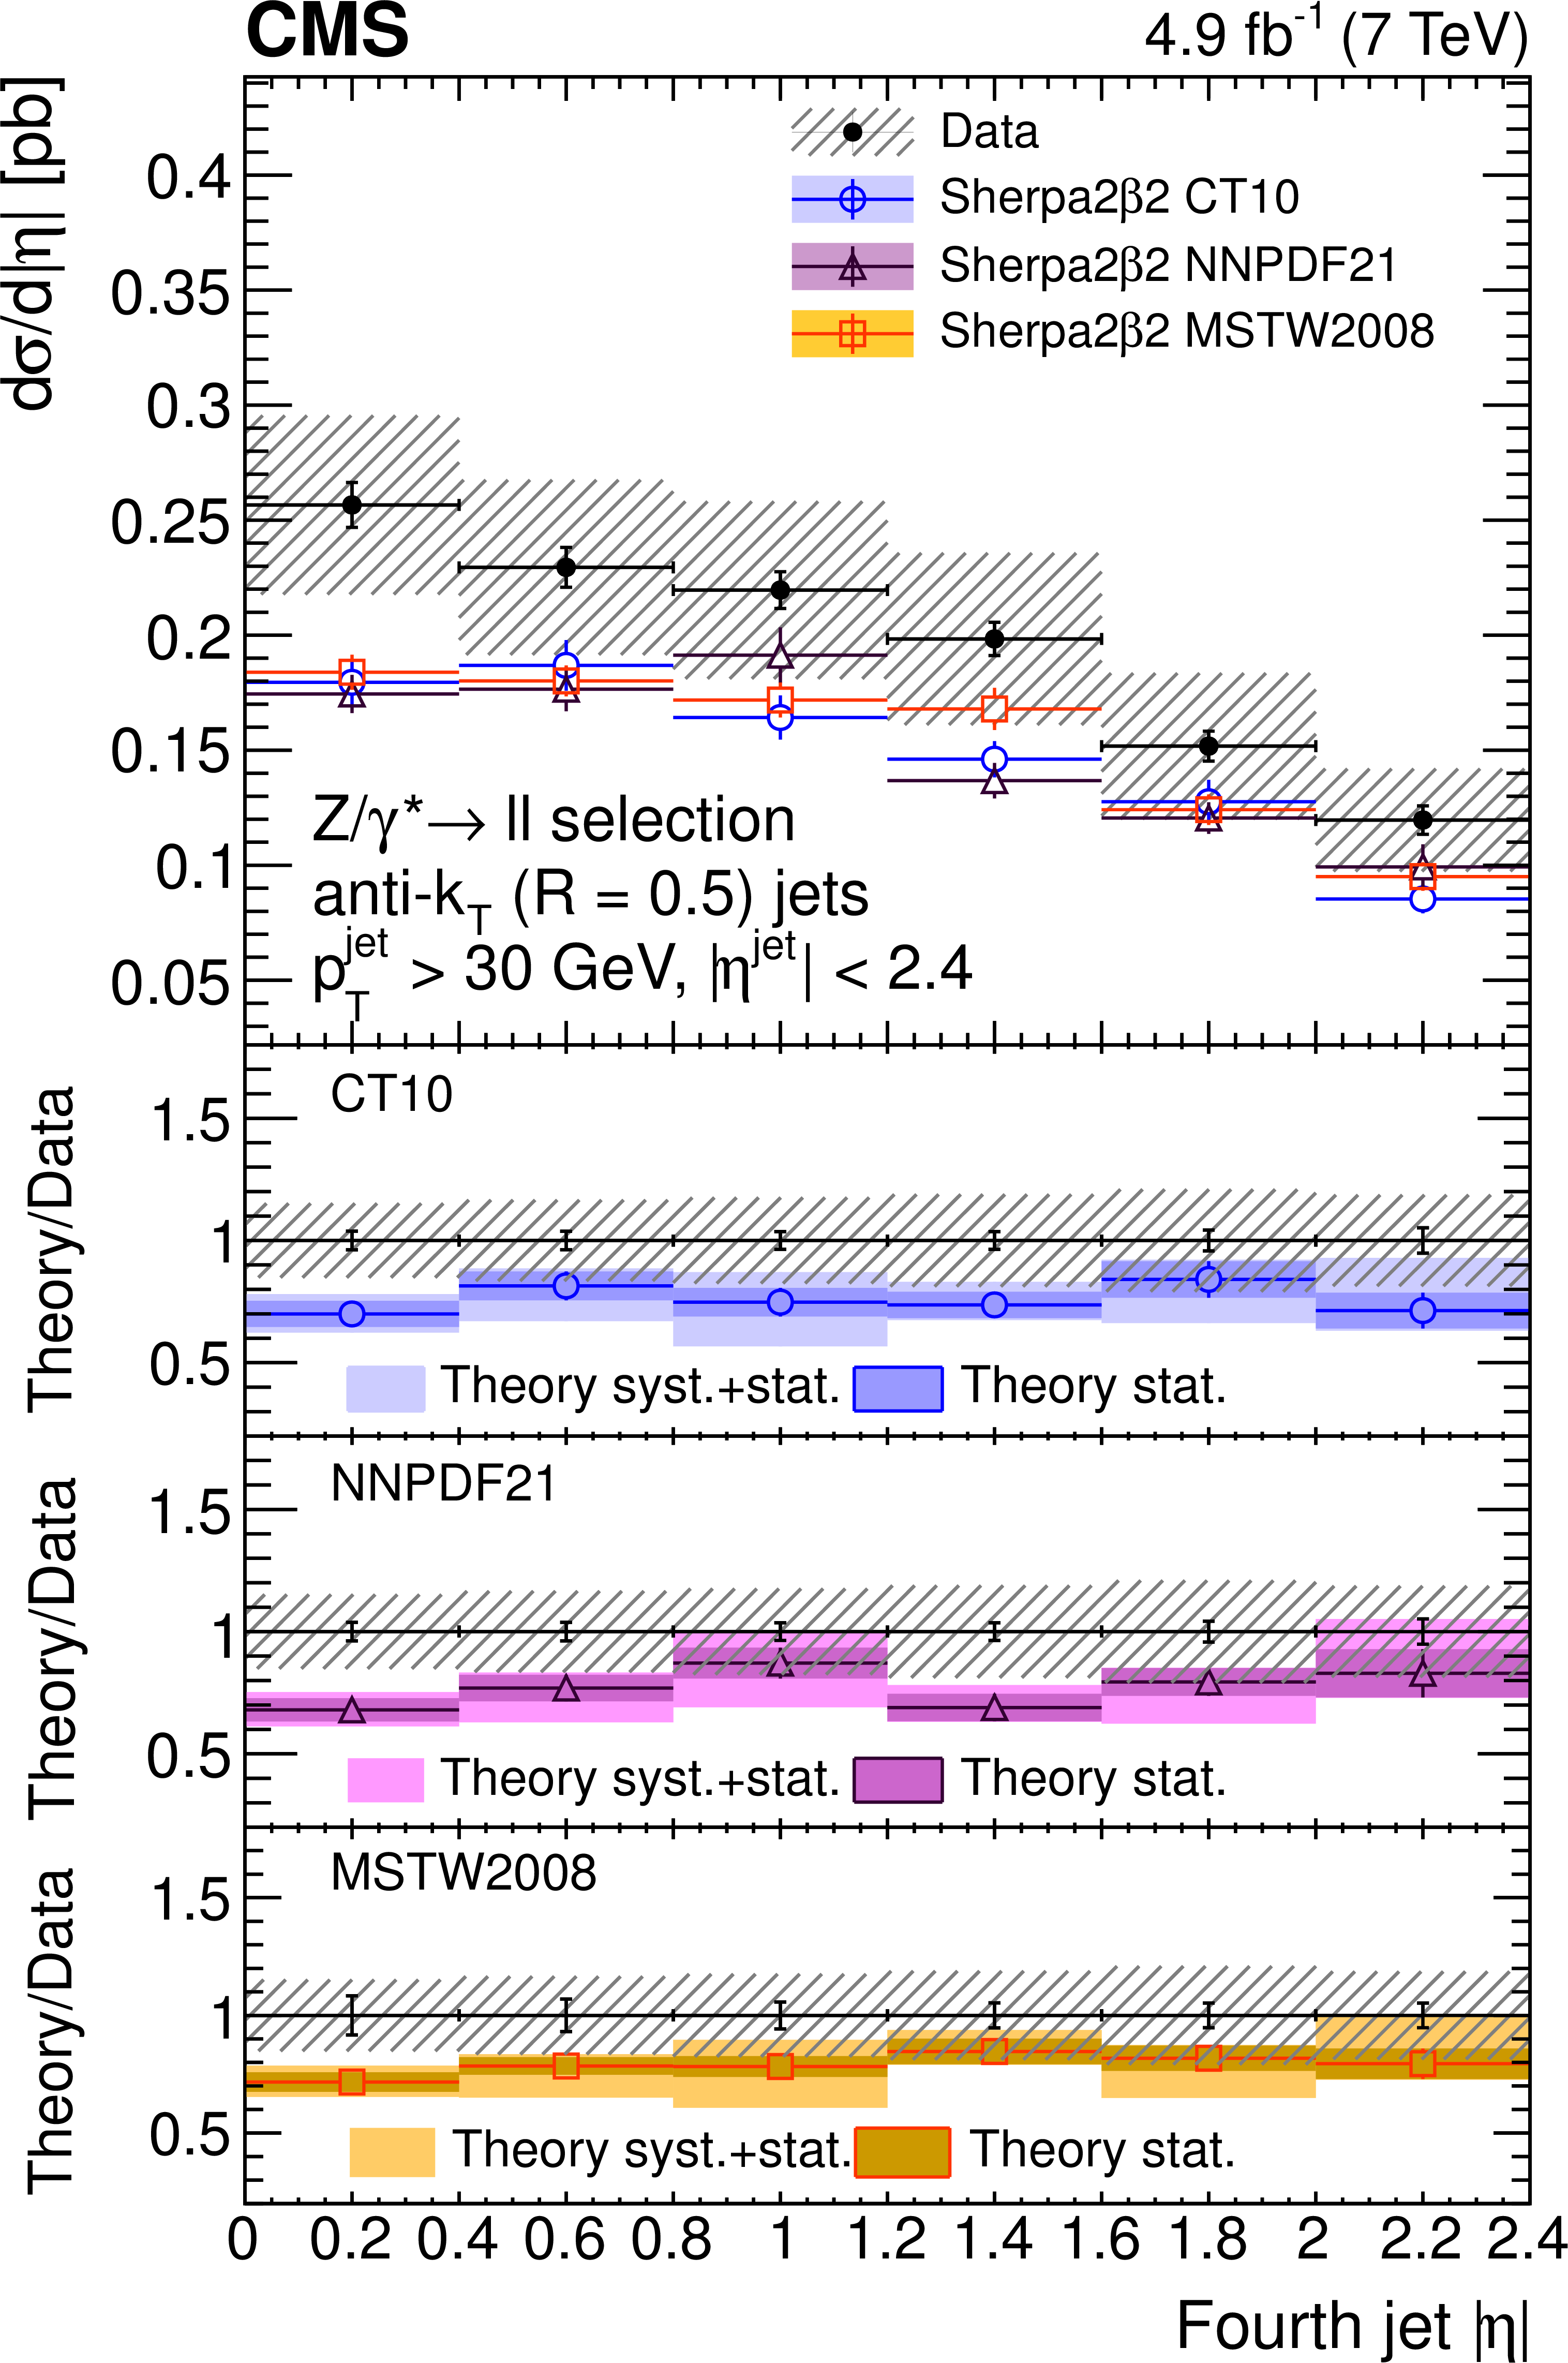
Figure 8-d:
Unfolded differential cross section as a function of the jet absolute pseudorapidity $ {| \eta | }$ for the first (a), second (b), third (c), and fourth (d) highest $ {p_{\mathrm {T}}} $ jets, compared with SHERPA predictions based on the PDF sets CT10, MSTW2008, and NNPDF2.1. Error bars around the experimental points represent the statistical uncertainty, while cross-hatched bands represent statistical plus systematic uncertainty. The bands around theory predictions correspond to the statistical uncertainty of the generated sample and to its combination with the theoretical PDF uncertainty. |
png pdf |
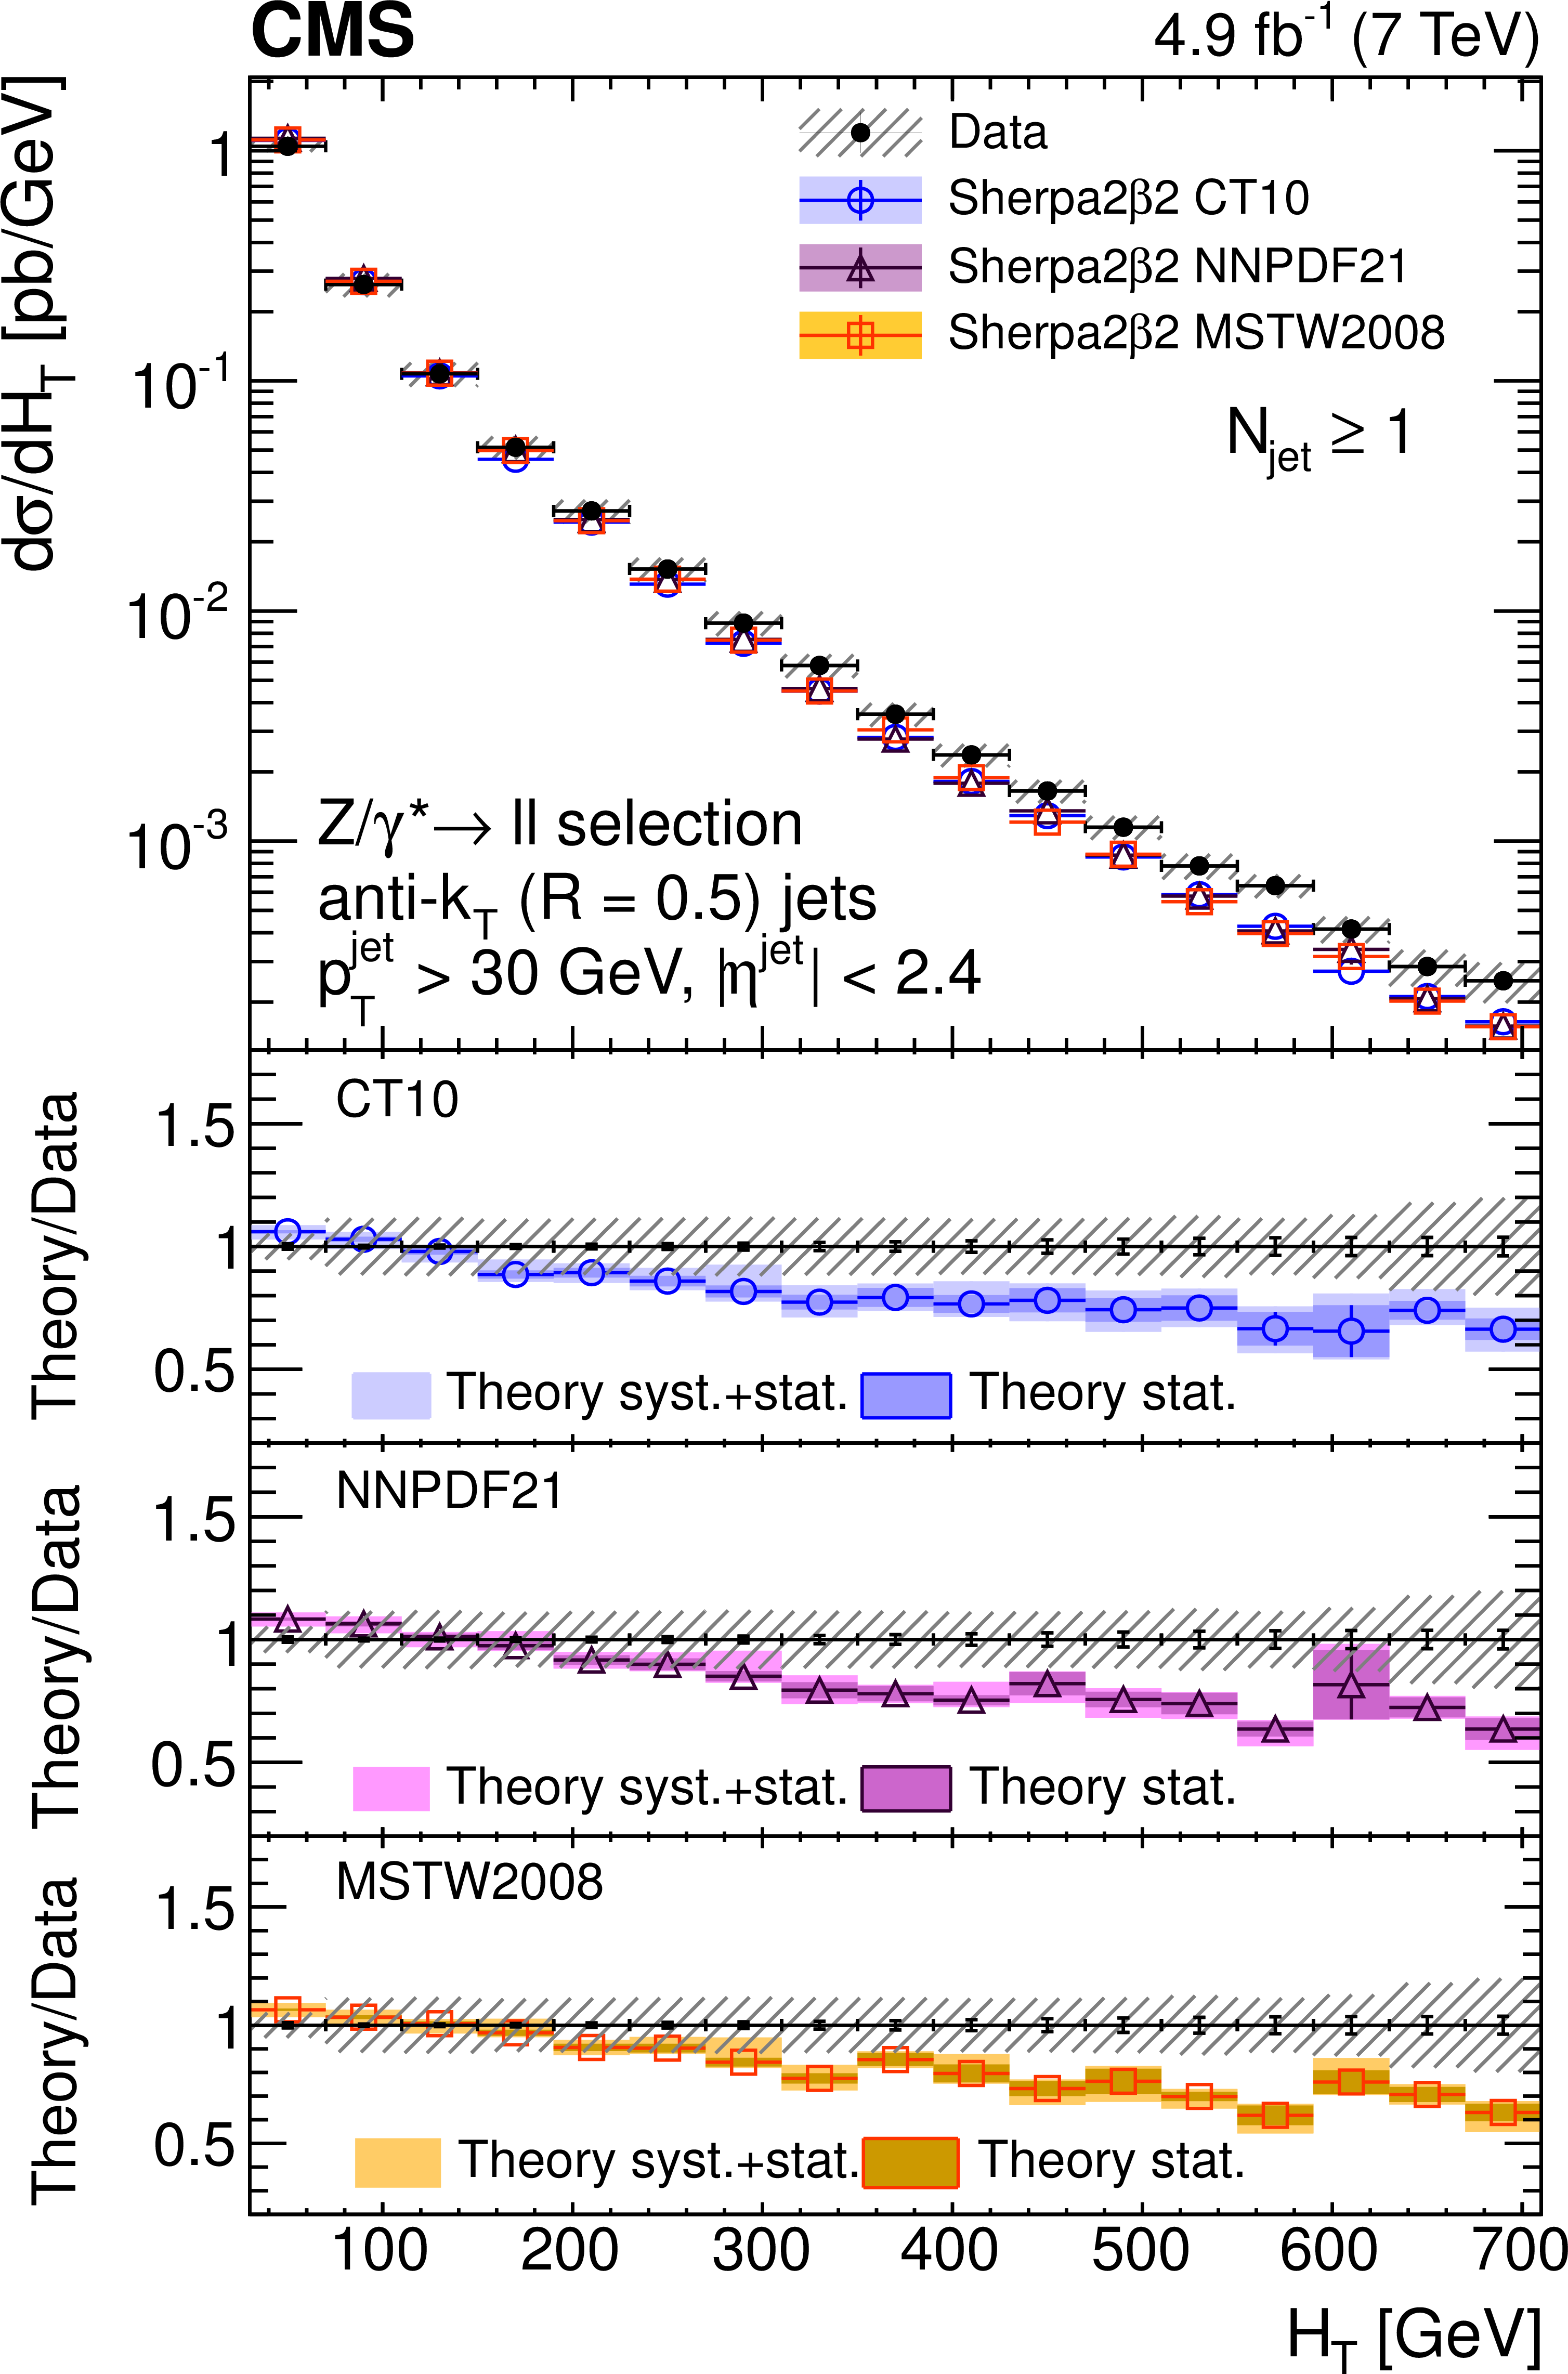
Figure 9-a:
Unfolded differential cross section as a function of $ {H_{\mathrm {T}}} $ for events with at least one (a), two (b), three (c), and four (d) jets compared with SHERPA predictions based on the PDF sets CT10, MSTW2008, and NNPDF2.1. Error bars around the experimental points represent the statistical uncertainty, while cross-hatched bands represent statistical plus systematic uncertainty. The bands around theory predictions correspond to the statistical uncertainty of the generated sample and to its combination with the theoretical PDF uncertainty. |
png pdf |
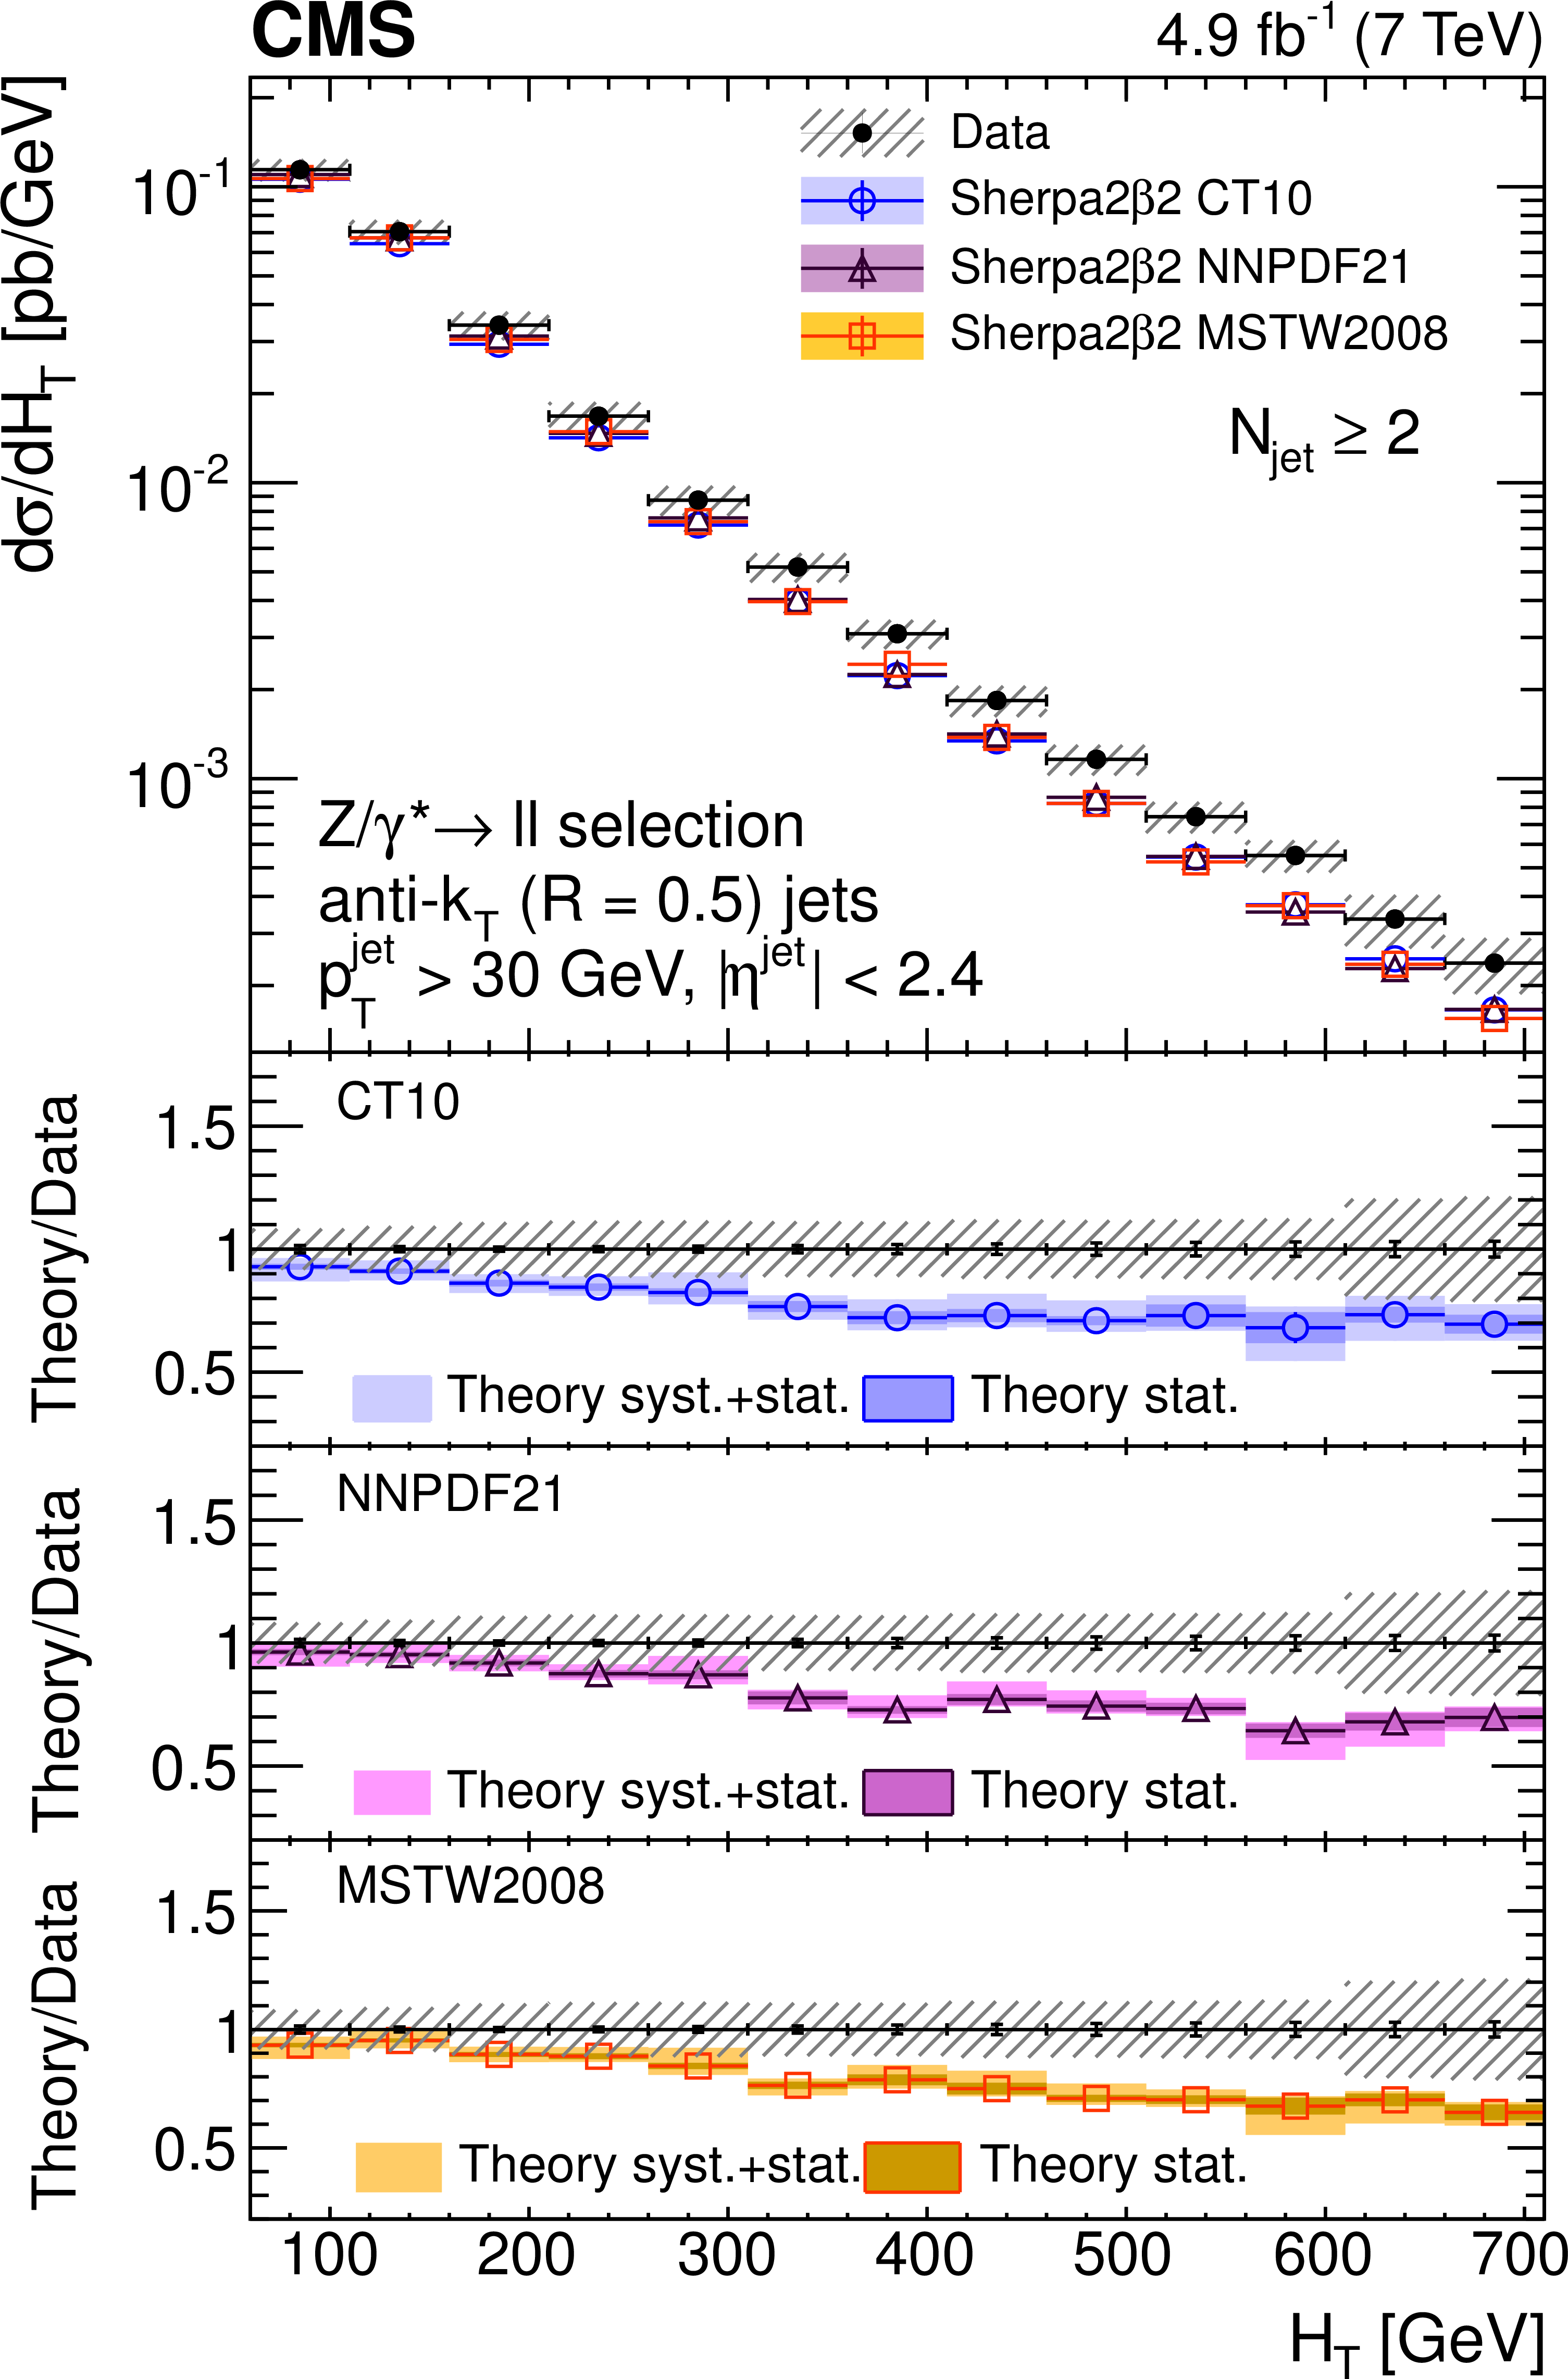
Figure 9-b:
Unfolded differential cross section as a function of $ {H_{\mathrm {T}}} $ for events with at least one (a), two (b), three (c), and four (d) jets compared with SHERPA predictions based on the PDF sets CT10, MSTW2008, and NNPDF2.1. Error bars around the experimental points represent the statistical uncertainty, while cross-hatched bands represent statistical plus systematic uncertainty. The bands around theory predictions correspond to the statistical uncertainty of the generated sample and to its combination with the theoretical PDF uncertainty. |
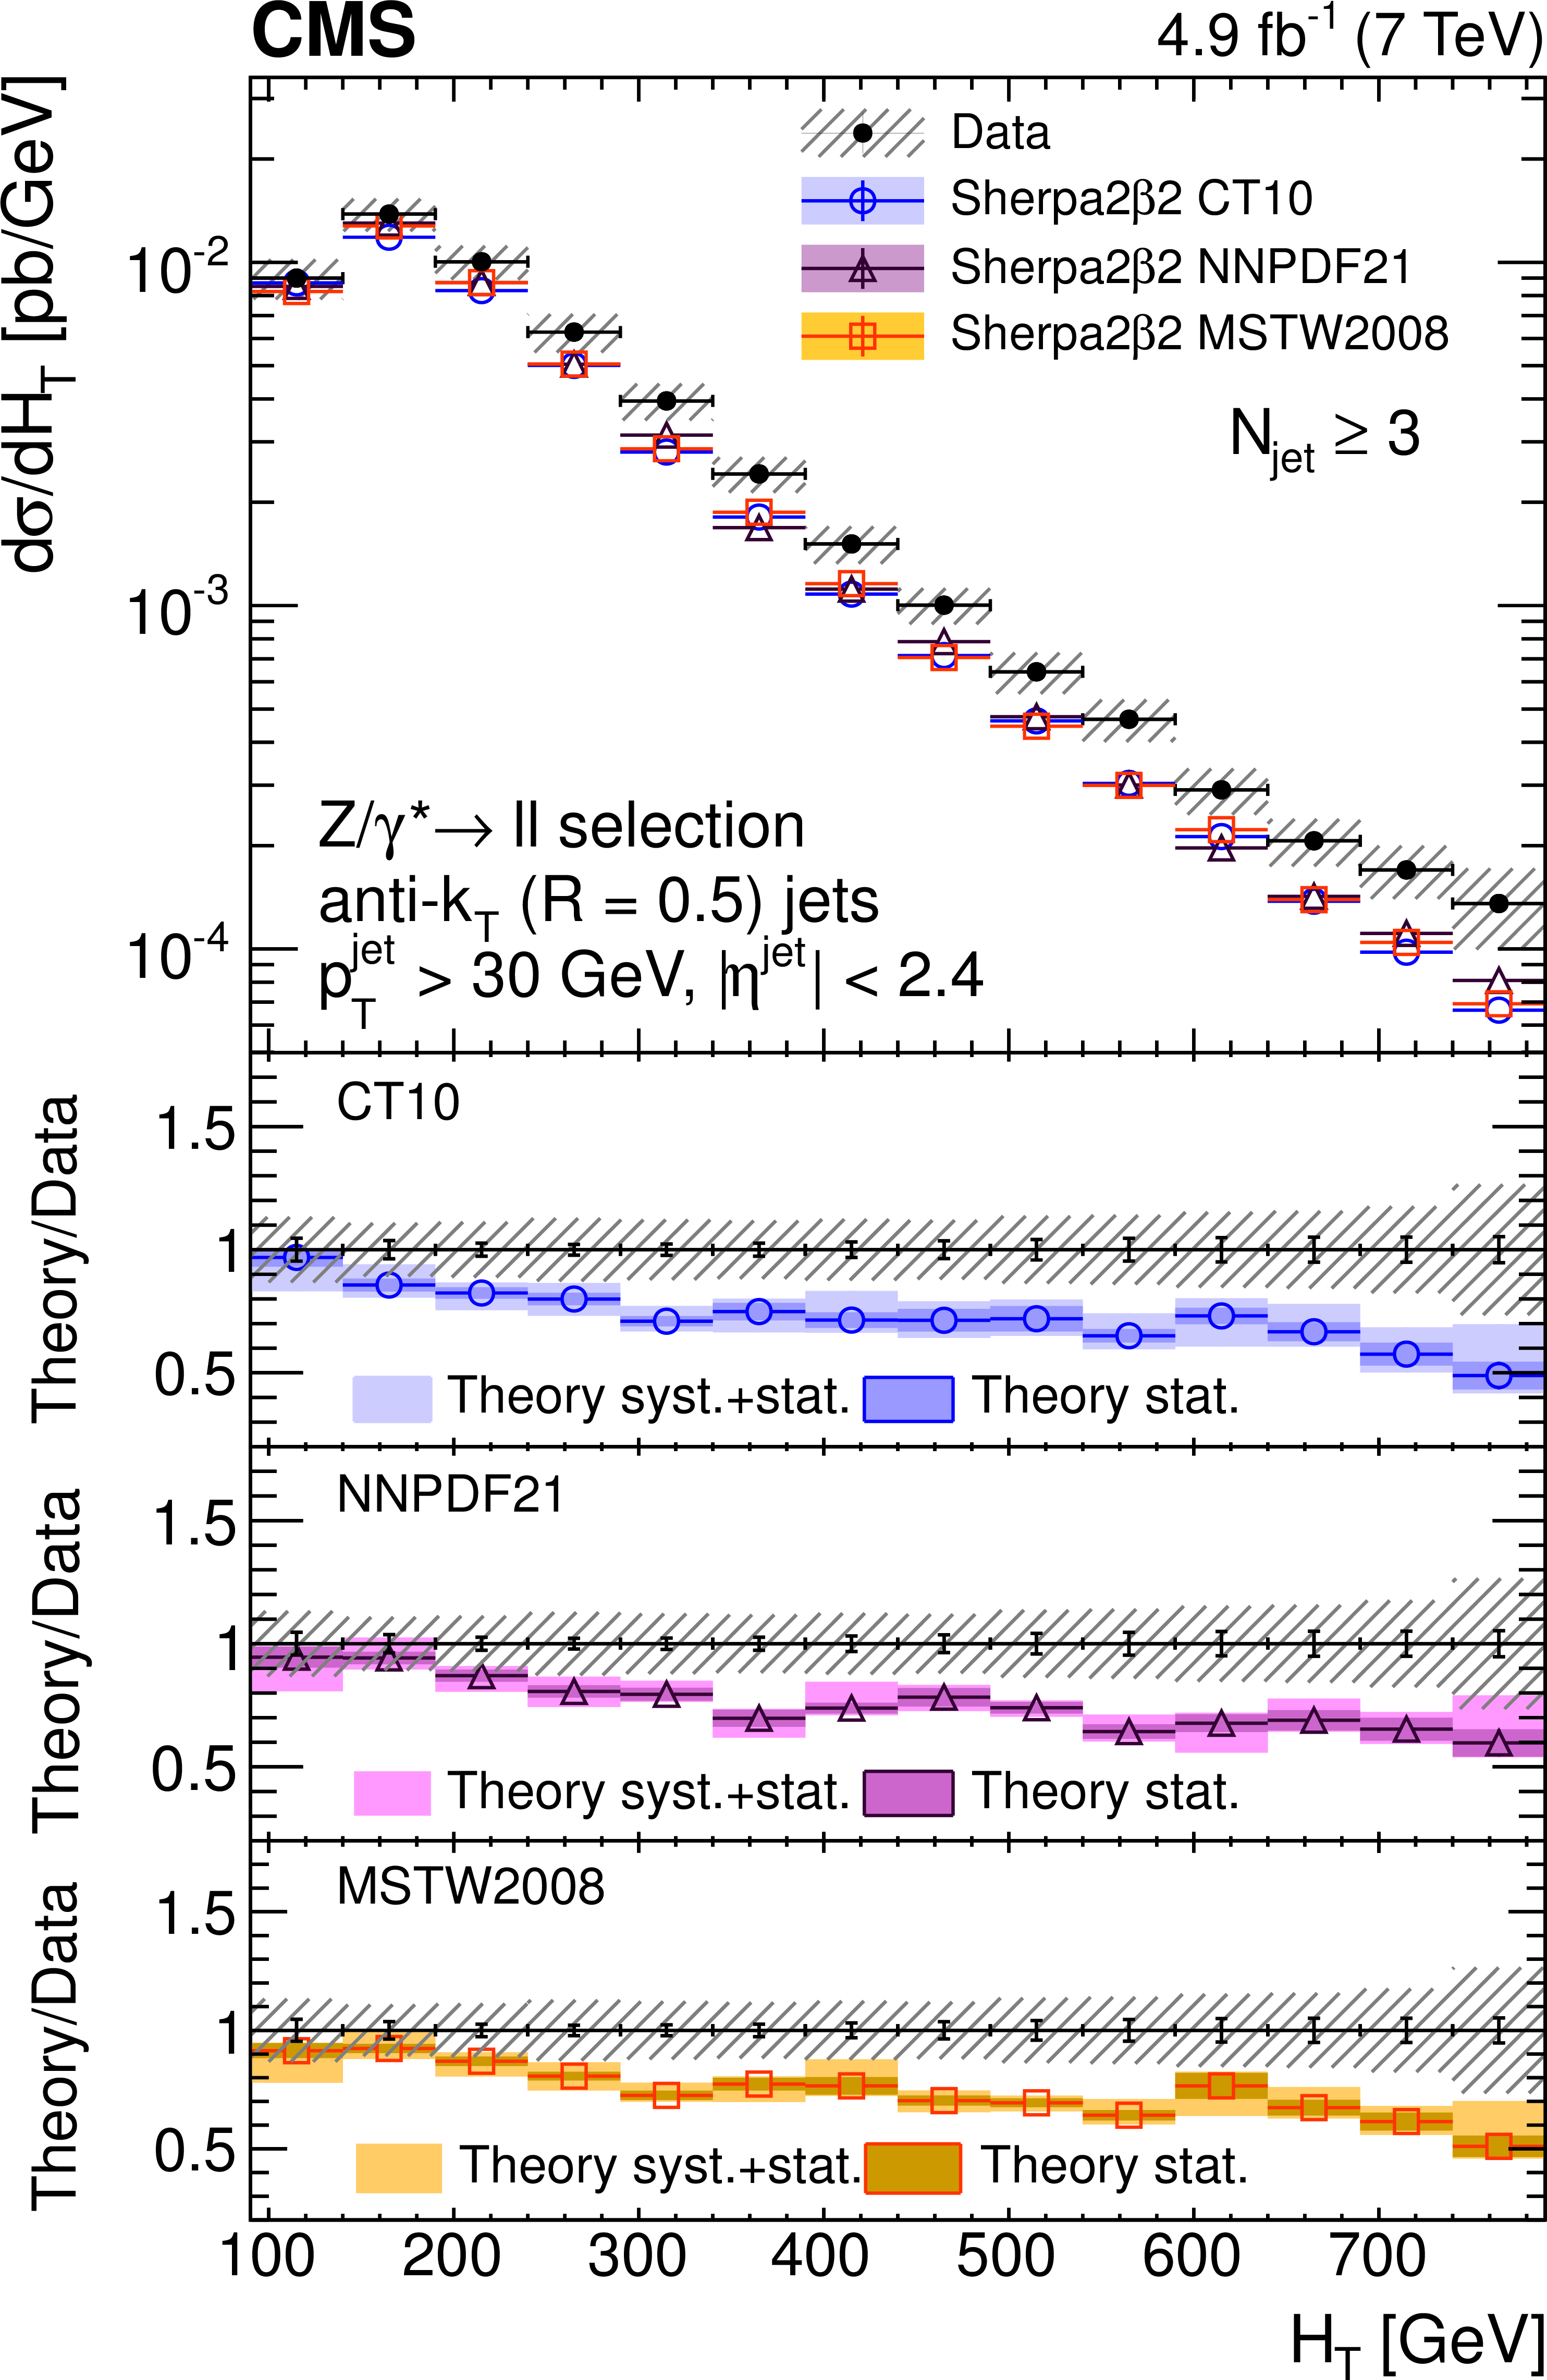
png pdf |
Figure 9-c:
Unfolded differential cross section as a function of $ {H_{\mathrm {T}}} $ for events with at least one (a), two (b), three (c), and four (d) jets compared with SHERPA predictions based on the PDF sets CT10, MSTW2008, and NNPDF2.1. Error bars around the experimental points represent the statistical uncertainty, while cross-hatched bands represent statistical plus systematic uncertainty. The bands around theory predictions correspond to the statistical uncertainty of the generated sample and to its combination with the theoretical PDF uncertainty. |
png pdf |
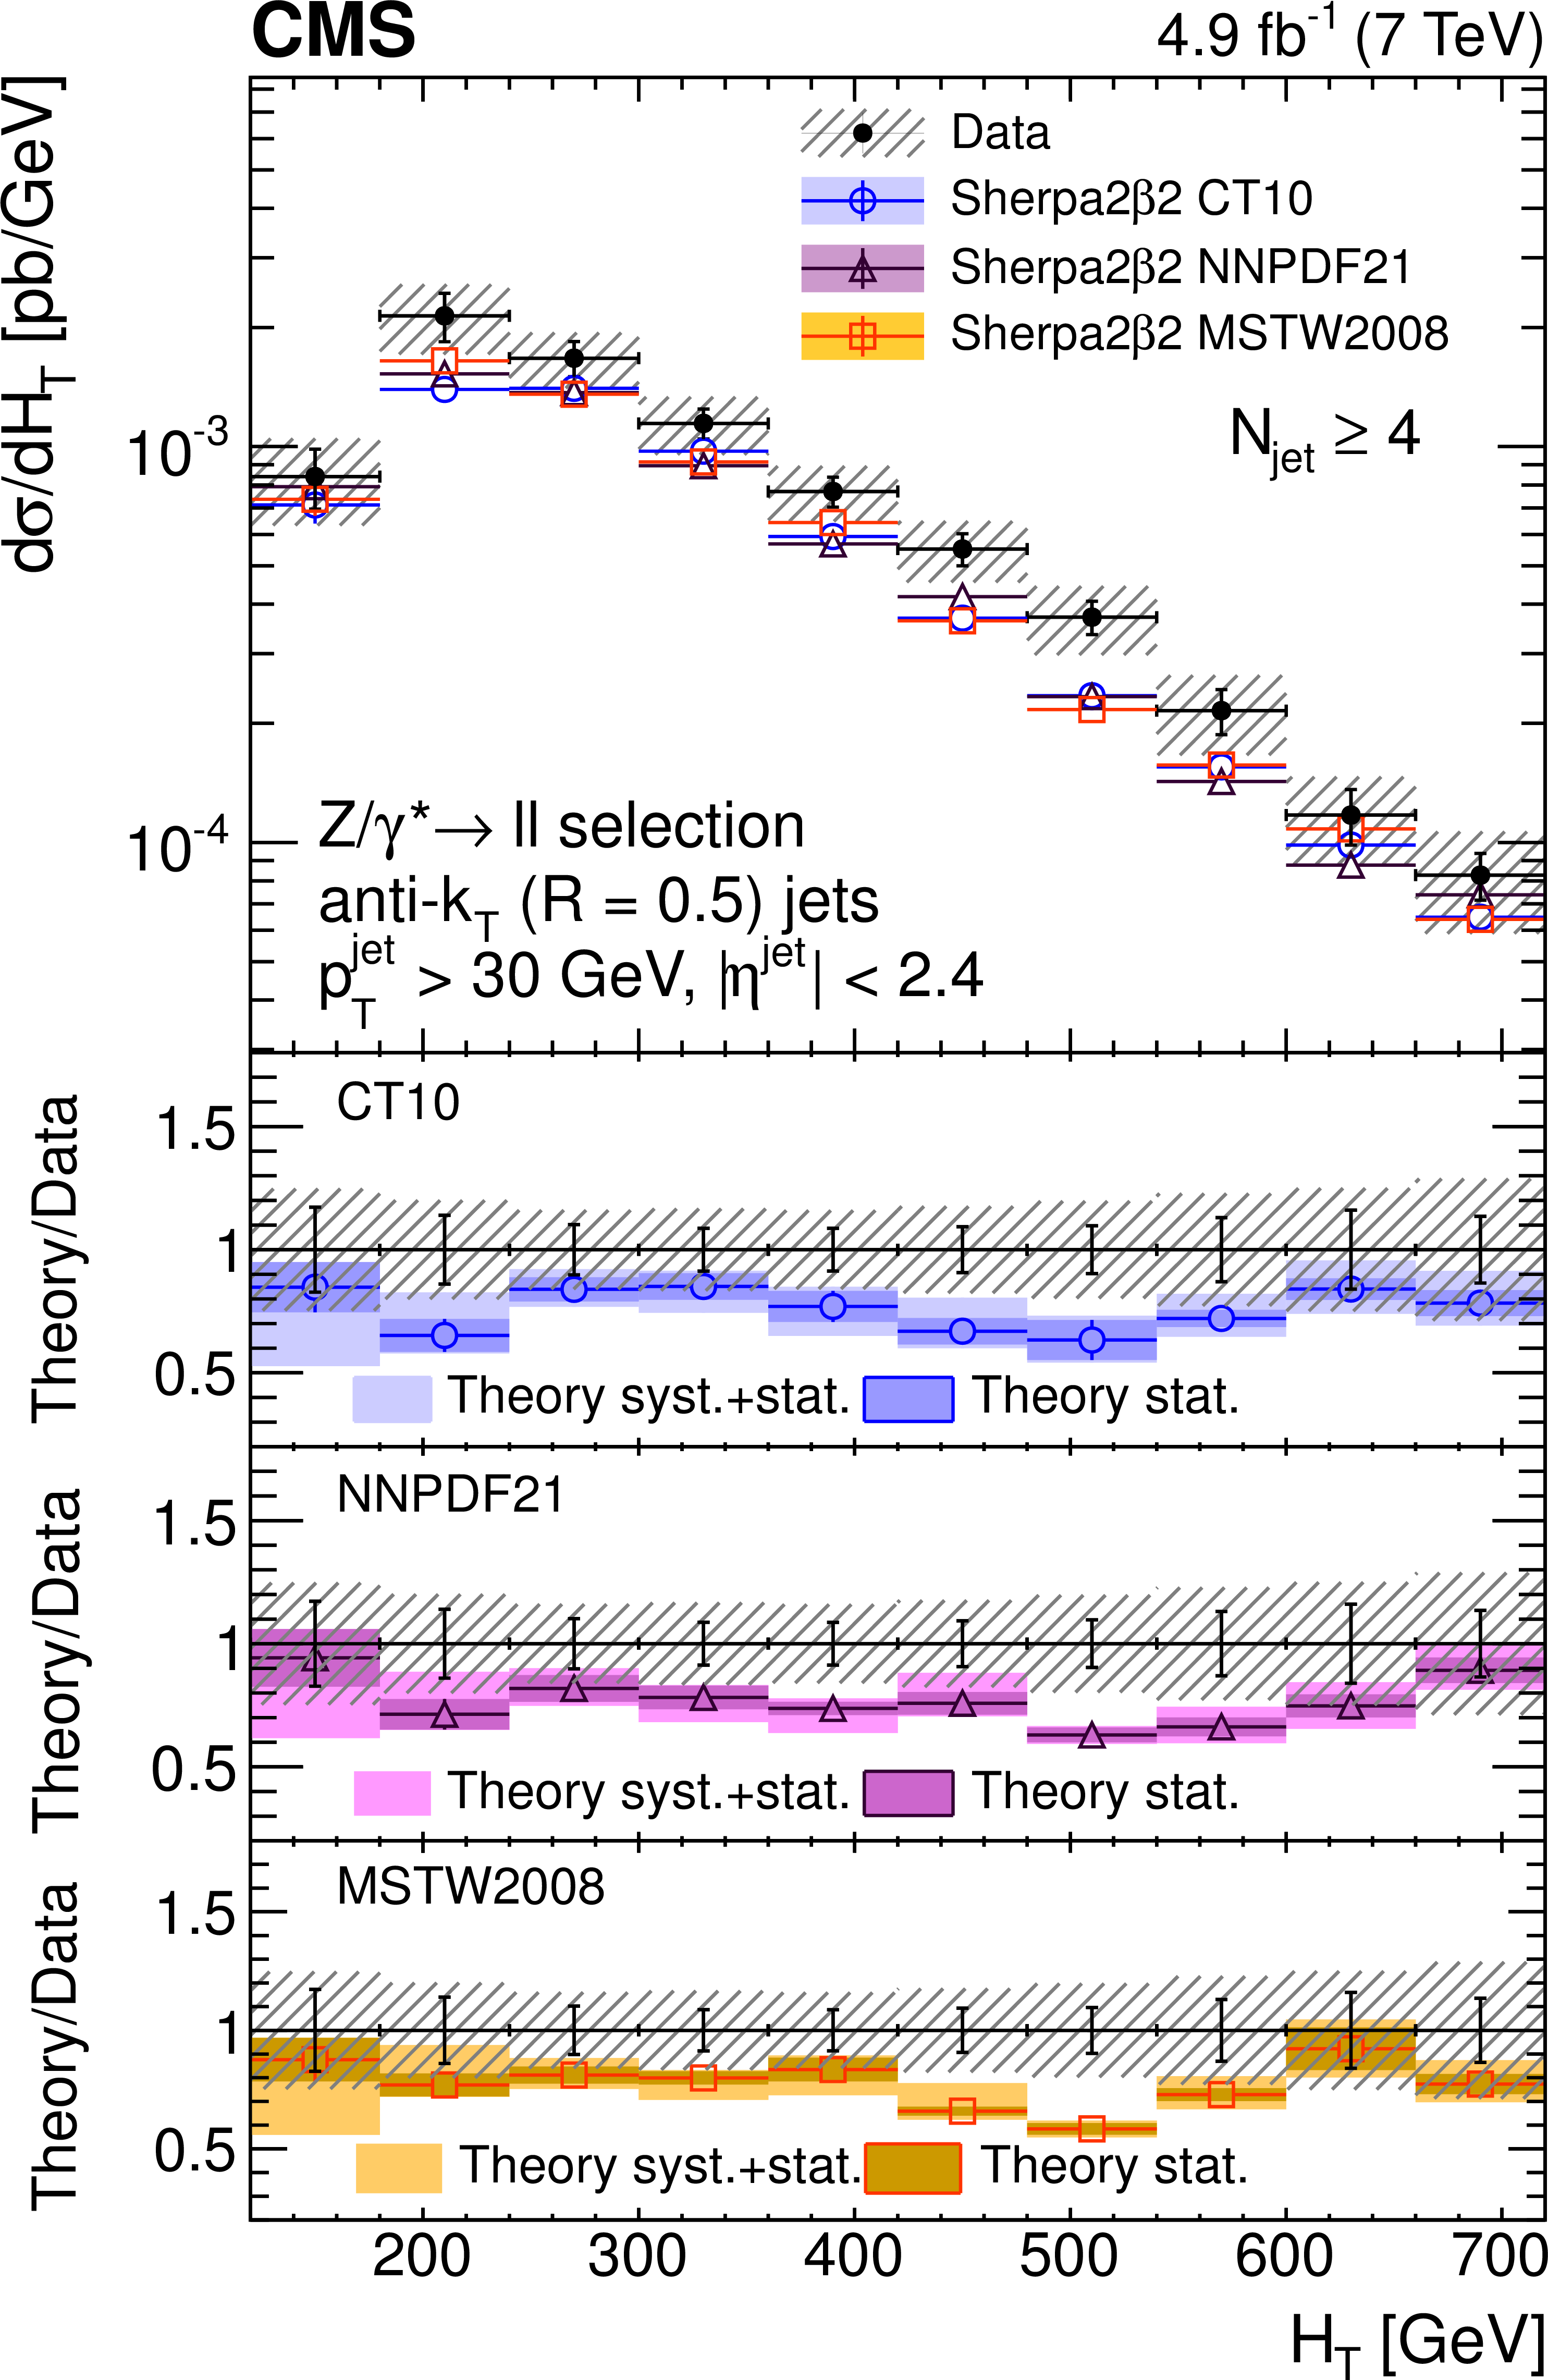
Figure 9-d:
Unfolded differential cross section as a function of $ {H_{\mathrm {T}}} $ for events with at least one (a), two (b), three (c), and four (d) jets compared with SHERPA predictions based on the PDF sets CT10, MSTW2008, and NNPDF2.1. Error bars around the experimental points represent the statistical uncertainty, while cross-hatched bands represent statistical plus systematic uncertainty. The bands around theory predictions correspond to the statistical uncertainty of the generated sample and to its combination with the theoretical PDF uncertainty. |
|
|
Compact Muon Solenoid LHC, CERN |
|

|

|

|

|

|