

Compact Muon Solenoid
LHC, CERN
| CMS-SMP-12-027 ; CERN-PH-EP-2014-287 | ||
| Measurement of the inclusive 3-jet production differential cross section in proton-proton collisions at 7 TeV and determination of the strong coupling constant in the TeV range | ||
| CMS Collaboration | ||
| 5 December 2014 | ||
| Eur. Phys. J. C 75 (2015) 186 | ||
| Abstract: This paper presents a measurement of the inclusive 3-jet production differential cross section at a proton-proton centre-of-mass energy of 7 TeV using data corresponding to an integrated luminosity of 5 fb$^{-1}$ collected with the CMS detector. The analysis is based on the three jets with the highest transverse momenta. The cross section is measured as a function of the invariant mass of the three jets in a range of 445-3270 GeV and in two bins of the maximum rapidity of the jets up to a value of 2. A comparison between the measurement and the prediction from perturbative QCD at next-to-leading order is performed. Within uncertainties, data and theory are in agreement. The sensitivity of the observable to parameters of the theory such as the parton distribution functions of the proton and the strong coupling constant $\alpha_S$ is studied. A fit to all data points with 3-jet masses larger than 664 GeV gives a value of the strong coupling constant of $\alpha_S(M_\mathrm{Z})$ = 0.1171 $\pm$ 0.0013 (exp) $^{+0.0073}_{-0.0047}$ (theo). | ||
| Links: e-print arXiv:1412.1633 [hep-ex] (PDF) ; CDS record ; inSPIRE record ; Public twiki page ; HepData record ; CADI line (restricted) ; | ||
| Figures & Tables | Additional Figures | CMS Publications |
|---|
| Figures | |
png pdf |
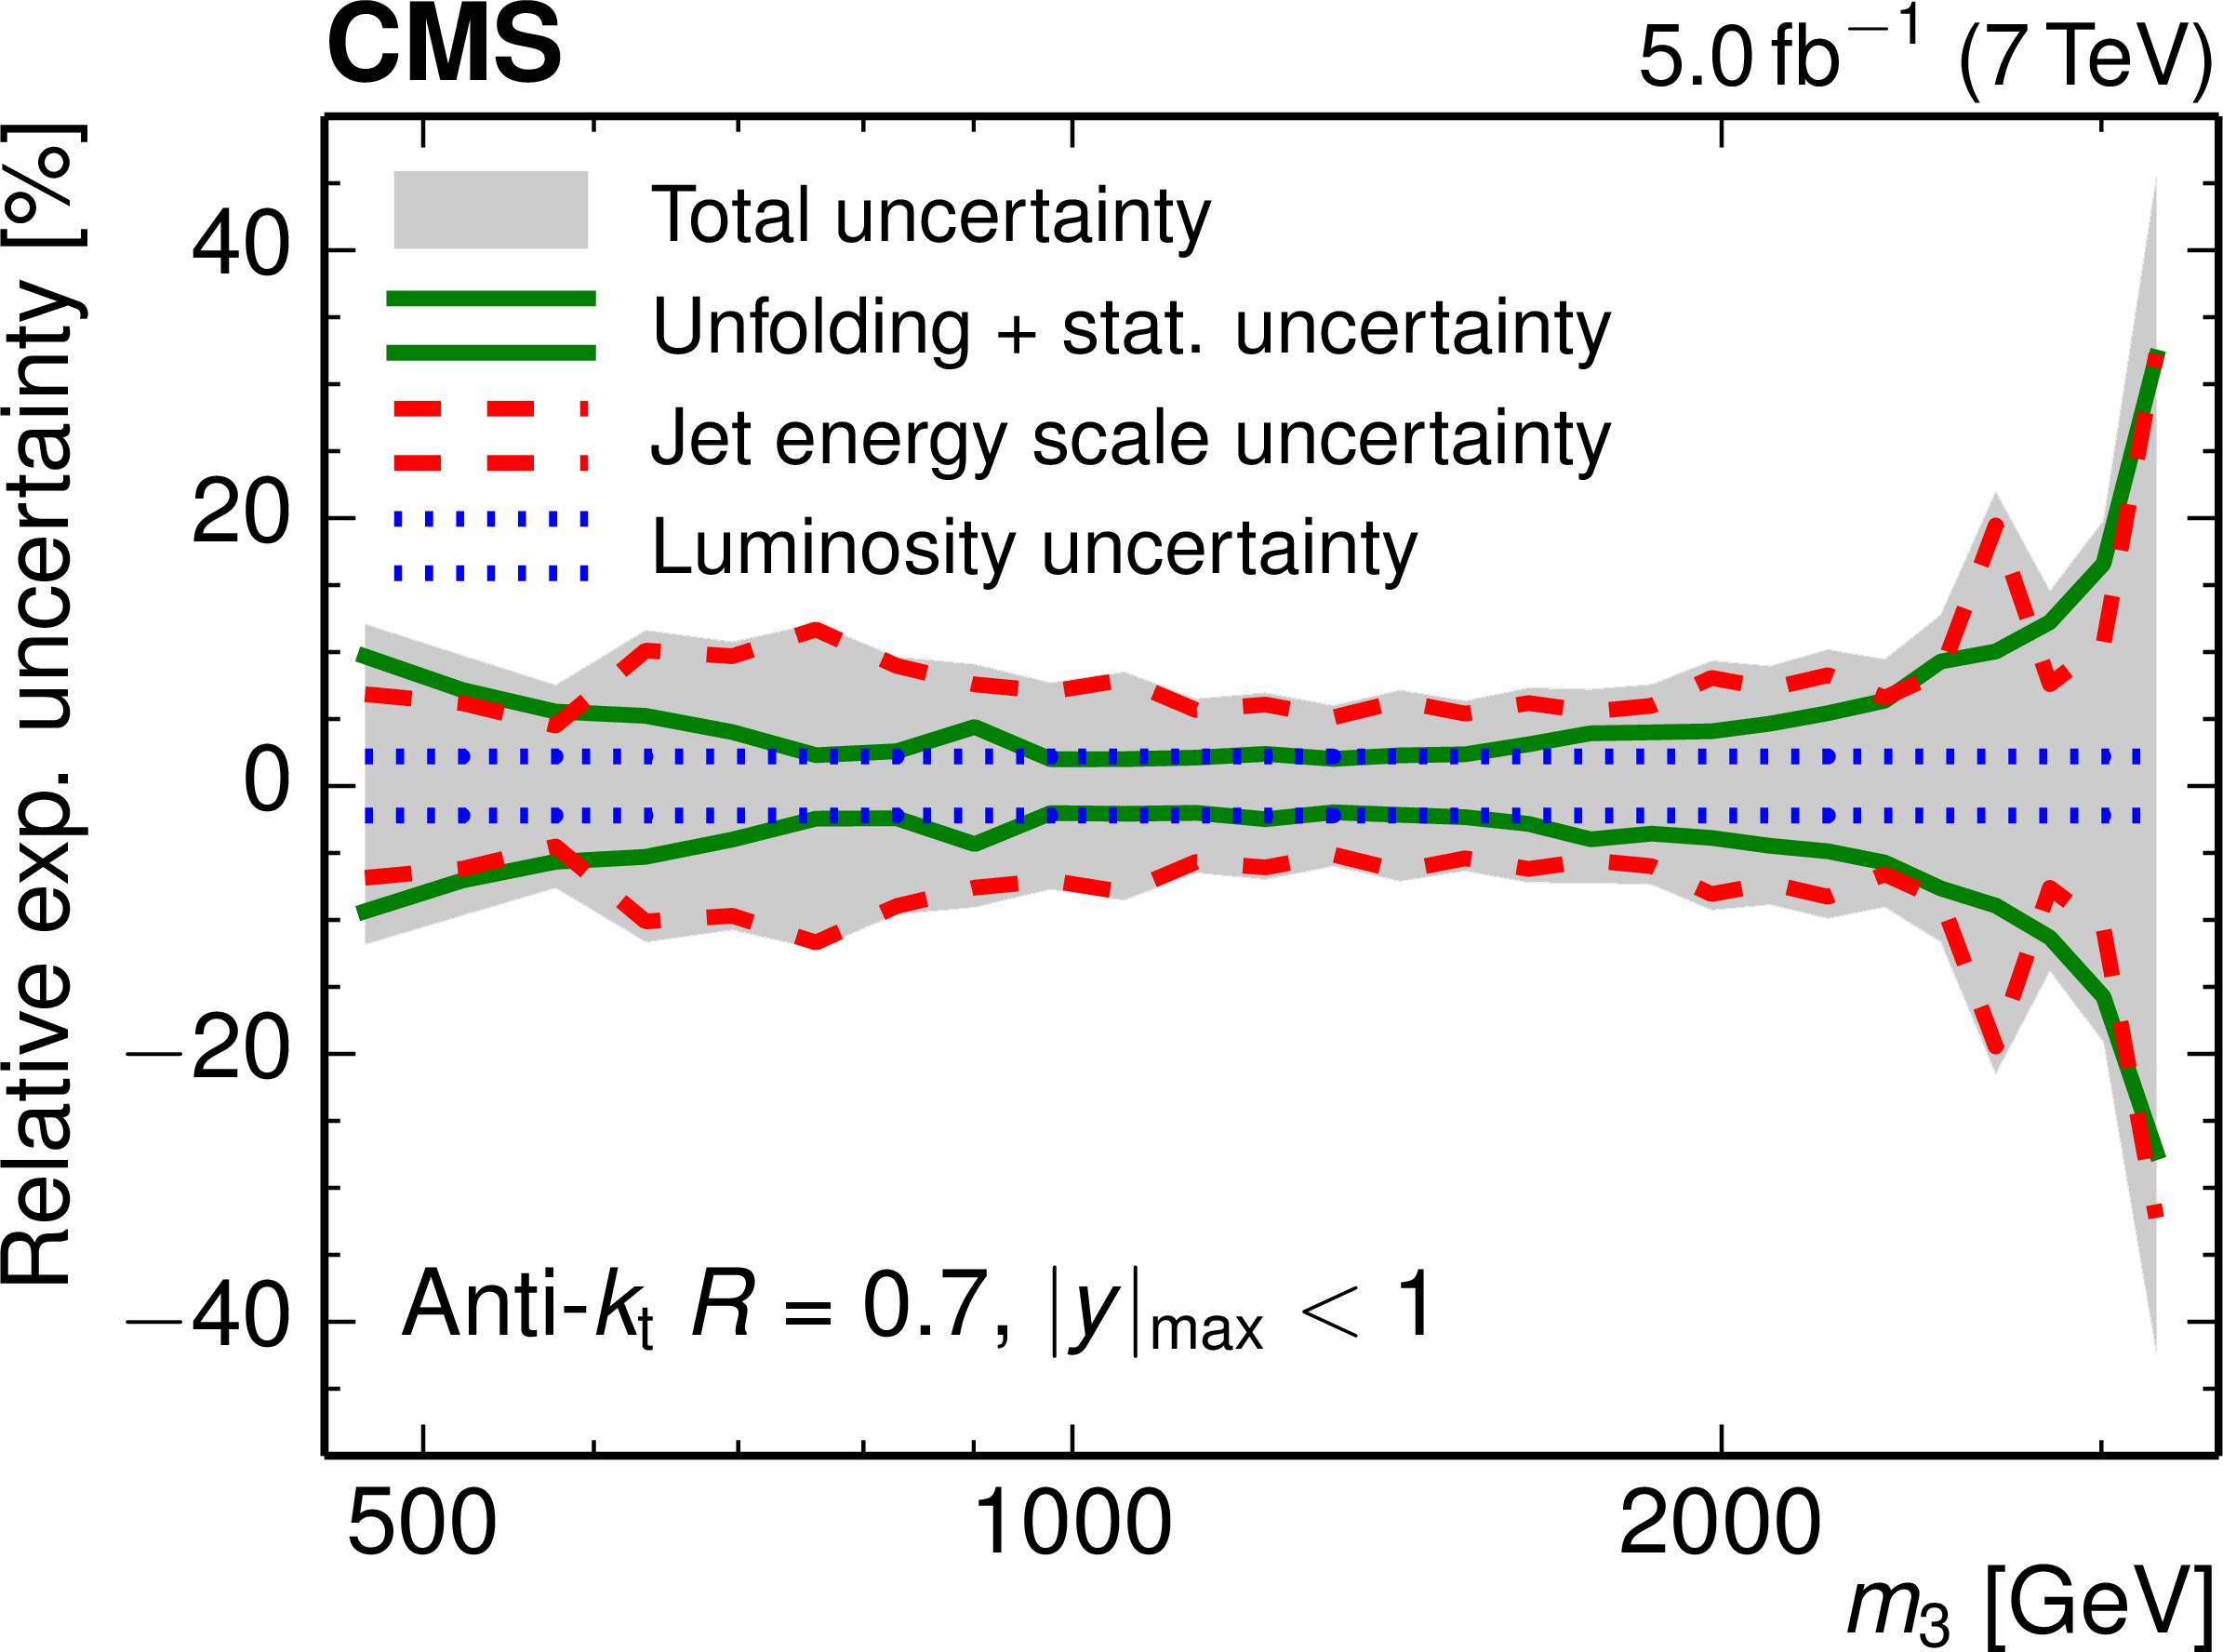
Figure 1-a:
Overview of the measurement uncertainties in the inner $ { {| y | }_{\text {max}}} < 1$ (a) and the outer rapidity region $1 \leq { {| y | }_{\text {max}}} < 2$ (b). All uncertainty components, including the 1% uncorrelated residual uncertainty, are added in quadrature to give the total uncertainty. |
png pdf |
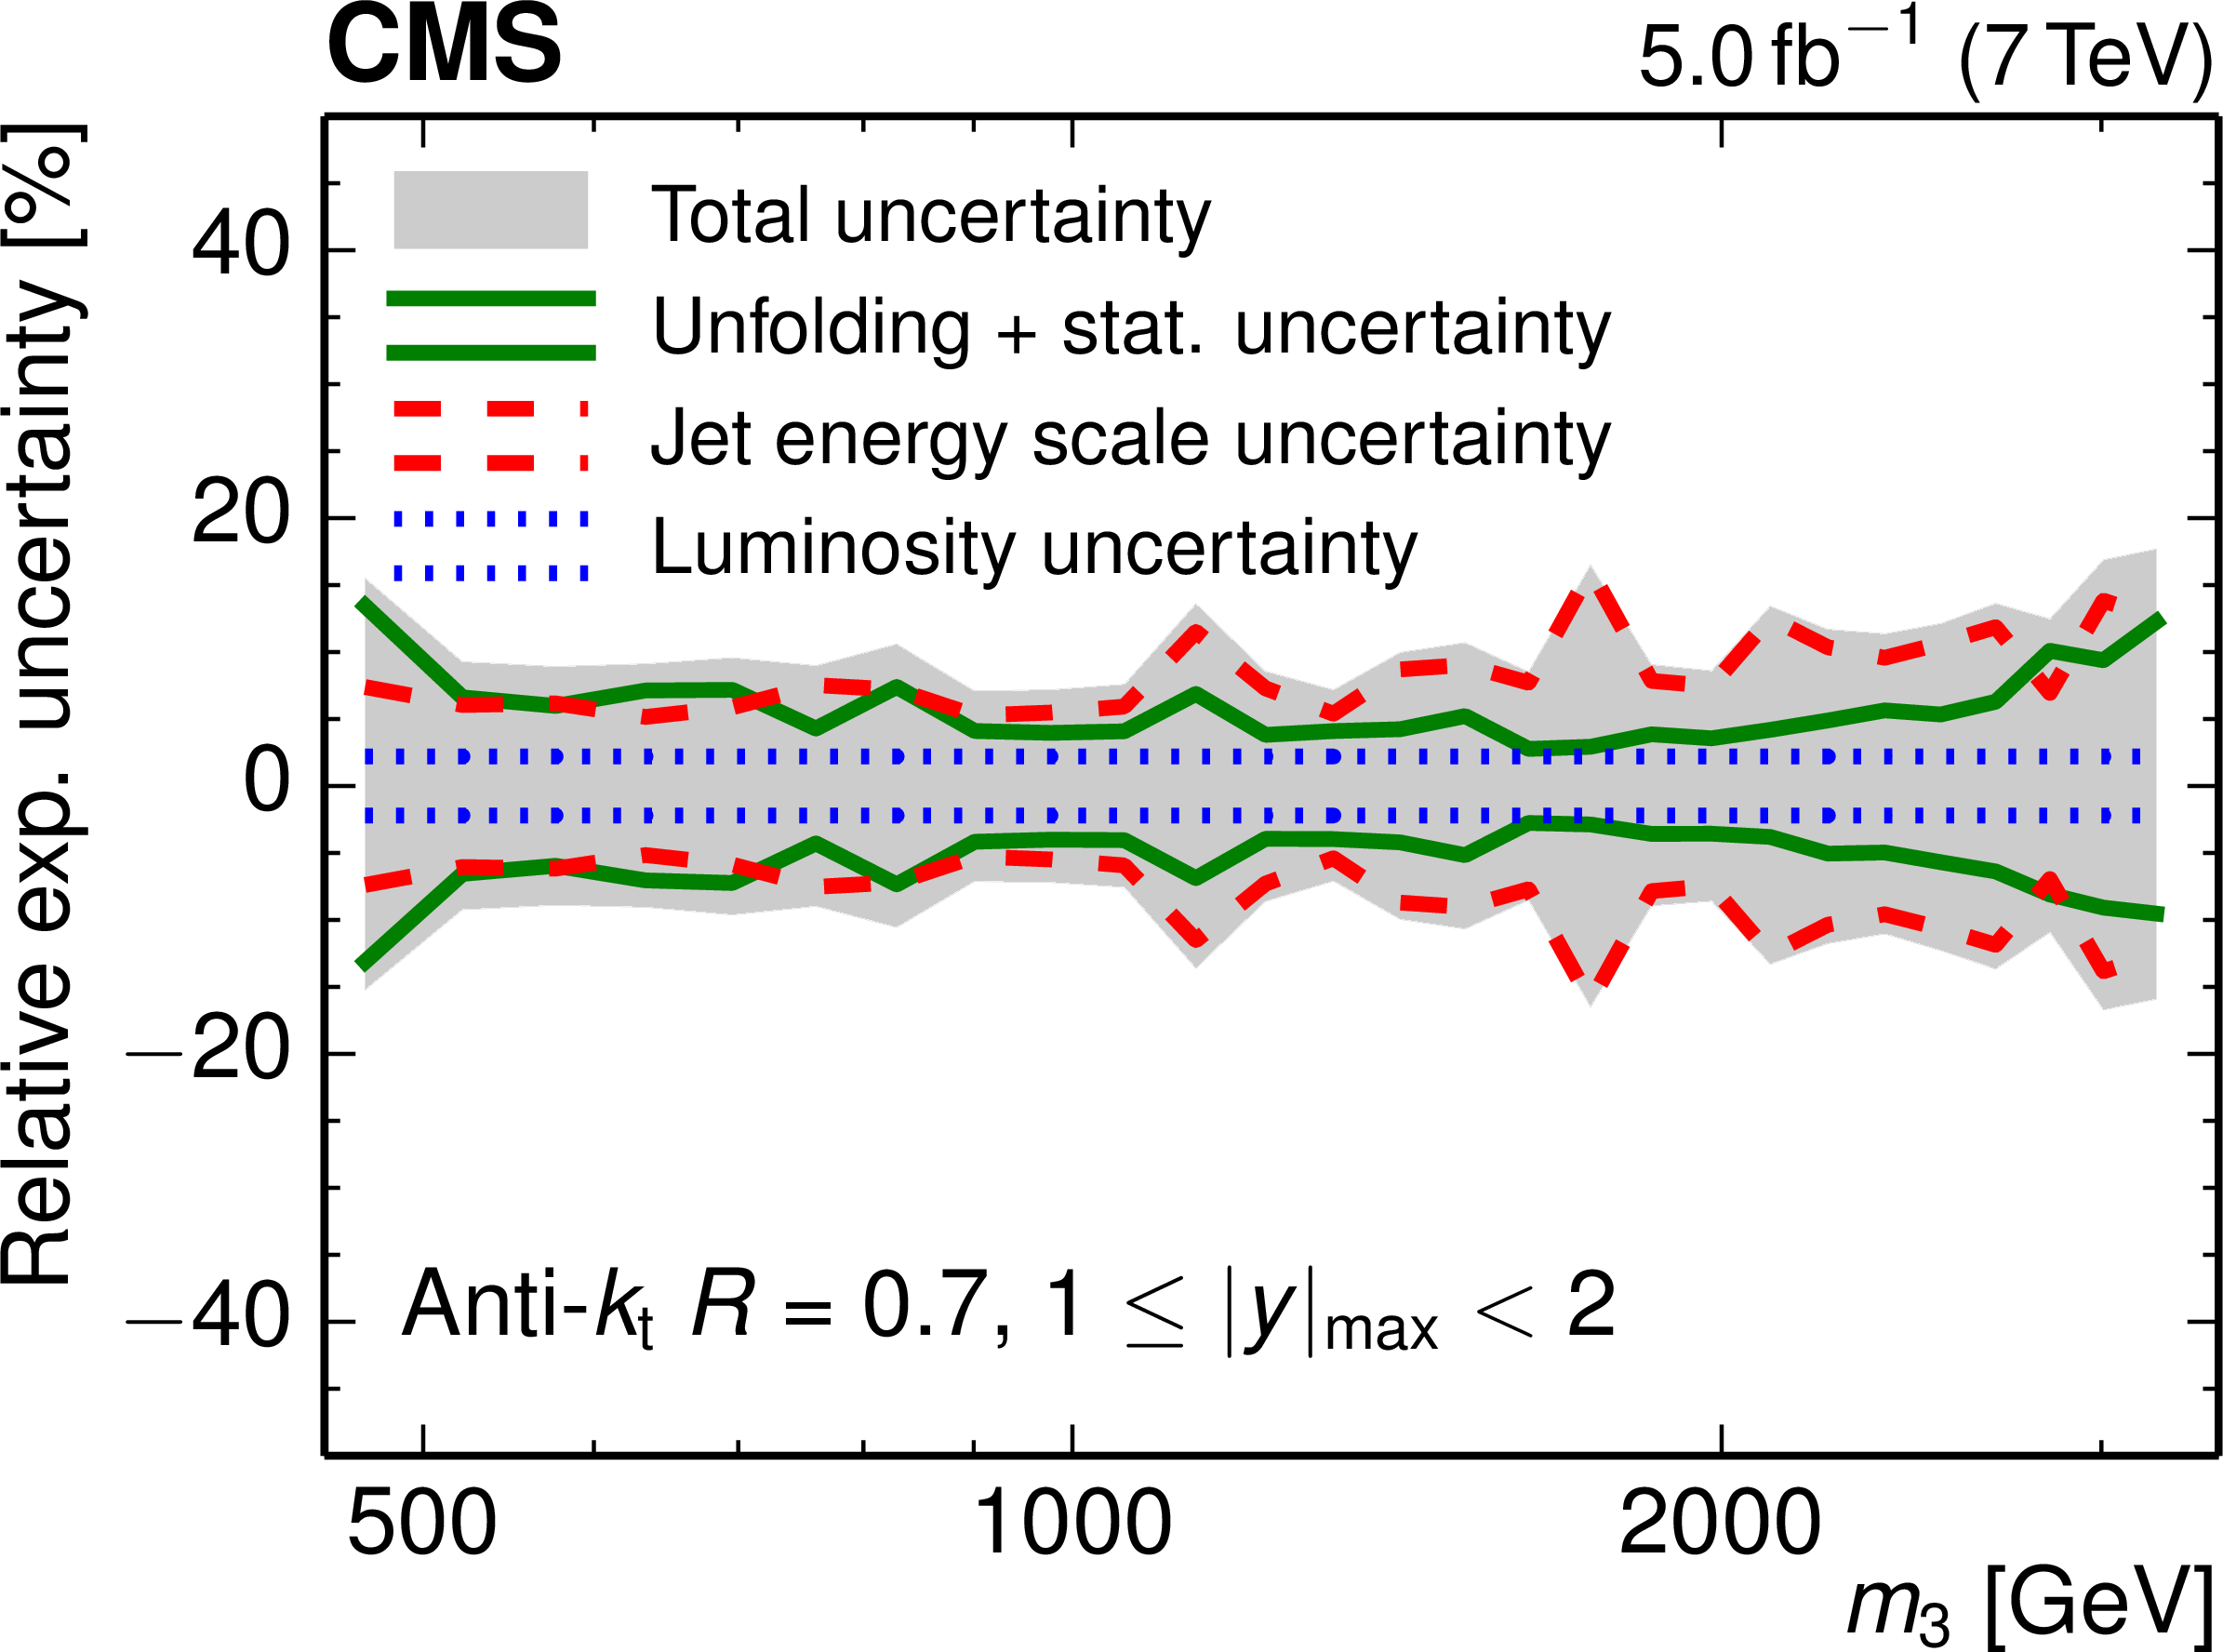
Figure 1-b:
Overview of the measurement uncertainties in the inner $ { {| y | }_{\text {max}}} < 1$ (a) and the outer rapidity region $1 \leq { {| y | }_{\text {max}}} < 2$ (b). All uncertainty components, including the 1% uncorrelated residual uncertainty, are added in quadrature to give the total uncertainty. |
png pdf |
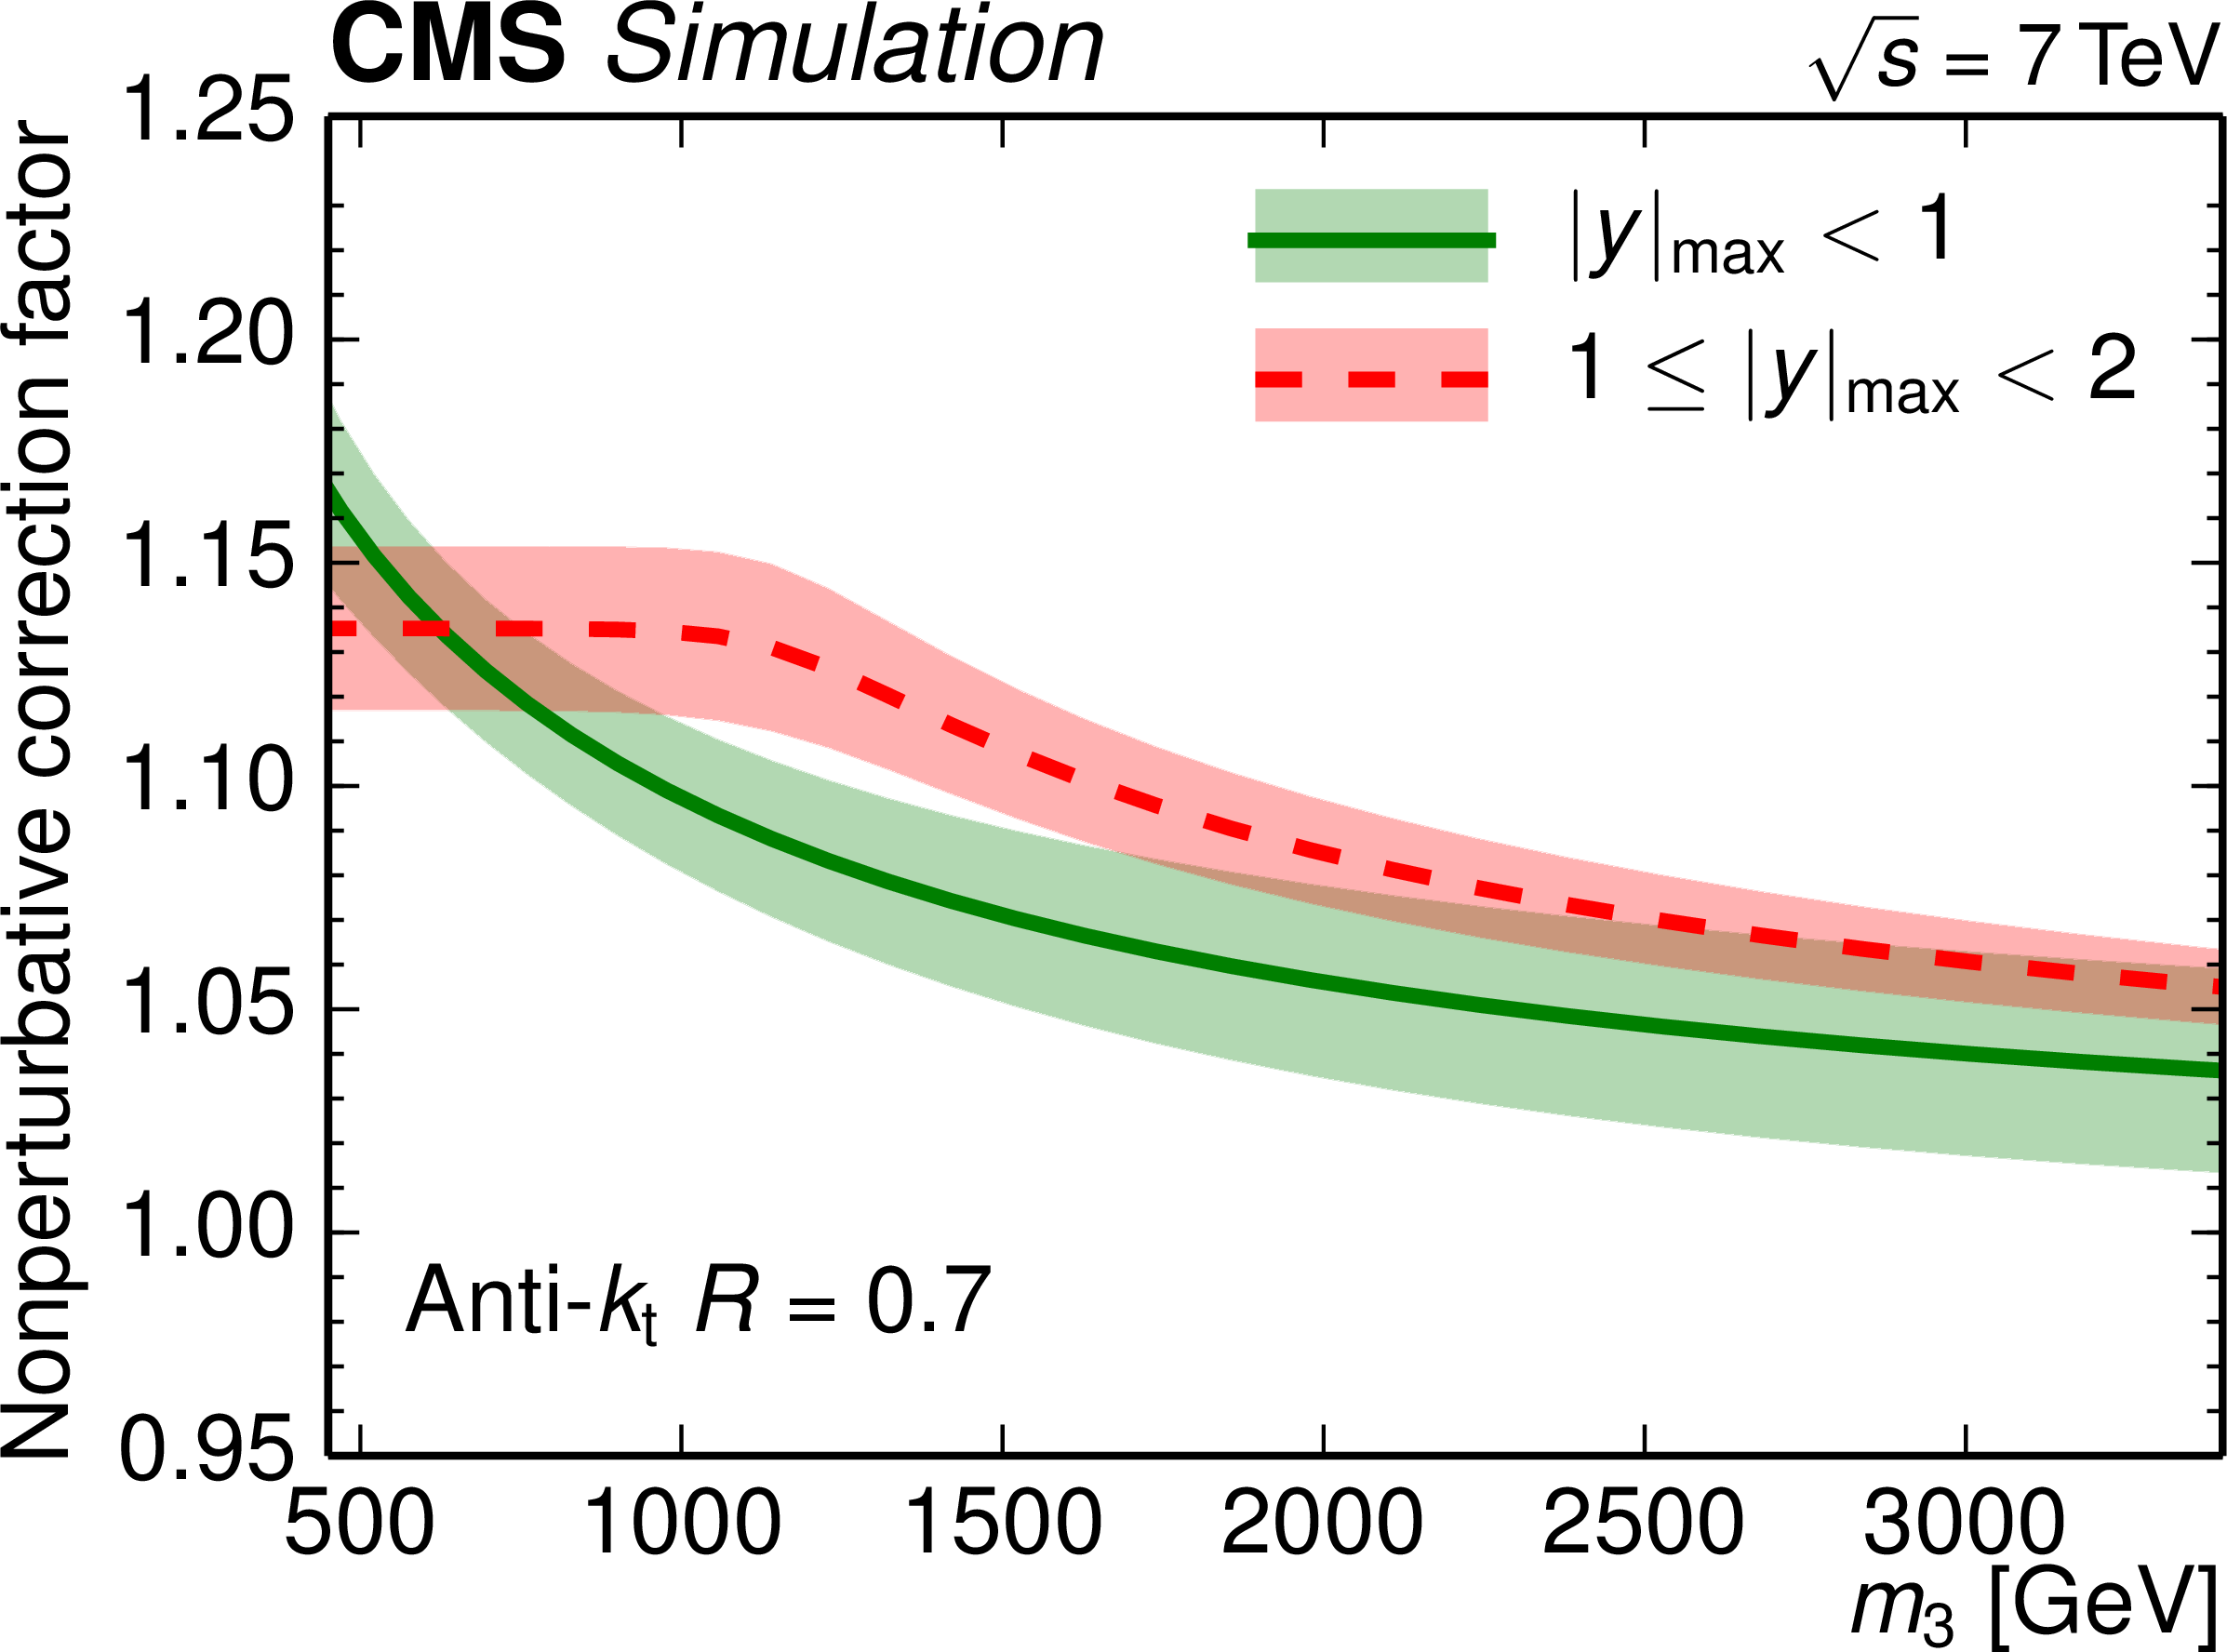
Figure 2:
Overview of the NP correction factors and their uncertainties in the inner $ { {| y | }_{\text {max}}} < 1$ (solid line) and in the outer rapidity region $1 \leq { {| y | }_{\text {max}}} < 2$ (dashed line). |
png pdf |
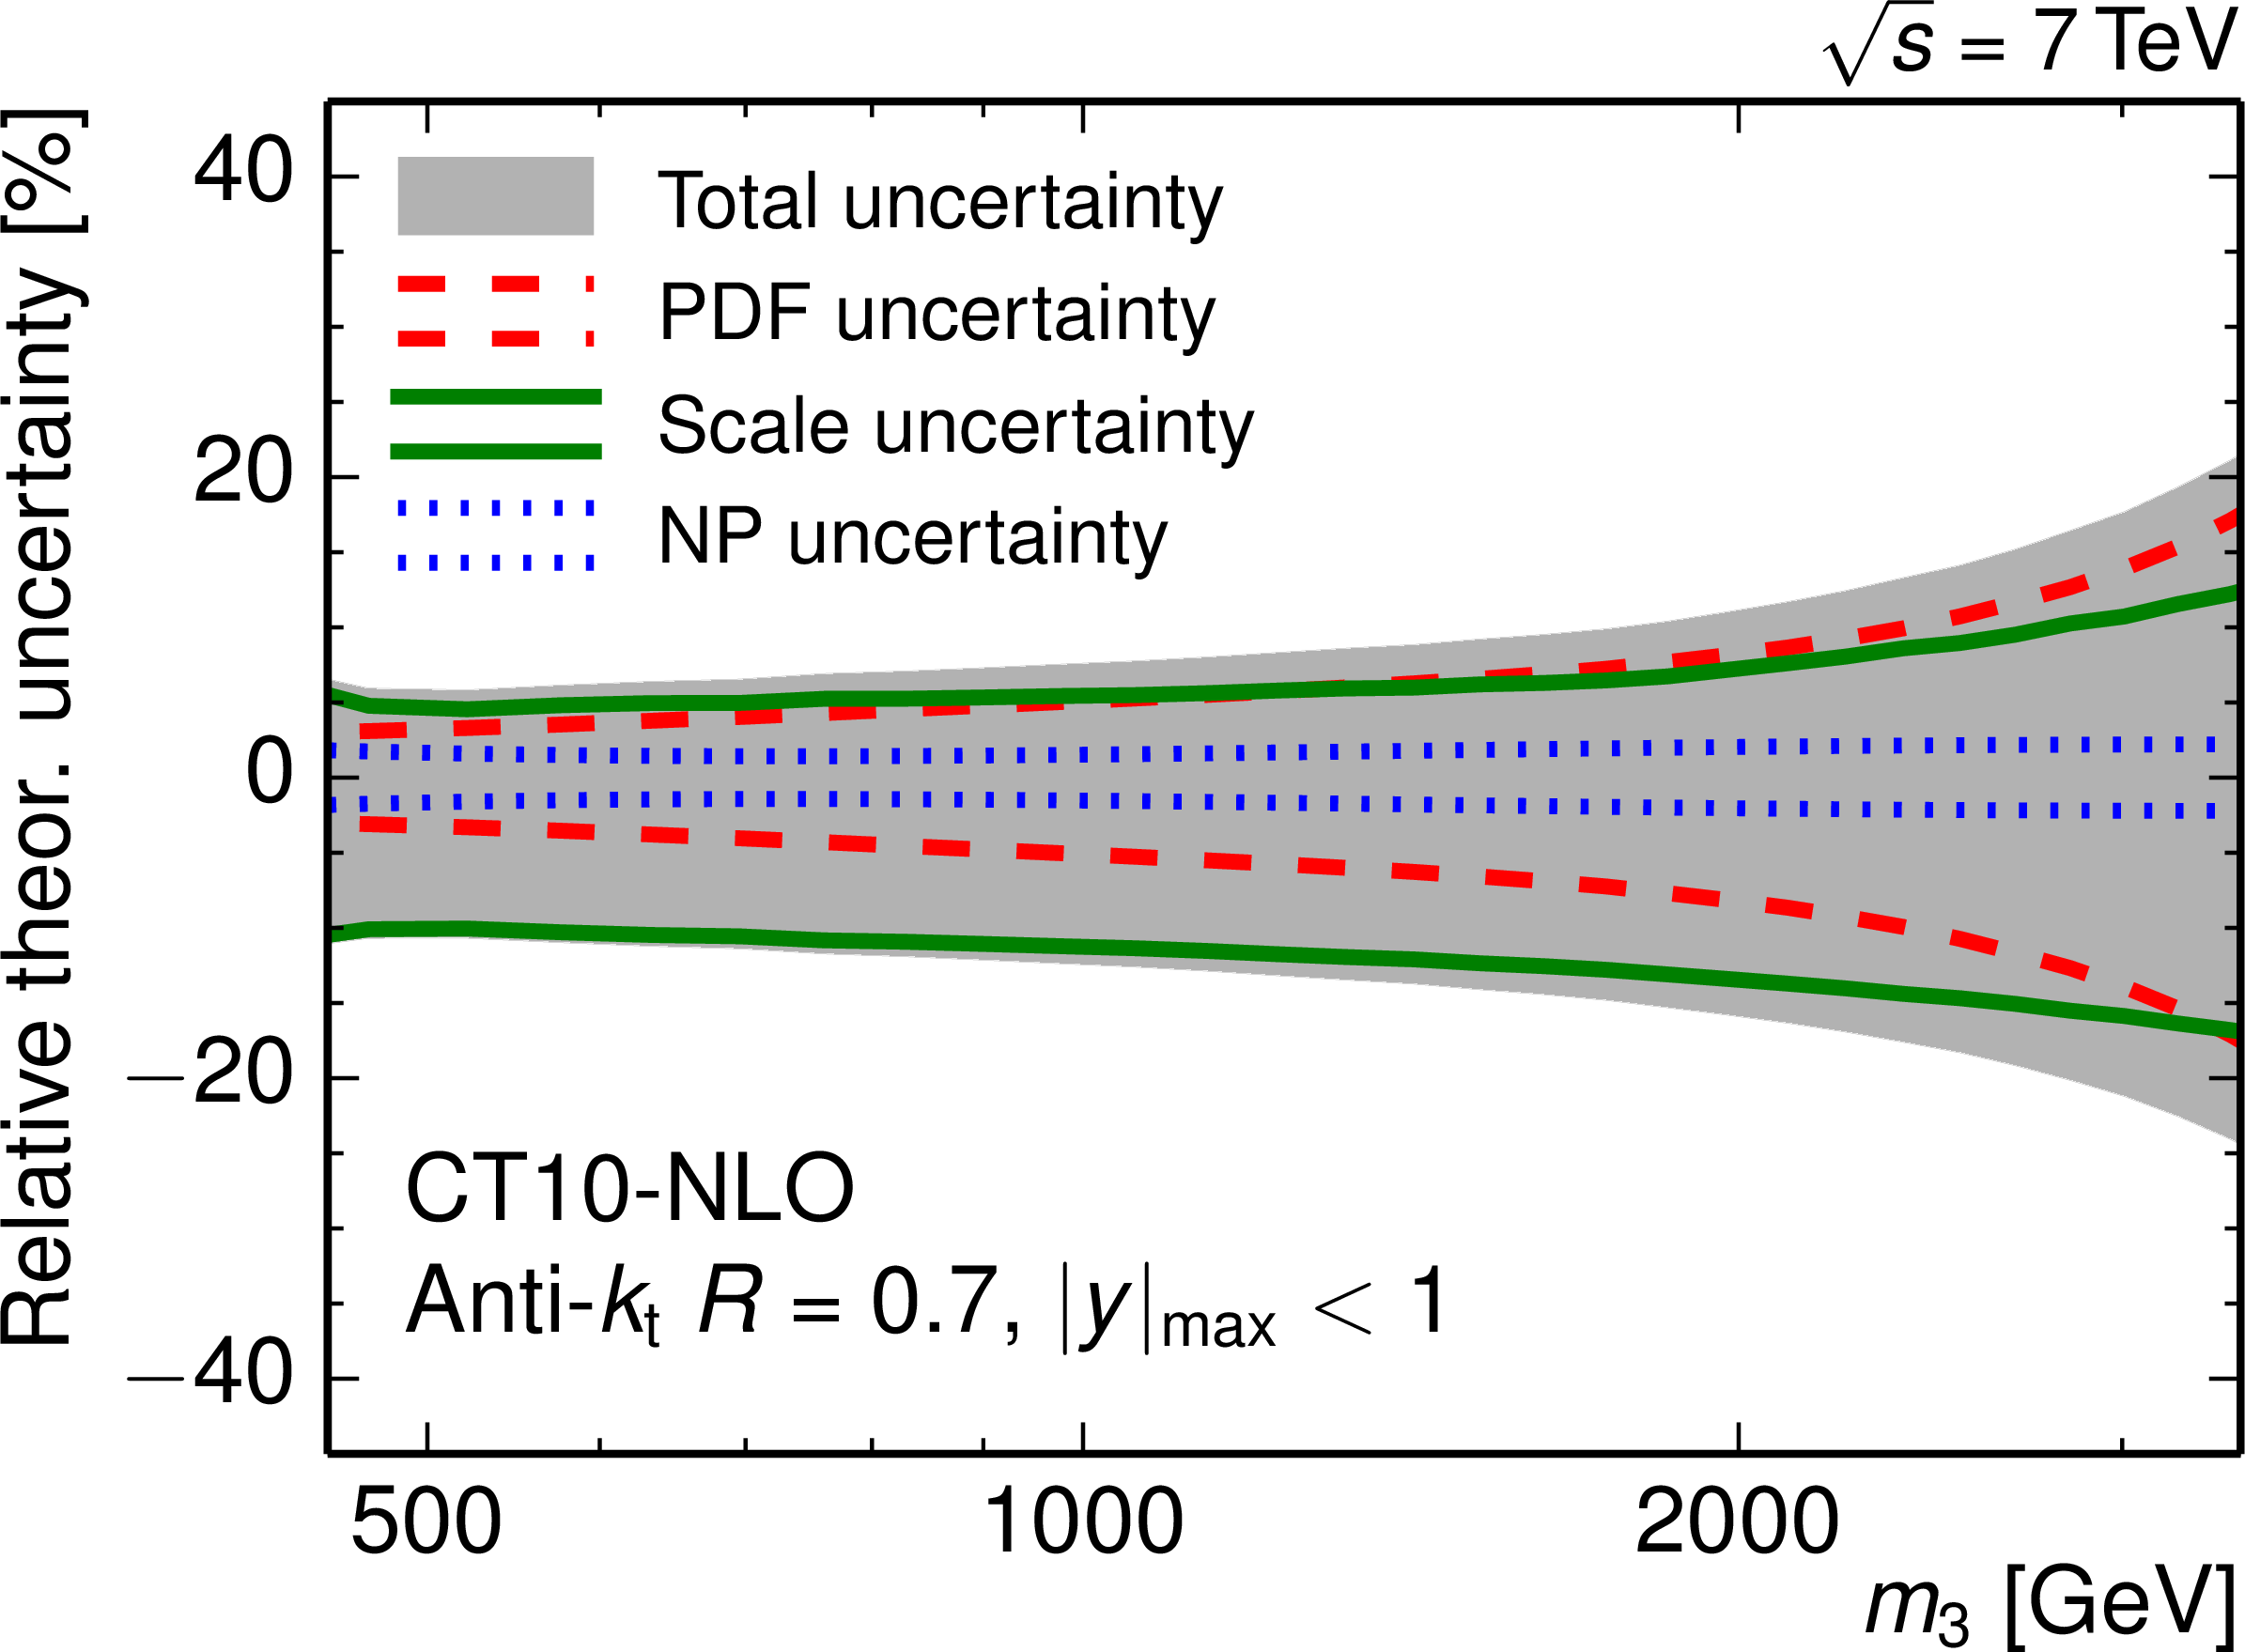
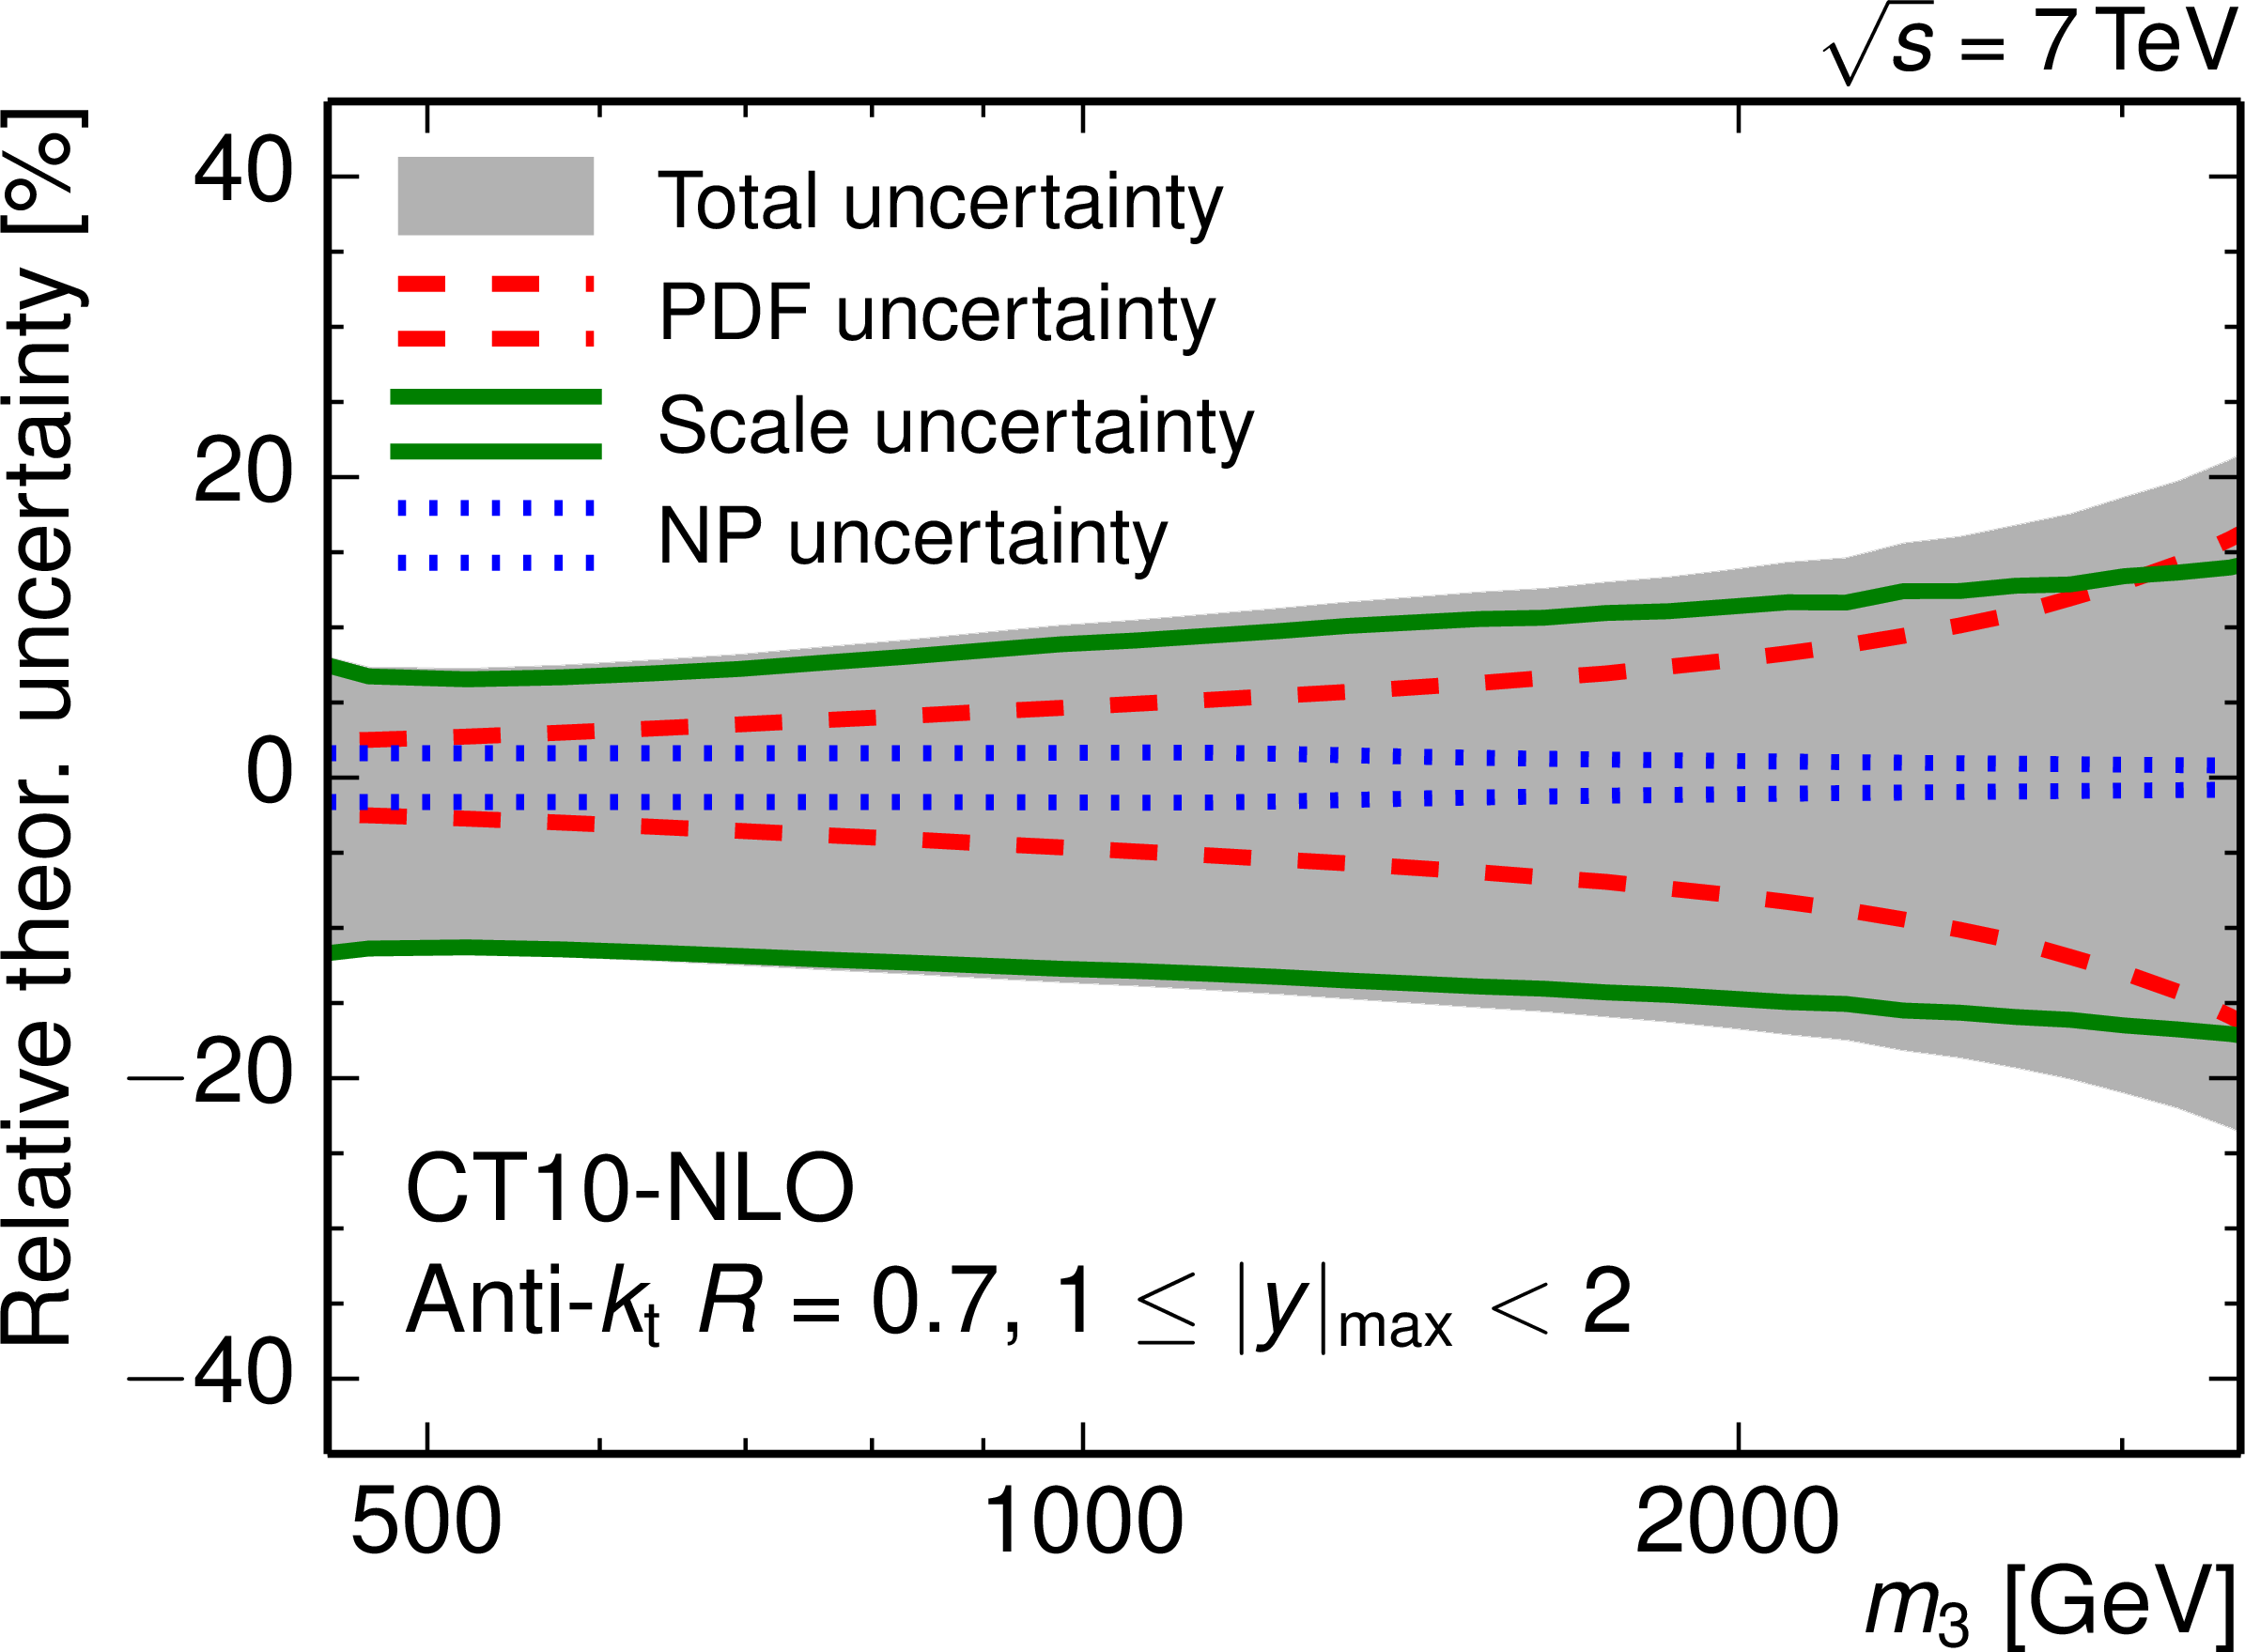
Figure 3-a:
Overview of the theory uncertainties in the inner $ { {| y | }_{\text {max}}} < 1$ (a) and in the outer rapidity region $1 \leq { {| y | }_{\text {max}}} < 2$ (b) for the CT10 PDF set with NLO PDF evolution. |
png pdf |
Figure 3-b:
Overview of the theory uncertainties in the inner $ { {| y | }_{\text {max}}} < 1$ (a) and in the outer rapidity region $1 \leq { {| y | }_{\text {max}}} < 2$ (b) for the CT10 PDF set with NLO PDF evolution. |
png pdf |
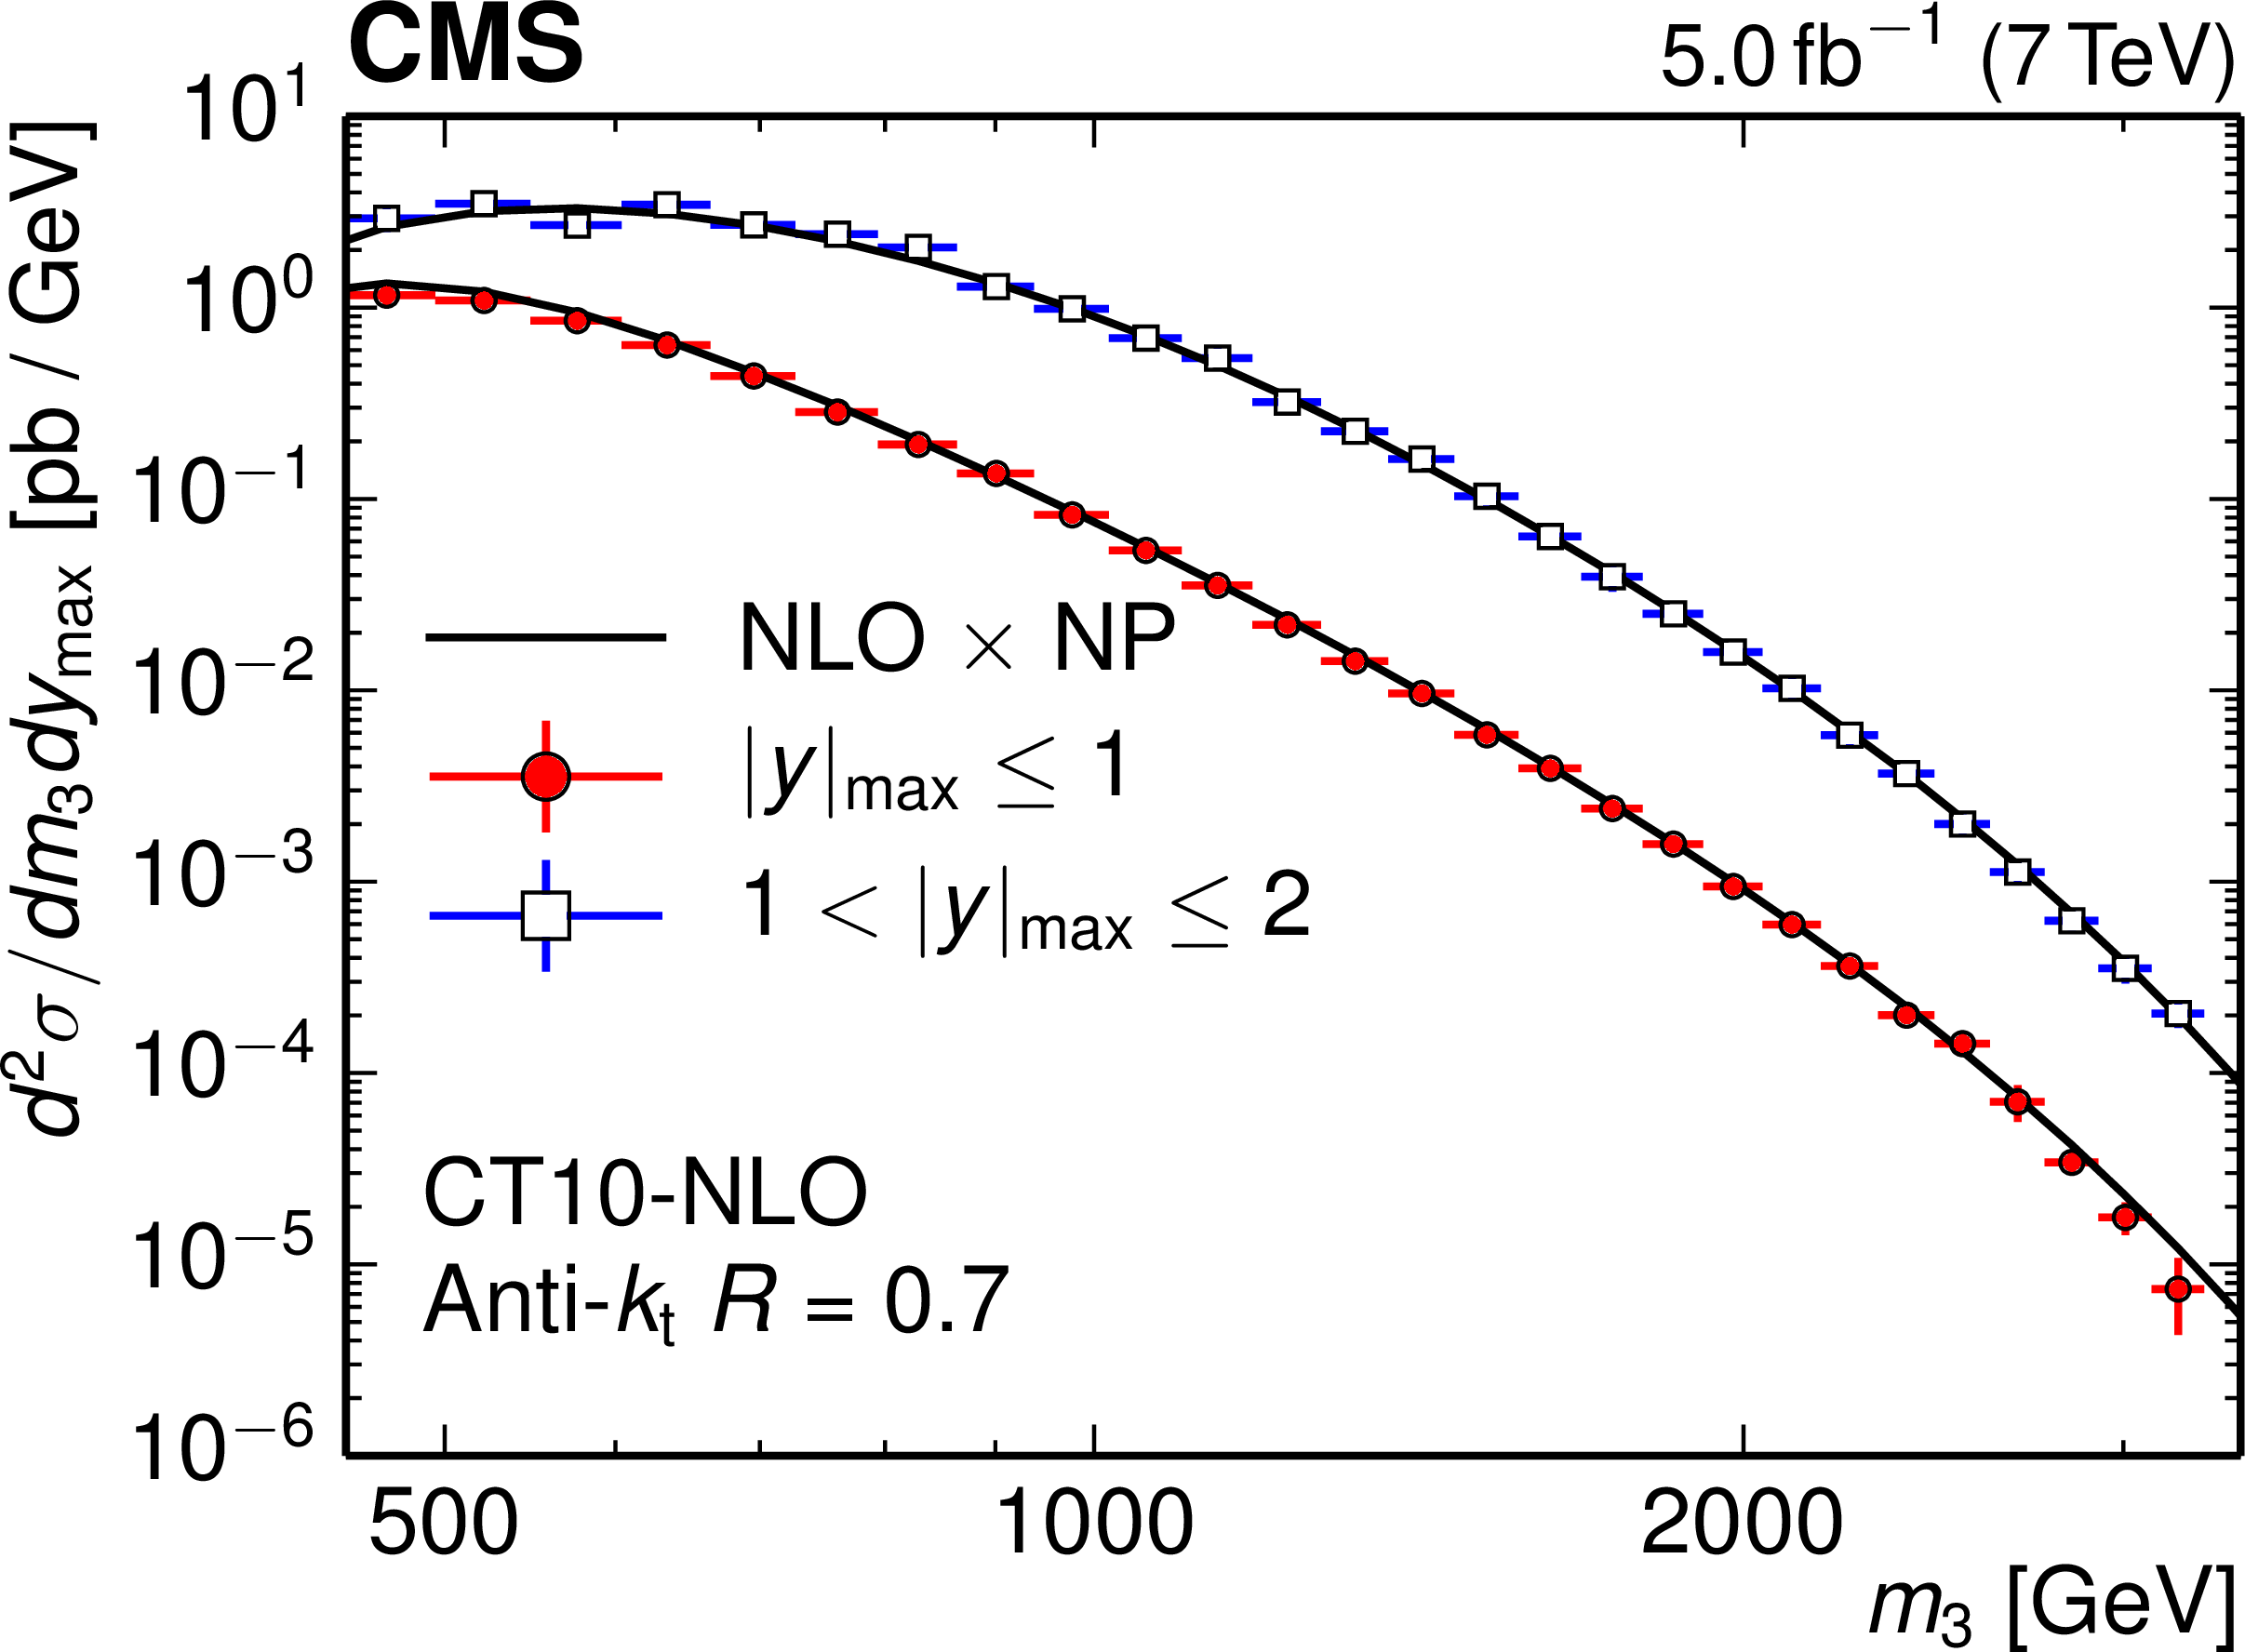
Figure 4:
Comparison of the measured 3-jet mass cross section with the theory prediction for the two regions in $ { {| y | }_{\text {max}}} $. This prediction is based on an NLO 3-jet calculation, which employs the CT10-NLO PDF set and is corrected for nonperturbative effects. The vertical error bars represent the total experimental uncertainty, while the horizontal error bars indicate the bin widths. |
png pdf |
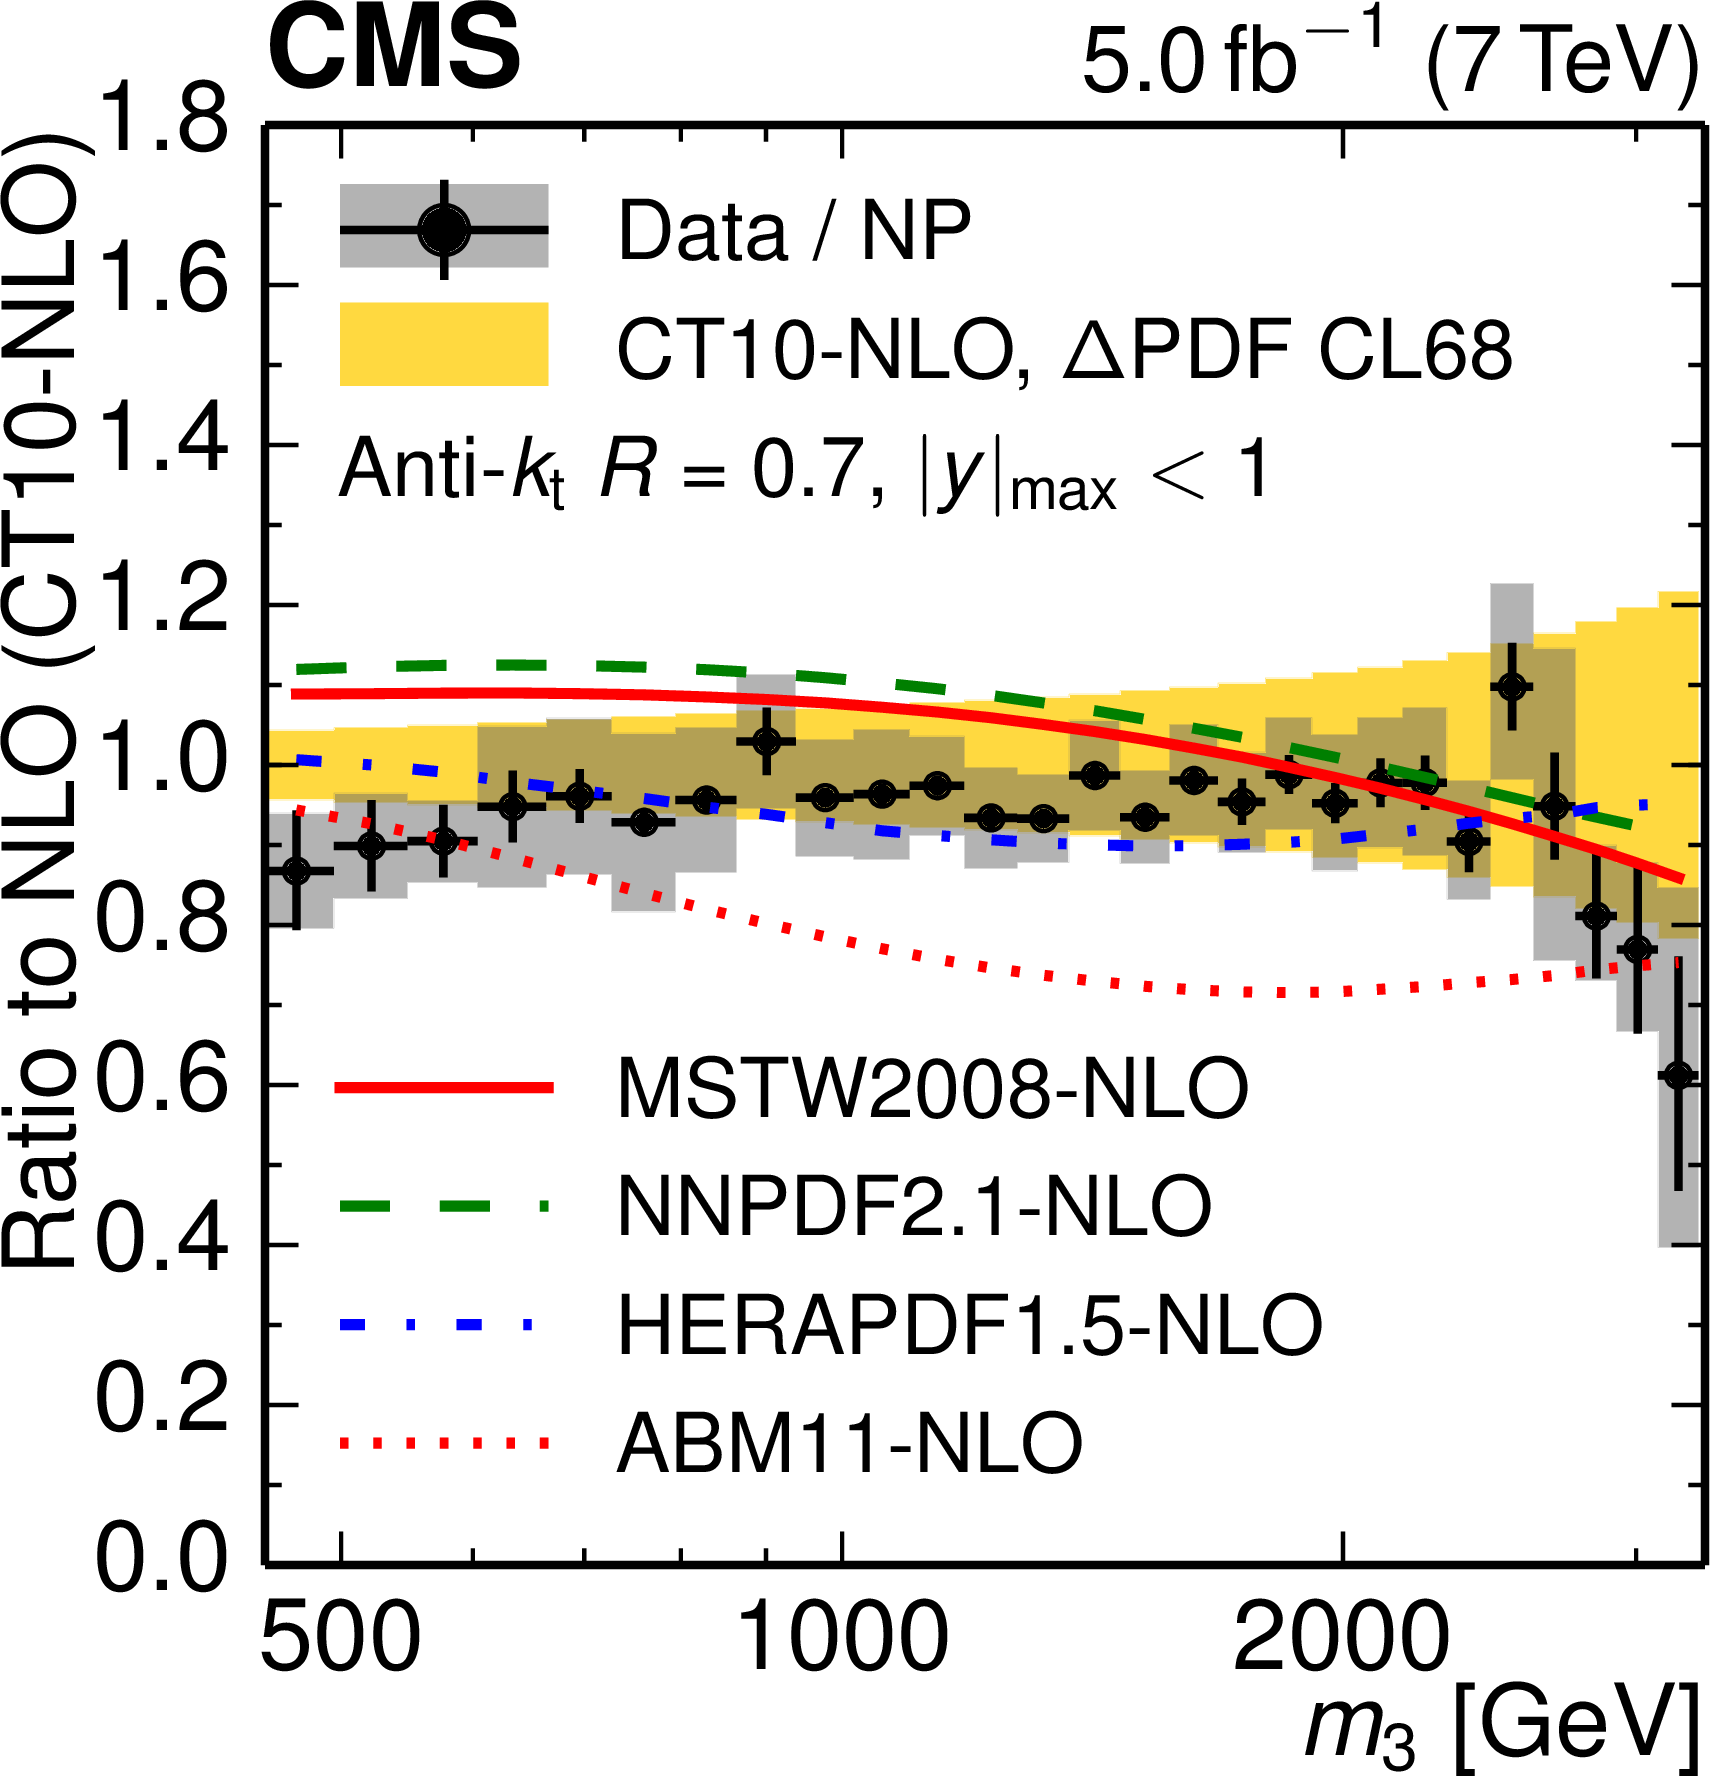
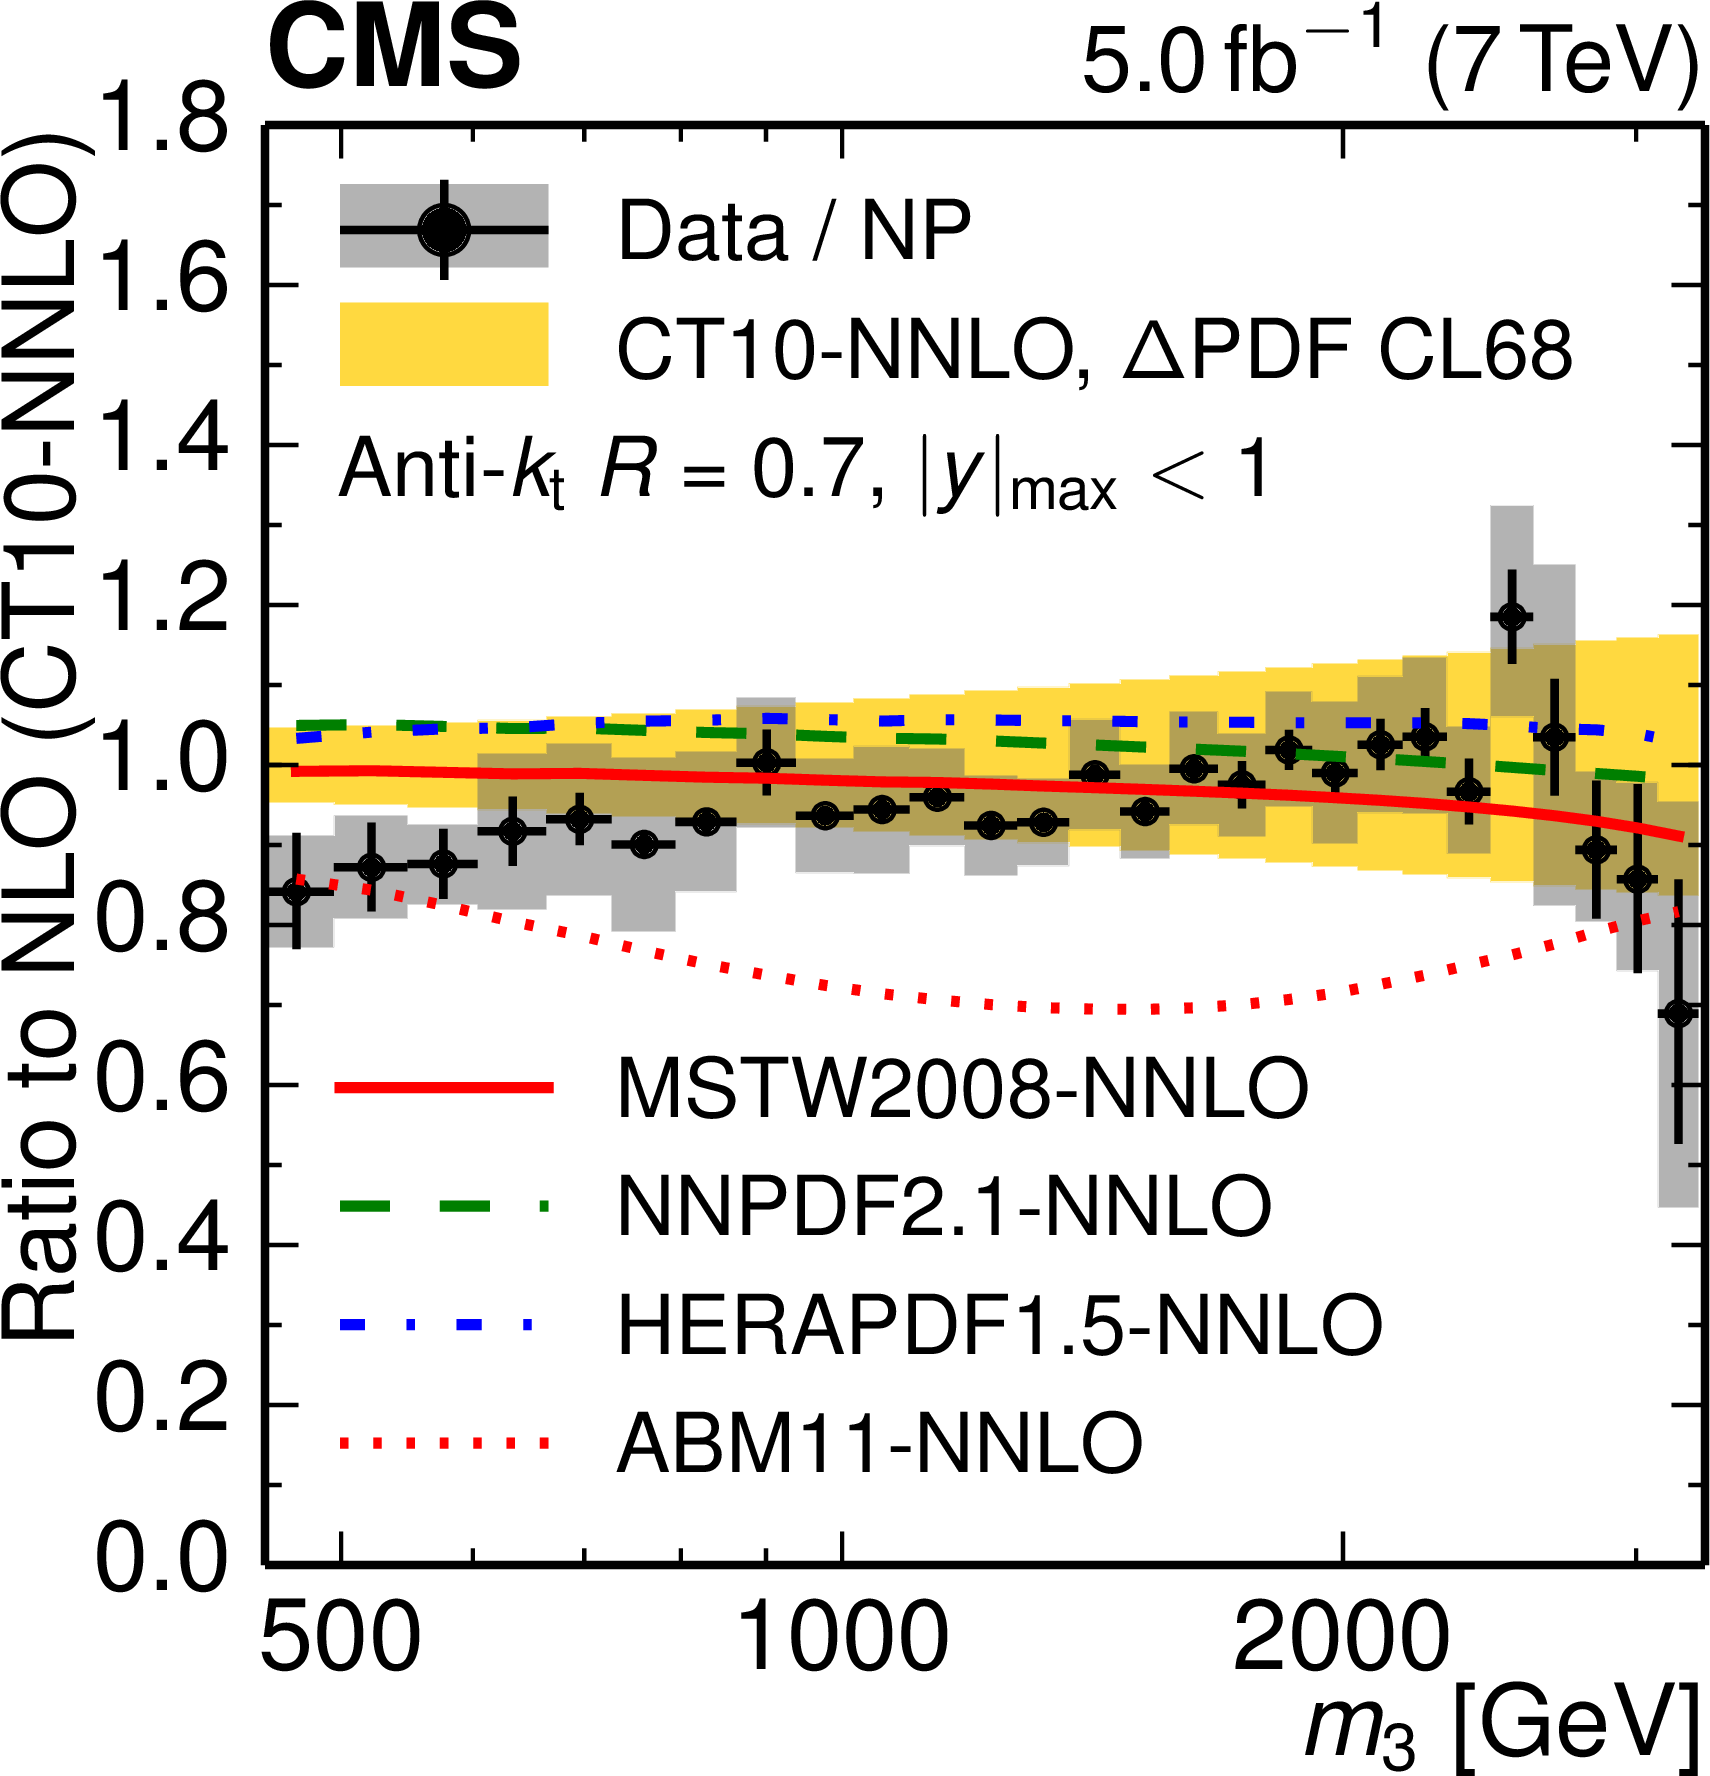
Figure 5-a:
Ratio of the 3-jet mass cross section, divided by NP corrections, to the theory prediction at NLO with the CT10-NLO (a, b) or CT10-NNLO PDF set (c, d) for the inner rapidity region (a, c) and for the outer rapidity region (b, d). The data are shown with error bars representing the statistical uncertainty after unfolding added quadratically to the 1% uncorrelated residual uncertainty and gray rectangles for the total correlated systematic uncertainty. The yellow band indicates the PDF uncertainty for the CT10 PDF sets at 68% confidence level. In addition, the ratios of the NLO predictions are displayed for the PDF sets MSTW2008, NNPDF2.1, HERAPDF1.5, and ABM11, also at next-to- (a, b) and next-to-next-to-leading evolution order (c, d). |
png pdf |
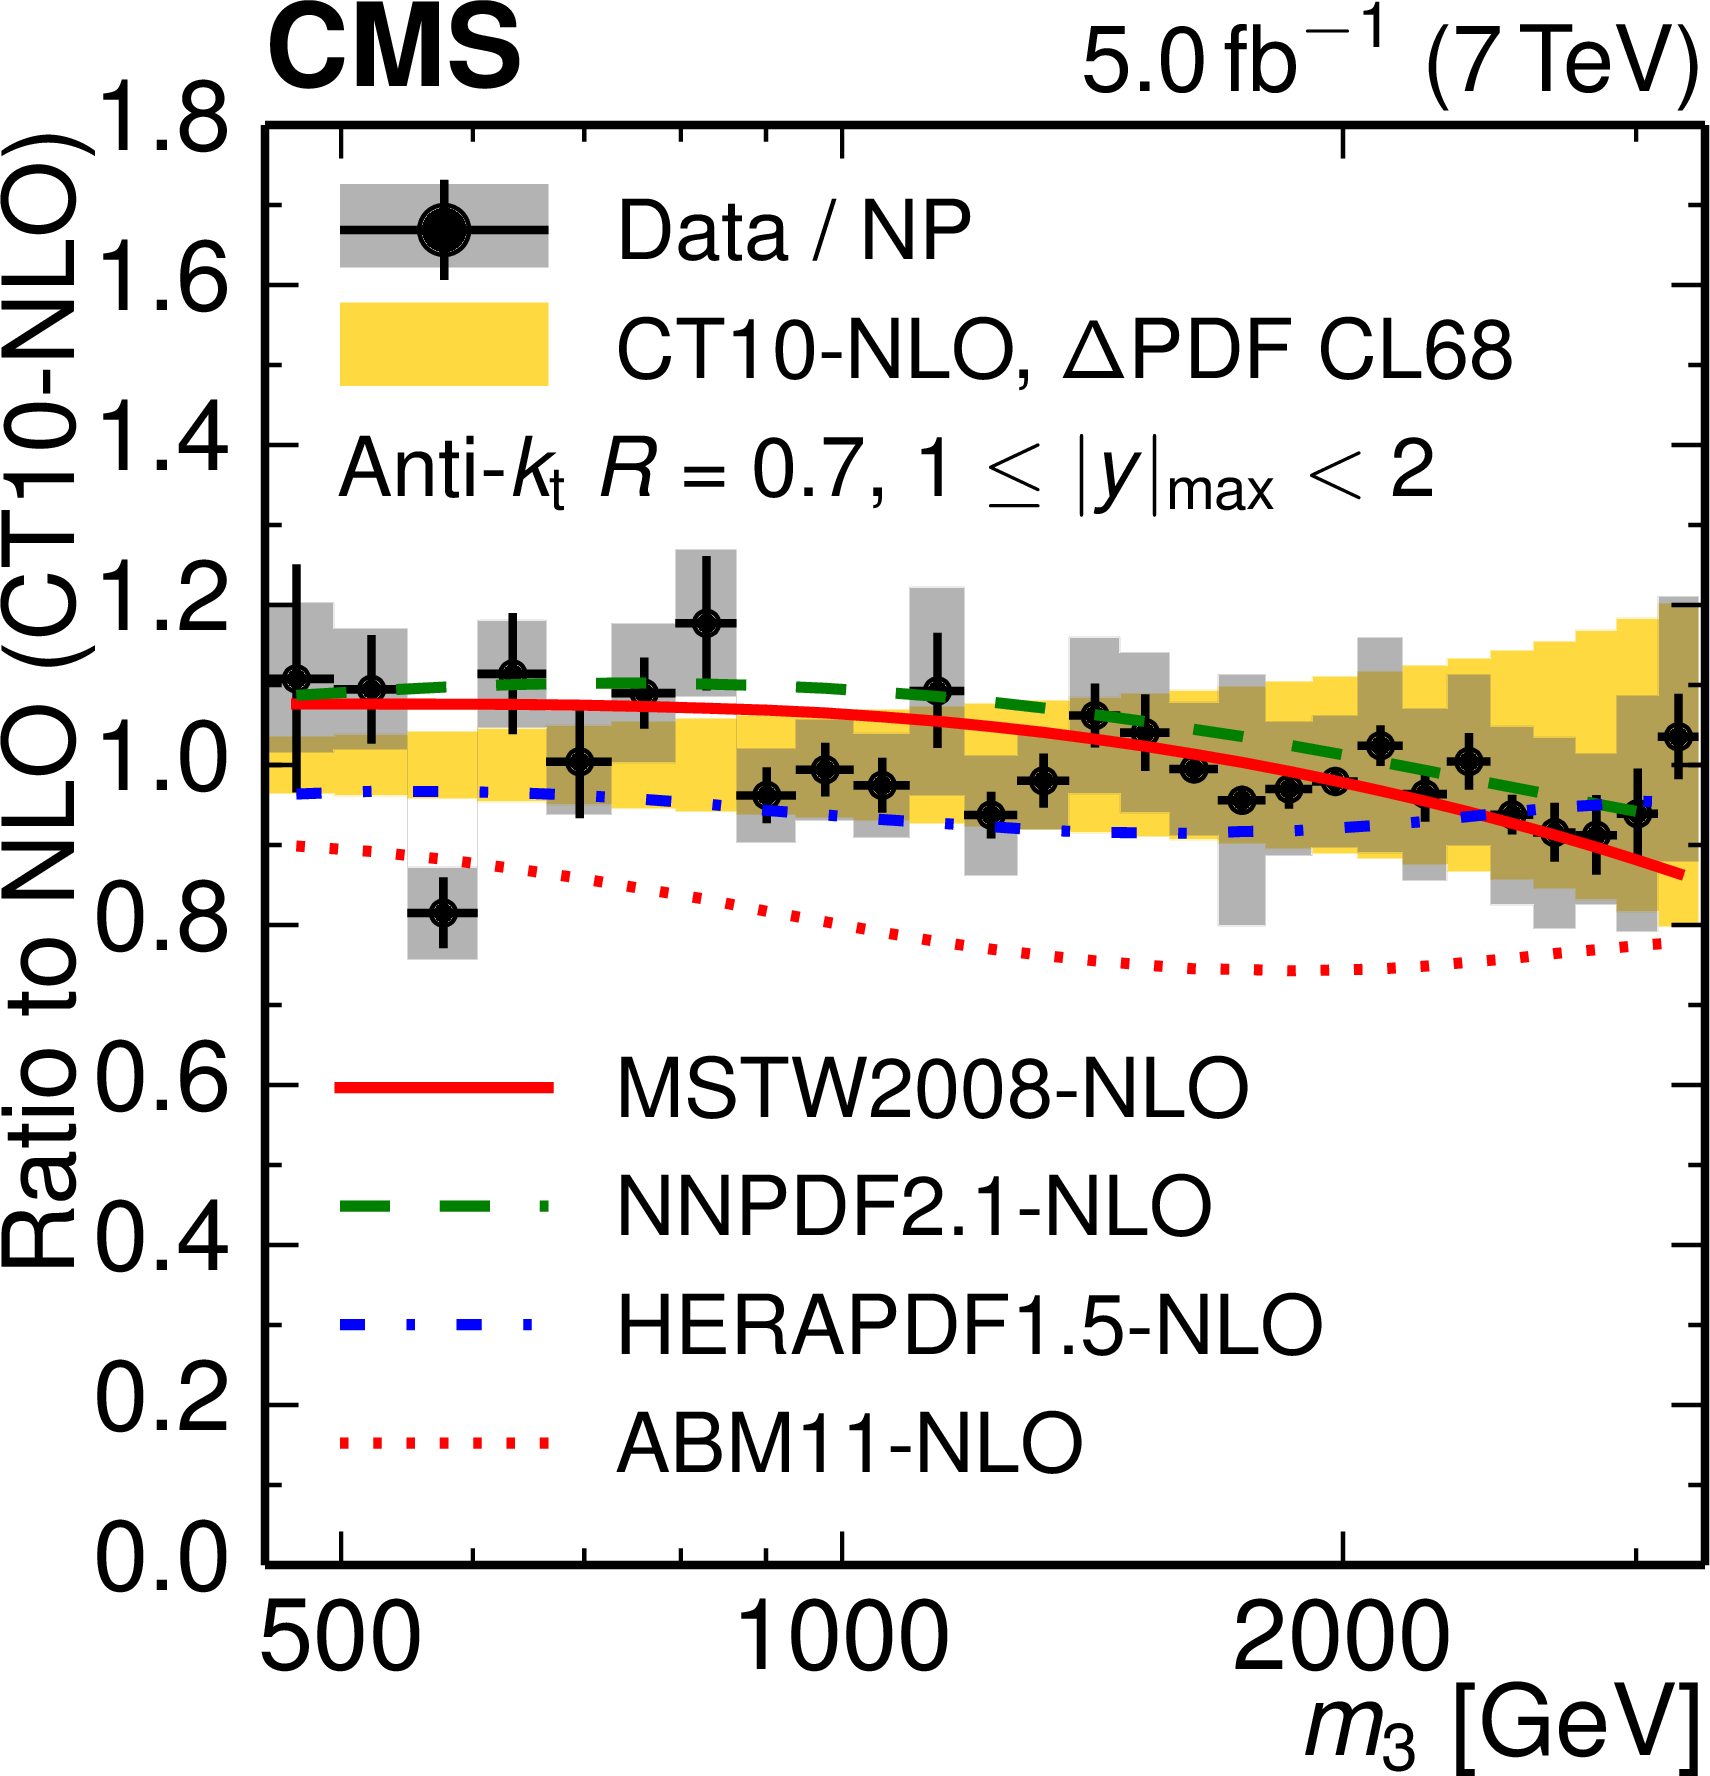
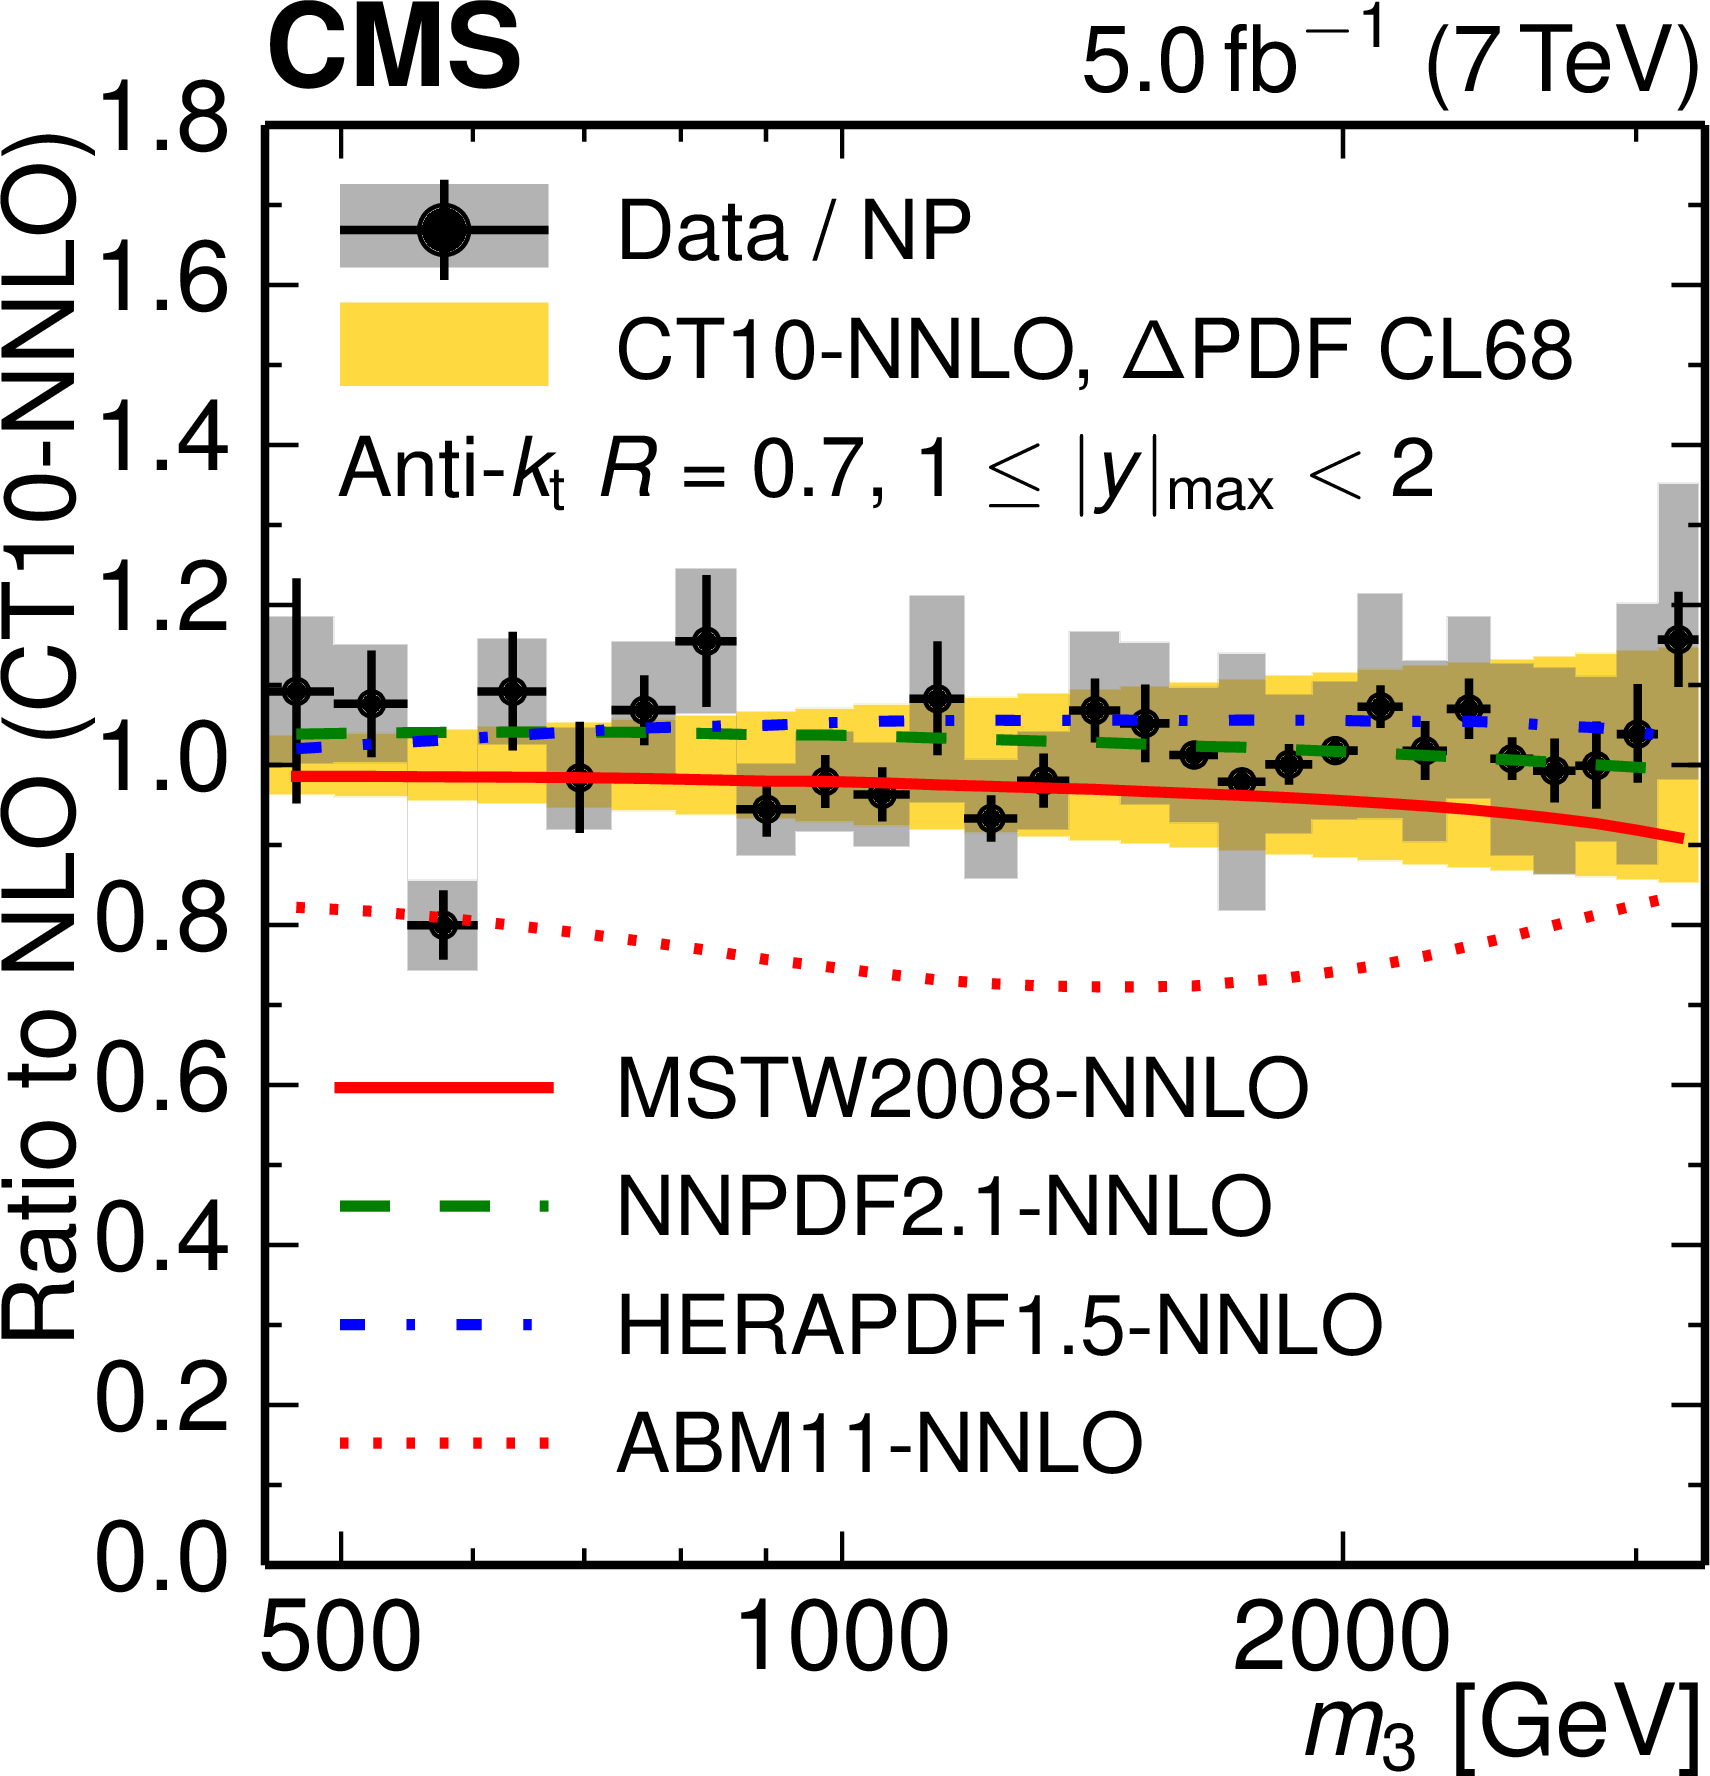
Figure 5-b:
Ratio of the 3-jet mass cross section, divided by NP corrections, to the theory prediction at NLO with the CT10-NLO (a, b) or CT10-NNLO PDF set (c, d) for the inner rapidity region (a, c) and for the outer rapidity region (b, d). The data are shown with error bars representing the statistical uncertainty after unfolding added quadratically to the 1% uncorrelated residual uncertainty and gray rectangles for the total correlated systematic uncertainty. The yellow band indicates the PDF uncertainty for the CT10 PDF sets at 68% confidence level. In addition, the ratios of the NLO predictions are displayed for the PDF sets MSTW2008, NNPDF2.1, HERAPDF1.5, and ABM11, also at next-to- (a, b) and next-to-next-to-leading evolution order (c, d). |
png pdf |
Figure 5-c:
Ratio of the 3-jet mass cross section, divided by NP corrections, to the theory prediction at NLO with the CT10-NLO (a, b) or CT10-NNLO PDF set (c, d) for the inner rapidity region (a, c) and for the outer rapidity region (b, d). The data are shown with error bars representing the statistical uncertainty after unfolding added quadratically to the 1% uncorrelated residual uncertainty and gray rectangles for the total correlated systematic uncertainty. The yellow band indicates the PDF uncertainty for the CT10 PDF sets at 68% confidence level. In addition, the ratios of the NLO predictions are displayed for the PDF sets MSTW2008, NNPDF2.1, HERAPDF1.5, and ABM11, also at next-to- (a, b) and next-to-next-to-leading evolution order (c, d). |
png pdf |
Figure 5-d:
Ratio of the 3-jet mass cross section, divided by NP corrections, to the theory prediction at NLO with the CT10-NLO (a, b) or CT10-NNLO PDF set (c, d) for the inner rapidity region (a, c) and for the outer rapidity region (b, d). The data are shown with error bars representing the statistical uncertainty after unfolding added quadratically to the 1% uncorrelated residual uncertainty and gray rectangles for the total correlated systematic uncertainty. The yellow band indicates the PDF uncertainty for the CT10 PDF sets at 68% confidence level. In addition, the ratios of the NLO predictions are displayed for the PDF sets MSTW2008, NNPDF2.1, HERAPDF1.5, and ABM11, also at next-to- (a, b) and next-to-next-to-leading evolution order (c, d). |
png pdf |
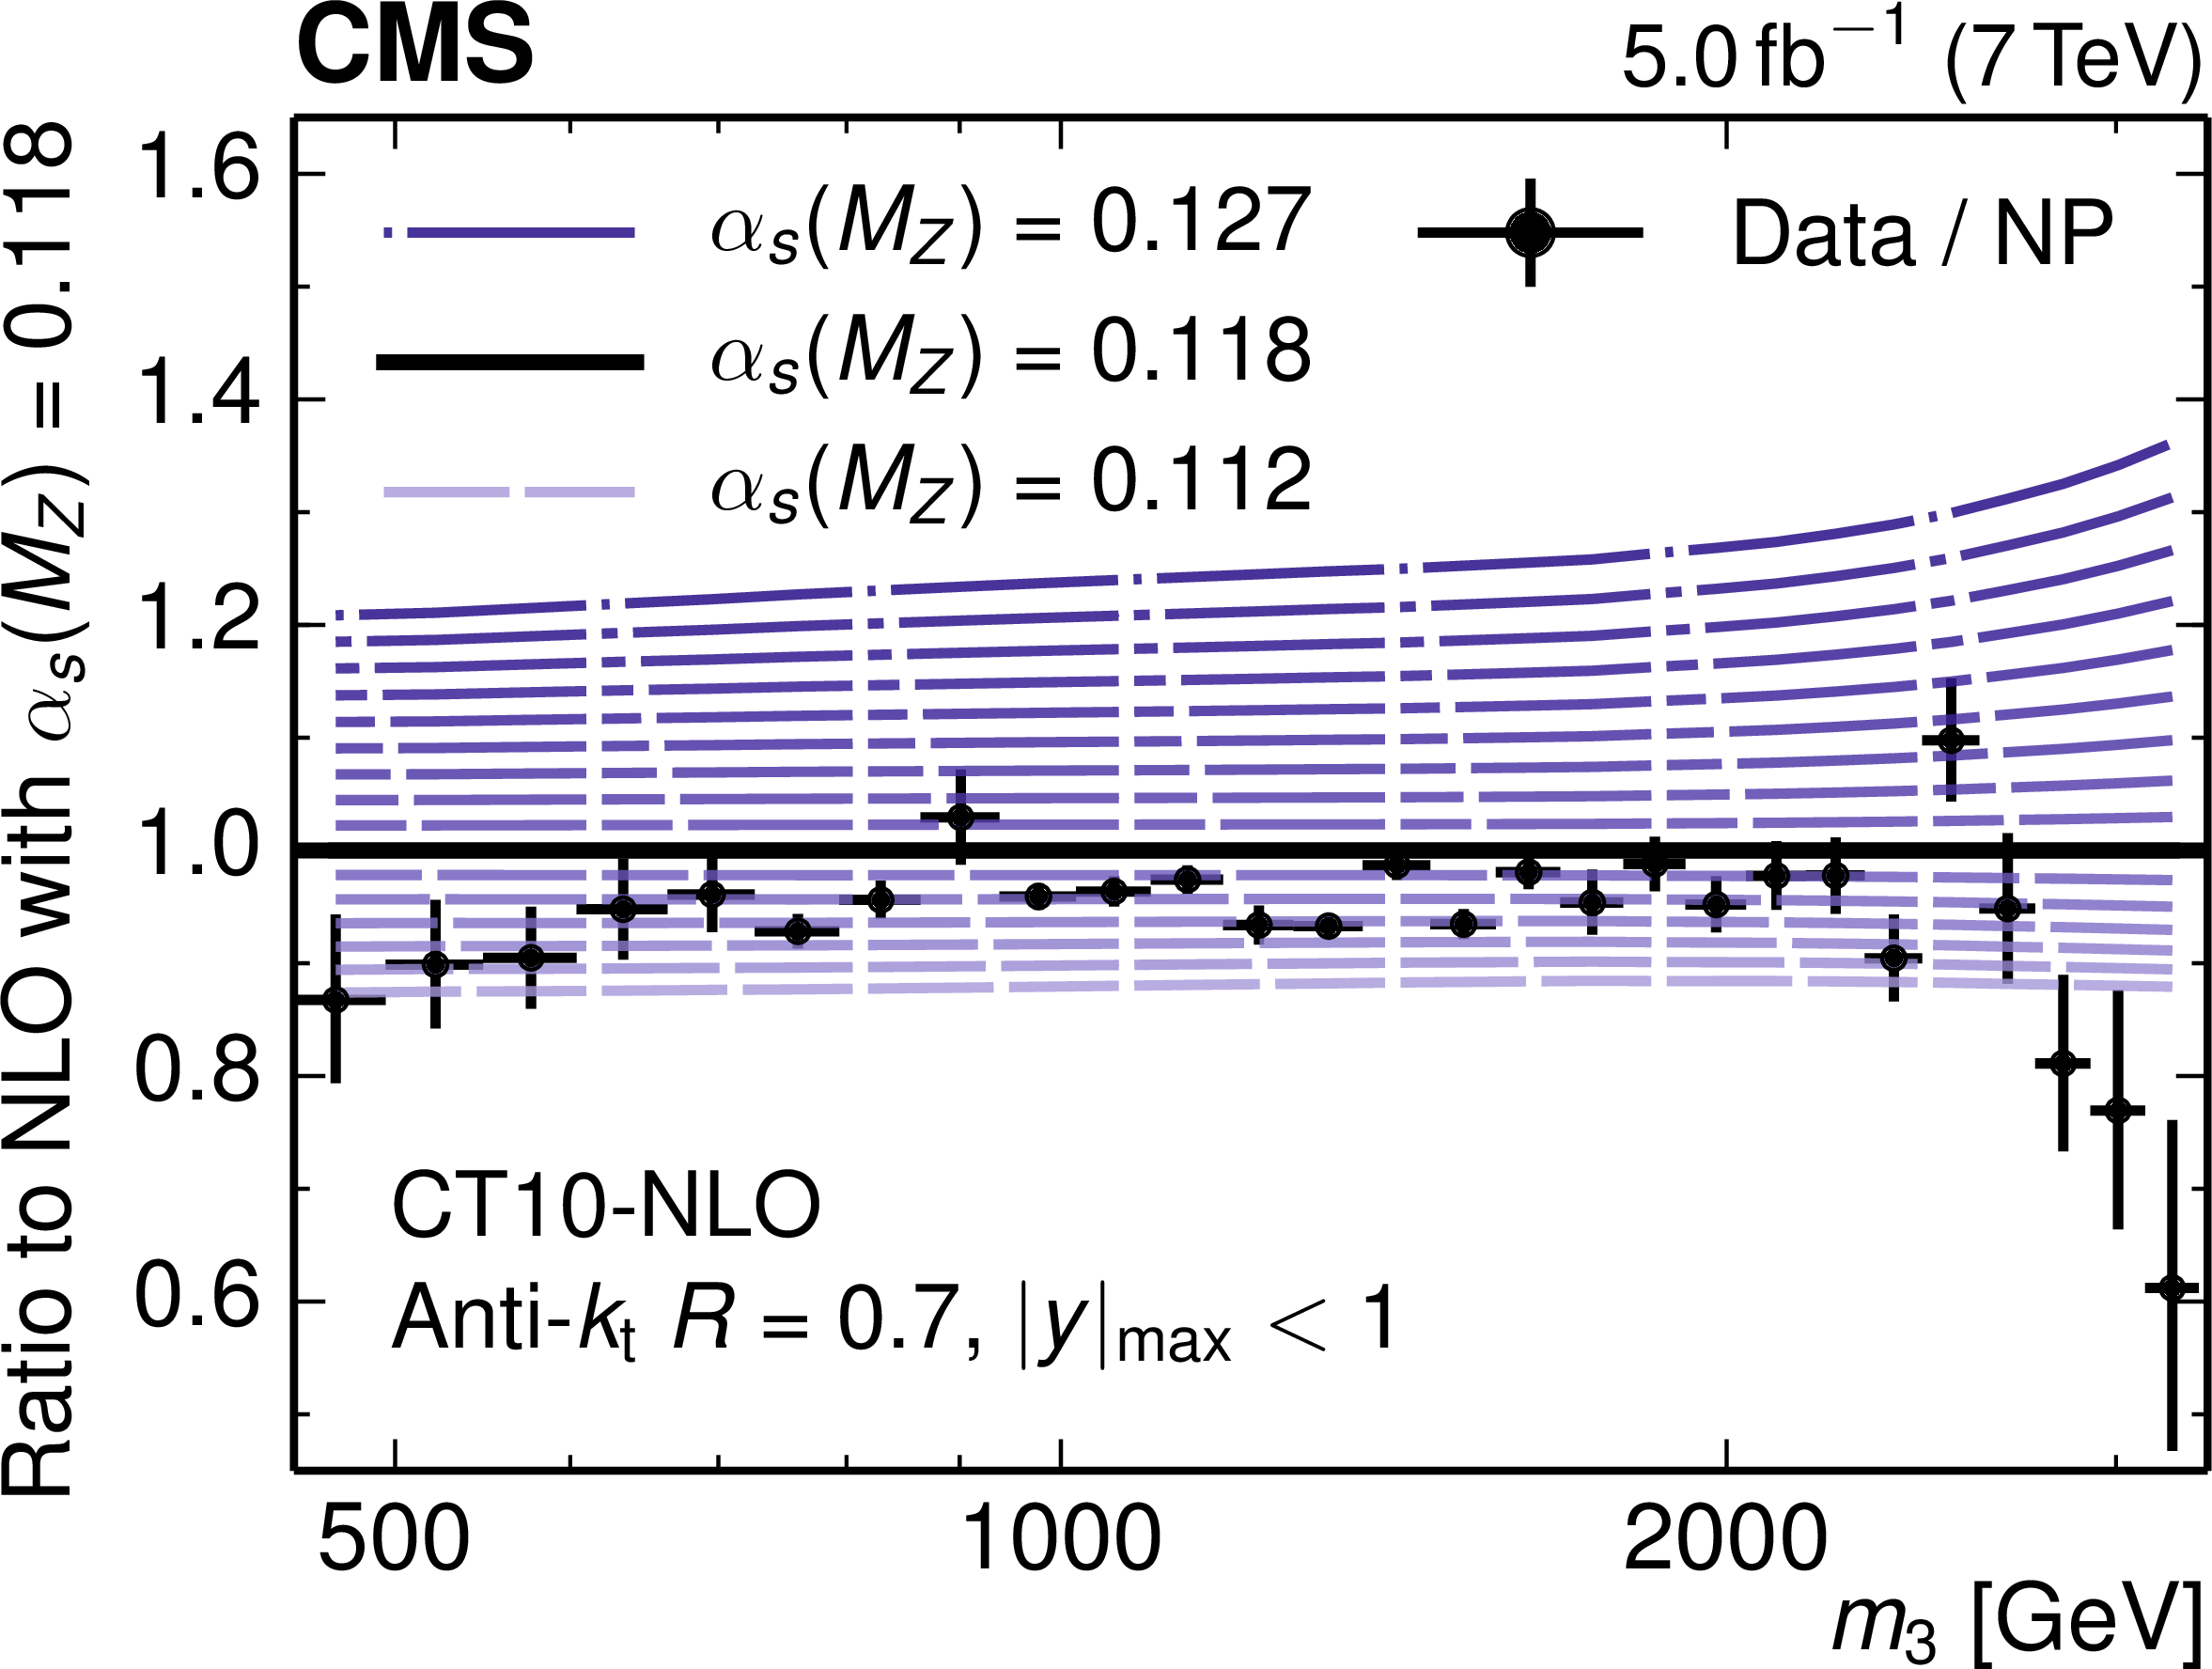
Figure 6-a:
Ratio of the measured 3-jet mass cross section in the inner rapidity region (a) and in the outer rapidity region (b), divided by the NP correction, with respect to the theory prediction at NLO while using the CT10-NLO PDF set with the default value of $ {\alpha _S(M_ {\mathrm {Z}})} = 0.118$. In addition, ratios are shown for the theory predictions with CT10-NLO PDFs assuming values of $ {\alpha _S(M_ {\mathrm {Z}})} $ ranging from 0.112 up to 0.127 in steps of 0.001. The error bars represent the total uncorrelated uncertainty of the data. |
png pdf |
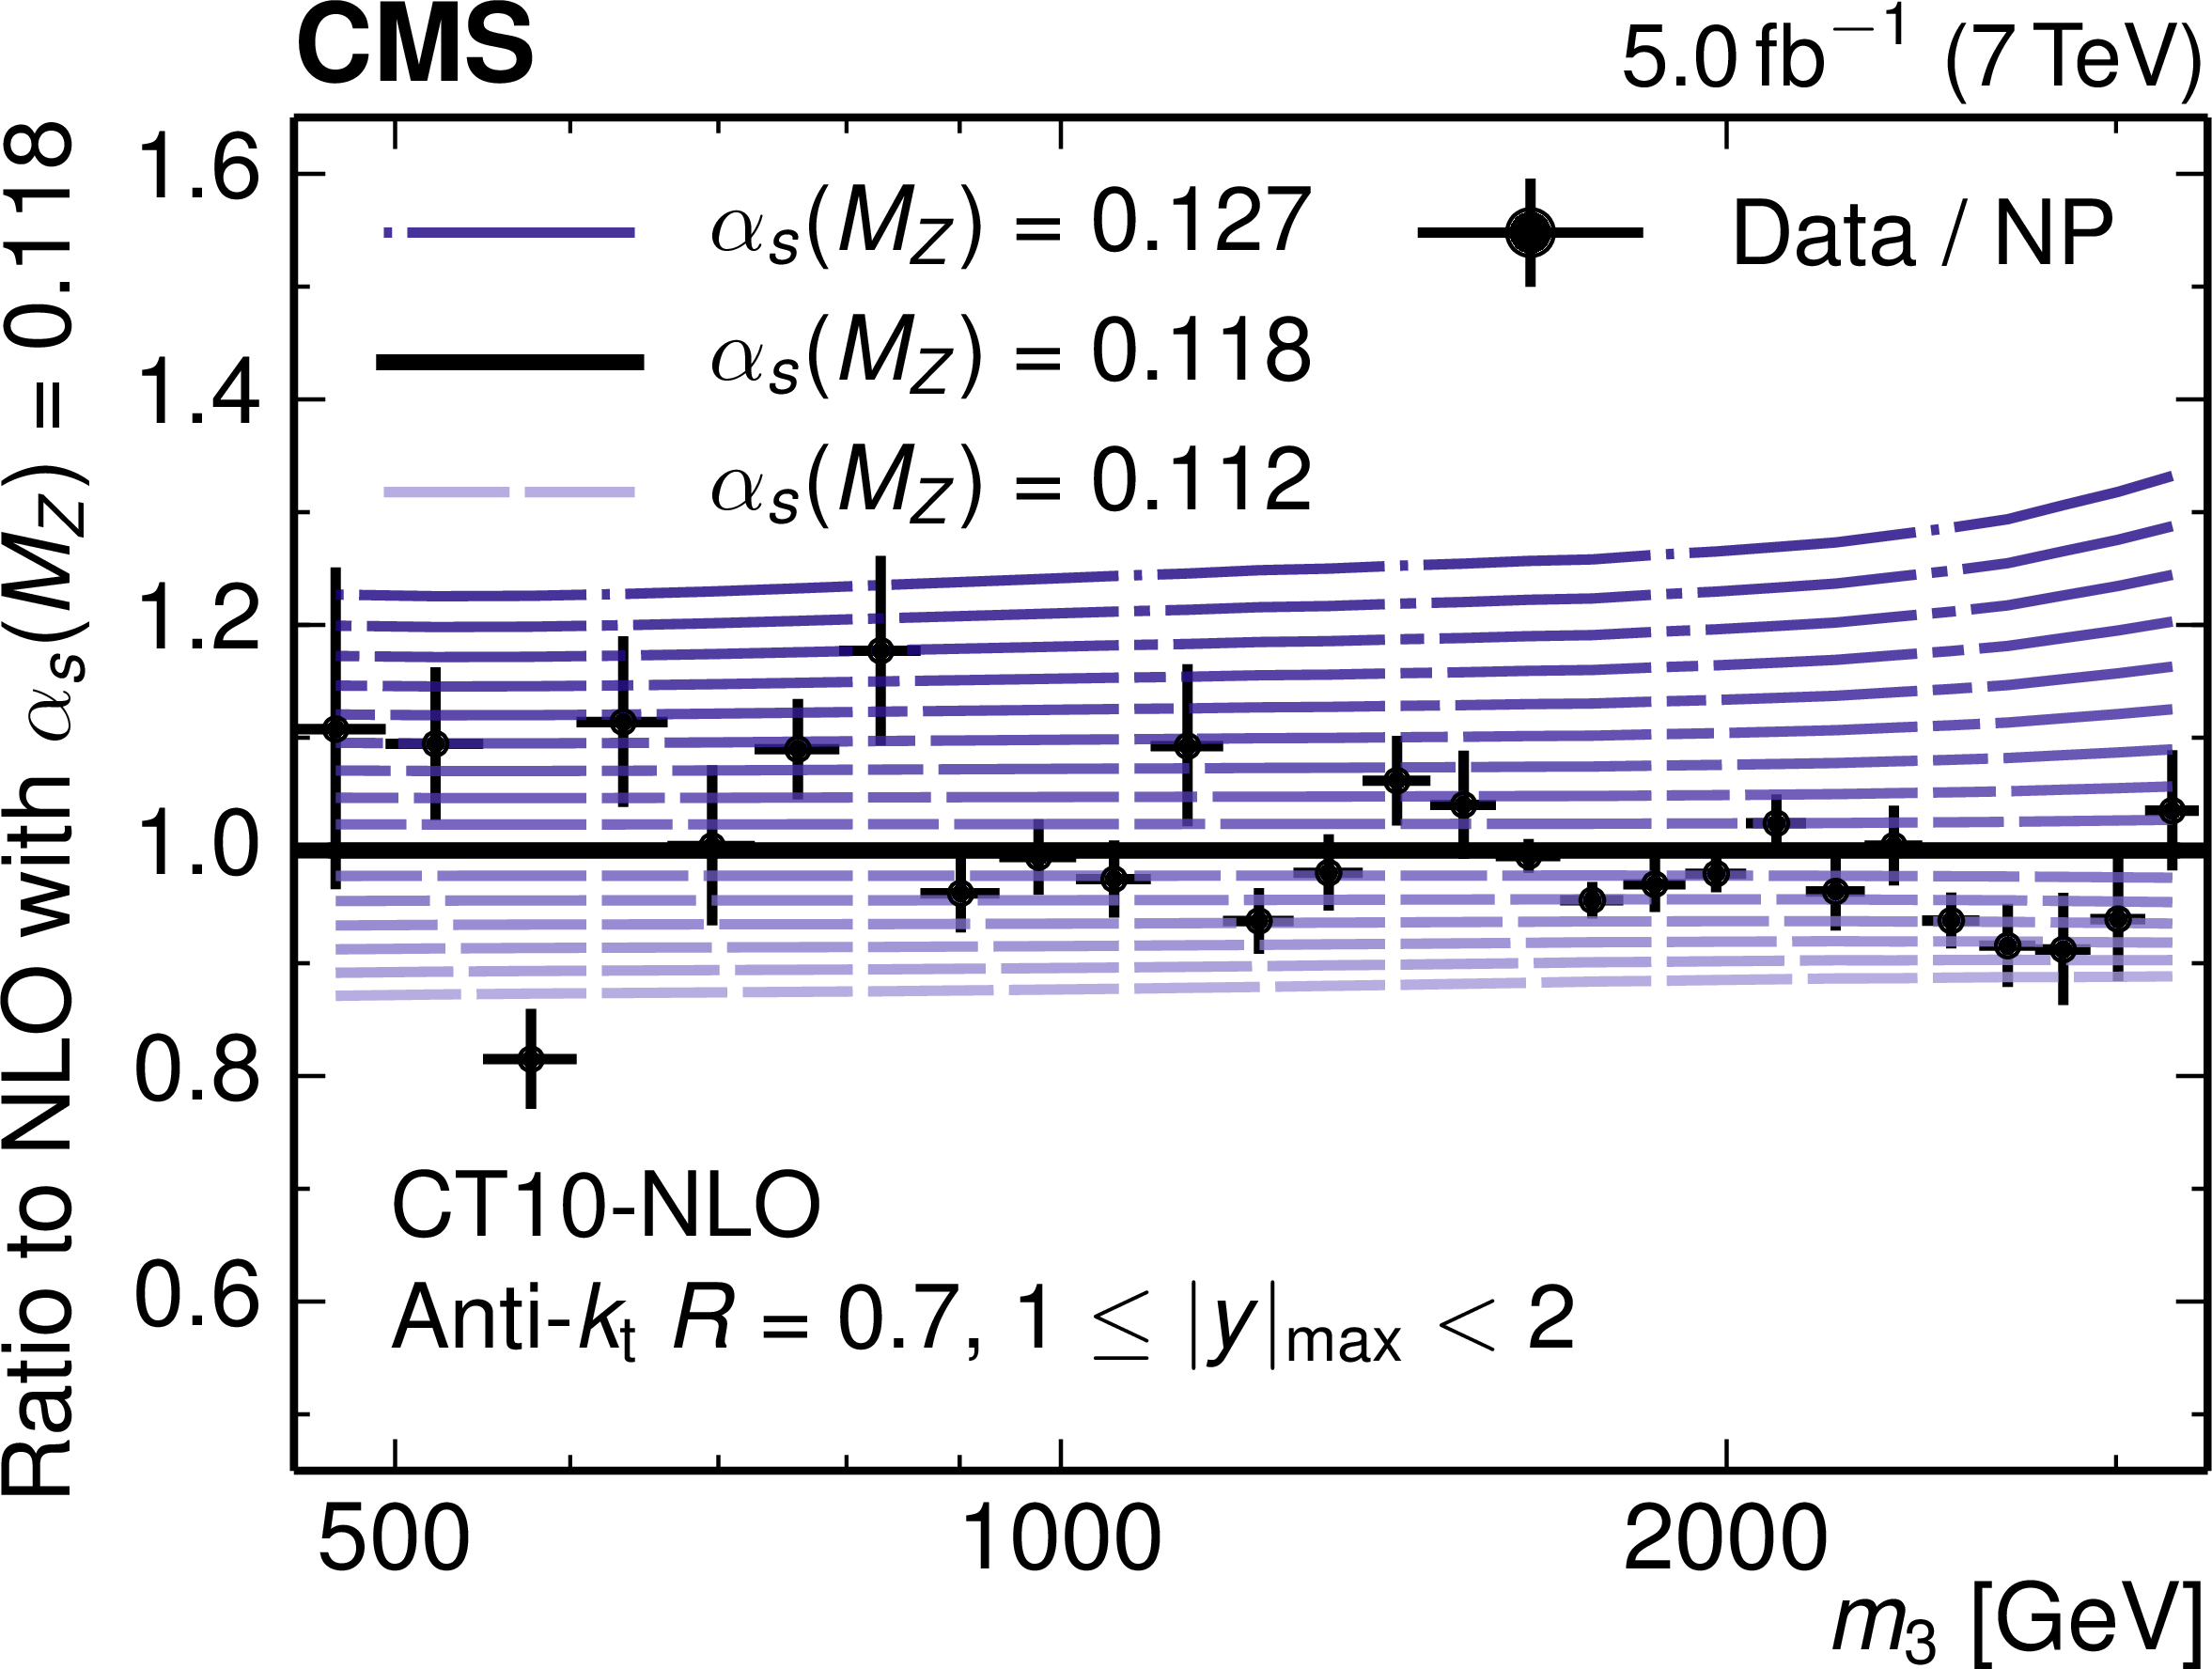
Figure 6-b:
Ratio of the measured 3-jet mass cross section in the inner rapidity region (a) and in the outer rapidity region (b), divided by the NP correction, with respect to the theory prediction at NLO while using the CT10-NLO PDF set with the default value of $ {\alpha _S(M_ {\mathrm {Z}})} = 0.118$. In addition, ratios are shown for the theory predictions with CT10-NLO PDFs assuming values of $ {\alpha _S(M_ {\mathrm {Z}})} $ ranging from 0.112 up to 0.127 in steps of 0.001. The error bars represent the total uncorrelated uncertainty of the data. |
png pdf |
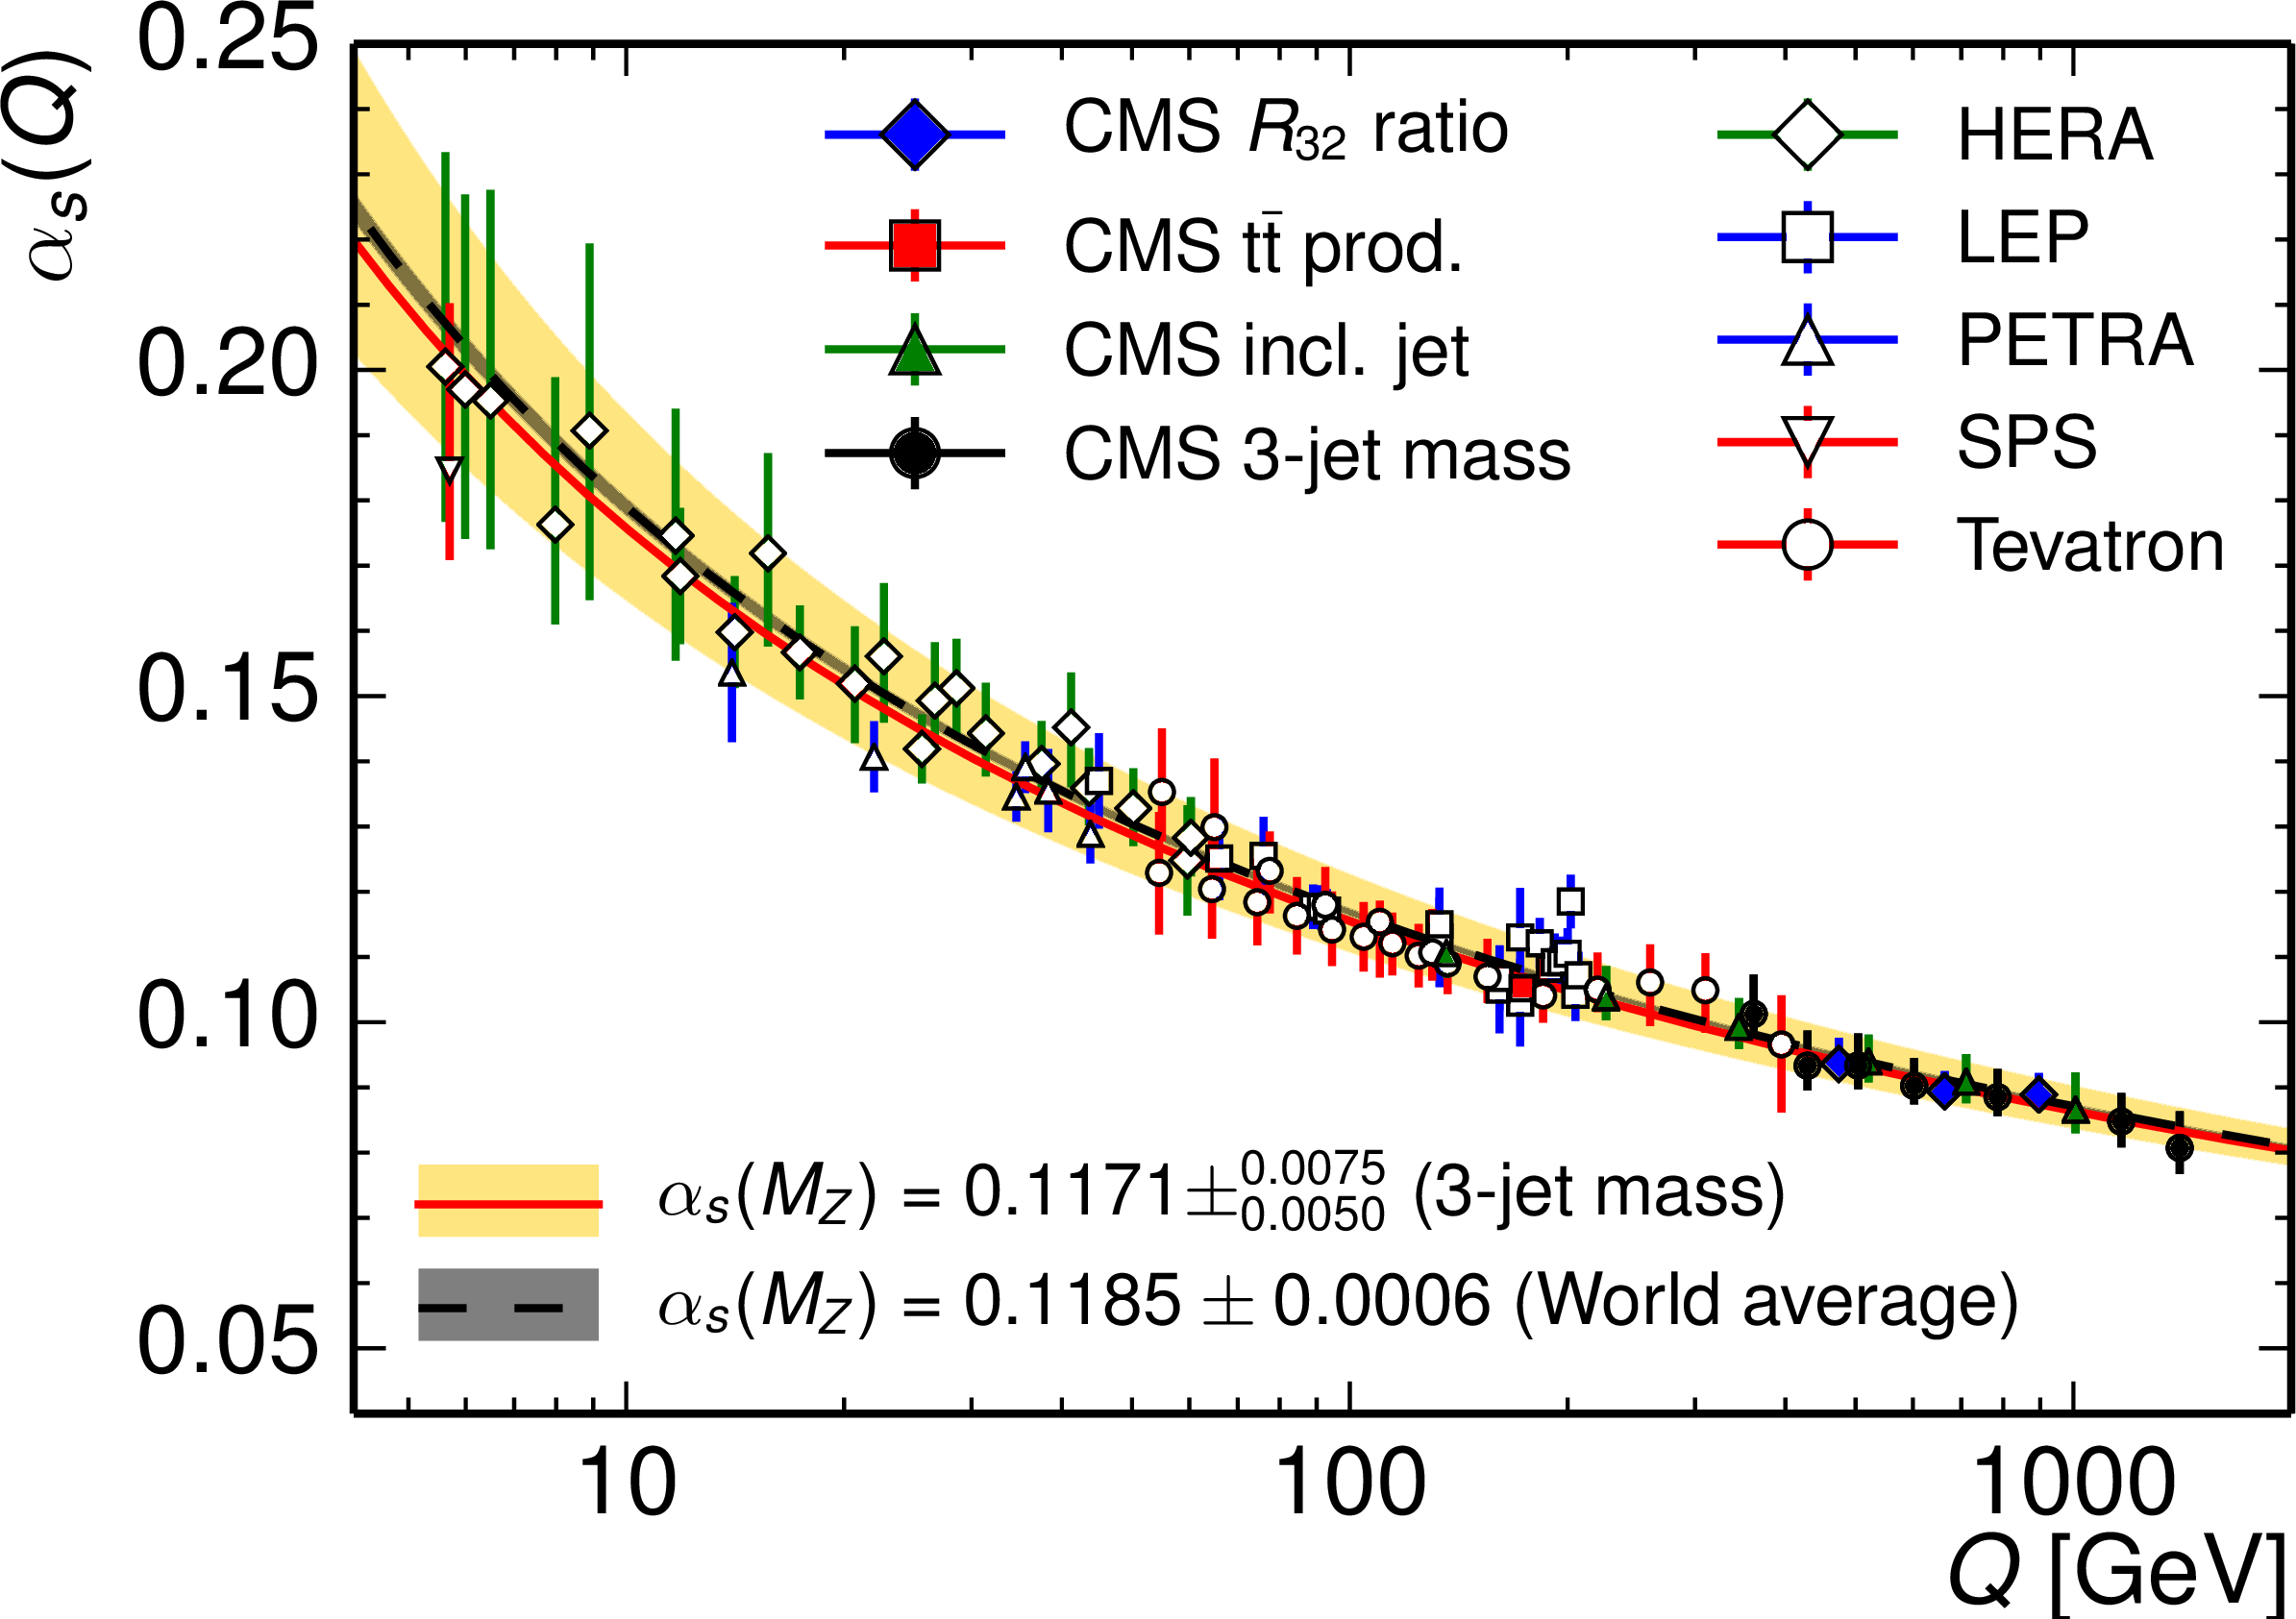
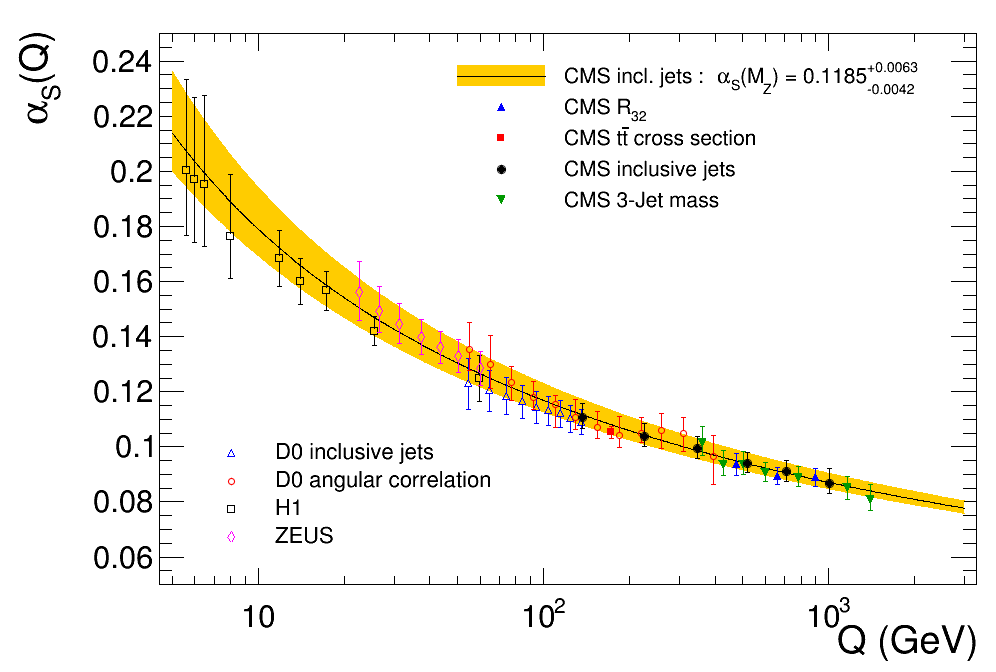
Figure 7:
Comparison of the $ {\alpha _\mathrm {S}(Q)} $ evolution as determined in this analysis from all measurement bins with $ {m_3} > $ 664 GeV (red curve with yellow uncertainty band) to the world average (dashed curve with dark grey uncertainty band) [60]. The error bars on the data points correspond to the total uncertainty. In addition, an overview of measurements of the running of the strong coupling $ {\alpha _\mathrm {S}(Q)} $ from electron-positron [65-67] electron-proton [69-72], and proton--(anti)proton collider experiments [11, 61, 62, 68] is presented. The results of this analysis extend the covered range in values of the scale $Q$ up to ${\approx }$1.4 TeV. |
| Tables | |
png pdf |
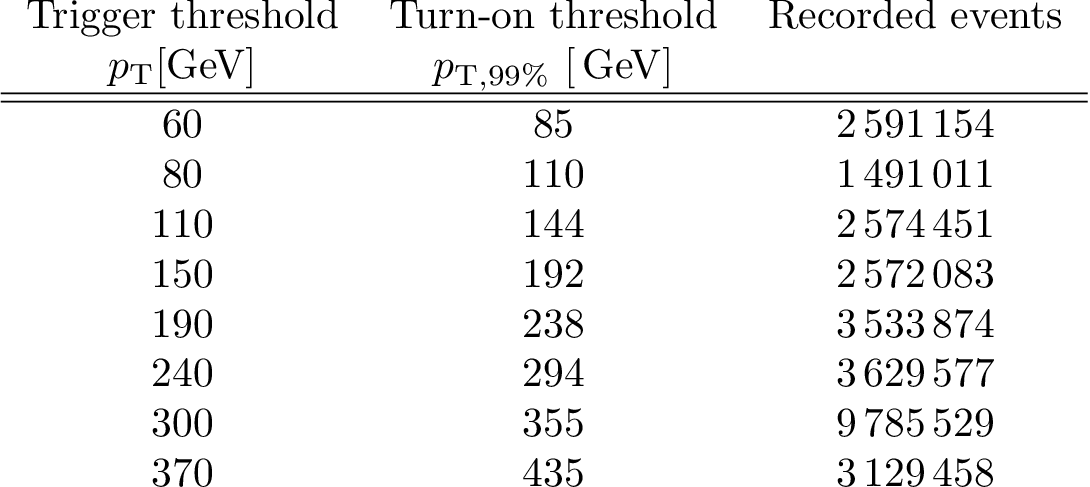
Table 1:
Trigger and turn-on thresholds in leading jet , and the number of events recorded via the single-jet trigger paths used for this measurement. |

png pdf |
Table 2:
The PDF sets used in comparisons to the data together with the evolution order (Evol.), the corresponding number of active flavours, $N_f$, the assumed masses $m_{\mathrm{t}}$ and $m_{\mathrm{Z}}$ of the top quark and the Z boson, respectively, the default values of $\alpha_S(m_{\mathrm{Z}})$, and the range in $\alpha_S(m_{\mathrm{Z}})$ variation available for fits. For CT10 the updated versions of 2012 are taken. |

png pdf |
Table 3:
Determinations of $\alpha_S(m_{\mathrm{Z}})$ in the considered ranges. The relevant scale in each 3-jet mass range is calculated from the cross section-weighted average as given by the theory prediction using the CT10 PDF set with NLO evolution. The three bottom rows present fits using the whole 3-jet mass range above 664 GeV in both rapidity regions either separately or combined (last row). Uncertainties are quoted separately for experimental sources, the PDFs, the NP corrections, and the scale uncertainty. |
png pdf |
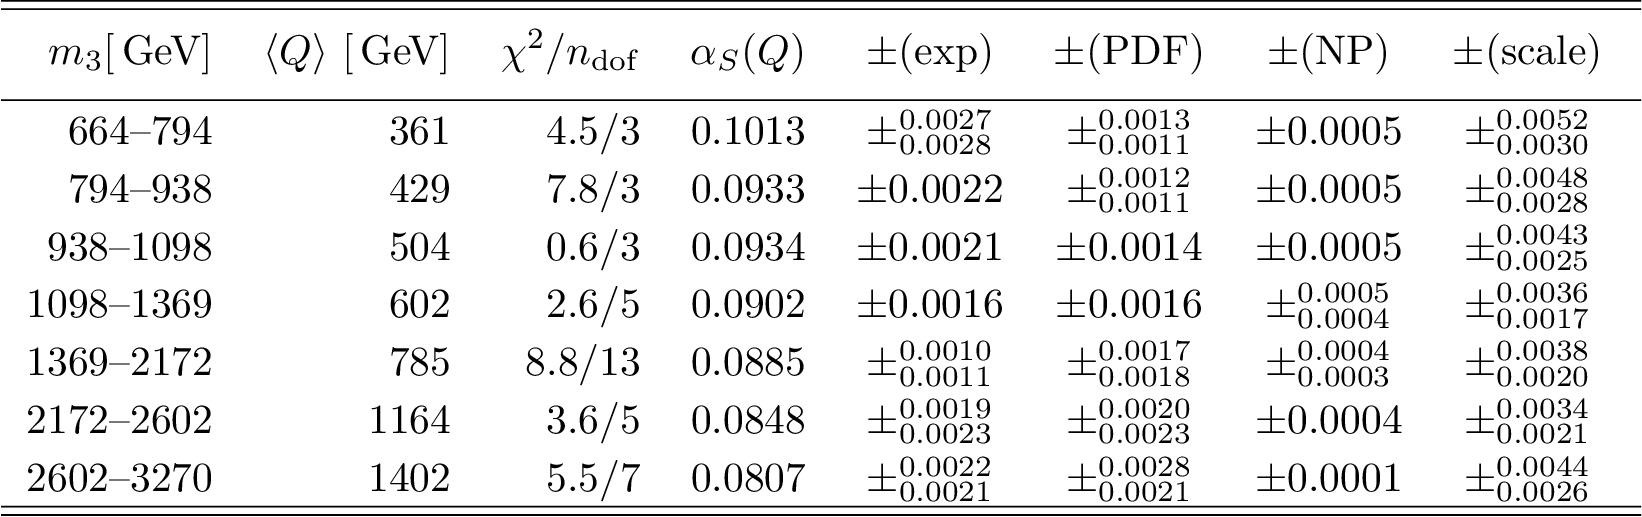
Table 4:
Determinations of $\alpha_S(Q)$ in the considered $m_3$ ranges. The relevant scale in each 3-jet mass range is calculated from the cross section-weighted average as given by the theory prediction using the CT10 PDF set with NLO evolution. The three bottom rows present fits using the whole 3-jet mass range above 664 GeV in both rapidity regions either separately or combined (last row). Uncertainties are quoted separately for experimental sources, the PDFs, the NP corrections, and the scale uncertainty. |
png pdf |
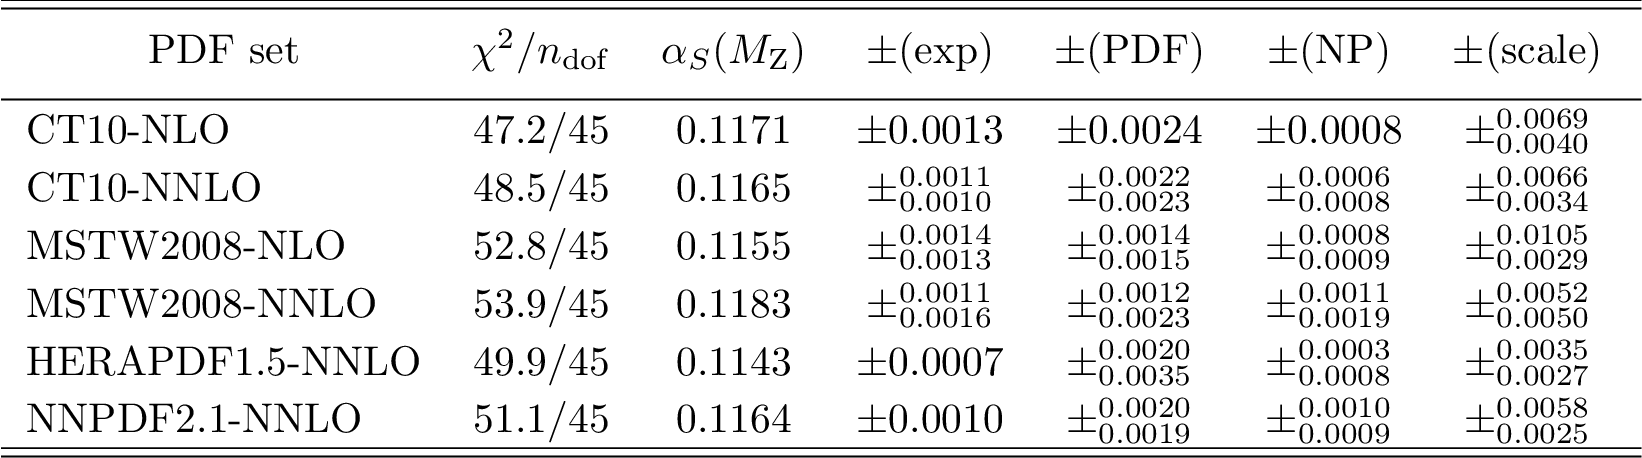
Table 5:
Determinations of $\alpha_S(m_{\mathrm{Z}})$ with different PDF sets using all 3-jet mass points with $m_3 >$ 664 GeV. Uncertainties are quoted separately for experimental sources, the PDFs, the NP corrections, and the scale uncertainty. |
| Additional Figures | |
png pdf |
Additional Figure 1:
Comparison of the $ \alpha _S(Q)$ evolution as determined from the inclusive jet analysis (solid curve with yellow uncertainty band) to measurements of the running of the strong coupling from electron-proton, and proton--(anti)proton collider experiments is presented. The results of this analysis extend the covered range in values of the scale $Q$ up to $\sim$ 1.4 TeV. |
|
|
Compact Muon Solenoid LHC, CERN |
|

|

|

|

|

|