

Compact Muon Solenoid
LHC, CERN
| CMS-SMP-13-005 ; CERN-PH-EP-2014-080 | ||
| Measurement of the $\mathrm{ p }\mathrm{ p } \to \mathrm{ Z }\mathrm{ Z }$ production cross section and constraints on anomalous triple gauge couplings in four-lepton final states at $ \sqrt{s} = $ 8 TeV | ||
| CMS Collaboration | ||
| 1 June 2014 | ||
| Phys. Lett. B 740 (2015) 250 [Corrigendum] | ||
|
Abstract:
A measurement of the inclusive $\mathrm{ Z }\mathrm{ Z }$ production cross section and constraints on anomalous triple gauge couplings in proton-proton collisions at $ \sqrt{s} = $ 8 TeV are presented. The analysis is based on a data sample, corresponding to an integrated luminosity of 19.6 fb$^{-1}$, collected with the CMS experiment at the LHC. The measurements are performed in the leptonic decay modes $\mathrm{ Z }\mathrm{ Z } \to \ell\ell\ell'\ell'$, where $\ell = \mathrm{ e }$, $\mu$ and $\ell' = \mathrm{ e }$, $\mu$, $\tau$. The measured total cross section $\sigma ( \mathrm{ p }\mathrm{ p } \to \mathrm{ Z }\mathrm{ Z }) = $ 7.7 $\pm$ 0.5 (stat) $^{+0.5} _{-0.4}$ (syst) $\pm$ 0.4 (theo) $\pm$ 0.2 (lumi) pb, for both Z bosons produced in the mass range 60 $< m_{\mathrm{ Z }} <$ 120 GeV, is consistent with standard model predictions. Differential cross sections are measured and well described by the theoretical predictions. The invariant mass distribution of the four-lepton system is used to set limits on anomalous $\mathrm{ Z }\mathrm{ Z }\mathrm{ Z }$ and $\mathrm{ Z }\mathrm{ Z }\gamma$ couplings at the 95% confidence level: $-0.004 | ||
| Links: e-print arXiv:1406.0113 [hep-ex] (PDF) ; CDS record ; inSPIRE record ; Public twiki page ; HepData record ; CADI line (restricted) ; | ||
| Figures | |
png pdf |
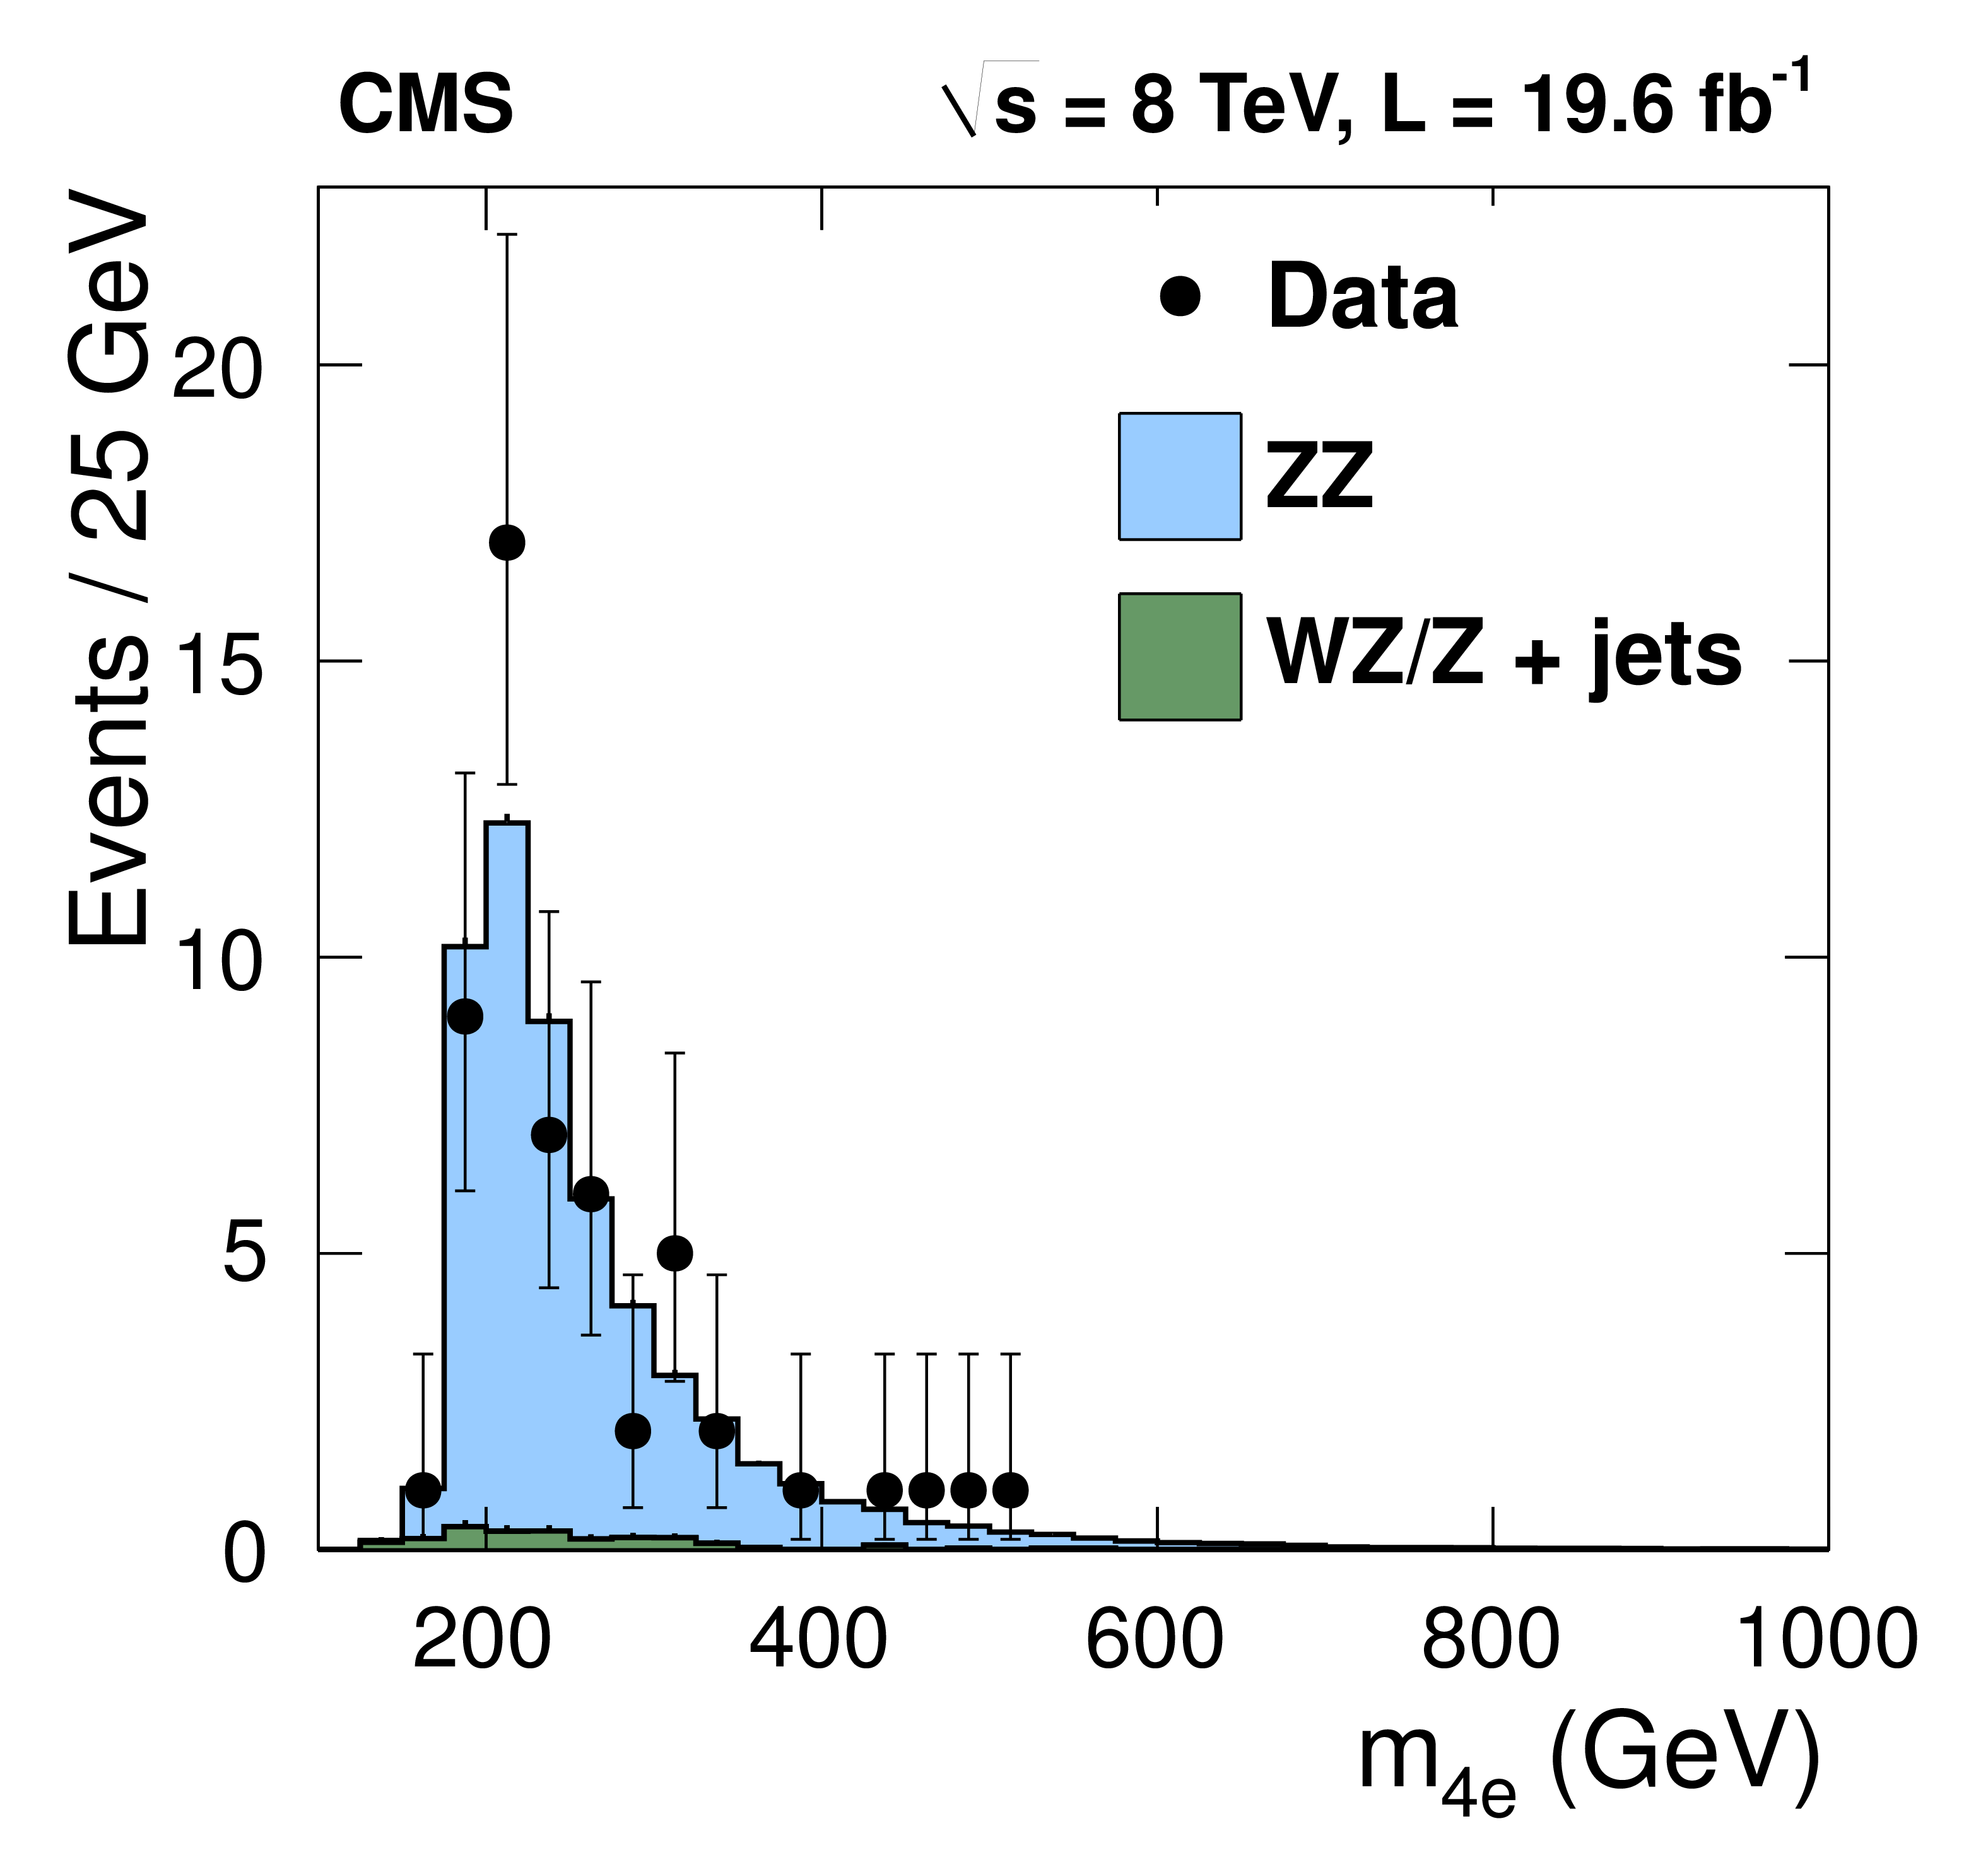
Figure 1-a:
Distribution of the reconstructed four-lepton mass for the (a) $4\mathrm{ e } $, (b) $4\mu $, (c) $2\mathrm{ e } 2\mu $, and (d) combined $ {\ell \ell \tau \tau }$ decay channels. The data sample corresponds to an integrated luminosity of 19.6 fb$-1$. Points represent the data, the shaded histograms labeled $\mathrm{ Z } \mathrm{ Z } $ represent the POWHEG+GG2ZZ+PYTHIA predictions for $\mathrm{ Z } \mathrm{ Z } $ signal, the histograms labeled $\mathrm{ W } \mathrm{ Z } /\mathrm{ Z } $+jets show the background, which is estimated from data, as described in the text. |
png pdf |
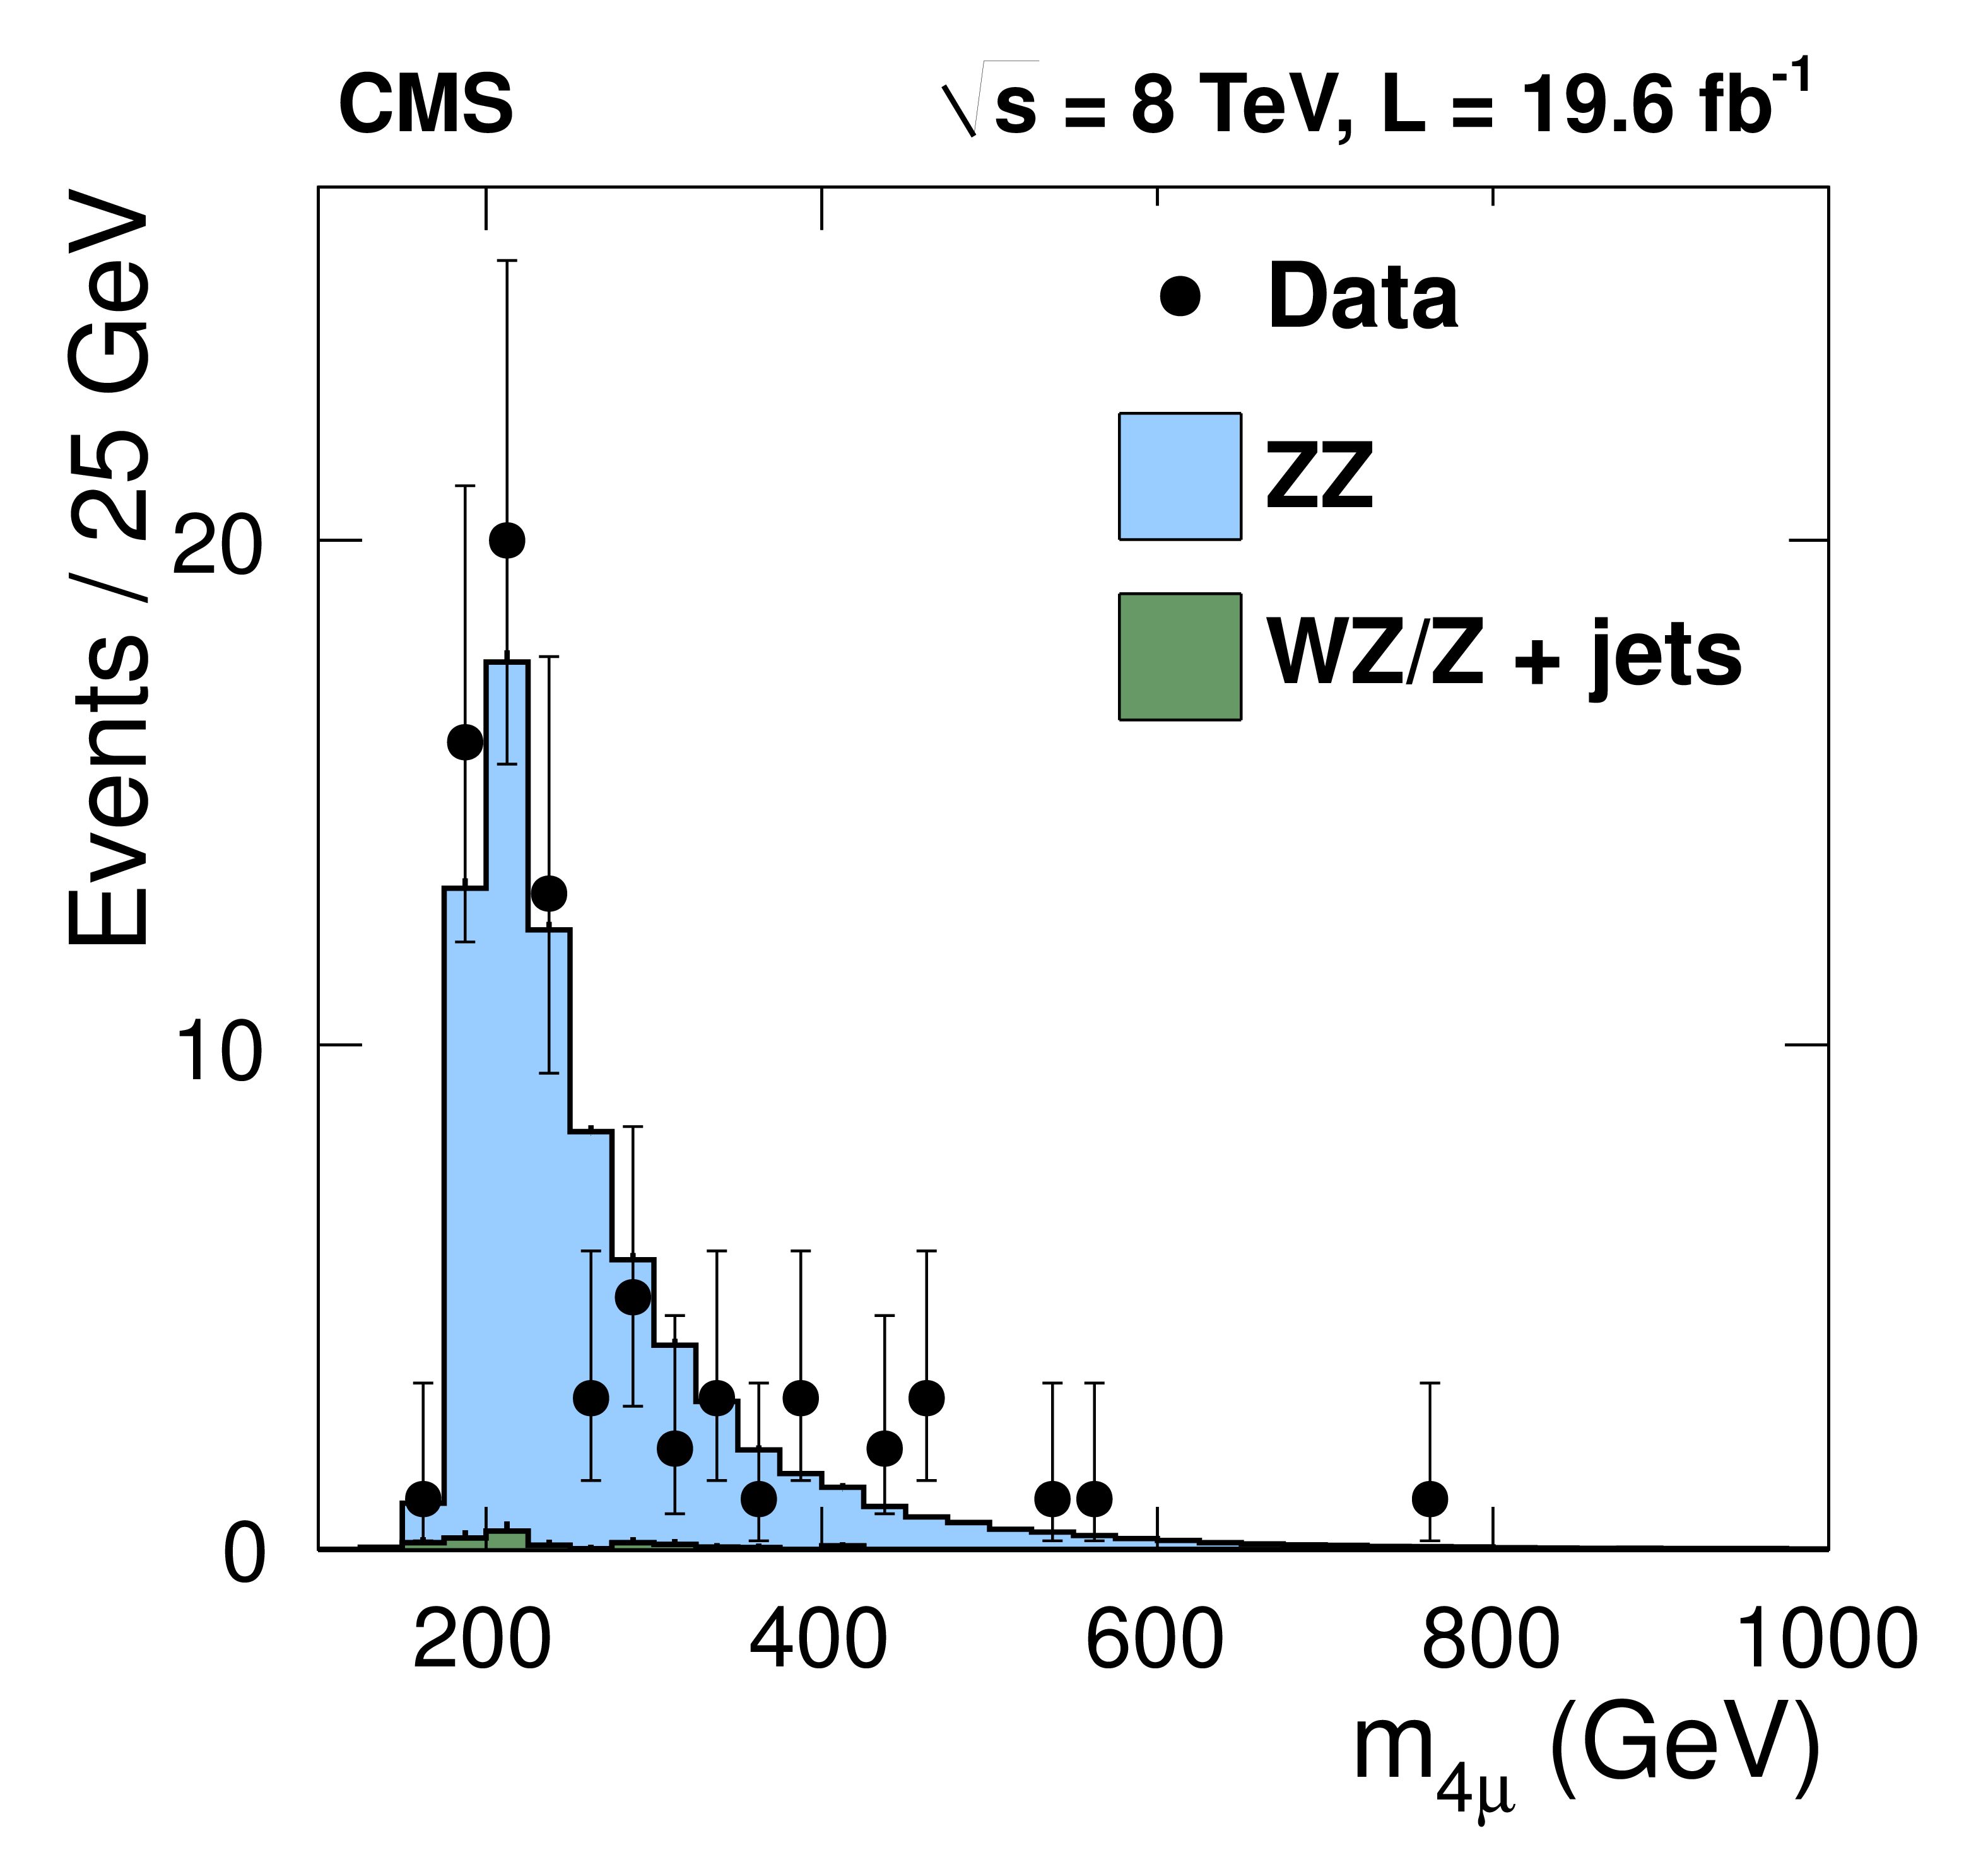
Figure 1-b:
Distribution of the reconstructed four-lepton mass for the (a) $4\mathrm{ e } $, (b) $4\mu $, (c) $2\mathrm{ e } 2\mu $, and (d) combined $ {\ell \ell \tau \tau }$ decay channels. The data sample corresponds to an integrated luminosity of 19.6 fb$-1$. Points represent the data, the shaded histograms labeled $\mathrm{ Z } \mathrm{ Z } $ represent the POWHEG+GG2ZZ+PYTHIA predictions for $\mathrm{ Z } \mathrm{ Z } $ signal, the histograms labeled $\mathrm{ W } \mathrm{ Z } /\mathrm{ Z } $+jets show the background, which is estimated from data, as described in the text. |
png pdf |
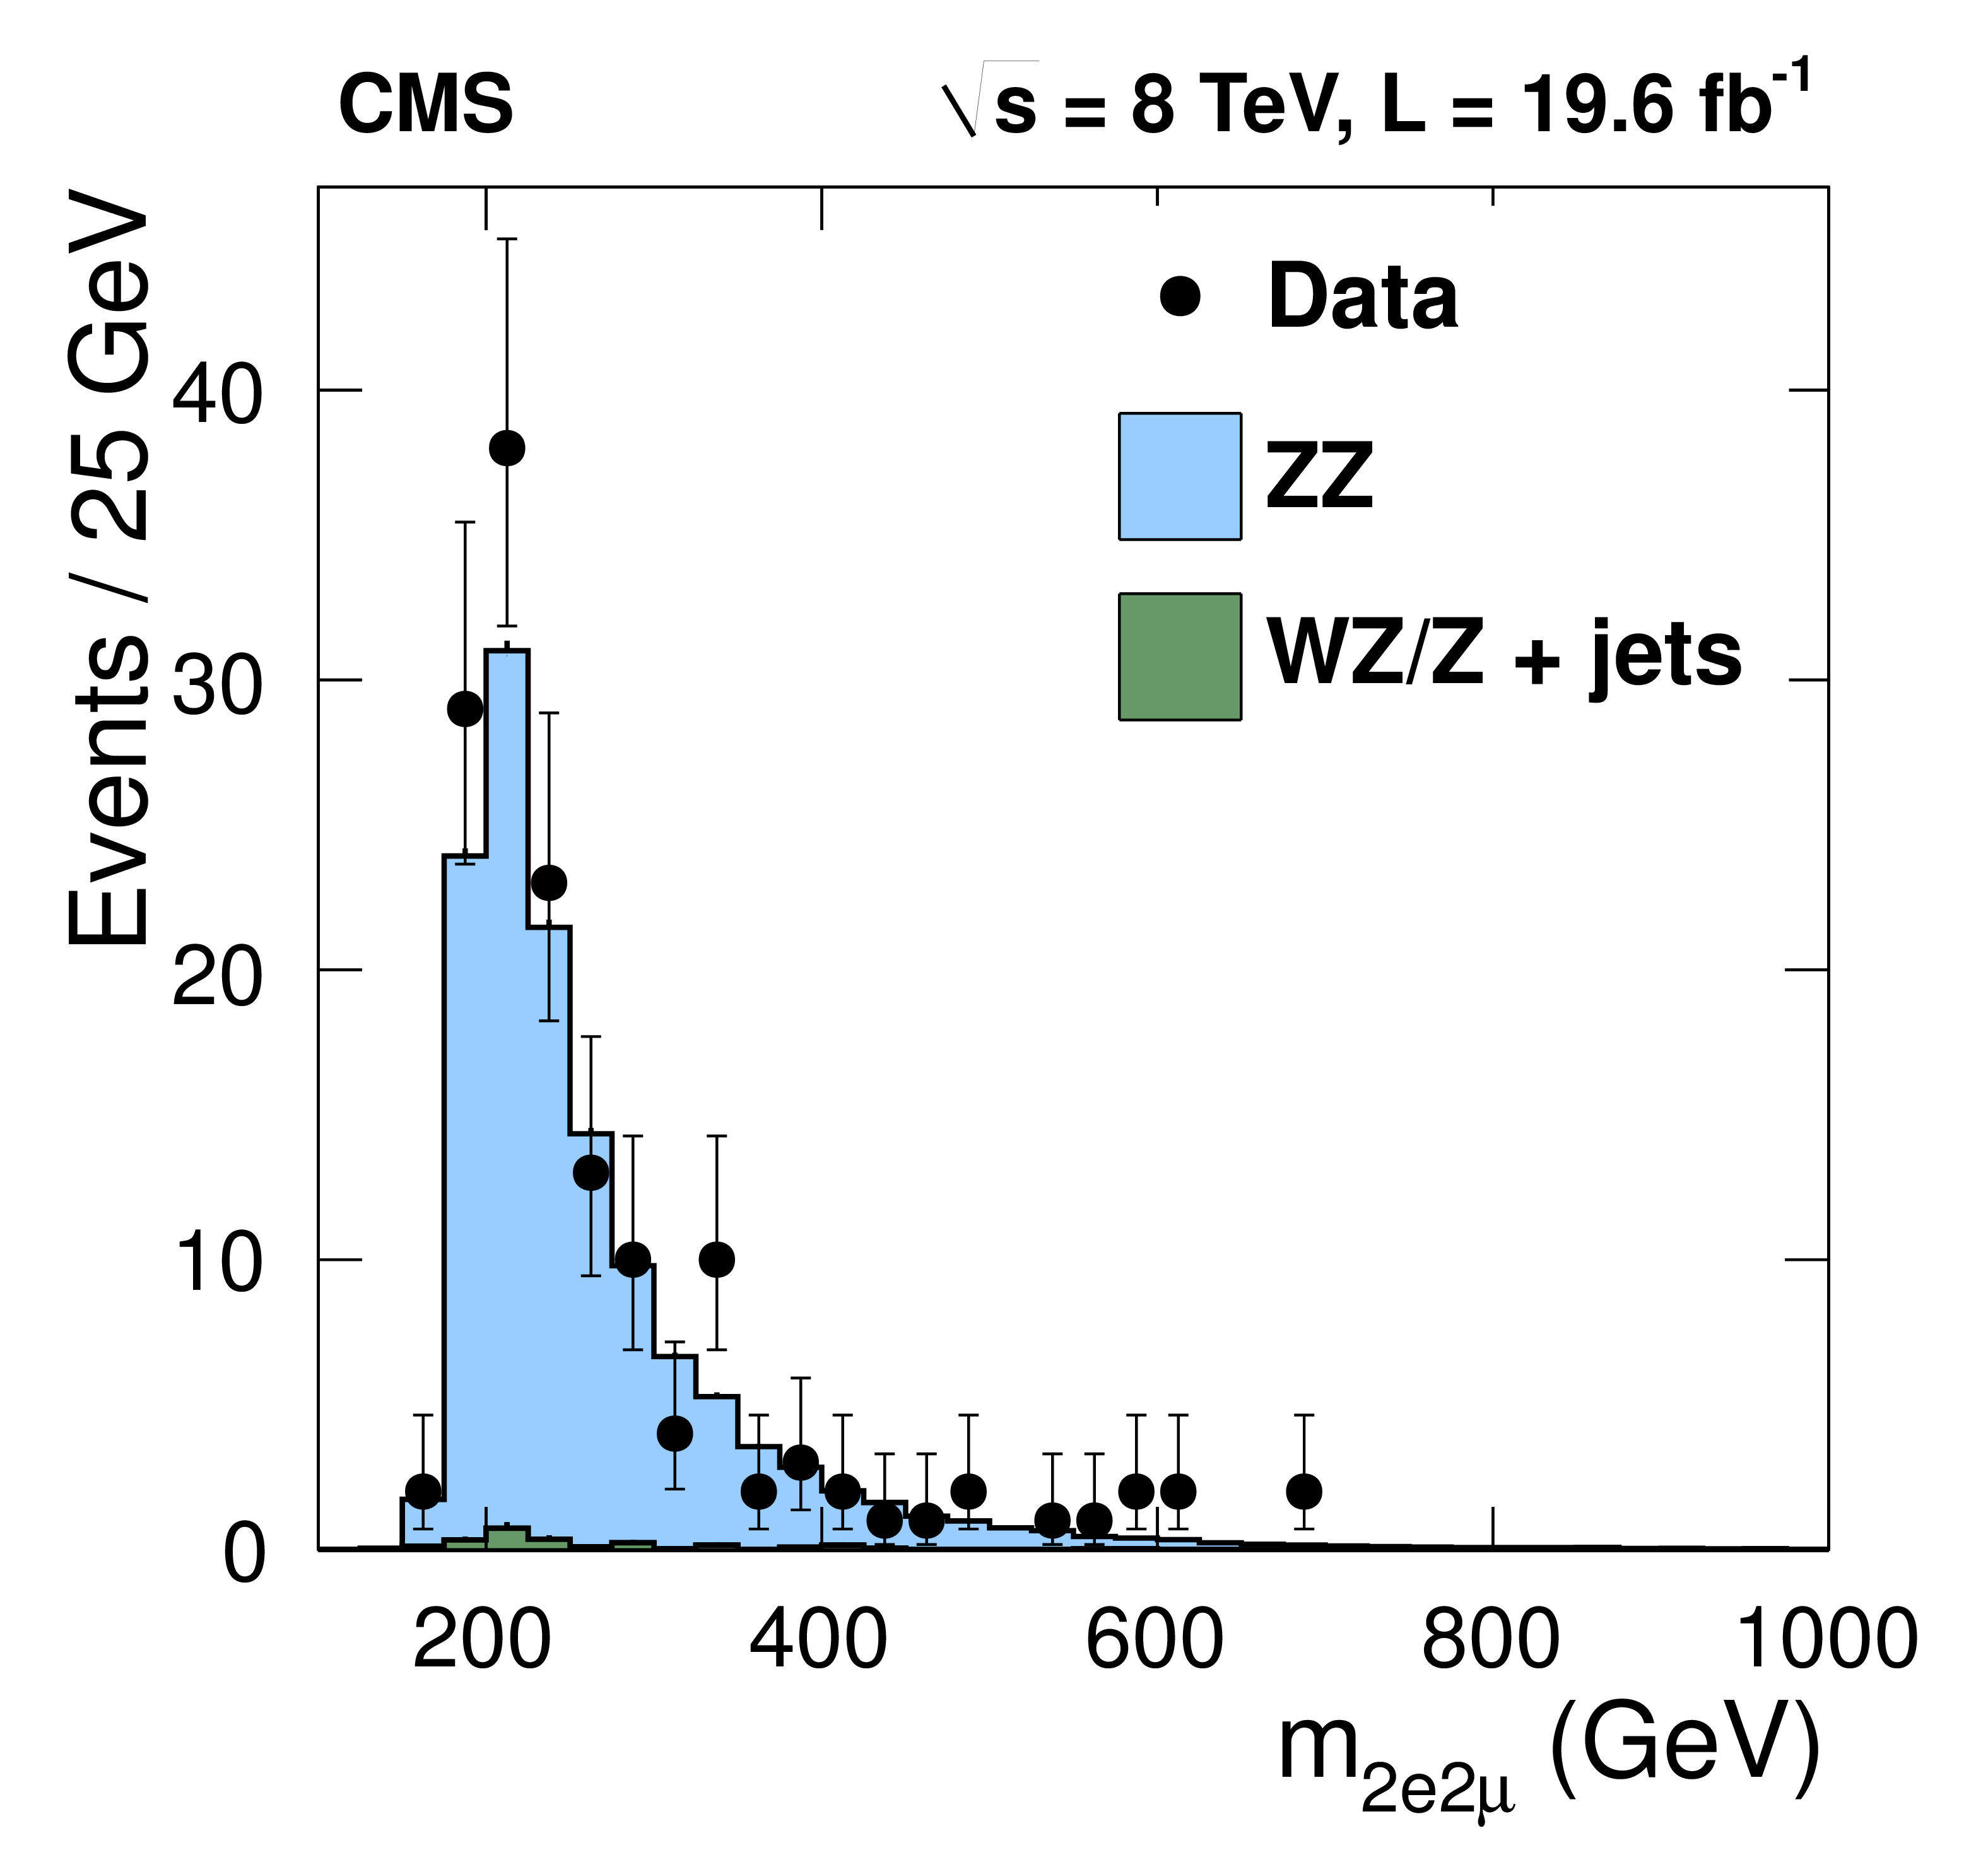
Figure 1-c:
Distribution of the reconstructed four-lepton mass for the (a) $4\mathrm{ e } $, (b) $4\mu $, (c) $2\mathrm{ e } 2\mu $, and (d) combined $ {\ell \ell \tau \tau }$ decay channels. The data sample corresponds to an integrated luminosity of 19.6 fb$-1$. Points represent the data, the shaded histograms labeled $\mathrm{ Z } \mathrm{ Z } $ represent the POWHEG+GG2ZZ+PYTHIA predictions for $\mathrm{ Z } \mathrm{ Z } $ signal, the histograms labeled $\mathrm{ W } \mathrm{ Z } /\mathrm{ Z } $+jets show the background, which is estimated from data, as described in the text. |
png pdf |
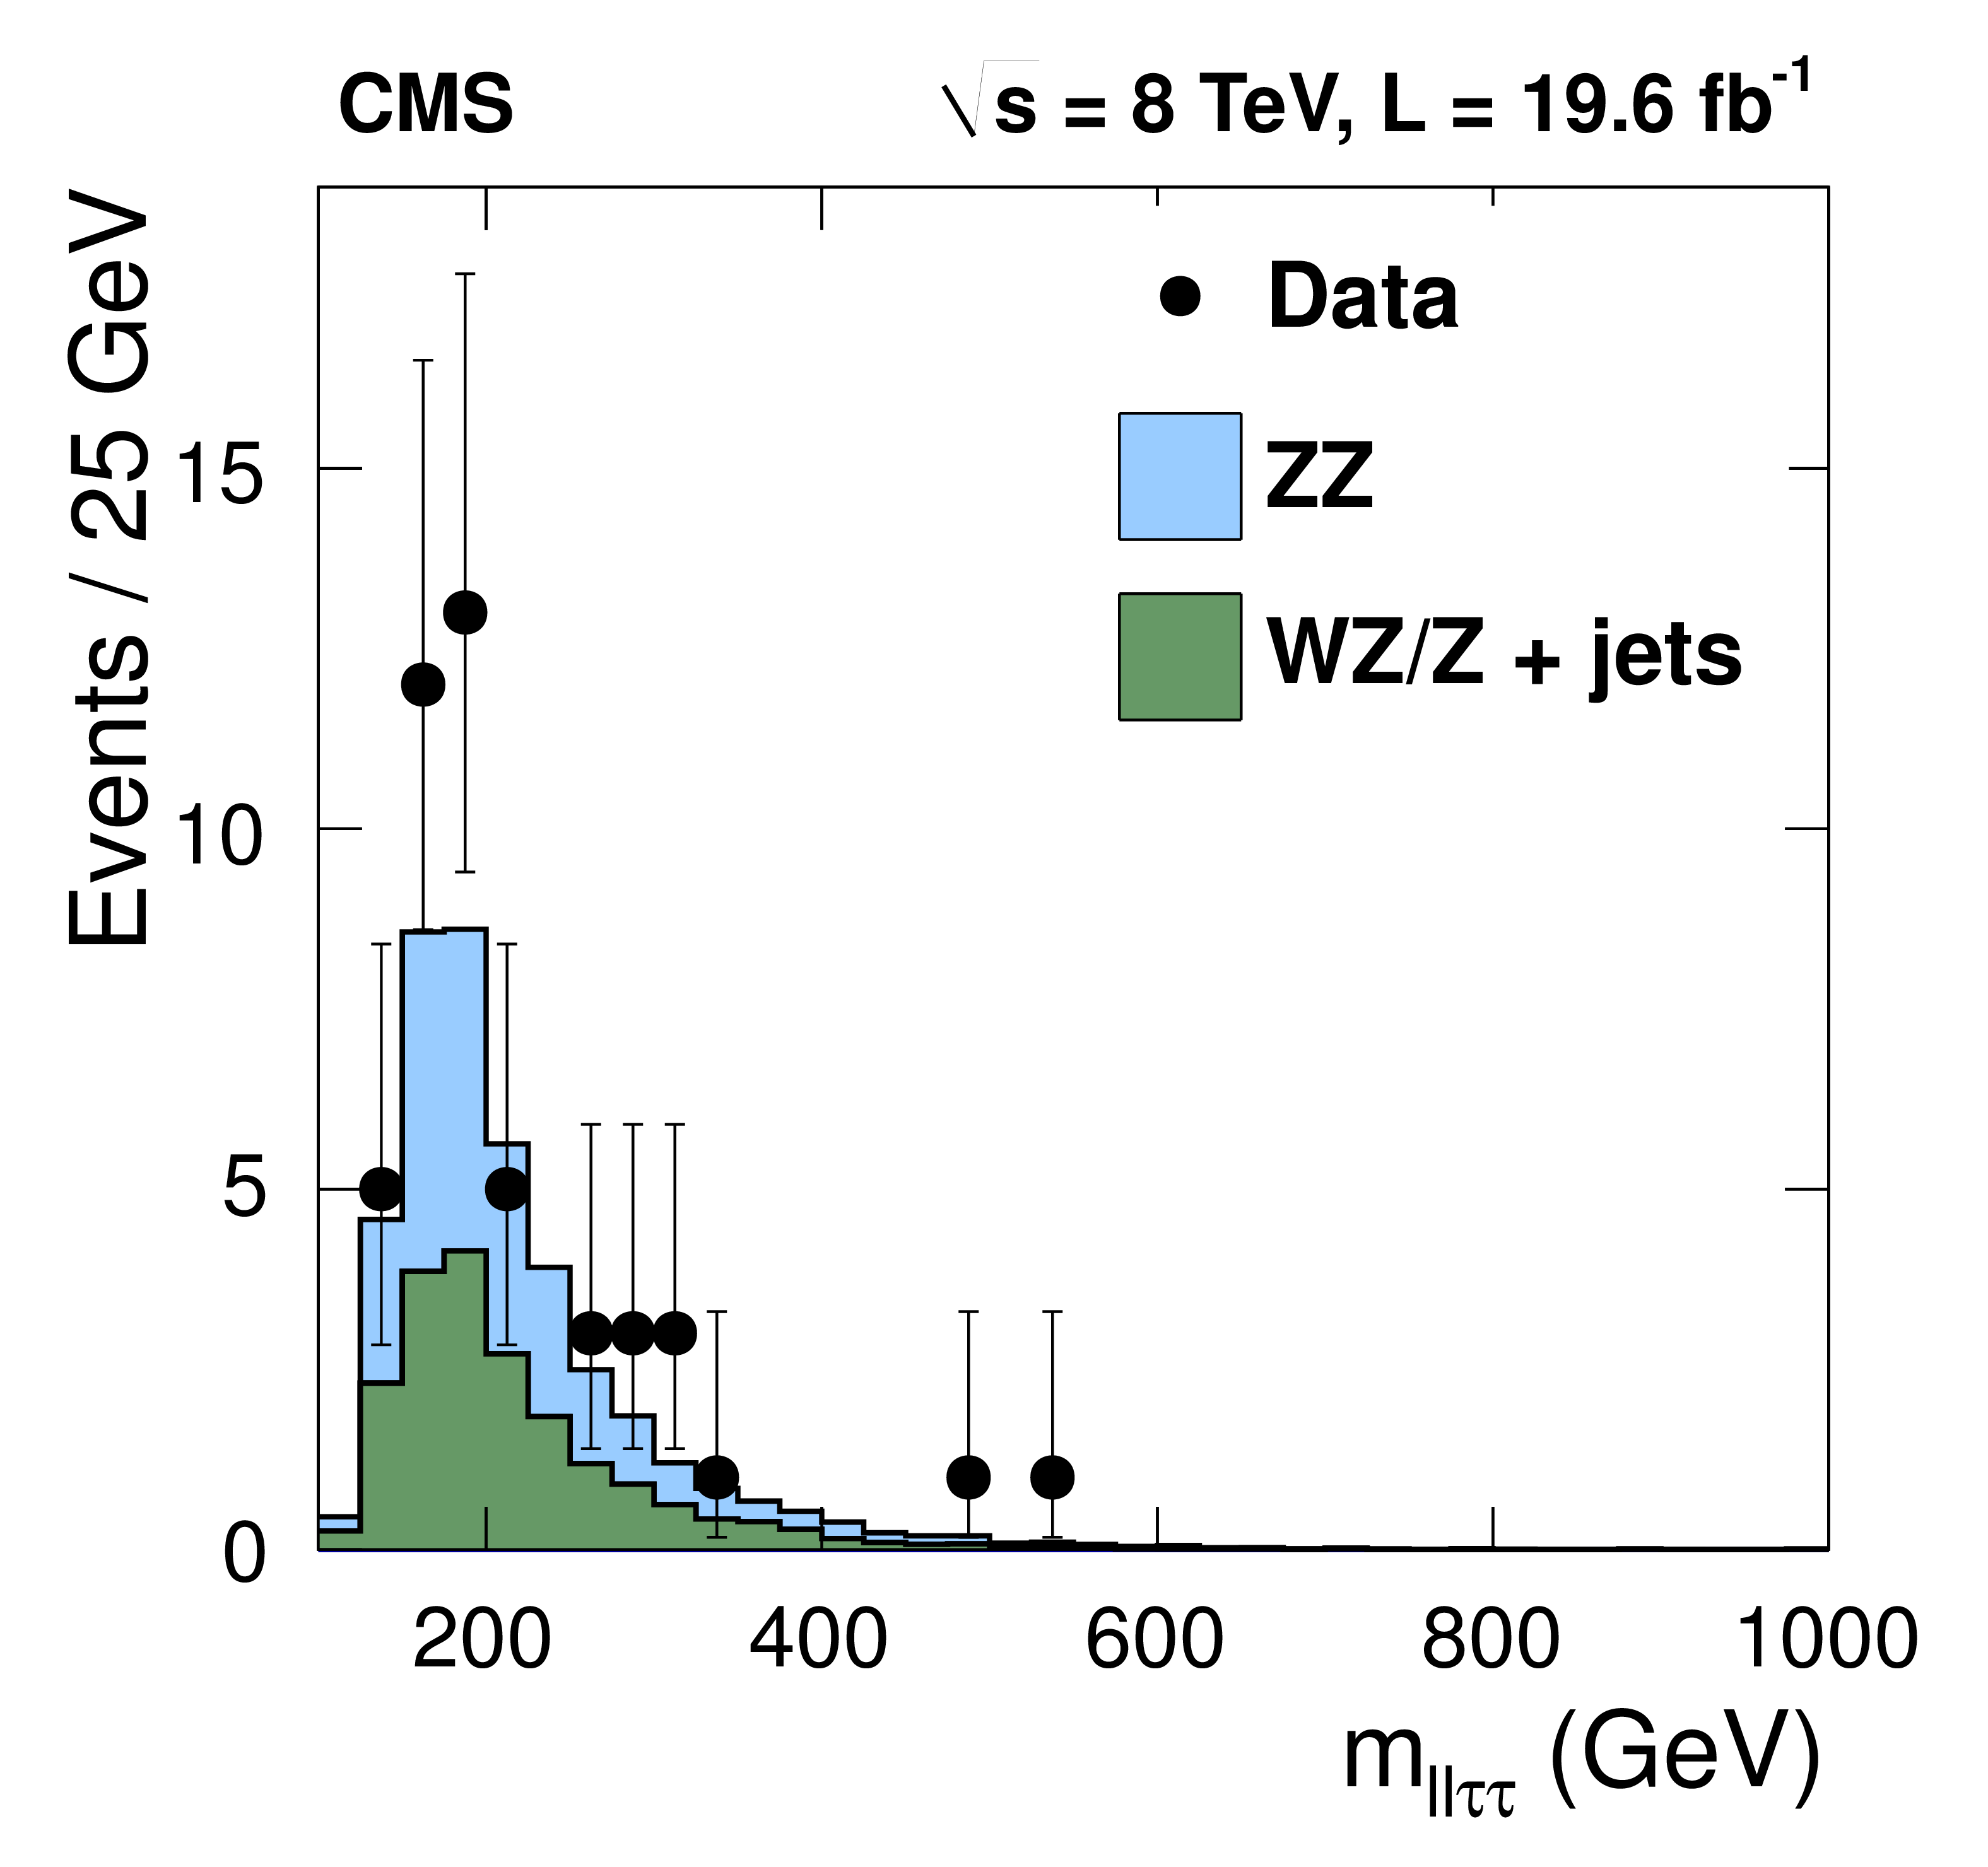
Figure 1-d:
Distribution of the reconstructed four-lepton mass for the (a) $4\mathrm{ e } $, (b) $4\mu $, (c) $2\mathrm{ e } 2\mu $, and (d) combined $ {\ell \ell \tau \tau }$ decay channels. The data sample corresponds to an integrated luminosity of 19.6 fb$-1$. Points represent the data, the shaded histograms labeled $\mathrm{ Z } \mathrm{ Z } $ represent the POWHEG+GG2ZZ+PYTHIA predictions for $\mathrm{ Z } \mathrm{ Z } $ signal, the histograms labeled $\mathrm{ W } \mathrm{ Z } /\mathrm{ Z } $+jets show the background, which is estimated from data, as described in the text. |

png pdf |
Figure 2-a:
(a) Distribution of the reconstructed four-lepton mass for the sum of the $4\mathrm{ e } $, $4\mu $, and $2\mathrm{ e } 2\mu $ decay channels. (b) Reconstructed $\mathrm{ Z } _1$ mass. The correlation between the reconstructed $\mathrm{ Z } _1$ and $\mathrm{ Z } _2$ masses for the (c) combined $4\mathrm{ e } $, $4\mu $, and $2\mathrm{ e } 2\mu $ final states and (d) for $ {\ell \ell \tau \tau }$ final states. Points represent the data, the shaded histograms labeled $\mathrm{ Z } \mathrm{ Z } $ represent the POWHEG+GG2ZZ+PYTHIA predictions for $\mathrm{ Z } \mathrm{ Z } $ signal, the histograms labeled $\mathrm{ W } \mathrm{ Z } /\mathrm{ Z } $+jets show background, which is estimated from data, as described in the text. |

png pdf |
Figure 2-b:
(a) Distribution of the reconstructed four-lepton mass for the sum of the $4\mathrm{ e } $, $4\mu $, and $2\mathrm{ e } 2\mu $ decay channels. (b) Reconstructed $\mathrm{ Z } _1$ mass. The correlation between the reconstructed $\mathrm{ Z } _1$ and $\mathrm{ Z } _2$ masses for the (c) combined $4\mathrm{ e } $, $4\mu $, and $2\mathrm{ e } 2\mu $ final states and (d) for $ {\ell \ell \tau \tau }$ final states. Points represent the data, the shaded histograms labeled $\mathrm{ Z } \mathrm{ Z } $ represent the POWHEG+GG2ZZ+PYTHIA predictions for $\mathrm{ Z } \mathrm{ Z } $ signal, the histograms labeled $\mathrm{ W } \mathrm{ Z } /\mathrm{ Z } $+jets show background, which is estimated from data, as described in the text. |

png pdf |
Figure 2-c:
(a) Distribution of the reconstructed four-lepton mass for the sum of the $4\mathrm{ e } $, $4\mu $, and $2\mathrm{ e } 2\mu $ decay channels. (b) Reconstructed $\mathrm{ Z } _1$ mass. The correlation between the reconstructed $\mathrm{ Z } _1$ and $\mathrm{ Z } _2$ masses for the (c) combined $4\mathrm{ e } $, $4\mu $, and $2\mathrm{ e } 2\mu $ final states and (d) for $ {\ell \ell \tau \tau }$ final states. Points represent the data, the shaded histograms labeled $\mathrm{ Z } \mathrm{ Z } $ represent the POWHEG+GG2ZZ+PYTHIA predictions for $\mathrm{ Z } \mathrm{ Z } $ signal, the histograms labeled $\mathrm{ W } \mathrm{ Z } /\mathrm{ Z } $+jets show background, which is estimated from data, as described in the text. |
png pdf |
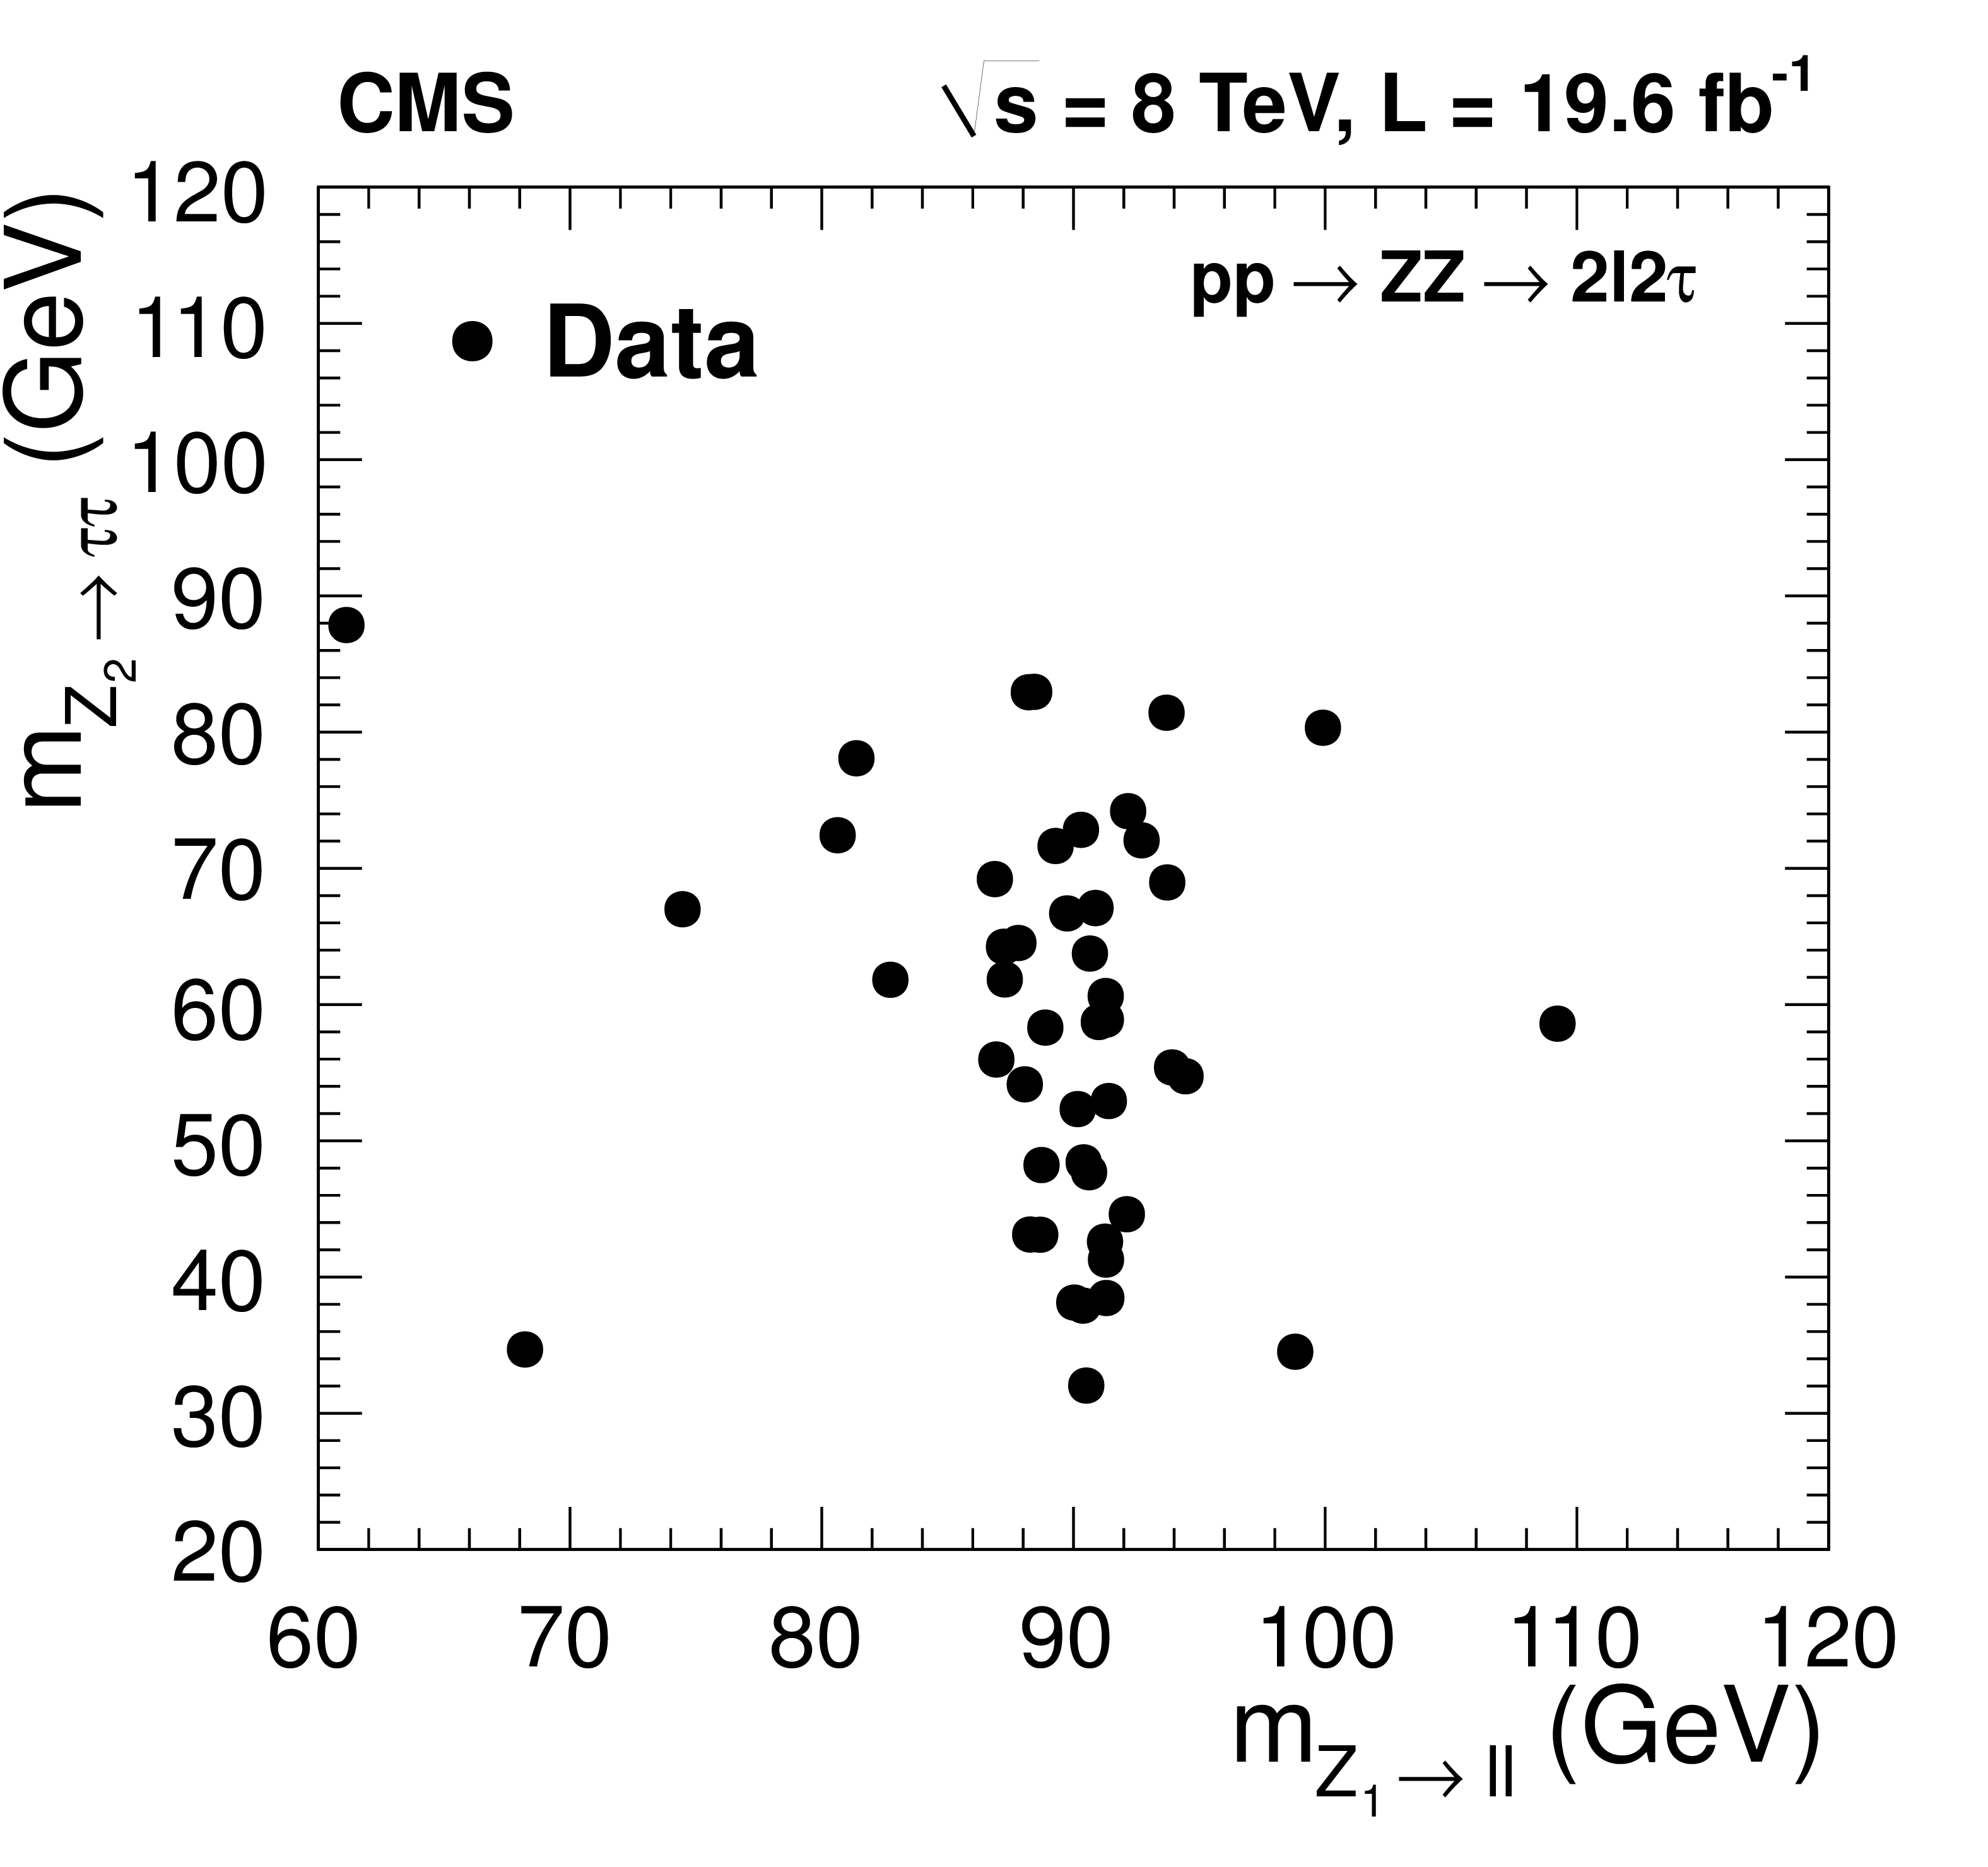
Figure 2-d:
(a) Distribution of the reconstructed four-lepton mass for the sum of the $4\mathrm{ e } $, $4\mu $, and $2\mathrm{ e } 2\mu $ decay channels. (b) Reconstructed $\mathrm{ Z } _1$ mass. The correlation between the reconstructed $\mathrm{ Z } _1$ and $\mathrm{ Z } _2$ masses for the (c) combined $4\mathrm{ e } $, $4\mu $, and $2\mathrm{ e } 2\mu $ final states and (d) for $ {\ell \ell \tau \tau }$ final states. Points represent the data, the shaded histograms labeled $\mathrm{ Z } \mathrm{ Z } $ represent the POWHEG+GG2ZZ+PYTHIA predictions for $\mathrm{ Z } \mathrm{ Z } $ signal, the histograms labeled $\mathrm{ W } \mathrm{ Z } /\mathrm{ Z } $+jets show background, which is estimated from data, as described in the text. |
png pdf |
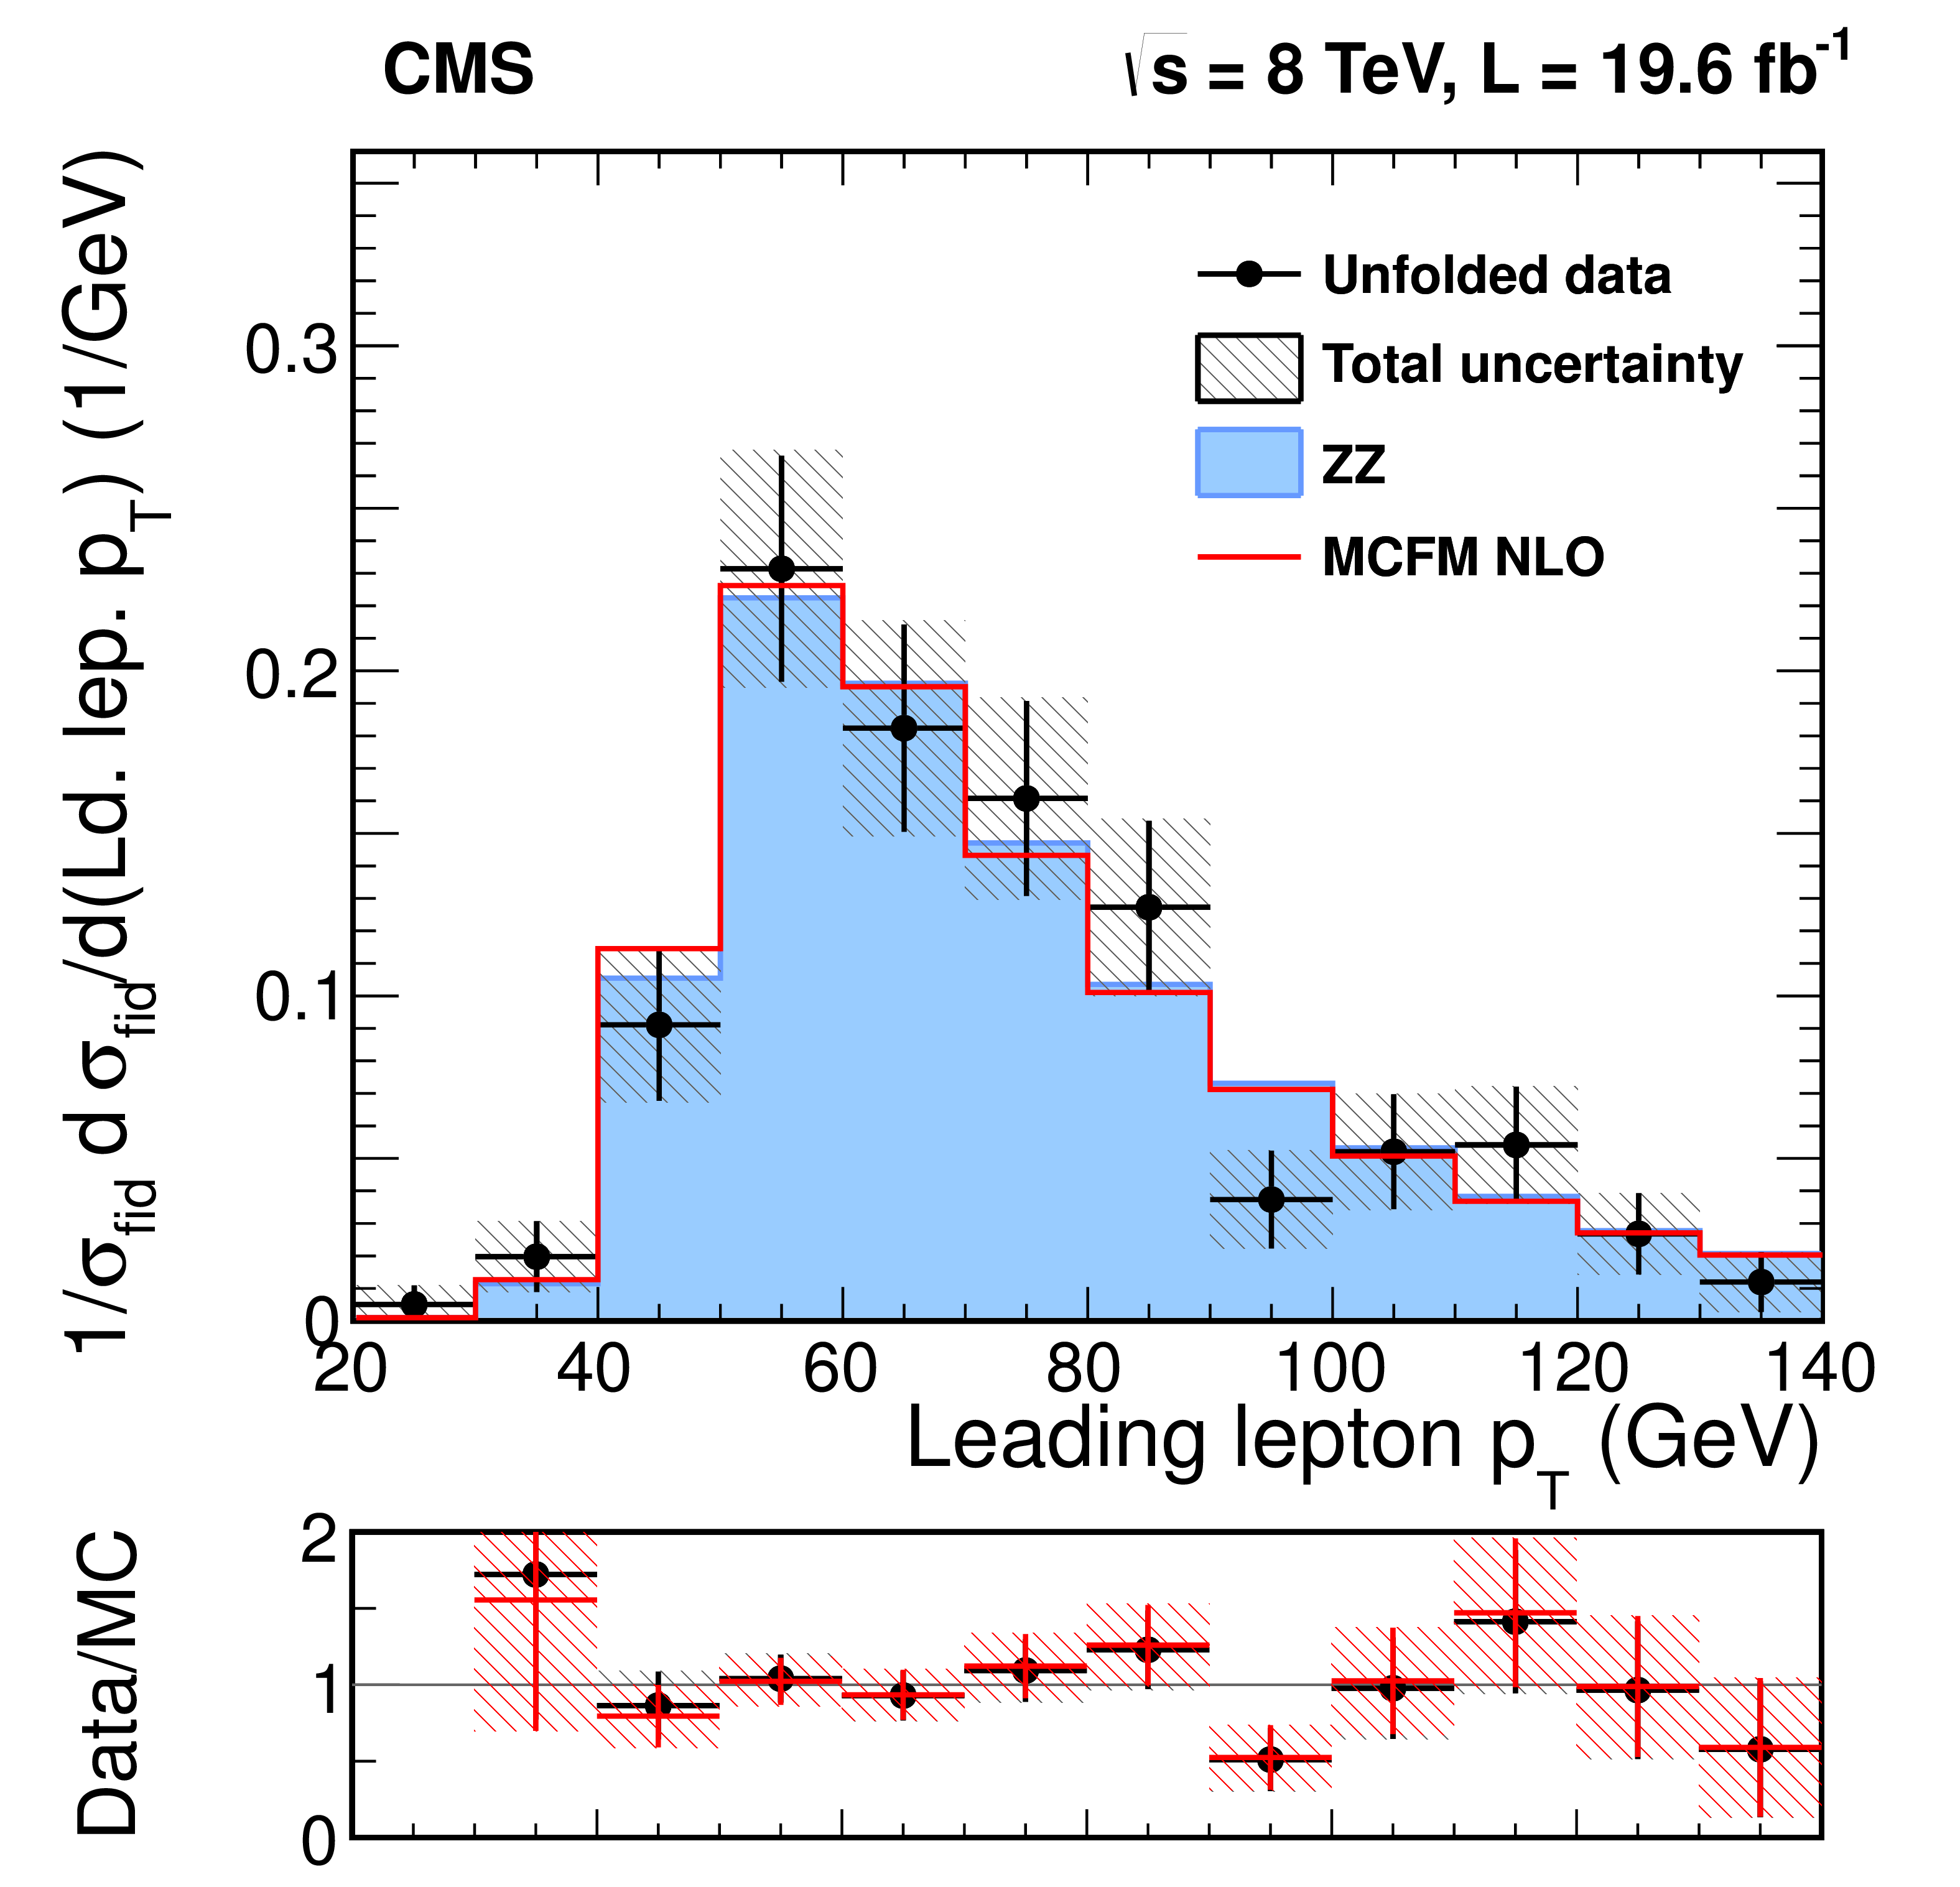
Figure 3-a:
Differential cross sections normalized to the fiducial cross section for the combined $4 \mathrm{ e } $, $4 \mu $, and $2 \mathrm{ e } 2 \mu $ decay channels as a function of $ {p_{\mathrm {T}}} $ for (a) the highest ${p_{\mathrm {T}}}$ lepton in the event, (b) the $\mathrm{ Z } _1$, and (c) the $\mathrm{ Z } \mathrm{ Z } $ system. Figure (d) shows the normalized $ {\mathrm {d}}\sigma / {\mathrm {d}}{m_{\mathrm{ Z } \mathrm{ Z } }}$ distribution. Points represent the data, and the shaded histograms labeled $\mathrm{ Z } \mathrm{ Z } $ represent the POWHEG+GG2ZZ+PYTHIA predictions for $\mathrm{ Z } \mathrm{ Z } $ signal, while the solid curves correspond to results of the MCFM calculations. The bottom part of each subfigure represents the ratio of the measured cross section to the expected one from POWHEG+GG2ZZ+PYTHIA (black crosses with solid symbols) and MCFM (red crosses). The shaded areas on all the plots represent the full uncertainties calculated as the quadrature sum of the statistical and systematic uncertainties, whereas the crosses represent the statistical uncertainties only.-a |
png pdf |
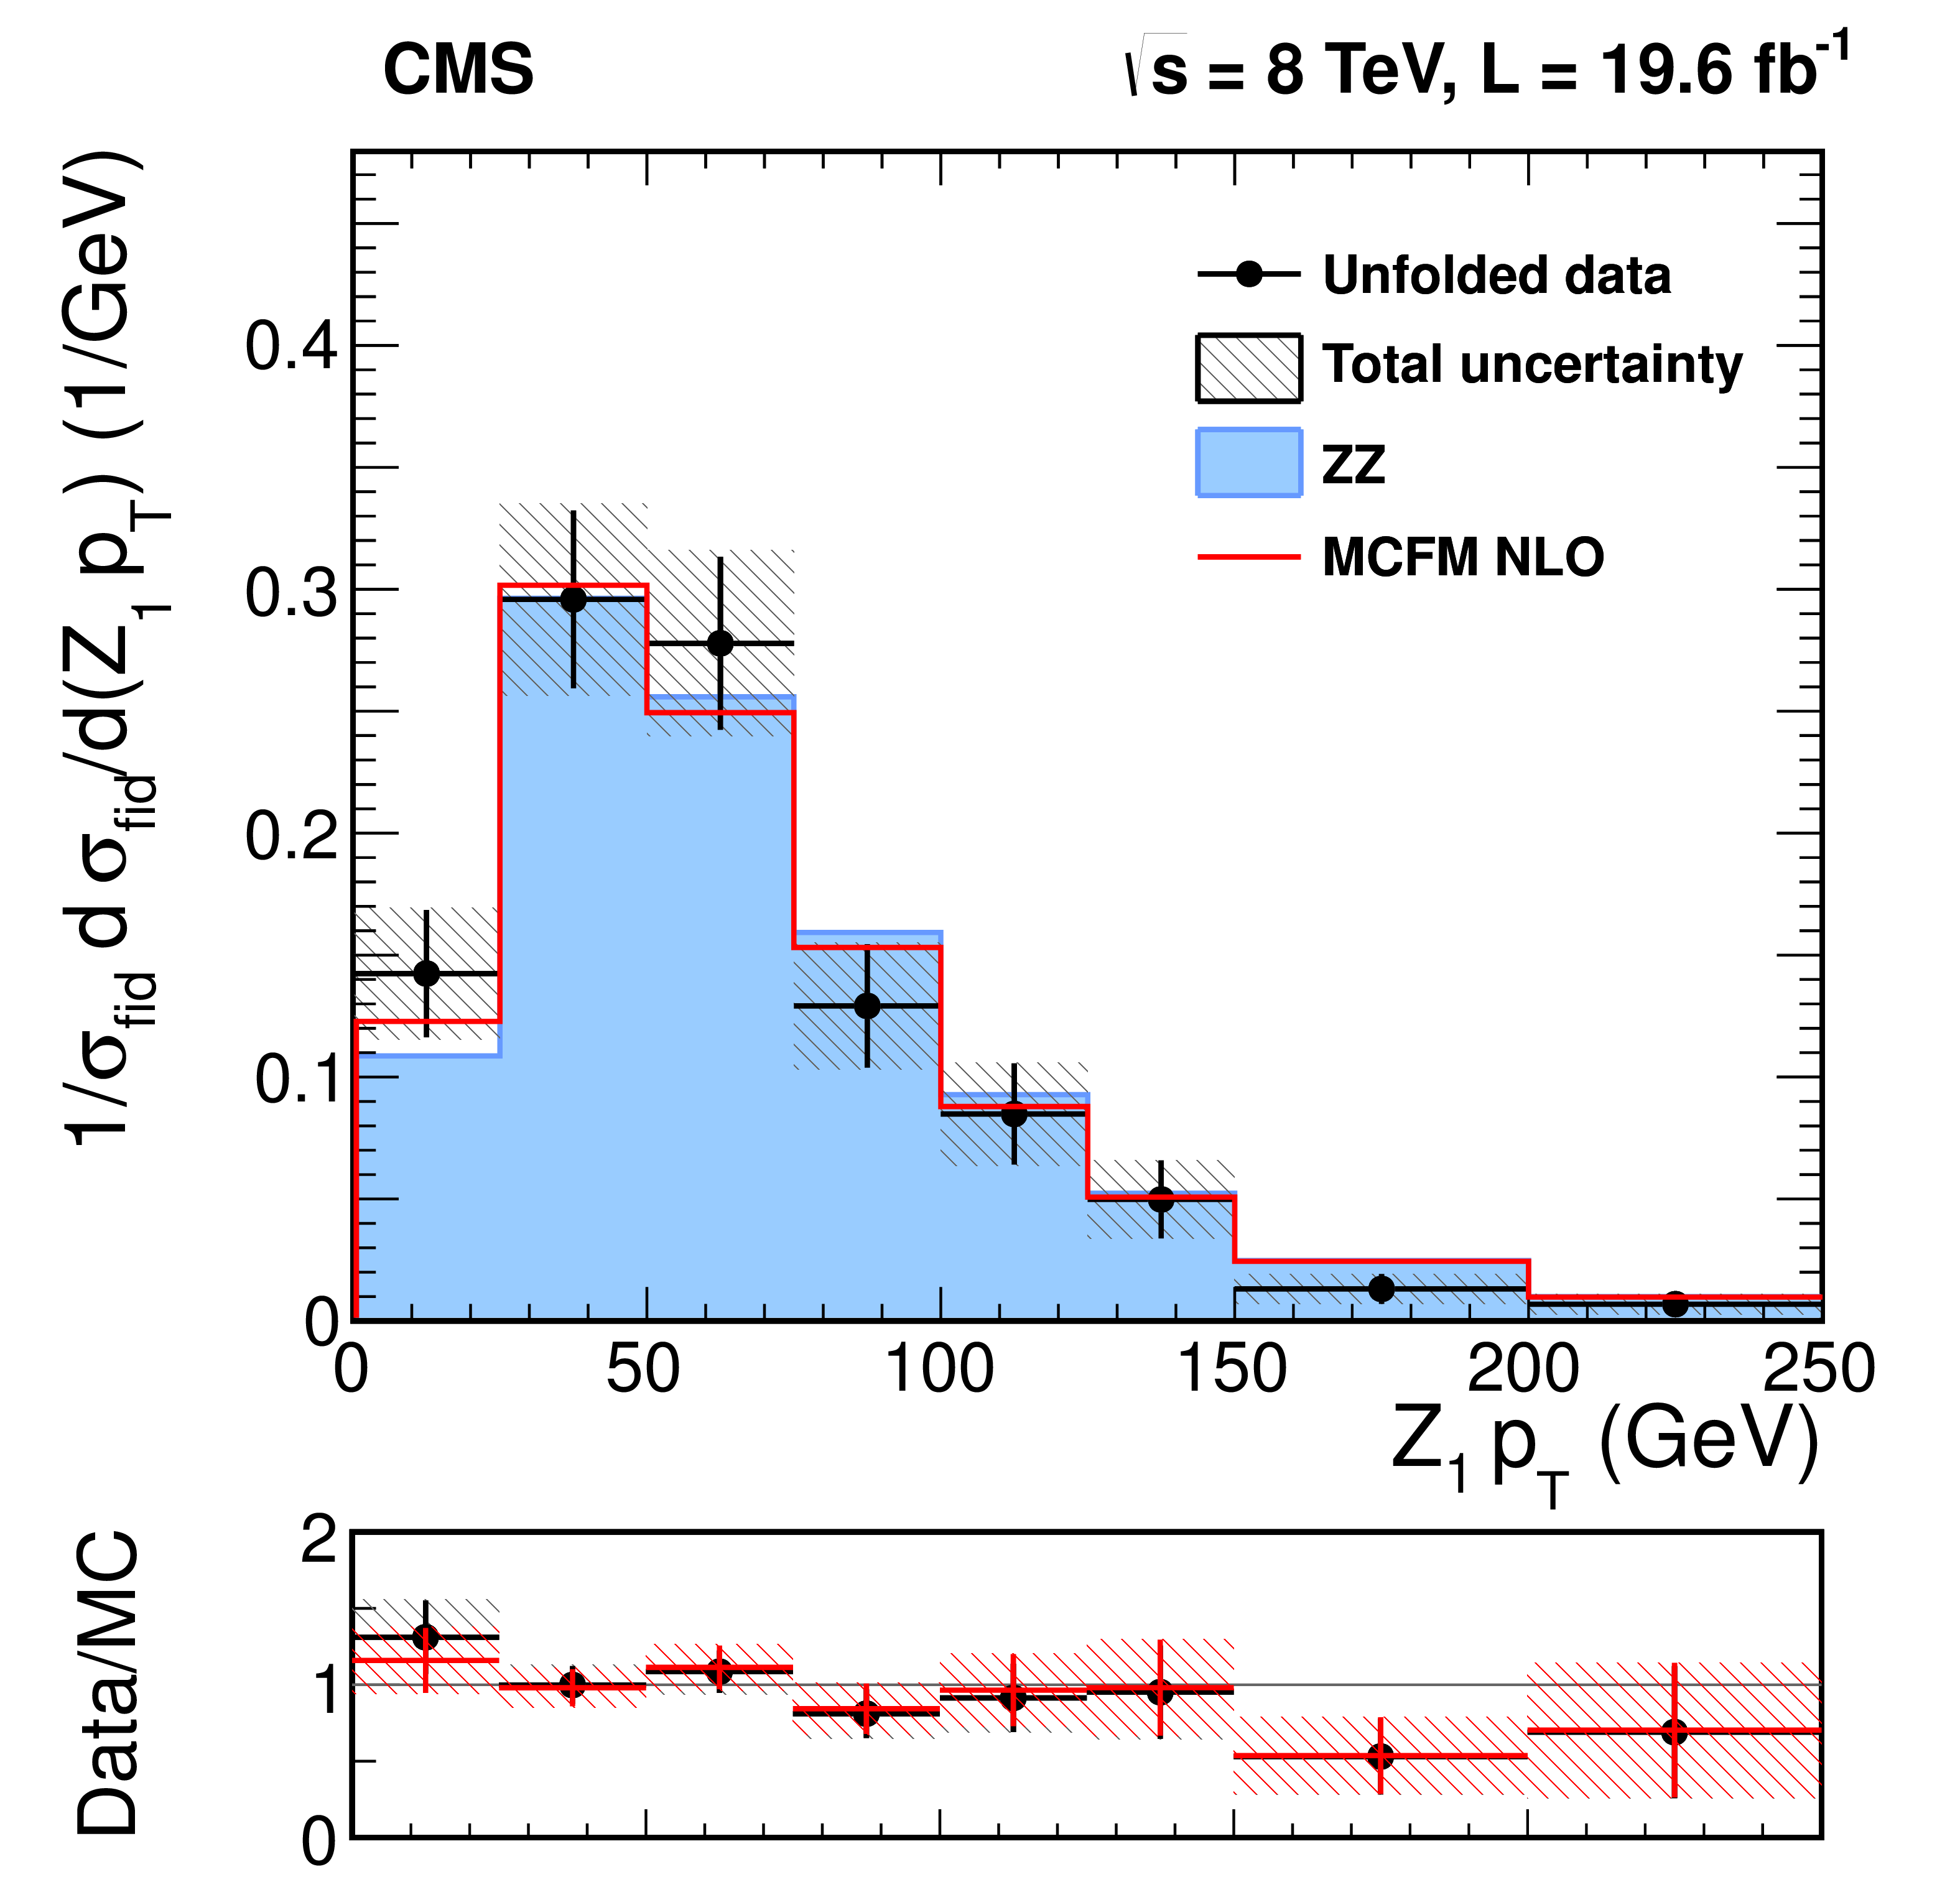
Figure 3-b:
Differential cross sections normalized to the fiducial cross section for the combined $4 \mathrm{ e } $, $4 \mu $, and $2 \mathrm{ e } 2 \mu $ decay channels as a function of $ {p_{\mathrm {T}}} $ for (a) the highest ${p_{\mathrm {T}}}$ lepton in the event, (b) the $\mathrm{ Z } _1$, and (c) the $\mathrm{ Z } \mathrm{ Z } $ system. Figure (d) shows the normalized $ {\mathrm {d}}\sigma / {\mathrm {d}}{m_{\mathrm{ Z } \mathrm{ Z } }}$ distribution. Points represent the data, and the shaded histograms labeled $\mathrm{ Z } \mathrm{ Z } $ represent the POWHEG+GG2ZZ+PYTHIA predictions for $\mathrm{ Z } \mathrm{ Z } $ signal, while the solid curves correspond to results of the MCFM calculations. The bottom part of each subfigure represents the ratio of the measured cross section to the expected one from POWHEG+GG2ZZ+PYTHIA (black crosses with solid symbols) and MCFM (red crosses). The shaded areas on all the plots represent the full uncertainties calculated as the quadrature sum of the statistical and systematic uncertainties, whereas the crosses represent the statistical uncertainties only.-b |
png pdf |
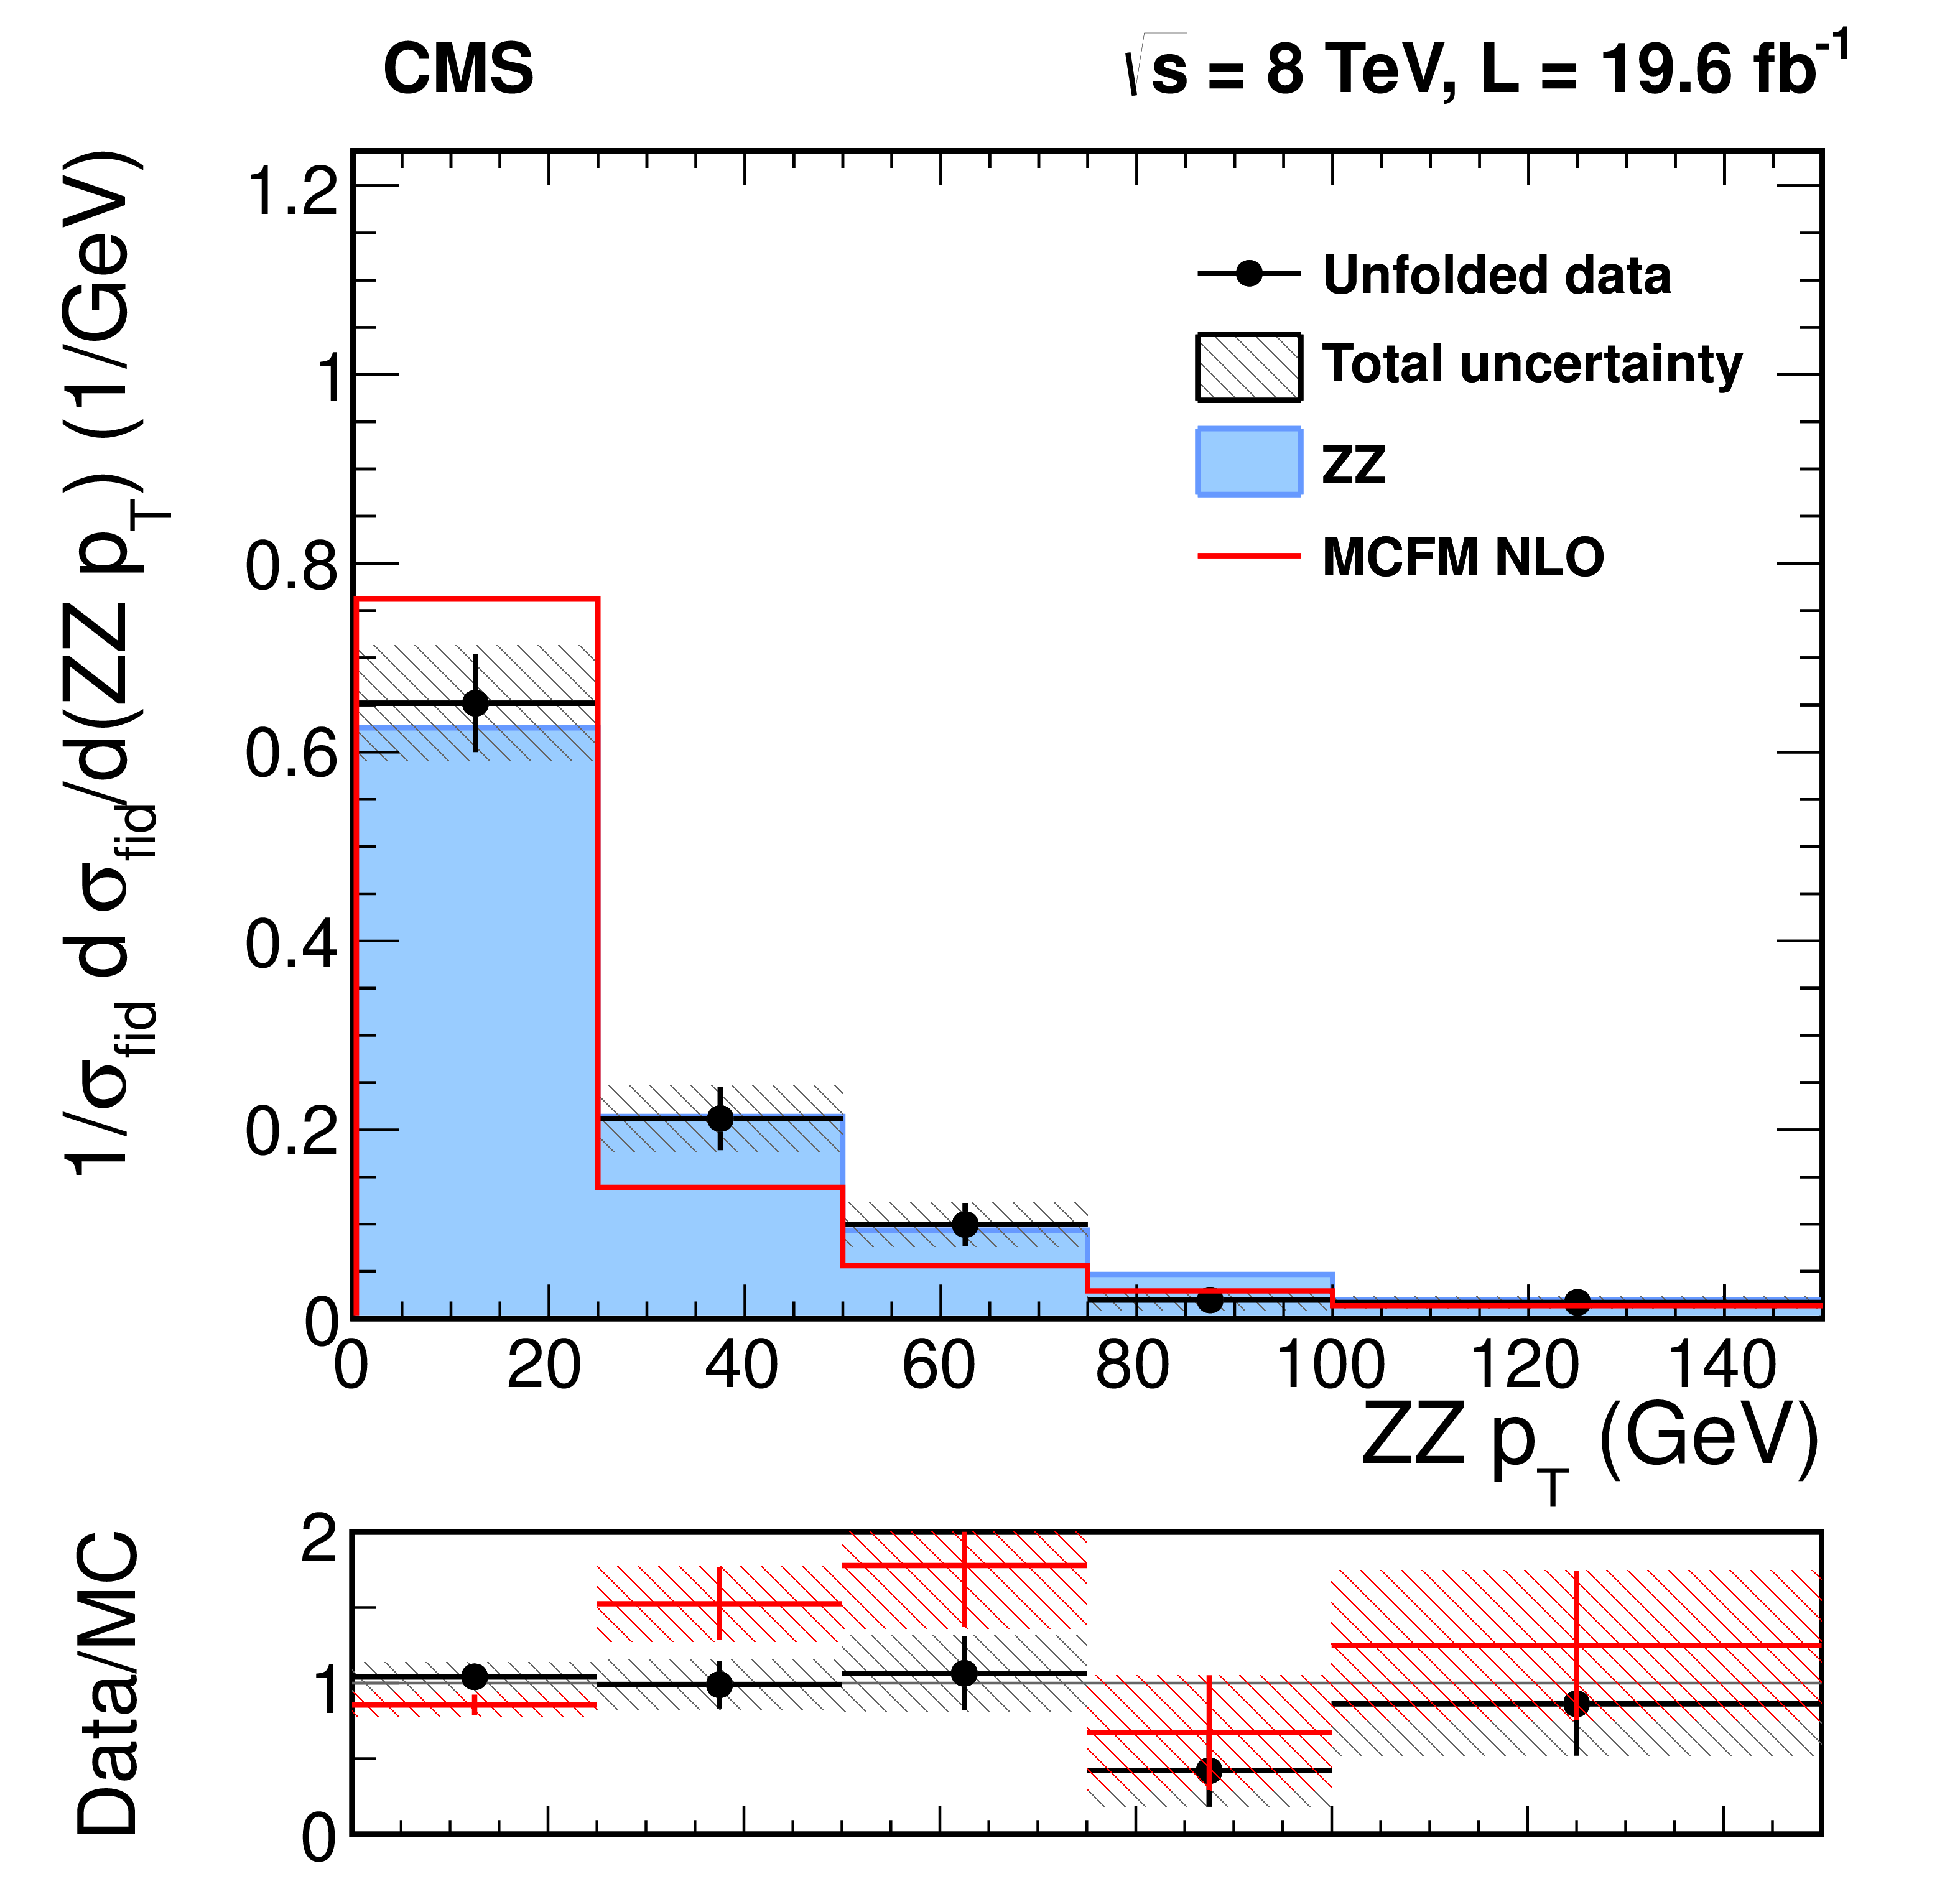
Figure 3-c:
Differential cross sections normalized to the fiducial cross section for the combined $4 \mathrm{ e } $, $4 \mu $, and $2 \mathrm{ e } 2 \mu $ decay channels as a function of $ {p_{\mathrm {T}}} $ for (a) the highest ${p_{\mathrm {T}}}$ lepton in the event, (b) the $\mathrm{ Z } _1$, and (c) the $\mathrm{ Z } \mathrm{ Z } $ system. Figure (d) shows the normalized $ {\mathrm {d}}\sigma / {\mathrm {d}}{m_{\mathrm{ Z } \mathrm{ Z } }}$ distribution. Points represent the data, and the shaded histograms labeled $\mathrm{ Z } \mathrm{ Z } $ represent the POWHEG+GG2ZZ+PYTHIA predictions for $\mathrm{ Z } \mathrm{ Z } $ signal, while the solid curves correspond to results of the MCFM calculations. The bottom part of each subfigure represents the ratio of the measured cross section to the expected one from POWHEG+GG2ZZ+PYTHIA (black crosses with solid symbols) and MCFM (red crosses). The shaded areas on all the plots represent the full uncertainties calculated as the quadrature sum of the statistical and systematic uncertainties, whereas the crosses represent the statistical uncertainties only.-c |
png pdf |
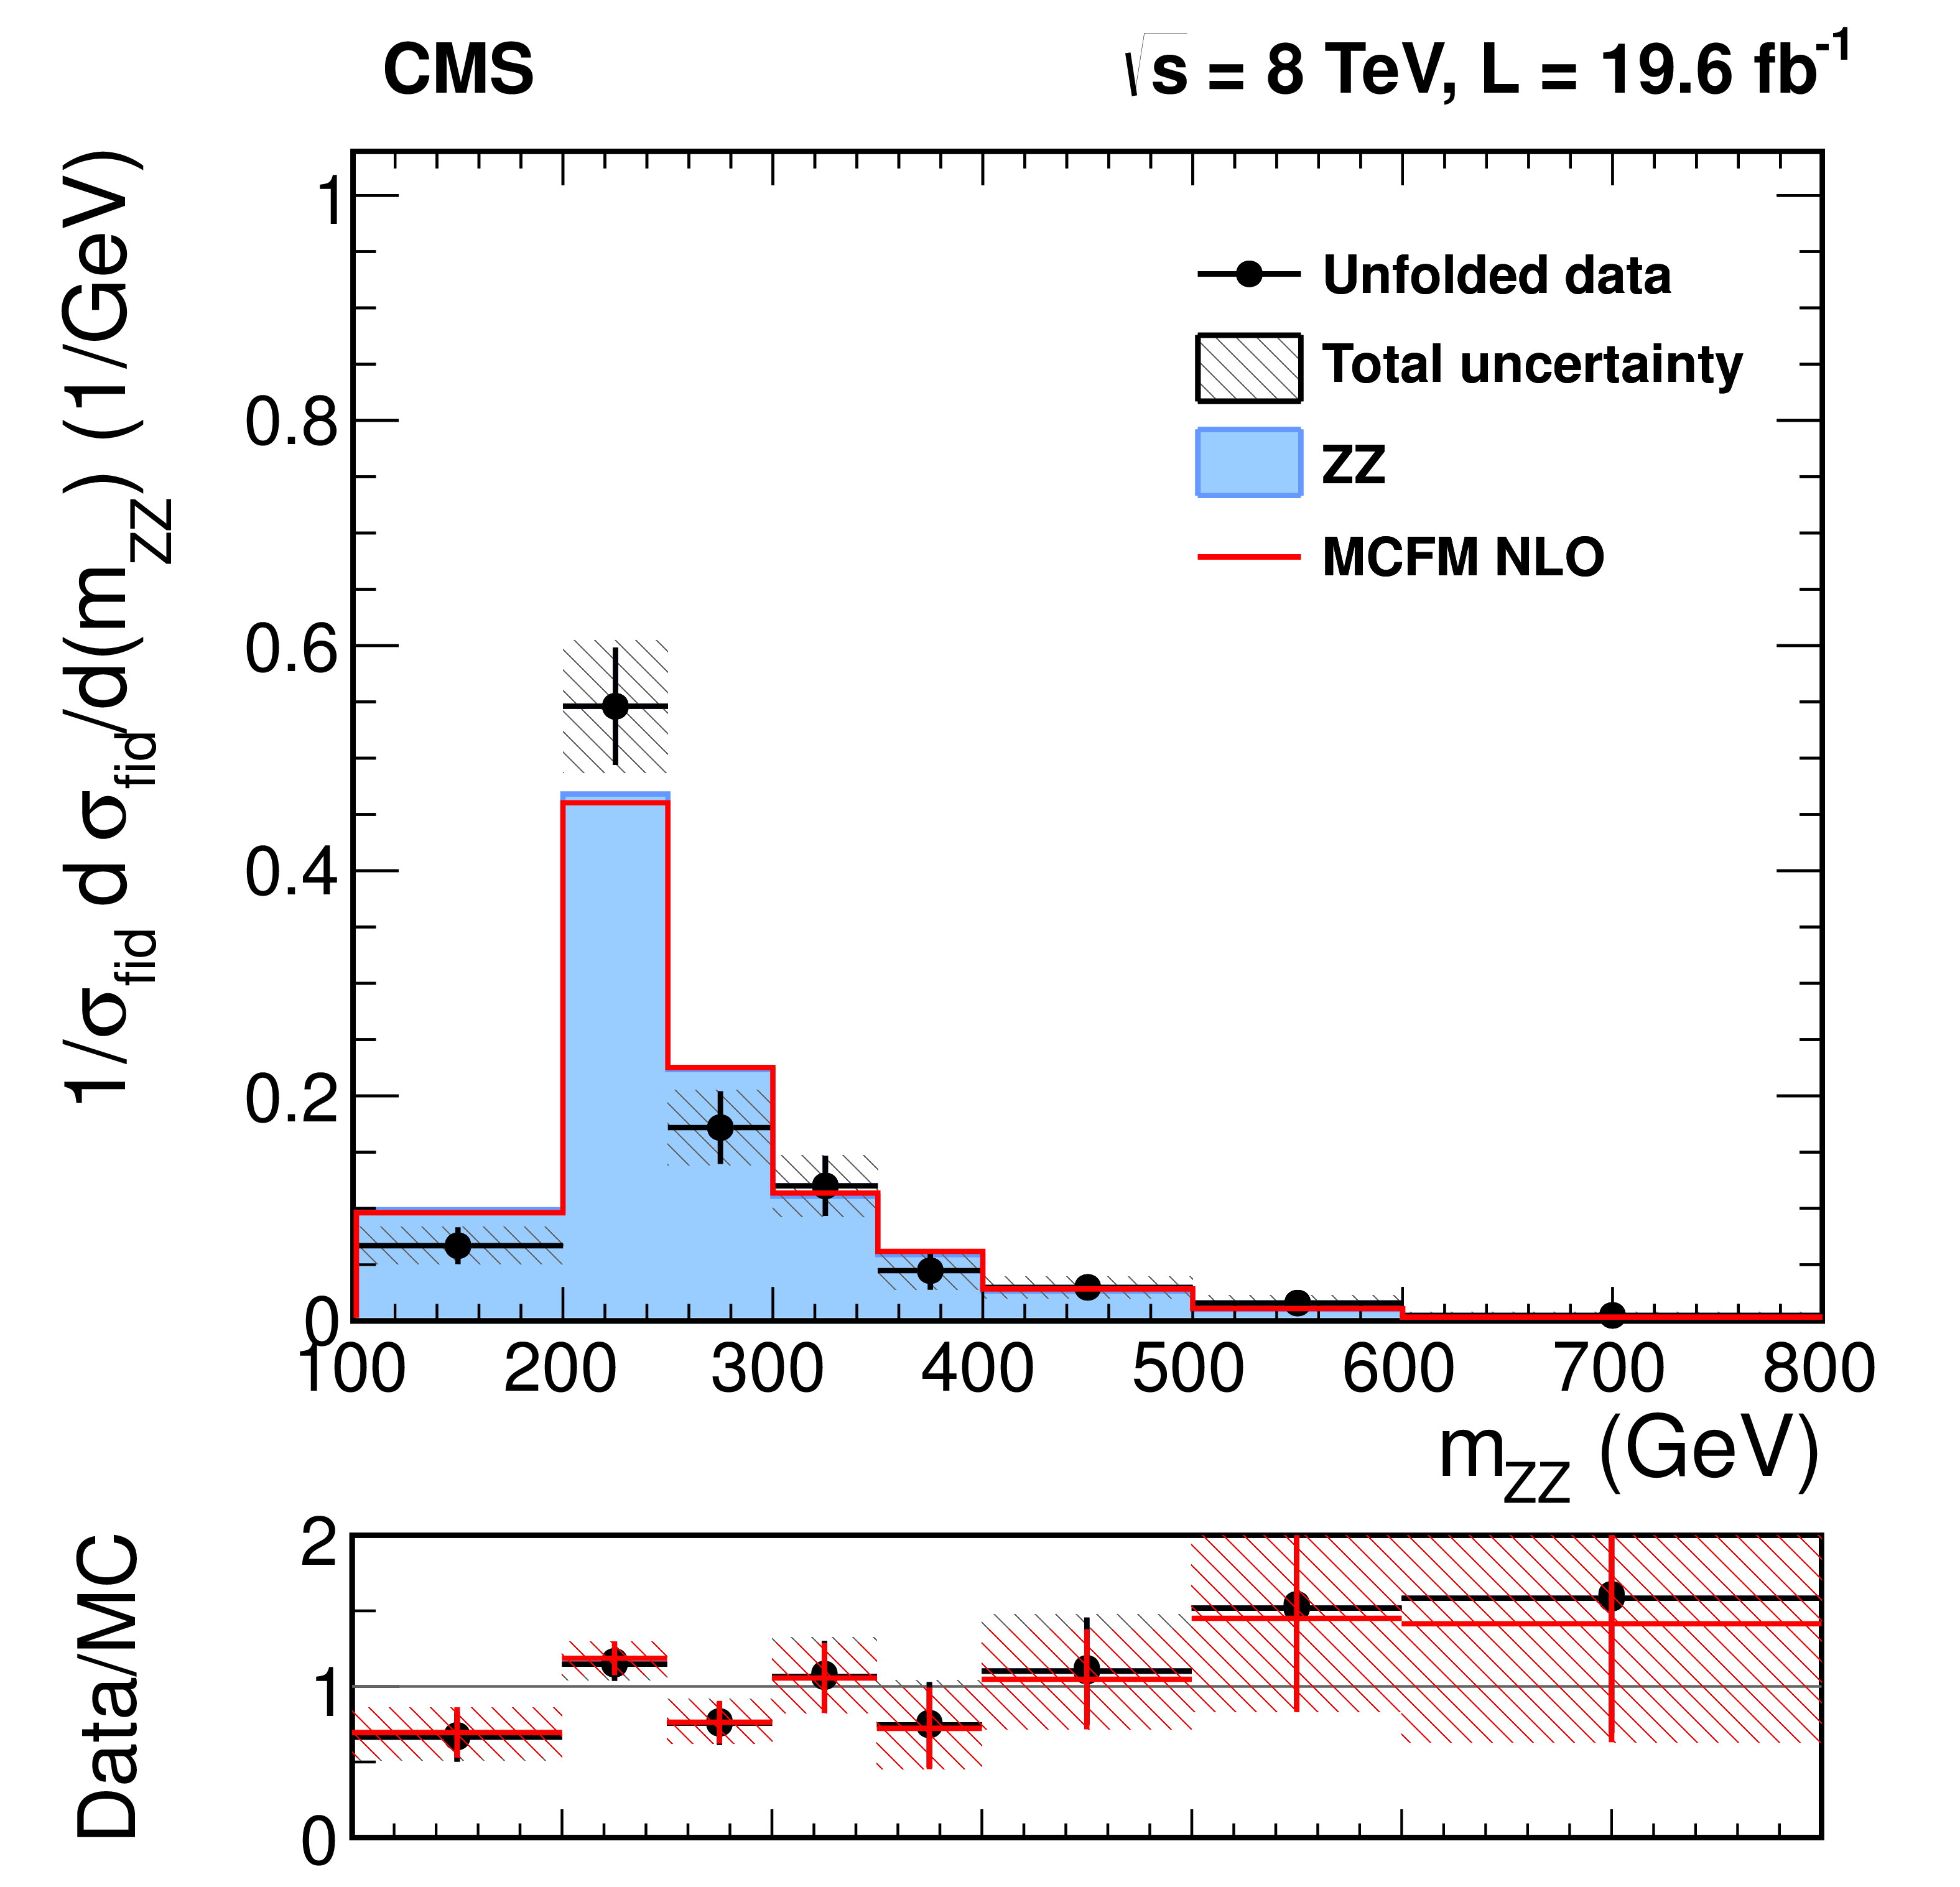
Figure 3-d:
Differential cross sections normalized to the fiducial cross section for the combined $4 \mathrm{ e } $, $4 \mu $, and $2 \mathrm{ e } 2 \mu $ decay channels as a function of $ {p_{\mathrm {T}}} $ for (a) the highest ${p_{\mathrm {T}}}$ lepton in the event, (b) the $\mathrm{ Z } _1$, and (c) the $\mathrm{ Z } \mathrm{ Z } $ system. Figure (d) shows the normalized $ {\mathrm {d}}\sigma / {\mathrm {d}}{m_{\mathrm{ Z } \mathrm{ Z } }}$ distribution. Points represent the data, and the shaded histograms labeled $\mathrm{ Z } \mathrm{ Z } $ represent the POWHEG+GG2ZZ+PYTHIA predictions for $\mathrm{ Z } \mathrm{ Z } $ signal, while the solid curves correspond to results of the MCFM calculations. The bottom part of each subfigure represents the ratio of the measured cross section to the expected one from POWHEG+GG2ZZ+PYTHIA (black crosses with solid symbols) and MCFM (red crosses). The shaded areas on all the plots represent the full uncertainties calculated as the quadrature sum of the statistical and systematic uncertainties, whereas the crosses represent the statistical uncertainties only.-d |
png pdf |
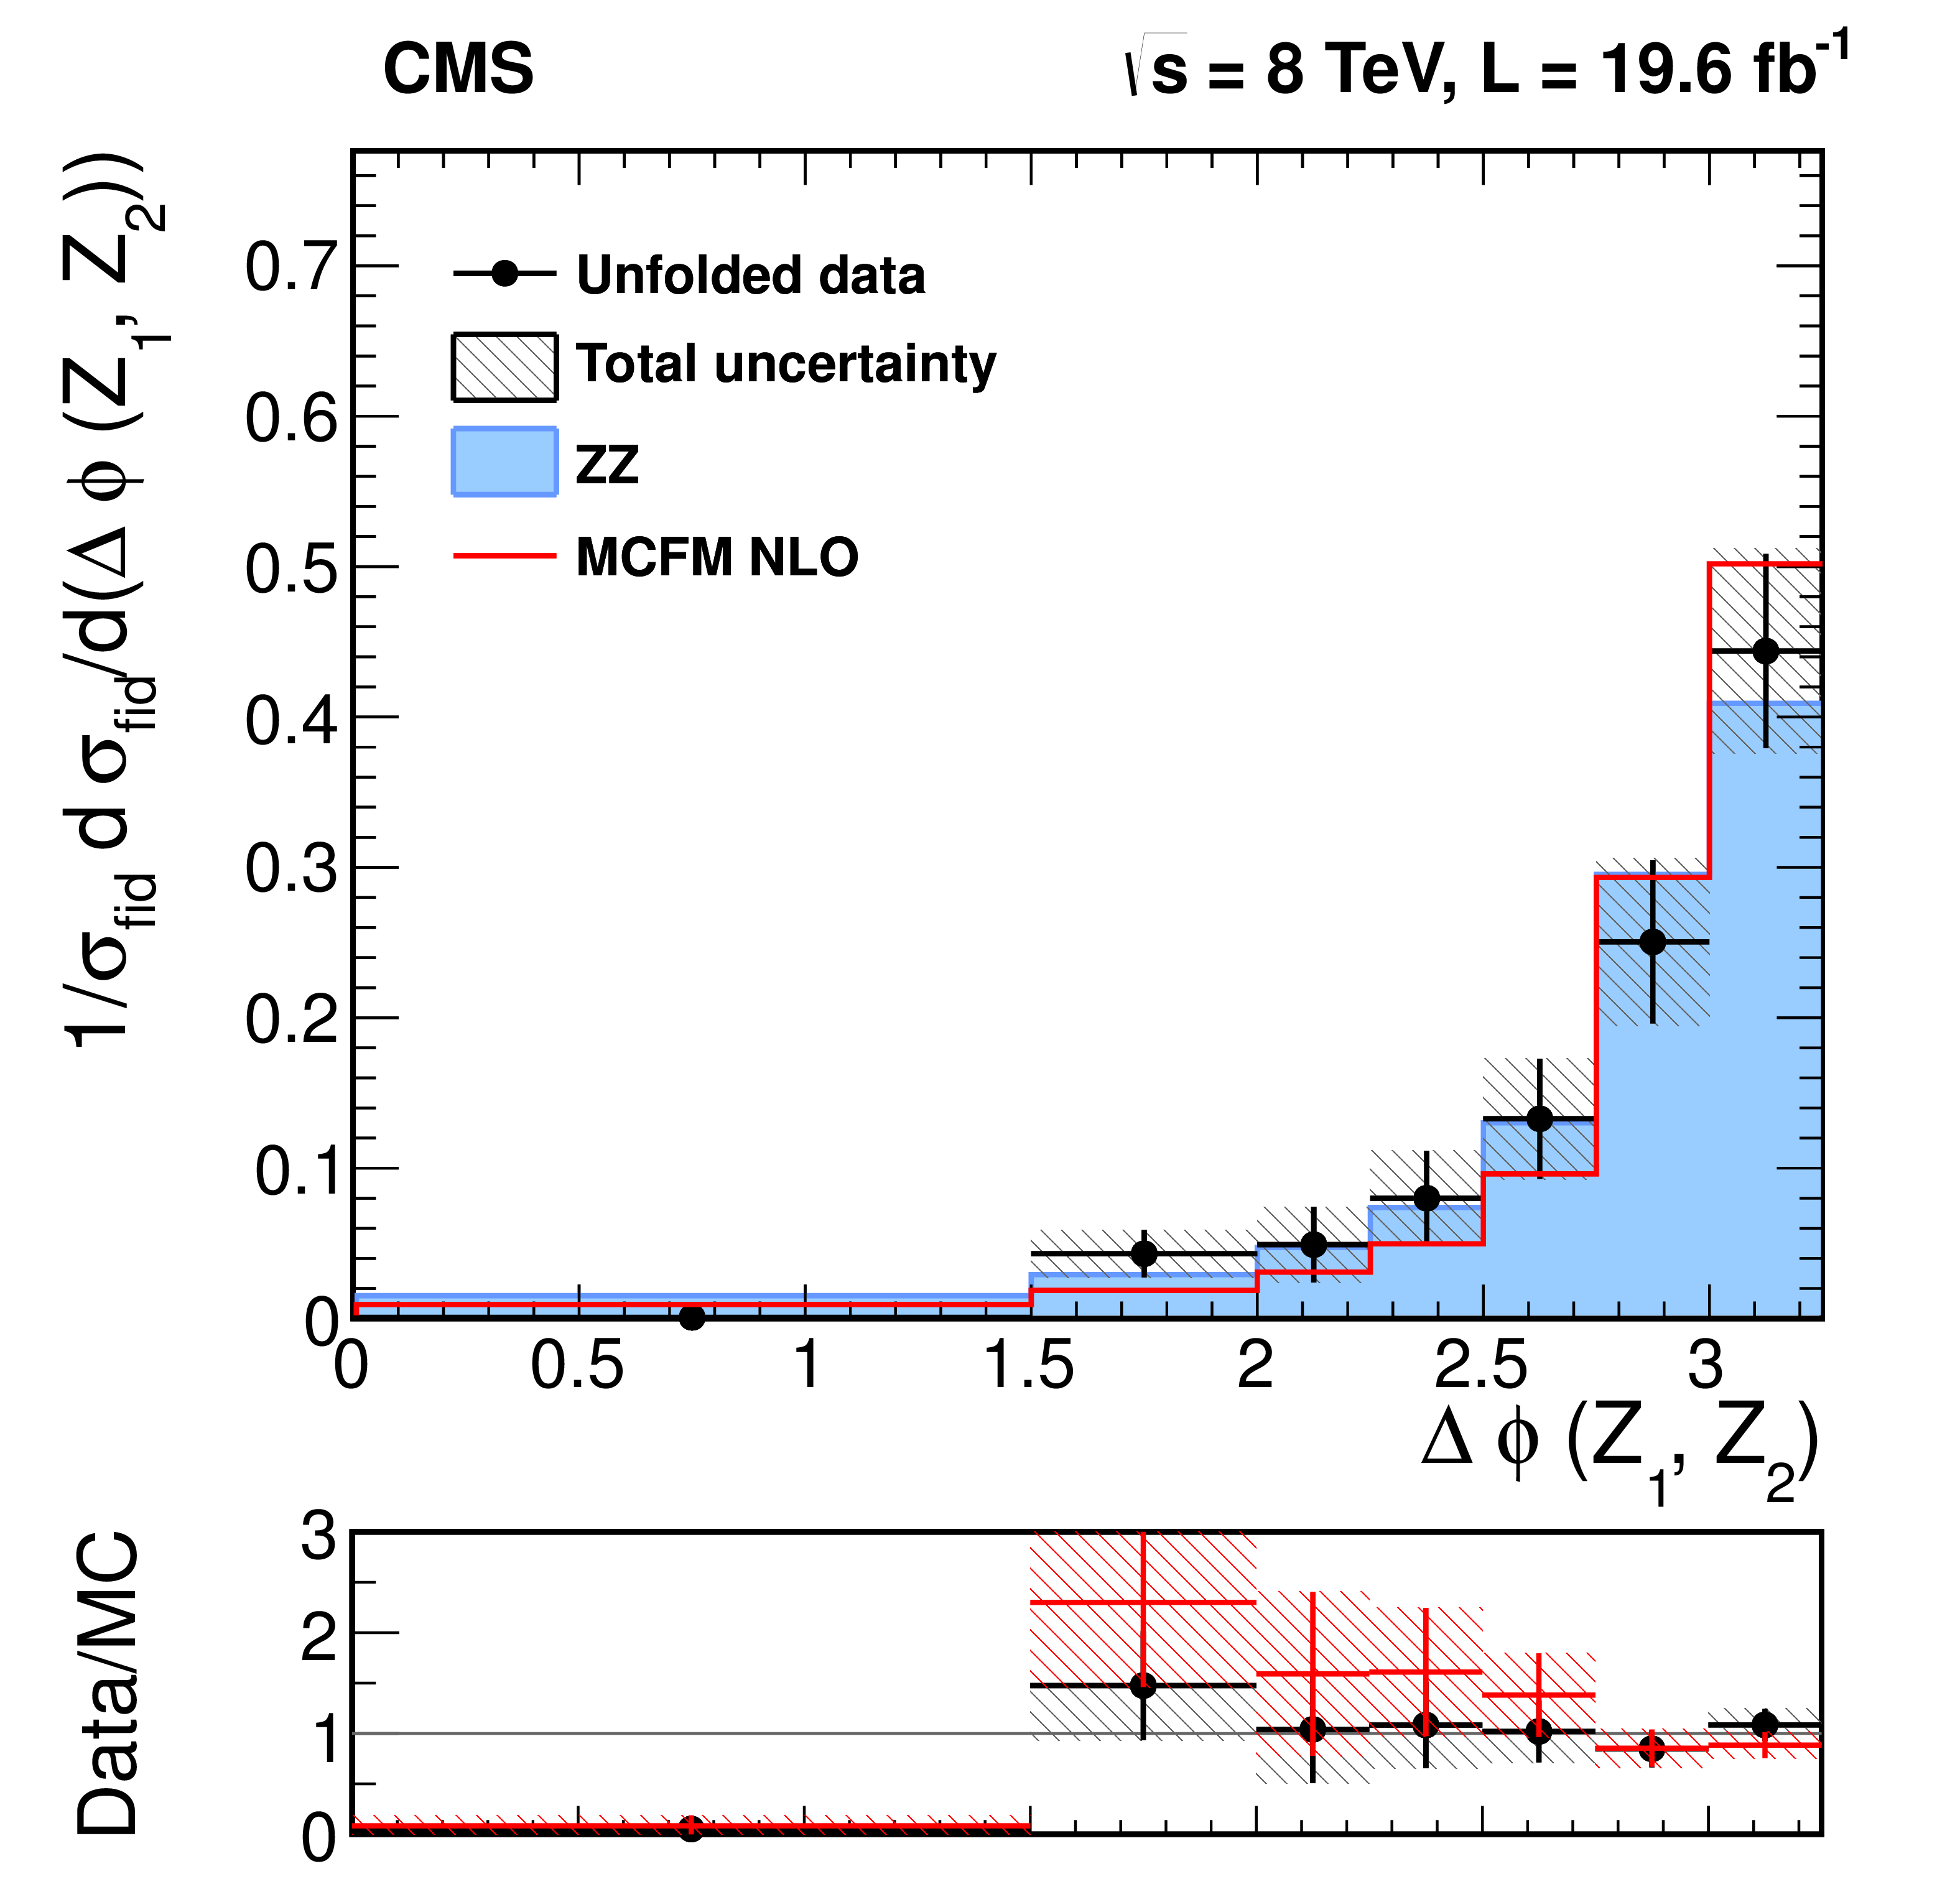
Figure 4-a:
Differential cross section normalized to the fiducial cross section for the combined $4 \mathrm{ e } $, $4 \mu $, and $2 \mathrm{ e } 2\mu $ decay channels as a function of (a) azimuthal separation of the two $\mathrm{ Z } $ bosons and (b) $\Delta R$ between the $\mathrm{ Z } $-bosons. Points represent the data, and the shaded histograms labeled $\mathrm{ Z } \mathrm{ Z } $ represent the POWHEG+GG2ZZ+PYTHIA predictions for $\mathrm{ Z } \mathrm{ Z } $ signal, while the solid curves correspond to results of the MCFM calculations. The bottom part of each subfigure represents the ratio of the measured cross section to the expected one from POWHEG+GG2ZZ+PYTHIA (black crosses with solid symbols) and MCFM (red crosses). The shaded areas on all the plots represent the full uncertainties calculated as the quadrature sum of the statistical and systematic uncertainties, whereas the crosses represent the statistical uncertainties only. |
png pdf |
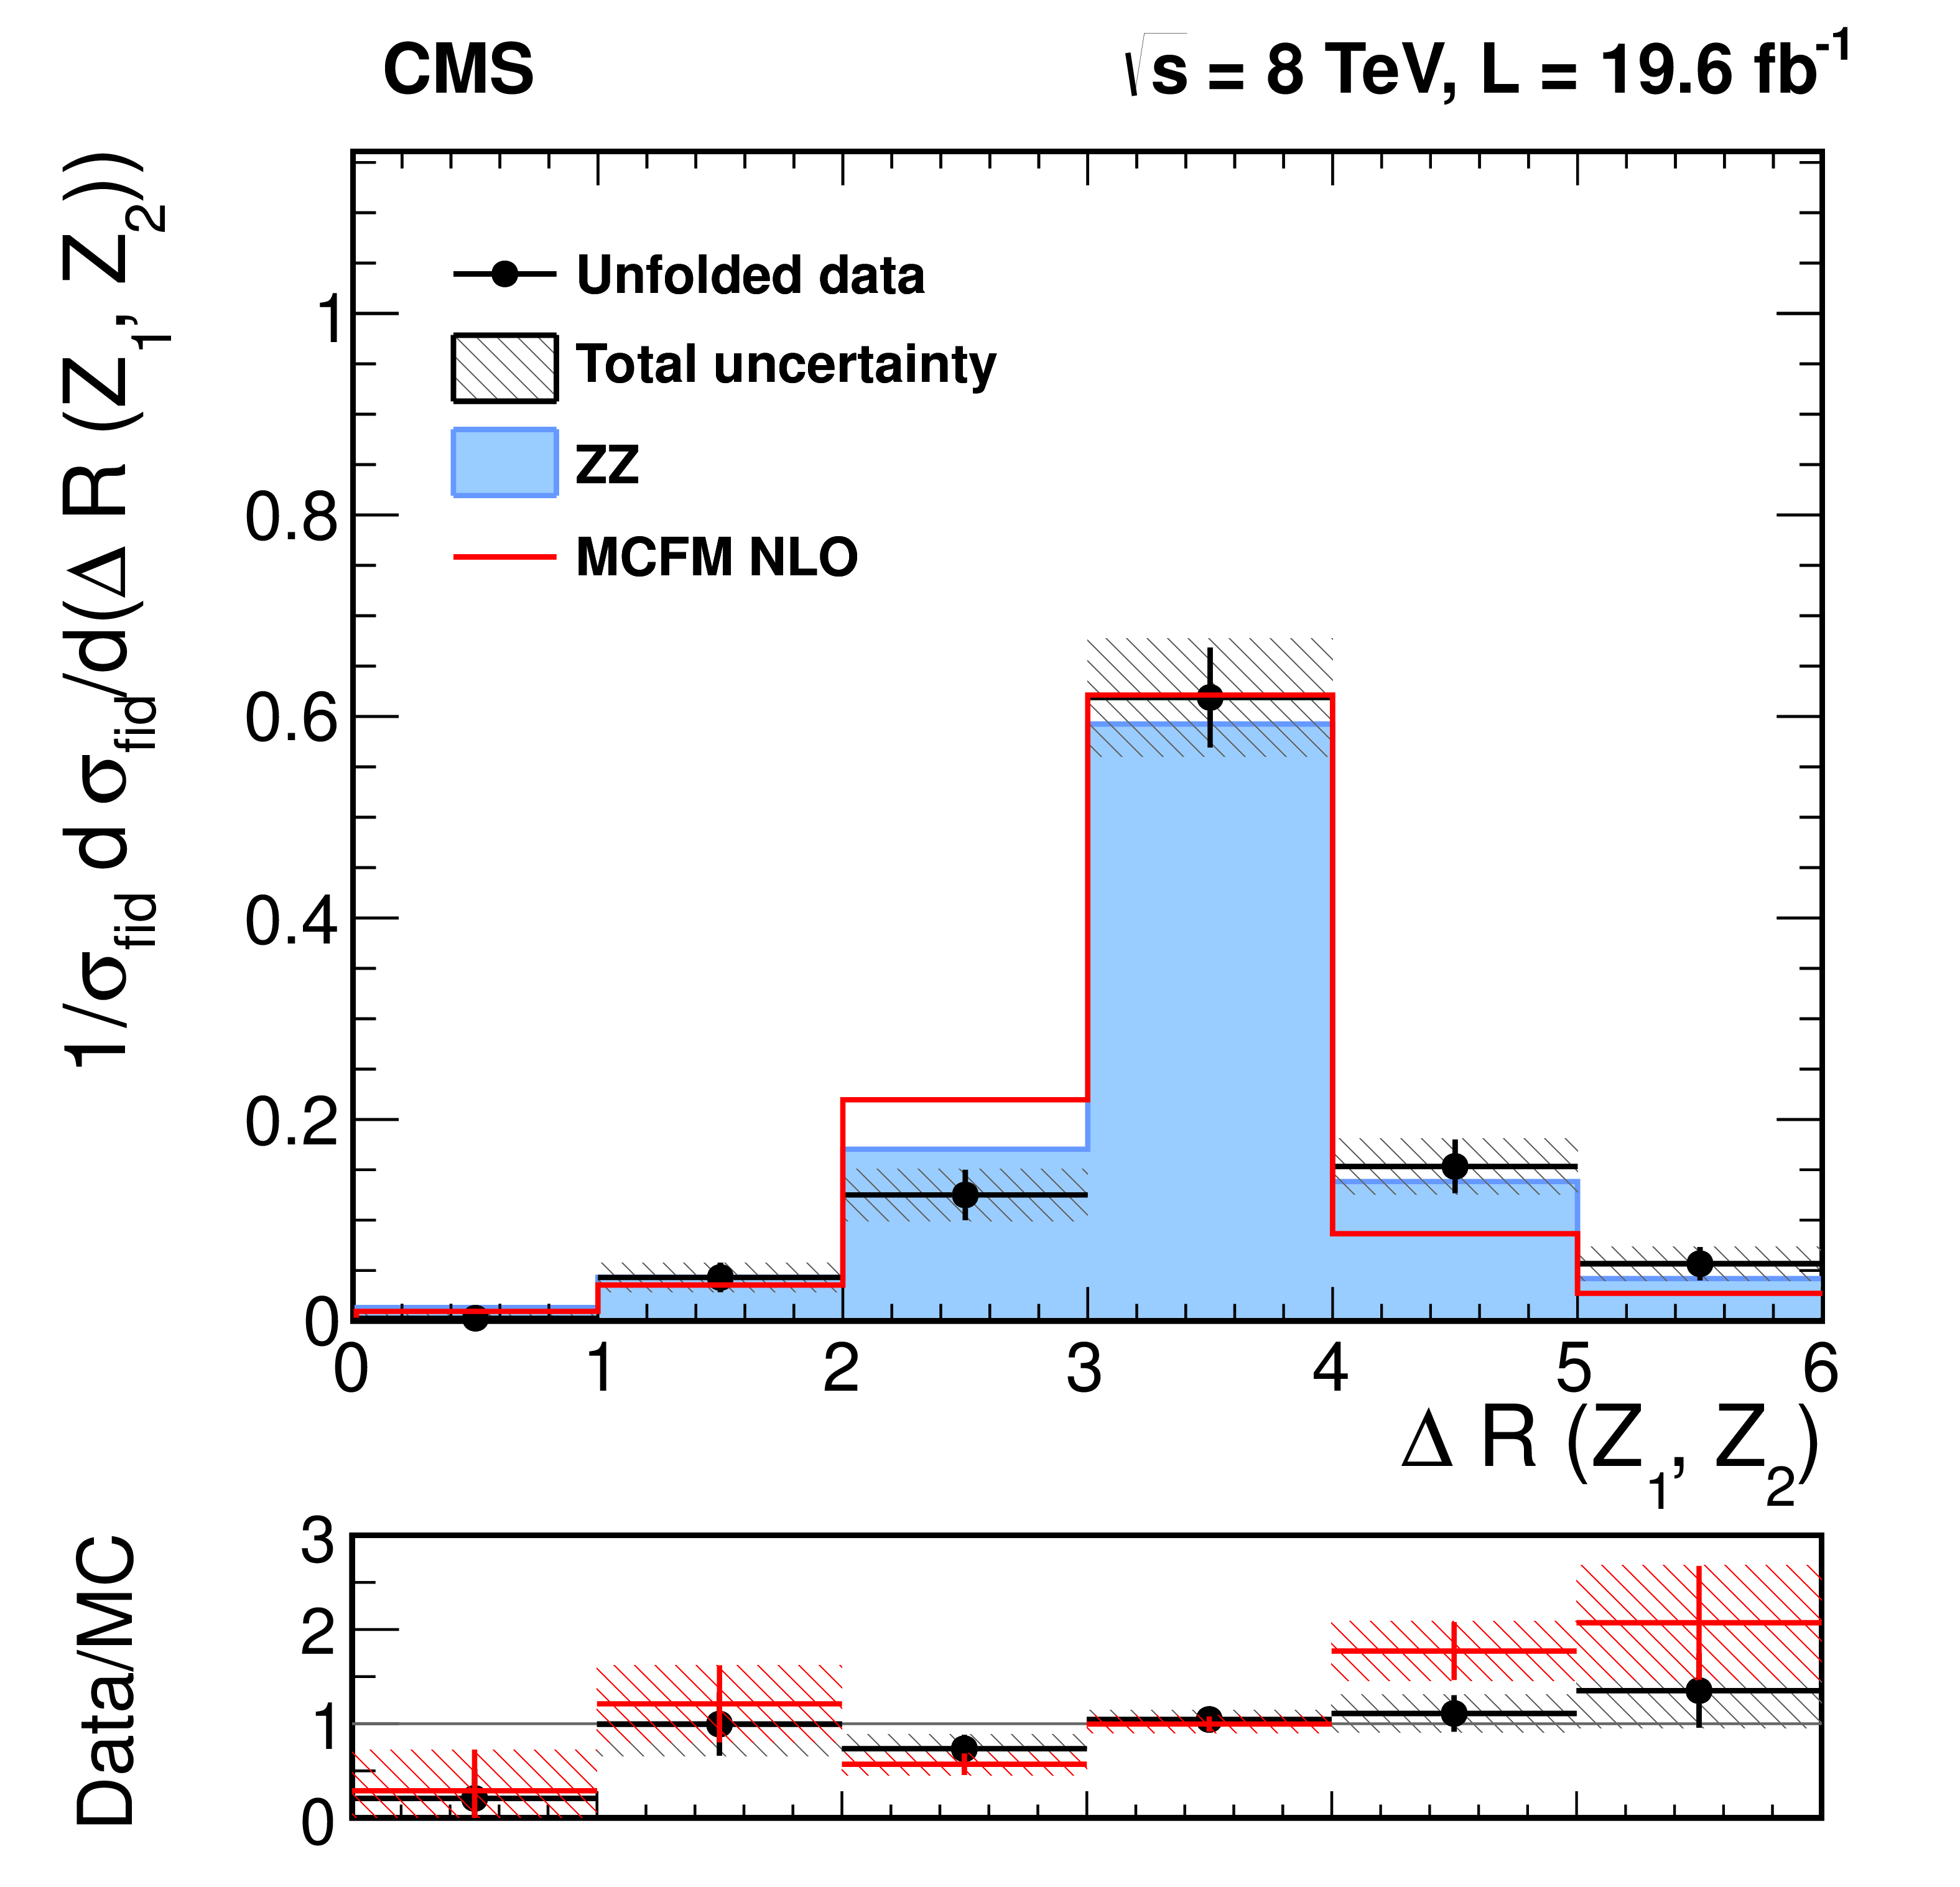
Figure 4-b:
Differential cross section normalized to the fiducial cross section for the combined $4 \mathrm{ e } $, $4 \mu $, and $2 \mathrm{ e } 2\mu $ decay channels as a function of (a) azimuthal separation of the two $\mathrm{ Z } $ bosons and (b) $\Delta R$ between the $\mathrm{ Z } $-bosons. Points represent the data, and the shaded histograms labeled $\mathrm{ Z } \mathrm{ Z } $ represent the POWHEG+GG2ZZ+PYTHIA predictions for $\mathrm{ Z } \mathrm{ Z } $ signal, while the solid curves correspond to results of the MCFM calculations. The bottom part of each subfigure represents the ratio of the measured cross section to the expected one from POWHEG+GG2ZZ+PYTHIA (black crosses with solid symbols) and MCFM (red crosses). The shaded areas on all the plots represent the full uncertainties calculated as the quadrature sum of the statistical and systematic uncertainties, whereas the crosses represent the statistical uncertainties only. |
png pdf |
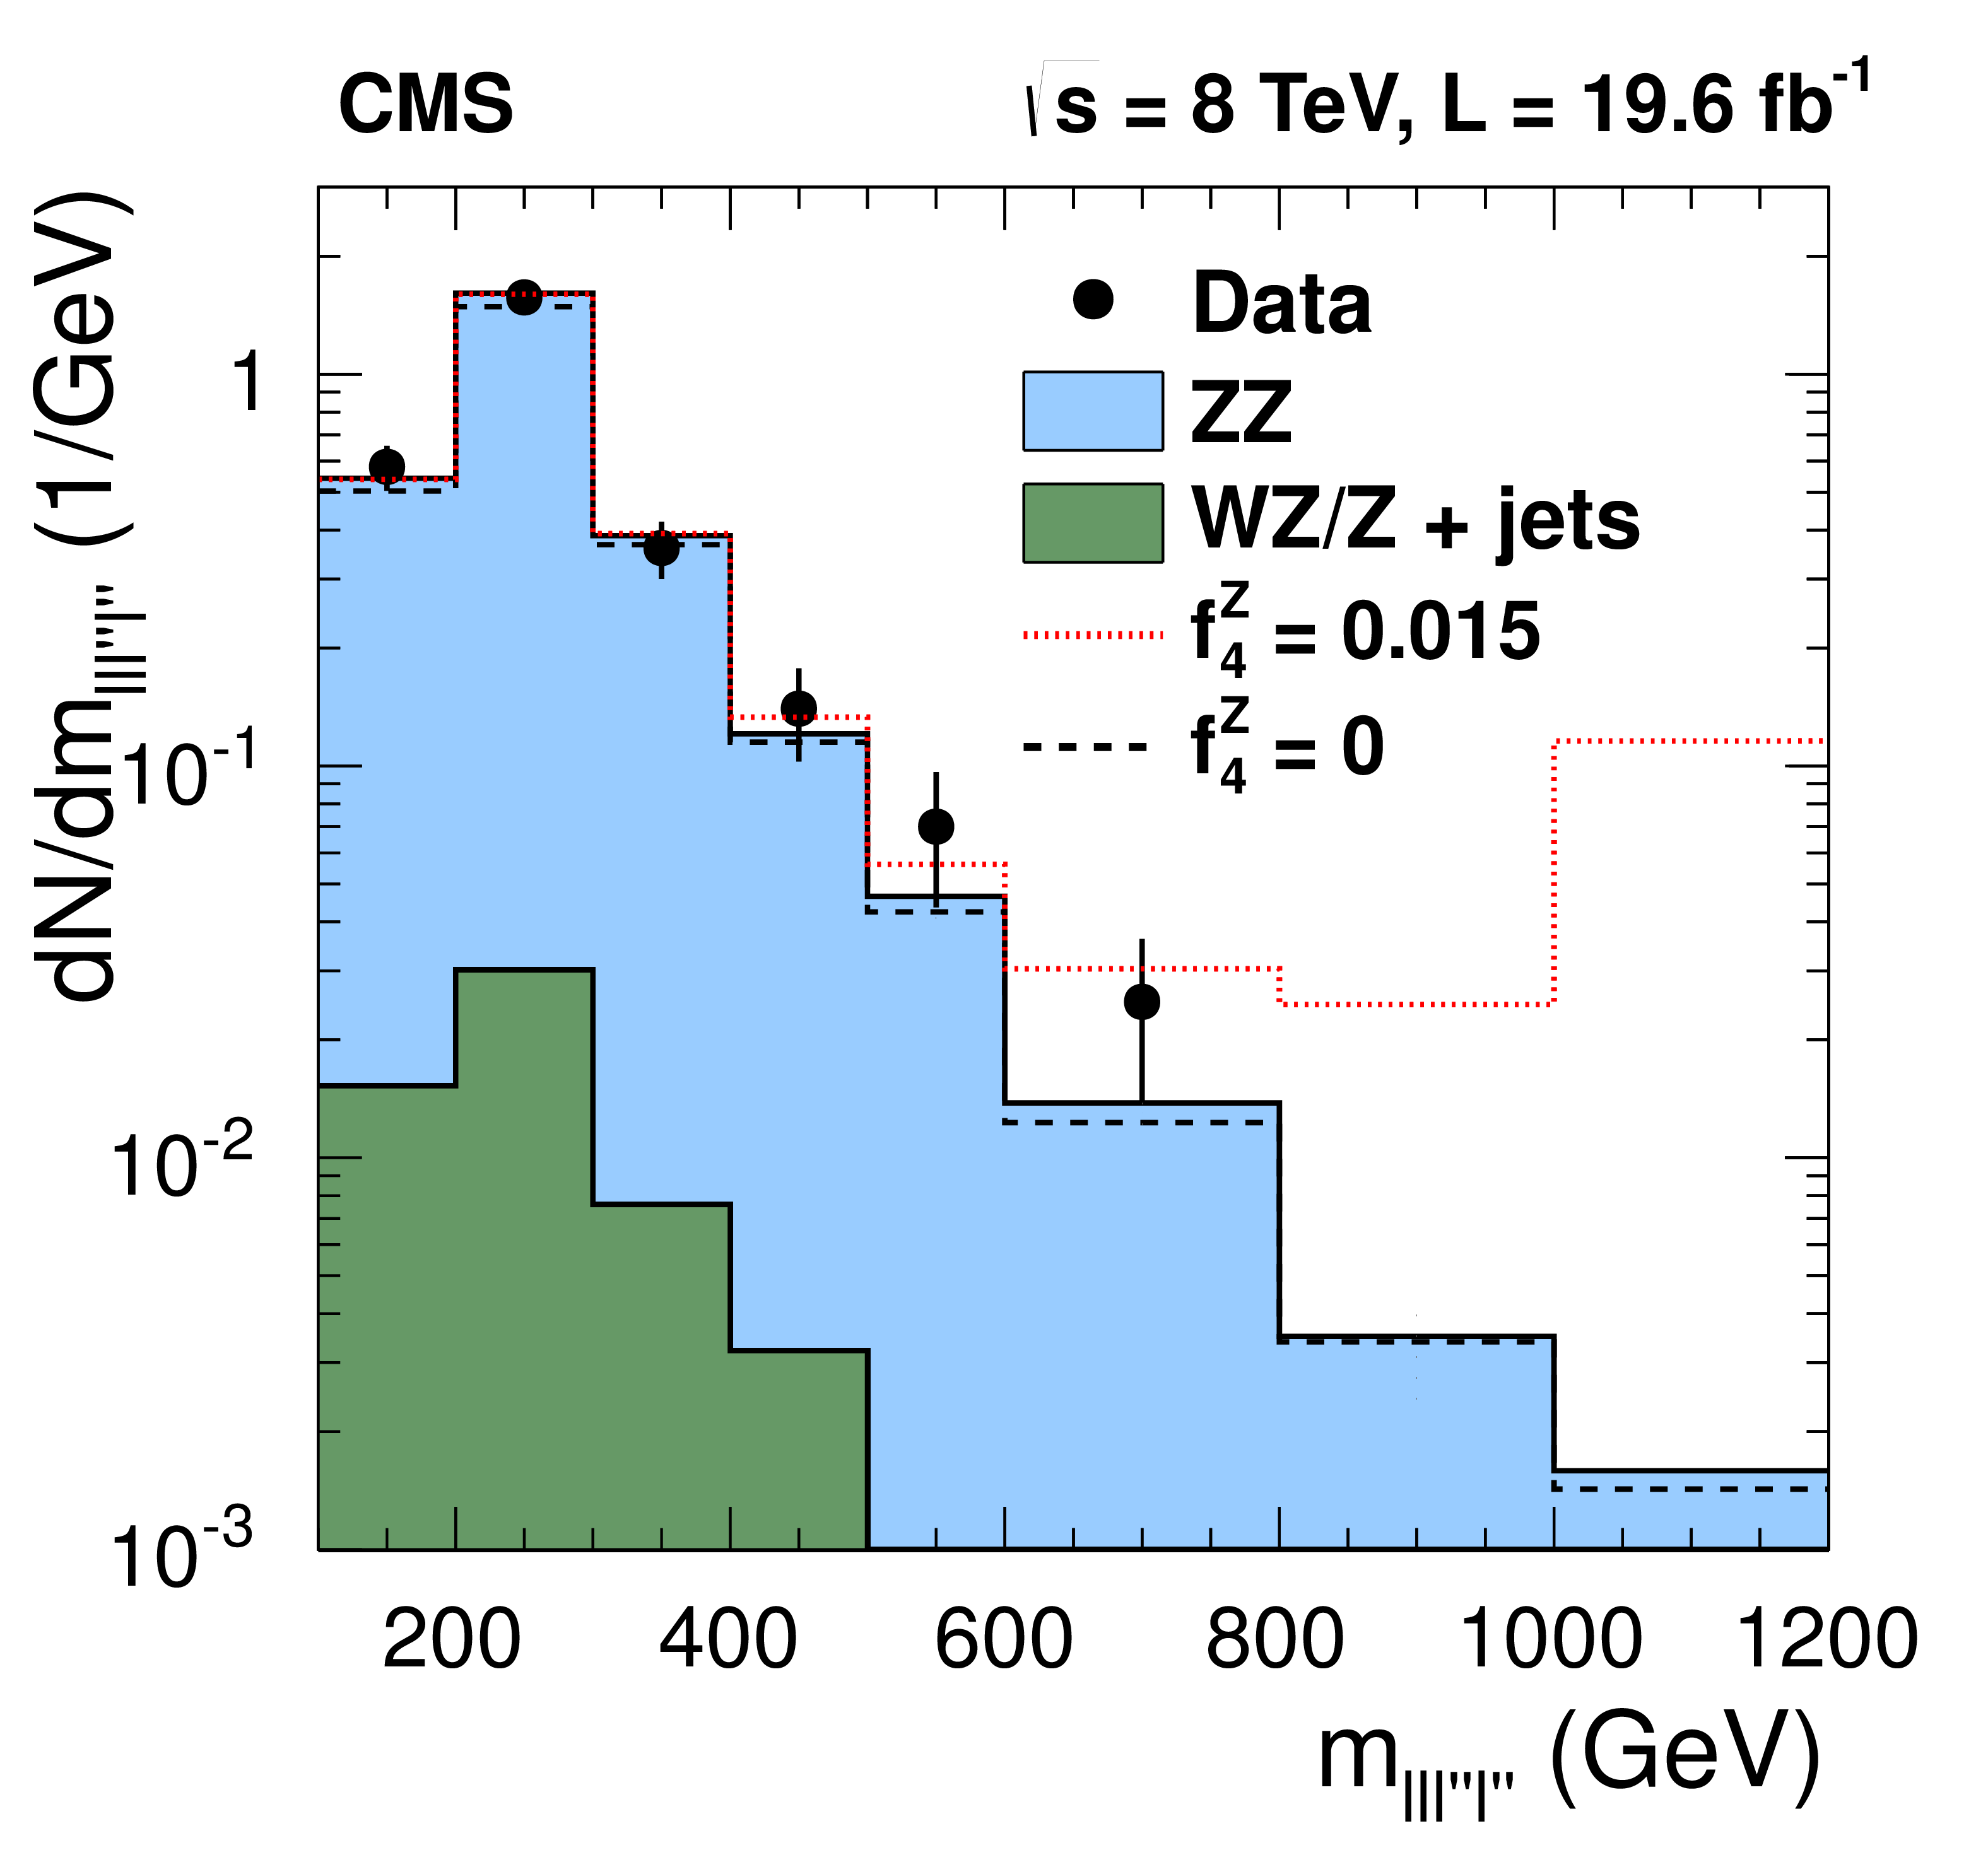
Figure 5:
Distribution of the four-lepton reconstructed mass for the combined $4\mathrm{ e } $, $4 \mu $, and $2\mathrm{ e } 2\mu $ channels. Points represent the data, the shaded histogram labeled $\mathrm{ Z } \mathrm{ Z } $ represents the POWHEG+GG2ZZ+PYTHIA predictions for $\mathrm{ Z } \mathrm{ Z } $ signal, the histograms labeled $\mathrm{ W } \mathrm{ Z } /\mathrm{ Z } $+jets shows background, which is estimated from data, as described in the text. The dashed and dotted histograms indicate the results of the SHERPA simulation for the SM ($f_4^{\mathrm{ Z } } =$ 0) and in the presence of an ATGC ($f_4^{\mathrm{ Z } }=$ 0.015) with all the other anomalous couplings set to zero. The last bin includes all entries with masses above 1000 GeV. |

png pdf |
Figure 6-a:
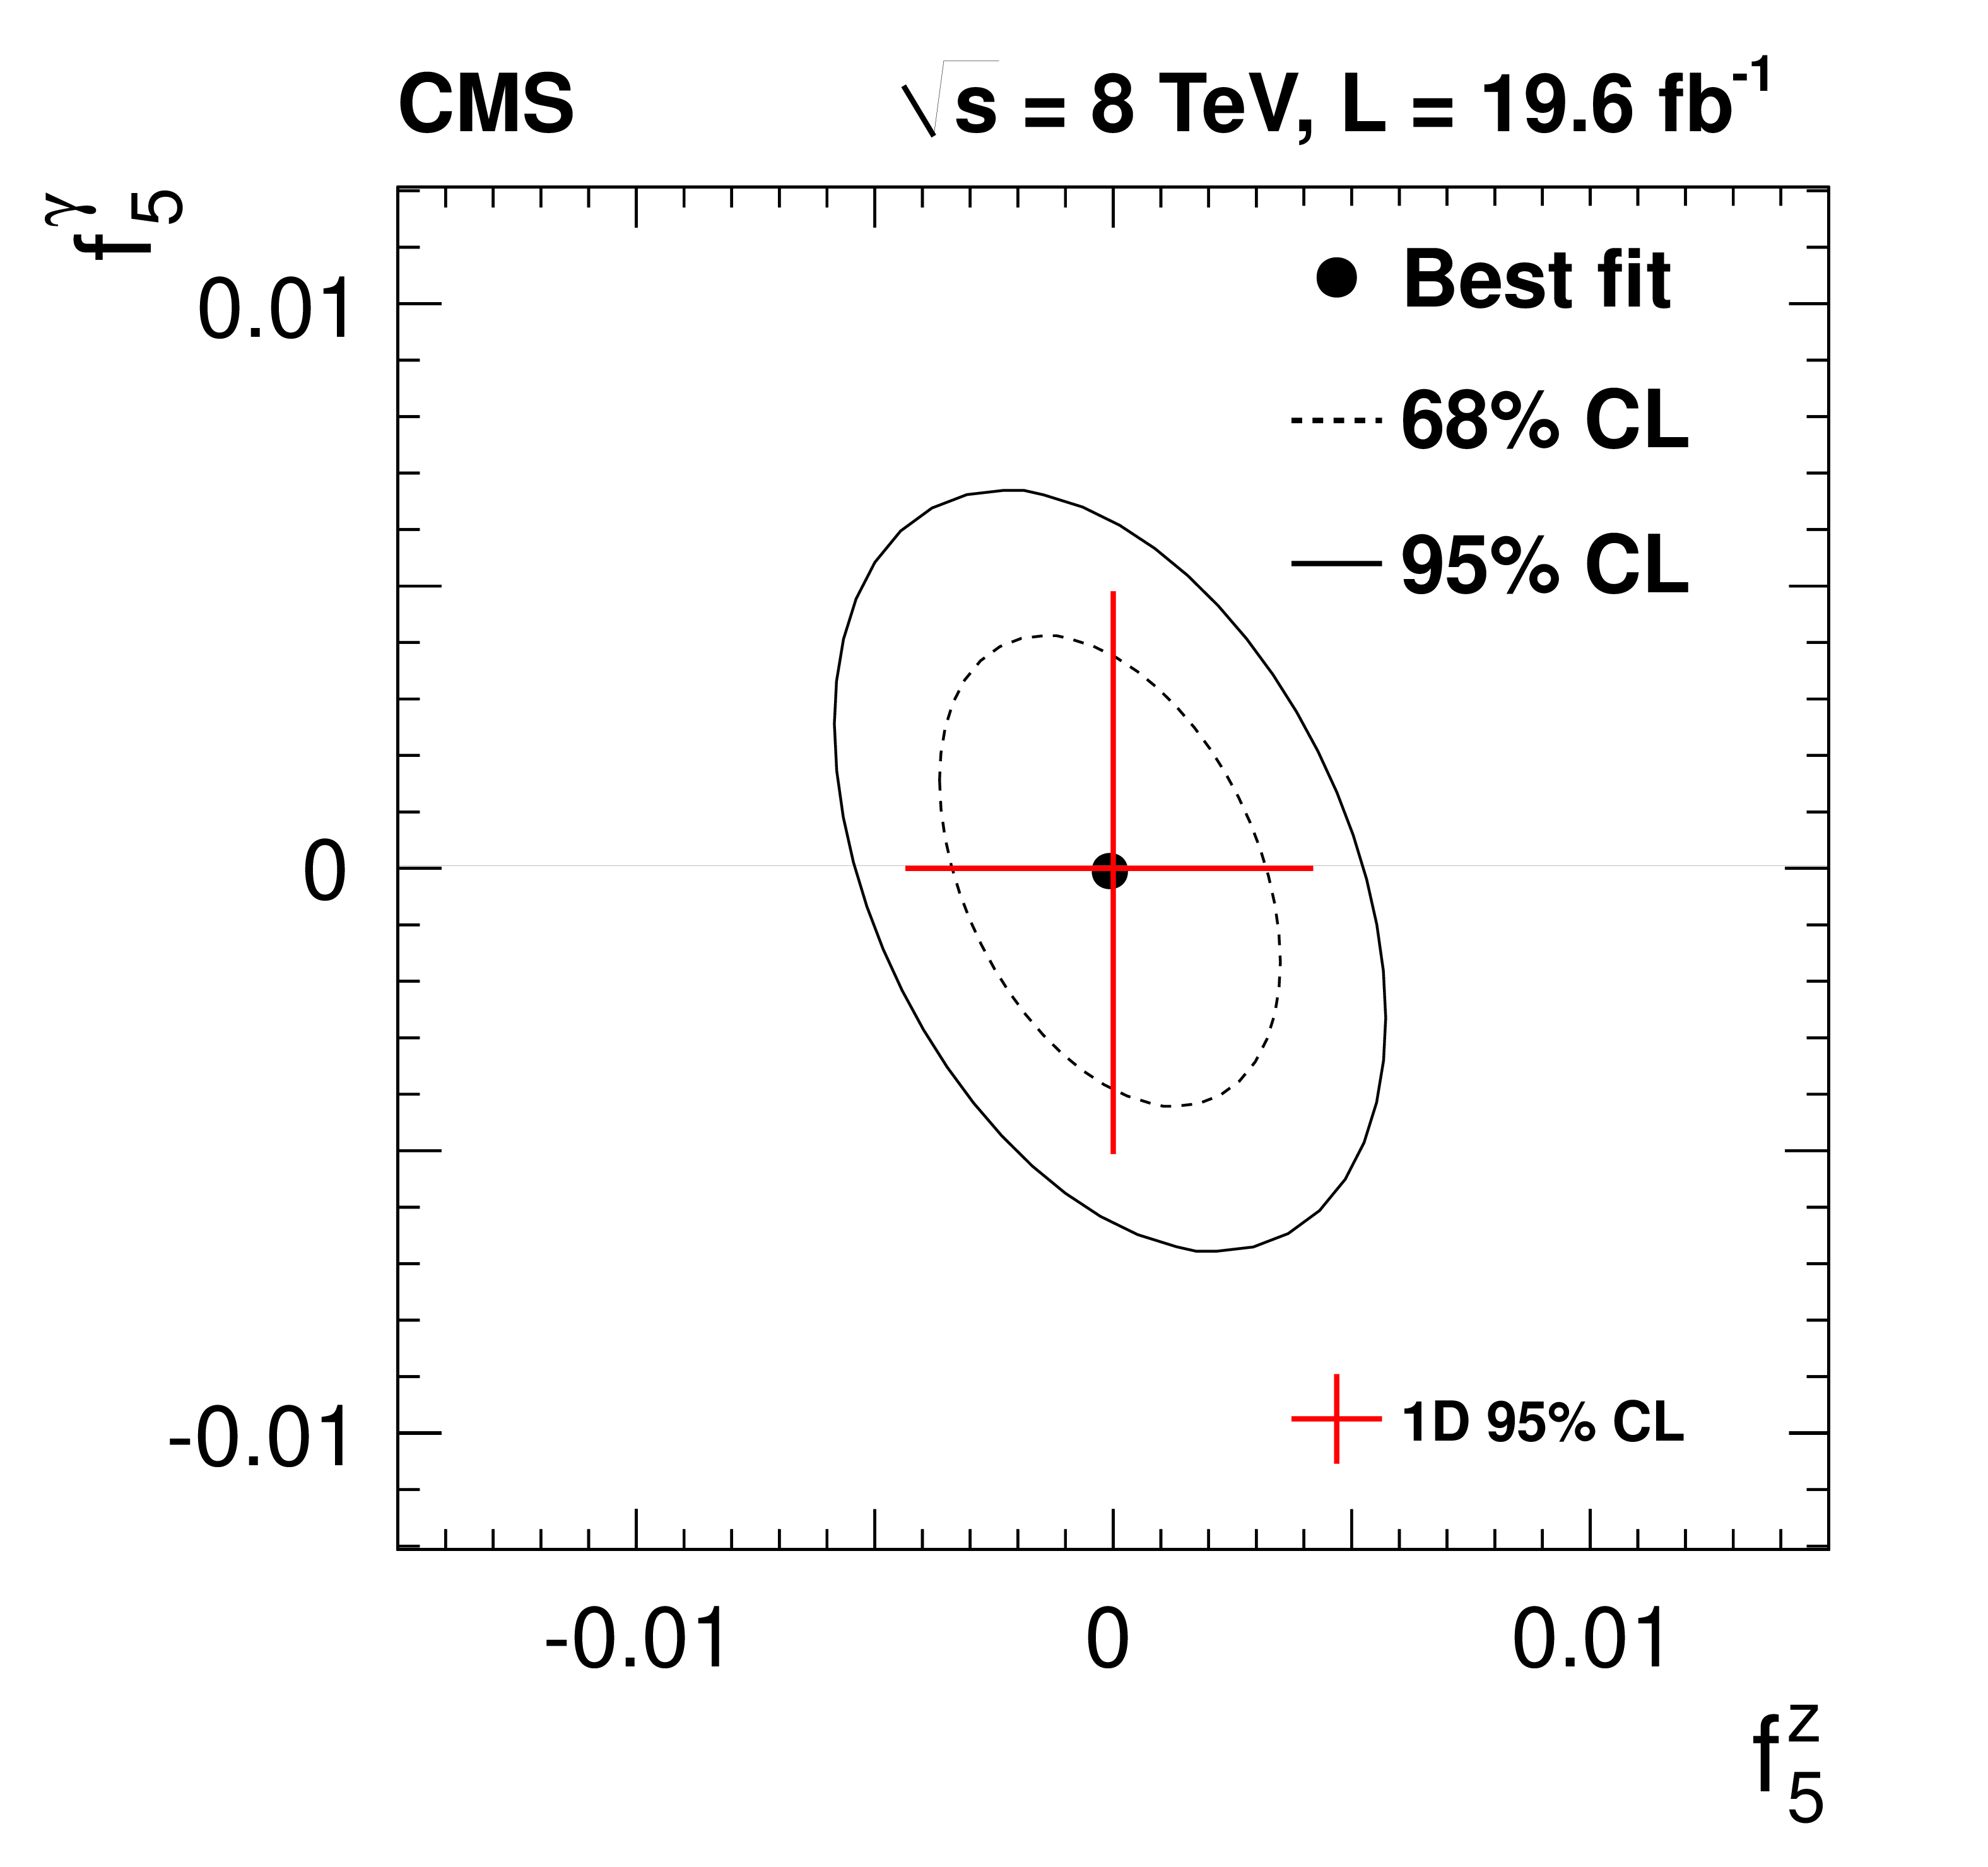
Two-dimensional exclusion limits at 68% (dashed contour) and 95% (solid contour) CL on the $\mathrm{ Z } \mathrm{ Z } \mathrm{ Z } $ and $\mathrm{ Z } \mathrm{ Z } \gamma $ ATGCs. The a (b) plot shows the exclusion contour in the $(f_{4(5)}^\mathrm{ Z } , f_{4(5)}^\gamma )$ parameter planes. The solid dot shows where the likelihood reaches its maximum. The values of couplings outside of contours are excluded at the corresponding confidence level. The lines in the middle represent one-dimensional limits. No form factor is used. |
png pdf |
Figure 6-b:
Two-dimensional exclusion limits at 68% (dashed contour) and 95% (solid contour) CL on the $\mathrm{ Z } \mathrm{ Z } \mathrm{ Z } $ and $\mathrm{ Z } \mathrm{ Z } \gamma $ ATGCs. The a (b) plot shows the exclusion contour in the $(f_{4(5)}^\mathrm{ Z } , f_{4(5)}^\gamma )$ parameter planes. The solid dot shows where the likelihood reaches its maximum. The values of couplings outside of contours are excluded at the corresponding confidence level. The lines in the middle represent one-dimensional limits. No form factor is used. |
| Tables | |

png pdf |
Table 1:
The expected yields of $\mathrm{ Z } \mathrm{ Z } $ and background events, as well as their sum (``Total expected'') are compared with the observed yields for each decay channel. The statistical and systematic uncertainties are also shown. |
png pdf |
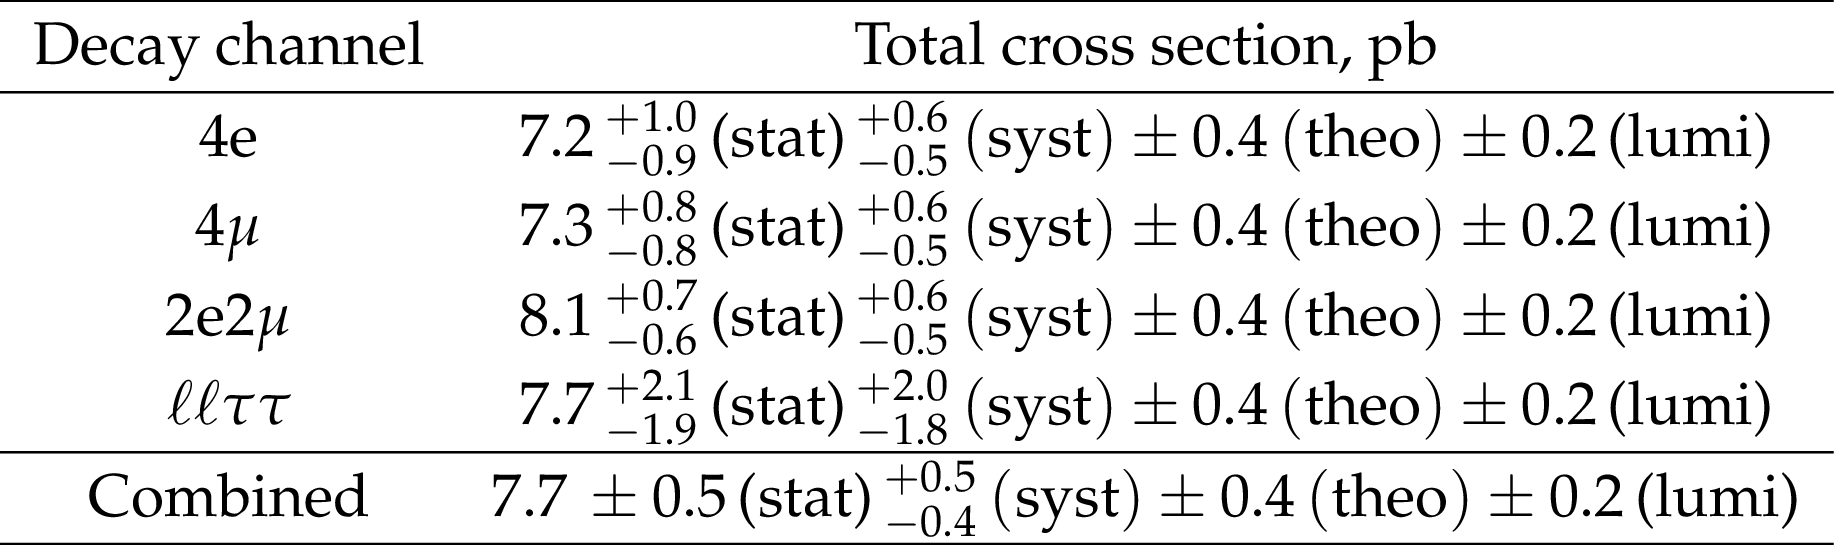
Table 2:
The total $\mathrm{ Z } \mathrm{ Z } $ production cross section as measured in each decay channel and for the combination of all channels. |
| Summary |
| Measurements have been presented of the inclusive $\mathrm{ Z }\mathrm{ Z }$ production cross section in proton-proton collisions at 8 TeV in the $\mathrm{ Z } \mathrm{ Z } \to \ell\ell\ell'\ell'$ decay mode, with $\ell = \mathrm{ e }$, $\mu$ and $\ell' = \mathrm{ e }$, $\mu$, $\tau$. The data sample corresponds to an integrated luminosity of 19.6 fb$^{-1}$. The measured total cross section $\sigma ( \mathrm{ p }\mathrm{ p } \to \mathrm{ Z }\mathrm{ Z }) =$ 7.7 $\pm$ 0.5 (stat) $^{+0.5} _{-0.4}$ (syst) $\pm$ 0.4 (theo) $\pm$ 0.2 (lumi) pb for both Z bosons in the mass range 60 $ < m_\mathrm{ Z } <$ 120 GeV and the differential cross sections agree well with the SM predictions. Improved limits on anomalous $\mathrm{ Z } \mathrm{ Z } \mathrm{ Z }$ and $\mathrm{ Z } \mathrm{ Z } \gamma$ triple gauge couplings are established, significantly restricting their possible allowed ranges. |
|
|
Compact Muon Solenoid LHC, CERN |
|

|

|

|

|

|