

Compact Muon Solenoid
LHC, CERN
| CMS-SMP-13-011 ; CERN-PH-EP-2014-022 | ||
| Measurement of WZ and ZZ production in pp collisions at $\sqrt{s}$ = 8 TeV in final states with b-tagged jets | ||
| CMS Collaboration | ||
| 12 March 2014 | ||
| Eur. Phys. J. C 74 (2014) 2973 | ||
| Abstract: Measurements are reported of the WZ and ZZ production cross sections in proton-proton collisions at $\sqrt{s}$ = 8 TeV in final states where one Z boson decays to b-tagged jets. The other gauge boson, either W or Z, is detected through its leptonic decay (either $ \mathrm{ W \to e\nu, \mu\nu }$ or $ \mathrm{ Z \to e^+ e^-, \mu^+ \mu^- } $, or $\mathrm{ \nu\bar{\nu} } ) $. The results are based on data corresponding to an integrated luminosity of 18.9 inverse-femtobarns collected with the CMS detector at the Large Hadron Collider. The measured cross sections, $\sigma( \mathrm{ pp \to WZ } )$ = 30.7 $\pm$ 9.3 (stat.) $\pm$ 7.1 (syst.) $\pm$ 4.1 (th.) $\pm$ 1.0 (lum.) pb and $\sigma( \mathrm{ pp \to ZZ } )$ = 6.5 $\pm$ 1.7 (stat.) $\pm$ 1.0 (syst.) $\pm$ 0.9 (th.) $\pm$ 0.2 (lum.) pb, are consistent with next-to-leading order quantum chromodynamics calculations. | ||
| Links: e-print arXiv:1403.3047 [hep-ex] (PDF) ; CDS record ; inSPIRE record ; Public twiki page ; HepData record ; CADI line (restricted) ; | ||
| Figures | |
png pdf |
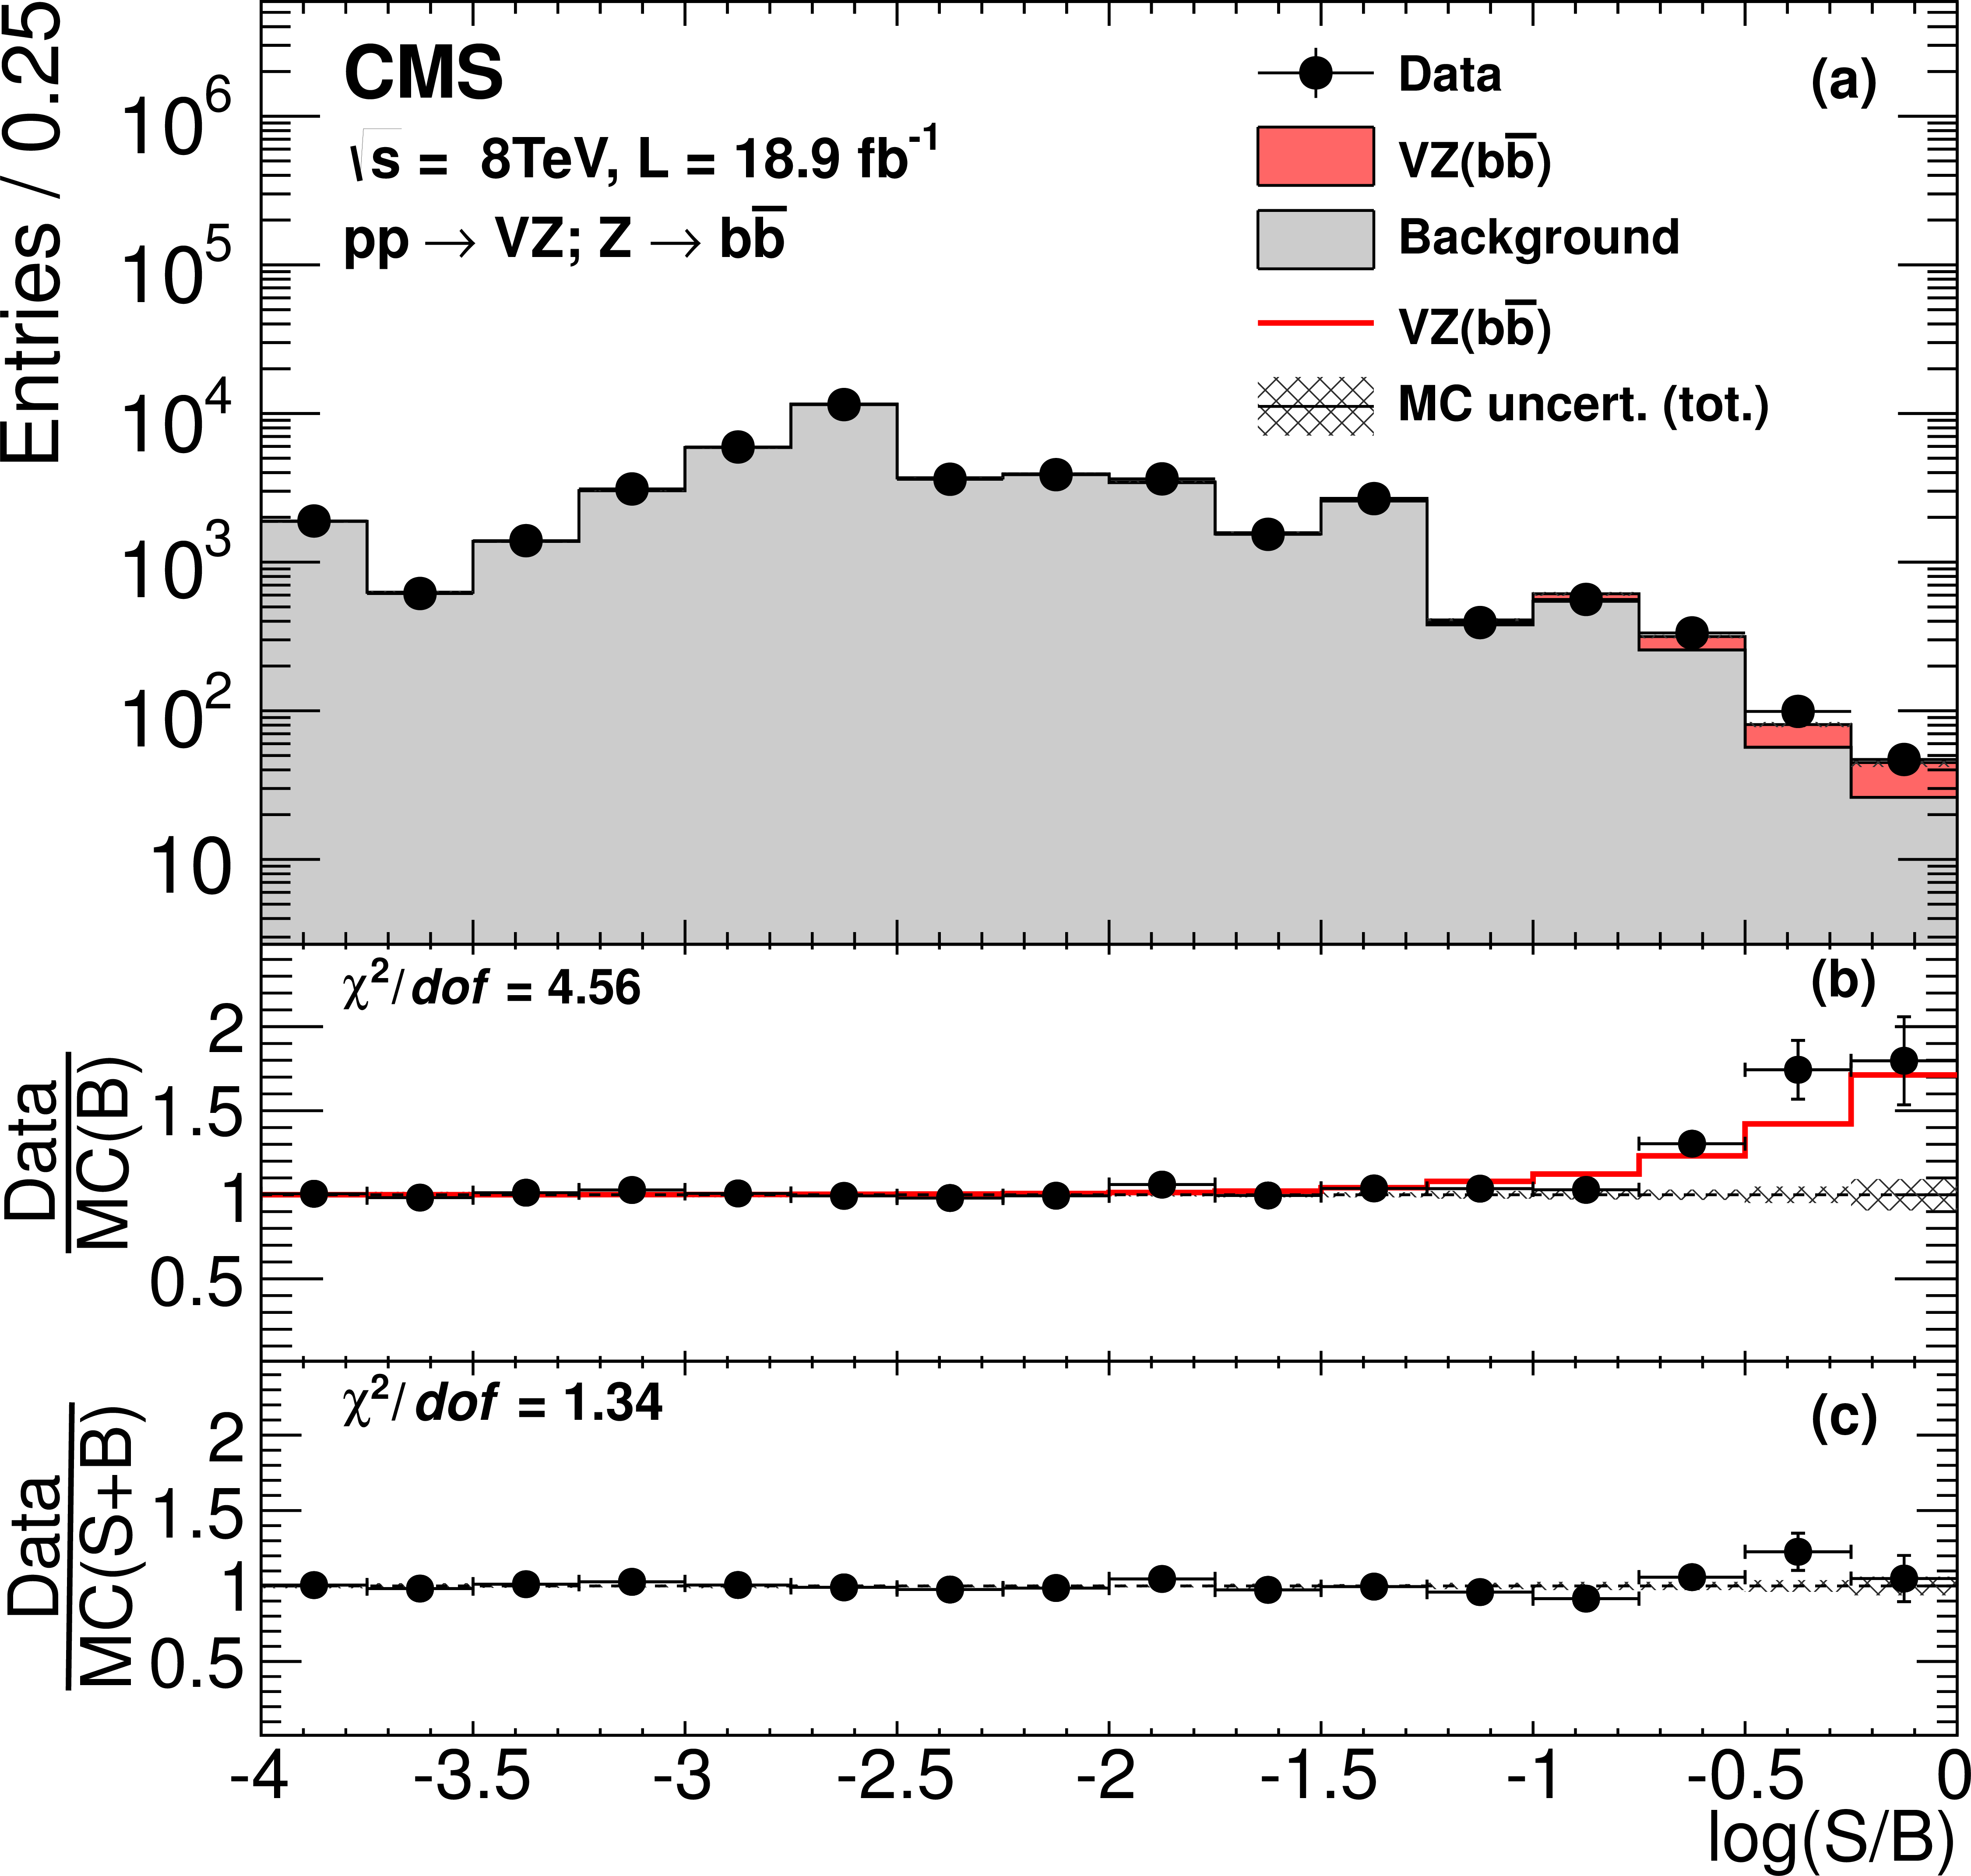
Figure 1:
(a) Combined distribution for all channels in the value of the logarithm of the ratio of signal to background (S/B) discriminants in data and in Monte Carlo (MC) simulations, based on the outputs of the S and B BDT discriminants for each event. The two bottom panels display (b) the ratio of the data and of the SM expectation relative to the background-only hypothesis, and (c) data relative to the expected sum of background and VZ signal. The error bars and the cross-hatched regions reflect total uncertainties at 68% confidence level. |
png pdf |
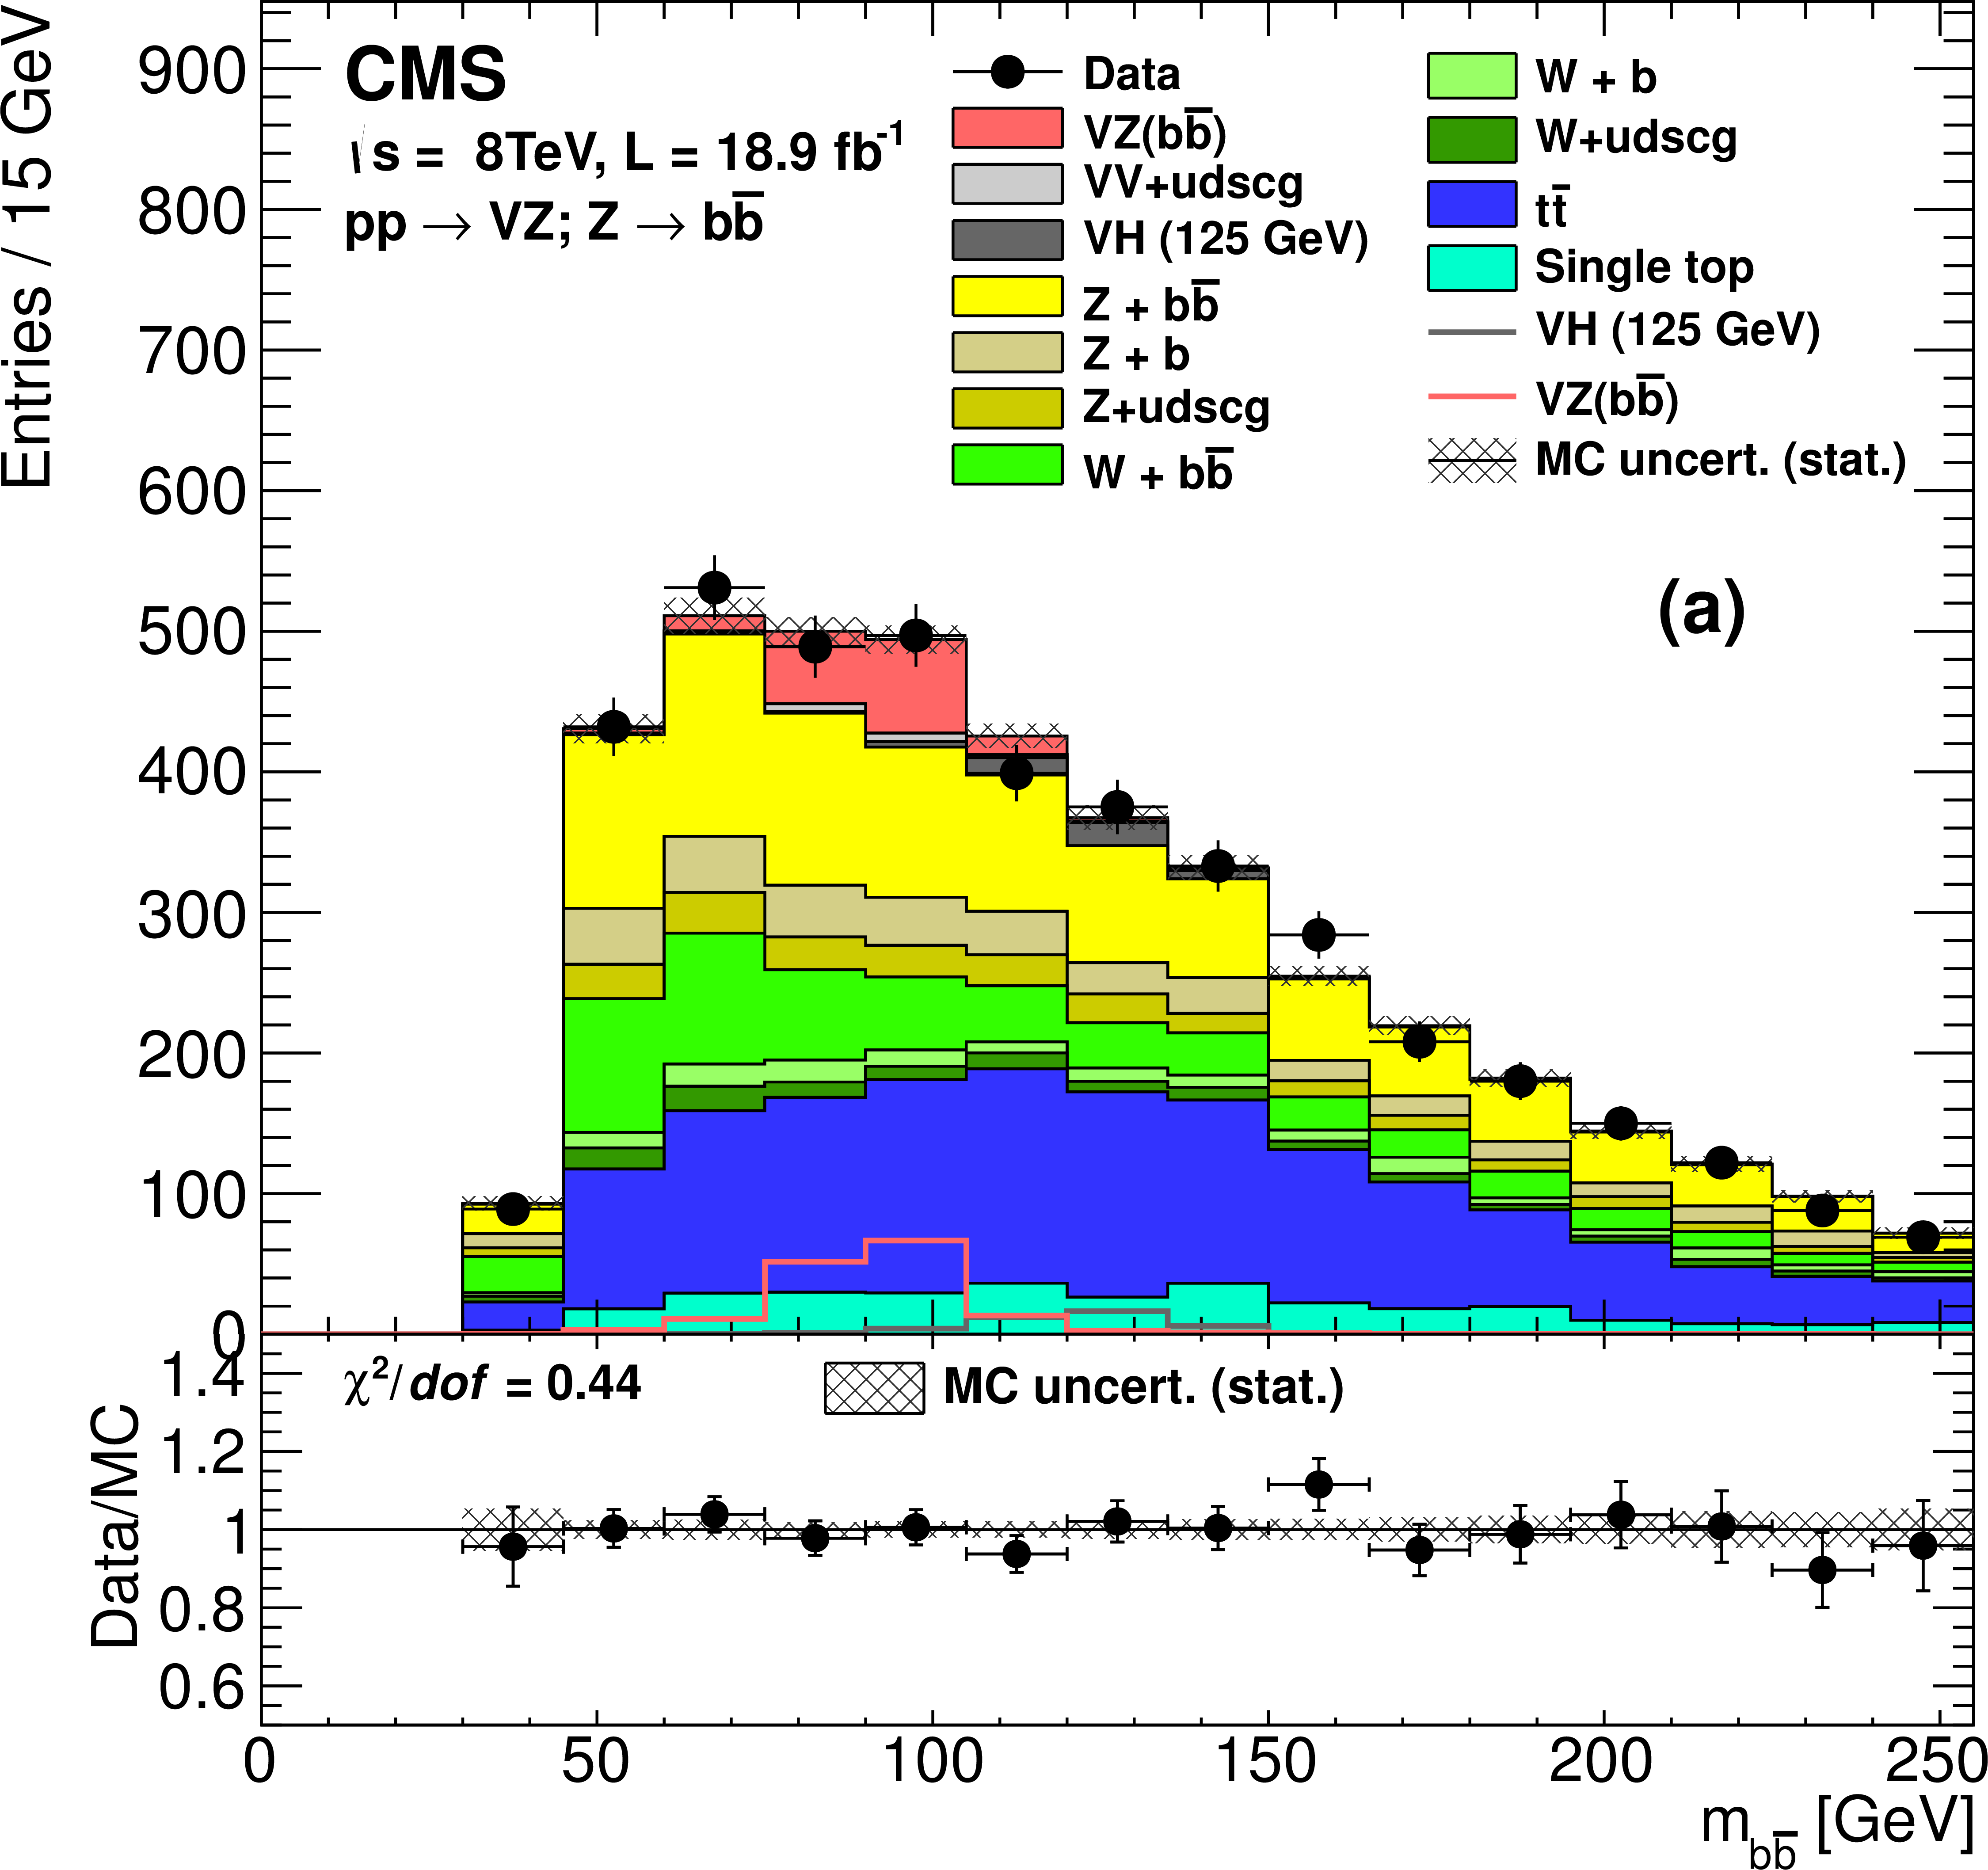
Figure 2-a:
(a) The combined $ { {\mathrm {b}} {\overline {\mathrm {b}}}} $ invariant mass distribution for all channels, compared to MC simulation of SM contributions. (b) Same distribution as in (a), but with all backgrounds to VZ production, except for the VH contribution, subtracted. The contributions from backgrounds and signal are summed cumulatively. The expectations for the sum of VZ signal and background from VH production are also shown superimposed. The error bars and cross-hatched regions reflect statistical uncertainties at 68% confidence level. |

png pdf |
Figure 2-b:
(a) The combined $ { {\mathrm {b}} {\overline {\mathrm {b}}}} $ invariant mass distribution for all channels, compared to MC simulation of SM contributions. (b) Same distribution as in (a), but with all backgrounds to VZ production, except for the VH contribution, subtracted. The contributions from backgrounds and signal are summed cumulatively. The expectations for the sum of VZ signal and background from VH production are also shown superimposed. The error bars and cross-hatched regions reflect statistical uncertainties at 68% confidence level. |
png pdf |
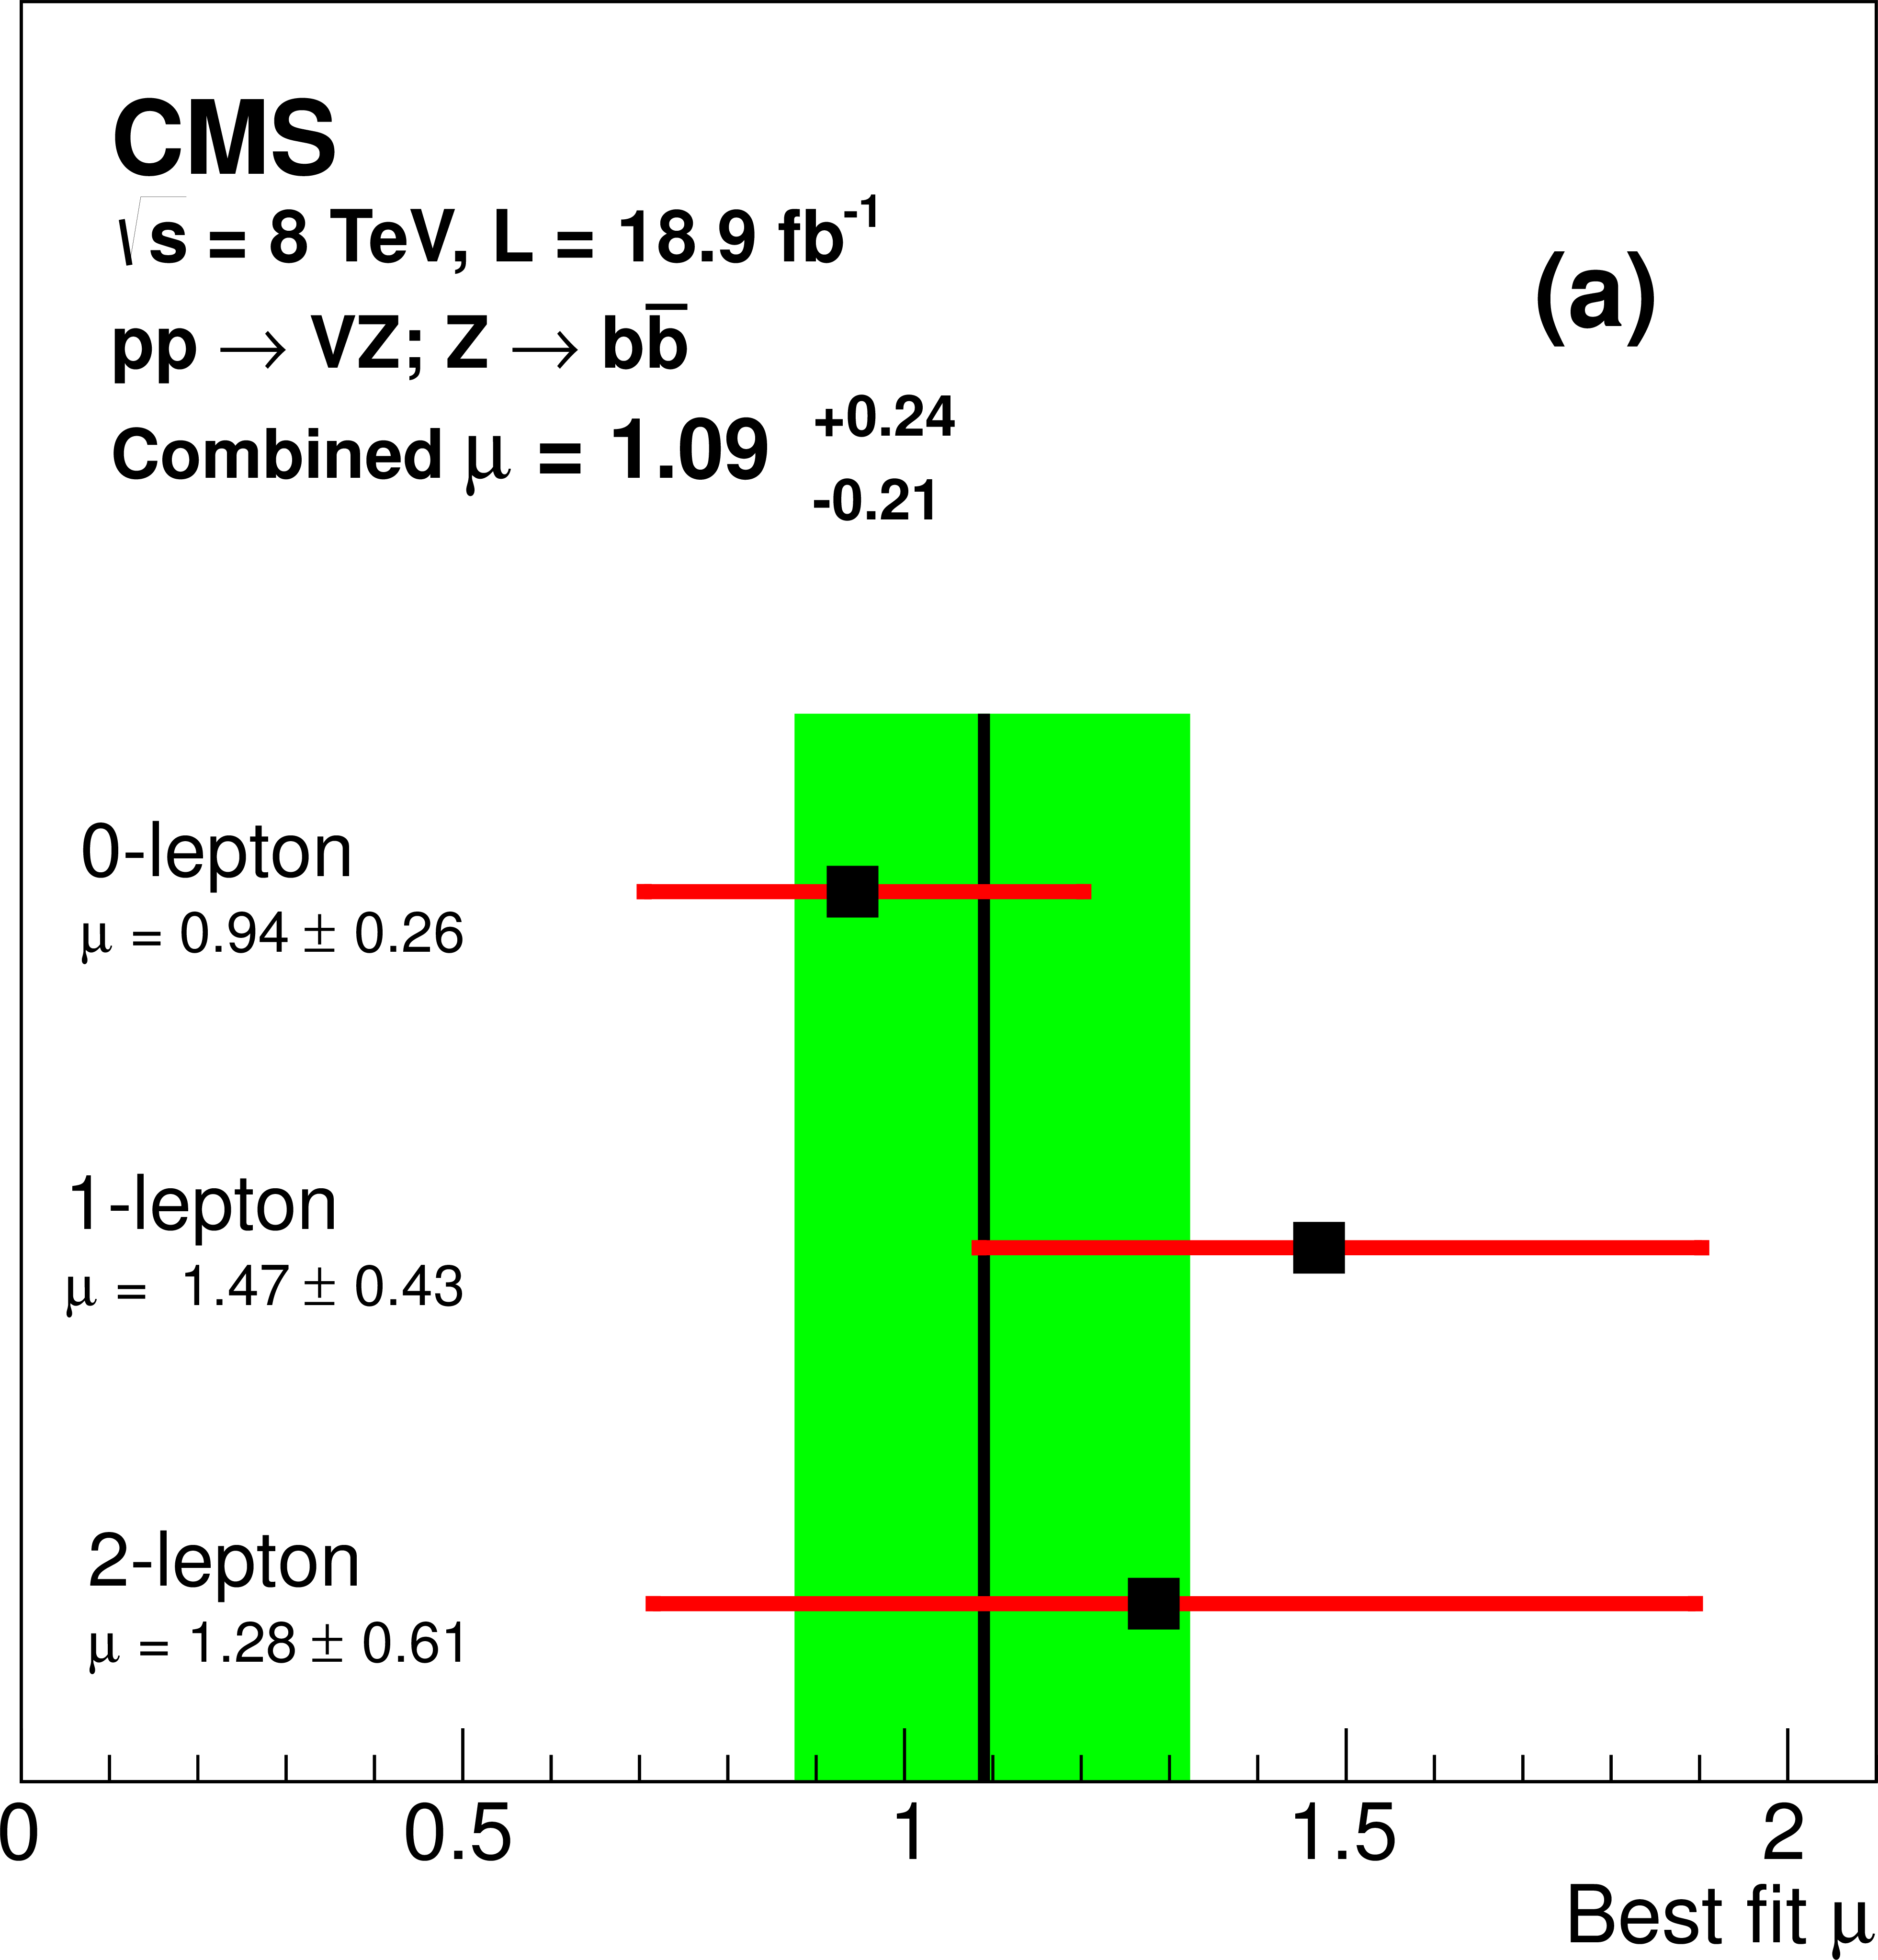
Figure 3-a:
(a) Best-fit values of the ratios of the VZ production cross sections, relative to SM predictions for individual channels, and for all channels combined (hatched band). (b) Contours of 68% and 95% confidence level for WZ and ZZ production cross sections. The large cross indicates the best-fit value including its 68% statistical uncertainty, and the light small cross shows the result for the MCFM NLO calculation. |
png pdf |
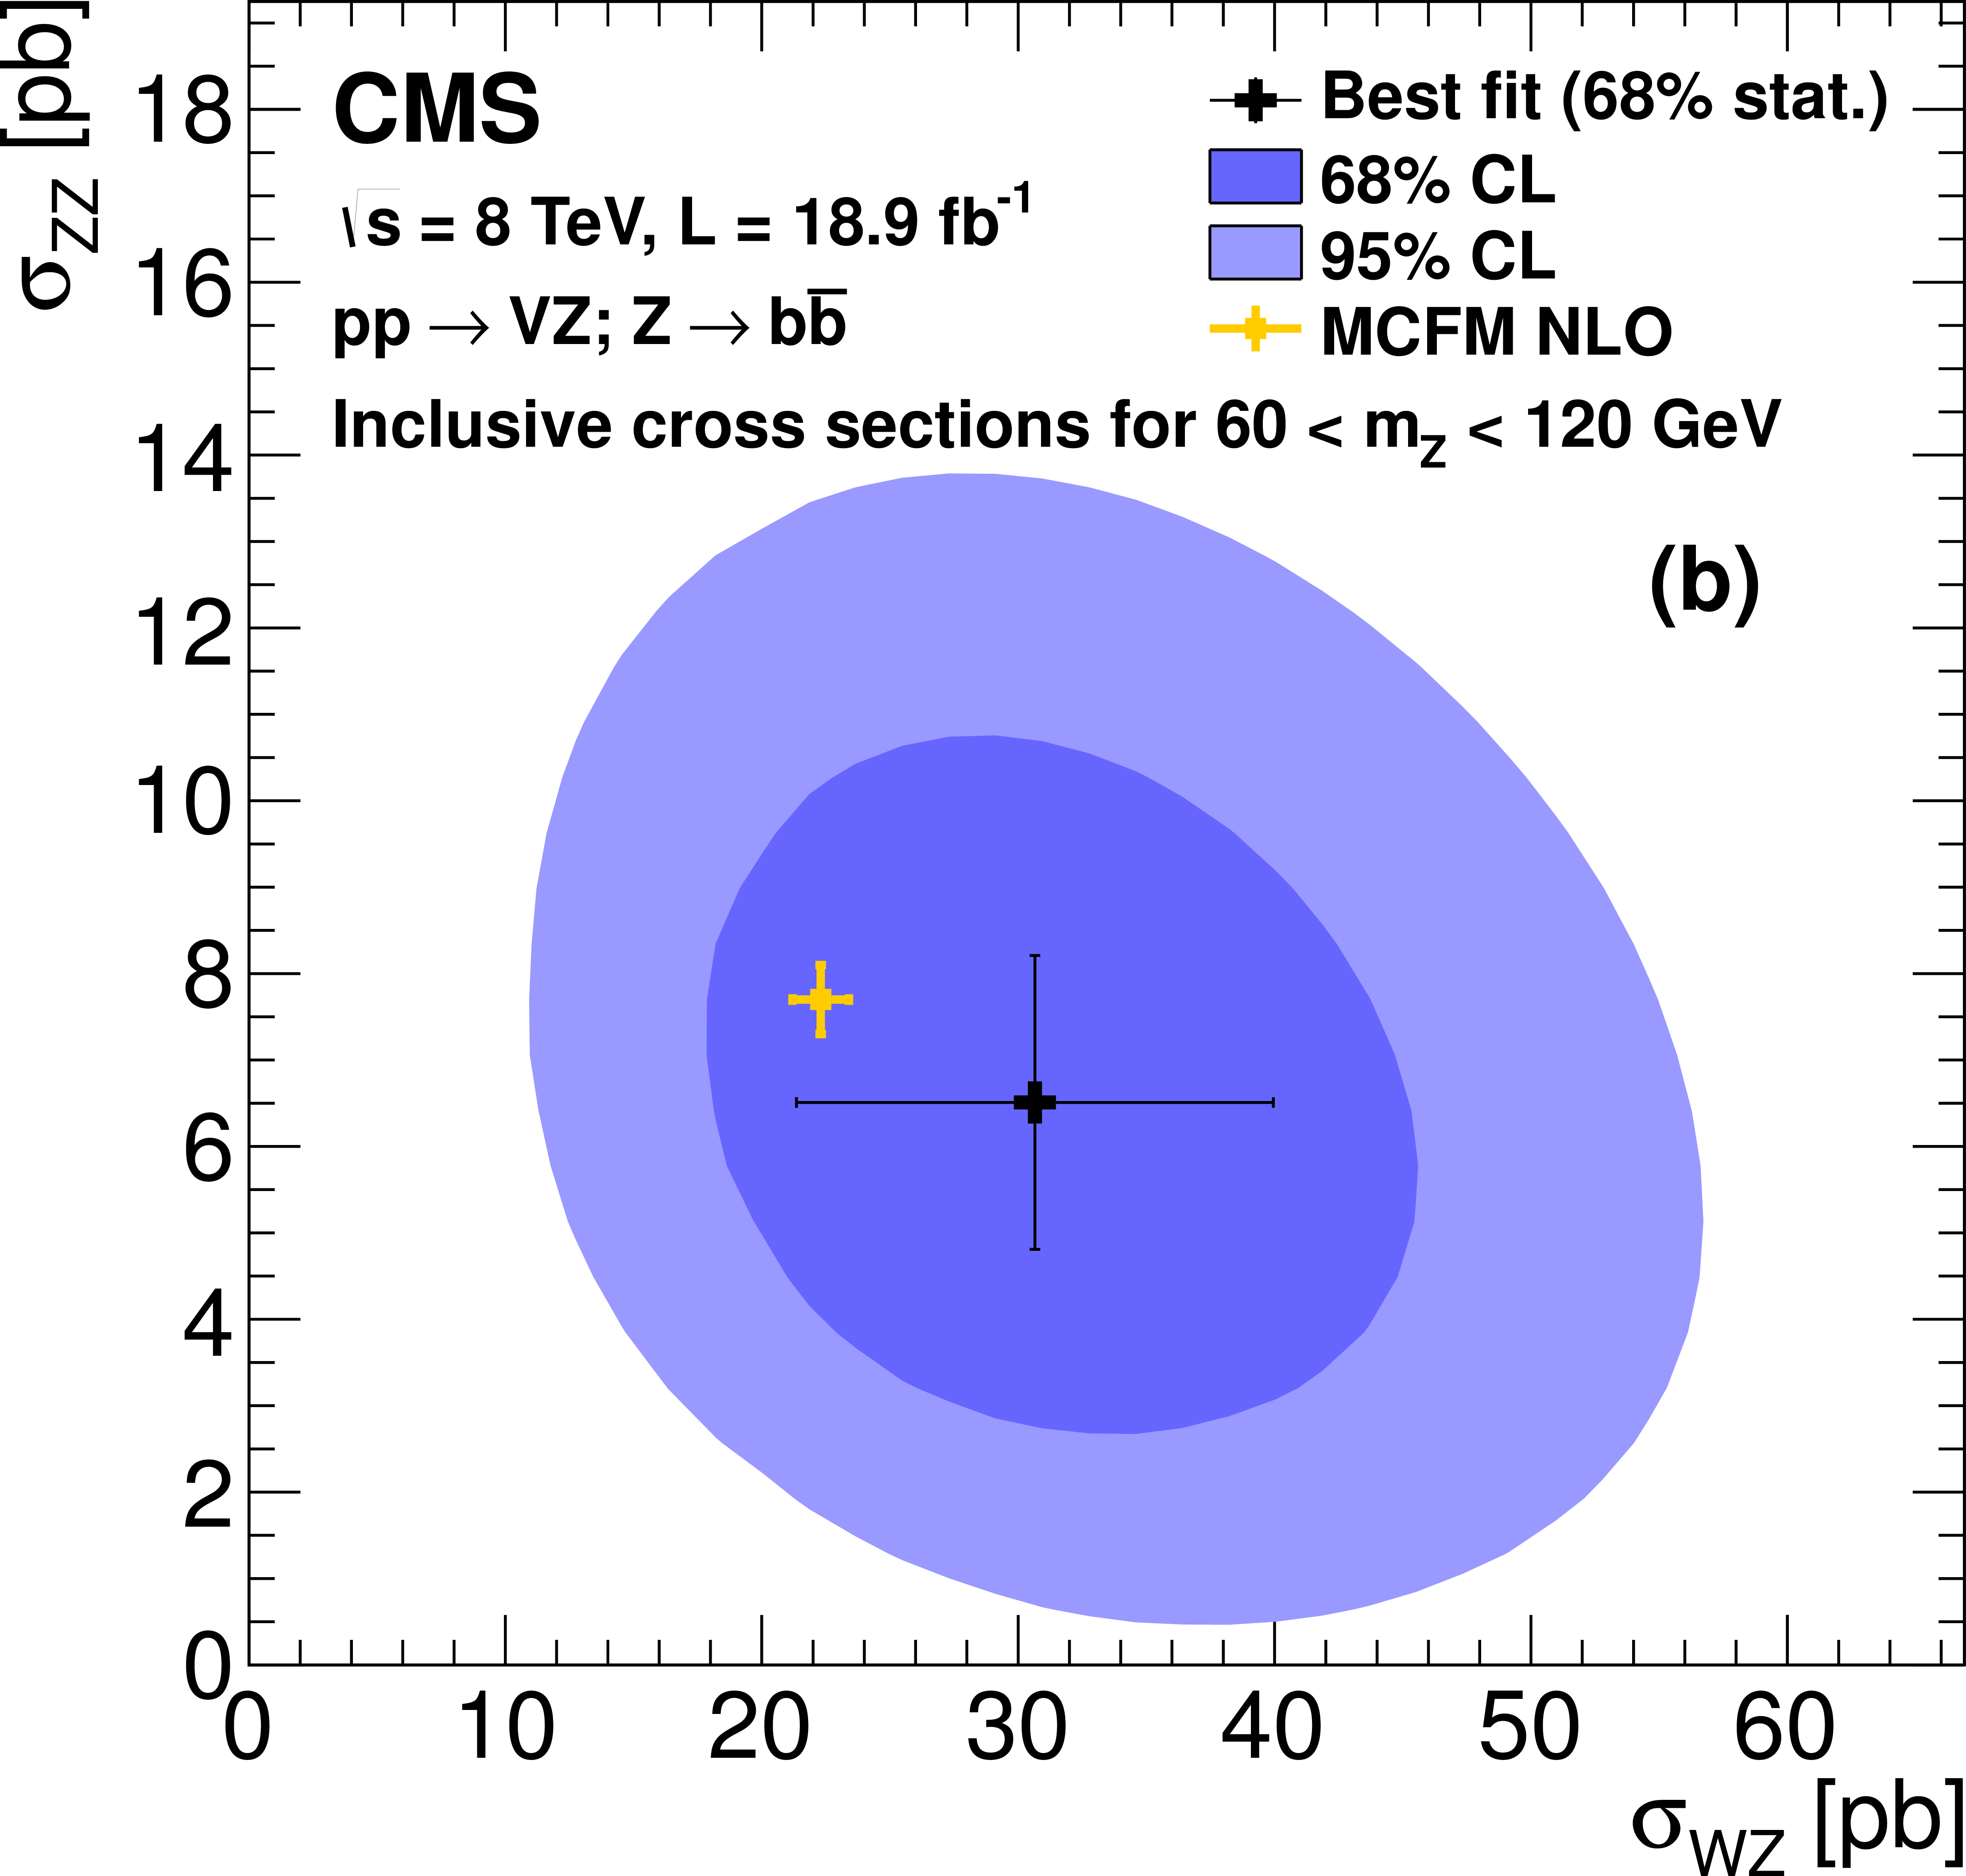
Figure 3-b:
(a) Best-fit values of the ratios of the VZ production cross sections, relative to SM predictions for individual channels, and for all channels combined (hatched band). (b) Contours of 68% and 95% confidence level for WZ and ZZ production cross sections. The large cross indicates the best-fit value including its 68% statistical uncertainty, and the light small cross shows the result for the MCFM NLO calculation. |
|
|
Compact Muon Solenoid LHC, CERN |
|

|

|

|

|

|