

Compact Muon Solenoid
LHC, CERN
| CMS-SMP-13-014 ; CERN-PH-EP-2014-303 | ||
| Measurement of the Z$\gamma$ production cross section in pp collisions at 8 TeV and search for anomalous triple gauge boson couplings | ||
| CMS Collaboration | ||
| 19 February 2015 | ||
| J. High Energy Phys. 04 (2015) 164 | ||
| Abstract: The cross section for the production of Z$\gamma$ in proton-proton collisions at 8 TeV is measured based on data collected by the CMS experiment at the LHC corresponding to an integrated luminosity of 19.5 fb$^{-1}$. Events with an oppositely-charged pair of muons or electrons together with an isolated photon are selected. The differential cross section as a function of the photon transverse momentum is measured inclusively and exclusively, where the exclusive selection applies a veto on central jets. The observed cross sections are compatible with the expectations of next-to-next-to-leading-order quantum chromodynamics. Limits on anomalous triple gauge couplings of ZZ$\gamma$ and Z$\gamma\gamma$ are set that improve on previous experimental results obtained with the charged lepton decay modes of the Z boson. | ||
| Links: e-print arXiv:1502.05664 [hep-ex] (PDF) ; CDS record ; inSPIRE record ; Public twiki page ; HepData record ; CADI line (restricted) ; | ||
| Figures | Additional Figures | CMS Publications |
|---|
| Figures | |
png pdf |
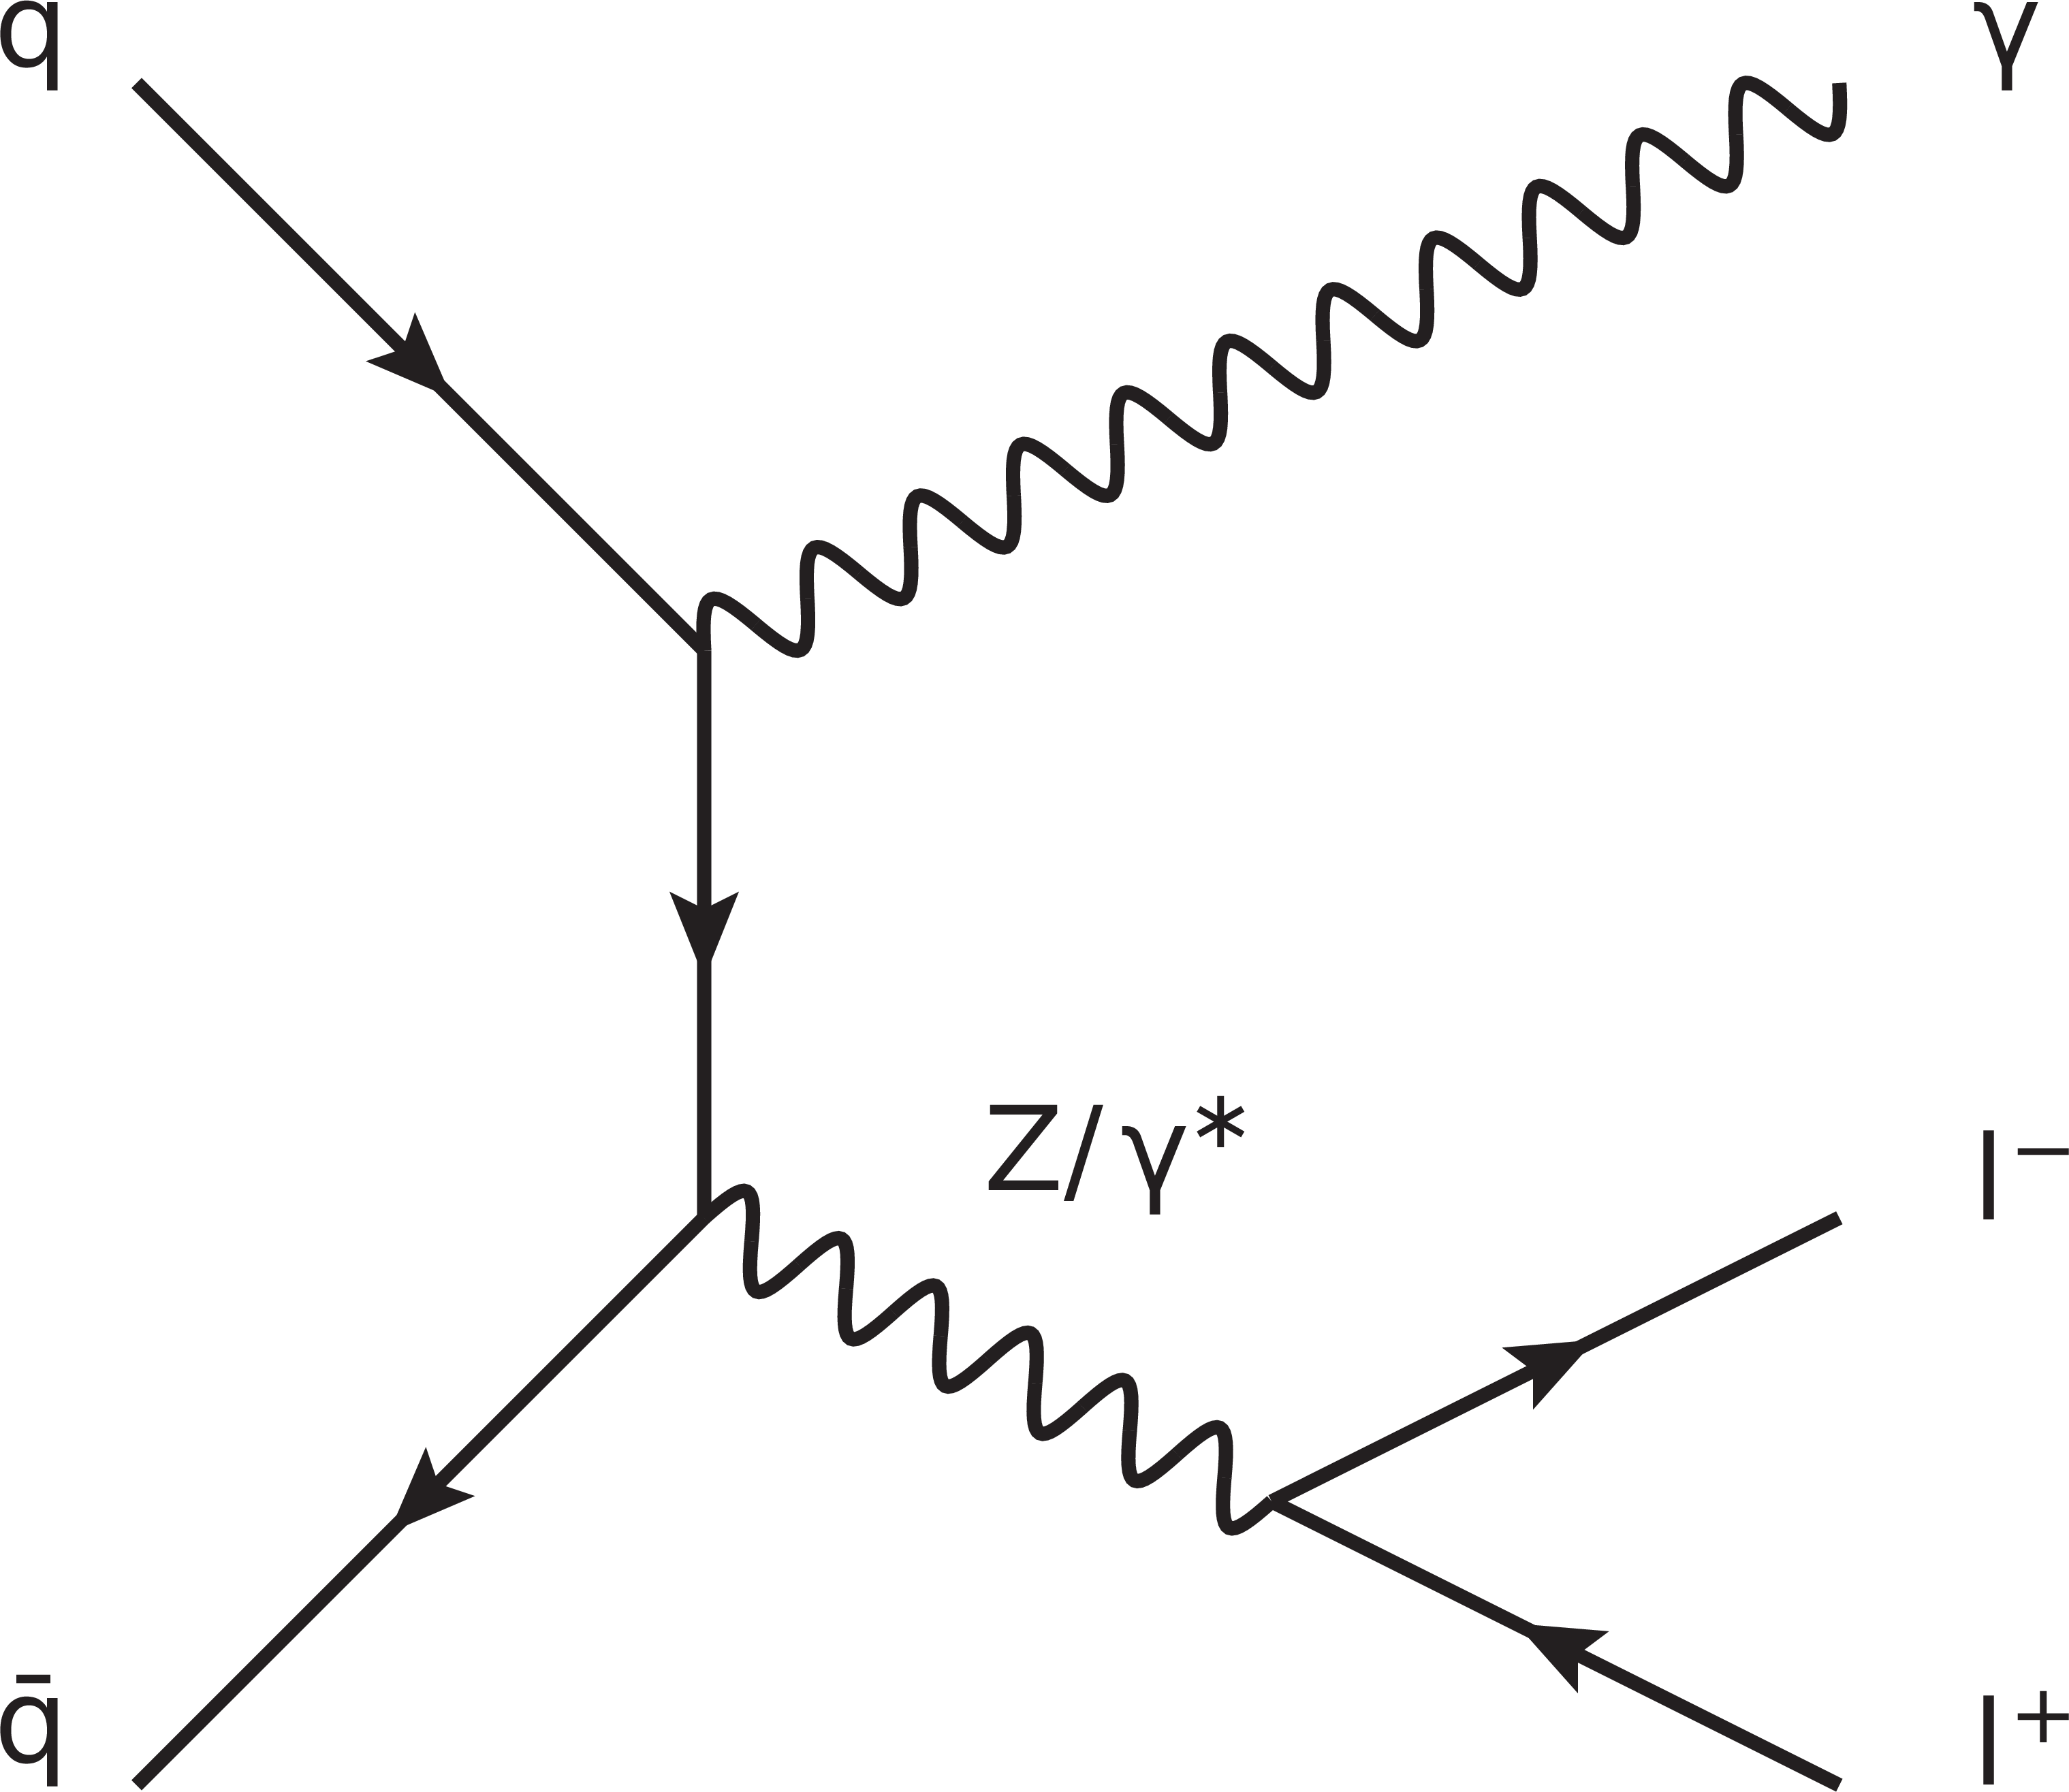
Figure 1-a:
Leading-order Feynman diagrams for $ { {\mathrm {Z}} \gamma } $ production in pp collisions. a: initial-state radiation. Center: final-state radiation. b: diagram involving aTGC's that are forbidden in the SM at tree level. |

png pdf |
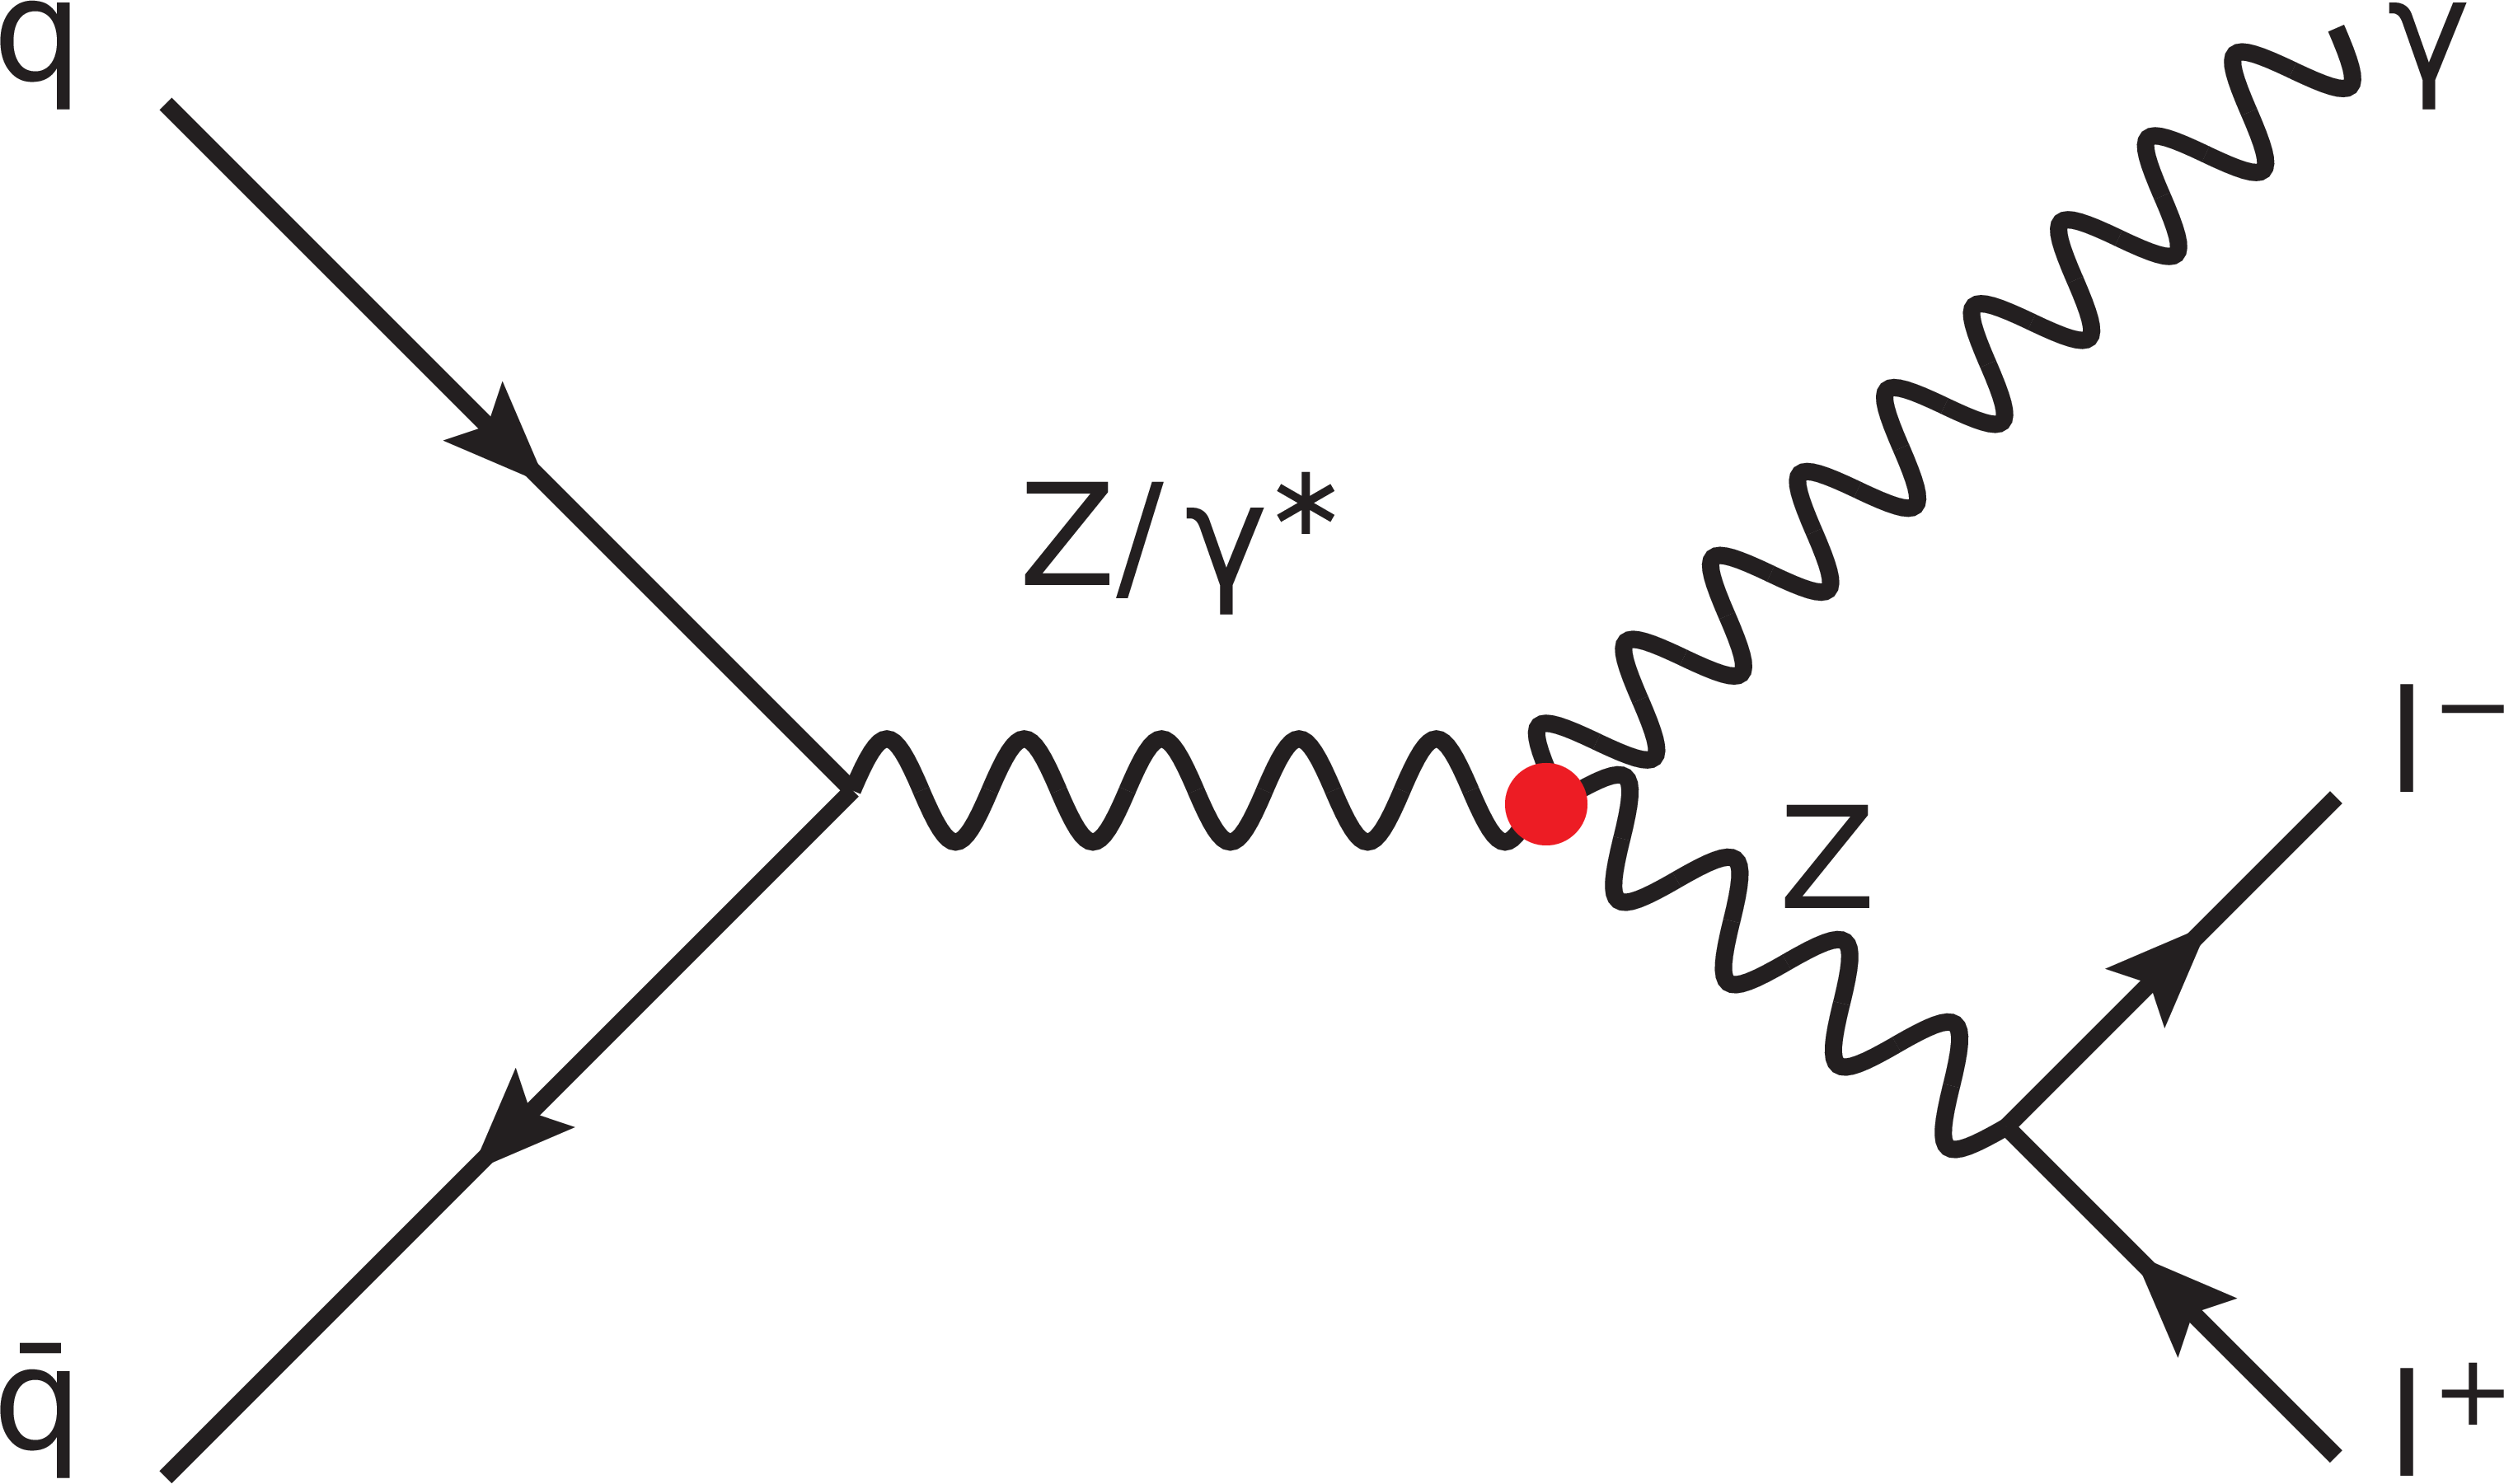
Figure 1-b:
Leading-order Feynman diagrams for $ { {\mathrm {Z}} \gamma } $ production in pp collisions. a: initial-state radiation. Center: final-state radiation. b: diagram involving aTGC's that are forbidden in the SM at tree level. |
png pdf |
Figure 1-c:
Leading-order Feynman diagrams for $ { {\mathrm {Z}} \gamma } $ production in pp collisions. a: initial-state radiation. Center: final-state radiation. b: diagram involving aTGC's that are forbidden in the SM at tree level. |
png pdf |
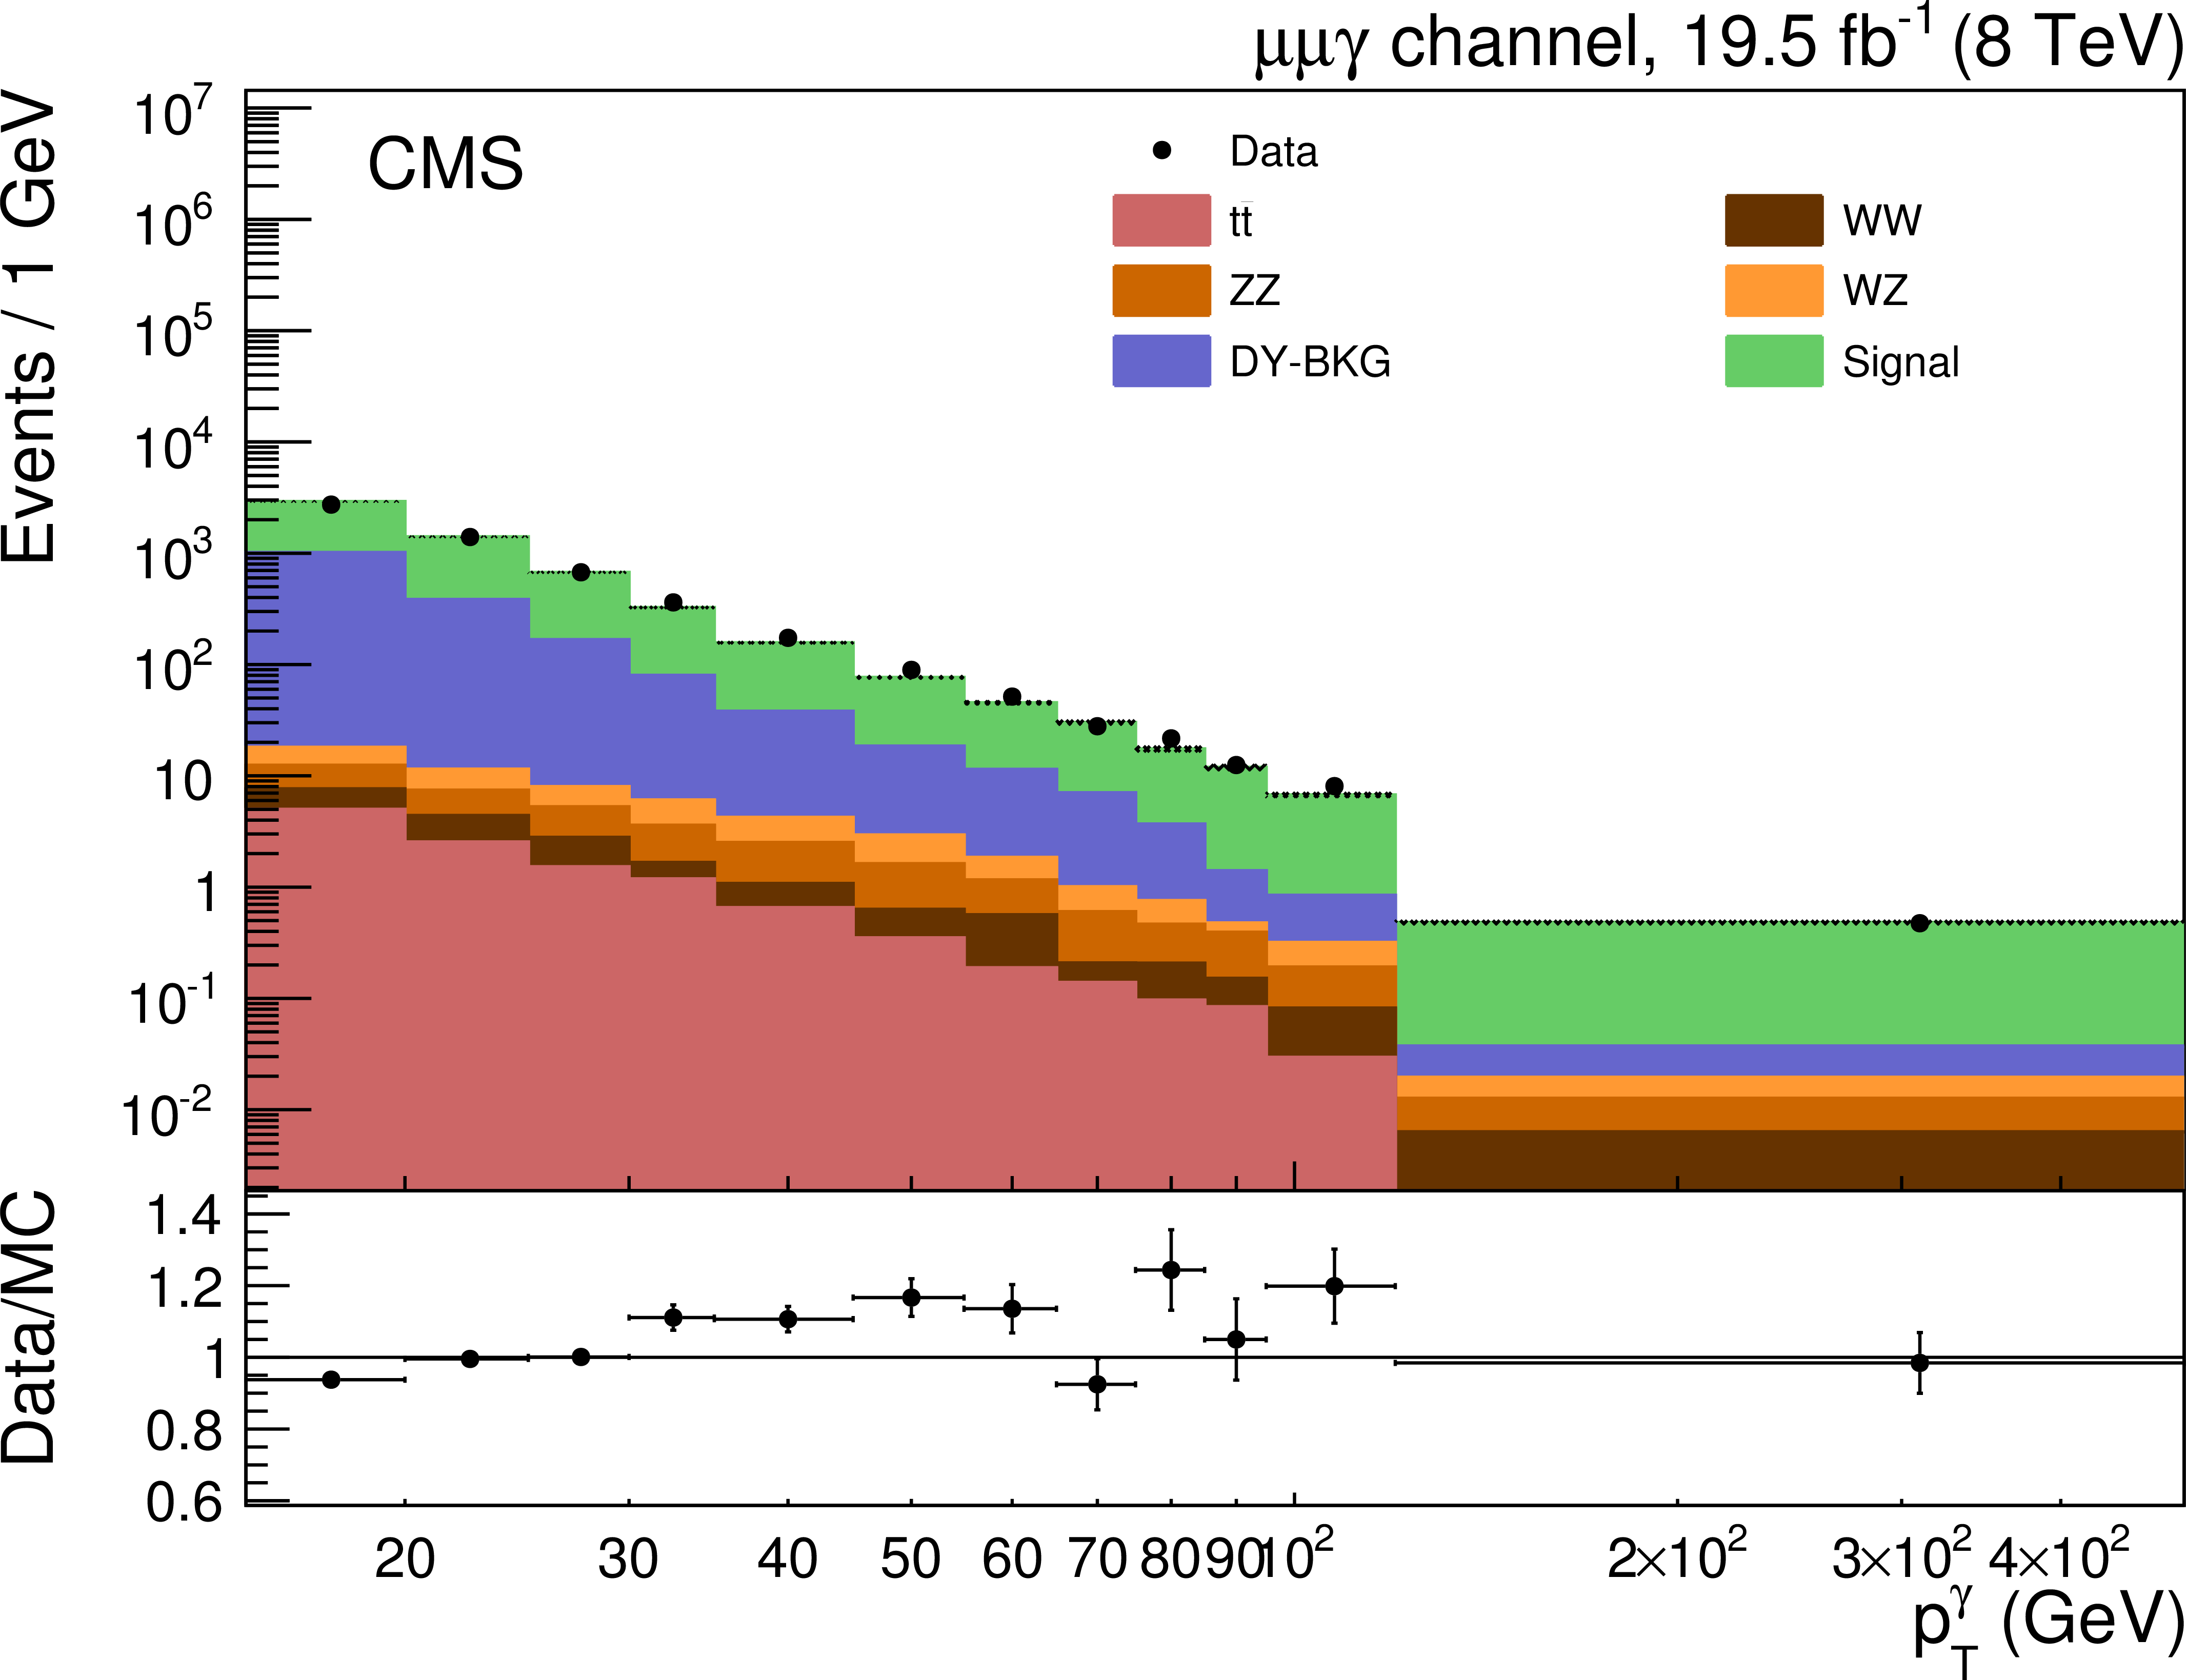
Figure 2-a:
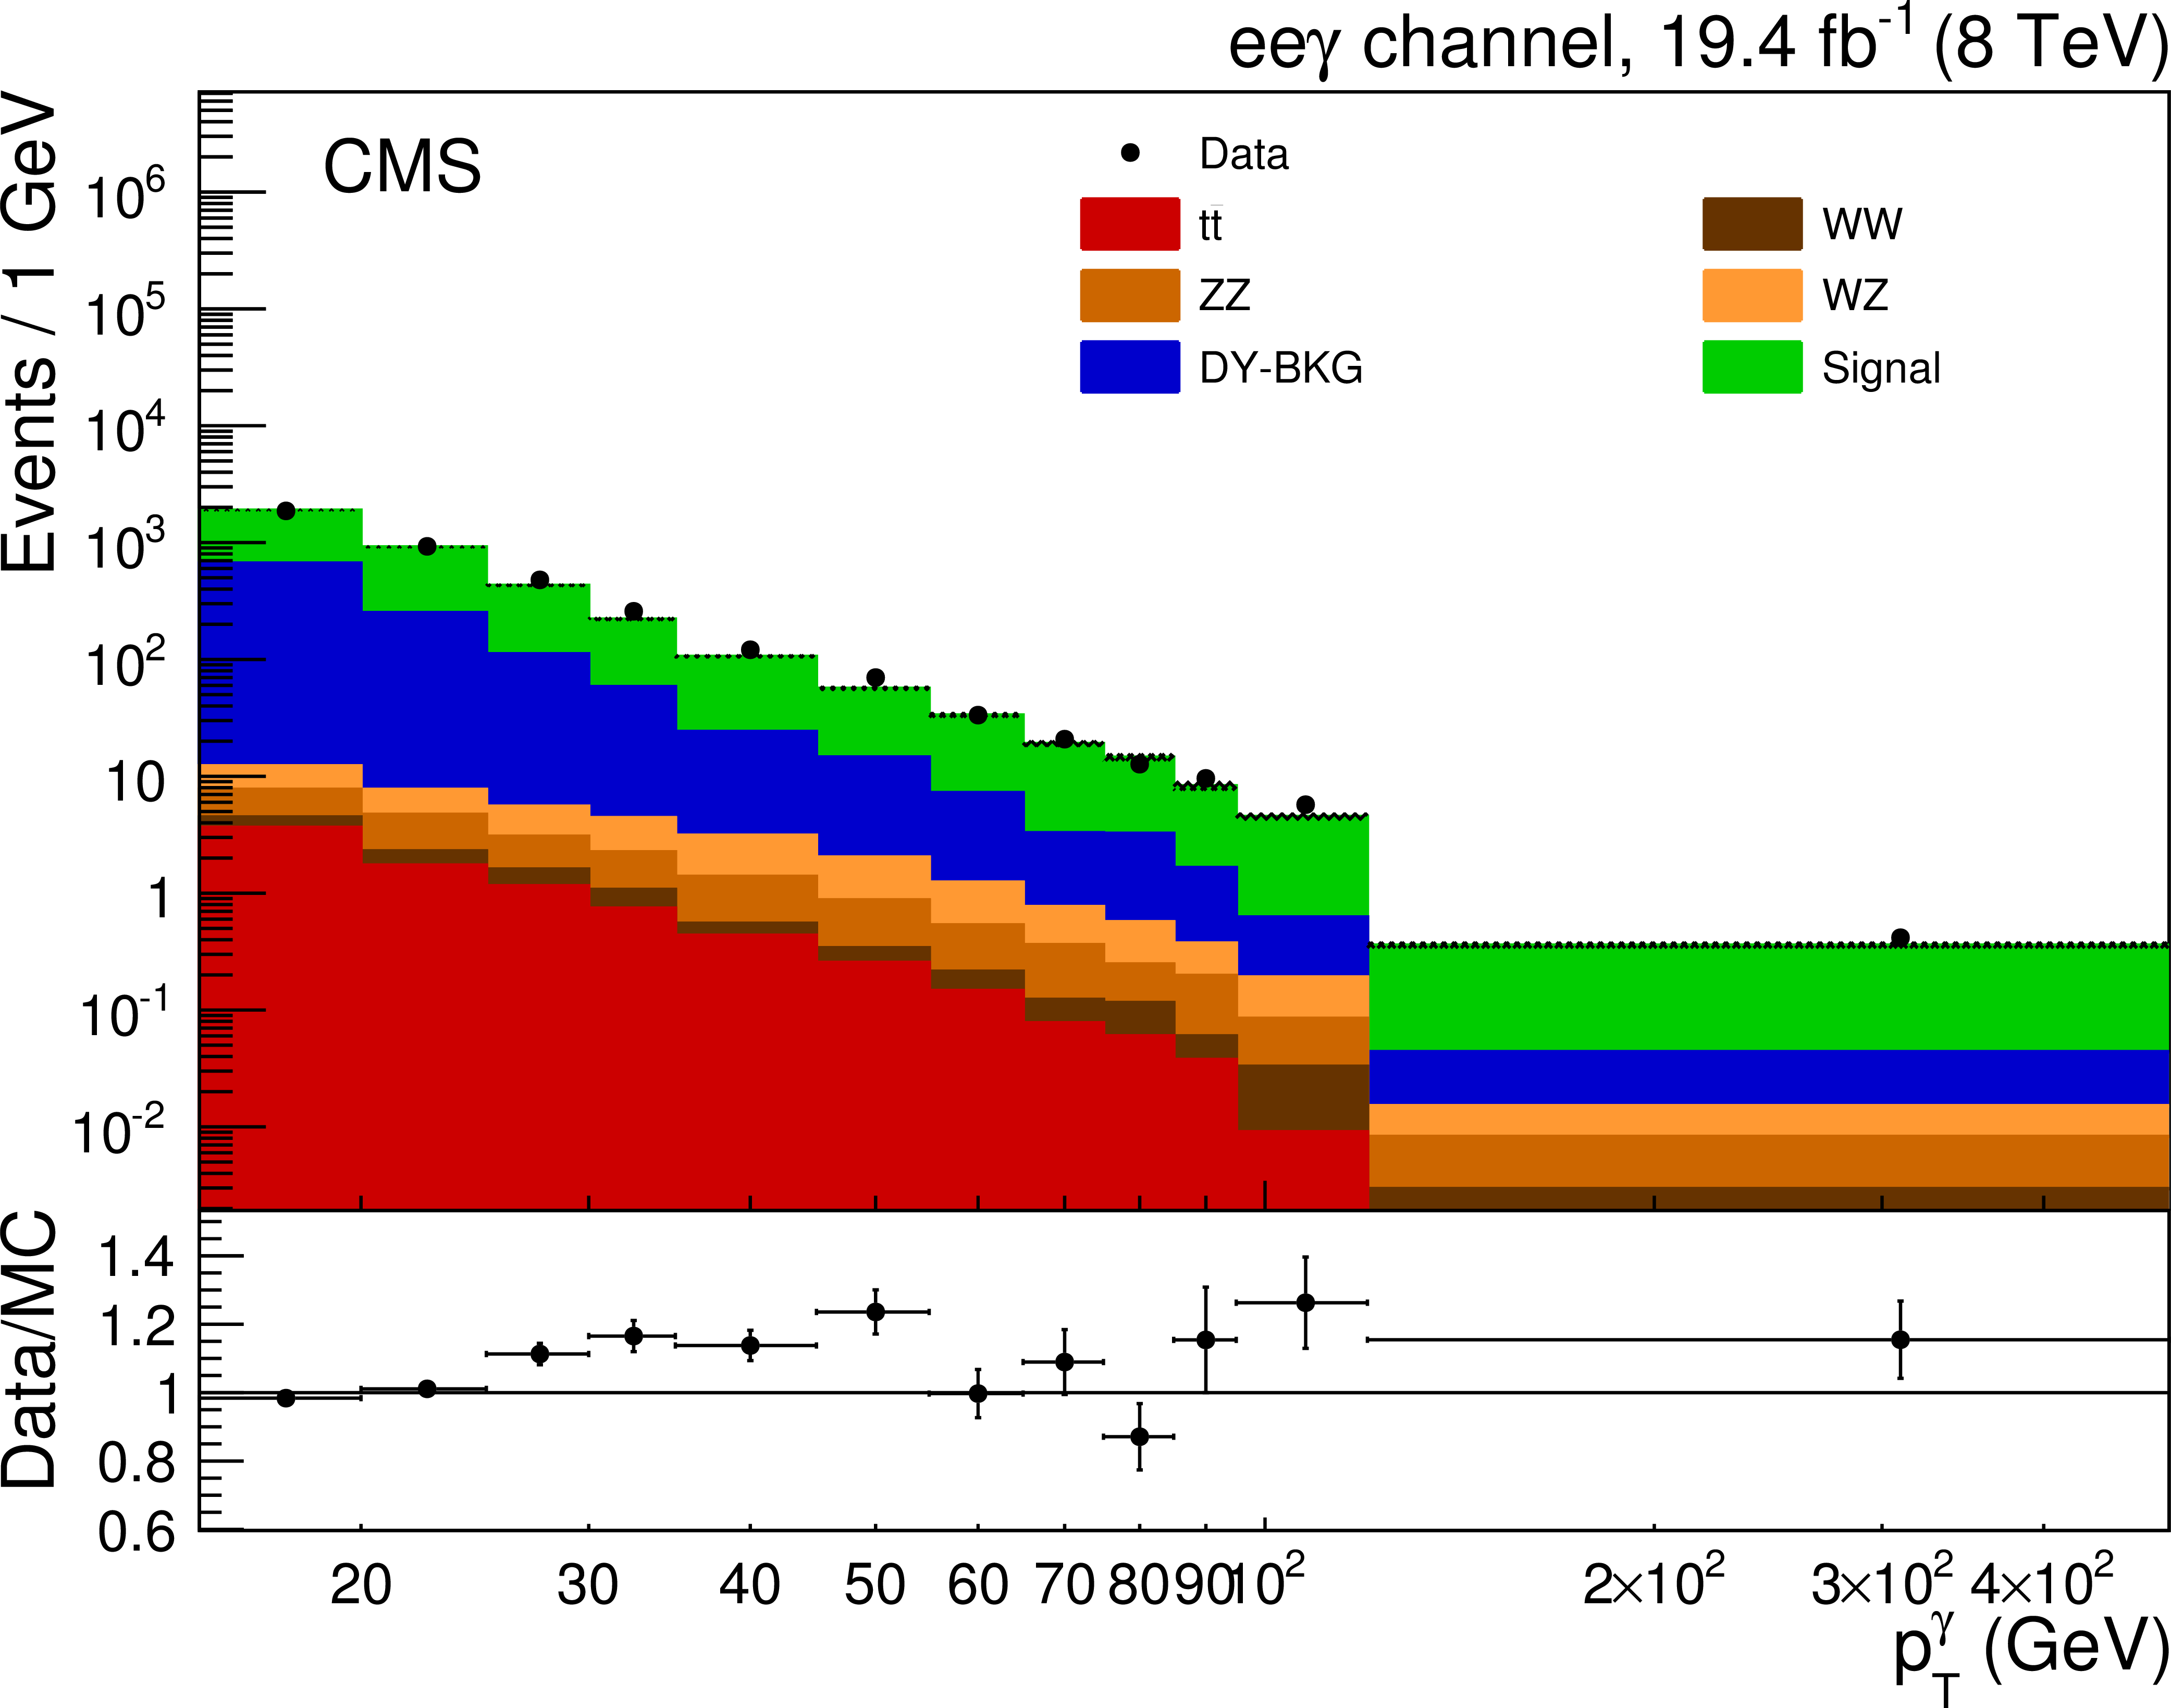
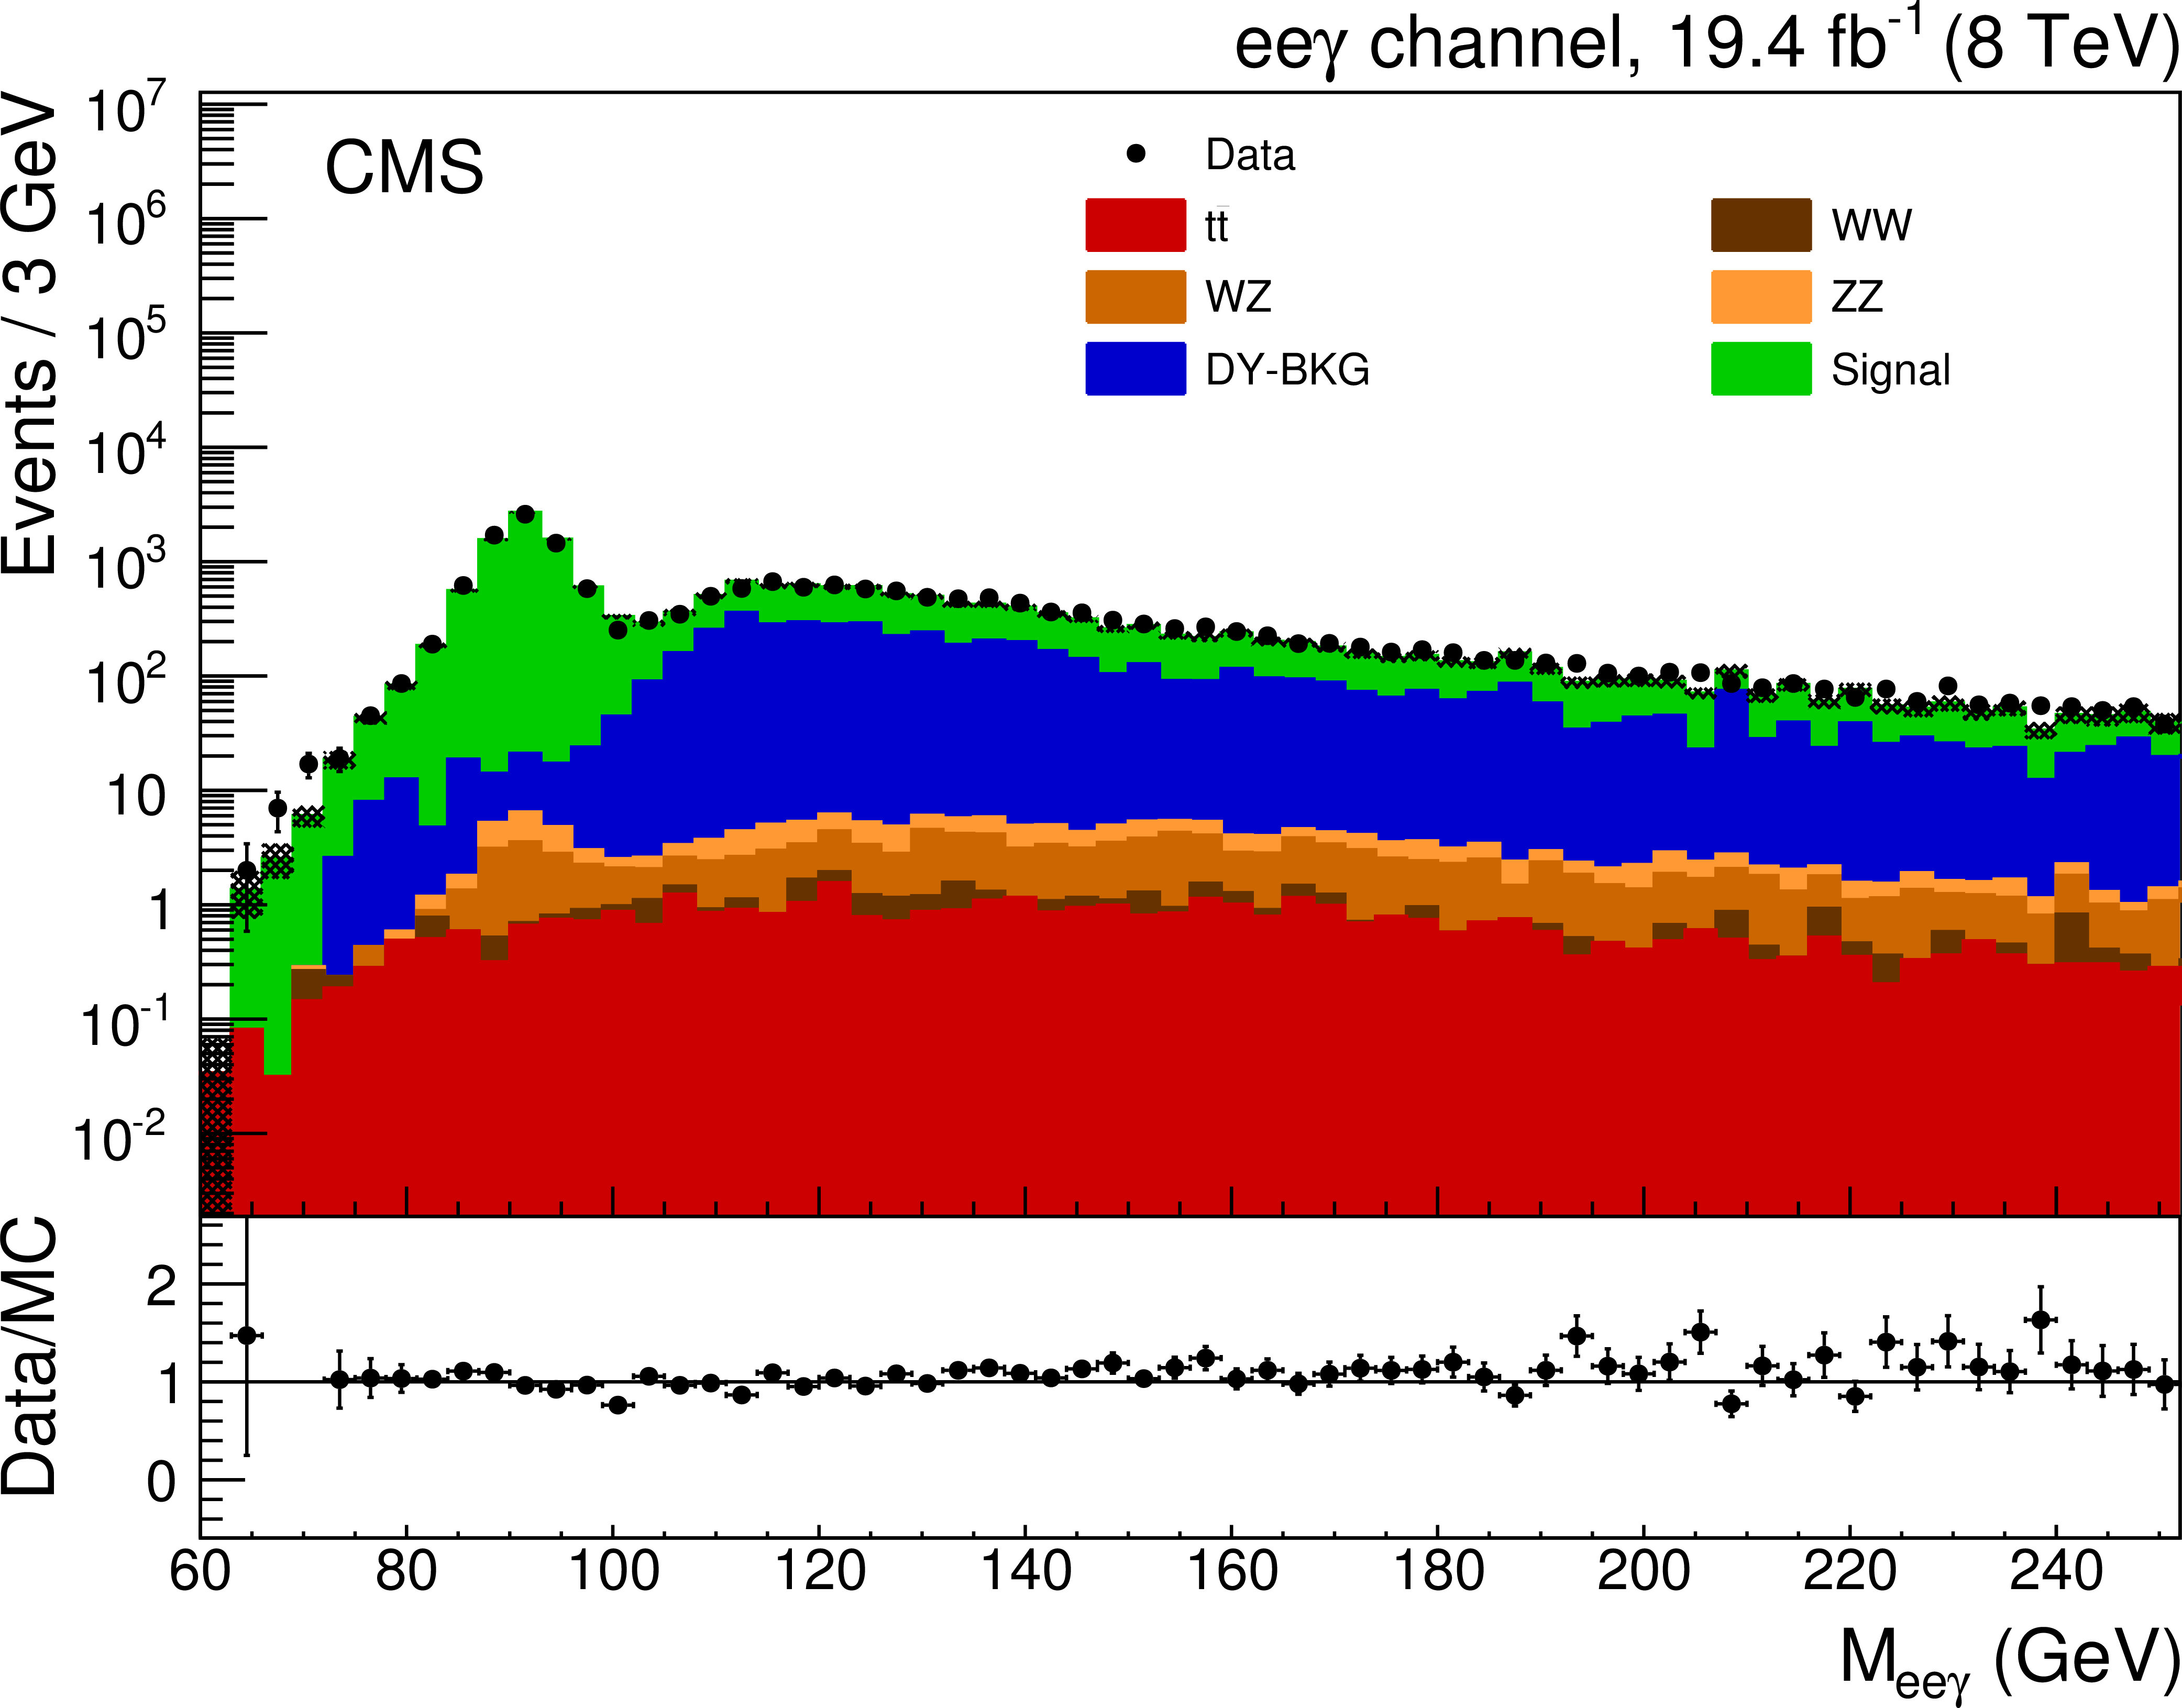
a: $ {p_{\mathrm {T}}^\gamma } $ distribution after the full event selection compared to the SM prediction. b: the distribution of the invariant mass $M_{\ell \ell \gamma }$. The mass distribution has a peak at the Z boson mass, which arises from FSR photons. Events with ISR photons appear in the large tail above the Z boson mass where a large fraction of background is expected. The displayed uncertainties include only the statistical uncertainties in data and simulated samples. |
png pdf |
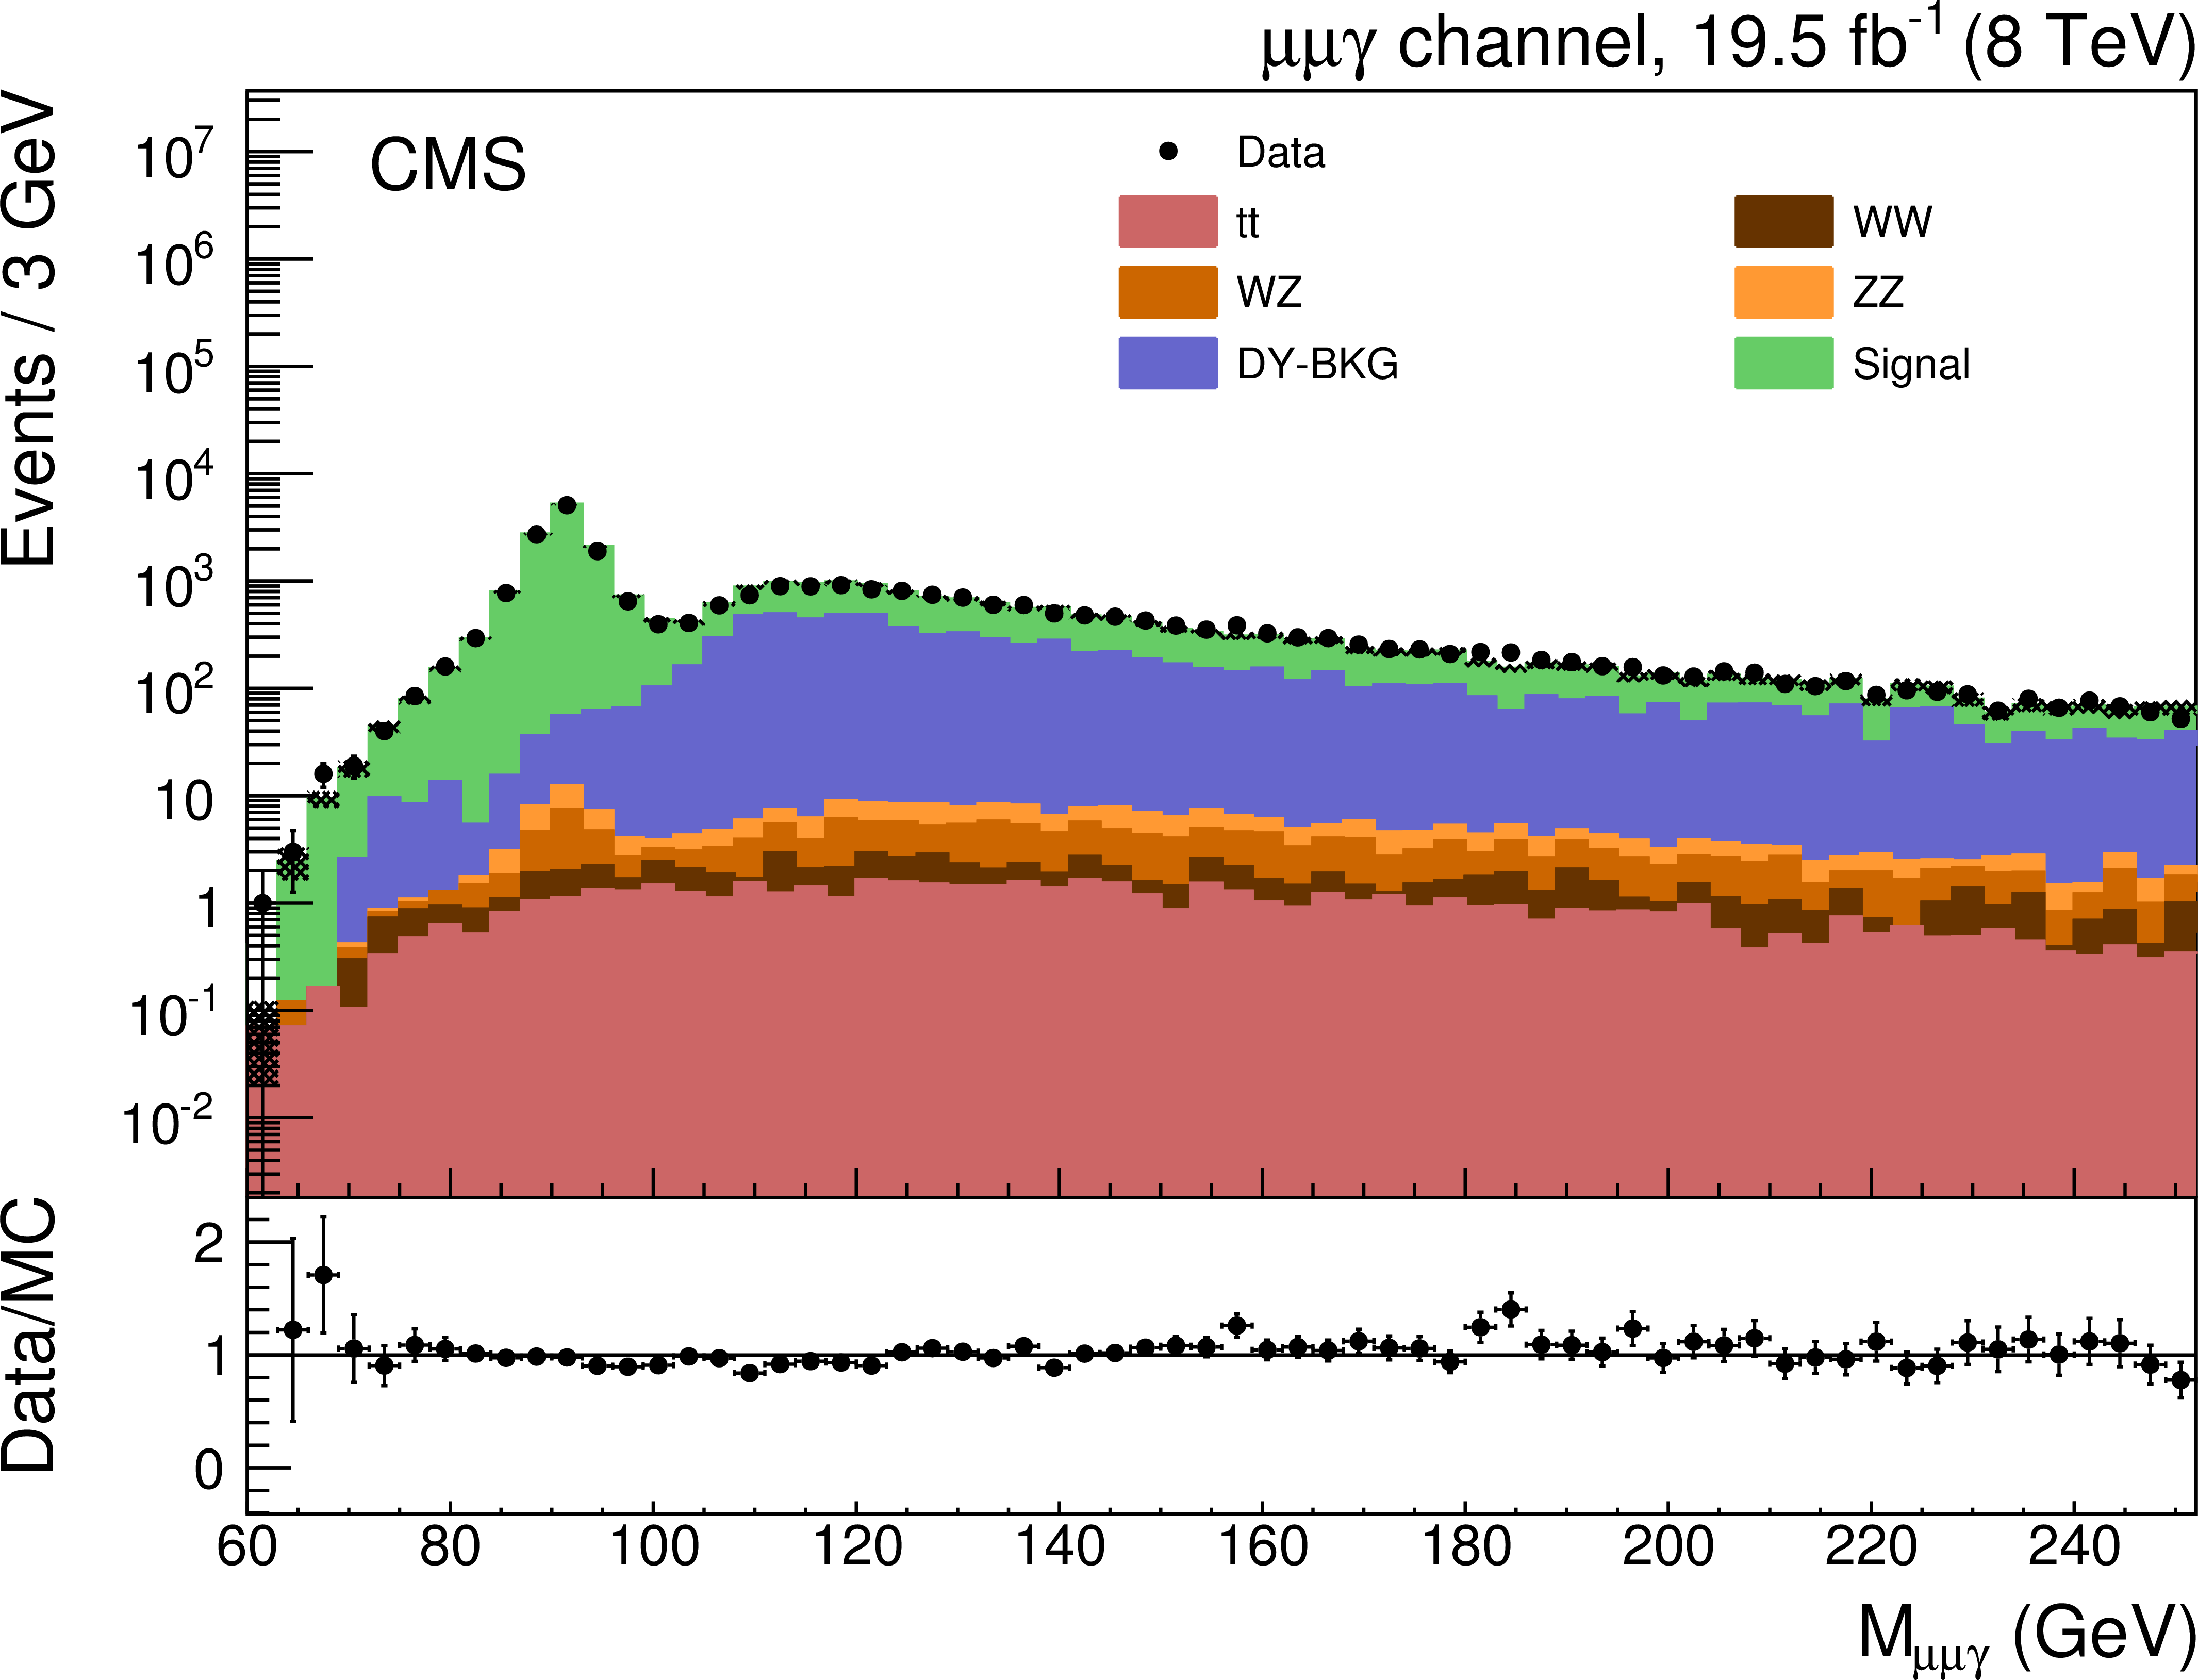
Figure 2-b:
a: $ {p_{\mathrm {T}}^\gamma } $ distribution after the full event selection compared to the SM prediction. b: the distribution of the invariant mass $M_{\ell \ell \gamma }$. The mass distribution has a peak at the Z boson mass, which arises from FSR photons. Events with ISR photons appear in the large tail above the Z boson mass where a large fraction of background is expected. The displayed uncertainties include only the statistical uncertainties in data and simulated samples. |
png pdf |
Figure 2-c:
a: $ {p_{\mathrm {T}}^\gamma } $ distribution after the full event selection compared to the SM prediction. b: the distribution of the invariant mass $M_{\ell \ell \gamma }$. The mass distribution has a peak at the Z boson mass, which arises from FSR photons. Events with ISR photons appear in the large tail above the Z boson mass where a large fraction of background is expected. The displayed uncertainties include only the statistical uncertainties in data and simulated samples. |
png pdf |
Figure 2-d:
a: $ {p_{\mathrm {T}}^\gamma } $ distribution after the full event selection compared to the SM prediction. b: the distribution of the invariant mass $M_{\ell \ell \gamma }$. The mass distribution has a peak at the Z boson mass, which arises from FSR photons. Events with ISR photons appear in the large tail above the Z boson mass where a large fraction of background is expected. The displayed uncertainties include only the statistical uncertainties in data and simulated samples. |
png pdf |
Figure 3-a:
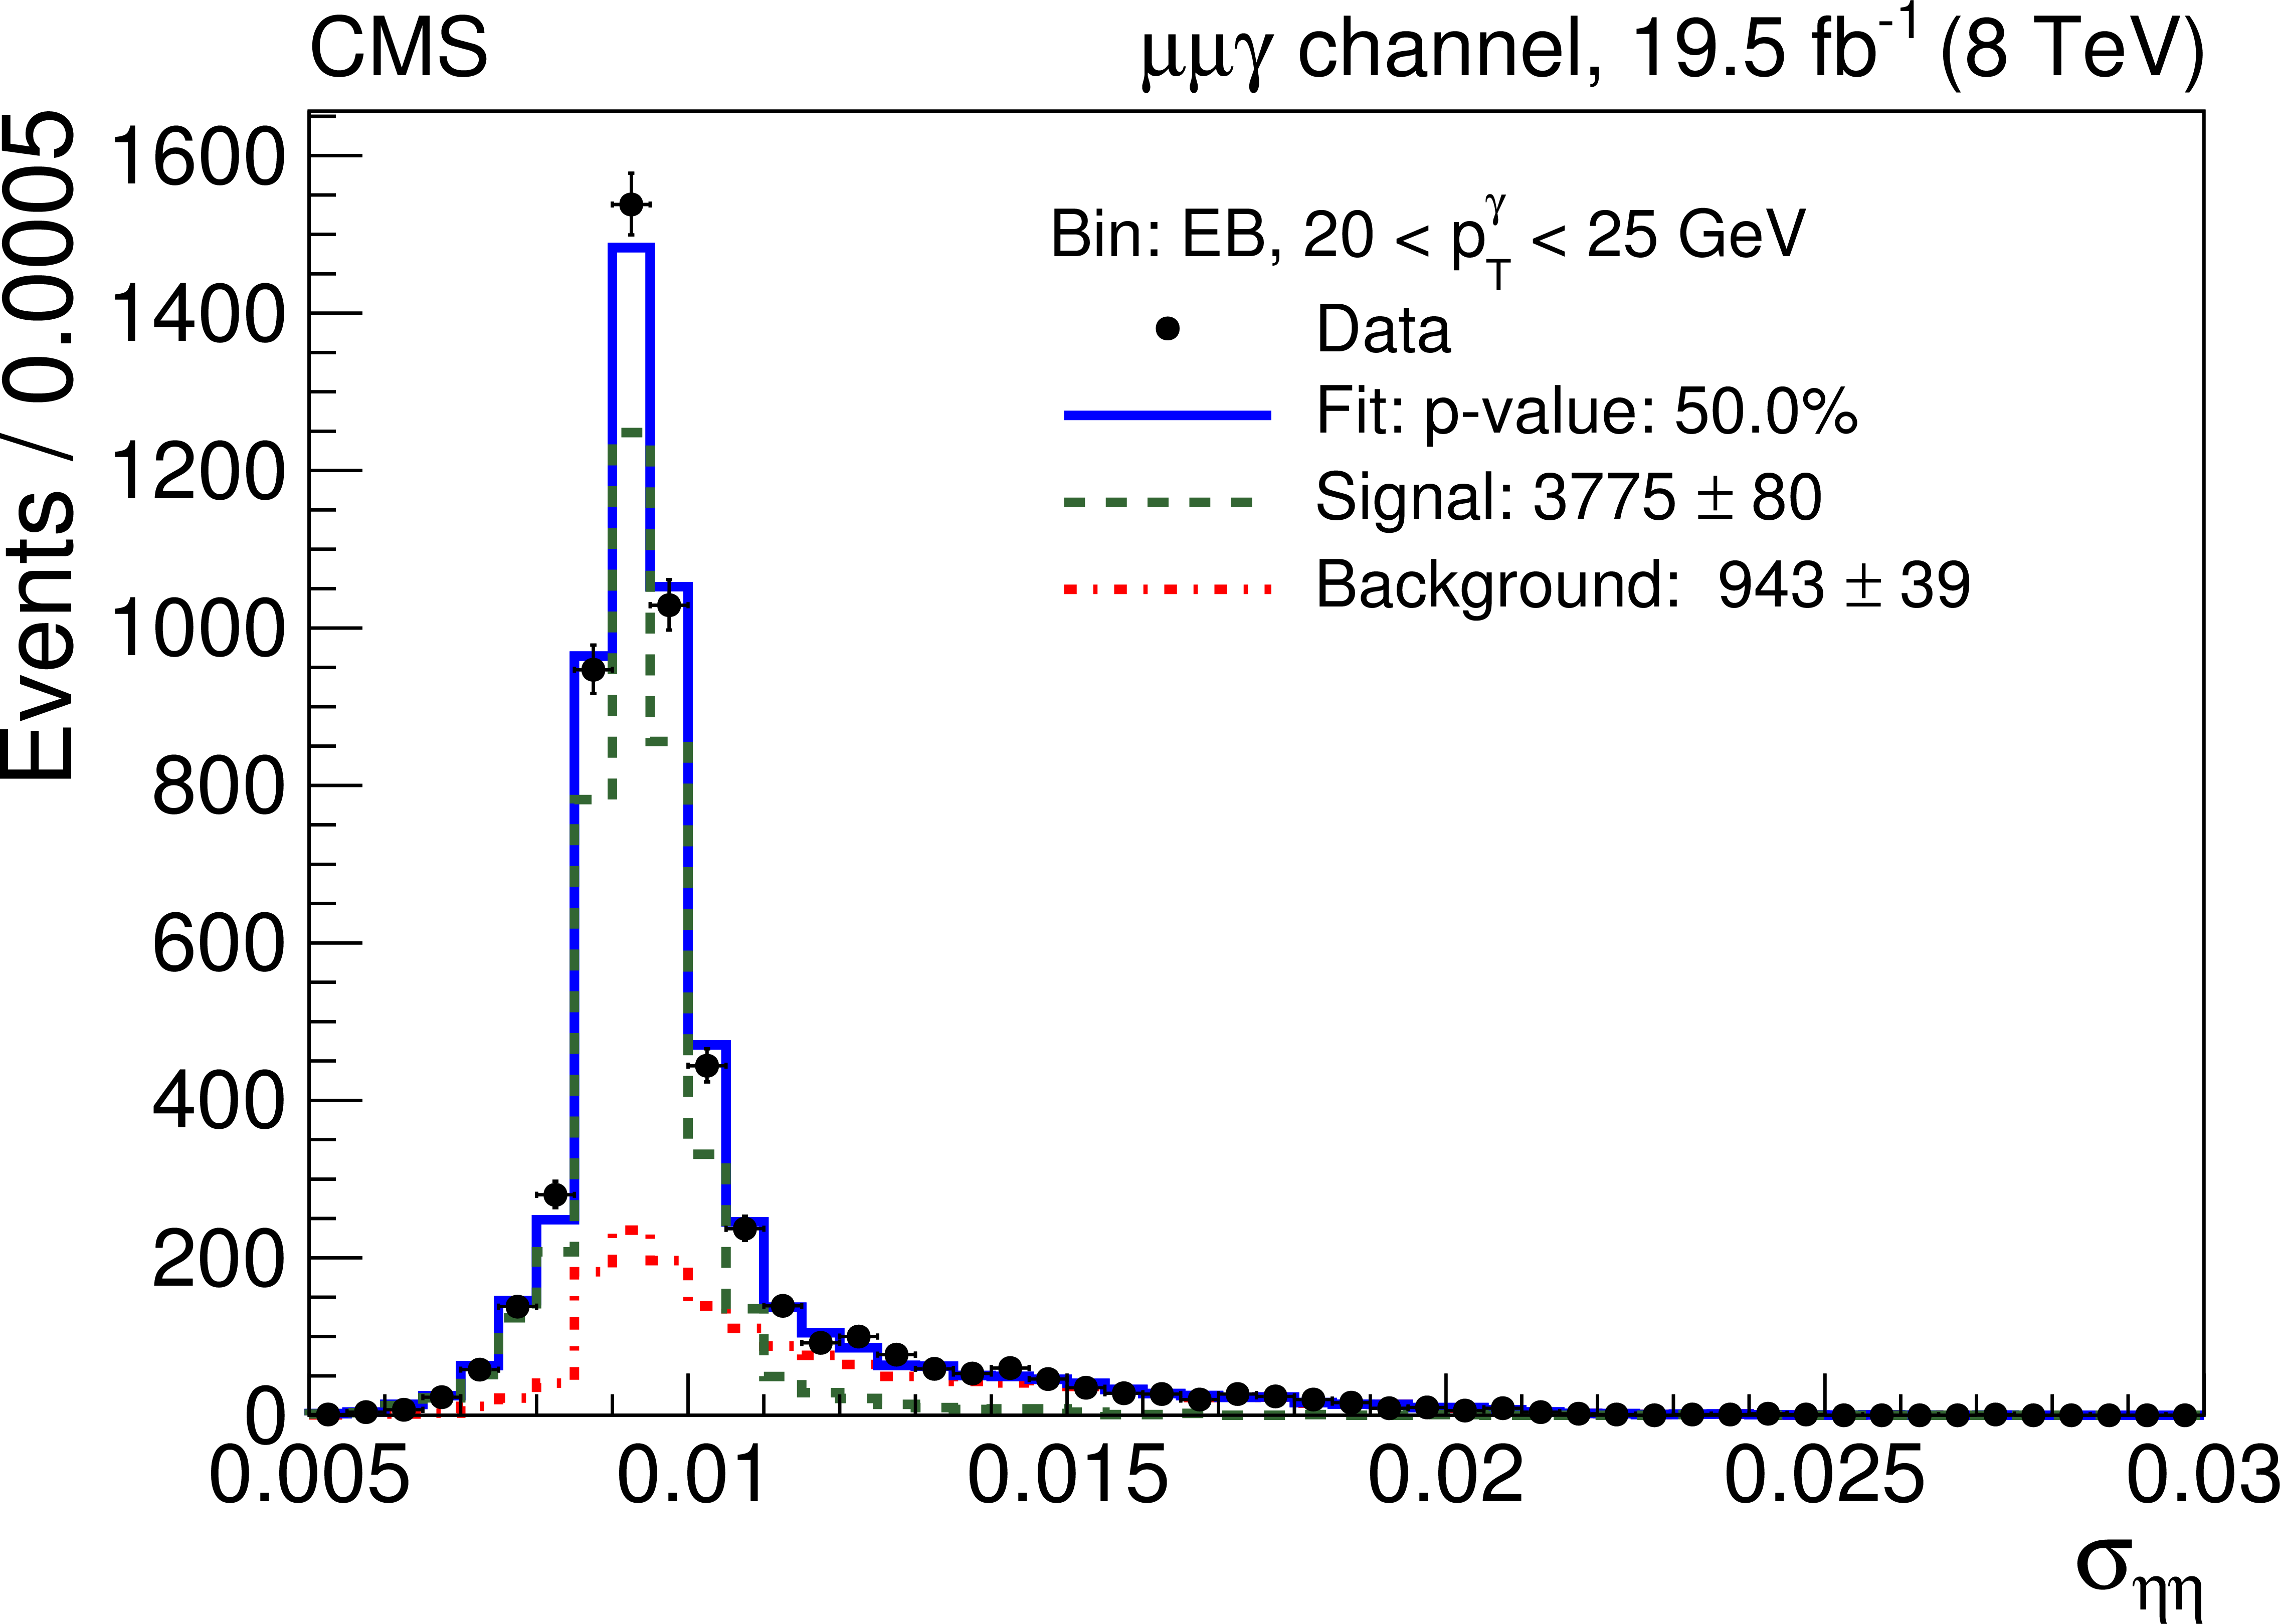
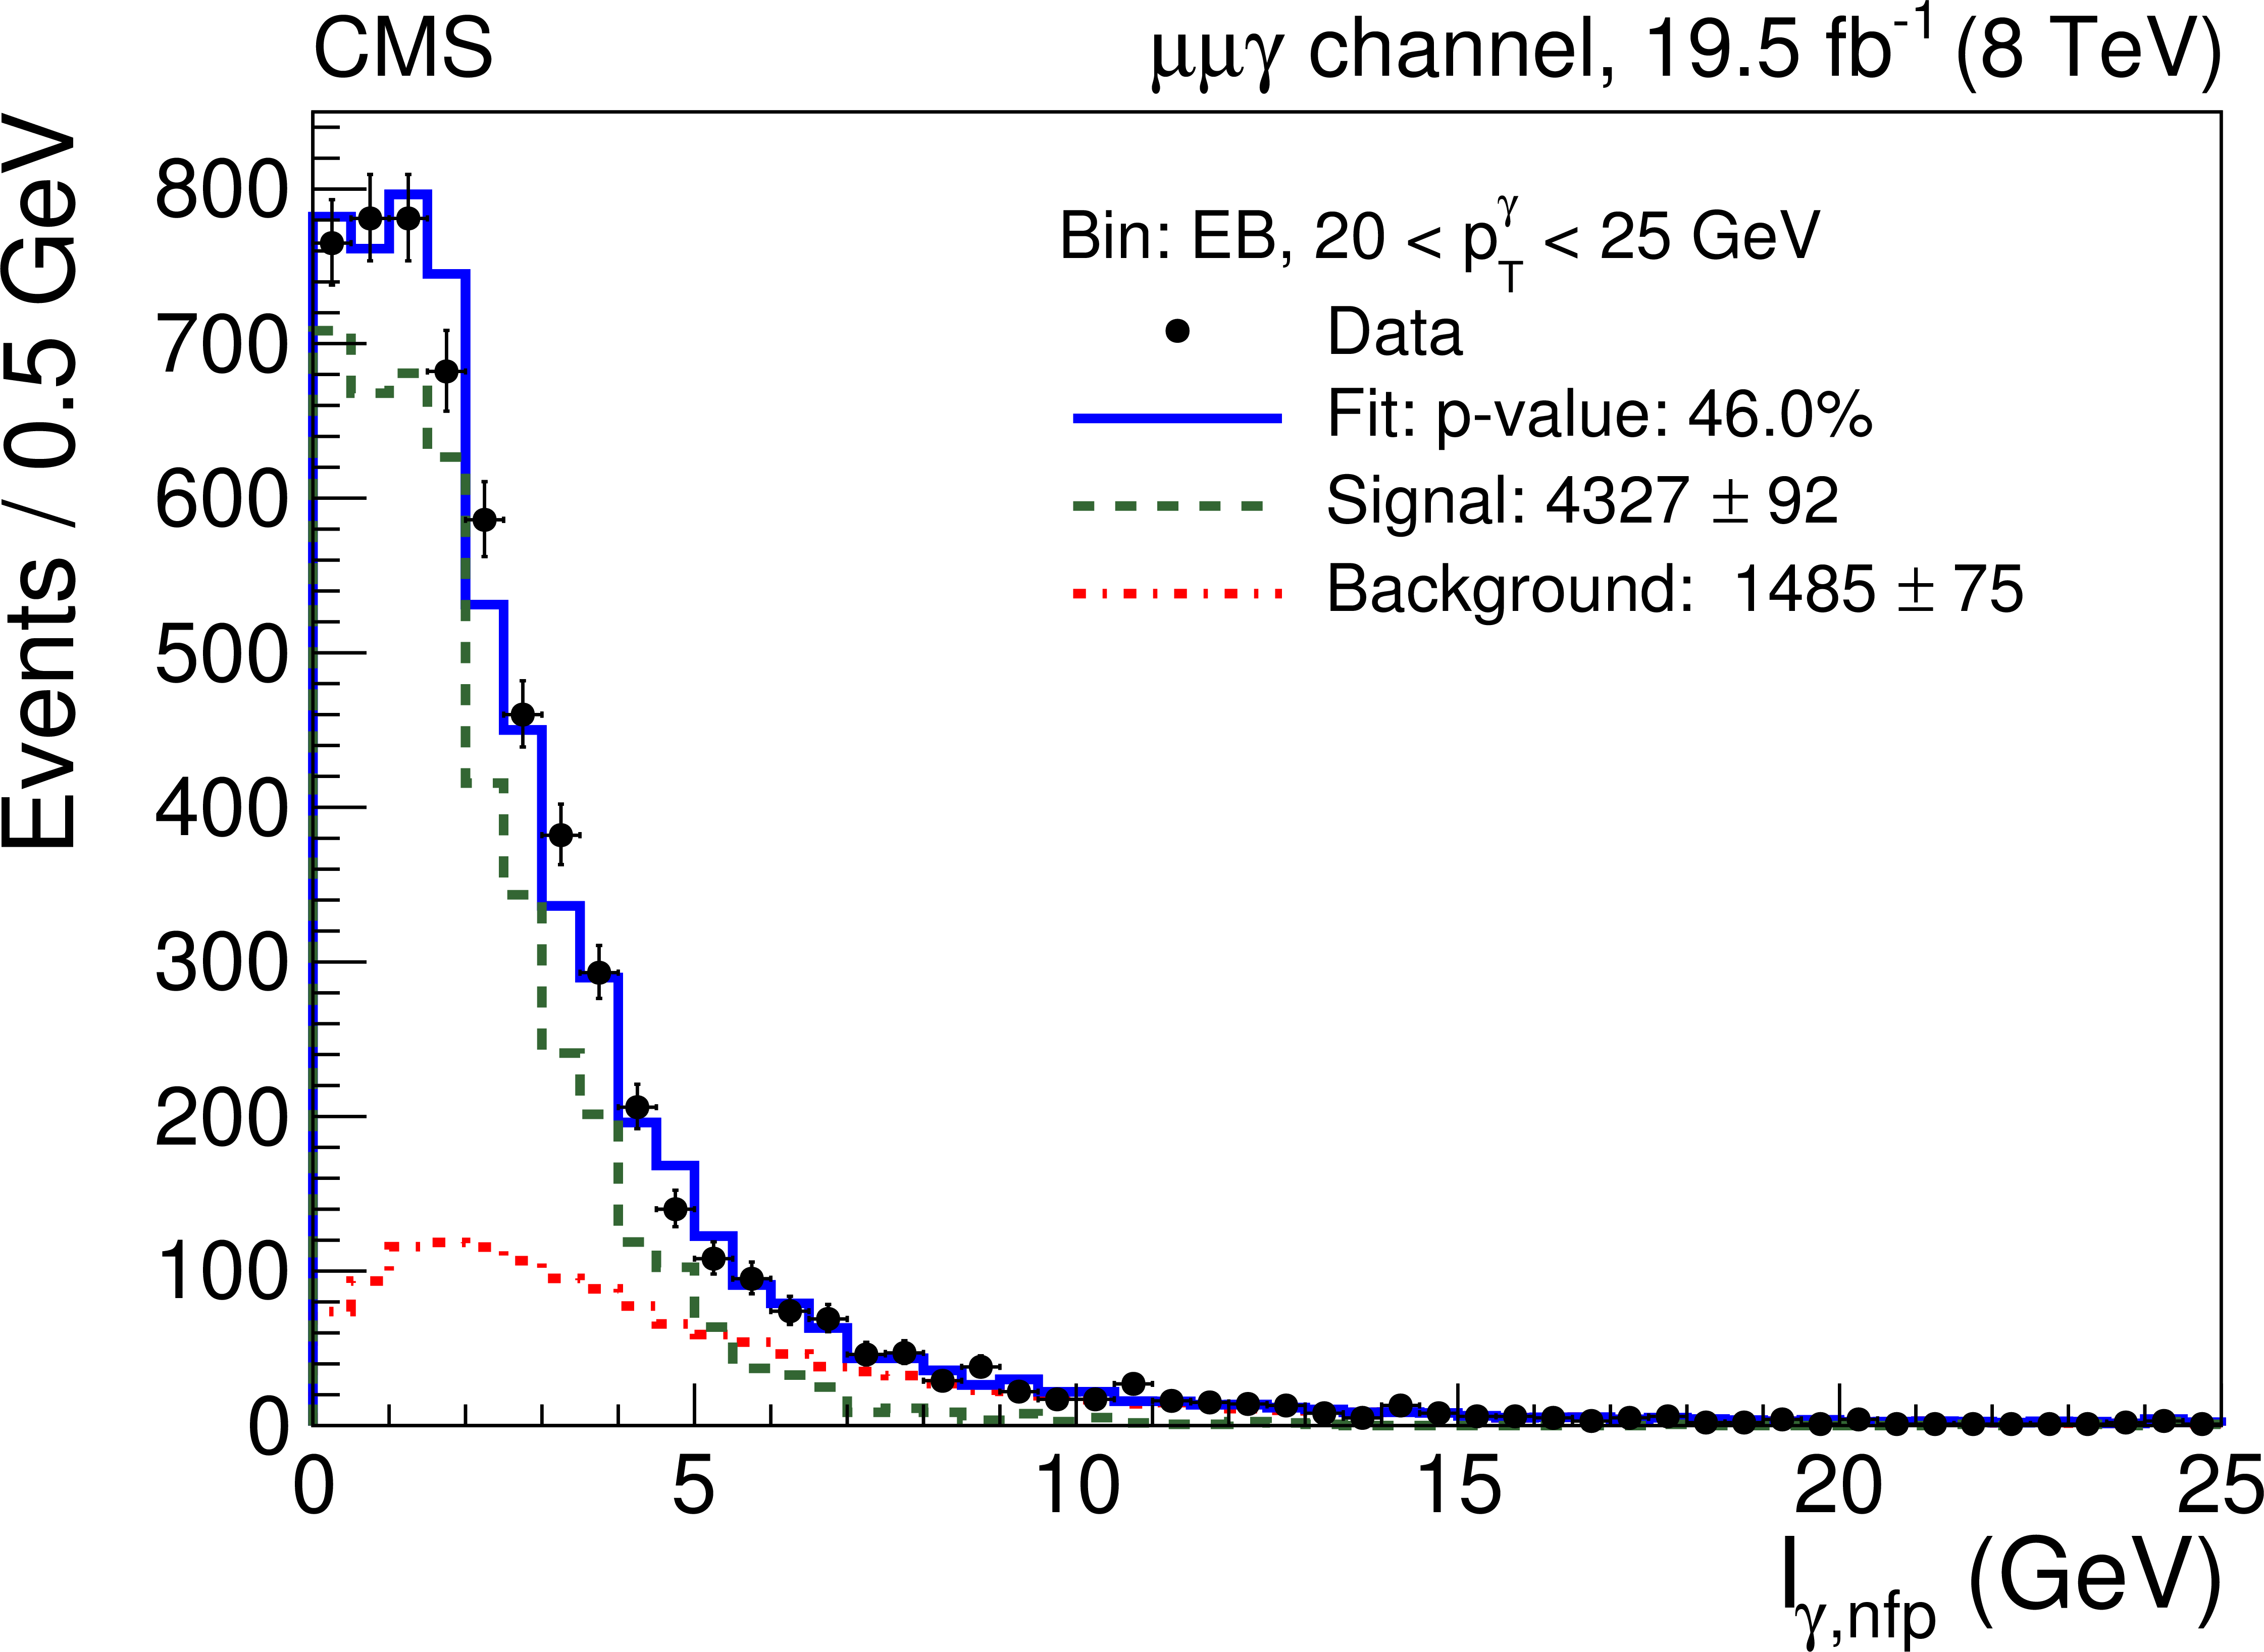
Fits of the $ {\sigma _{\eta \eta }} $ templates (a) and the $ {I_{\gamma \mathrm {,nfp}}} $ templates (b) to the data for 20 $< {p_{\mathrm {T}}^\gamma } <$ 25 GeV in the EB region. The extracted signal contributions are indicated by the green curves and the background contributions by the red ones. |
png pdf |
Figure 3-b:
Fits of the $ {\sigma _{\eta \eta }} $ templates (a) and the $ {I_{\gamma \mathrm {,nfp}}} $ templates (b) to the data for 20 $< {p_{\mathrm {T}}^\gamma } <$ 25 GeV in the EB region. The extracted signal contributions are indicated by the green curves and the background contributions by the red ones. |
png pdf |
Figure 4-a:
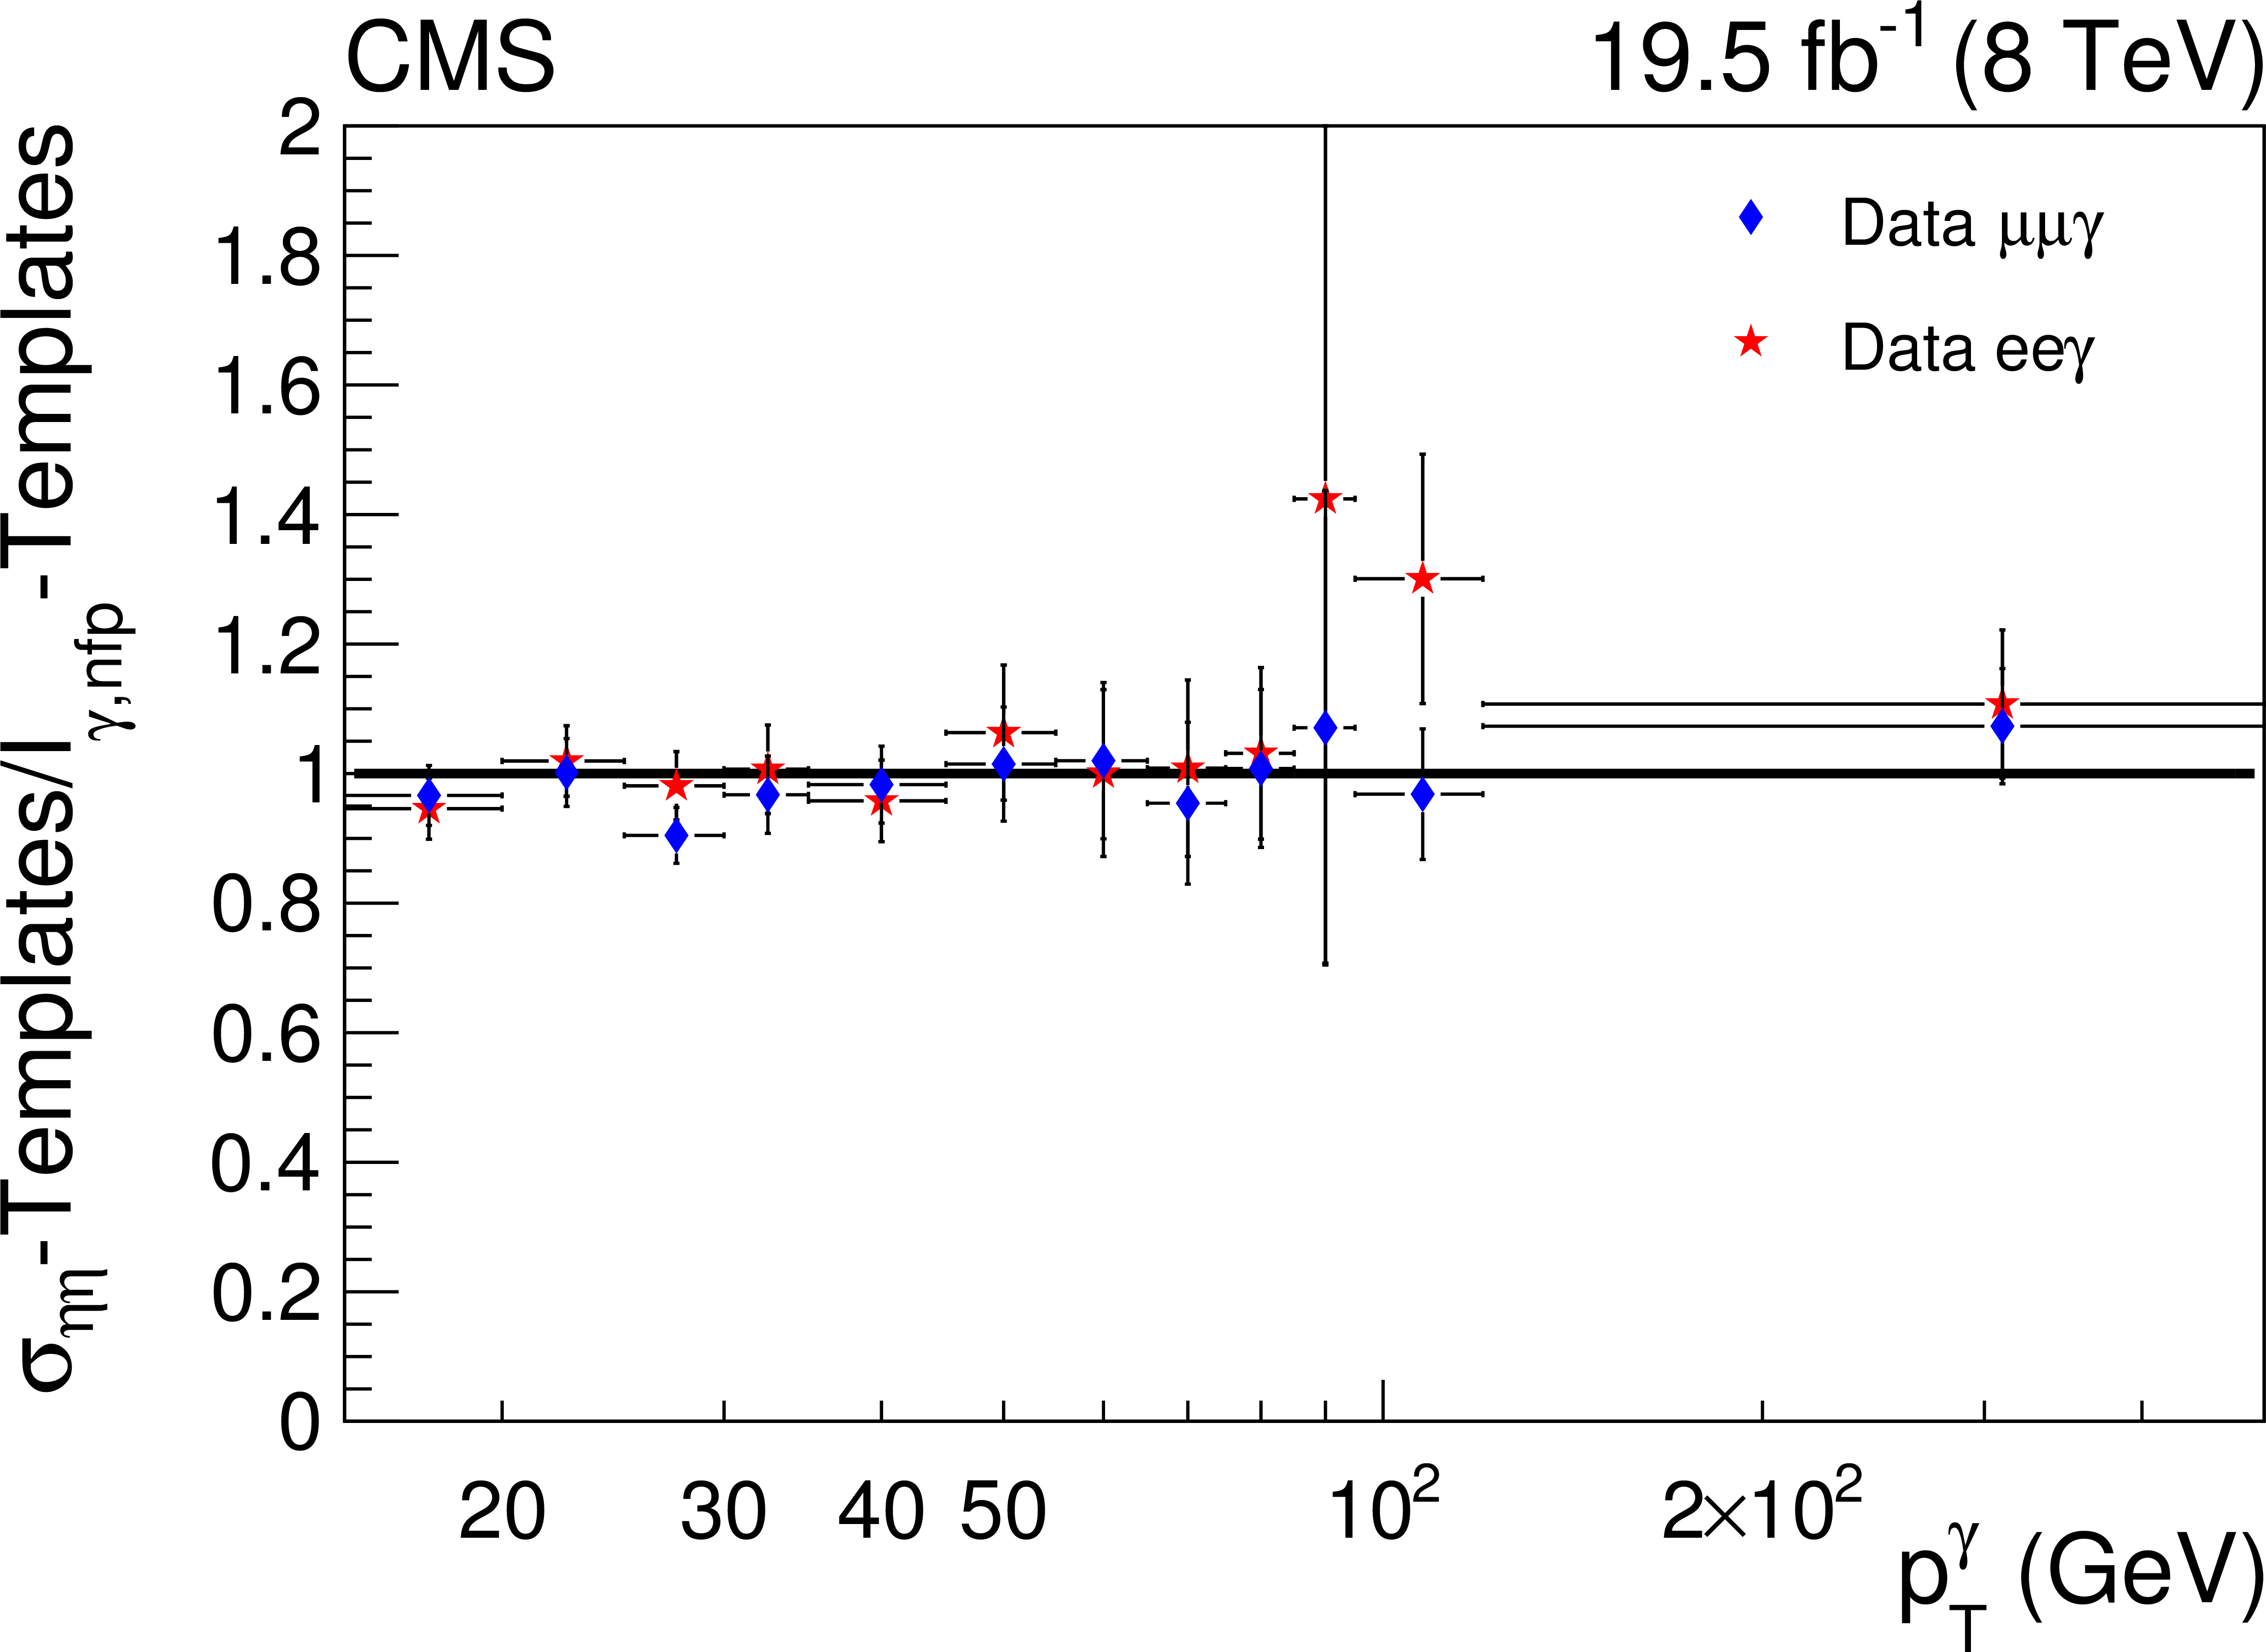
a: ratio of the inclusive cross sections as obtained with the two template methods. b: measured differential cross sections for the muon and electron channels using a combination of the two template methods compared to the NNLO [2], the MCFM (NLO) and the SHERPA SM predictions. The last bin is computed for the interval 120--500 GeV . |

png pdf |
Figure 4-b:
a: ratio of the inclusive cross sections as obtained with the two template methods. b: measured differential cross sections for the muon and electron channels using a combination of the two template methods compared to the NNLO [2], the MCFM (NLO) and the SHERPA SM predictions. The last bin is computed for the interval 120--500 GeV . |

png pdf |
Figure 5-a:
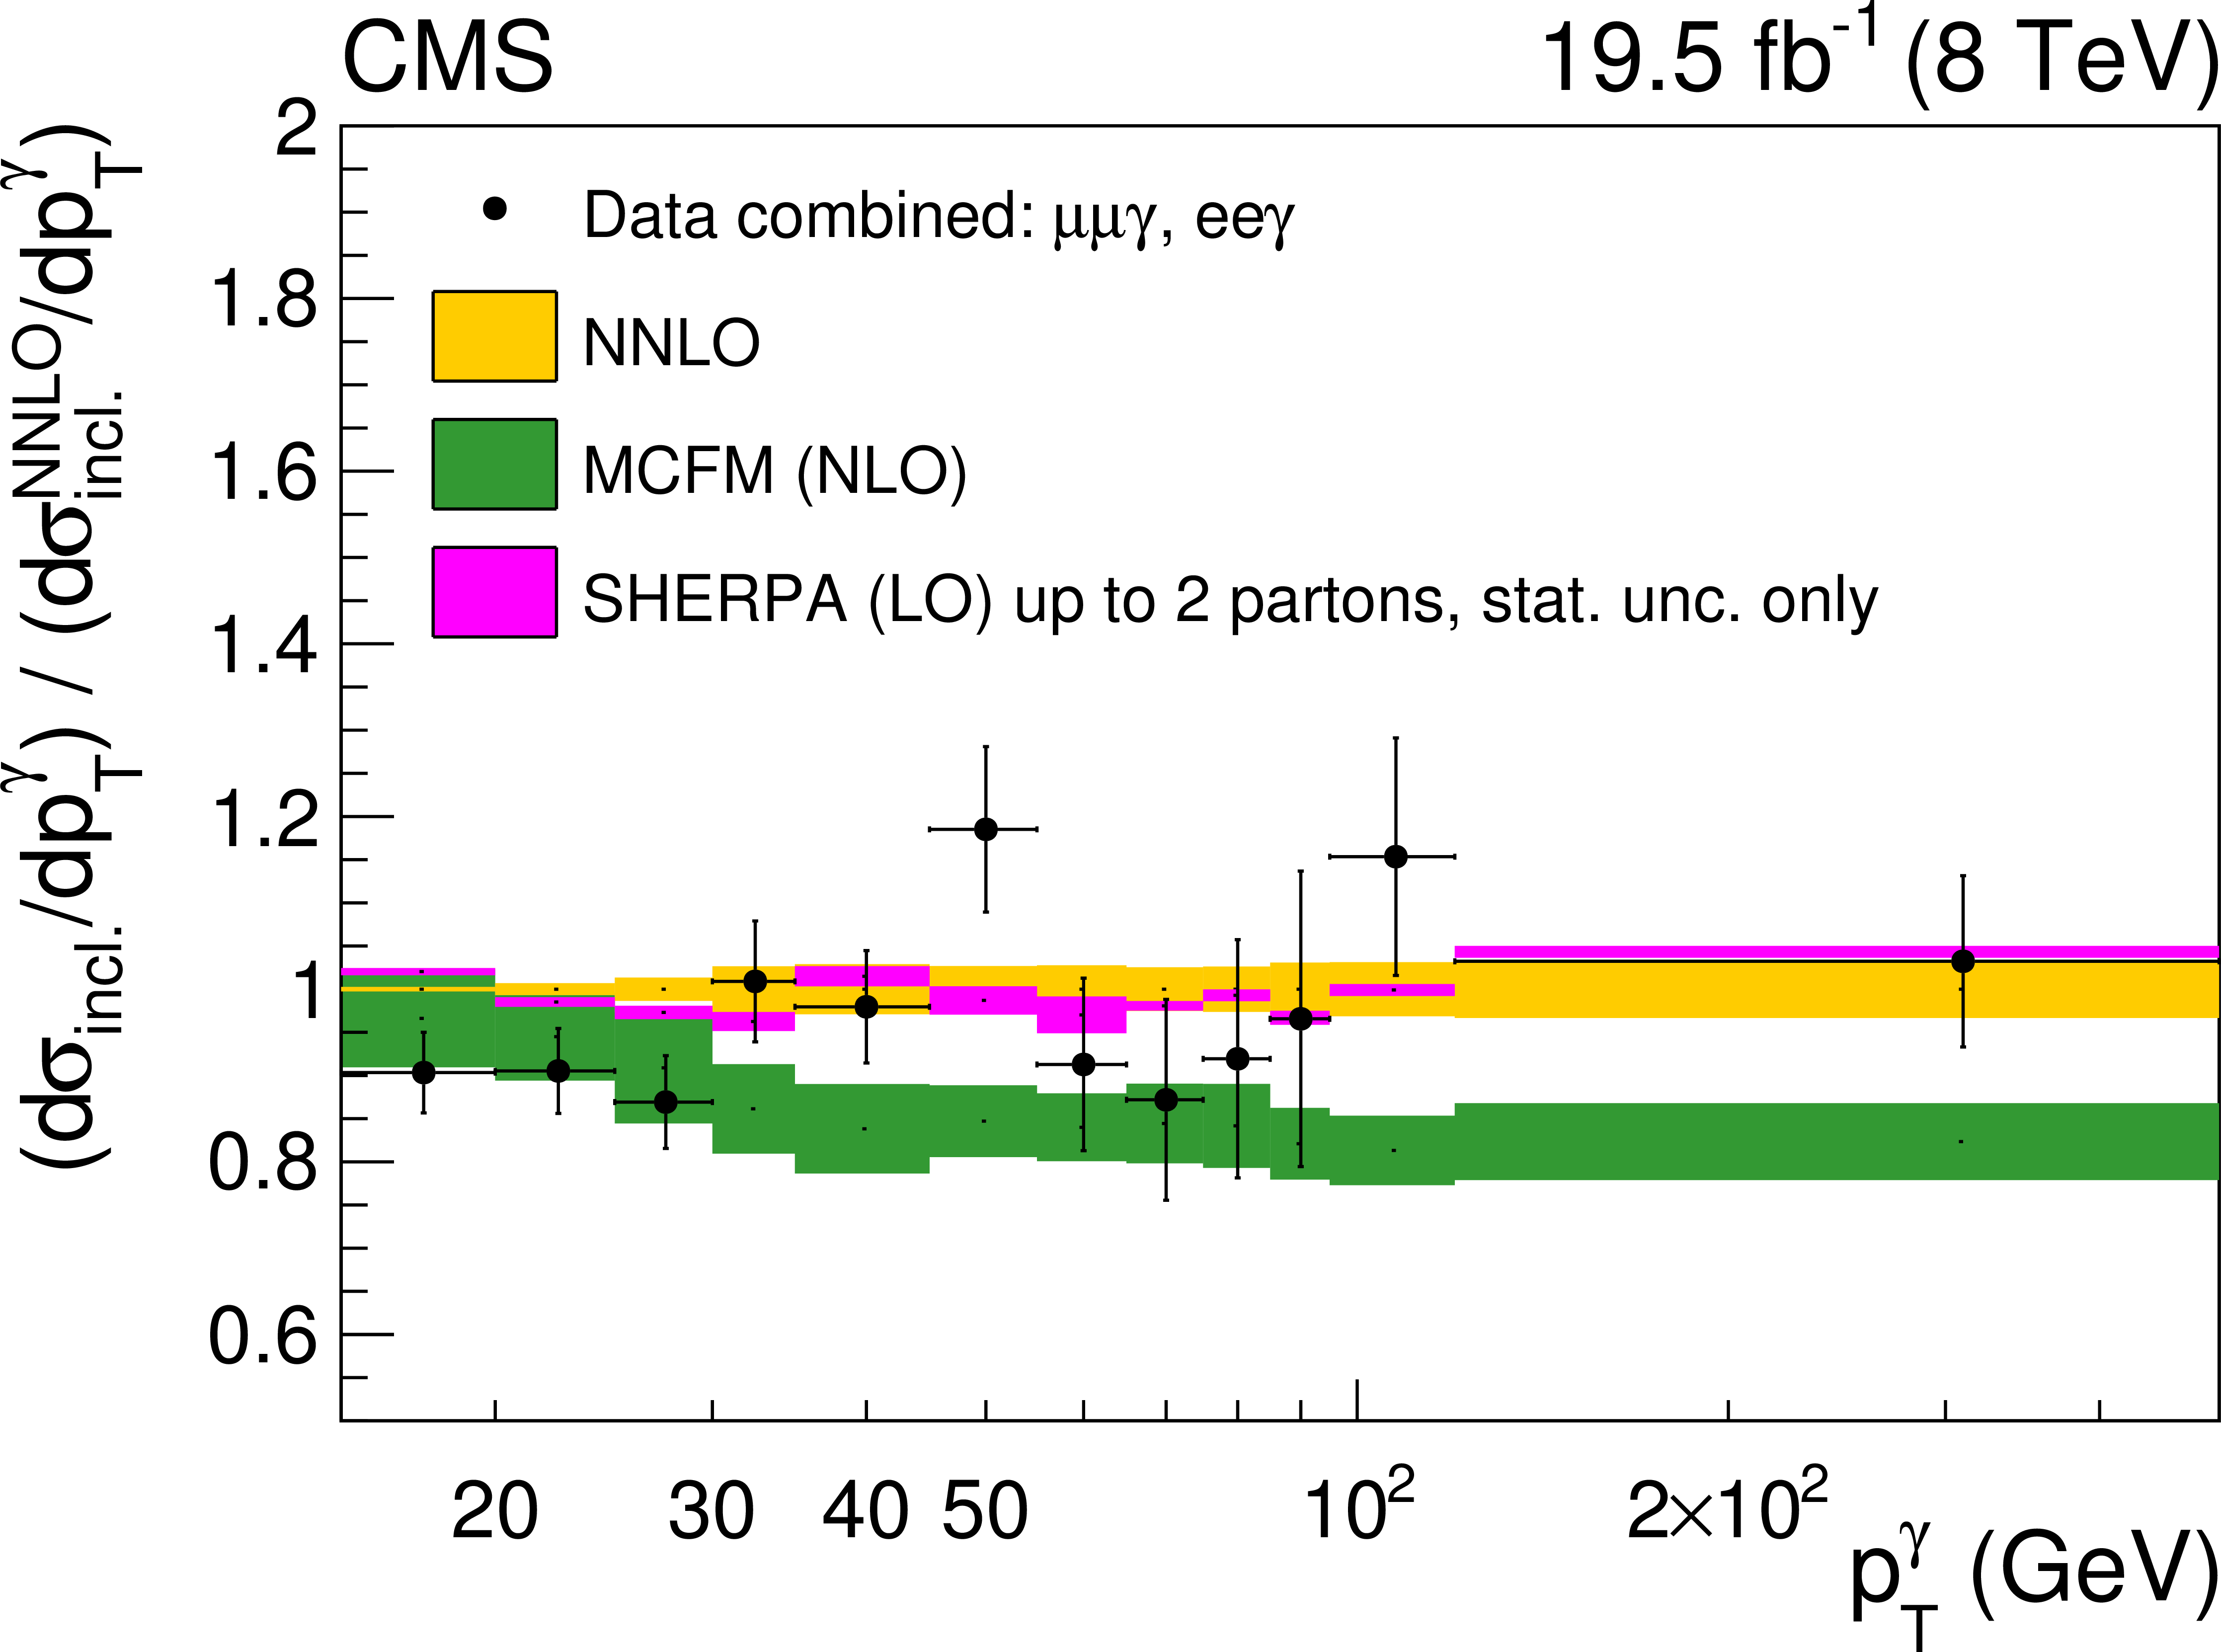
a: combined inclusive differential cross section for the two lepton channels compared to the NNLO [2], the MCFM (NLO) and the SHERPA SM predictions. The latter is normalized to the NNLO cross section. The last bin is computed for the interval 120--500 GeV. b: the ratios of the data and the other predictions to the NNLO calculation showing the effect of the additional partons on the inclusive cross section. |
png pdf |
Figure 5-b:
a: combined inclusive differential cross section for the two lepton channels compared to the NNLO [2], the MCFM (NLO) and the SHERPA SM predictions. The latter is normalized to the NNLO cross section. The last bin is computed for the interval 120--500 GeV. b: the ratios of the data and the other predictions to the NNLO calculation showing the effect of the additional partons on the inclusive cross section. |
png pdf |
Figure 6-a:
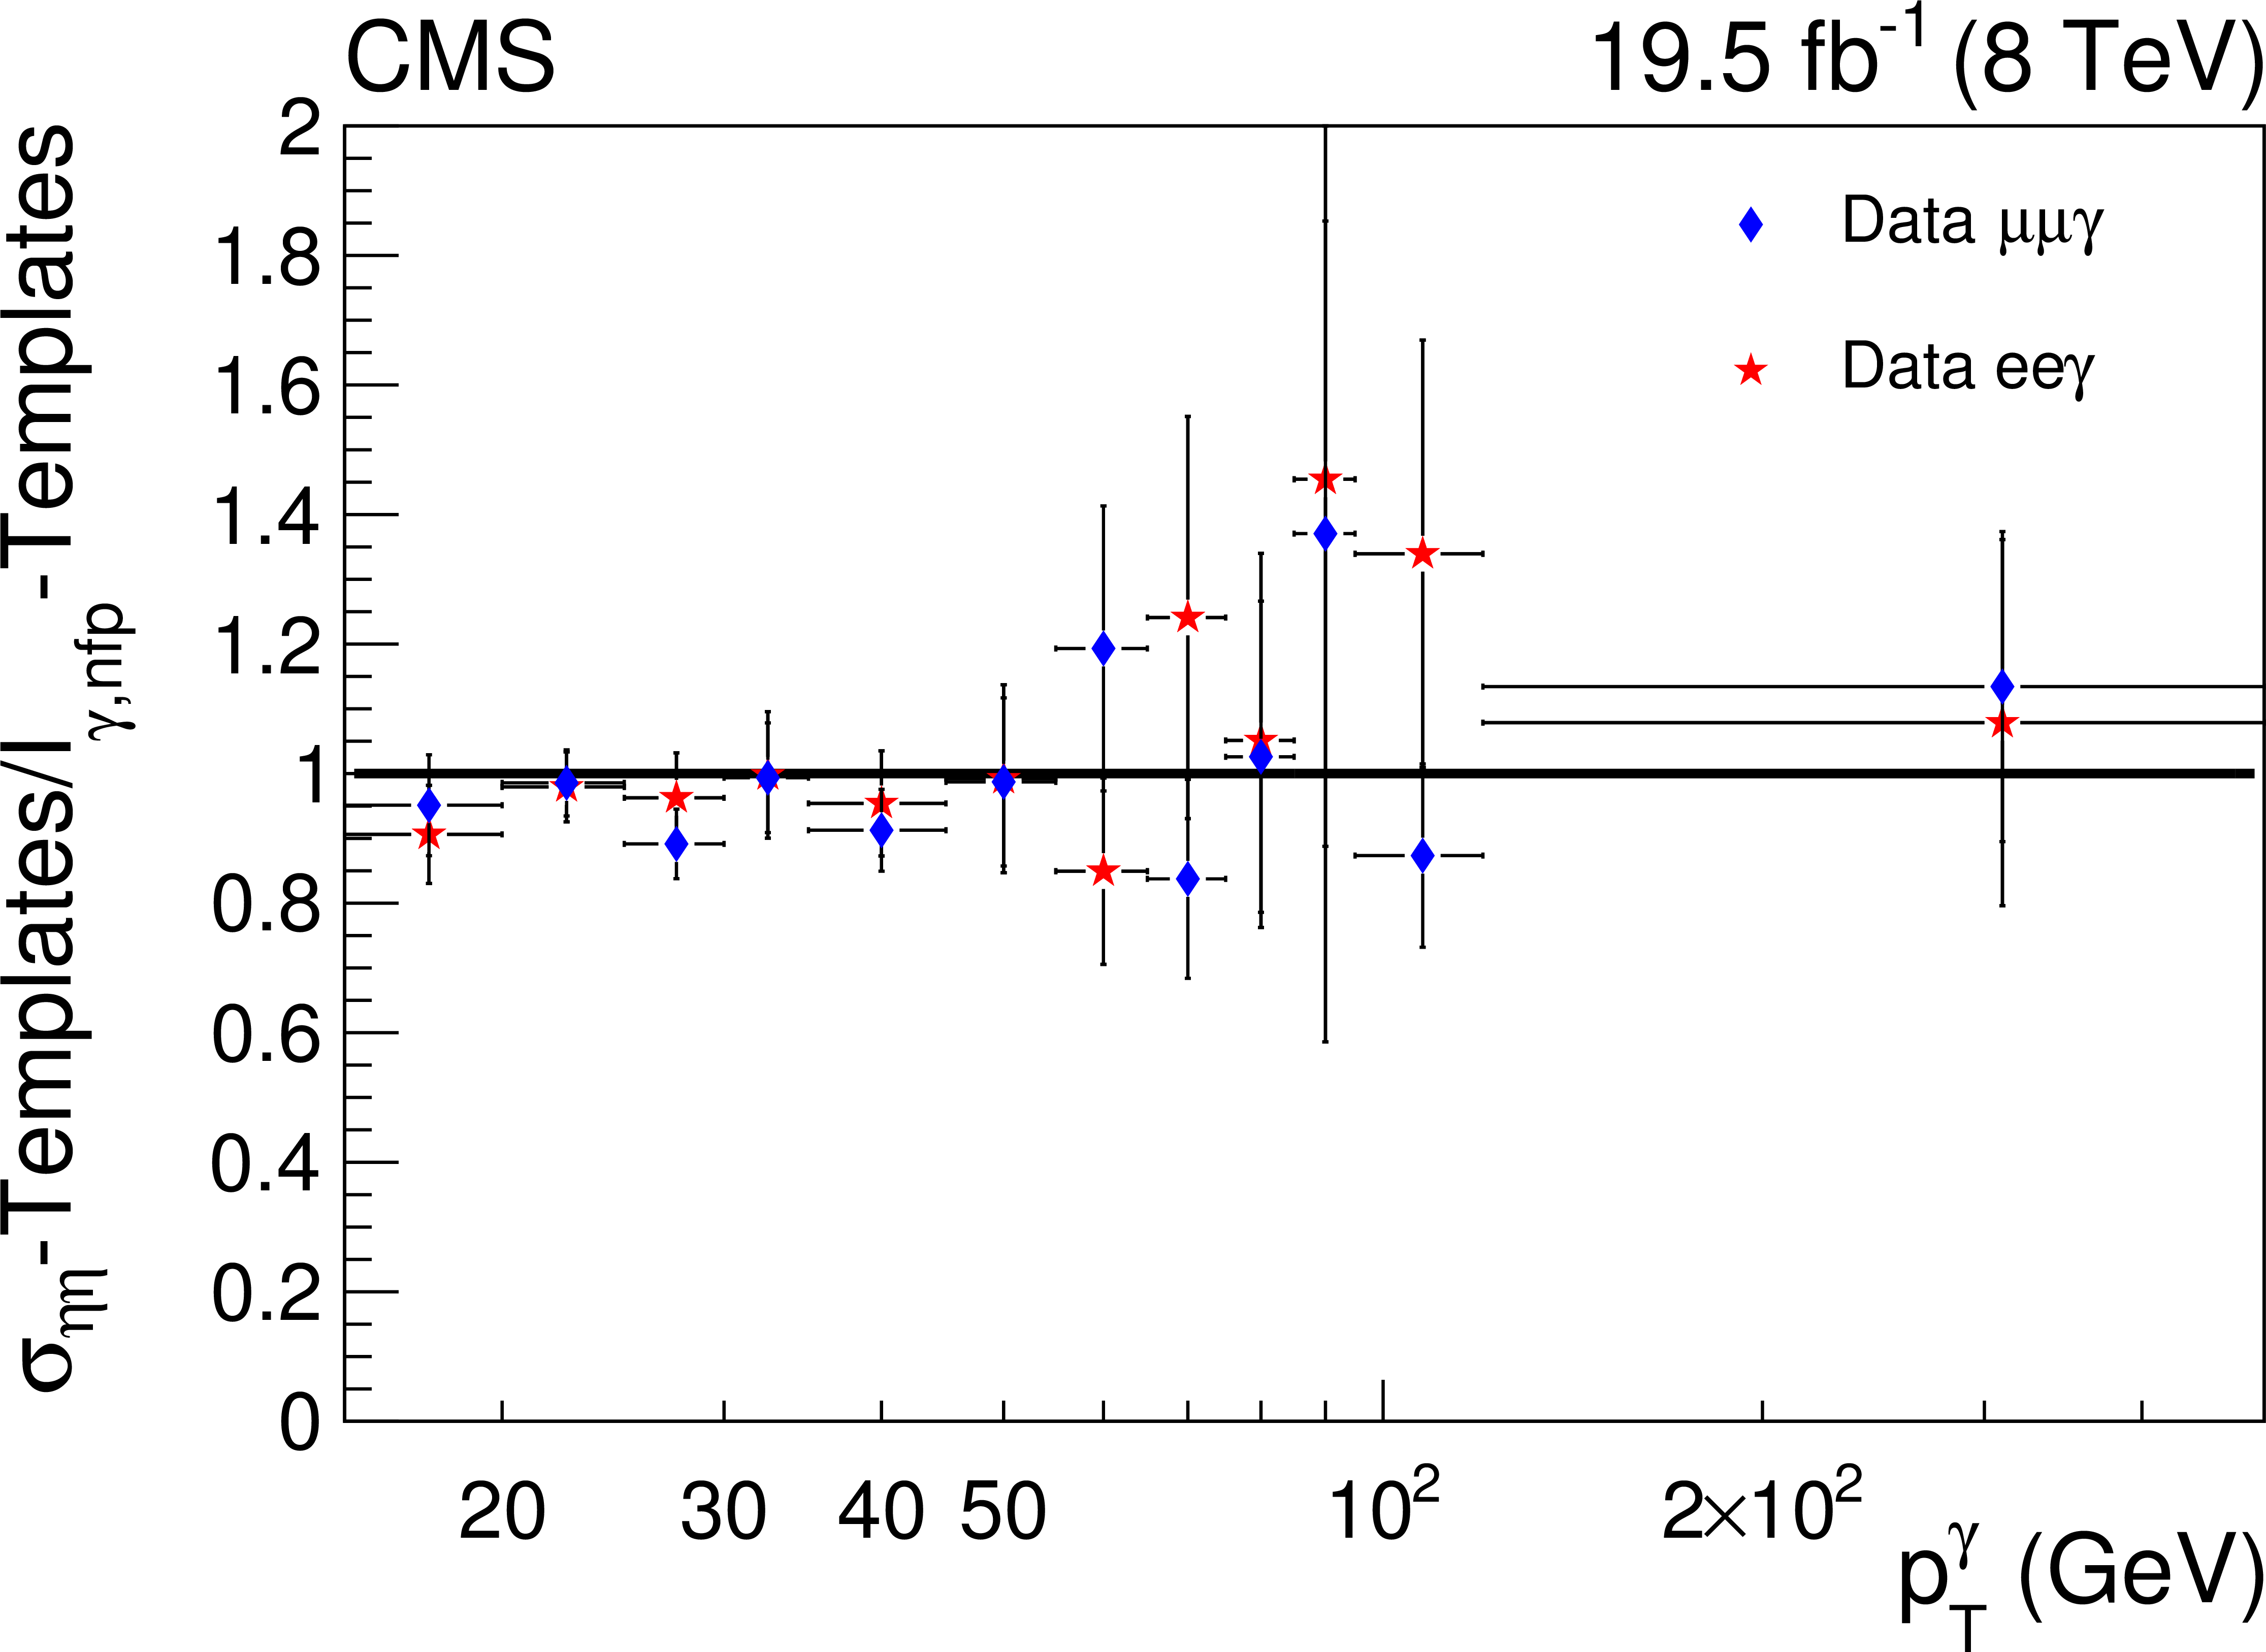
a: ratio of the exclusive cross sections as obtained with the two template methods. b: measured cross sections for the muon and electron channels using a combination of the two template methods compared to the MCFM (NLO) and the SHERPA SM predictions. The last bin is computed for the interval 120--500 GeV . |

png pdf |
Figure 6-b:
a: ratio of the exclusive cross sections as obtained with the two template methods. b: measured cross sections for the muon and electron channels using a combination of the two template methods compared to the MCFM (NLO) and the SHERPA SM predictions. The last bin is computed for the interval 120--500 GeV . |
png pdf |
Figure 7-a:
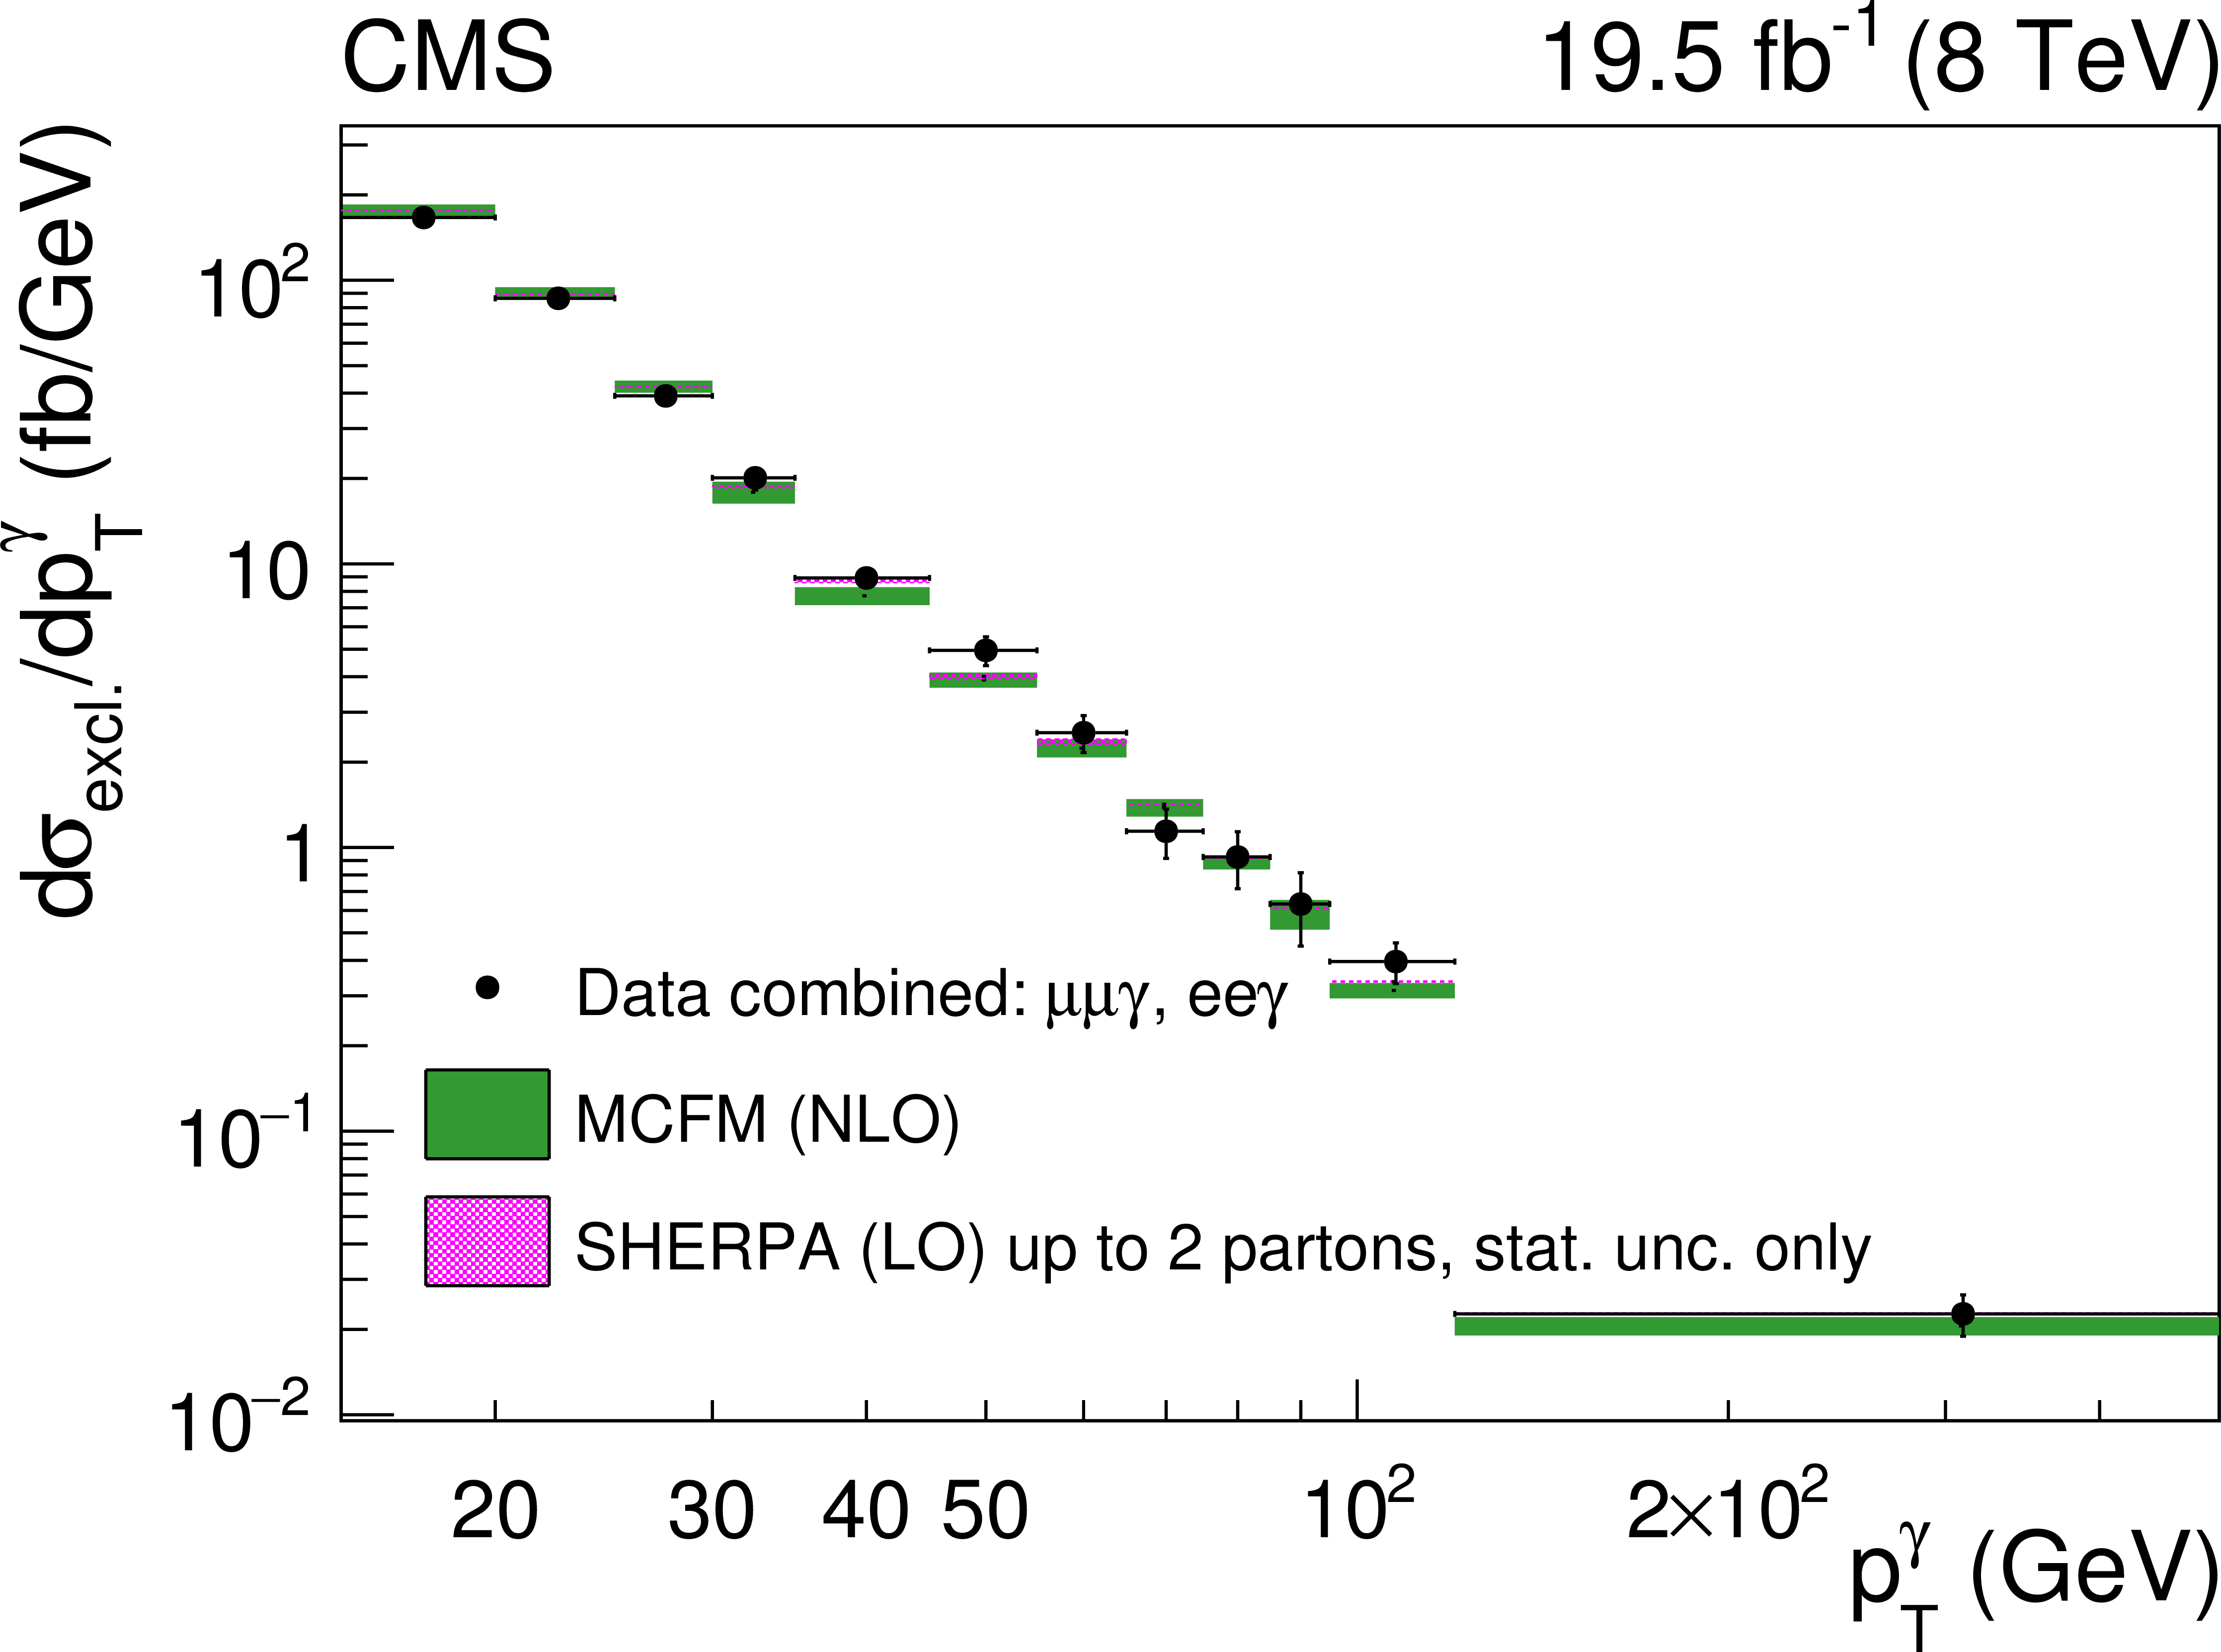
a: combined exclusive differential cross section for the two lepton channels compared to the MCFM (NLO) and SHERPA SM predictions. The whole SHERPA sample (inclusive) is normalized to the NNLO cross section. The last bin is computed for the interval 120--500 GeV. b: for the exclusive measurement the ratios to the MCFM (NLO) prediction are shown. |

png pdf |
Figure 7-b:
a: combined exclusive differential cross section for the two lepton channels compared to the MCFM (NLO) and SHERPA SM predictions. The whole SHERPA sample (inclusive) is normalized to the NNLO cross section. The last bin is computed for the interval 120--500 GeV. b: for the exclusive measurement the ratios to the MCFM (NLO) prediction are shown. |
png pdf |
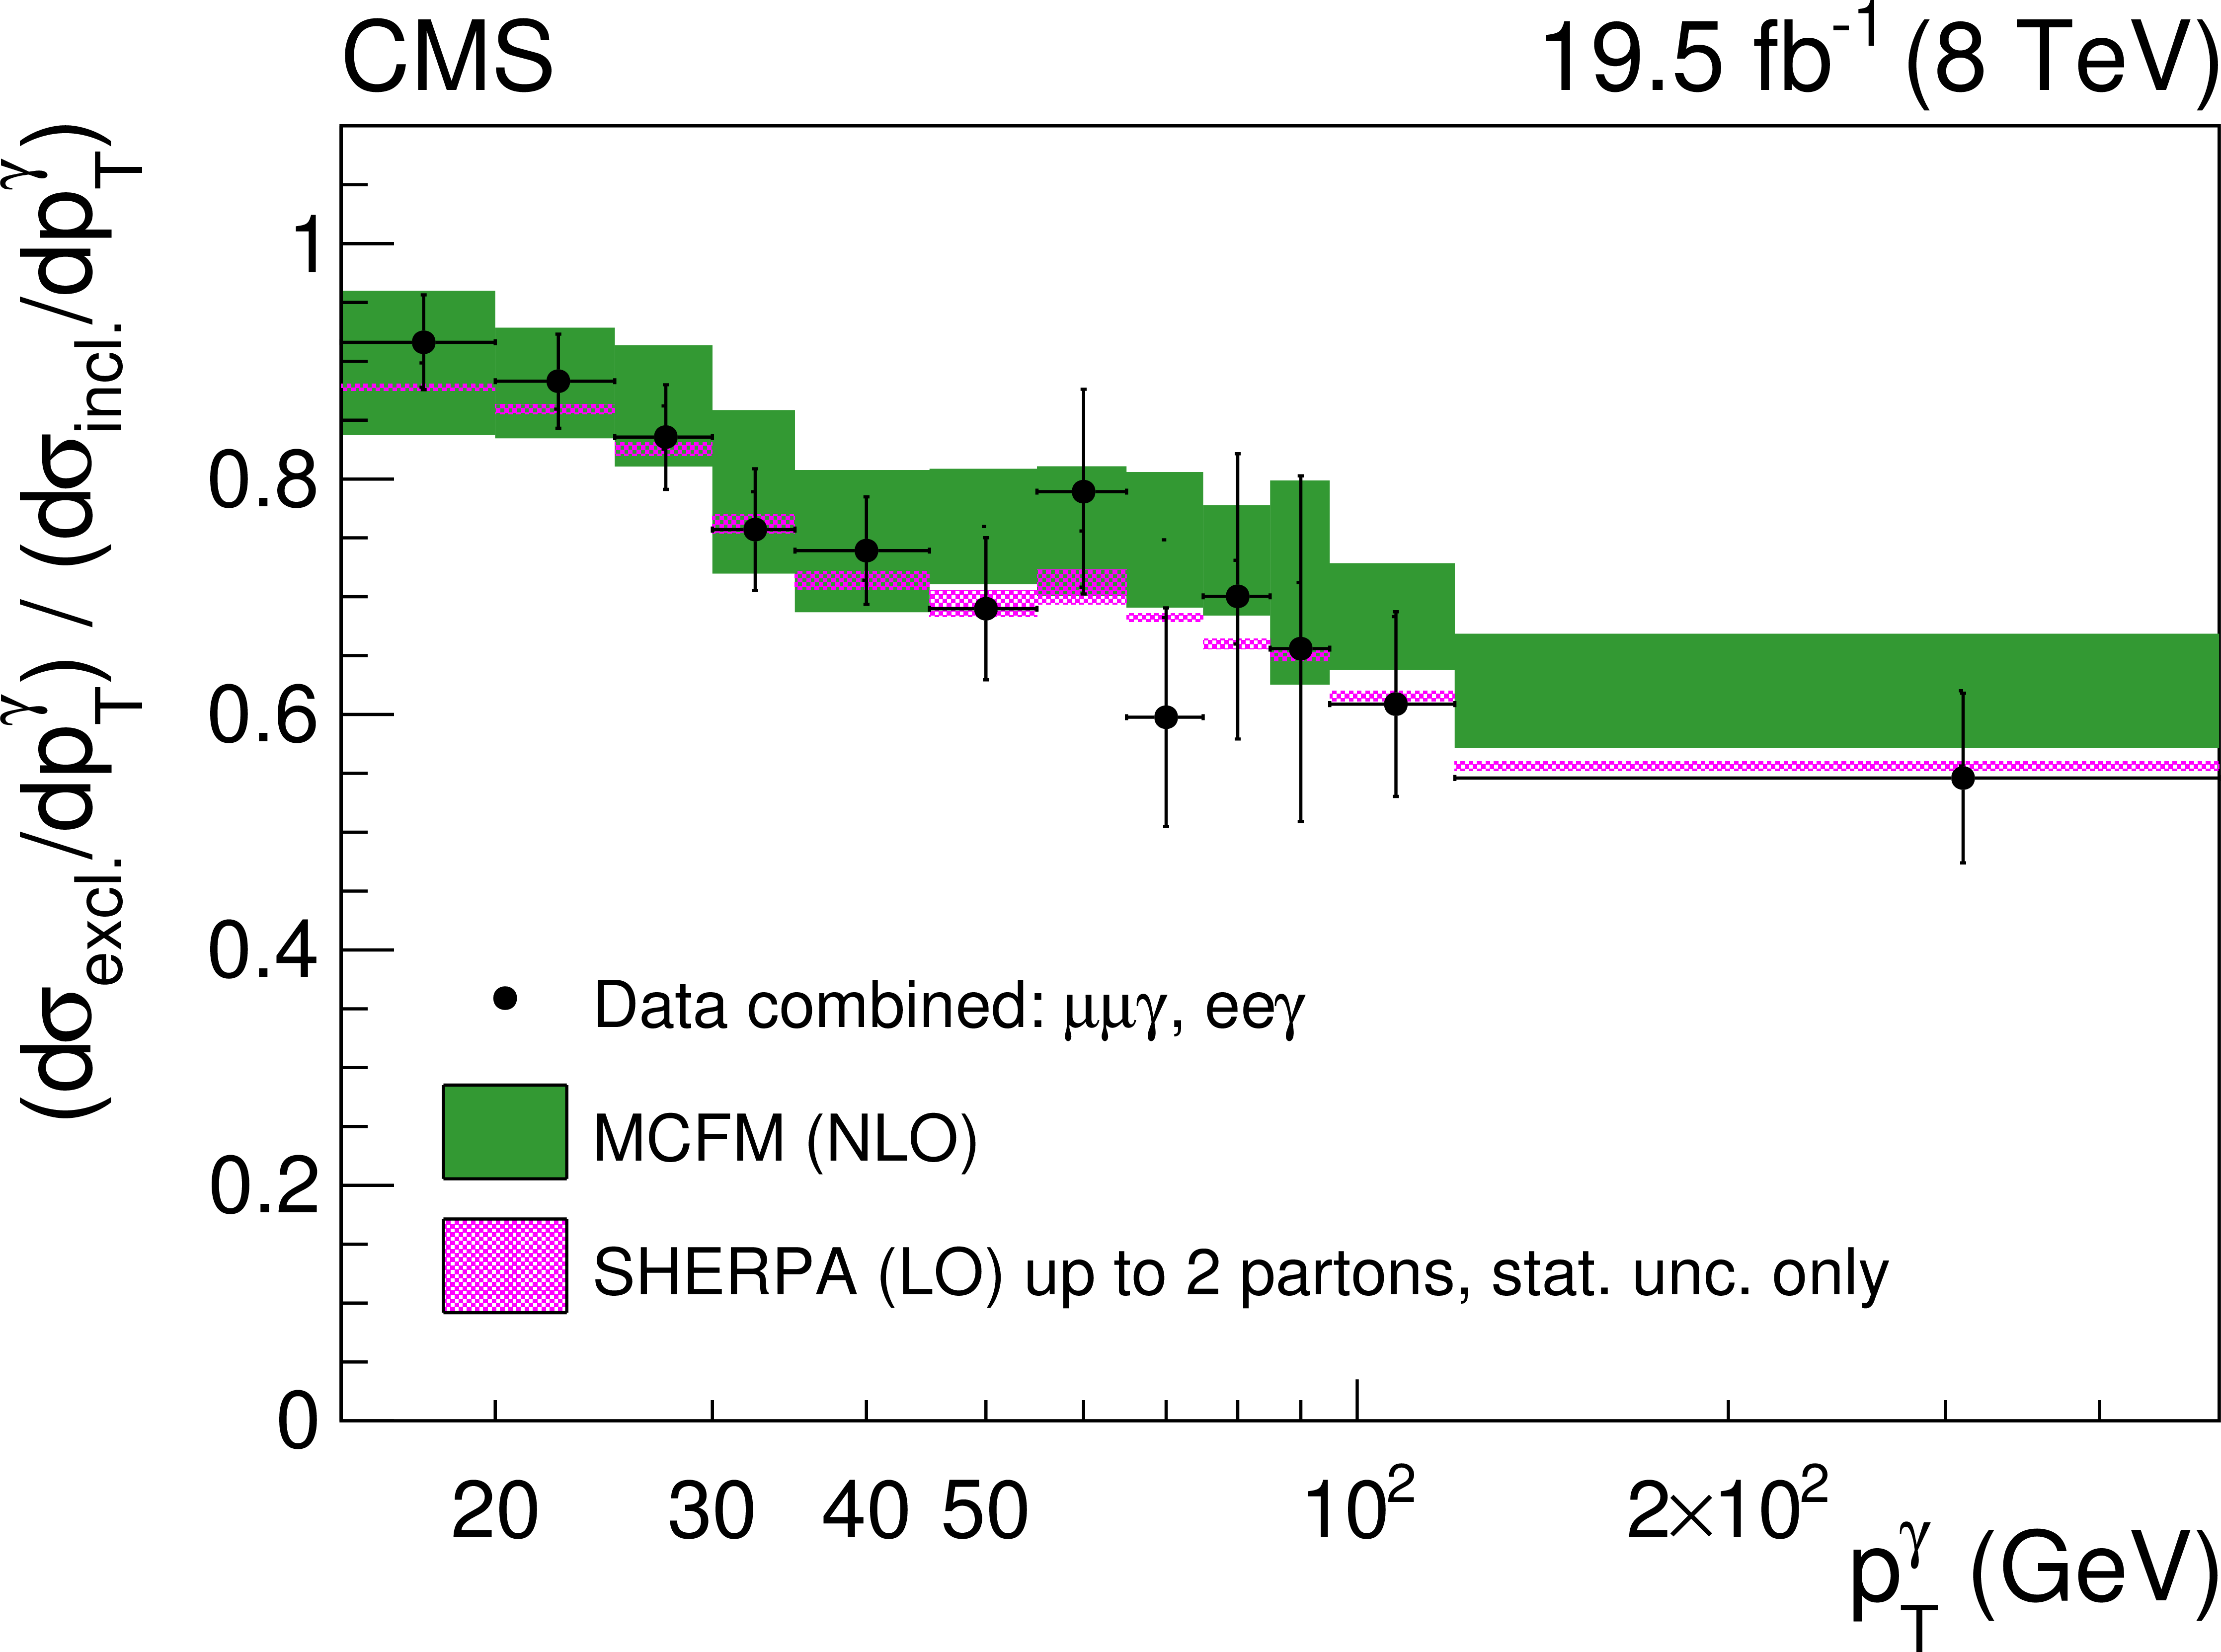
Figure 8:
Ratio of the exclusive to inclusive cross sections for $ { {\mathrm {Z}} \gamma } $ production. |
png pdf |
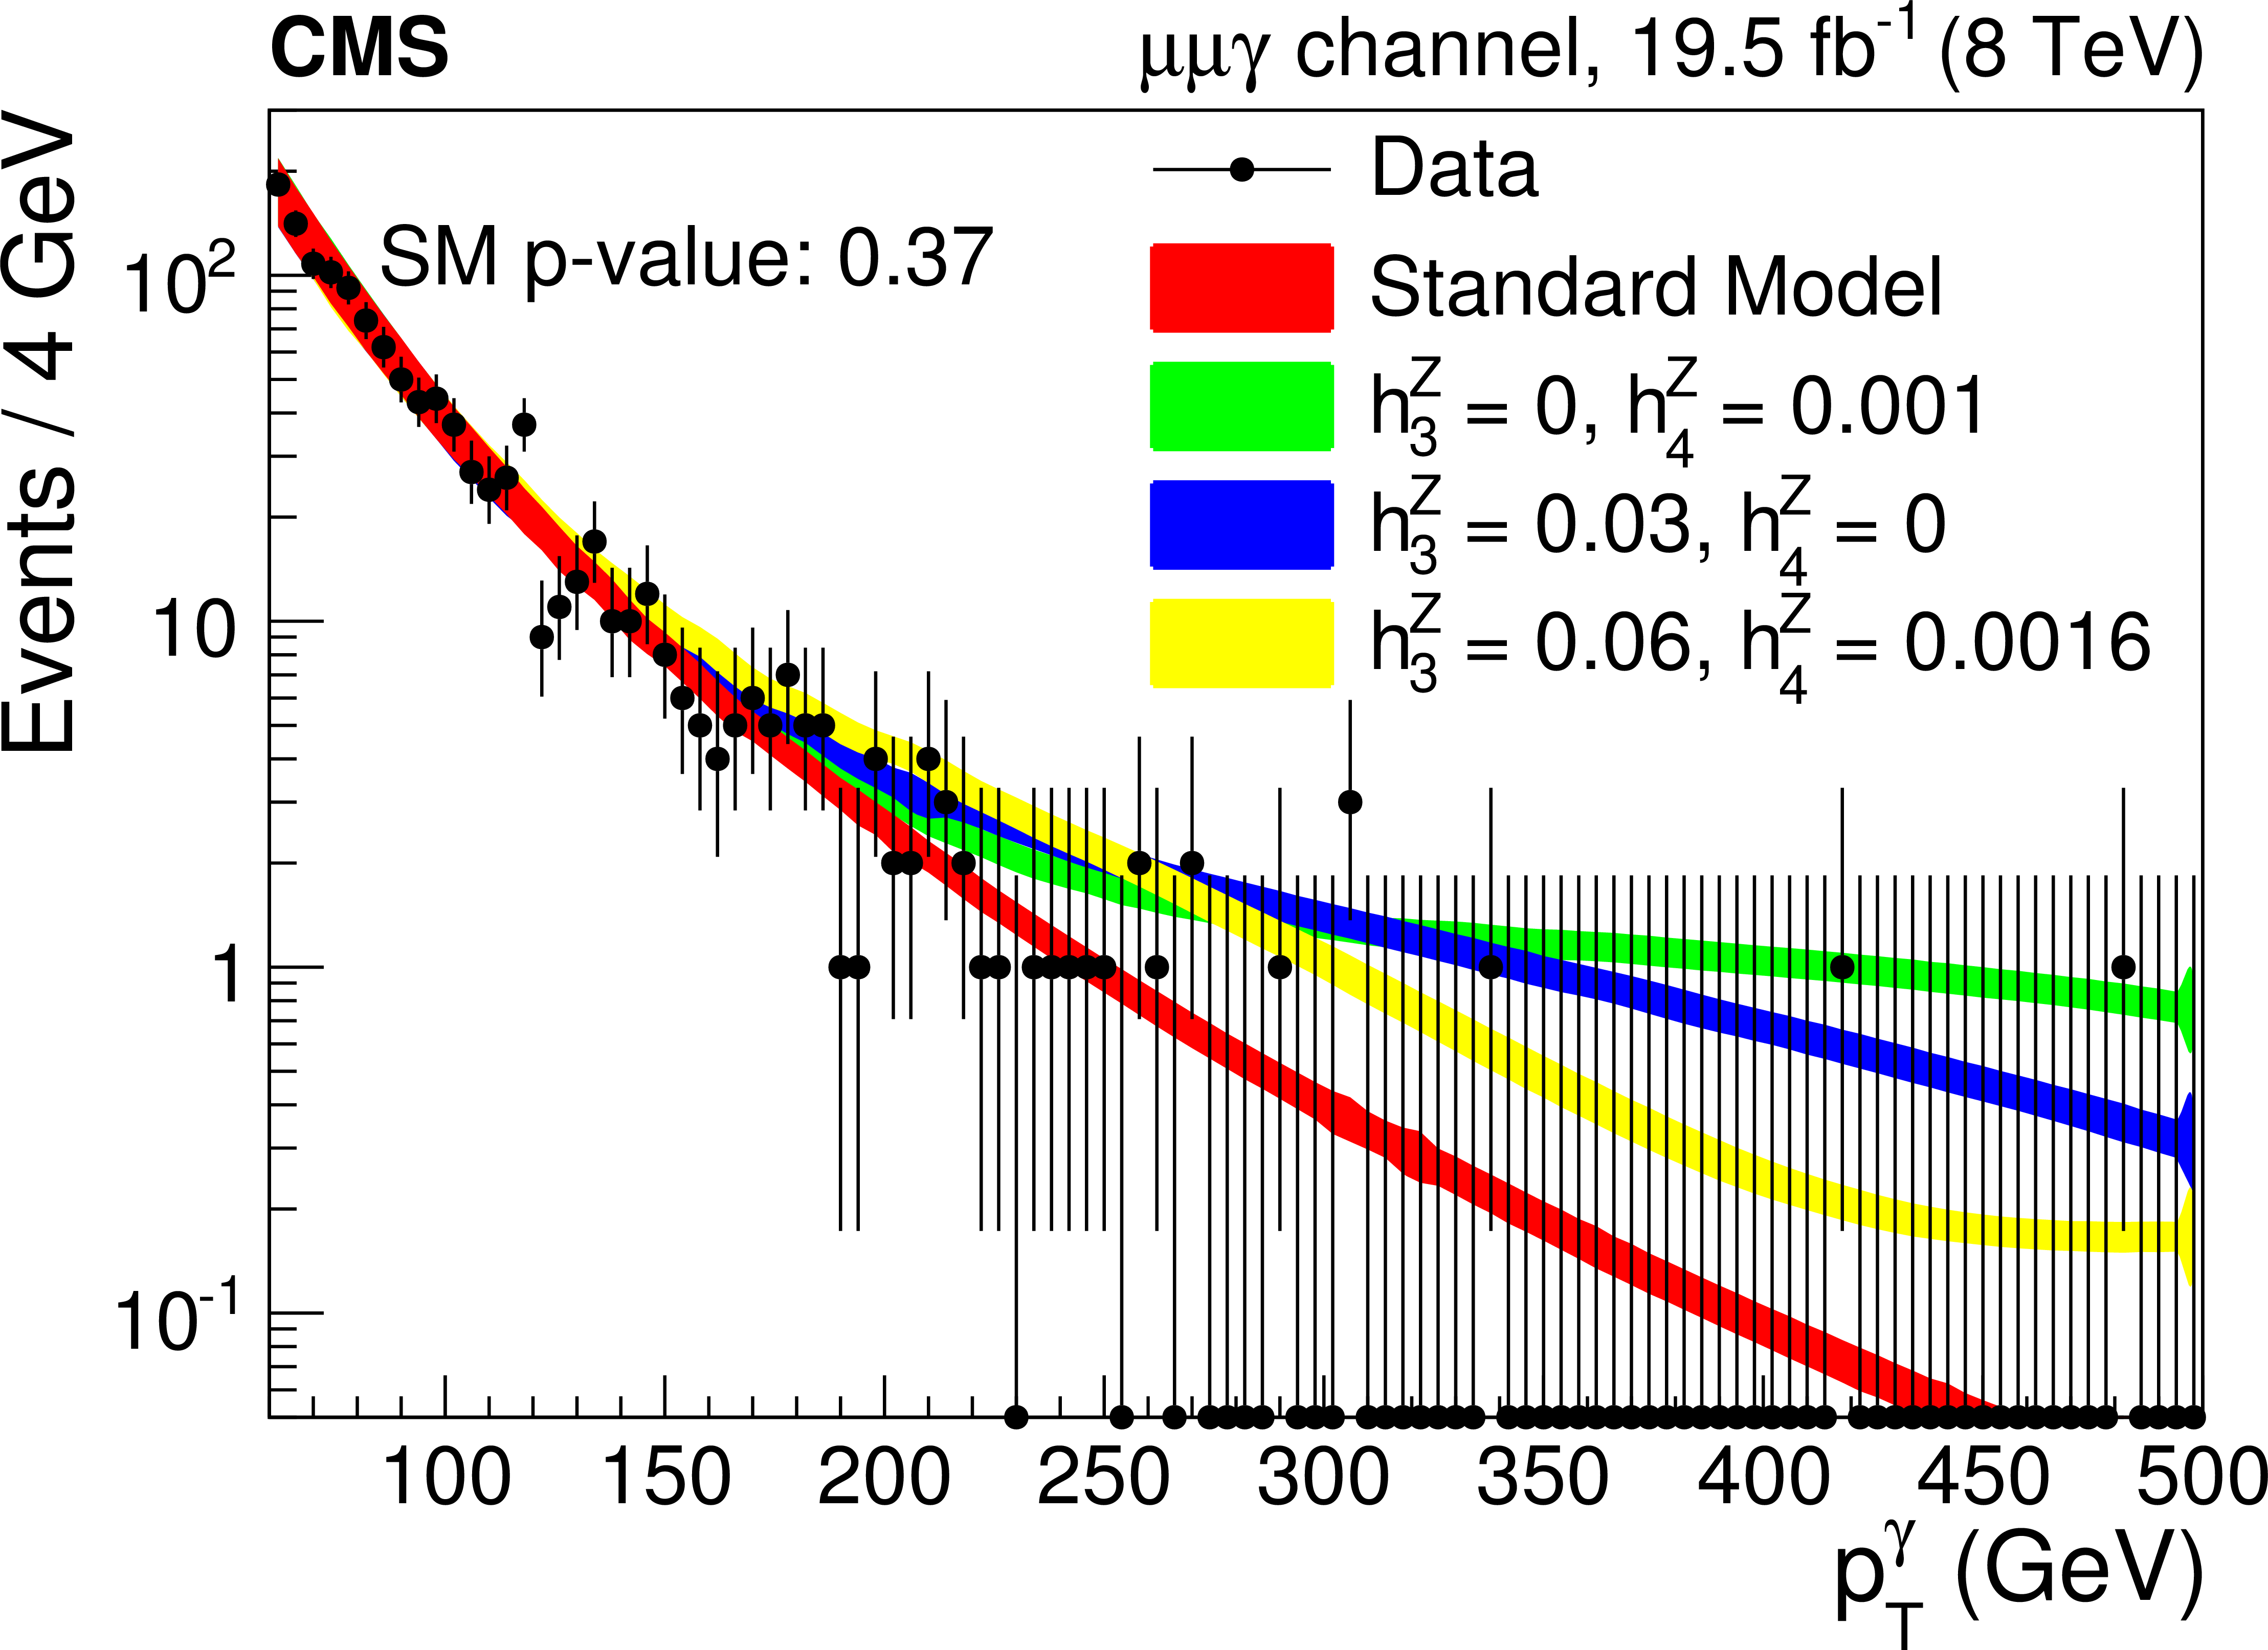
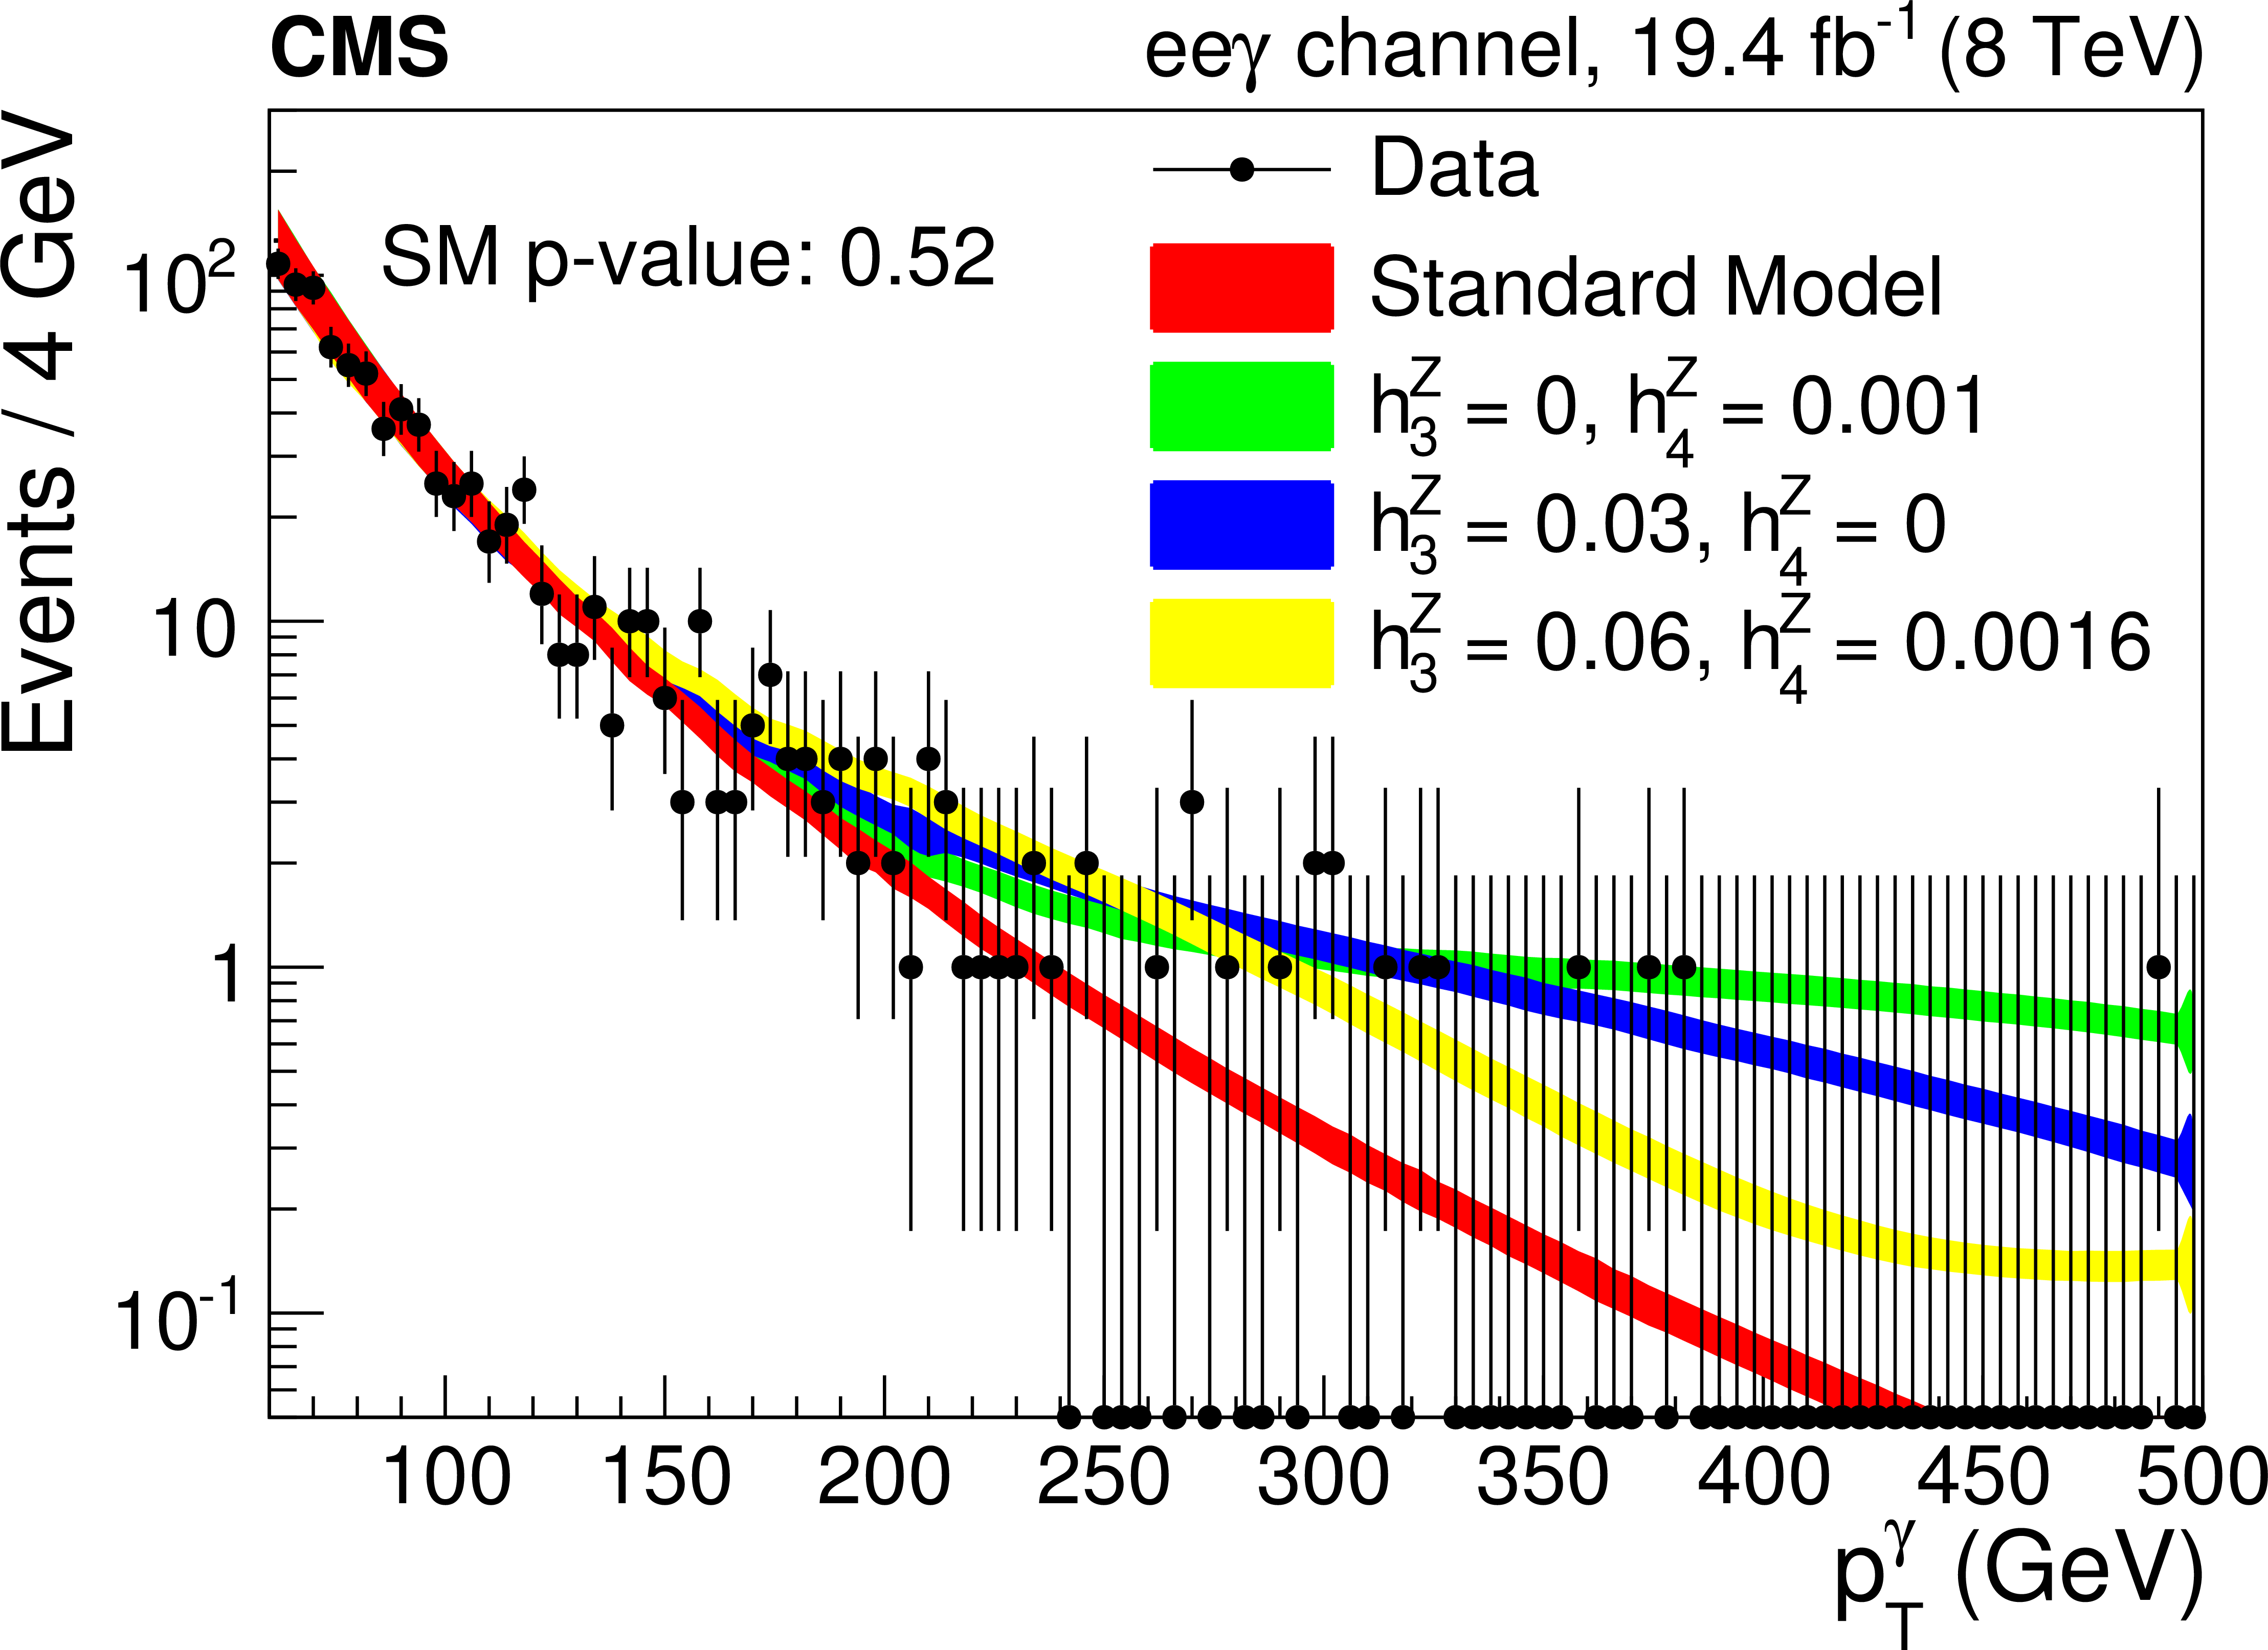
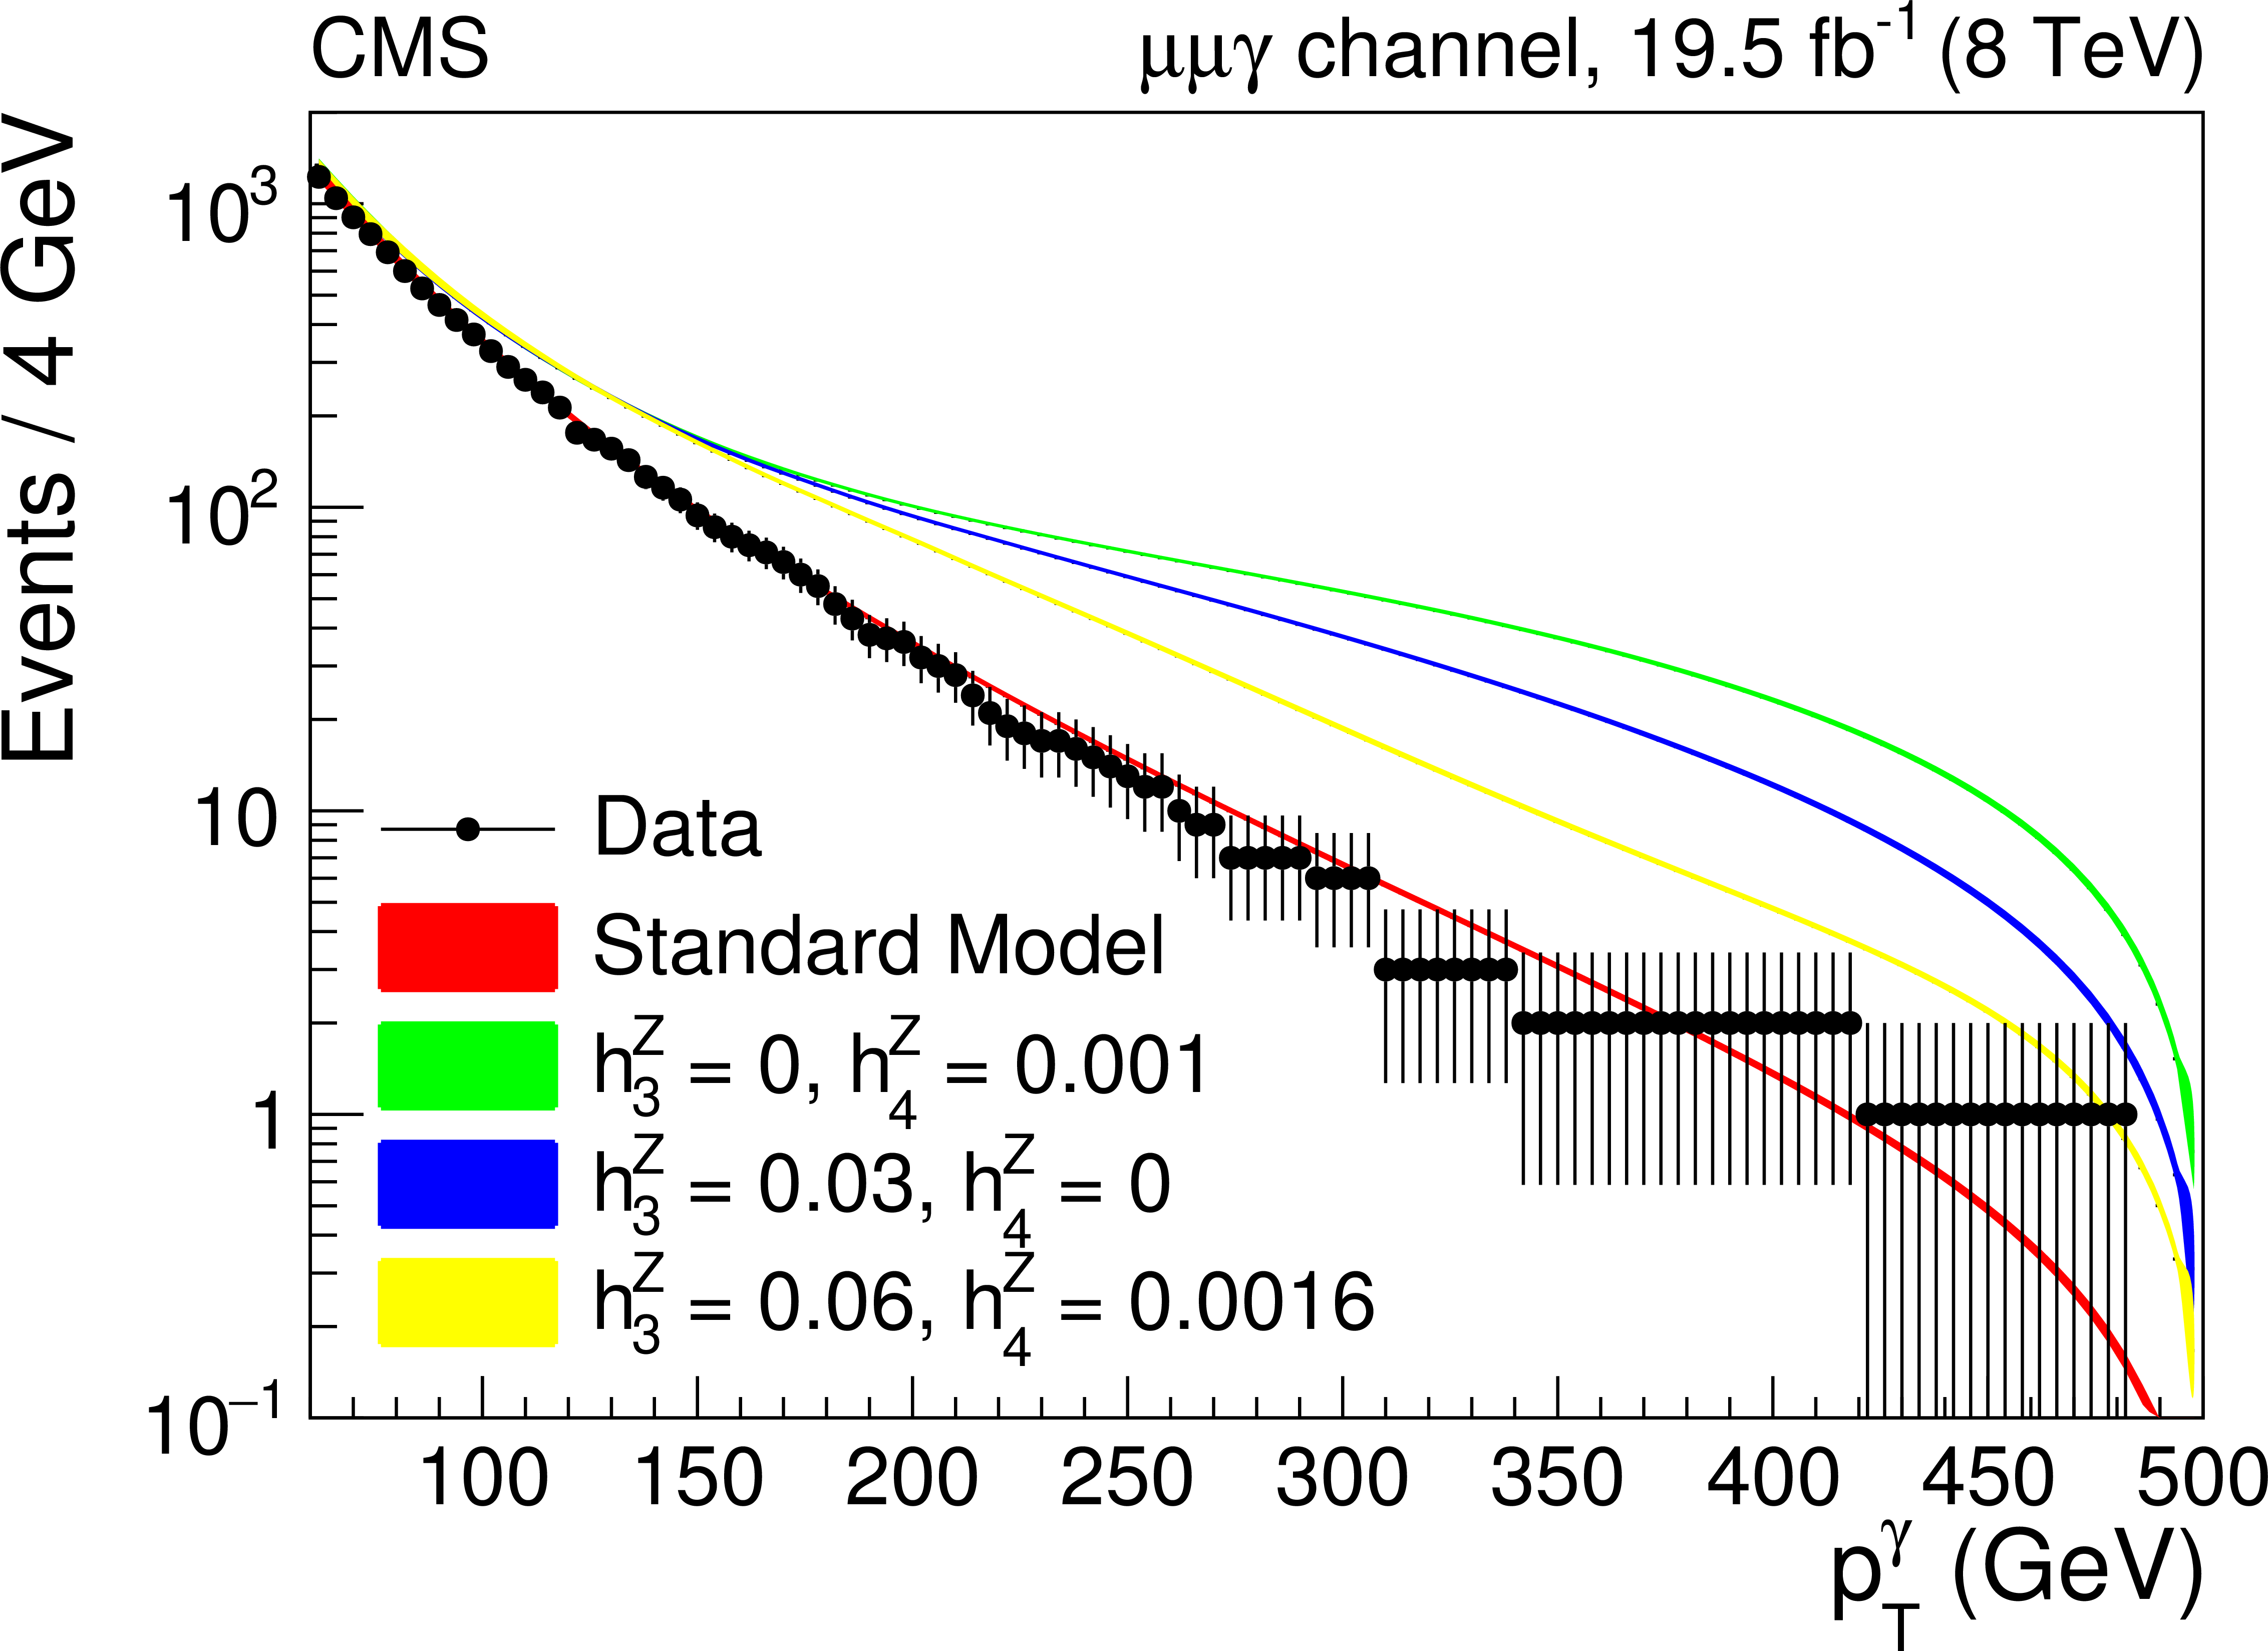
Figure 9-a:
a: the $ {p_{\mathrm {T}}^\gamma } $ distribution compared to predictions using various values for the aTGC's and the SM. The observed $p$-values show that data are fully compatible with the SM expectation (red). b: corresponding cumulated distributions. |
png pdf |
Figure 9-b:
a: the $ {p_{\mathrm {T}}^\gamma } $ distribution compared to predictions using various values for the aTGC's and the SM. The observed $p$-values show that data are fully compatible with the SM expectation (red). b: corresponding cumulated distributions. |
png pdf |
Figure 9-c:
a: the $ {p_{\mathrm {T}}^\gamma } $ distribution compared to predictions using various values for the aTGC's and the SM. The observed $p$-values show that data are fully compatible with the SM expectation (red). b: corresponding cumulated distributions. |

png pdf |
Figure 9-d:
a: the $ {p_{\mathrm {T}}^\gamma } $ distribution compared to predictions using various values for the aTGC's and the SM. The observed $p$-values show that data are fully compatible with the SM expectation (red). b: corresponding cumulated distributions. |

png pdf |
Figure 10-a:
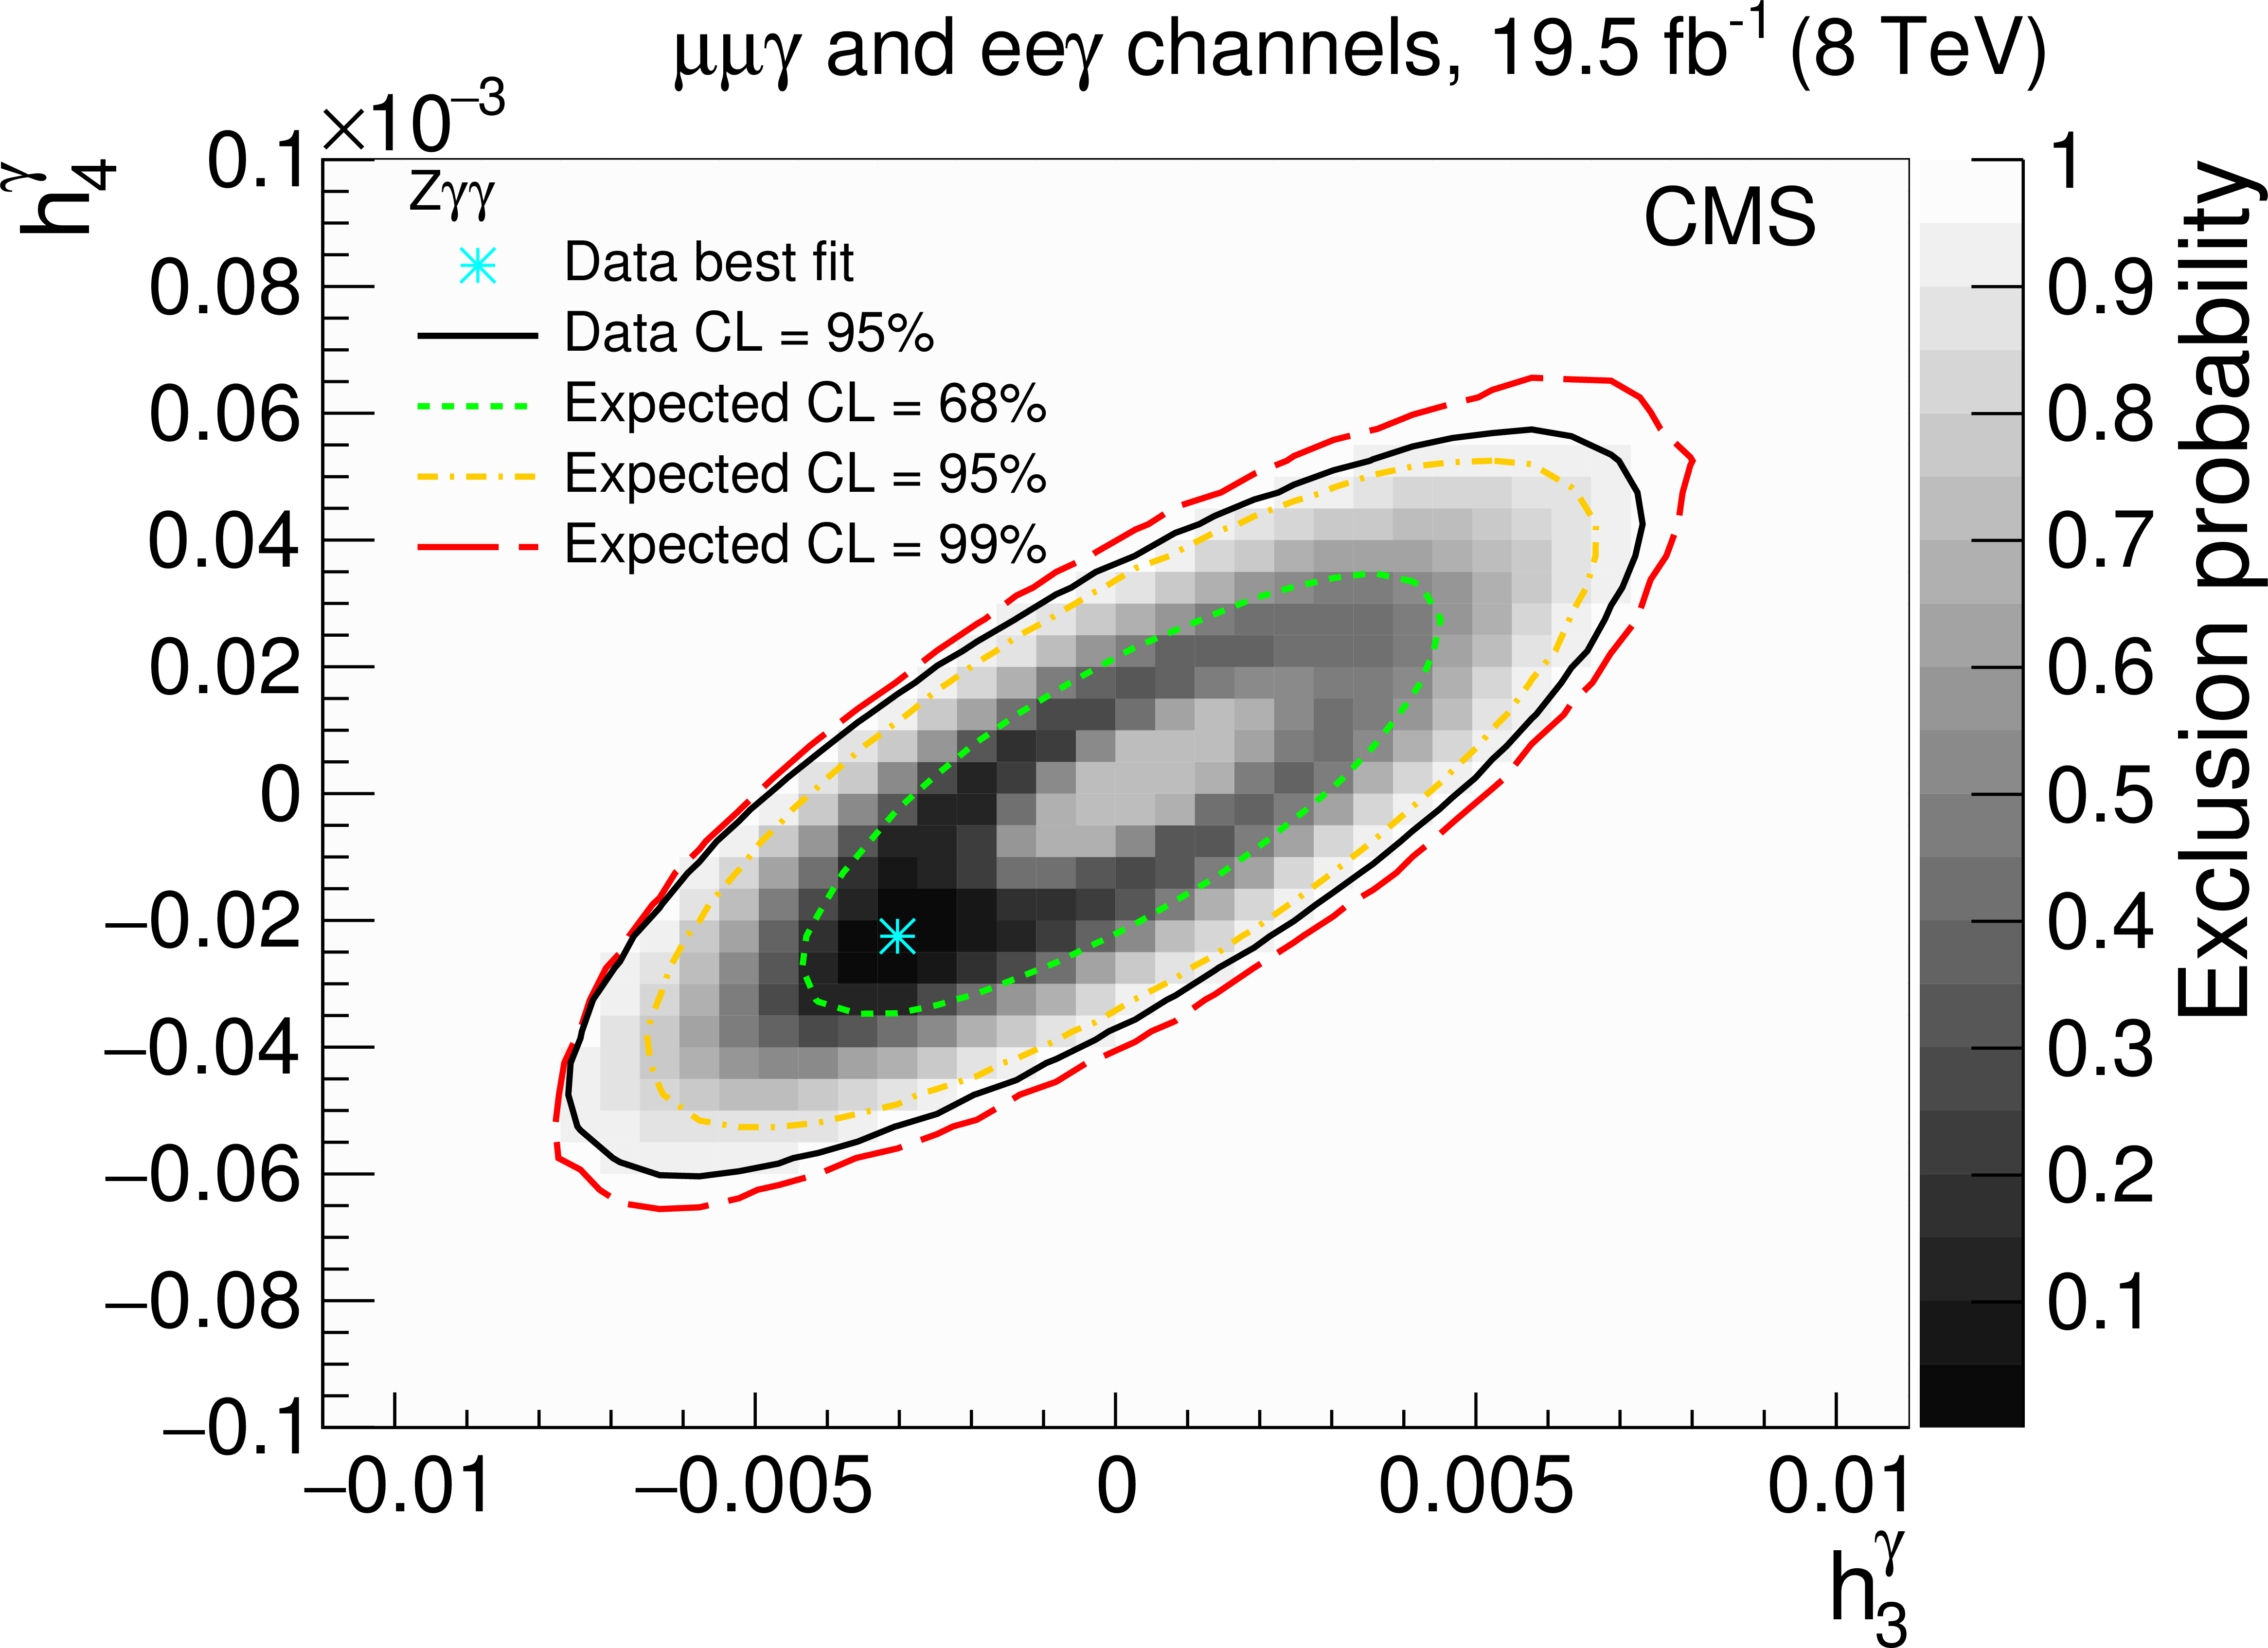
Best fit of the combined muon and electron channels for models of anomalous $ { {\mathrm {Z}} {\mathrm {Z}} \gamma } $ (a) and $ { {\mathrm {Z}} \gamma \gamma }$ (b) couplings. No form factor is used. The light blue star indicates the point of highest probability. The level of gray represents the exclusion probability and the black line corresponds to the 95% CL limit. In addition, several expected contours from SM simulation are shown. |
png pdf |
Figure 10-b:
Best fit of the combined muon and electron channels for models of anomalous $ { {\mathrm {Z}} {\mathrm {Z}} \gamma } $ (a) and $ { {\mathrm {Z}} \gamma \gamma }$ (b) couplings. No form factor is used. The light blue star indicates the point of highest probability. The level of gray represents the exclusion probability and the black line corresponds to the 95% CL limit. In addition, several expected contours from SM simulation are shown. |
| Additional Figures | |
png pdf |
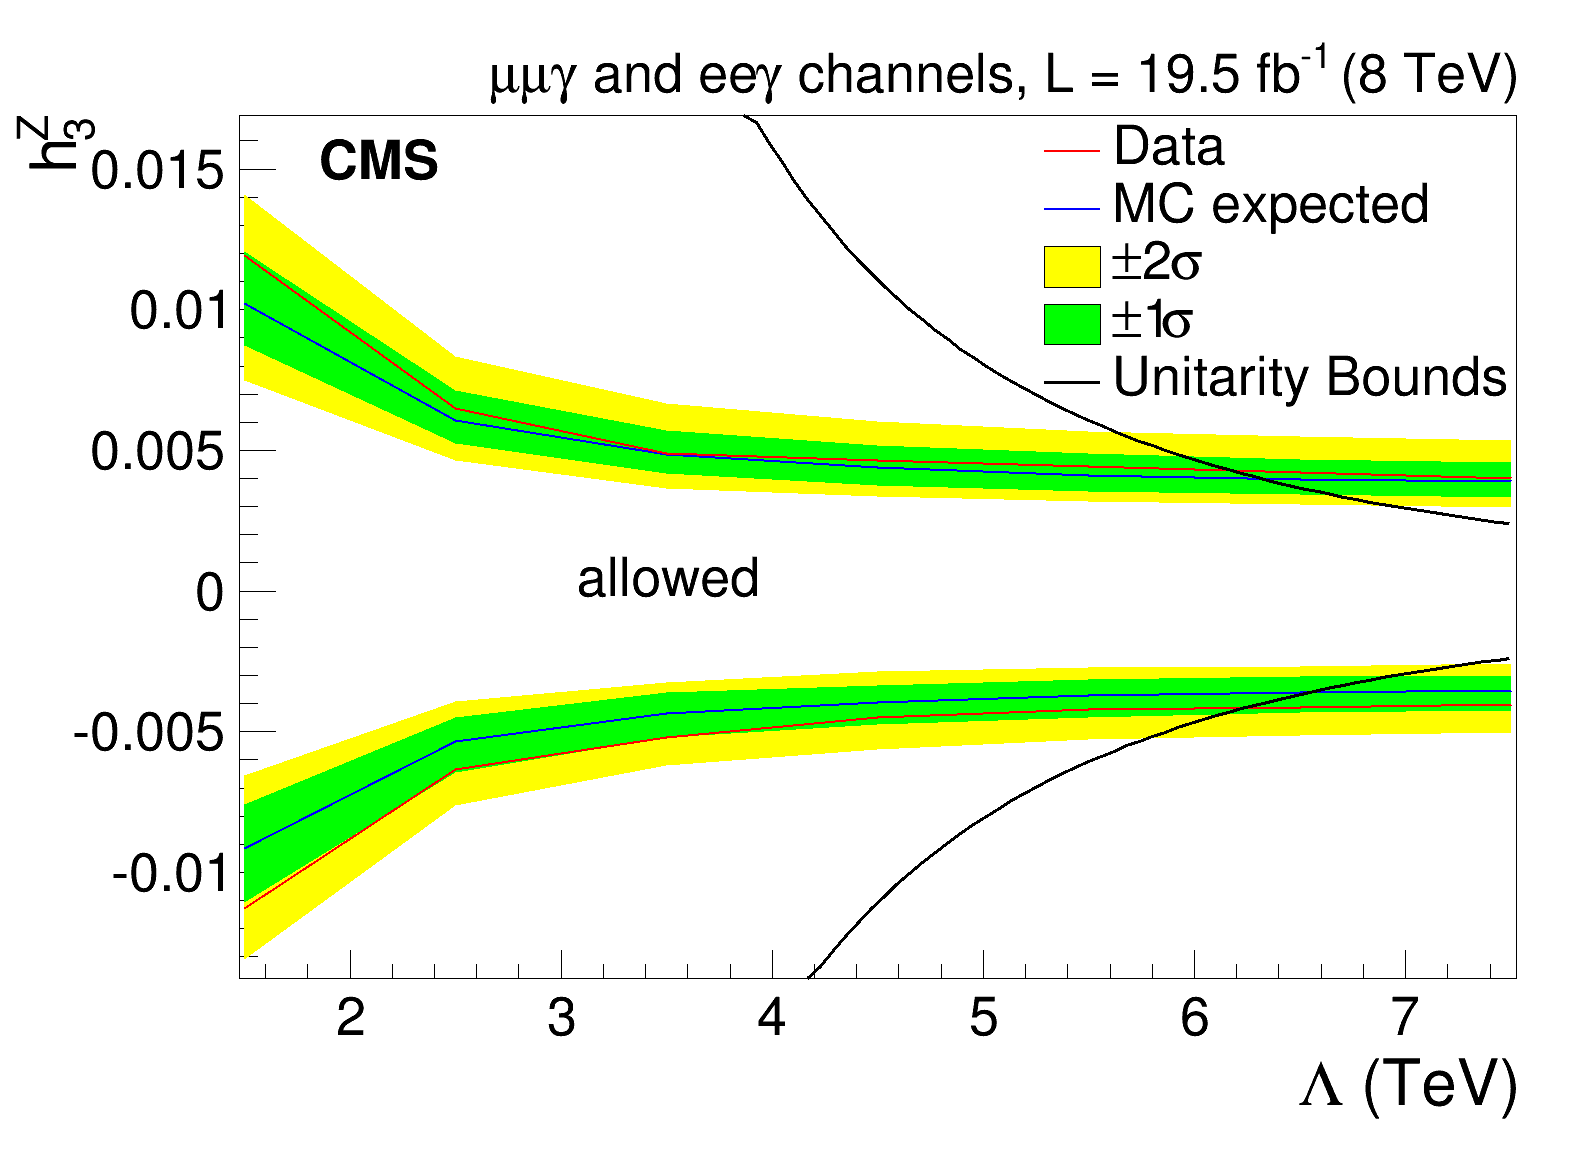
Additional Figure 1-a:
Limits on the anomalous $\mathrm{Z\gamma\gamma}$ couplings $\mathrm{h}_3^Z$ (a) and $\mathrm{h}_4^Z$ (b) as a function of the form factor scale $\Lambda$. |
png pdf |
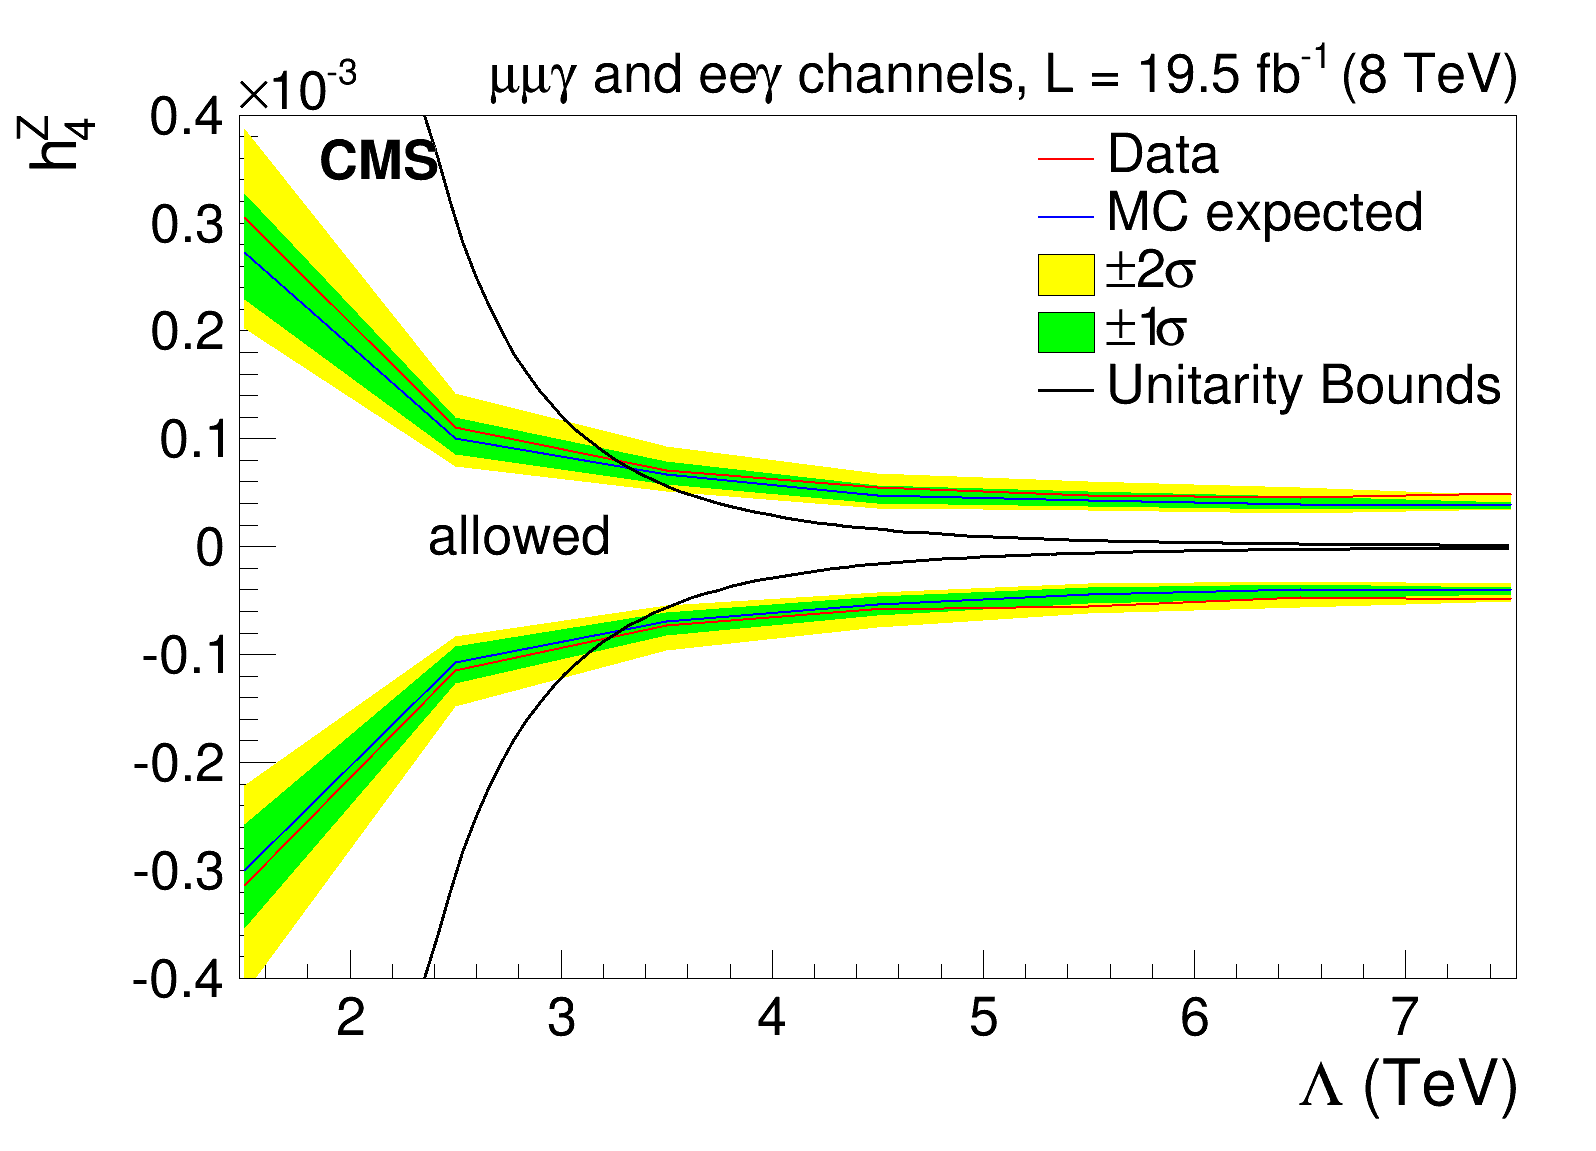
Additional Figure 1-b:
Limits on the anomalous $\mathrm{Z\gamma\gamma}$ couplings $\mathrm{h}_3^Z$ (a) and $\mathrm{h}_4^Z$ (b) as a function of the form factor scale $\Lambda$. |
png pdf |
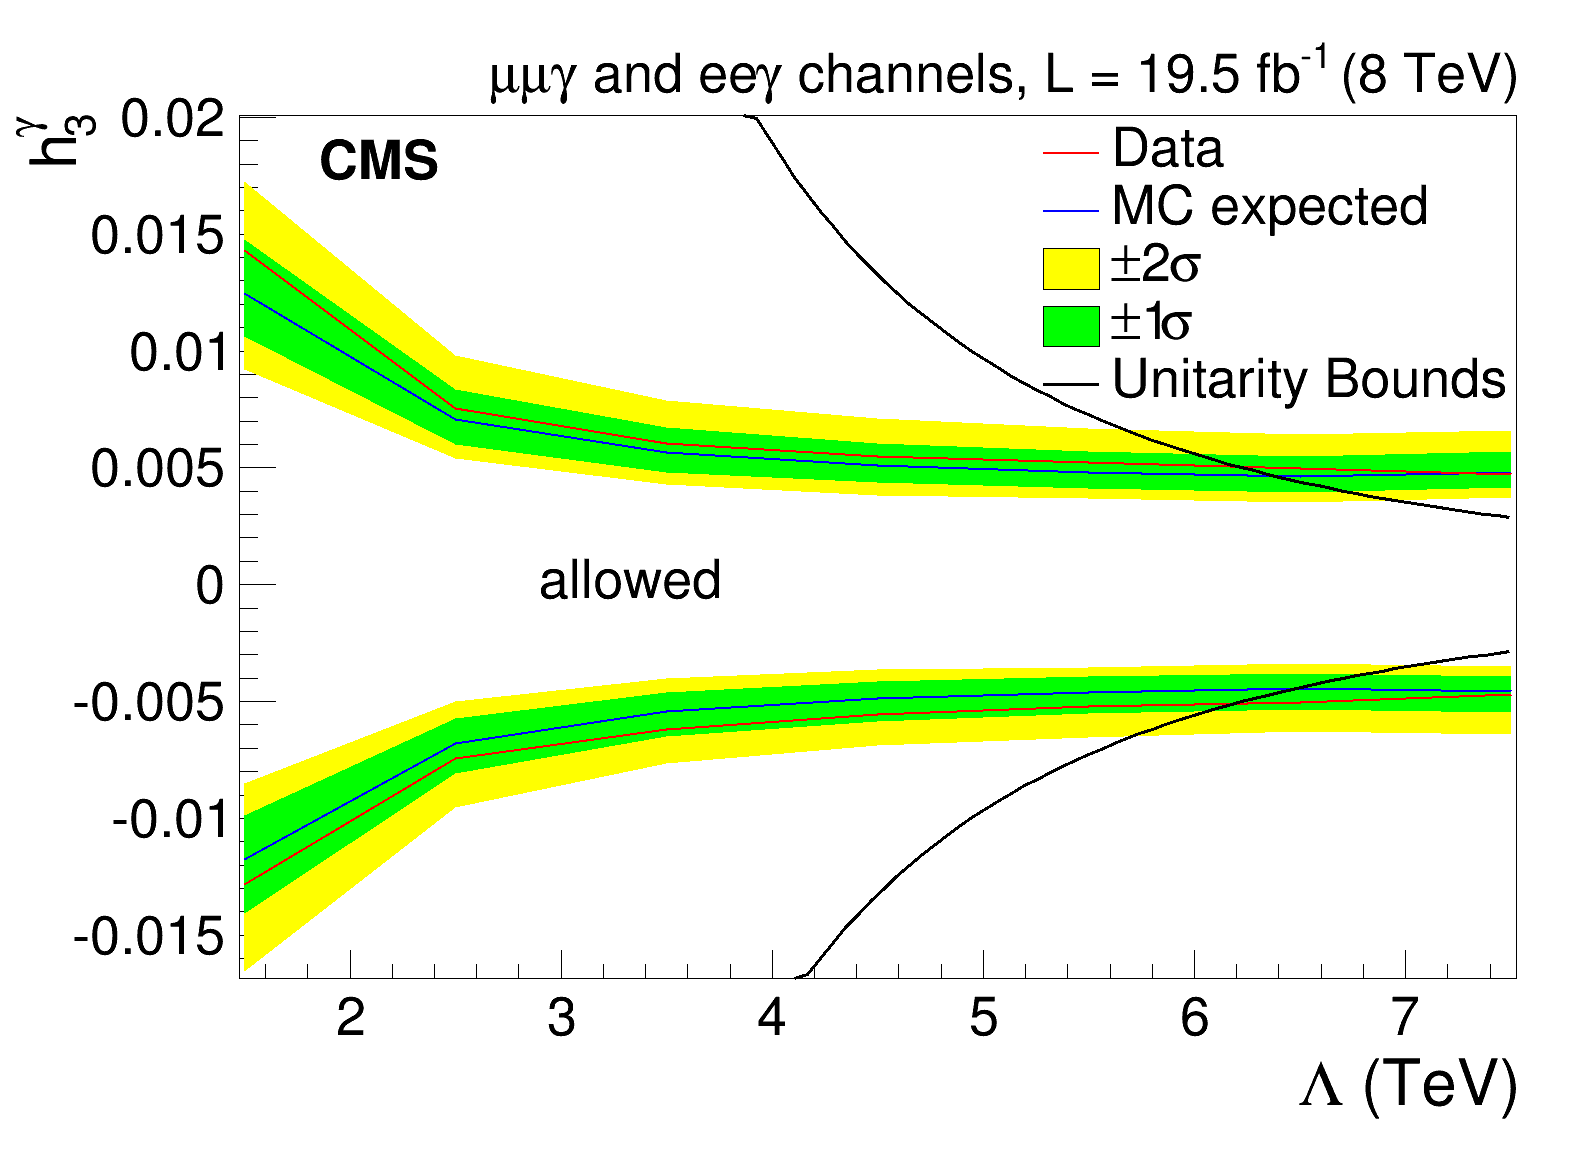
Additional Figure 2-a:
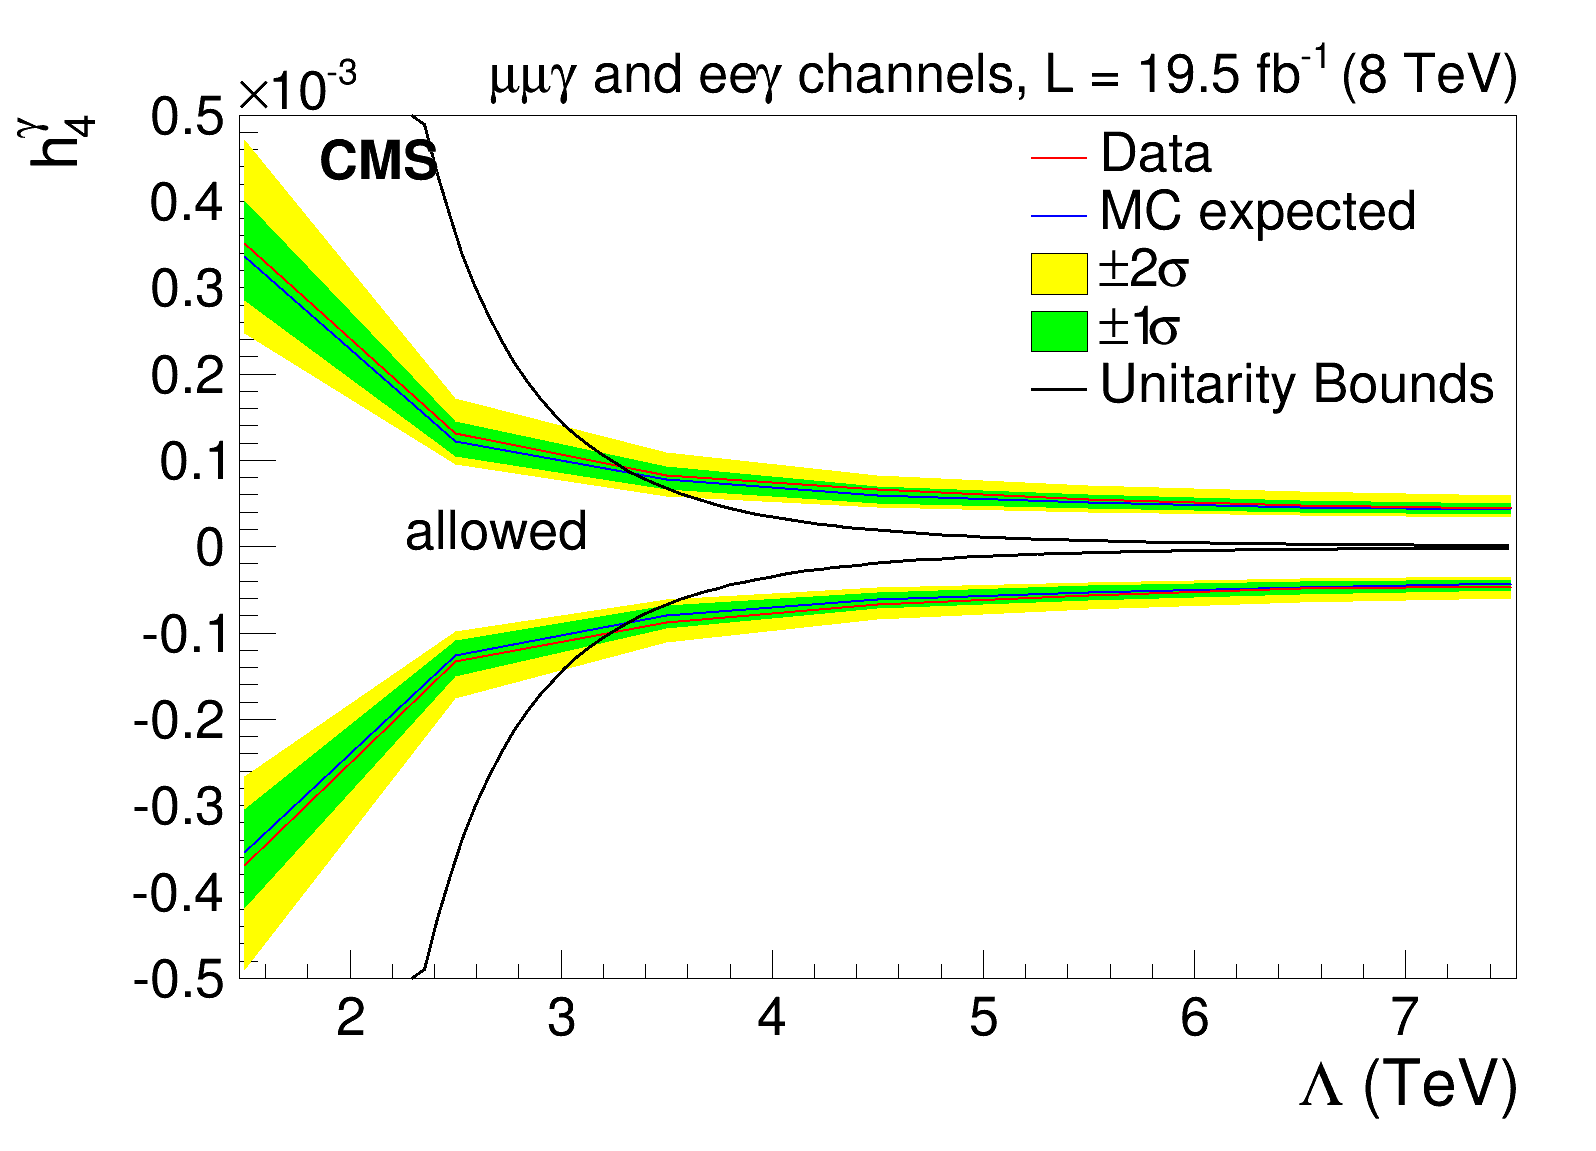
Limits on the anomalous $\mathrm{ZZ\gamma}$ couplings $\mathrm{h}_3^{\gamma}$ (a) and $\mathrm{h}_4^{\gamma}$ (b) as a function of the form factor scale $\Lambda$. |
png pdf |
Additional Figure 2-b:
Limits on the anomalous $\mathrm{ZZ\gamma}$ couplings $\mathrm{h}_3^{\gamma}$ (a) and $\mathrm{h}_4^{\gamma}$ (b) as a function of the form factor scale $\Lambda$. |
png pdf |
Additional Figure 3-a:
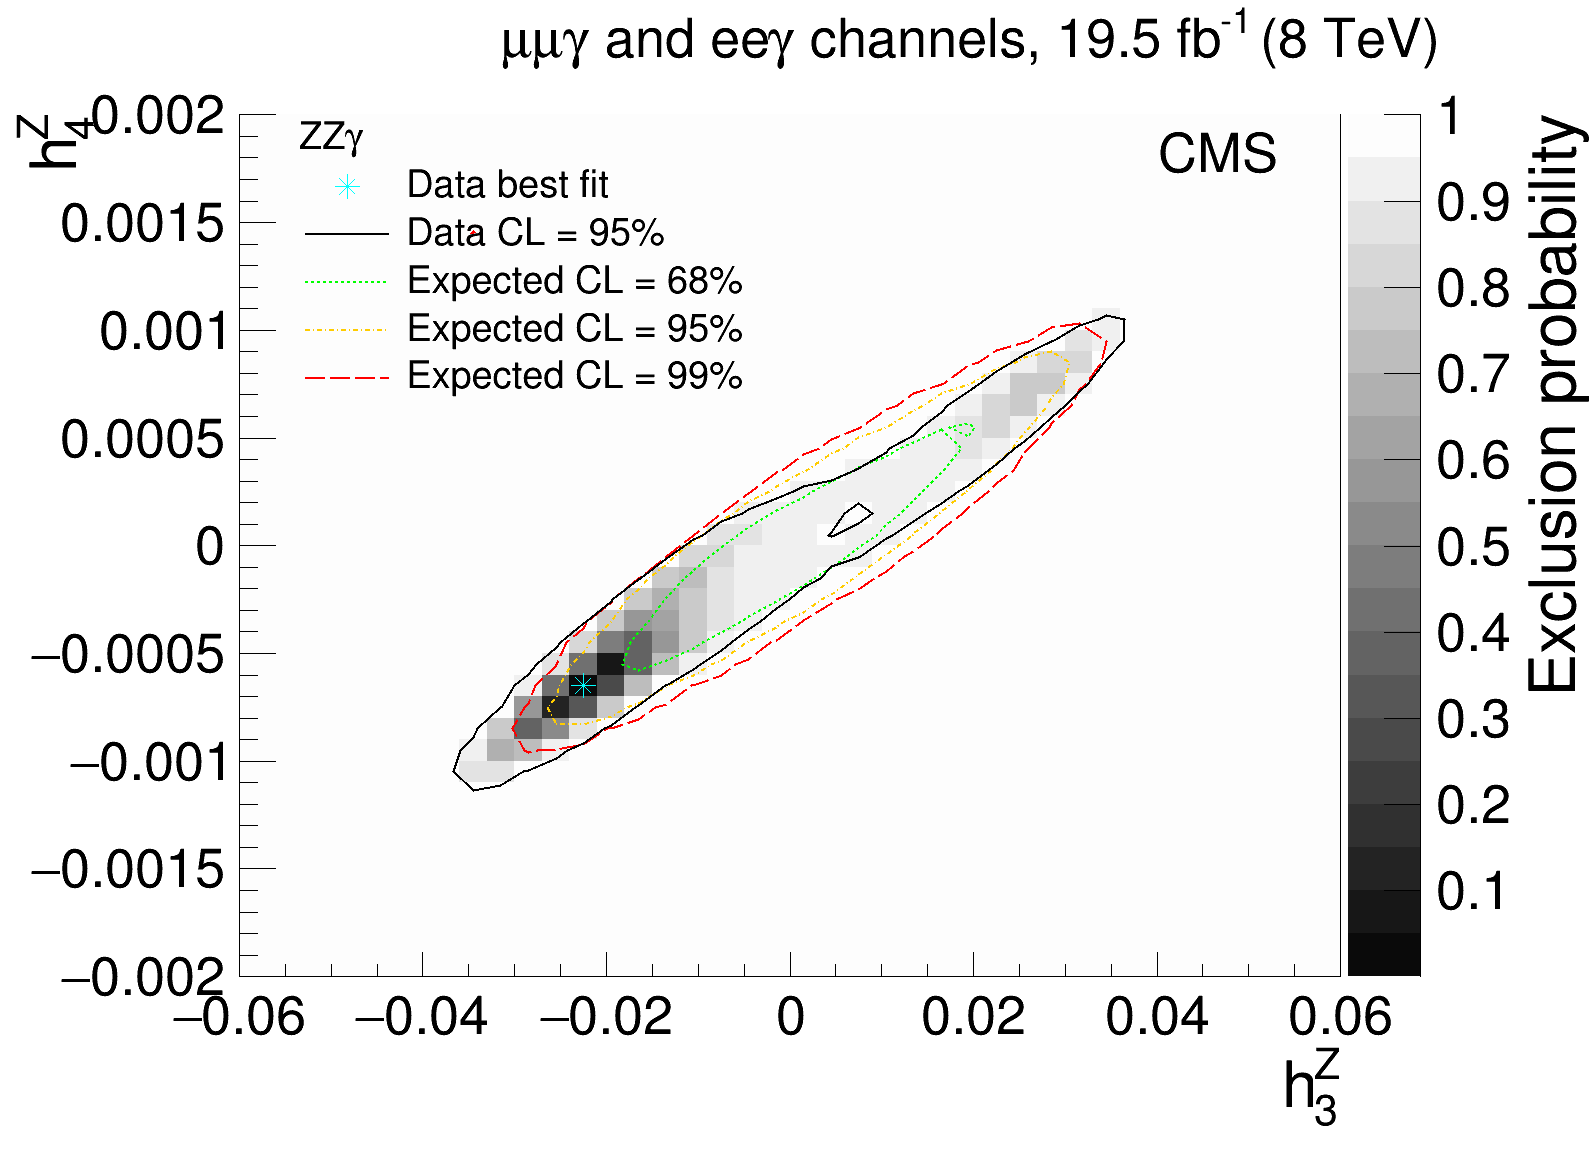
Best fit of the combined muon and electron channels for models of anomalous $\mathrm{ZZ\gamma}$ (a) and $\mathrm{Z\gamma\gamma}$ (b) couplings. A form factor scale of $\Lambda =$ 1.5 TeV is used. The blue marker indicates the point of highest probability. The level of gray represents the exclusion probability and the black line corresponds to the 95% CL limit. In addition several expected contours from SM simulation are shown. |

png pdf |
Additional Figure 3-b:
Best fit of the combined muon and electron channels for models of anomalous $\mathrm{ZZ\gamma}$ (a) and $\mathrm{Z\gamma\gamma}$ (b) couplings. A form factor scale of $\Lambda =$ 1.5 TeV is used. The blue marker indicates the point of highest probability. The level of gray represents the exclusion probability and the black line corresponds to the 95% CL limit. In addition several expected contours from SM simulation are shown. |
|
|
Compact Muon Solenoid LHC, CERN |
|

|

|

|

|

|