
Compact Muon Solenoid
LHC, CERN
| CMS-SMP-14-003 ; CERN-PH-EP-2014-289 | ||
| Measurements of differential and double-differential Drell-Yan cross sections in proton-proton collisions at $\sqrt{s}$ = 8 TeV | ||
| CMS Collaboration | ||
| 3 December 2014 | ||
| Eur. Phys. J. C 75 (2015) 147 | ||
| Abstract: Measurements of the differential and double-differential Drell-Yan cross sections in the dielectron and dimuon channels are presented. They are based on proton-proton collision data at $\sqrt{s}$ = 8 TeV recorded with the CMS detector at the LHC and corresponding to an integrated luminosity of 19.7 fb$^{-1} $. The measured inclusive cross section in the Z peak region (60-120 GeV), obtained from the combination of the dielectron and dimuon channels, is 1138 $\pm$ 8 (exp) $\pm$ 25 (theo) $\pm$ 30 (lumi) pb, where the statistical uncertainty is negligible. The differential cross section $\mathrm{d\sigma/dm}$ in the dilepton mass range 15 to 2000 GeV is measured and corrected to the full phase space. The double-differential cross section $\mathrm{d^2\sigma / dm \, d|y|}$ is also measured over the mass range 20 to 1500 GeV and absolute dilepton rapidity from 0 to 2.4. In addition, the ratios of the normalized differential cross sections measured at $\sqrt{s}$ = 7 and 8 TeV are presented. These measurements are compared to the predictions of perturbative QCD at next-to-leading and next-to-next-to-leading (NNLO) orders using various sets of parton distribution functions (PDFs). The results agree with the NNLO theoretical predictions computed with FEWZ 3.1 using the CT10 NNLO and NNPDF2.1 NNLO PDFs. The measured double-differential cross section and ratio of normalized differential cross sections are sufficiently precise to constrain the proton PDFs. | ||
| Links: e-print arXiv:1412.1115 [hep-ex] (PDF) ; CDS record ; inSPIRE record ; Public twiki page ; HepData record ; CADI line (restricted) ; | ||
| Tables | |

png pdf |
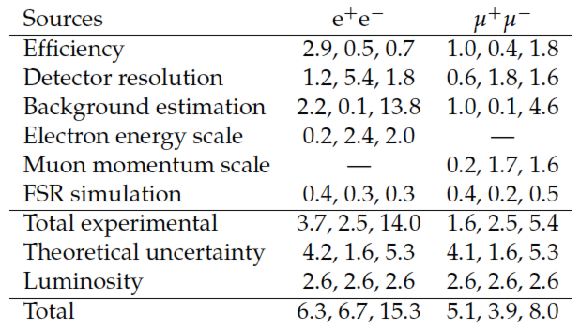
Table 1:
Typical systematic uncertainties (in percent) at low mass (below 40 GeV), in the Z peak region (60 $< m < $ 120 GeV), and at high mass (above 200 GeV) for the dielectron and dimuon channels; ``---'' means that the source does not apply. |

png pdf |
Table 2:
Absolute cross section measurements in the Z peak region (60 $< m <$ 120 GeV). The uncertainties in the measurements include the experimental and theoretical systematic sources and the uncertainty in the integrated luminosity. The statistical component is negligible. |

|
Compact Muon Solenoid LHC, CERN |

|

|

|

|

|

|