

Compact Muon Solenoid
LHC, CERN
| CMS-SMP-14-004 ; CERN-PH-EP-2015-295 | ||
| Forward-backward asymmetry of Drell-Yan lepton pairs in pp collisions at $\sqrt{s} = $ 8 TeV | ||
| CMS Collaboration | ||
| 18 January 2016 | ||
| Eur. Phys. J. C 76 (2016) 325 | ||
| Abstract: A measurement of the forward-backward asymmetry $A_{\mathrm{FB}}$ of oppositely charged lepton pairs ($\mu\mu$ and $\mathrm{ e }\mathrm{ e }$) produced via $\mathrm{Z}/\gamma^*$ boson exchange in pp collisions at $\sqrt{s} = $ 8 TeV is presented. The data sample corresponds to an integrated luminosity of 19.7 fb$^{-1}$ collected with the CMS detector at the LHC. The measurement of $A_{\mathrm{FB}}$ is performed for dilepton masses between 40 GeV and 2 TeV and for dilepton rapidity up to 5. The $A_{\mathrm{FB}}$ measurements as a function of dilepton mass and rapidity are compared with the standard model predictions. | ||
| Links: e-print arXiv:1601.04768 [hep-ex] (PDF) ; CDS record ; inSPIRE record ; HepData record ; CADI line (restricted) ; | ||
| Figures | |
png pdf |
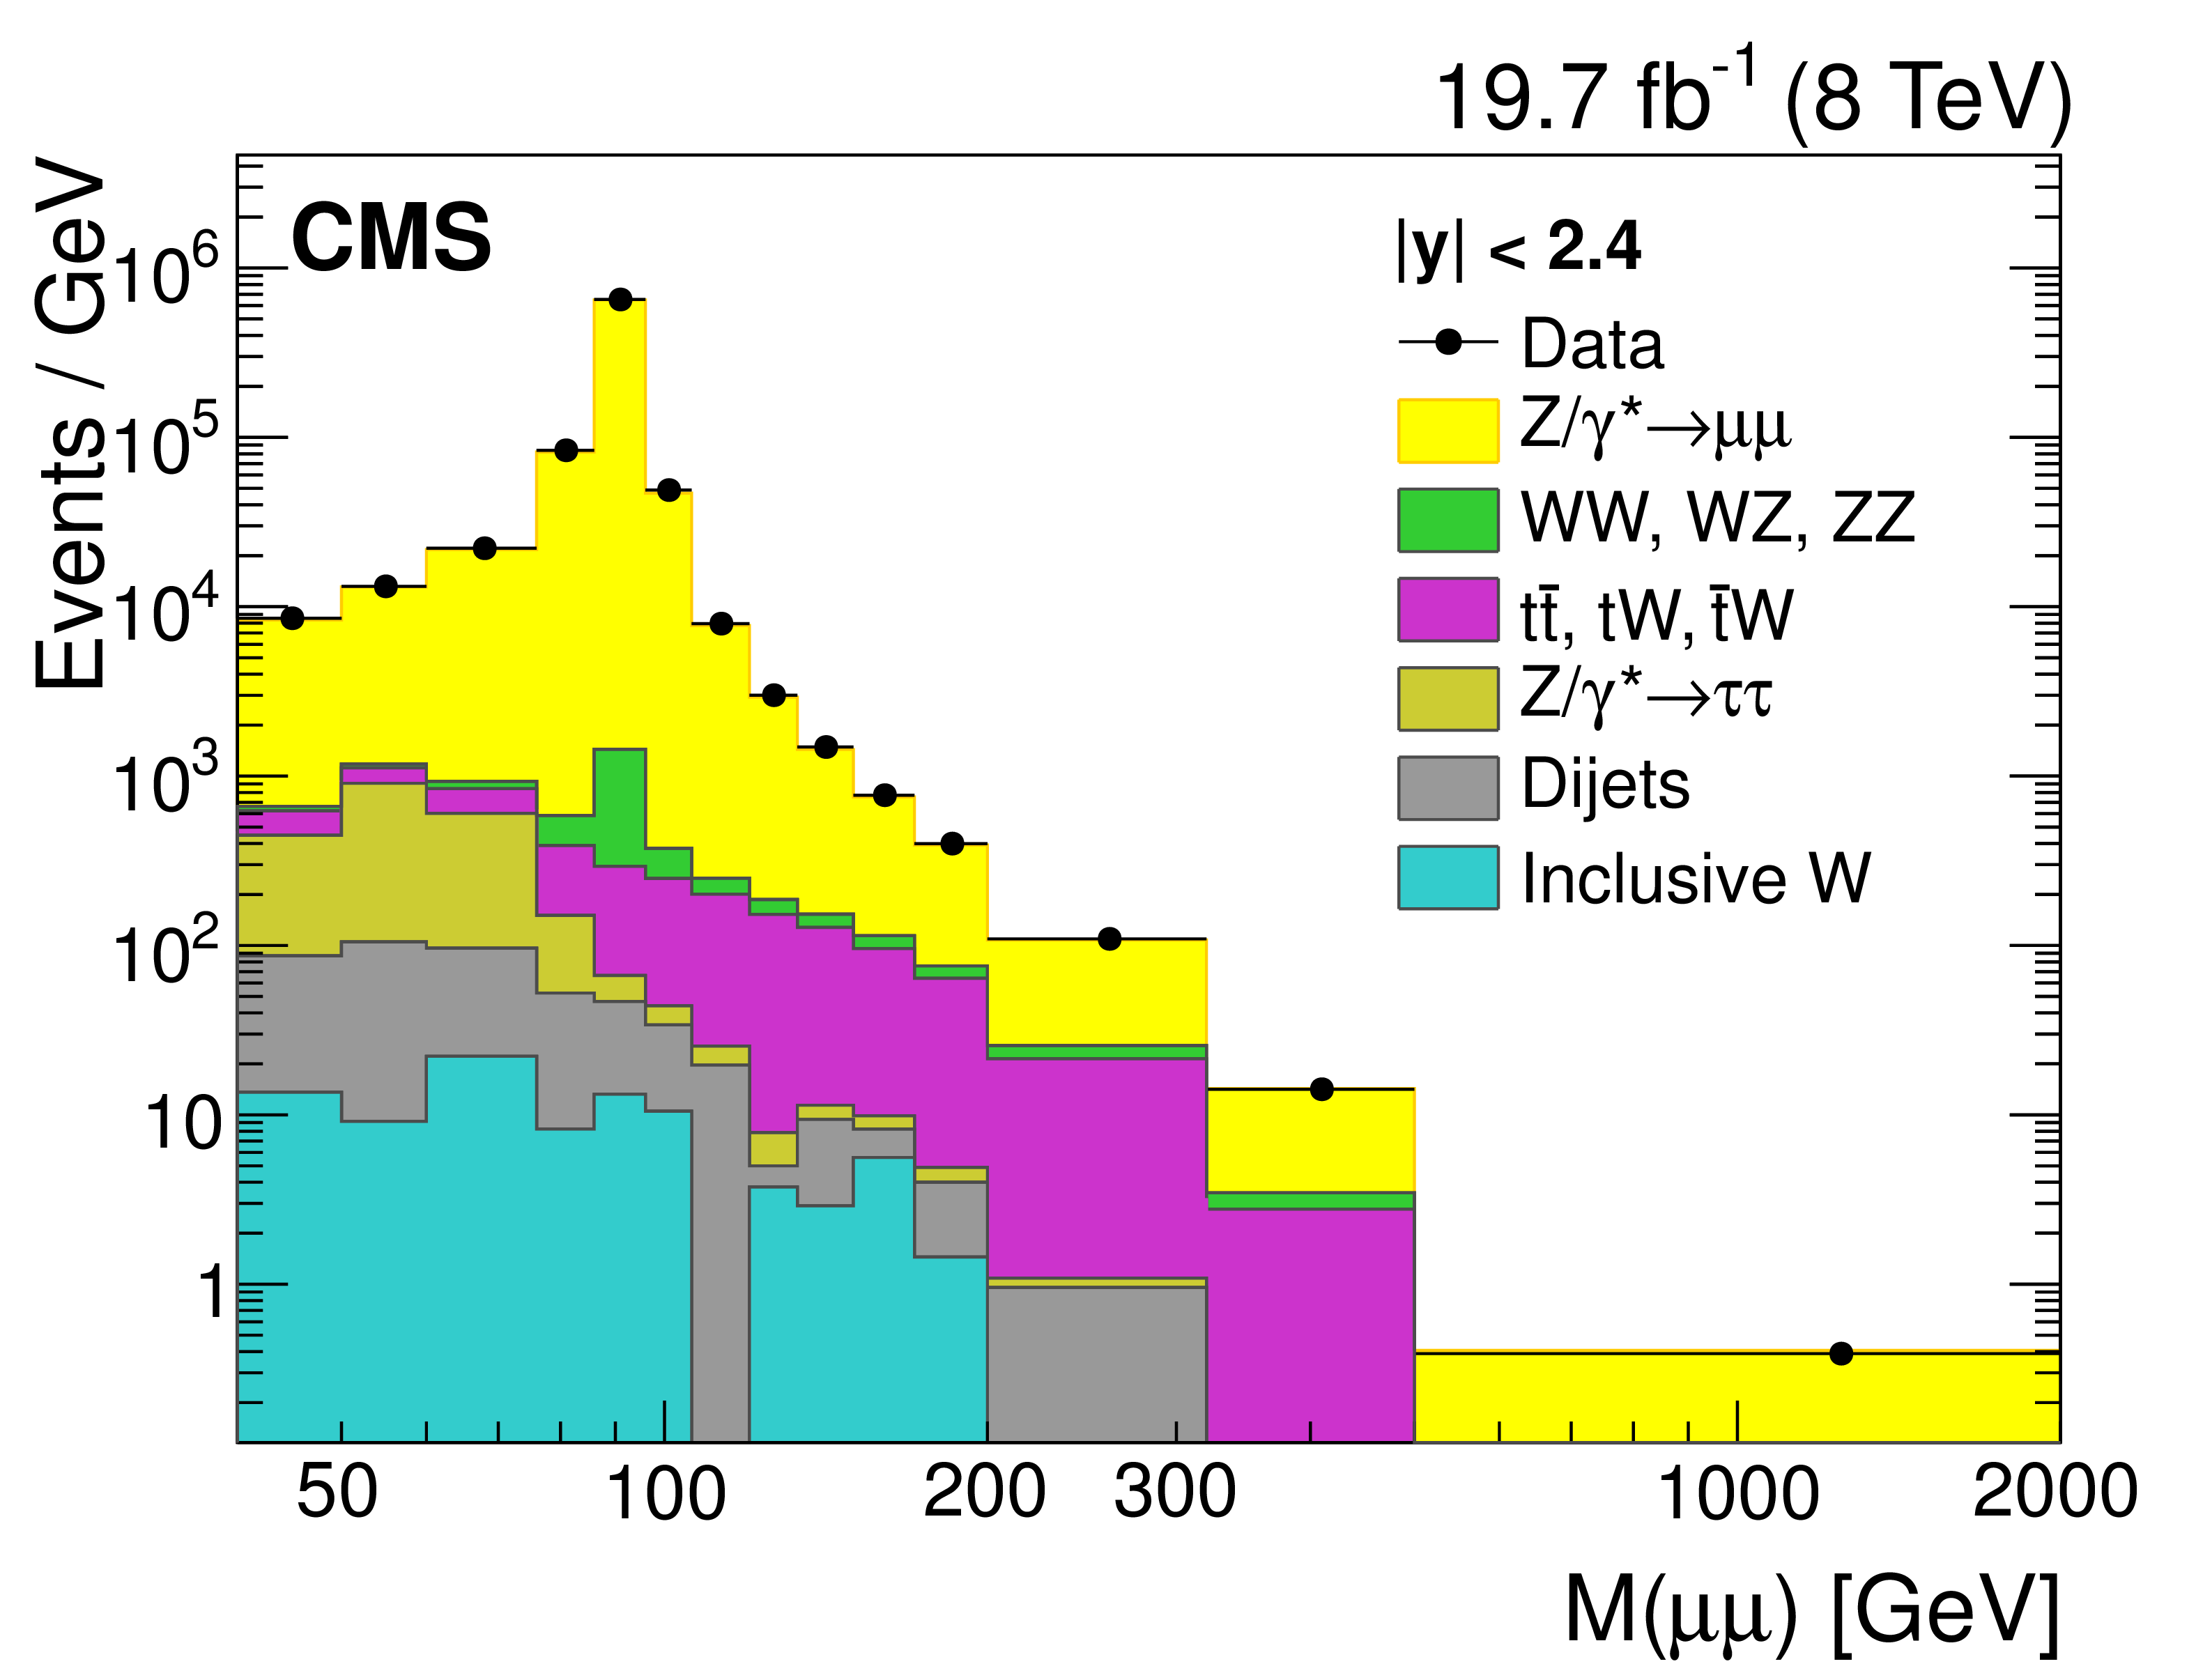
Figure 1-a:
The invariant mass distributions for $\mu \mu $ (a), $\mathrm{ e } \mathrm{ e } $ (b) events with $ {| y | }< $ 2.4, and $\mathrm{ e } \mathrm{ e } $ (c) events with 2.4 $ < {| y | }< $ 5. Only statistical uncertainties are shown. The stacked histograms represent the sum of the background contributions and the signal. |
png pdf |
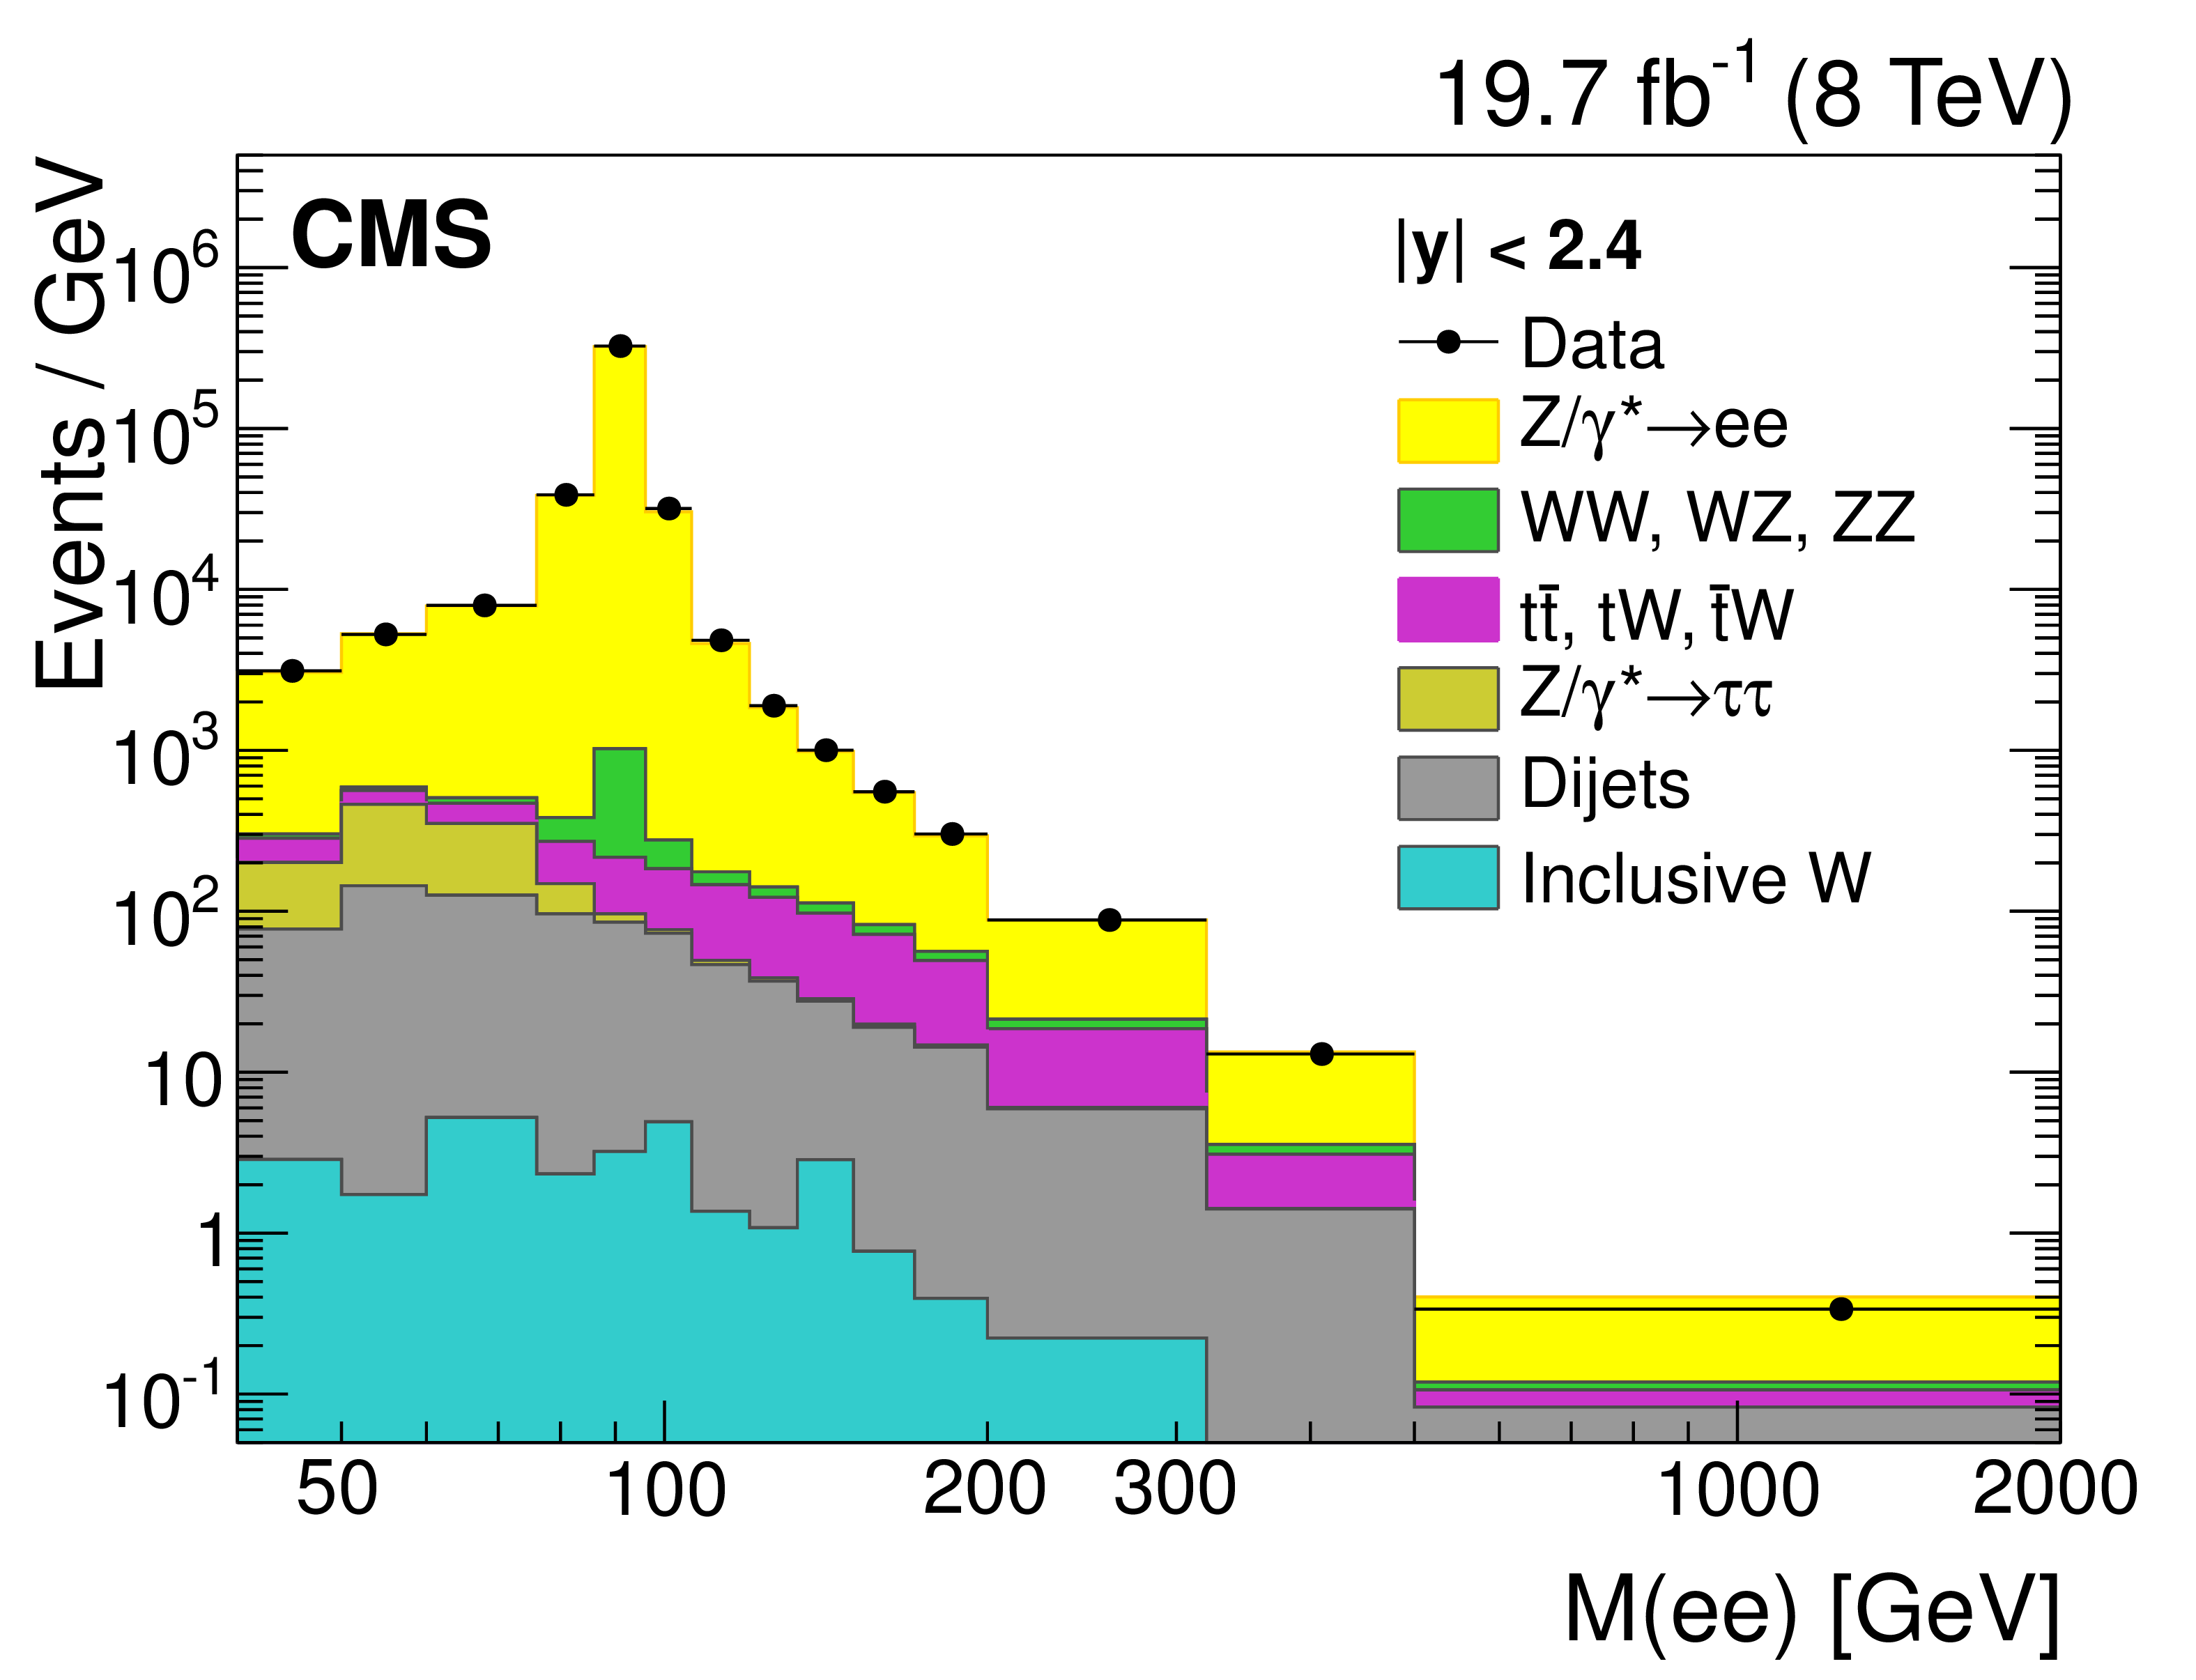
Figure 1-b:
The invariant mass distributions for $\mu \mu $ (a), $\mathrm{ e } \mathrm{ e } $ (b) events with $ {| y | }< $ 2.4, and $\mathrm{ e } \mathrm{ e } $ (c) events with 2.4 $ < {| y | }< $ 5. Only statistical uncertainties are shown. The stacked histograms represent the sum of the background contributions and the signal. |
png pdf |
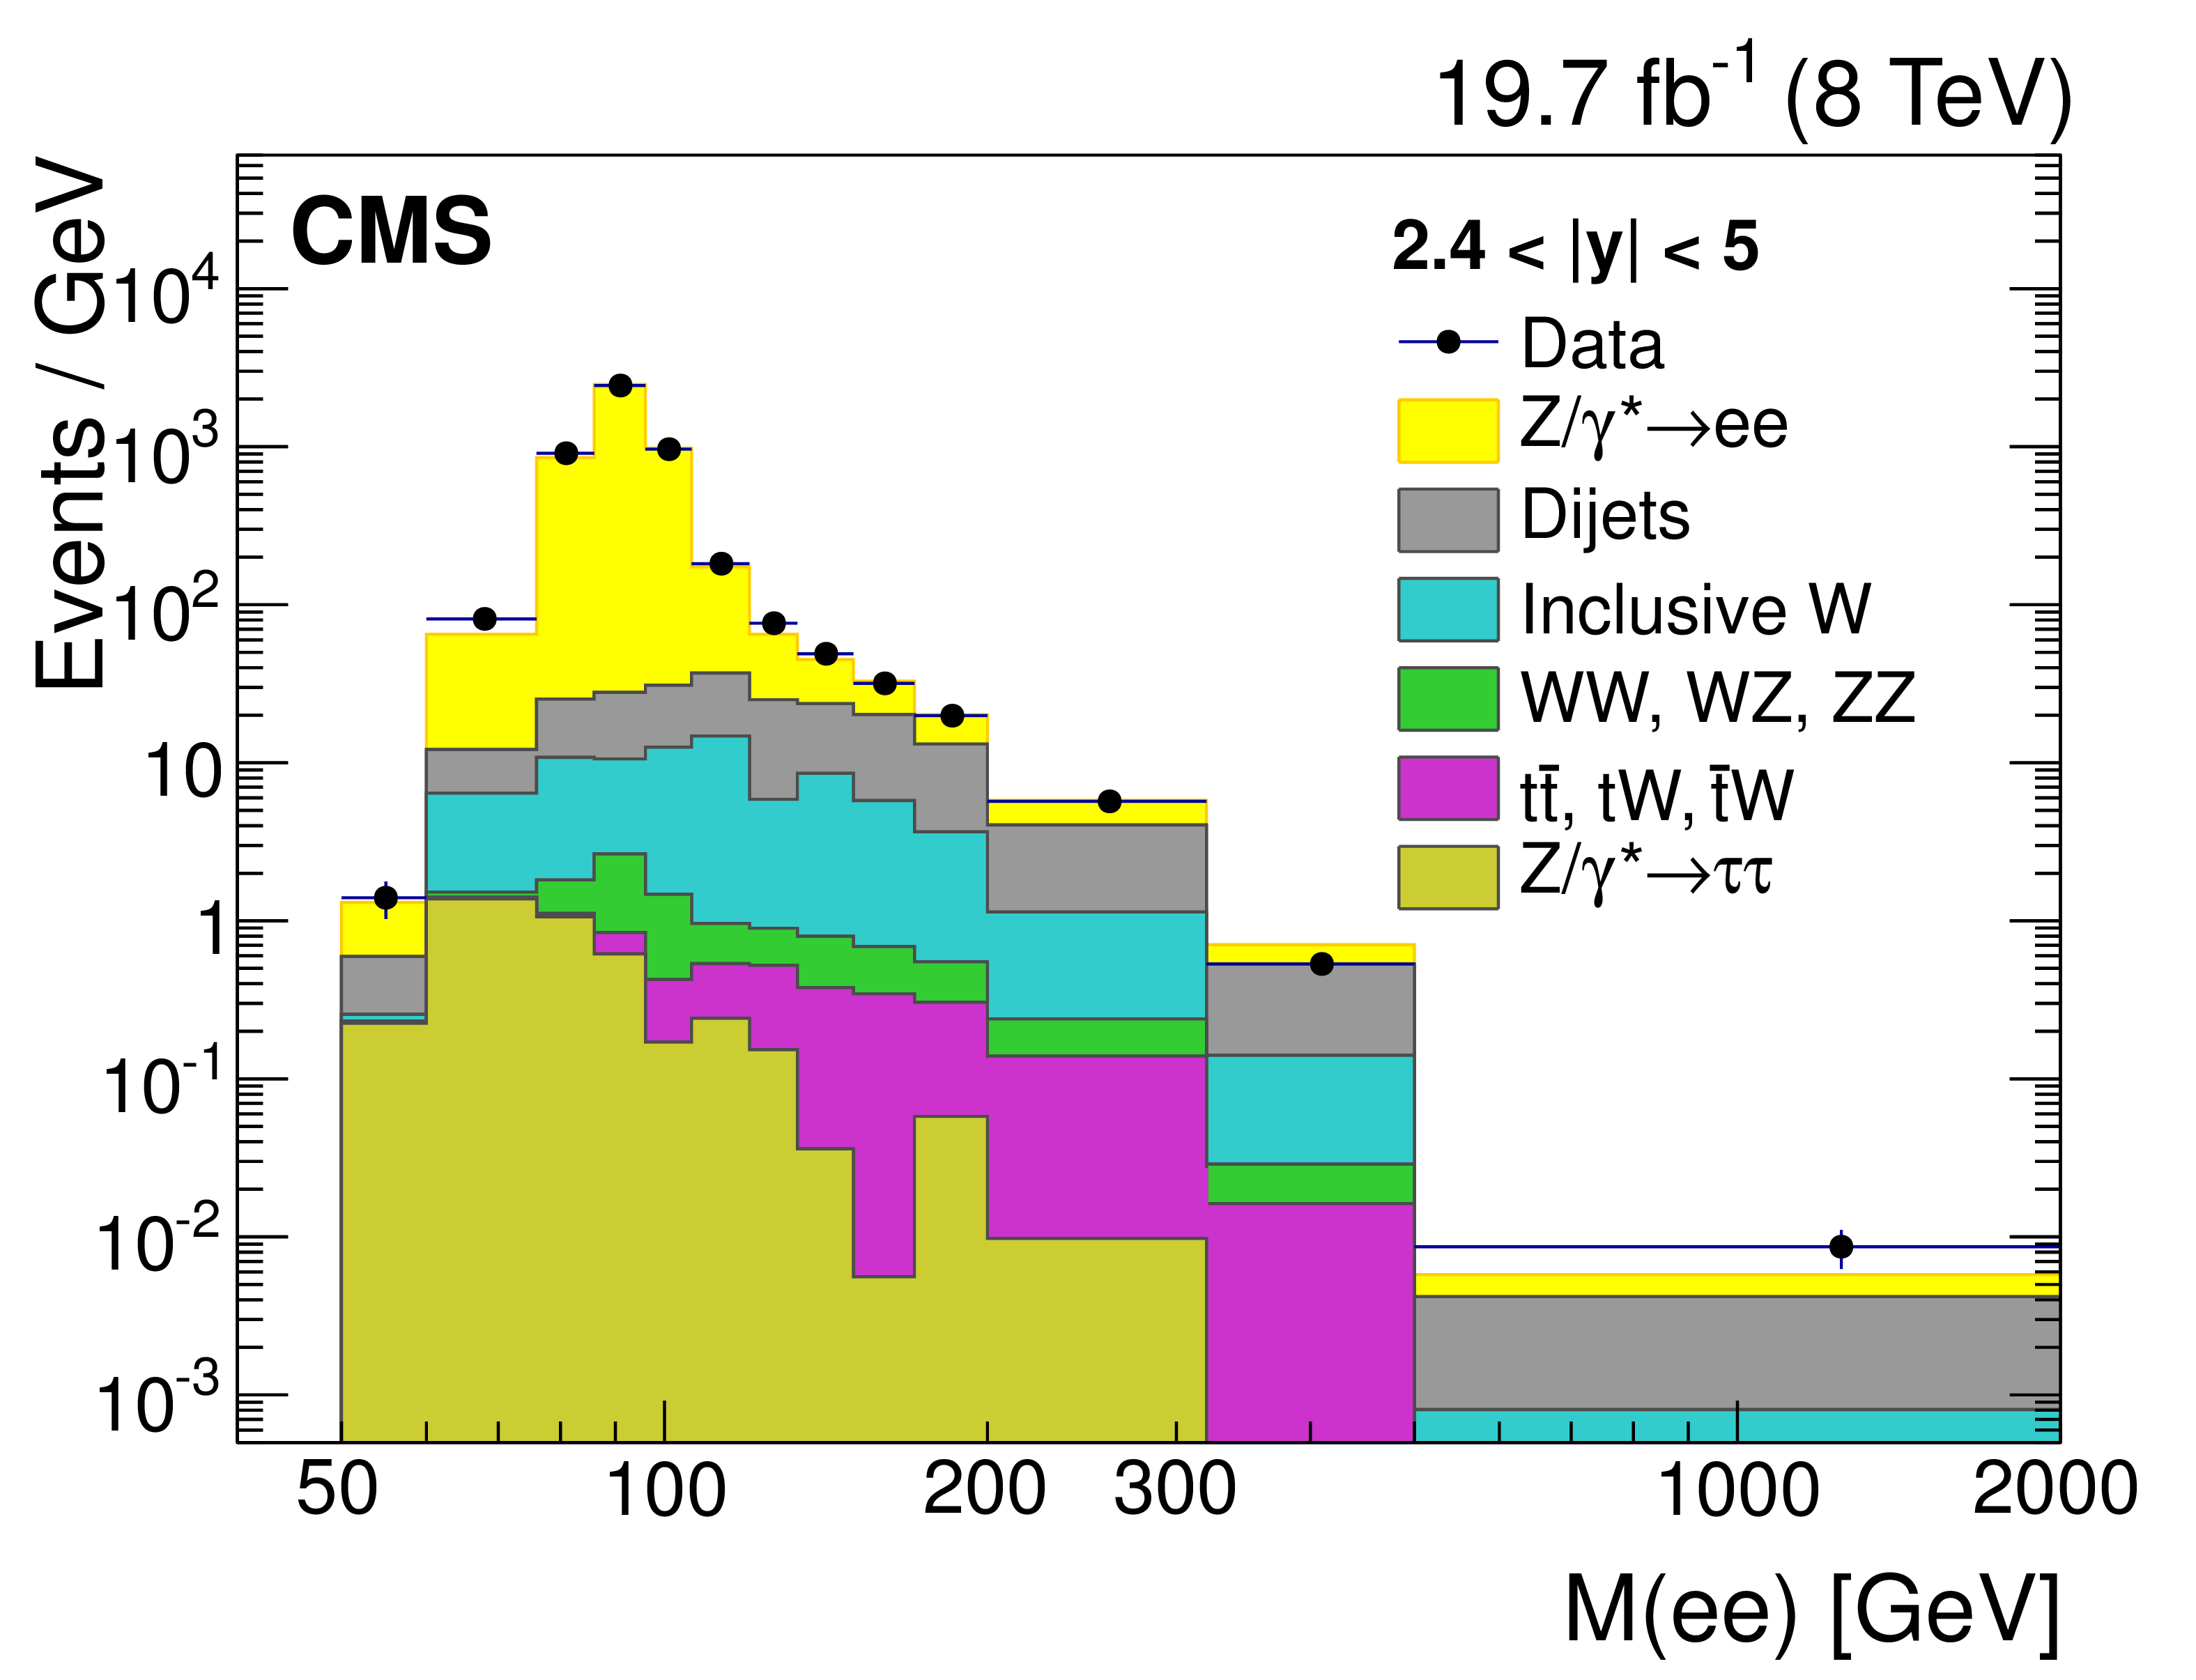
Figure 1-c:
The invariant mass distributions for $\mu \mu $ (a), $\mathrm{ e } \mathrm{ e } $ (b) events with $ {| y | }< $ 2.4, and $\mathrm{ e } \mathrm{ e } $ (c) events with 2.4 $ < {| y | }< $ 5. Only statistical uncertainties are shown. The stacked histograms represent the sum of the background contributions and the signal. |
png pdf |
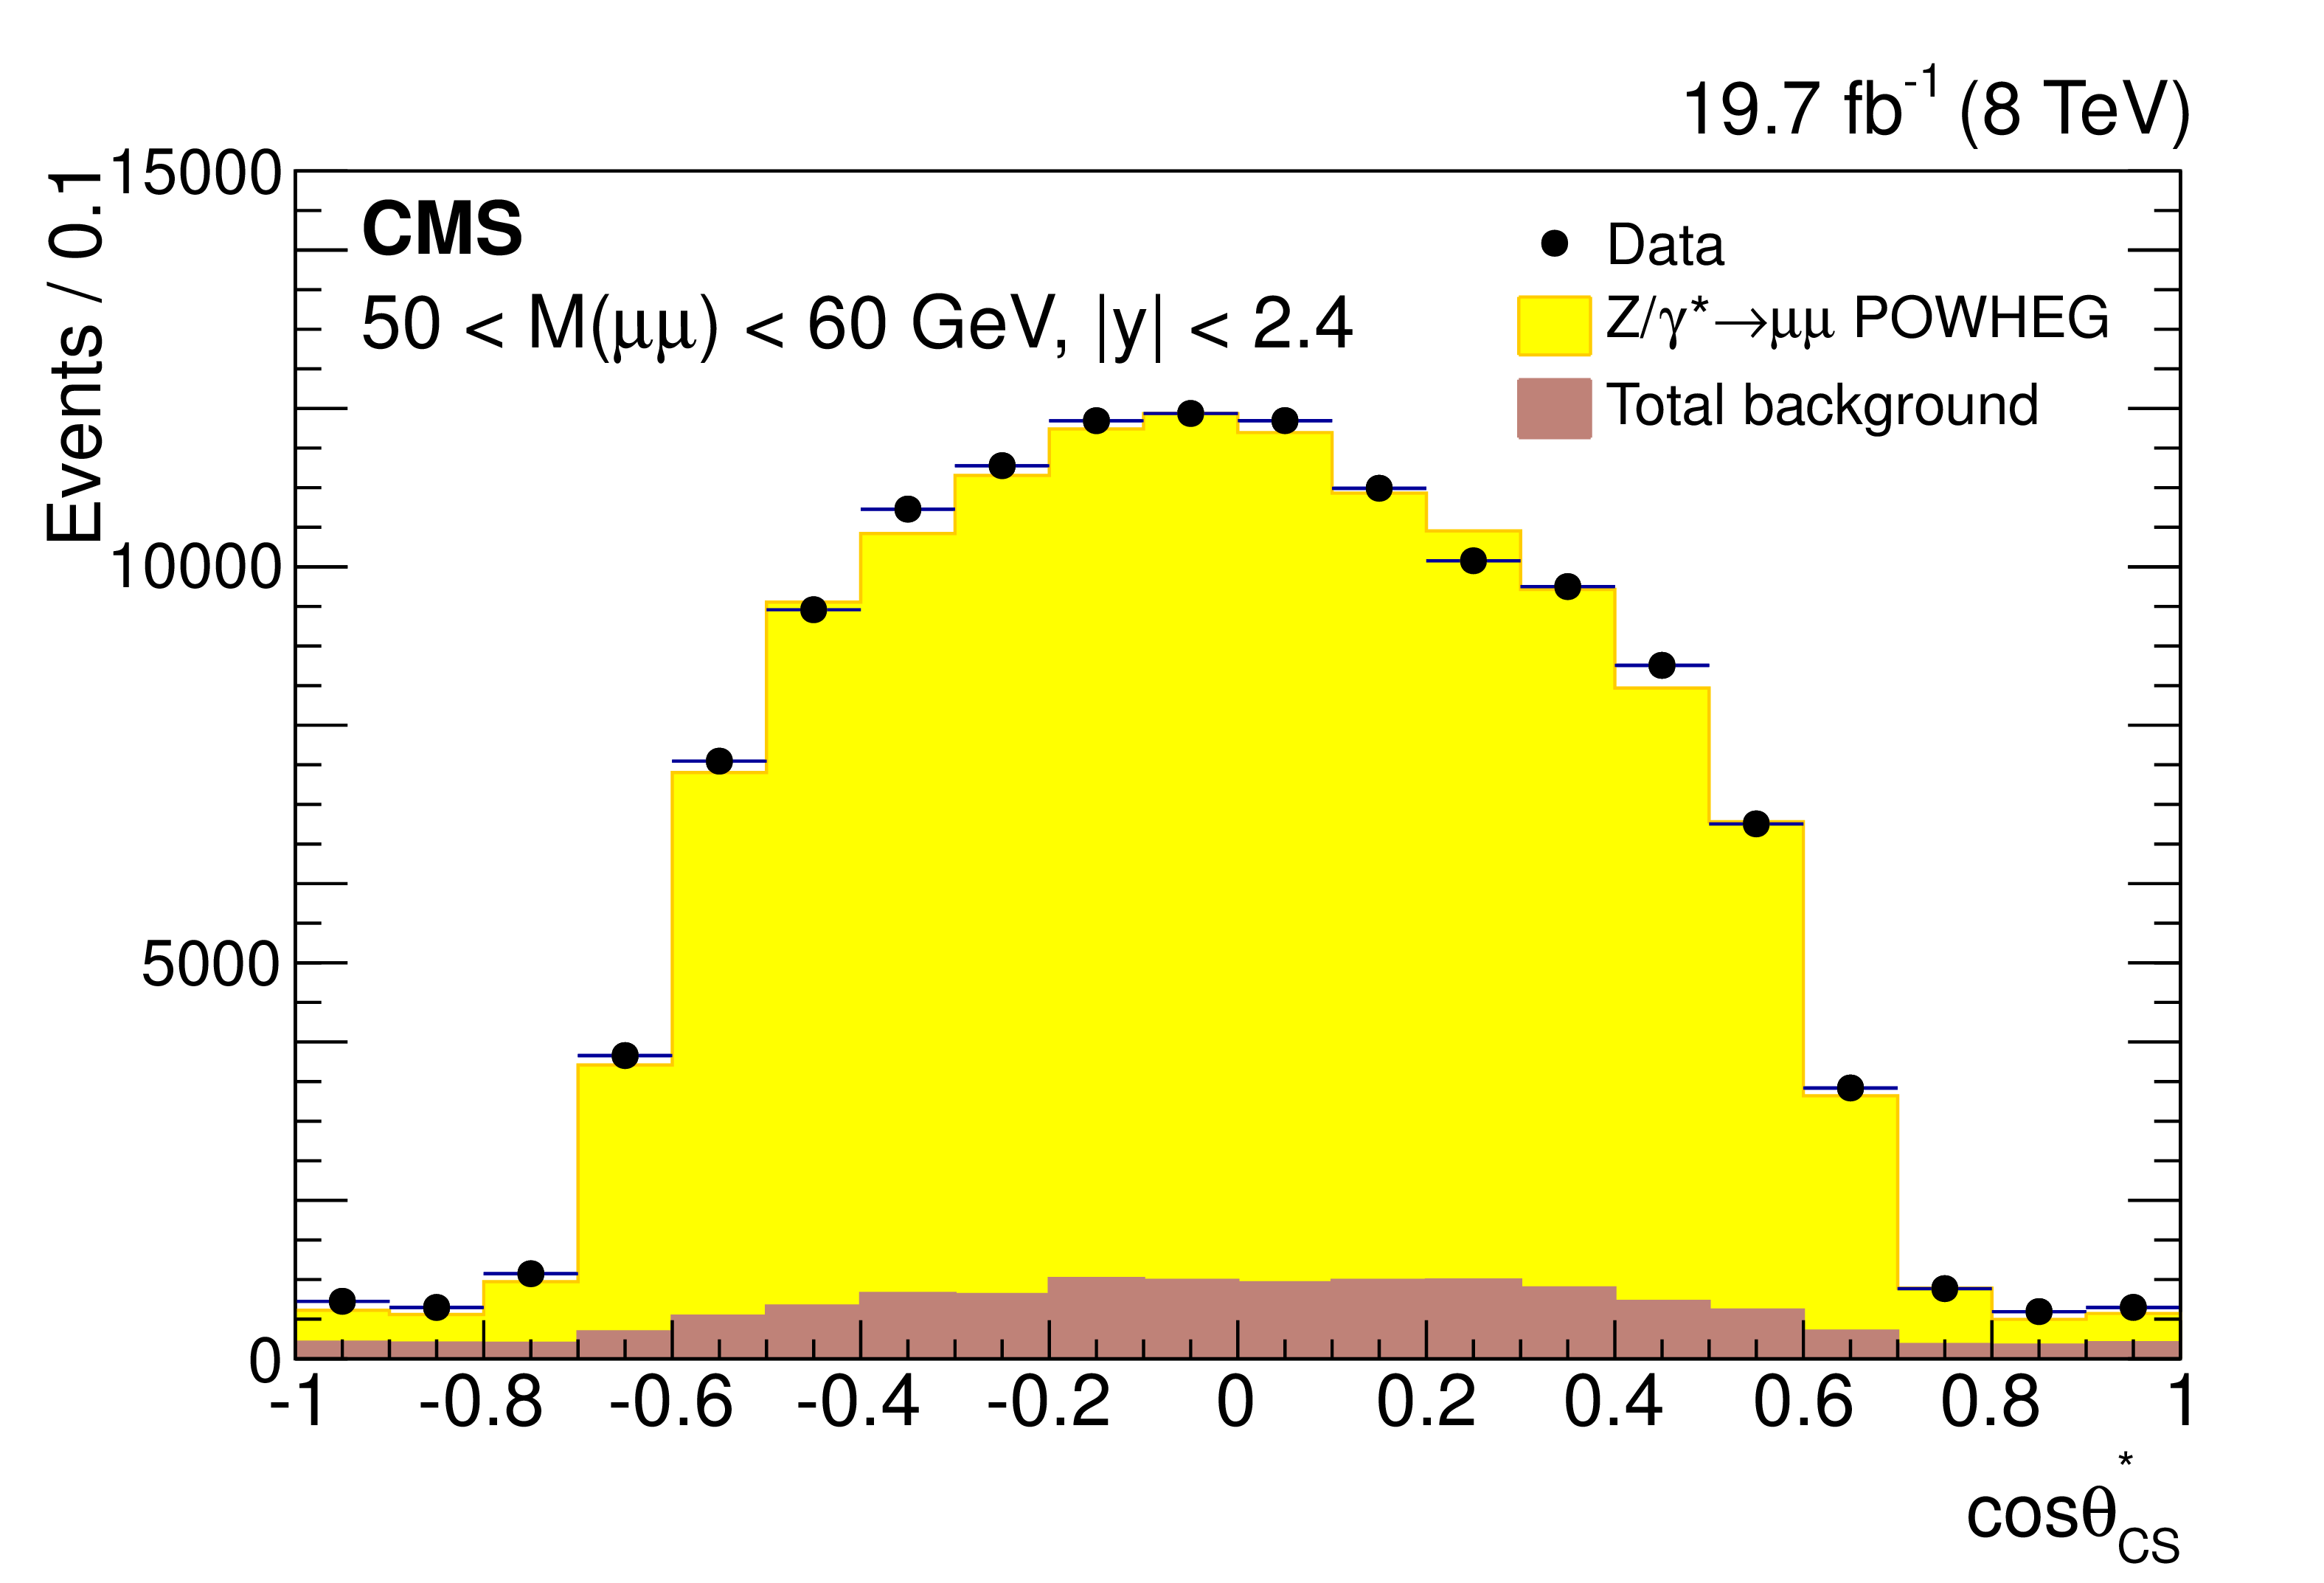
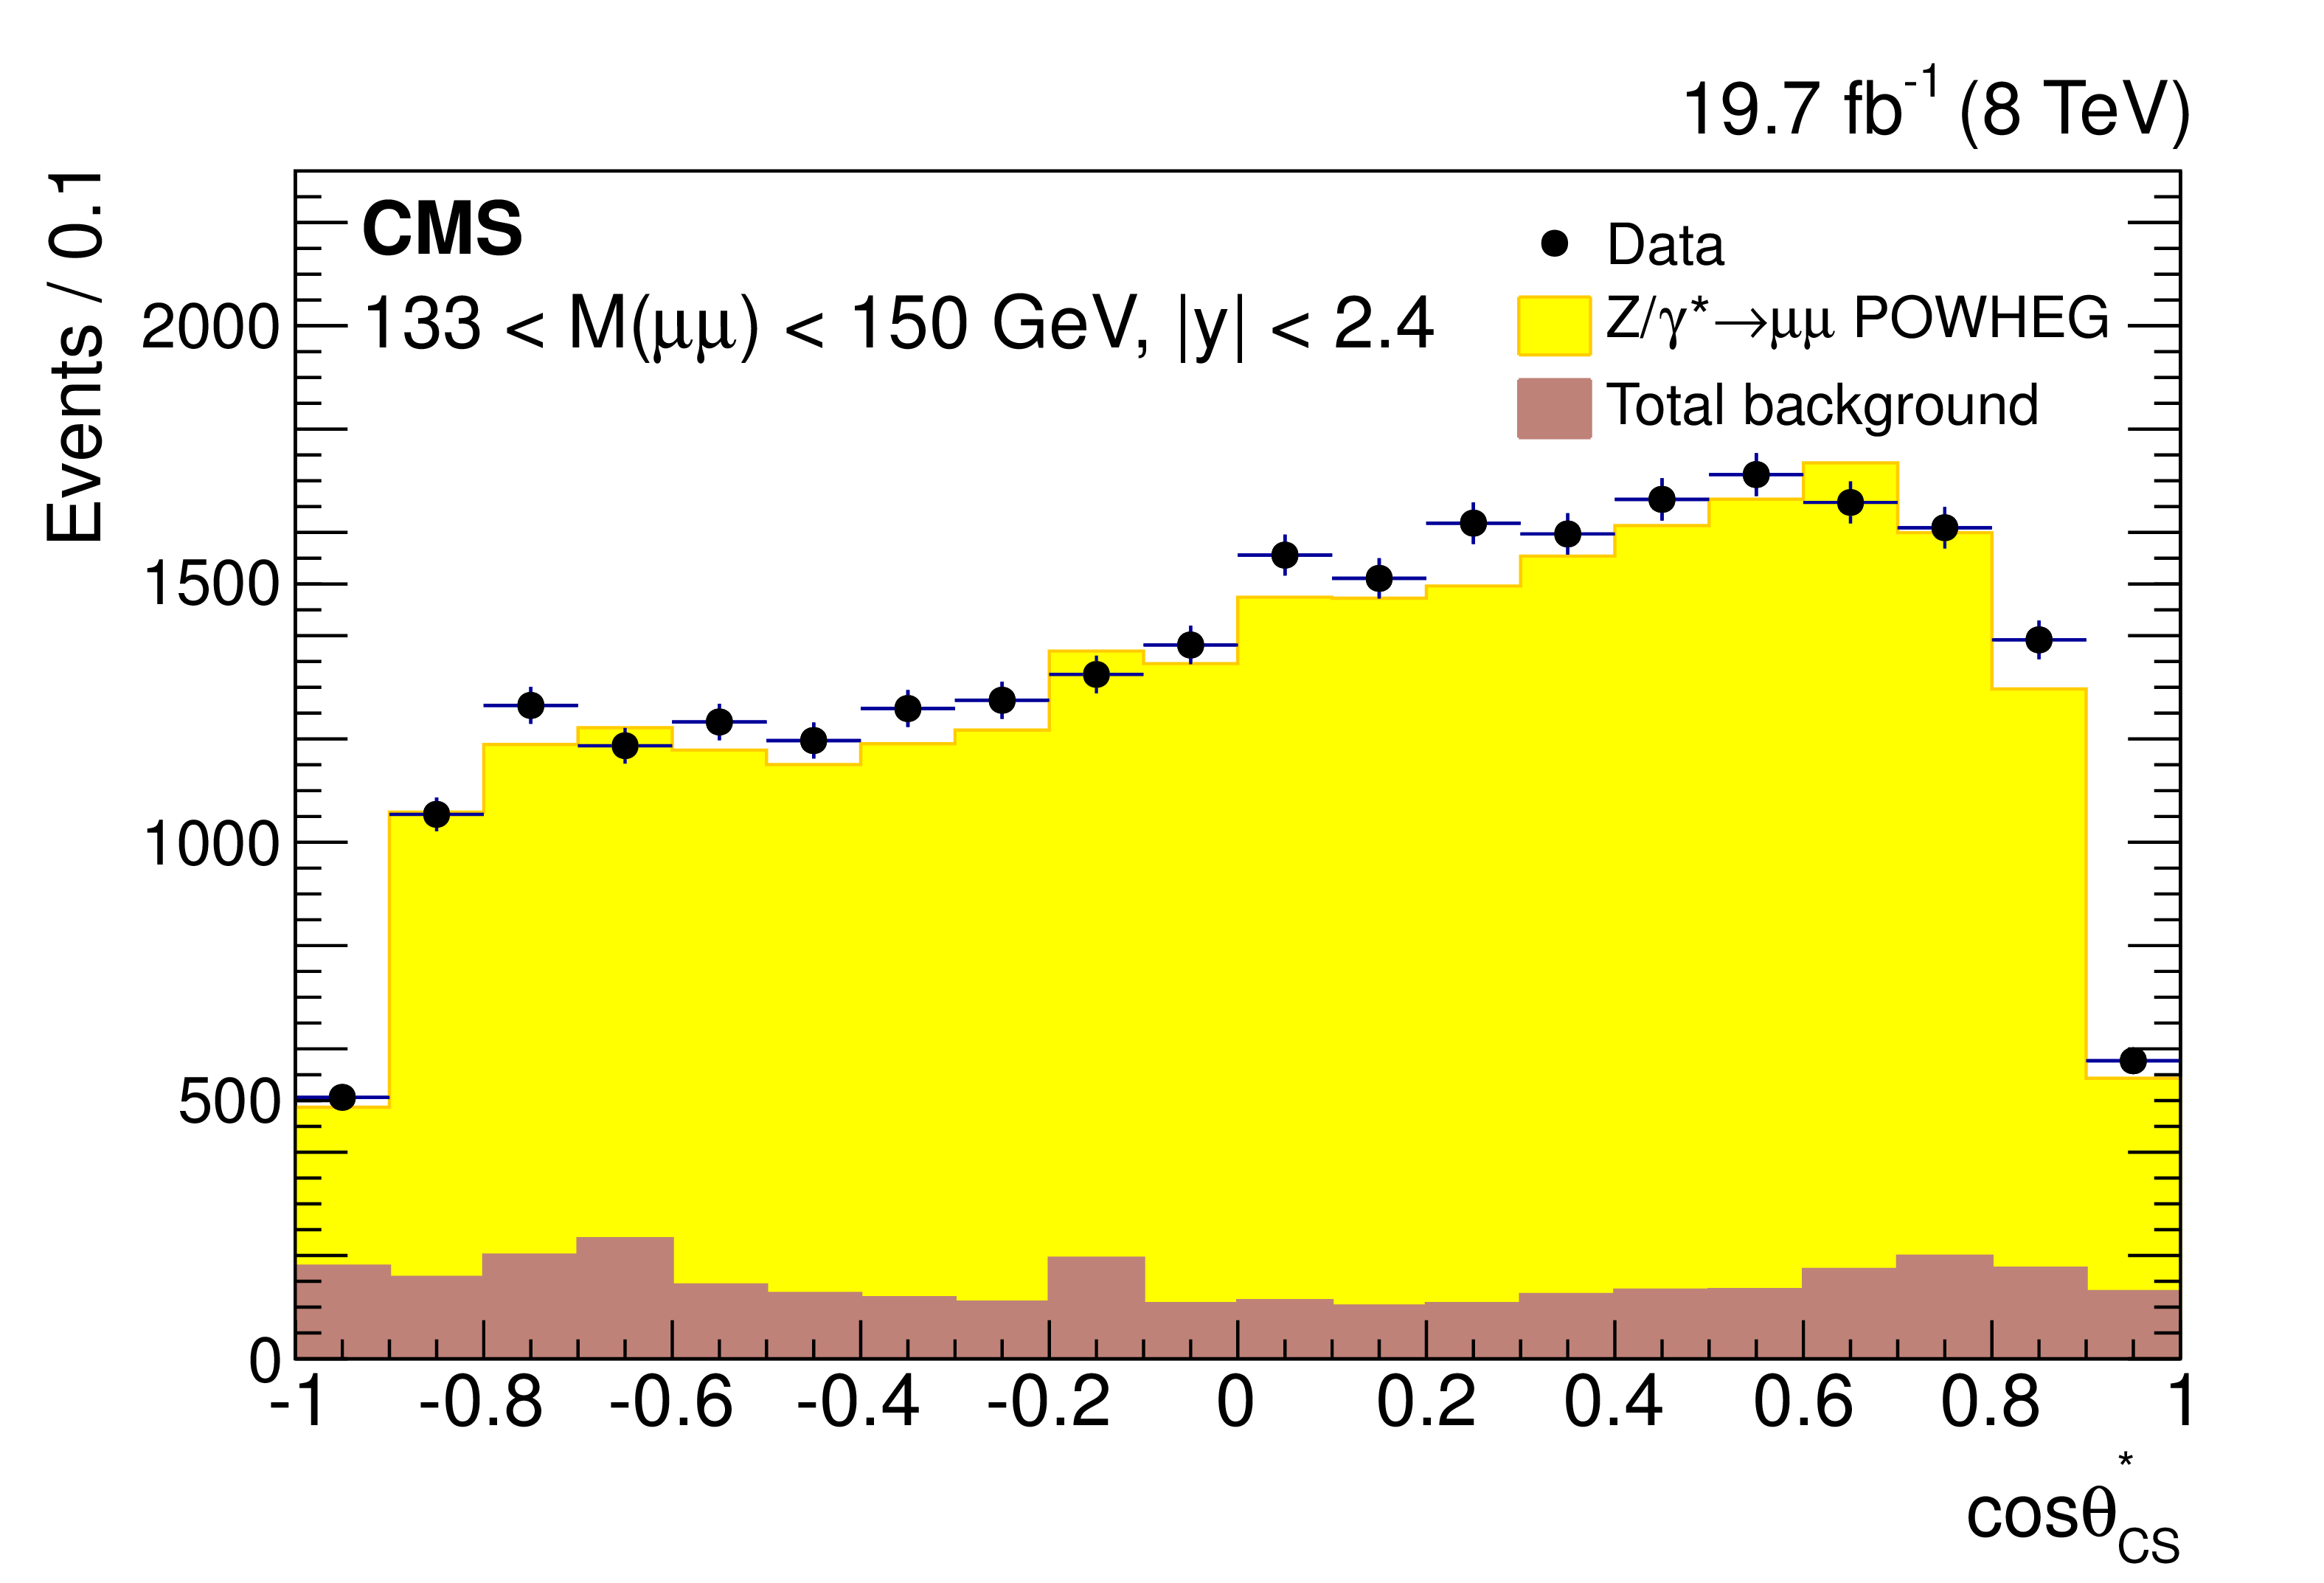
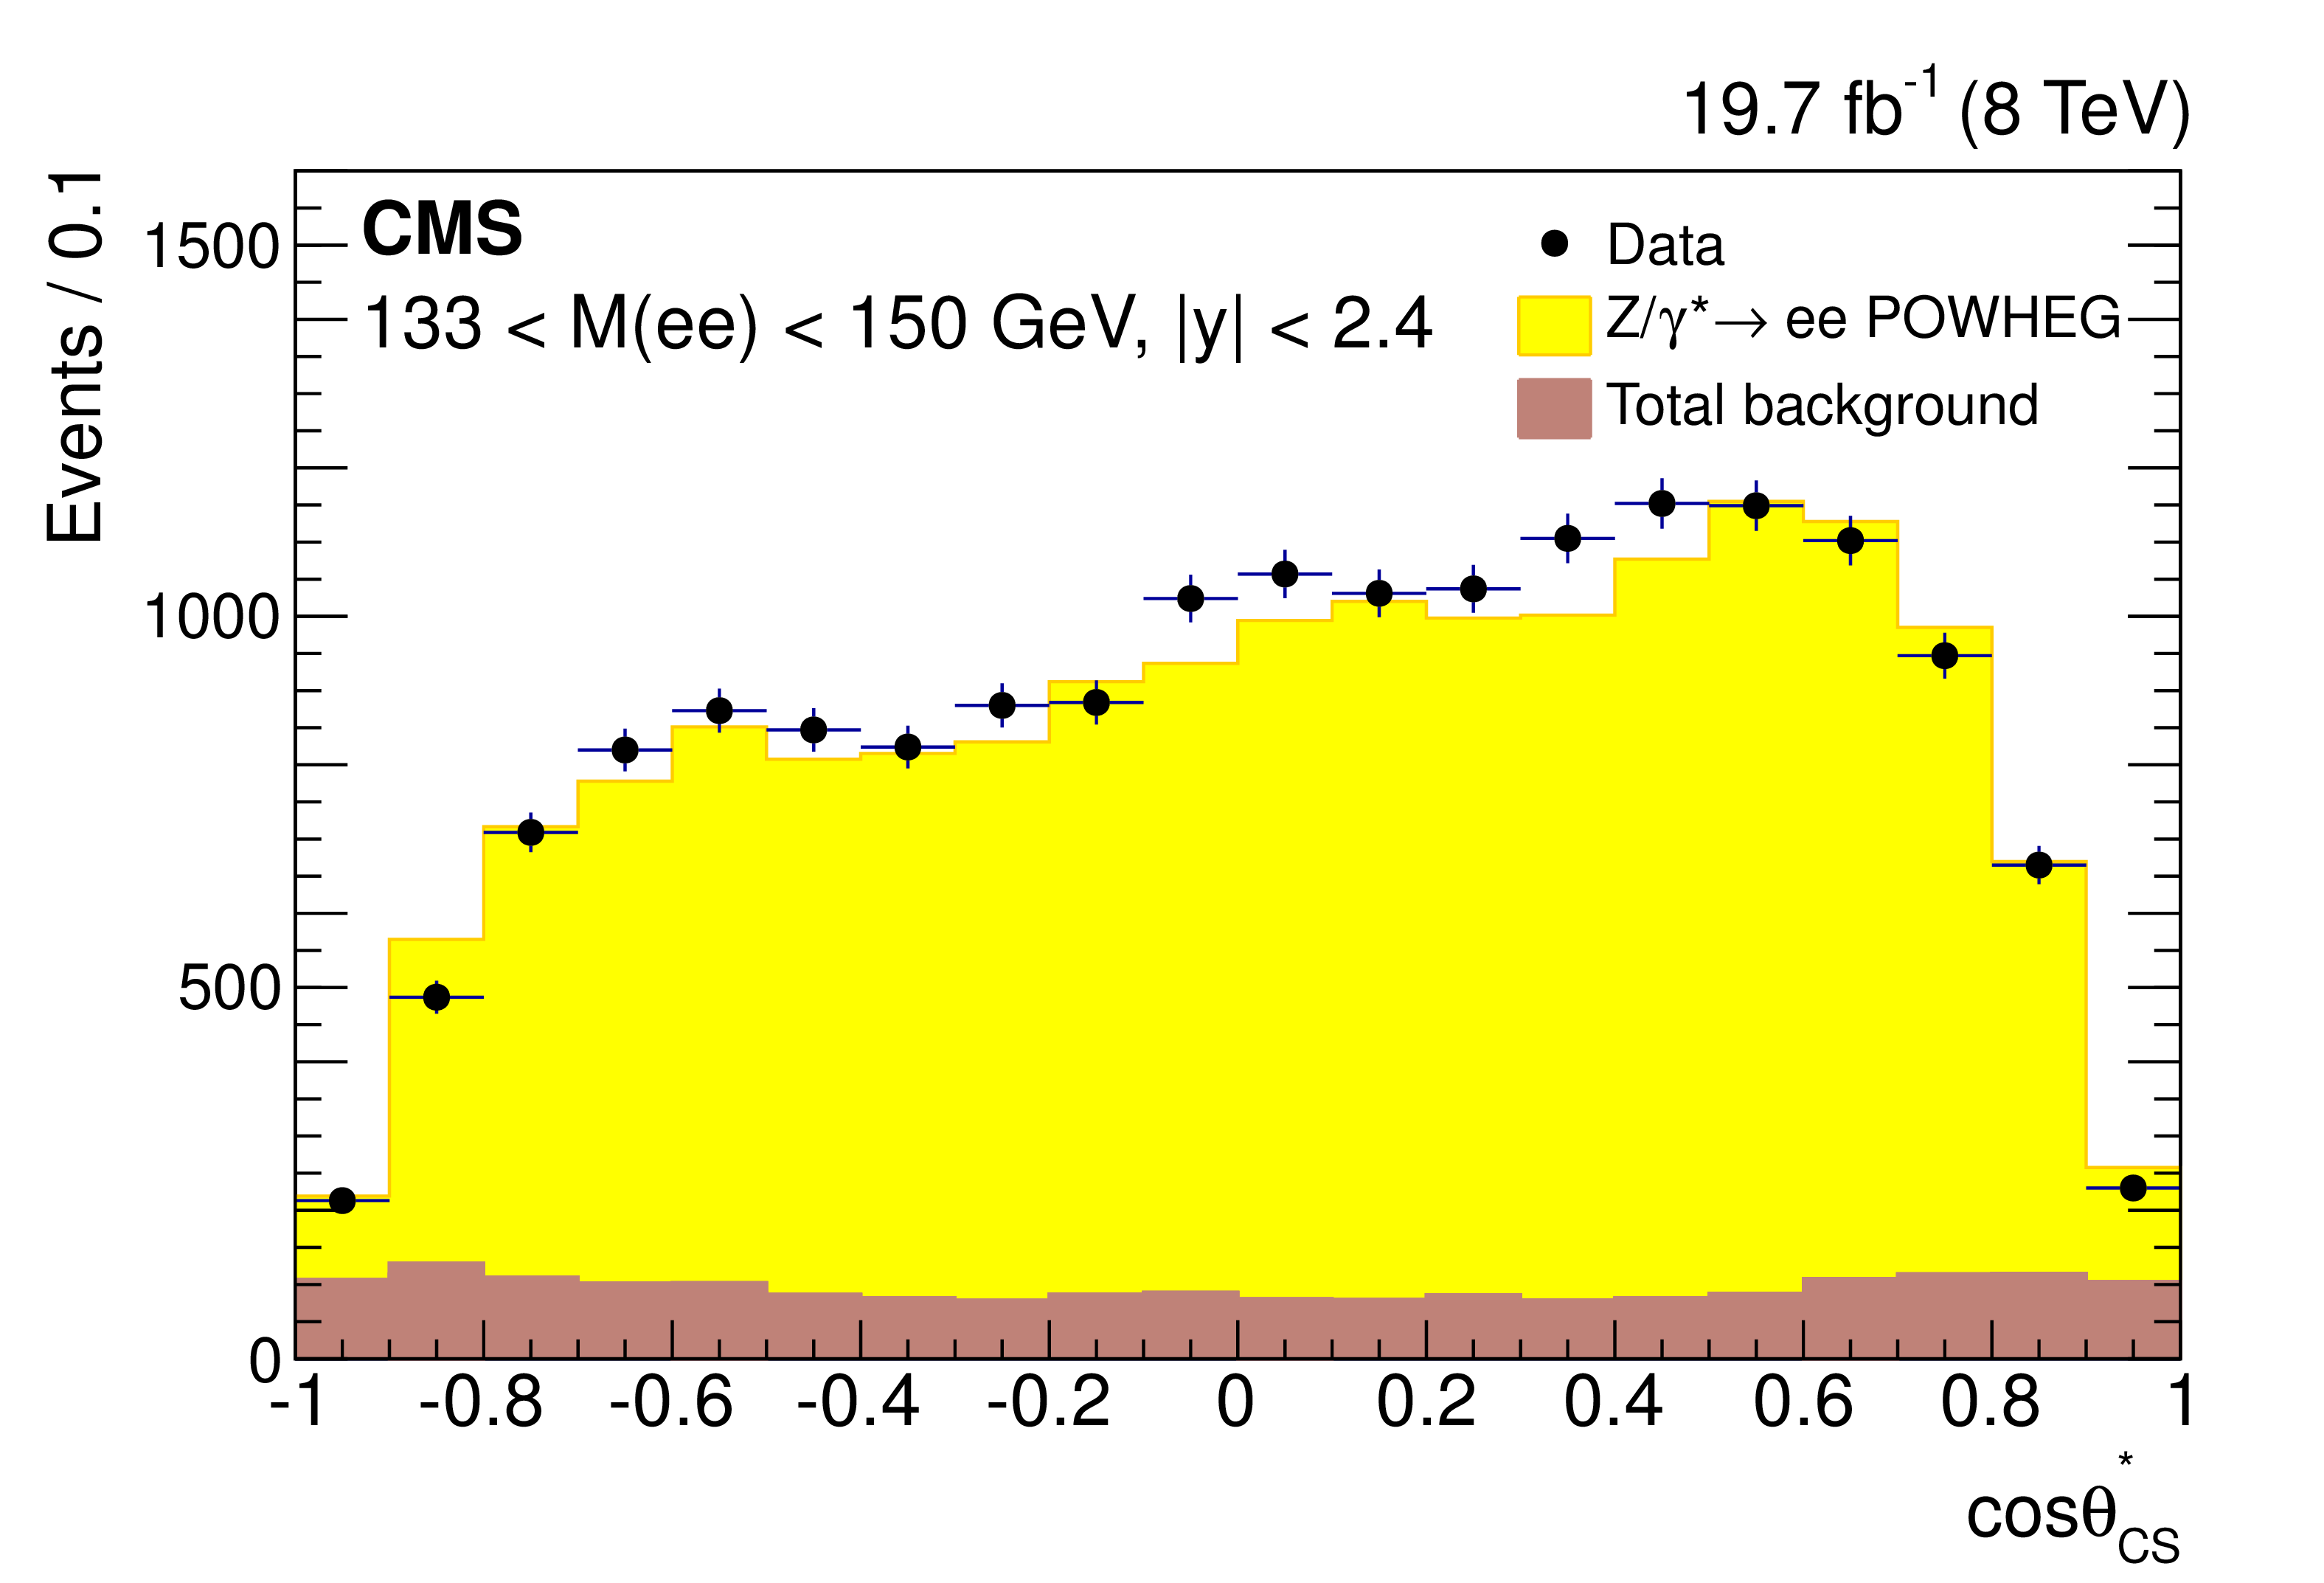
Figure 2-a:
The $\cos\theta ^{*}_\mathrm {CS}$ distributions for $\mu \mu $ ($\mathrm{ e } \mathrm{ e } $) events are presented in the a,b (c,d) panels. Only statistical uncertainties are shown. The stacked histograms represent the sum of the background contribution and the signal. The plots on the a,c (b,d) panels correspond to events with dilepton invariant mass 50 $ < M < $ 60 GeV (133 $ < M < $ 150 GeV ). |
png pdf |
Figure 2-b:
The $\cos\theta ^{*}_\mathrm {CS}$ distributions for $\mu \mu $ ($\mathrm{ e } \mathrm{ e } $) events are presented in the a,b (c,d) panels. Only statistical uncertainties are shown. The stacked histograms represent the sum of the background contribution and the signal. The plots on the a,c (b,d) panels correspond to events with dilepton invariant mass 50 $ < M < $ 60 GeV (133 $ < M < $ 150 GeV ). |

png pdf |
Figure 2-c:
The $\cos\theta ^{*}_\mathrm {CS}$ distributions for $\mu \mu $ ($\mathrm{ e } \mathrm{ e } $) events are presented in the a,b (c,d) panels. Only statistical uncertainties are shown. The stacked histograms represent the sum of the background contribution and the signal. The plots on the a,c (b,d) panels correspond to events with dilepton invariant mass 50 $ < M < $ 60 GeV (133 $ < M < $ 150 GeV ). |
png pdf |
Figure 2-d:
The $\cos\theta ^{*}_\mathrm {CS}$ distributions for $\mu \mu $ ($\mathrm{ e } \mathrm{ e } $) events are presented in the a,b (c,d) panels. Only statistical uncertainties are shown. The stacked histograms represent the sum of the background contribution and the signal. The plots on the a,c (b,d) panels correspond to events with dilepton invariant mass 50 $ < M < $ 60 GeV (133 $ < M < $ 150 GeV ). |
png pdf |
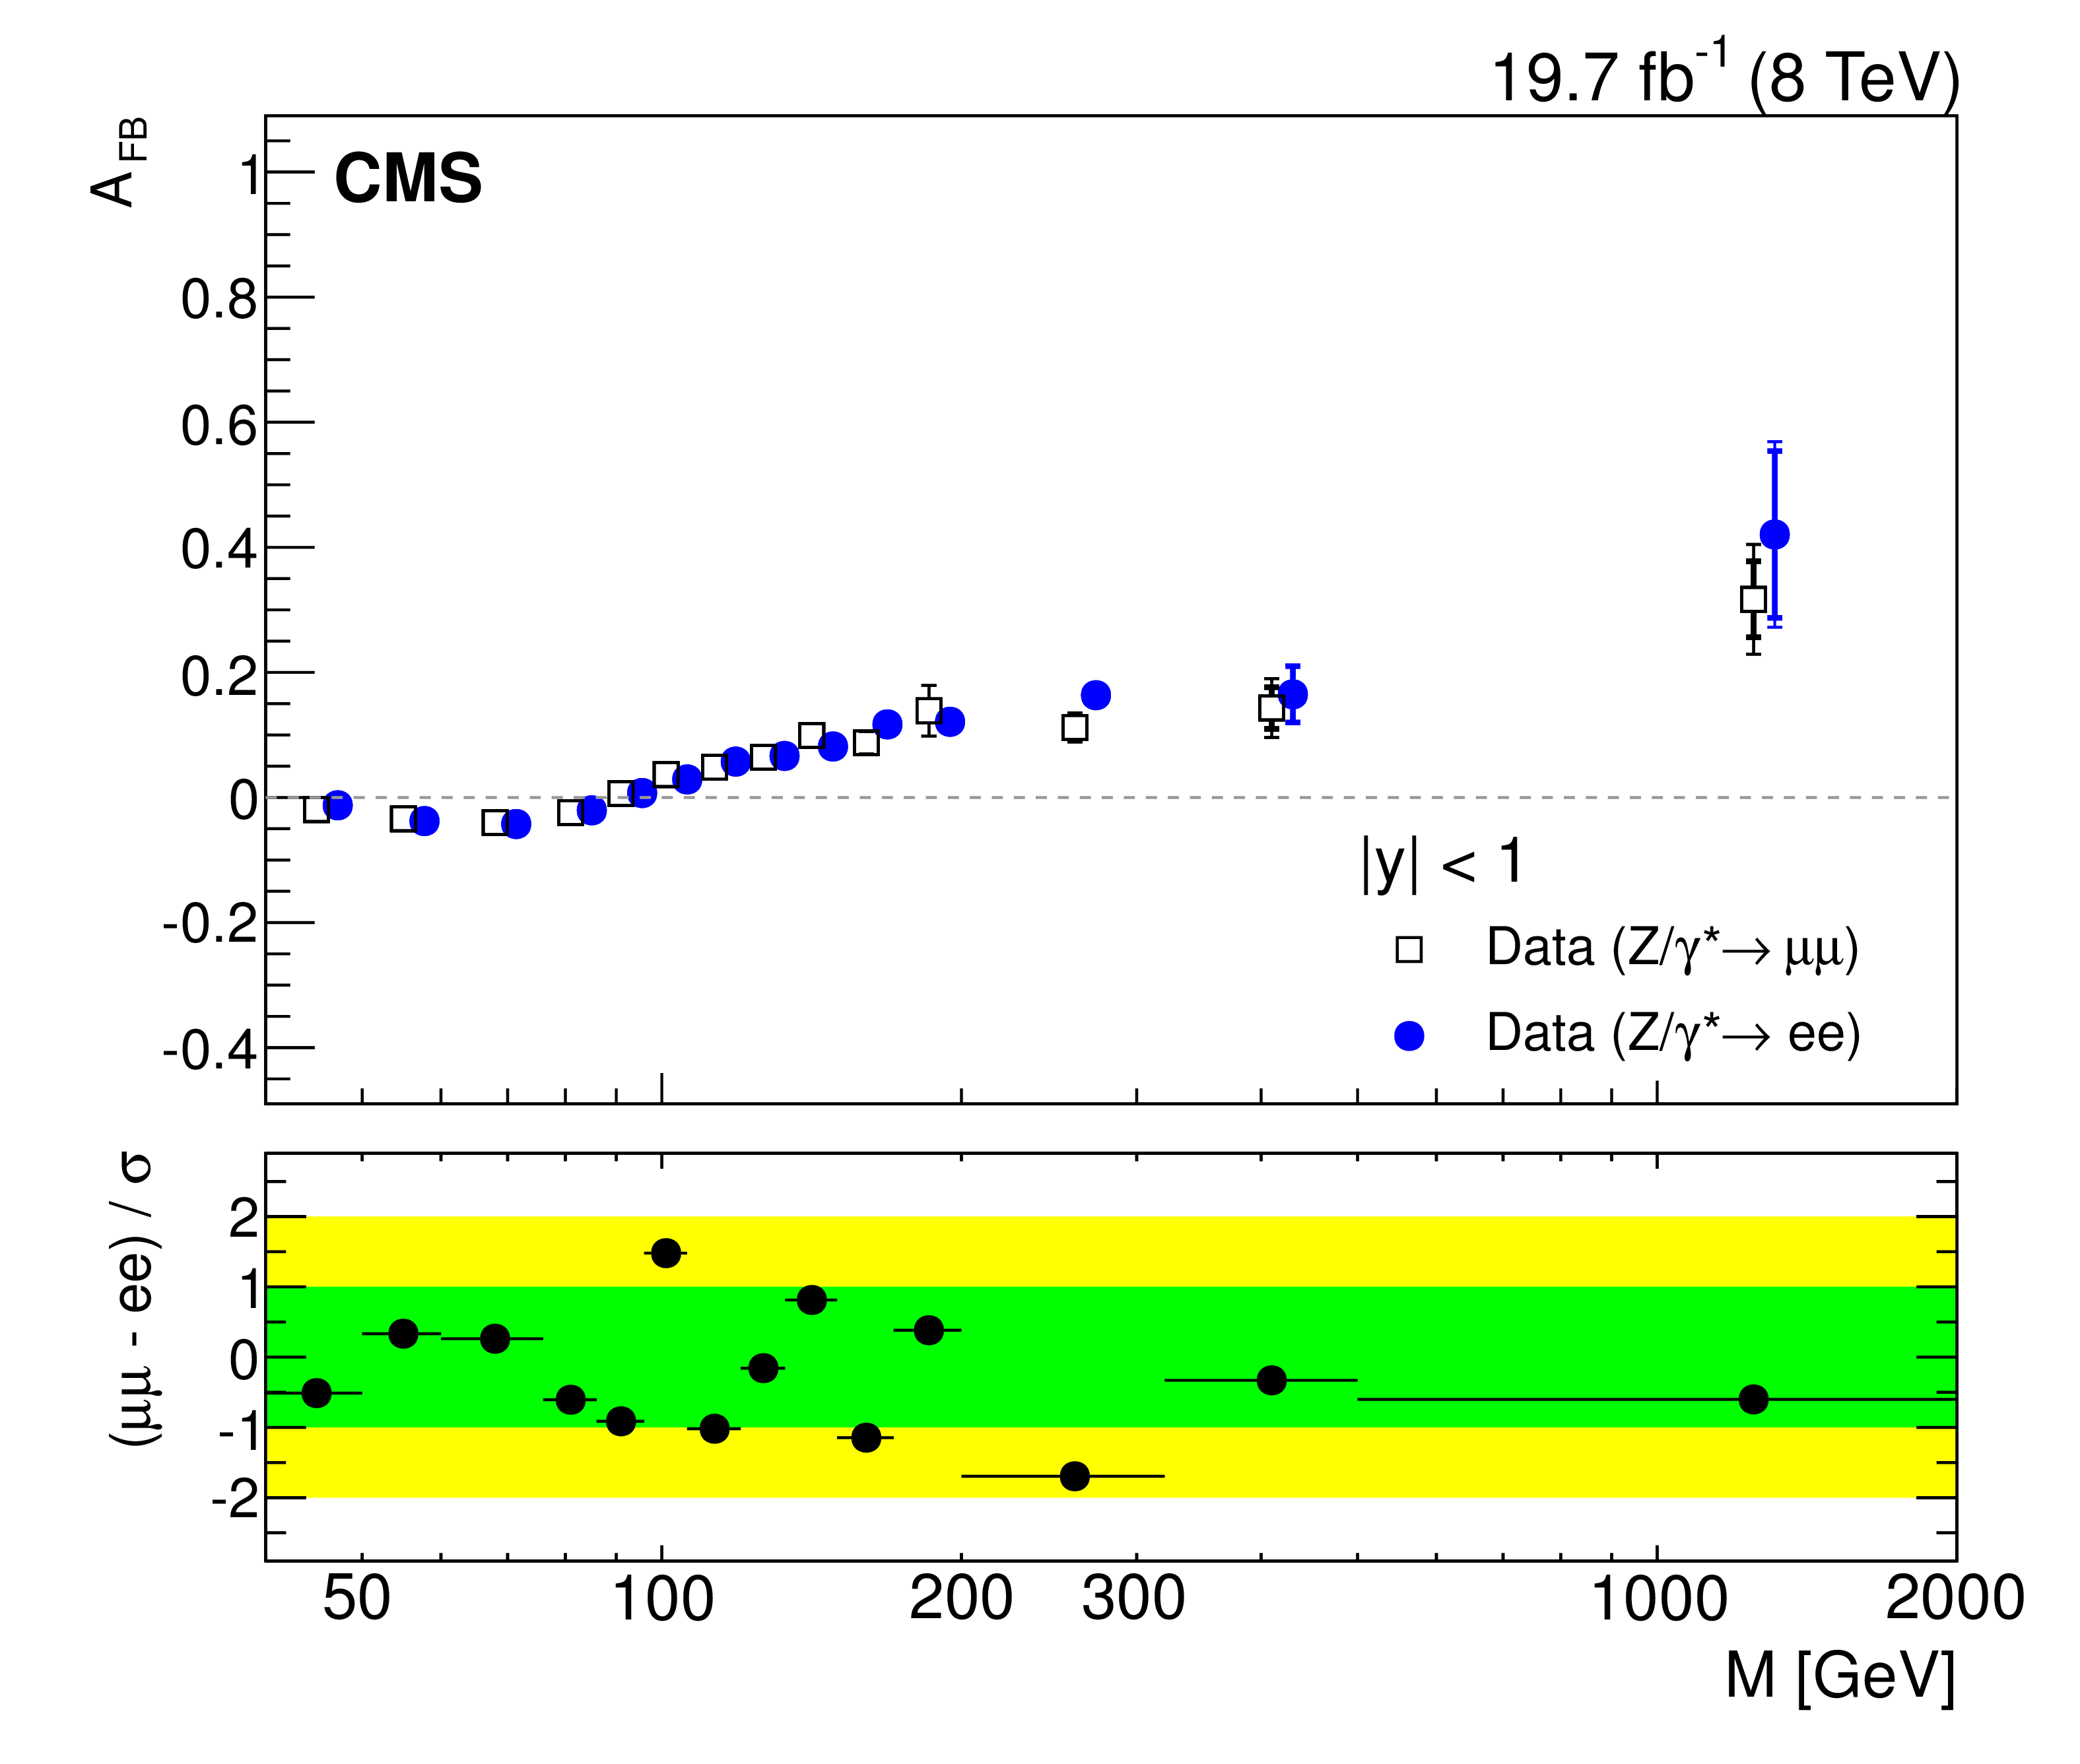
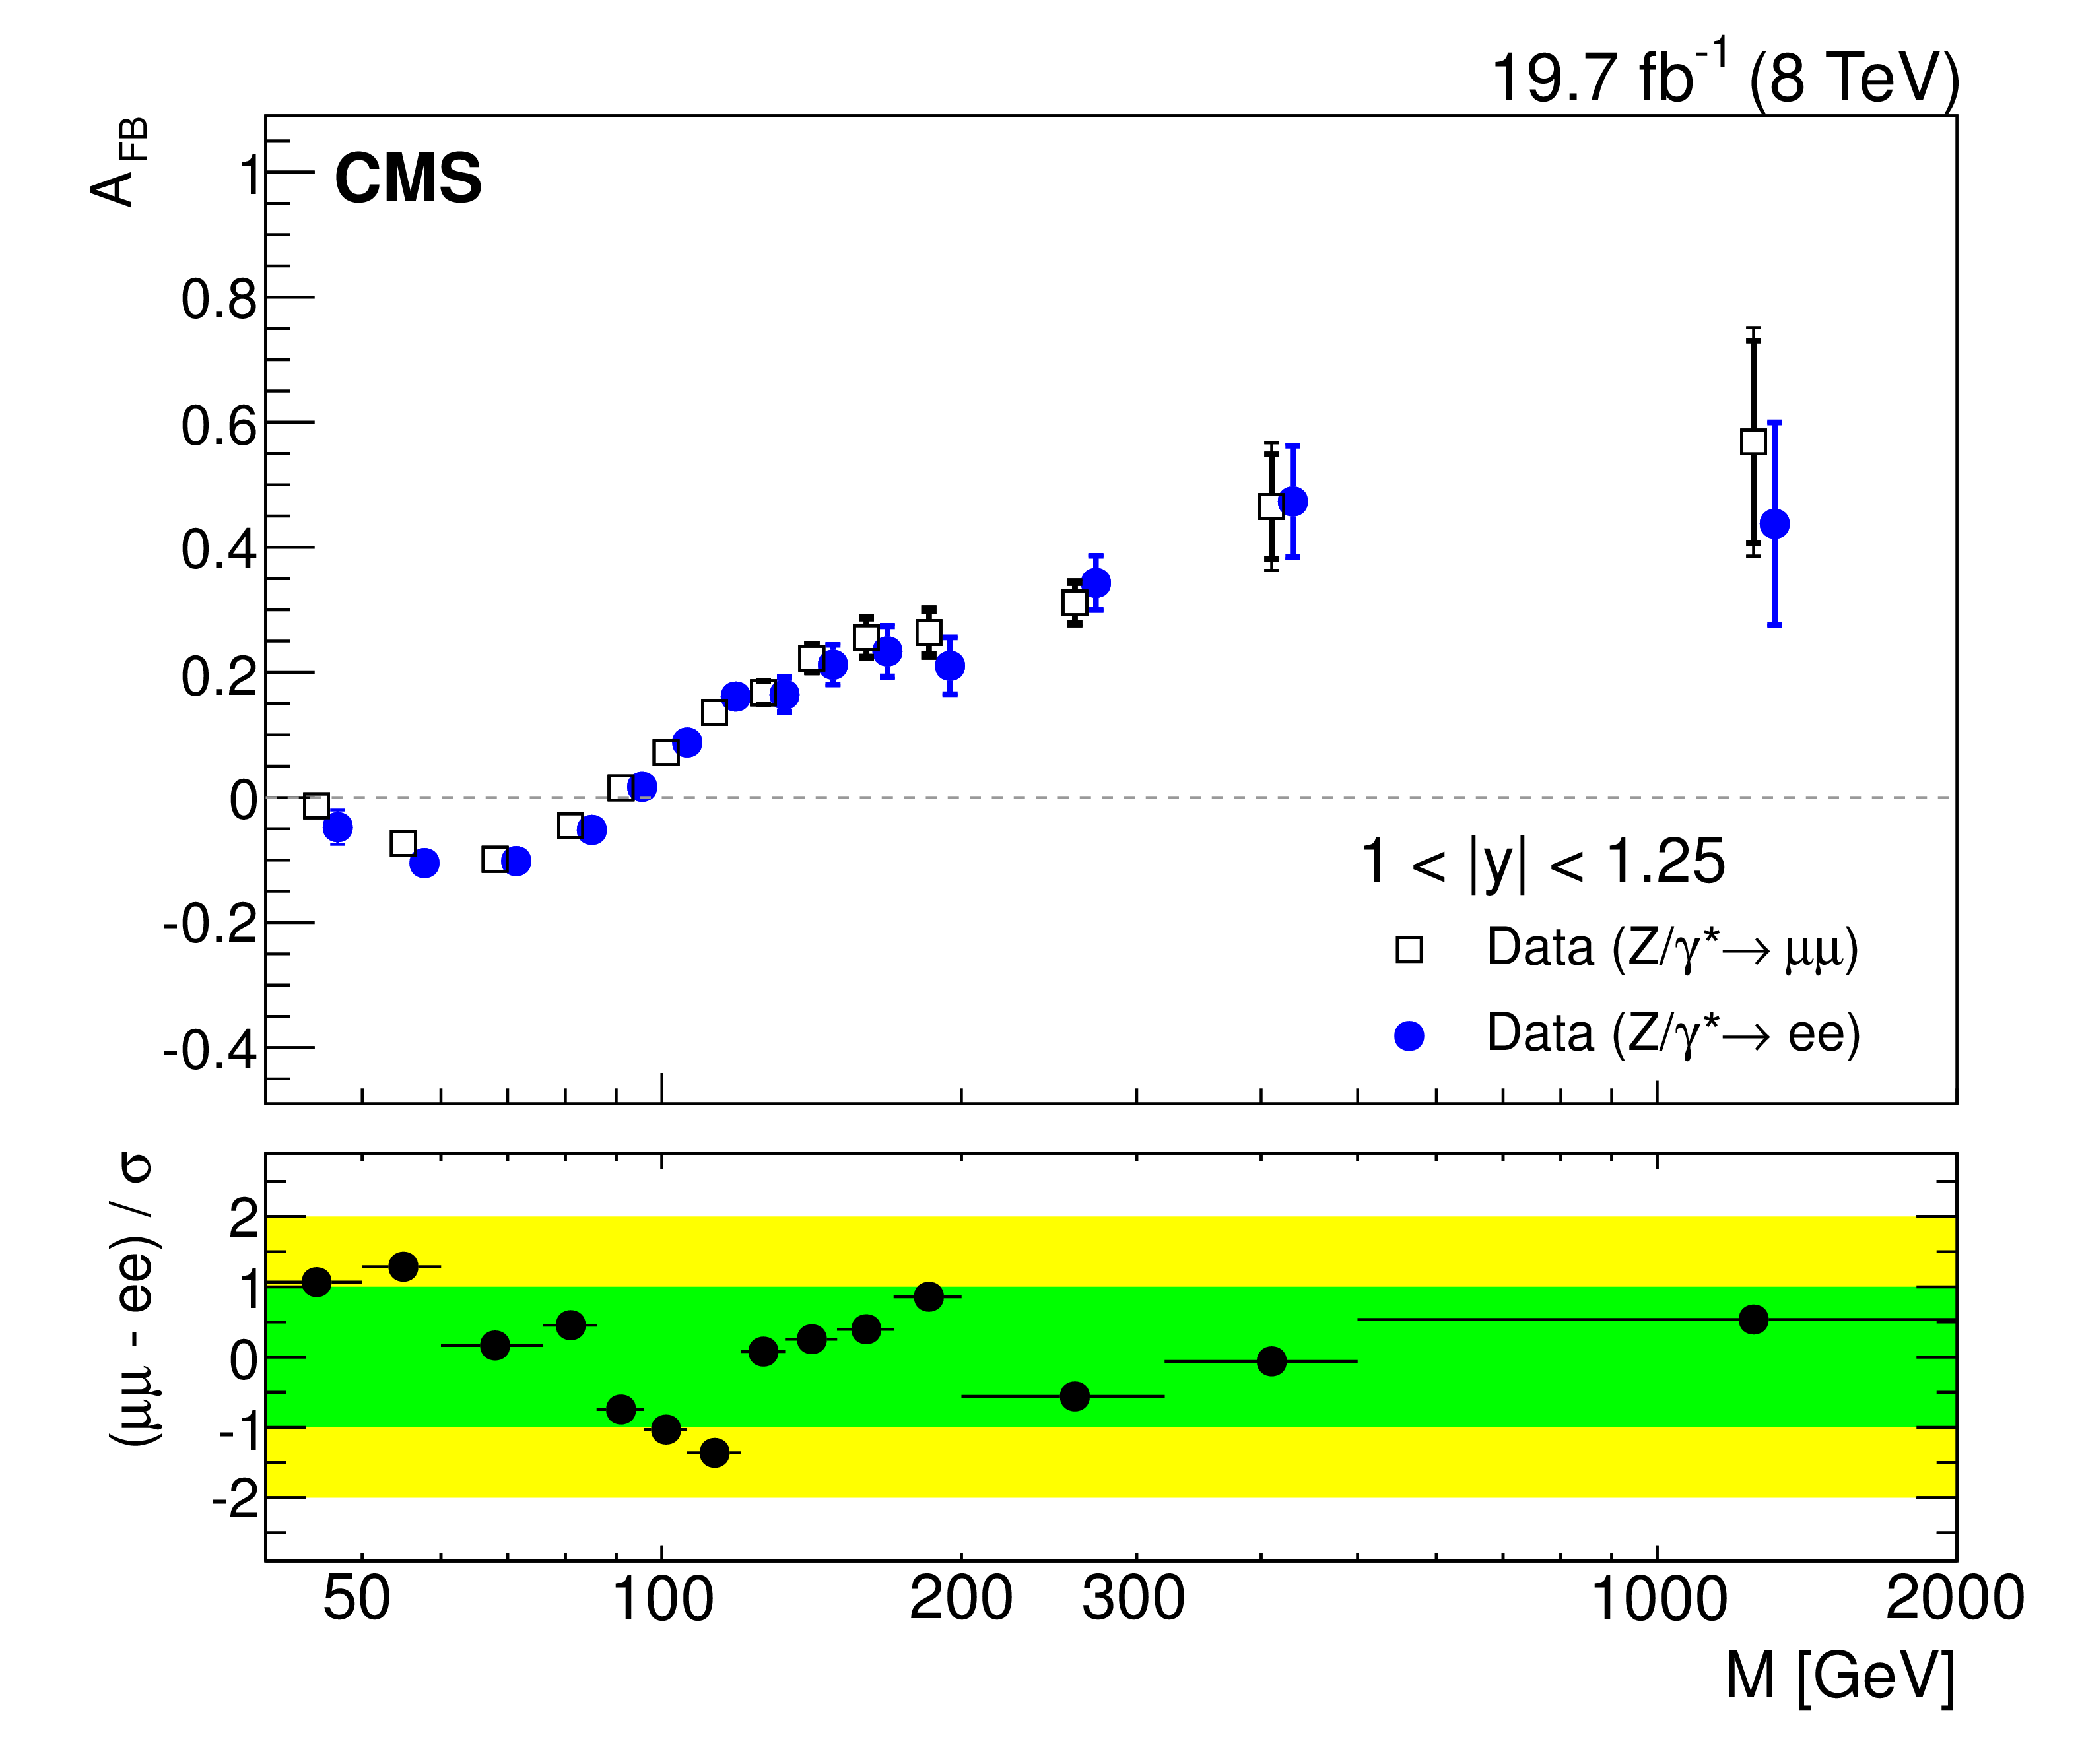
Figure 3-a:
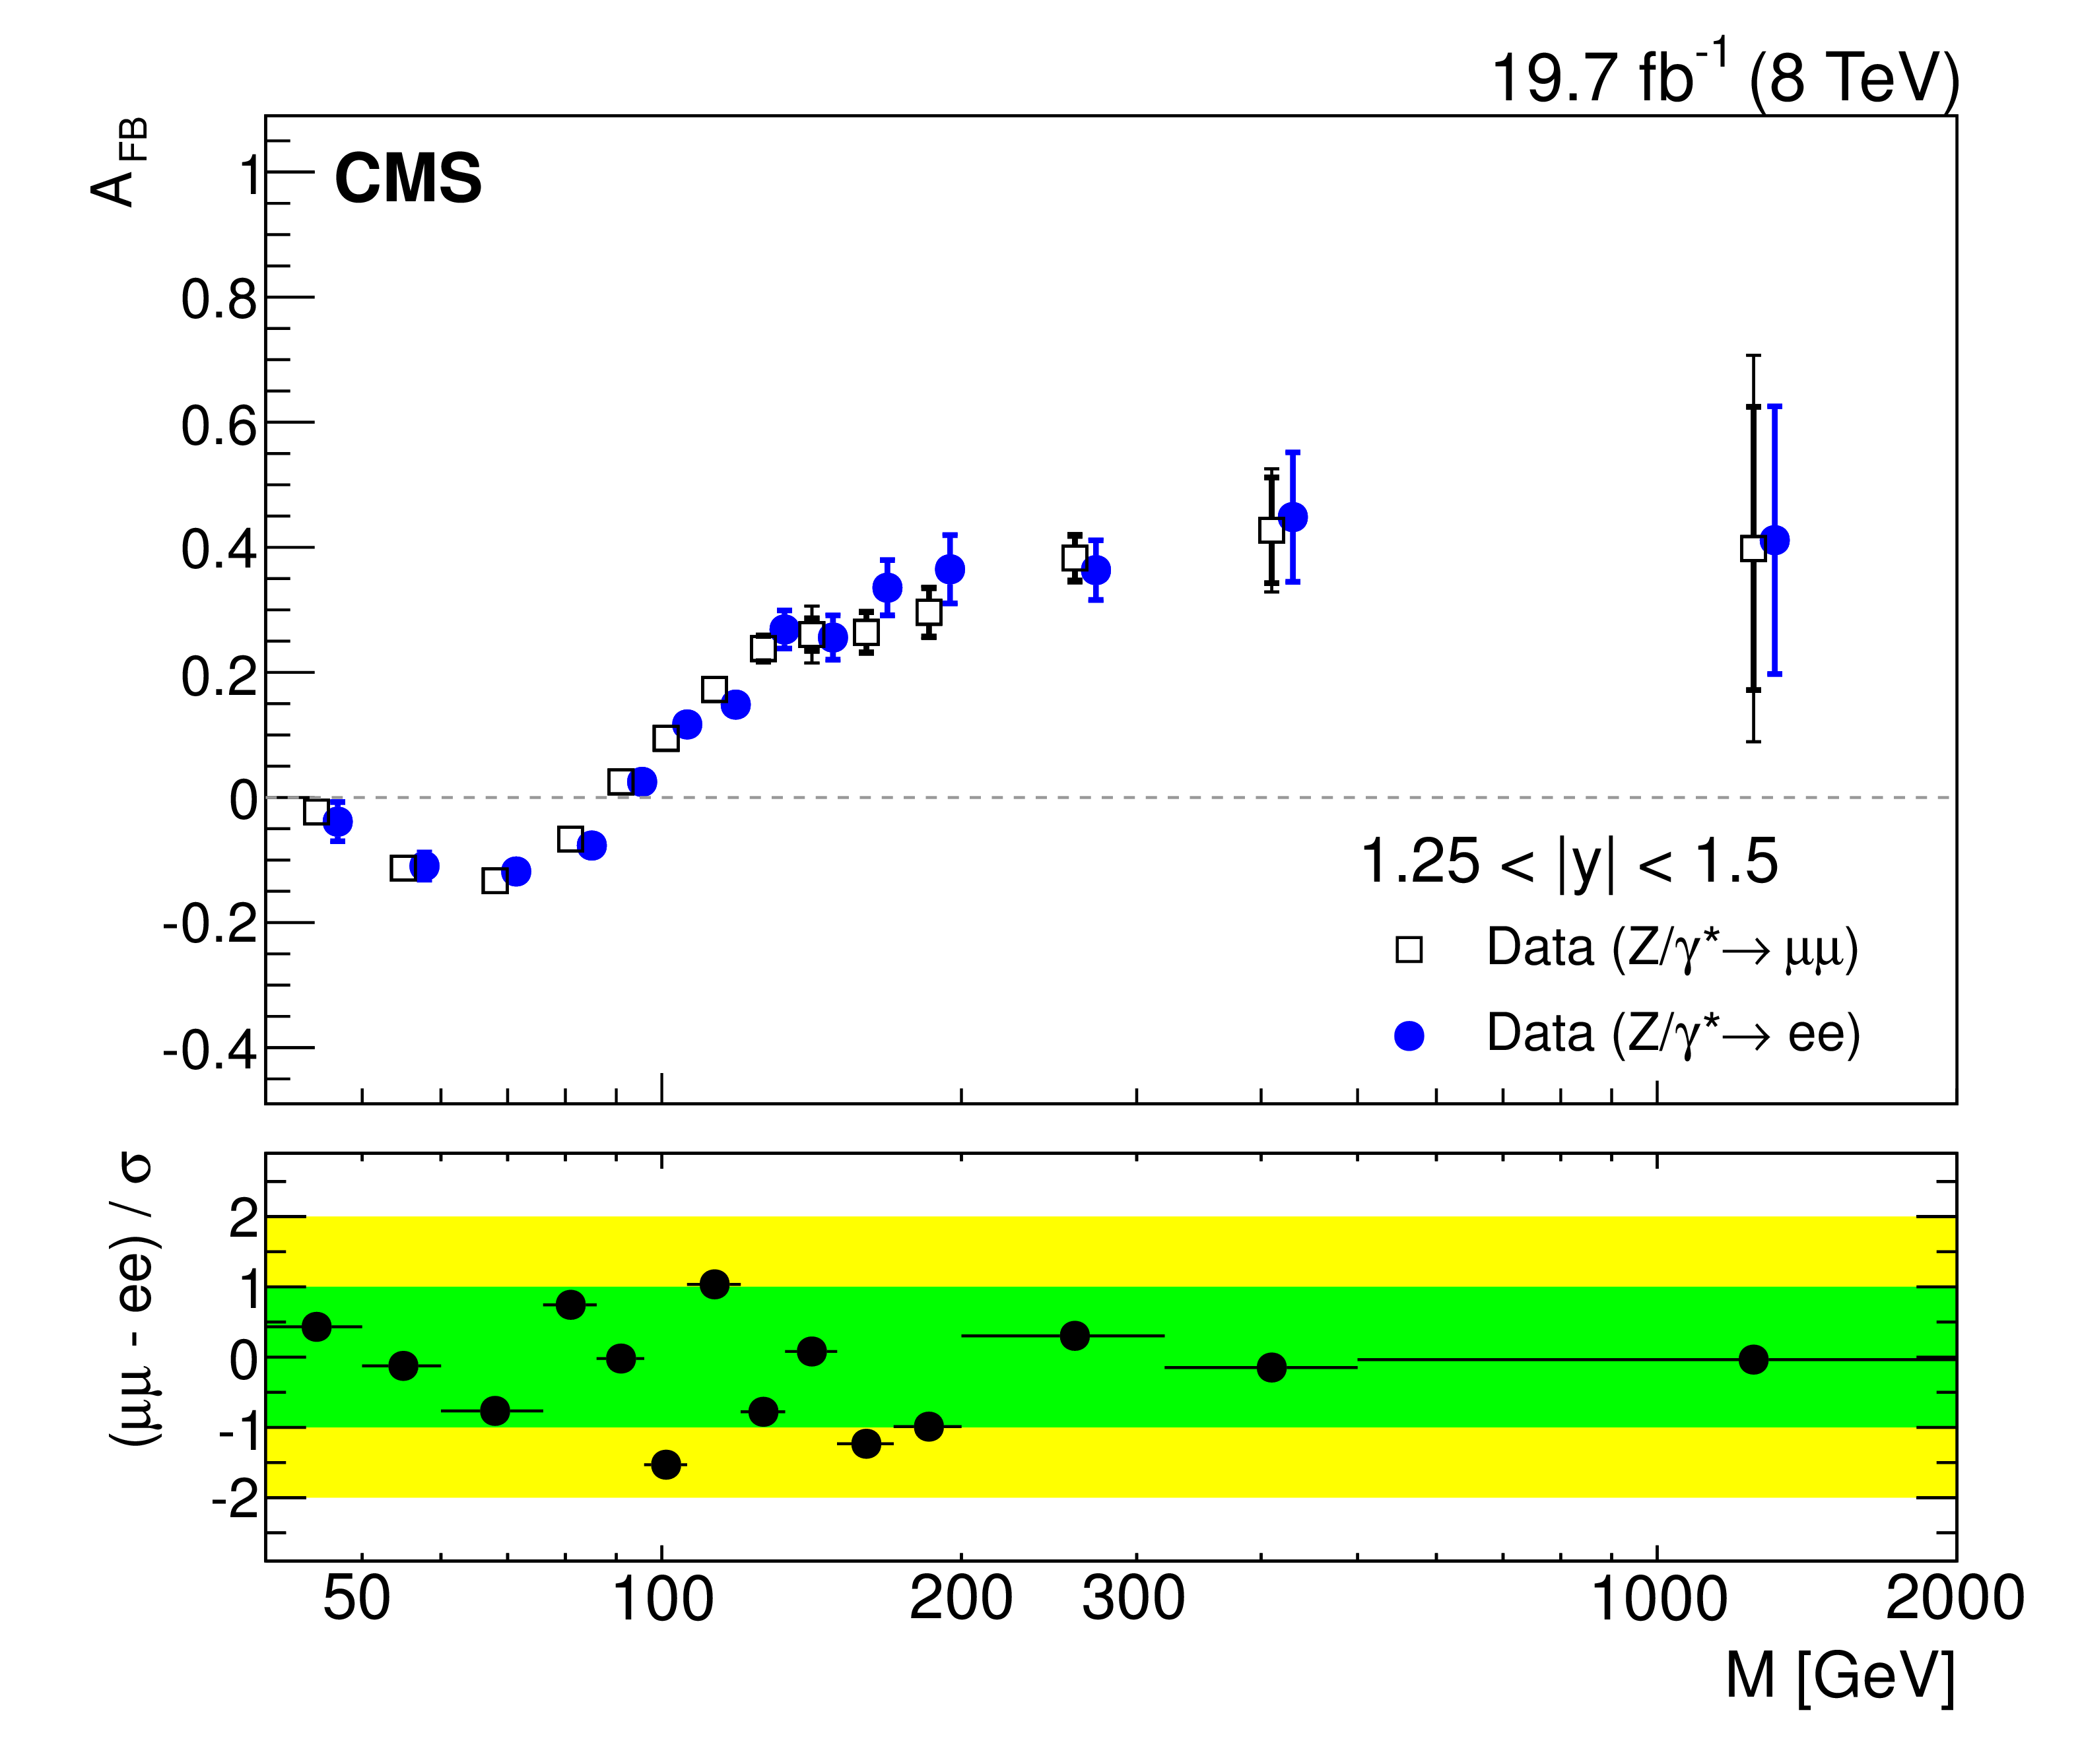
The unfolded ${A_\mathrm {FB}}$ distributions for muons (open squares) and electrons (solid circles) for the four central rapidity regions. The statistical (thick vertical bar) and statistical plus systematics (thin vertical bar) uncertainties are presented. The solid circles are shifted slightly to compare the result better. The lower panel in each plot shows the difference of the unfolded ${A_\mathrm {FB}}$ in muons and electrons divided by the total uncertainty (stat. $\oplus $ syst.). |
png pdf |
Figure 3-b:
The unfolded ${A_\mathrm {FB}}$ distributions for muons (open squares) and electrons (solid circles) for the four central rapidity regions. The statistical (thick vertical bar) and statistical plus systematics (thin vertical bar) uncertainties are presented. The solid circles are shifted slightly to compare the result better. The lower panel in each plot shows the difference of the unfolded ${A_\mathrm {FB}}$ in muons and electrons divided by the total uncertainty (stat. $\oplus $ syst.). |
png pdf |
Figure 3-c:
The unfolded ${A_\mathrm {FB}}$ distributions for muons (open squares) and electrons (solid circles) for the four central rapidity regions. The statistical (thick vertical bar) and statistical plus systematics (thin vertical bar) uncertainties are presented. The solid circles are shifted slightly to compare the result better. The lower panel in each plot shows the difference of the unfolded ${A_\mathrm {FB}}$ in muons and electrons divided by the total uncertainty (stat. $\oplus $ syst.). |

png pdf |
Figure 3-d:
The unfolded ${A_\mathrm {FB}}$ distributions for muons (open squares) and electrons (solid circles) for the four central rapidity regions. The statistical (thick vertical bar) and statistical plus systematics (thin vertical bar) uncertainties are presented. The solid circles are shifted slightly to compare the result better. The lower panel in each plot shows the difference of the unfolded ${A_\mathrm {FB}}$ in muons and electrons divided by the total uncertainty (stat. $\oplus $ syst.). |
png pdf |
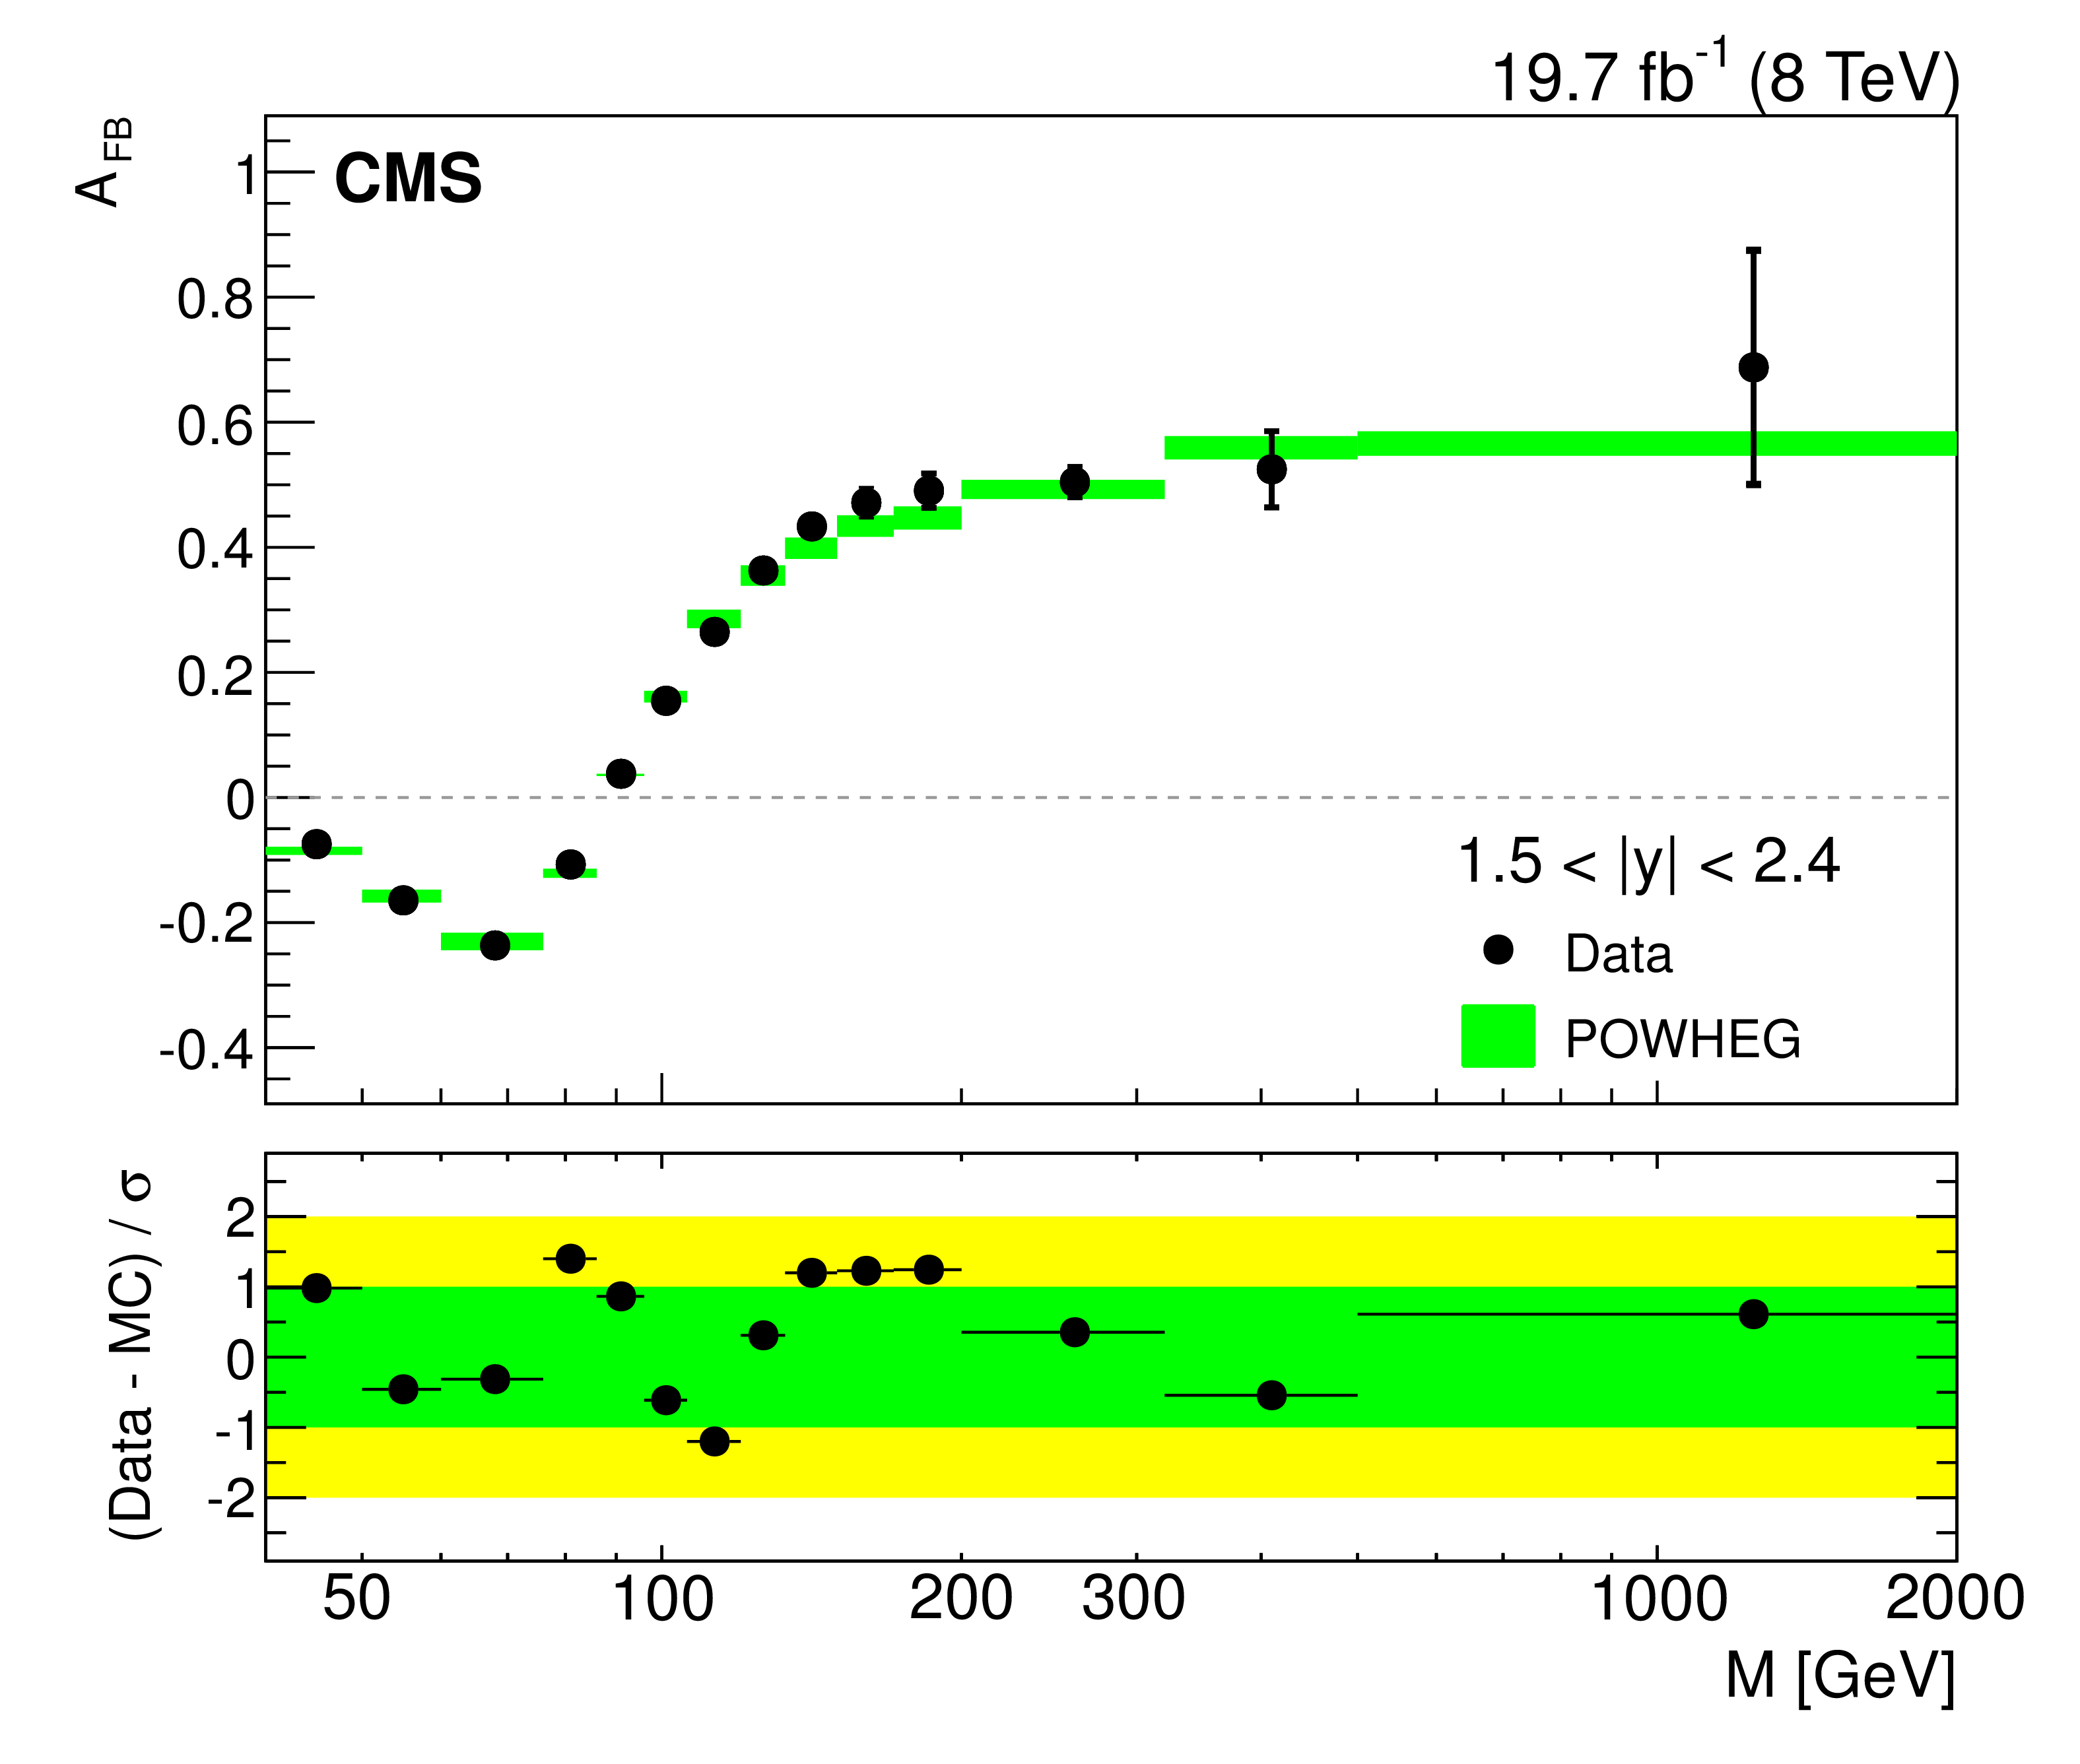
Figure 4-a:
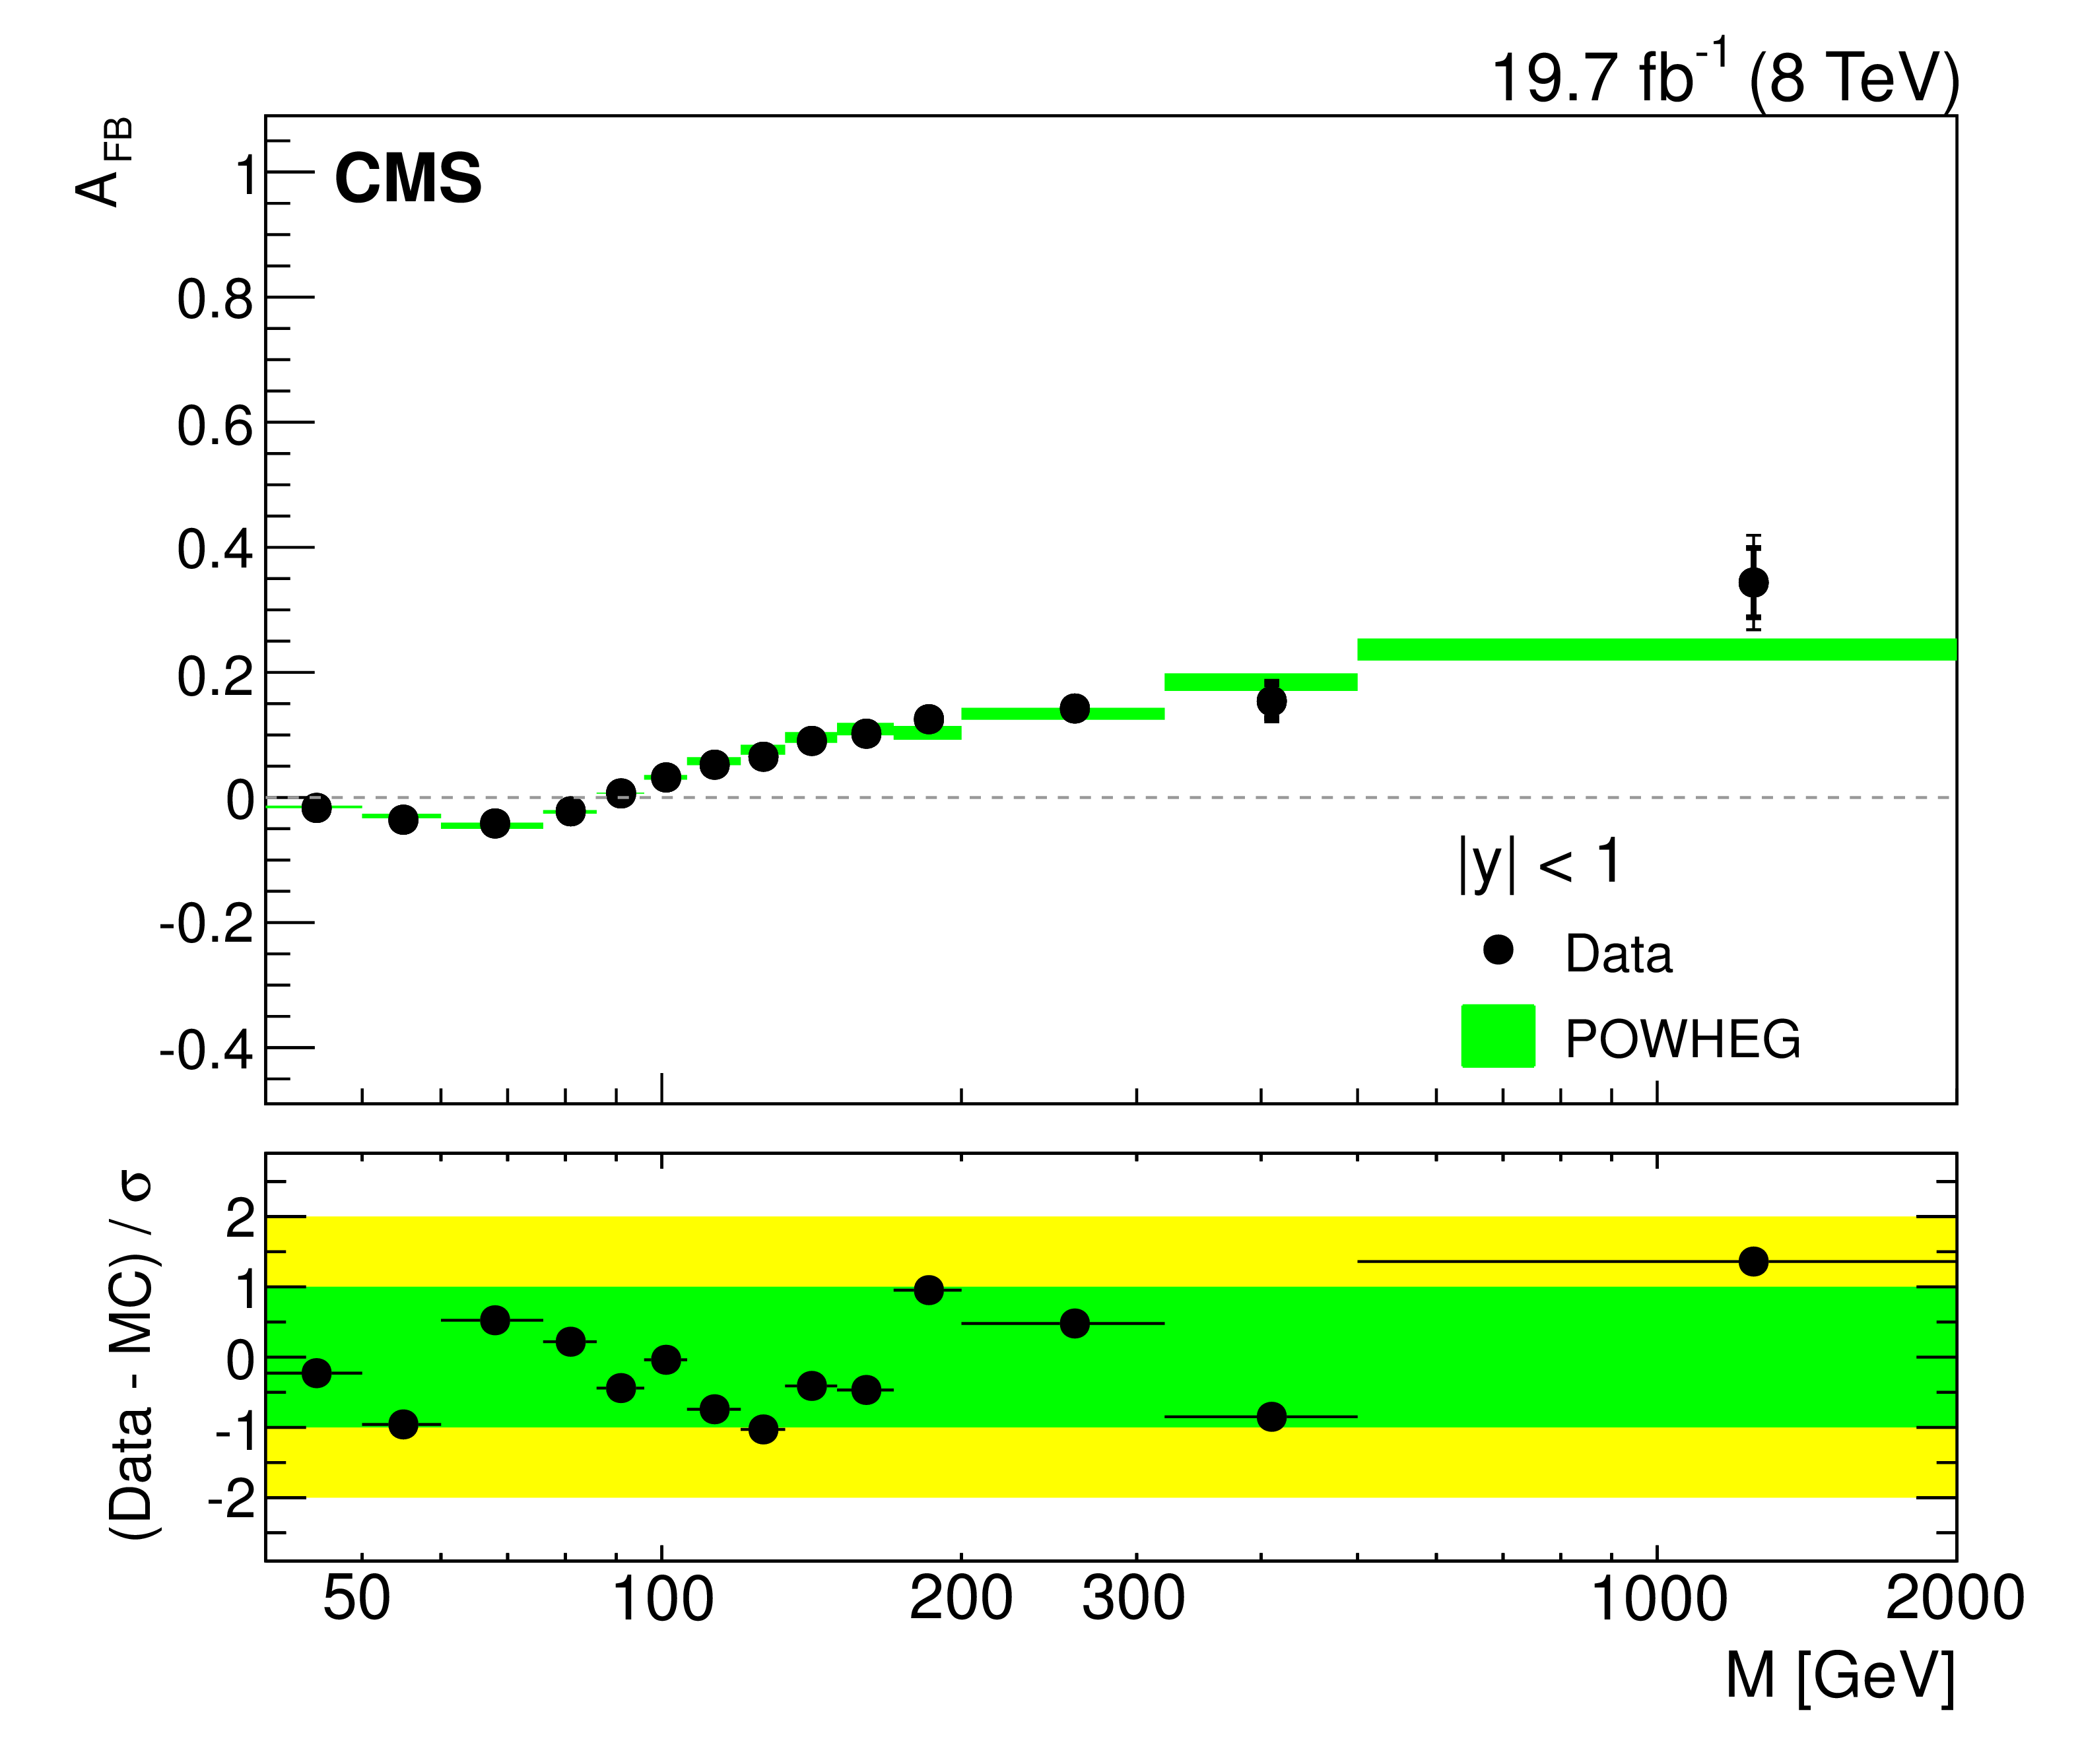
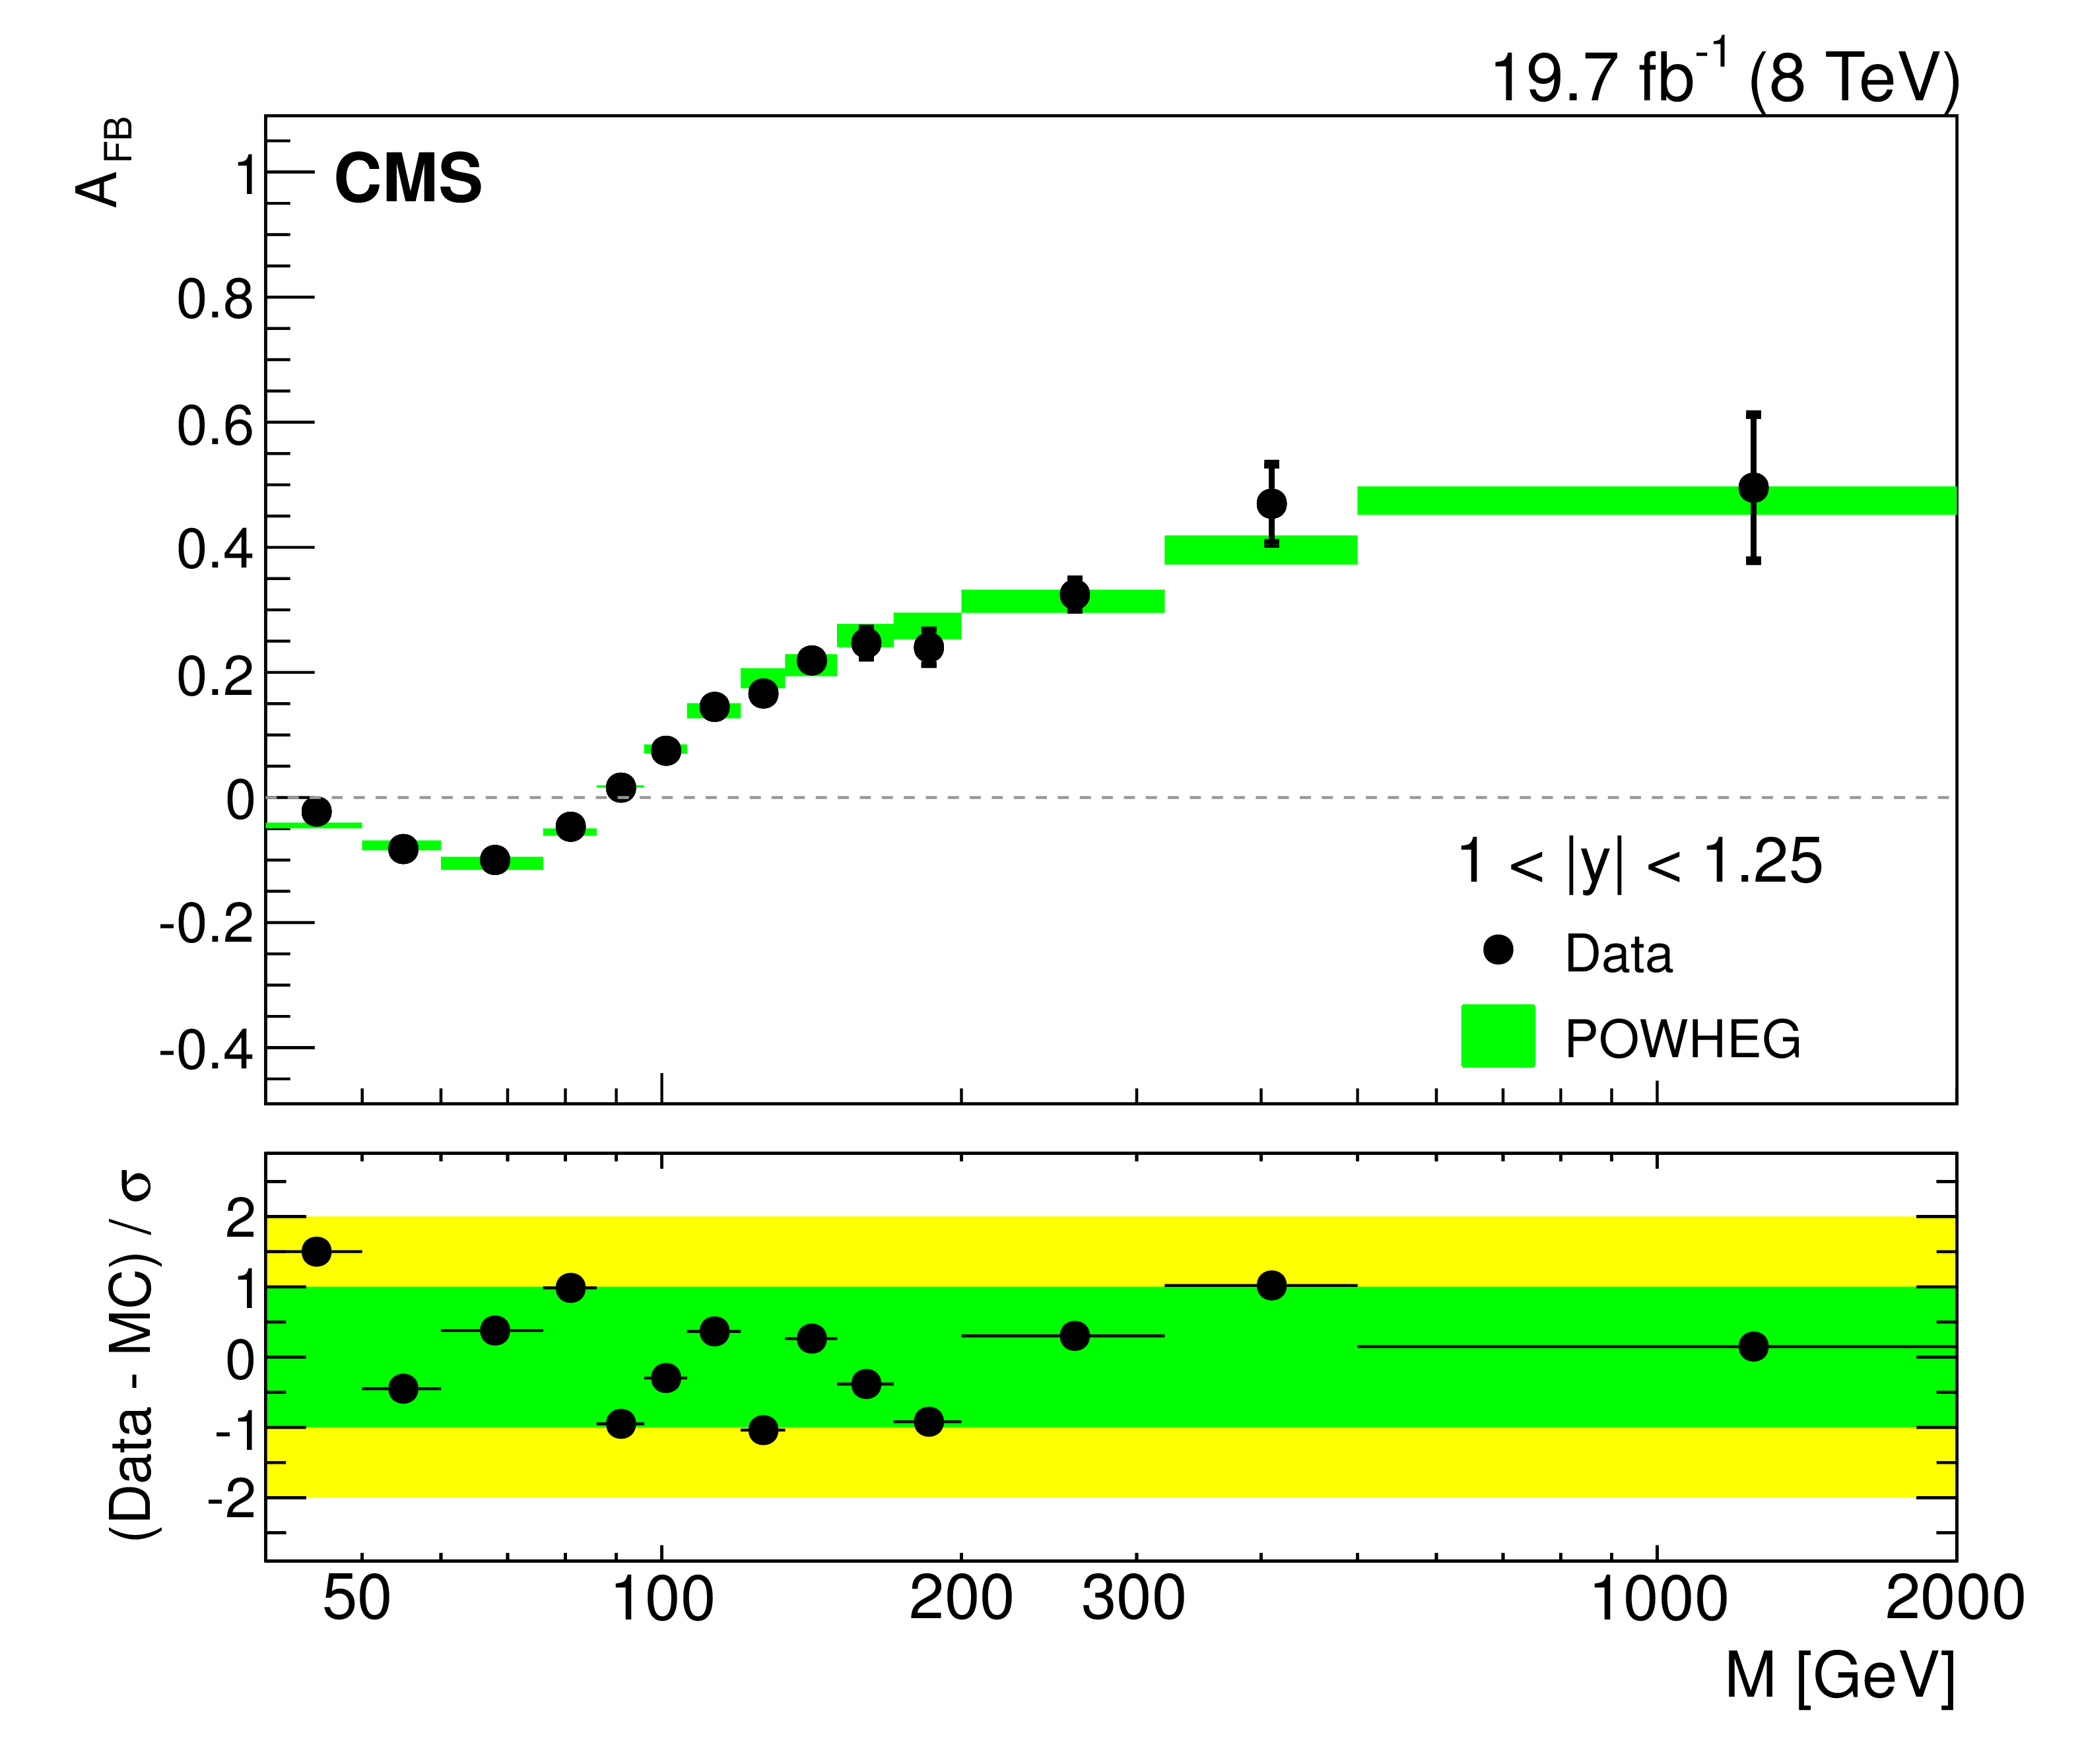
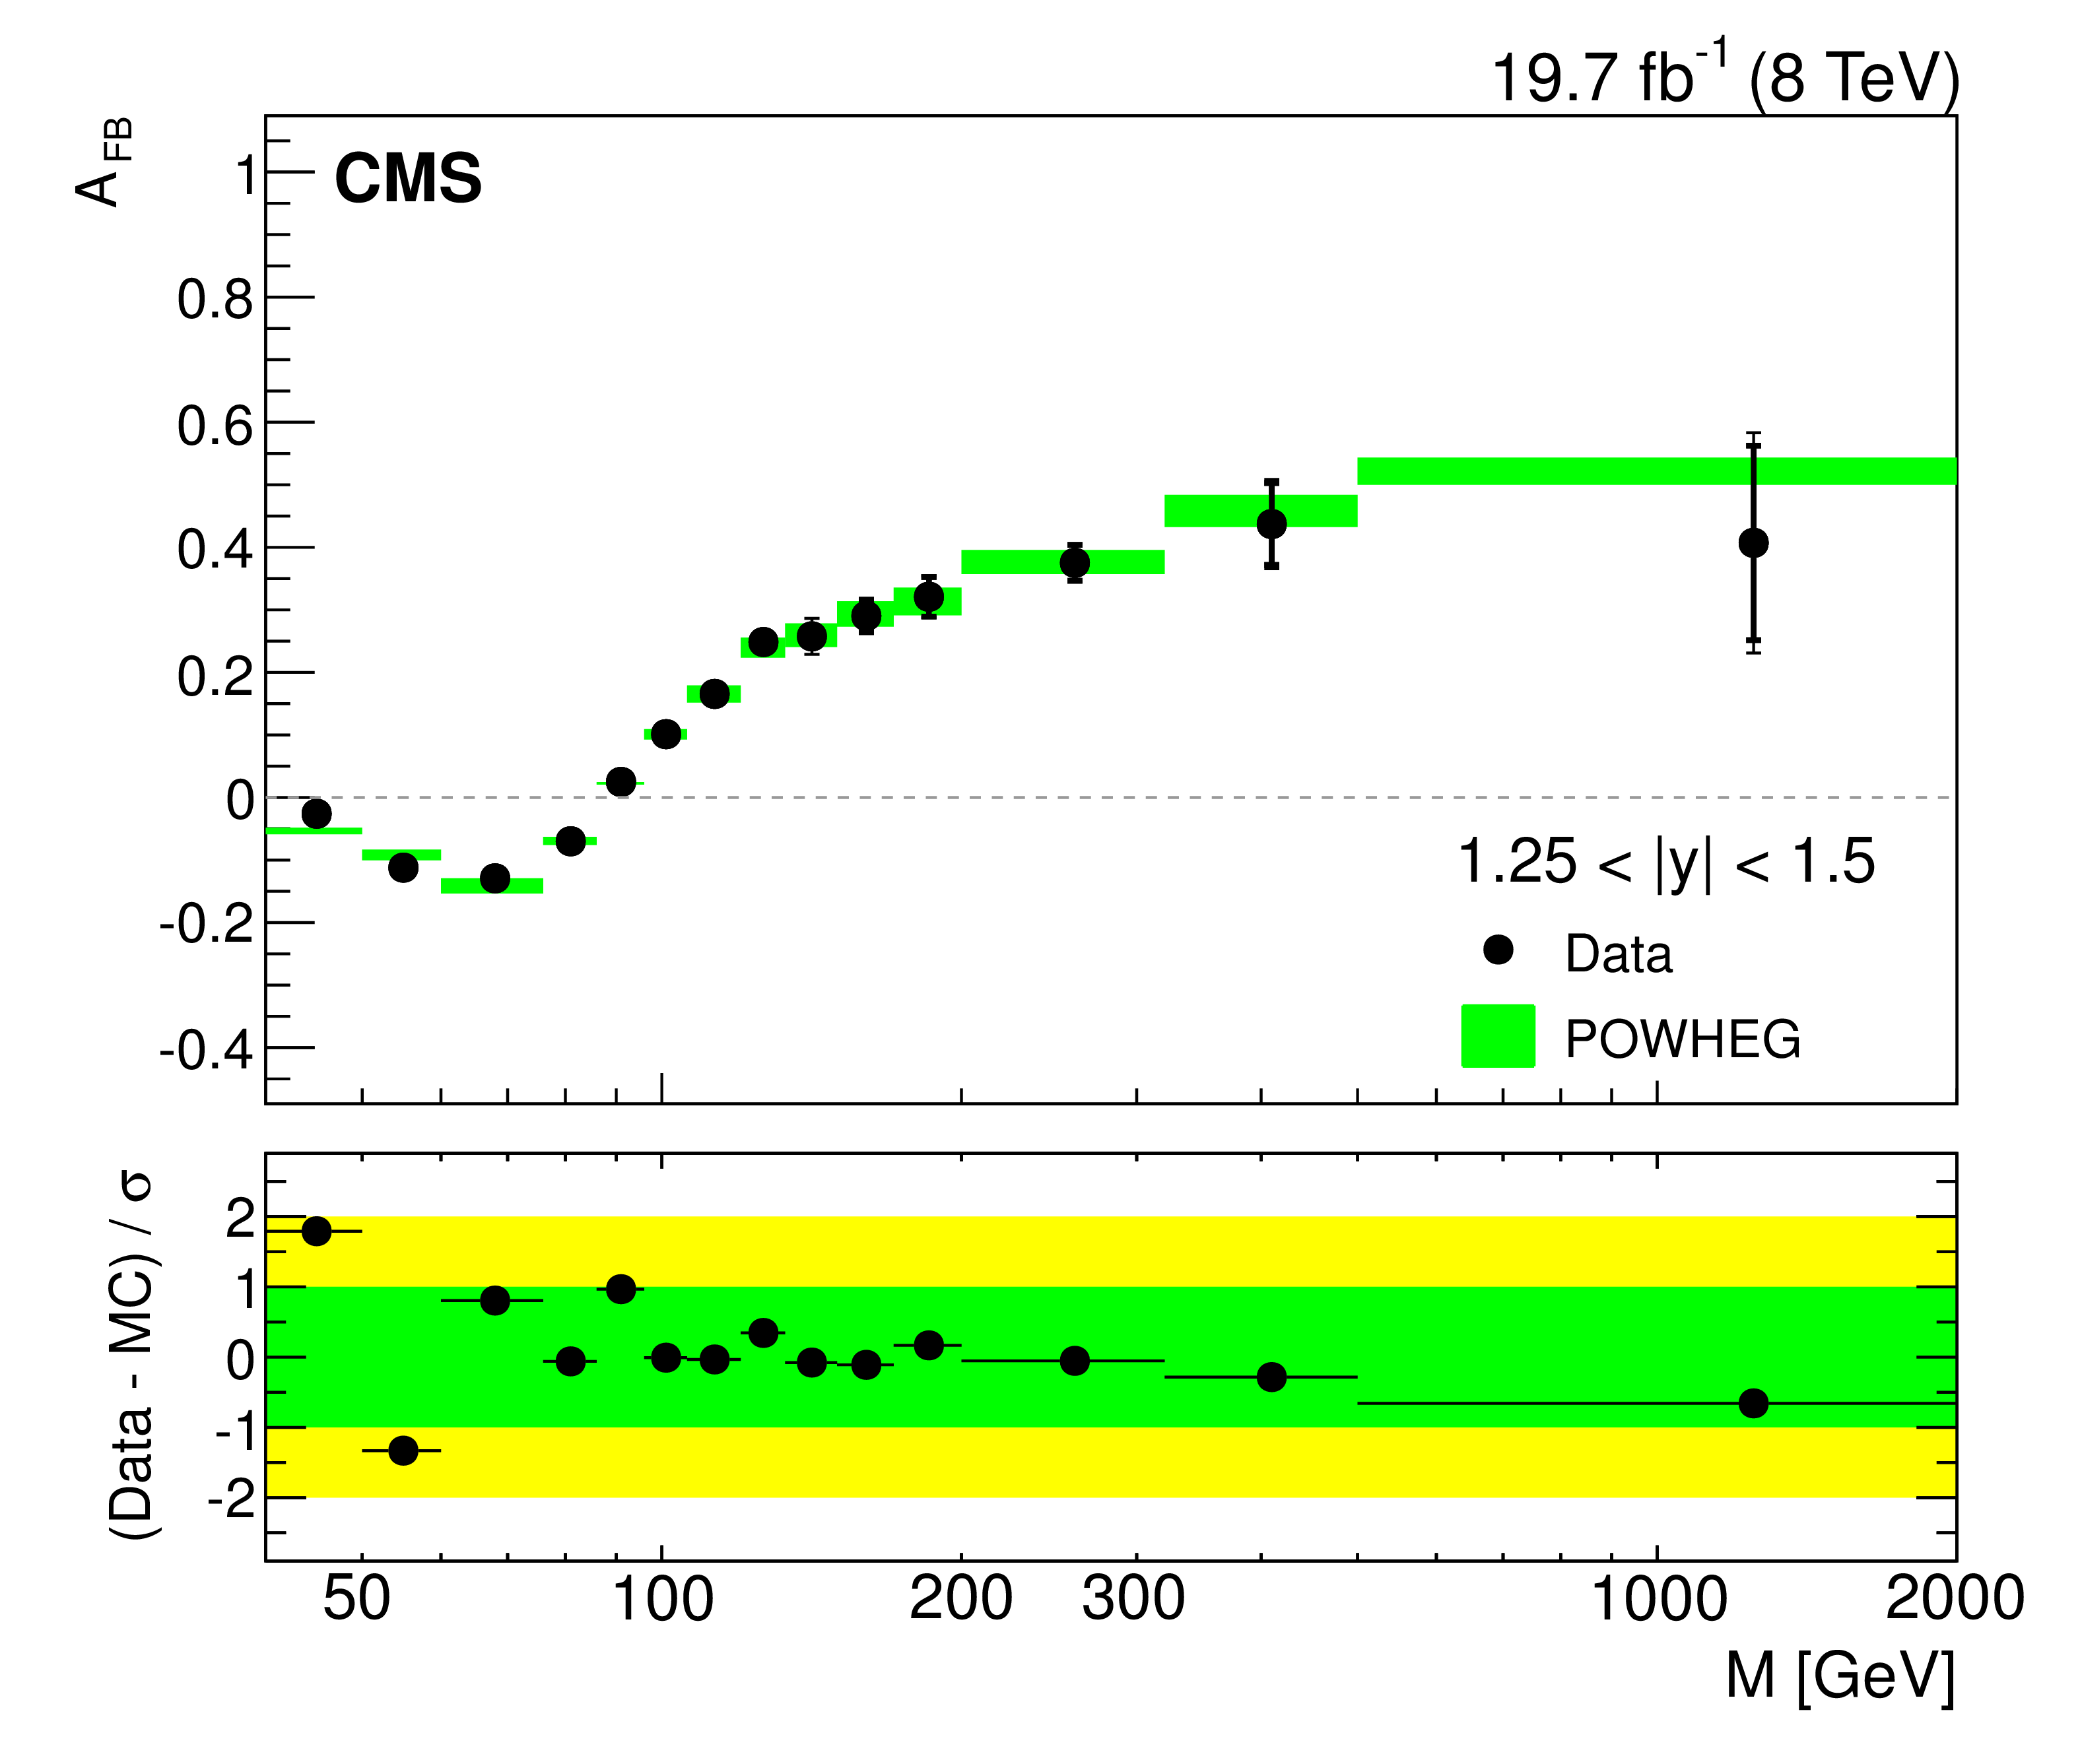
The combined ($\mu^+ \mu^- $ and $\mathrm{ e }^- \mathrm{ e }^+ $ ) unfolded ${A_\mathrm {FB}}$ distributions in the four central rapidity regions. The statistical (thick vertical bar) and statistical plus systematics (thin vertical bar) uncertainties are presented. The measurements are compared with the prediction of POWHEG. The total uncertainties (considering the statistical, PDF, and scale uncertainties) in the POWHEG prediction are shown as shaded bands. The lower panel in each plot shows the difference of ${A_\mathrm {FB}}$ in data and prediction divided by the total uncertainty of data and prediction. |
png pdf |
Figure 4-b:
The combined ($\mu^+ \mu^- $ and $\mathrm{ e }^- \mathrm{ e }^+ $ ) unfolded ${A_\mathrm {FB}}$ distributions in the four central rapidity regions. The statistical (thick vertical bar) and statistical plus systematics (thin vertical bar) uncertainties are presented. The measurements are compared with the prediction of POWHEG. The total uncertainties (considering the statistical, PDF, and scale uncertainties) in the POWHEG prediction are shown as shaded bands. The lower panel in each plot shows the difference of ${A_\mathrm {FB}}$ in data and prediction divided by the total uncertainty of data and prediction. |
png pdf |
Figure 4-c:
The combined ($\mu^+ \mu^- $ and $\mathrm{ e }^- \mathrm{ e }^+ $ ) unfolded ${A_\mathrm {FB}}$ distributions in the four central rapidity regions. The statistical (thick vertical bar) and statistical plus systematics (thin vertical bar) uncertainties are presented. The measurements are compared with the prediction of POWHEG. The total uncertainties (considering the statistical, PDF, and scale uncertainties) in the POWHEG prediction are shown as shaded bands. The lower panel in each plot shows the difference of ${A_\mathrm {FB}}$ in data and prediction divided by the total uncertainty of data and prediction. |
png pdf |
Figure 4-d:
The combined ($\mu^+ \mu^- $ and $\mathrm{ e }^- \mathrm{ e }^+ $ ) unfolded ${A_\mathrm {FB}}$ distributions in the four central rapidity regions. The statistical (thick vertical bar) and statistical plus systematics (thin vertical bar) uncertainties are presented. The measurements are compared with the prediction of POWHEG. The total uncertainties (considering the statistical, PDF, and scale uncertainties) in the POWHEG prediction are shown as shaded bands. The lower panel in each plot shows the difference of ${A_\mathrm {FB}}$ in data and prediction divided by the total uncertainty of data and prediction. |
png pdf |
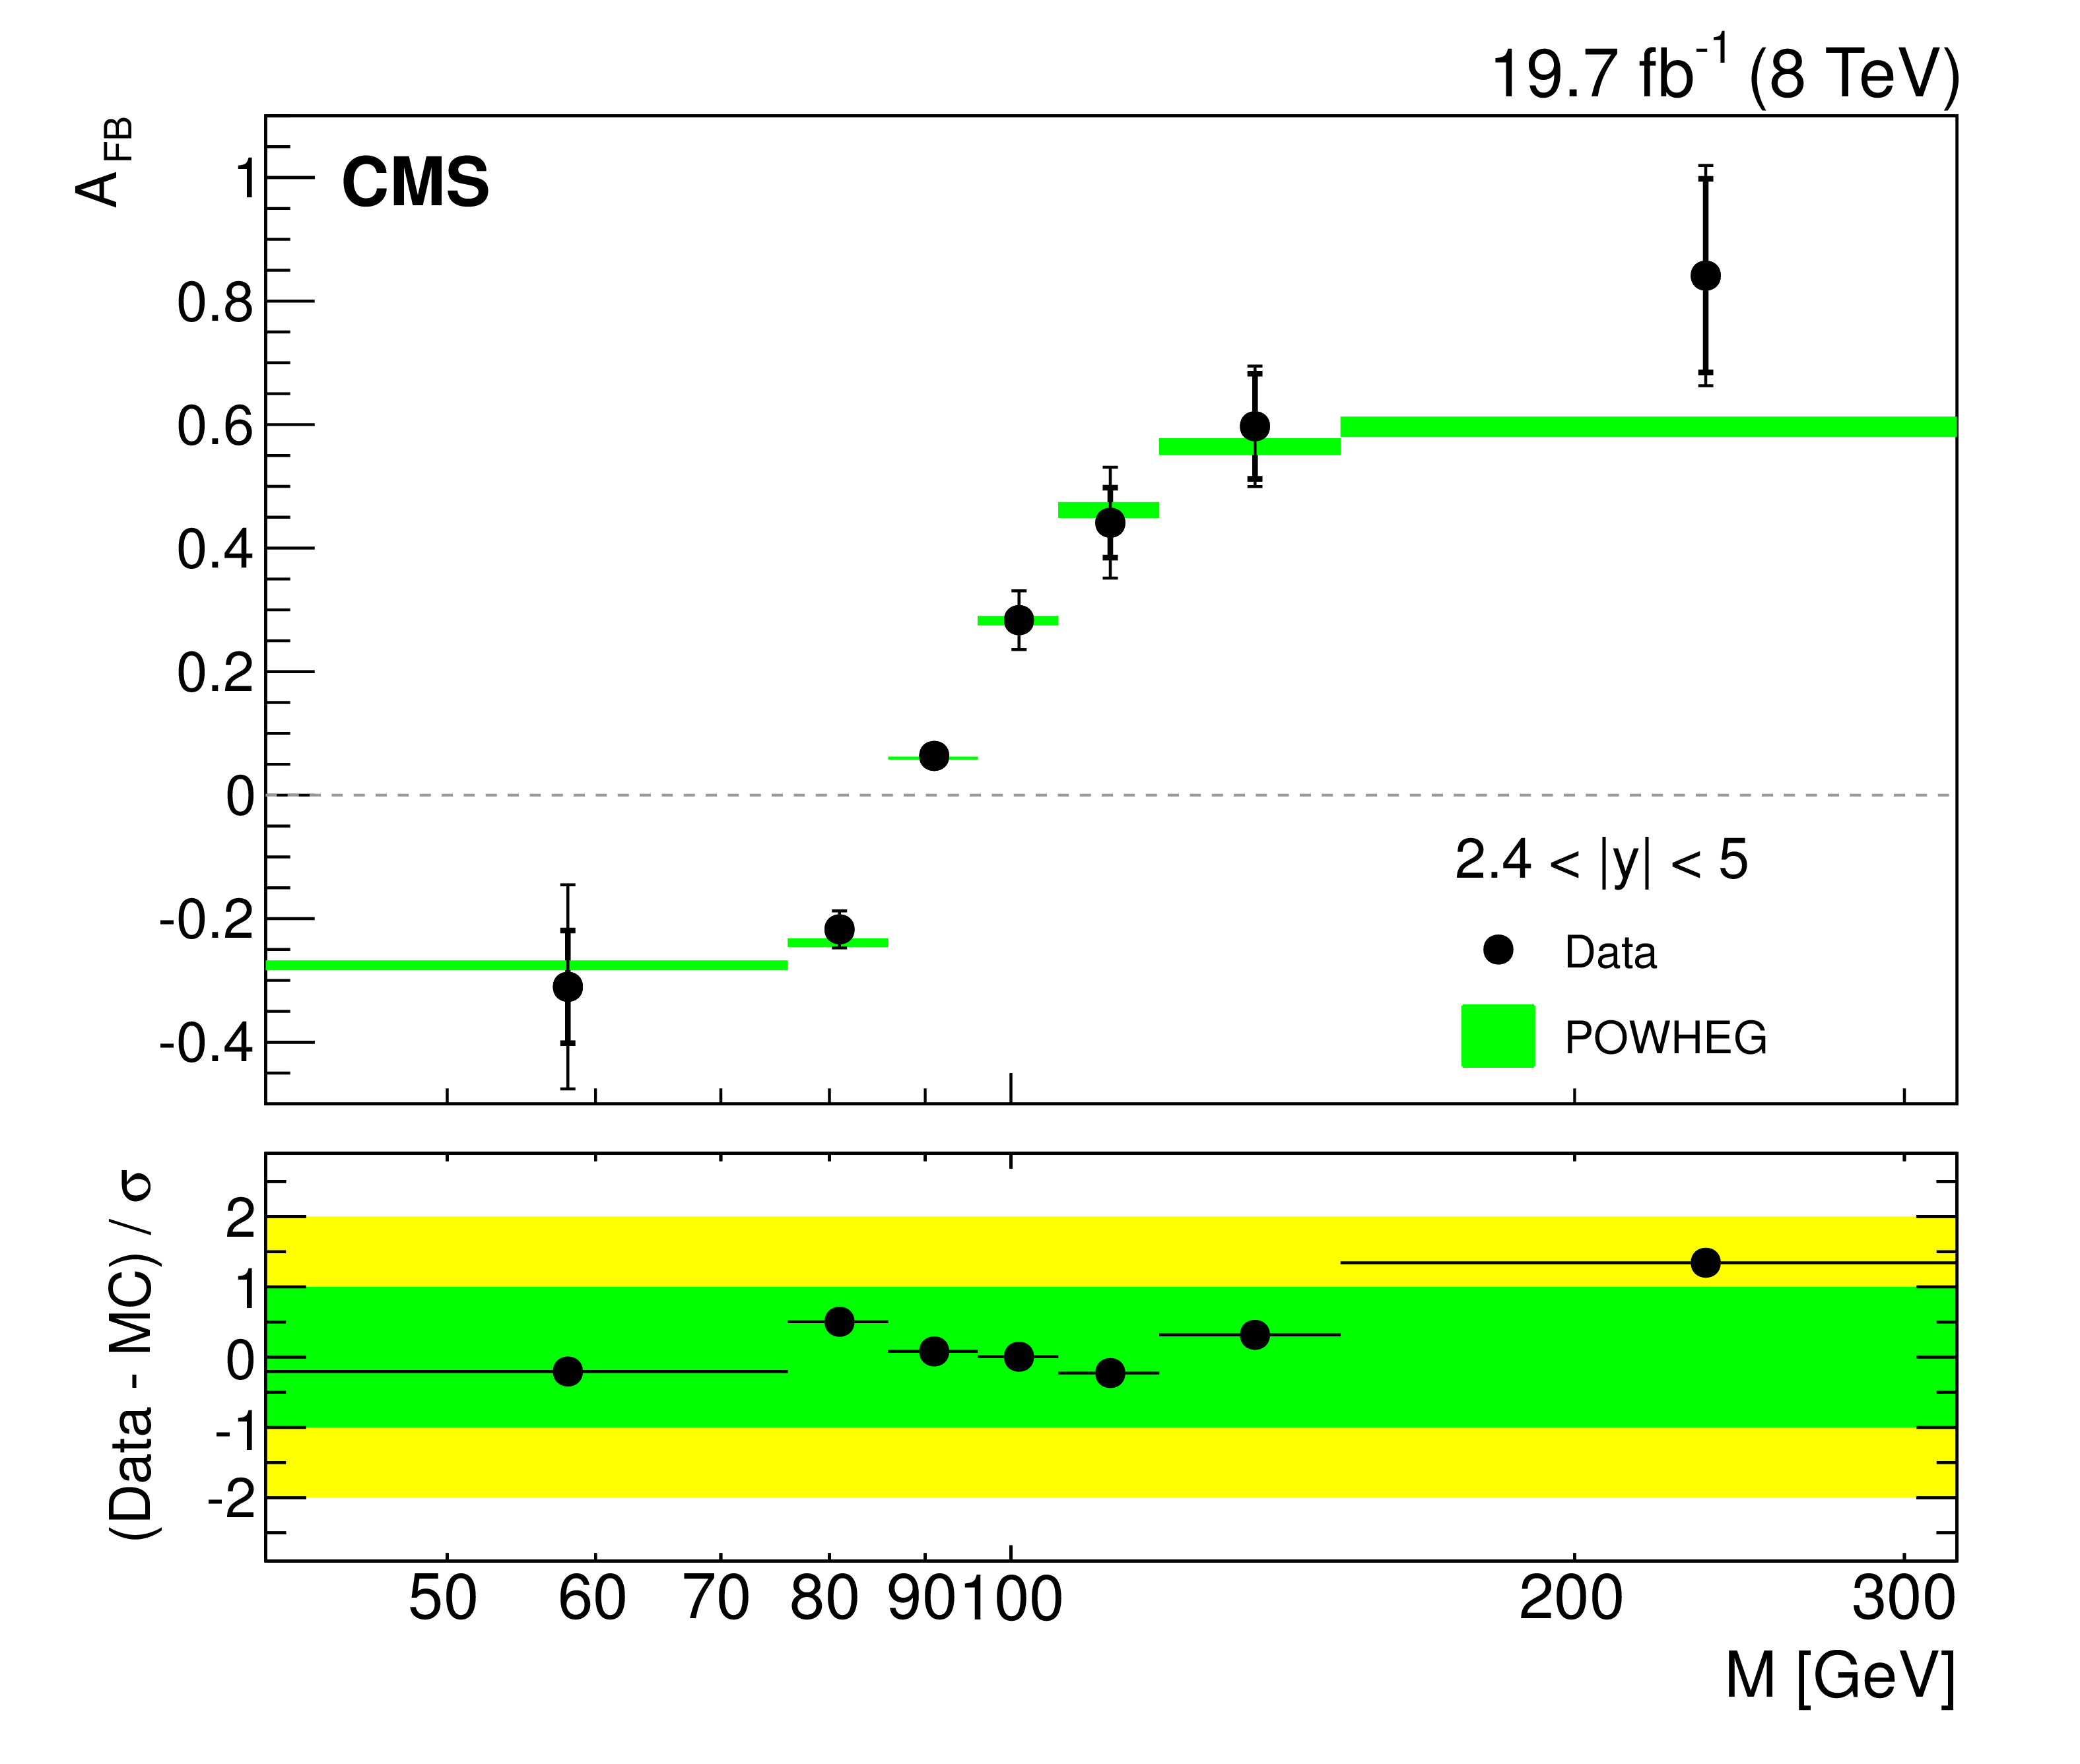
Figure 5:
The unfolded ${A_\mathrm {FB}}$ distribution for the forward rapidity region (2.4 $ < {| y | }< $ 5 ) using one central electron ($ {| \eta | }< $ 2.4 ) and one HF electron (3 $ < {| \eta | }< $ 5 ). The inner thick vertical bars correspond to the statistical uncertainty and the outer thin vertical bars to the total uncertainties. The measurements are compared with the prediction of POWHEG. The total uncertainties (considering the statistical, PDF, and scale uncertainties) in the POWHEG prediction are shown as shaded bands. The lower panel shows the difference of ${A_\mathrm {FB}}$ in data and prediction divided by the total uncertainty of data and prediction. |
| Tables | |
png pdf |
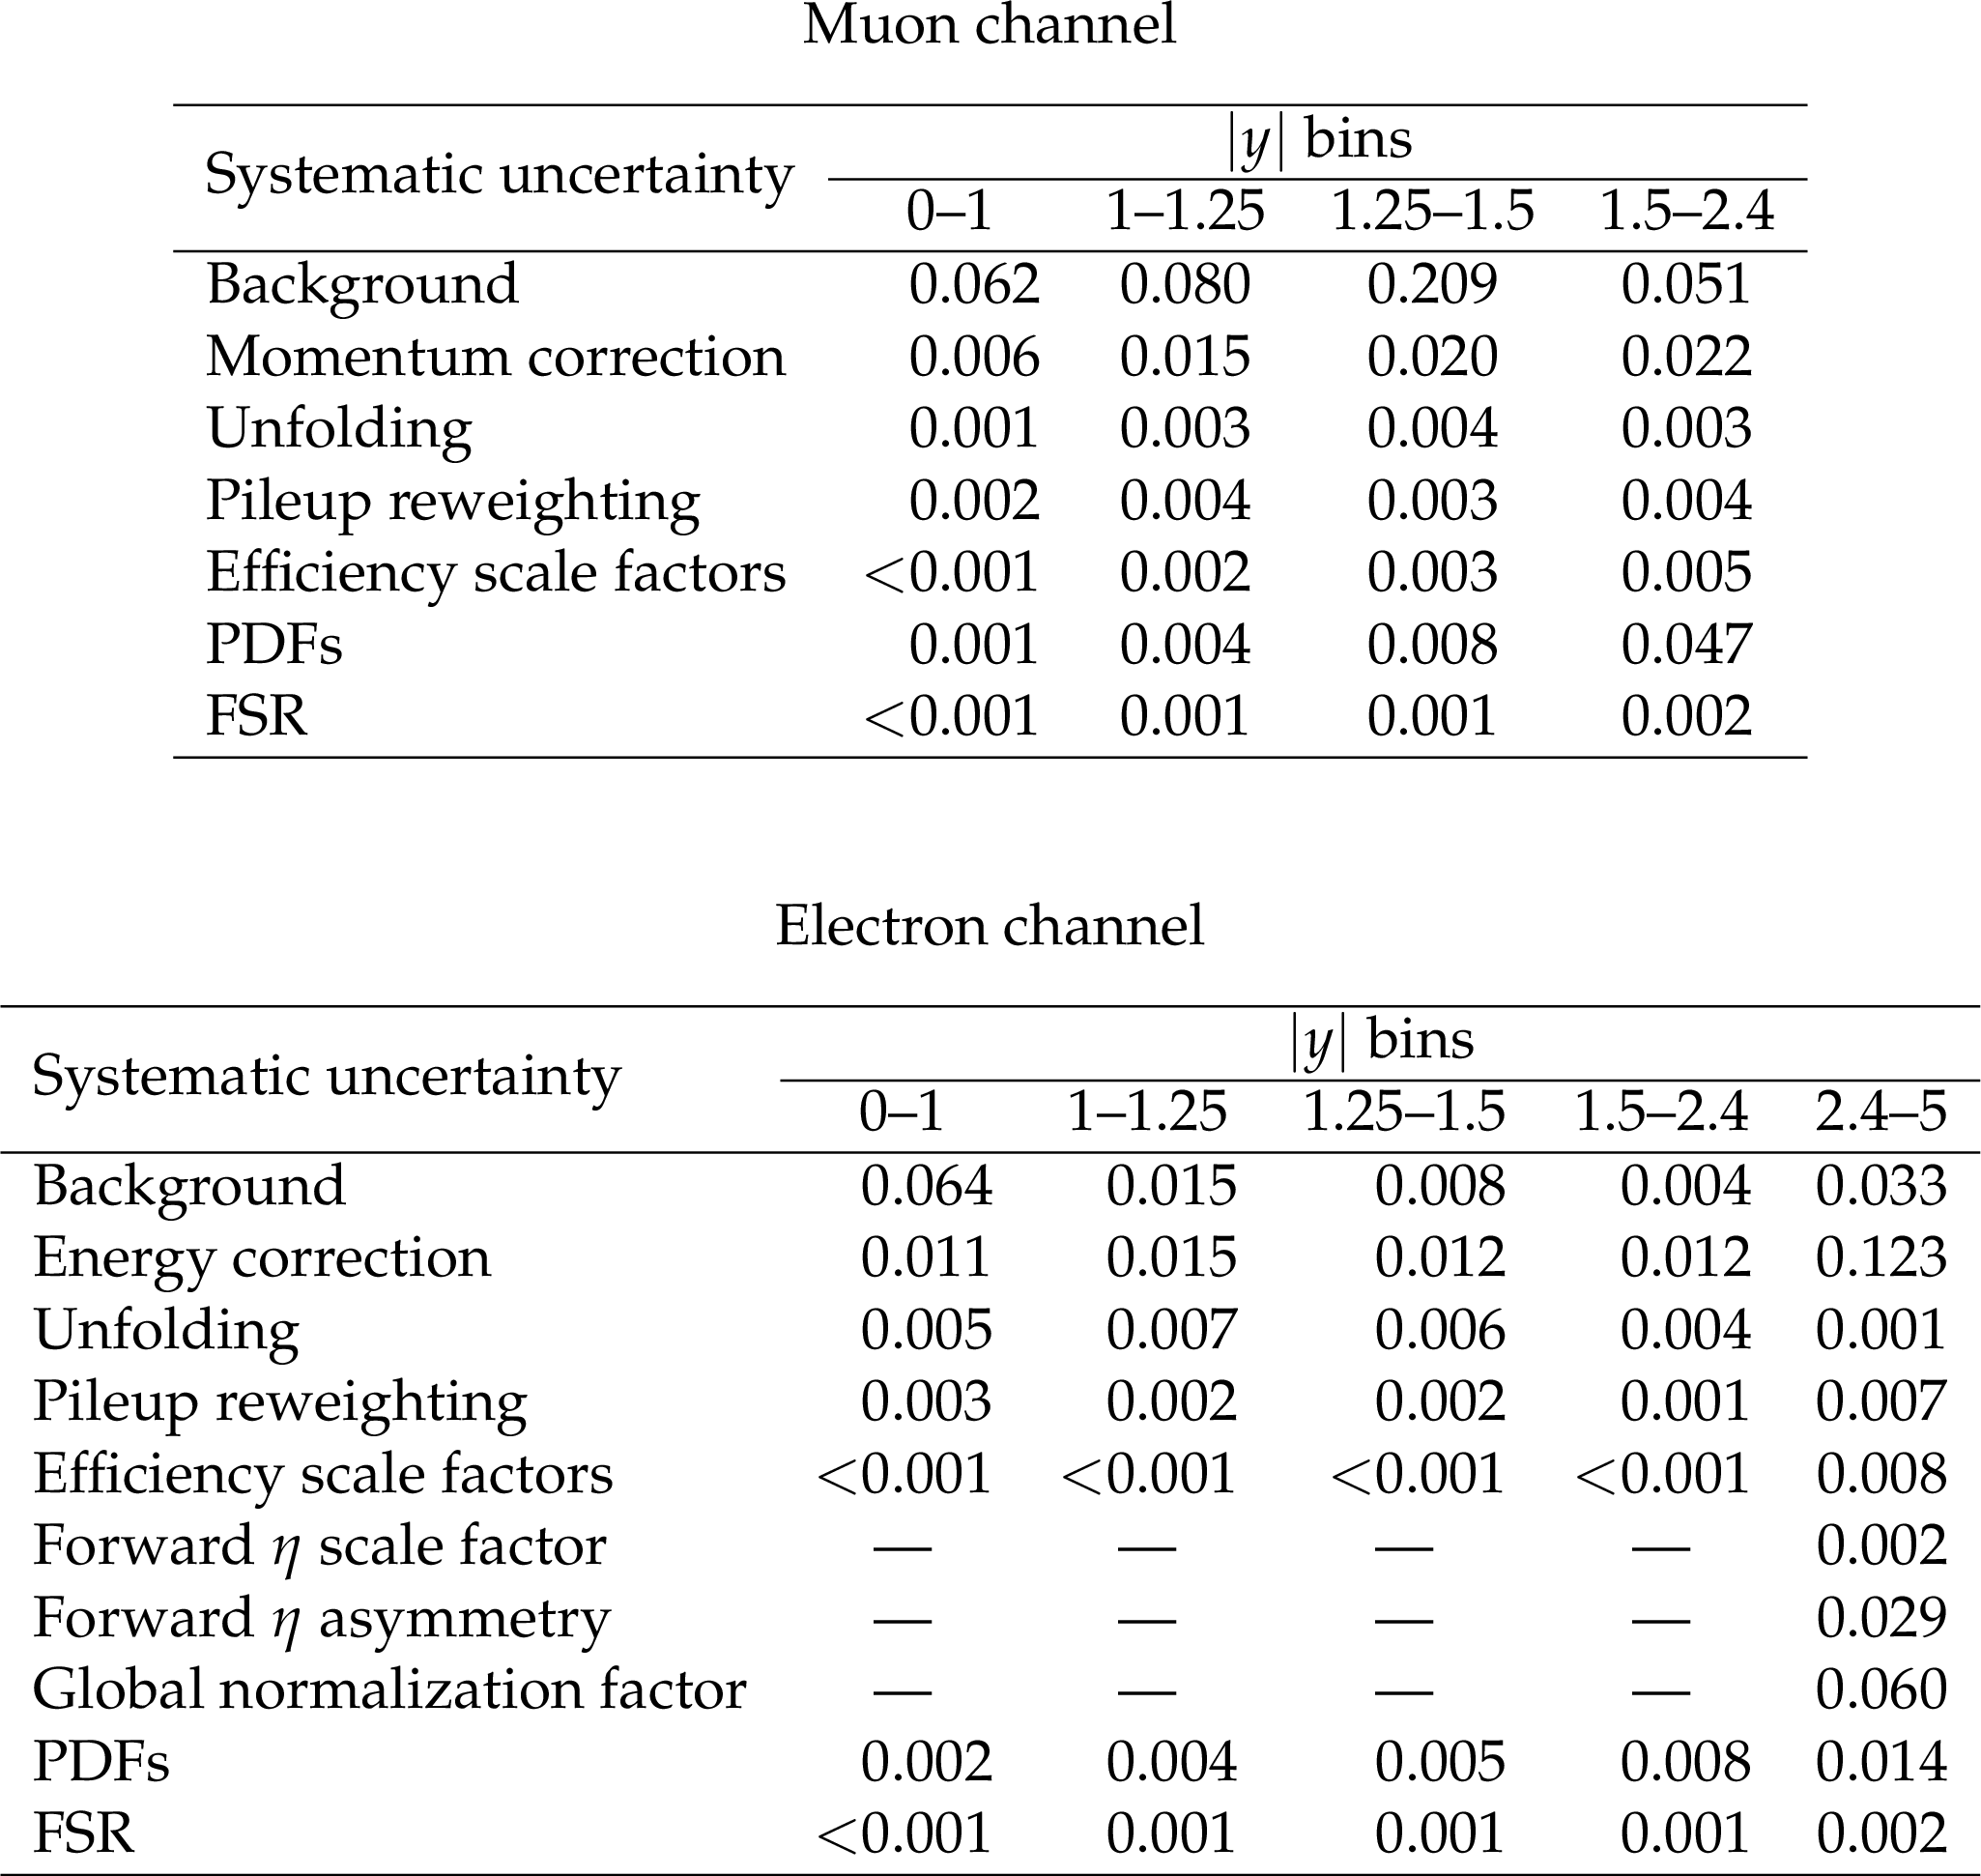
Table 1:
The maximum value of the systematic uncertainty in ${A_\mathrm {FB}}$ as a function of $M$ from each source for different regions of $ {| y | }$. |
png pdf |
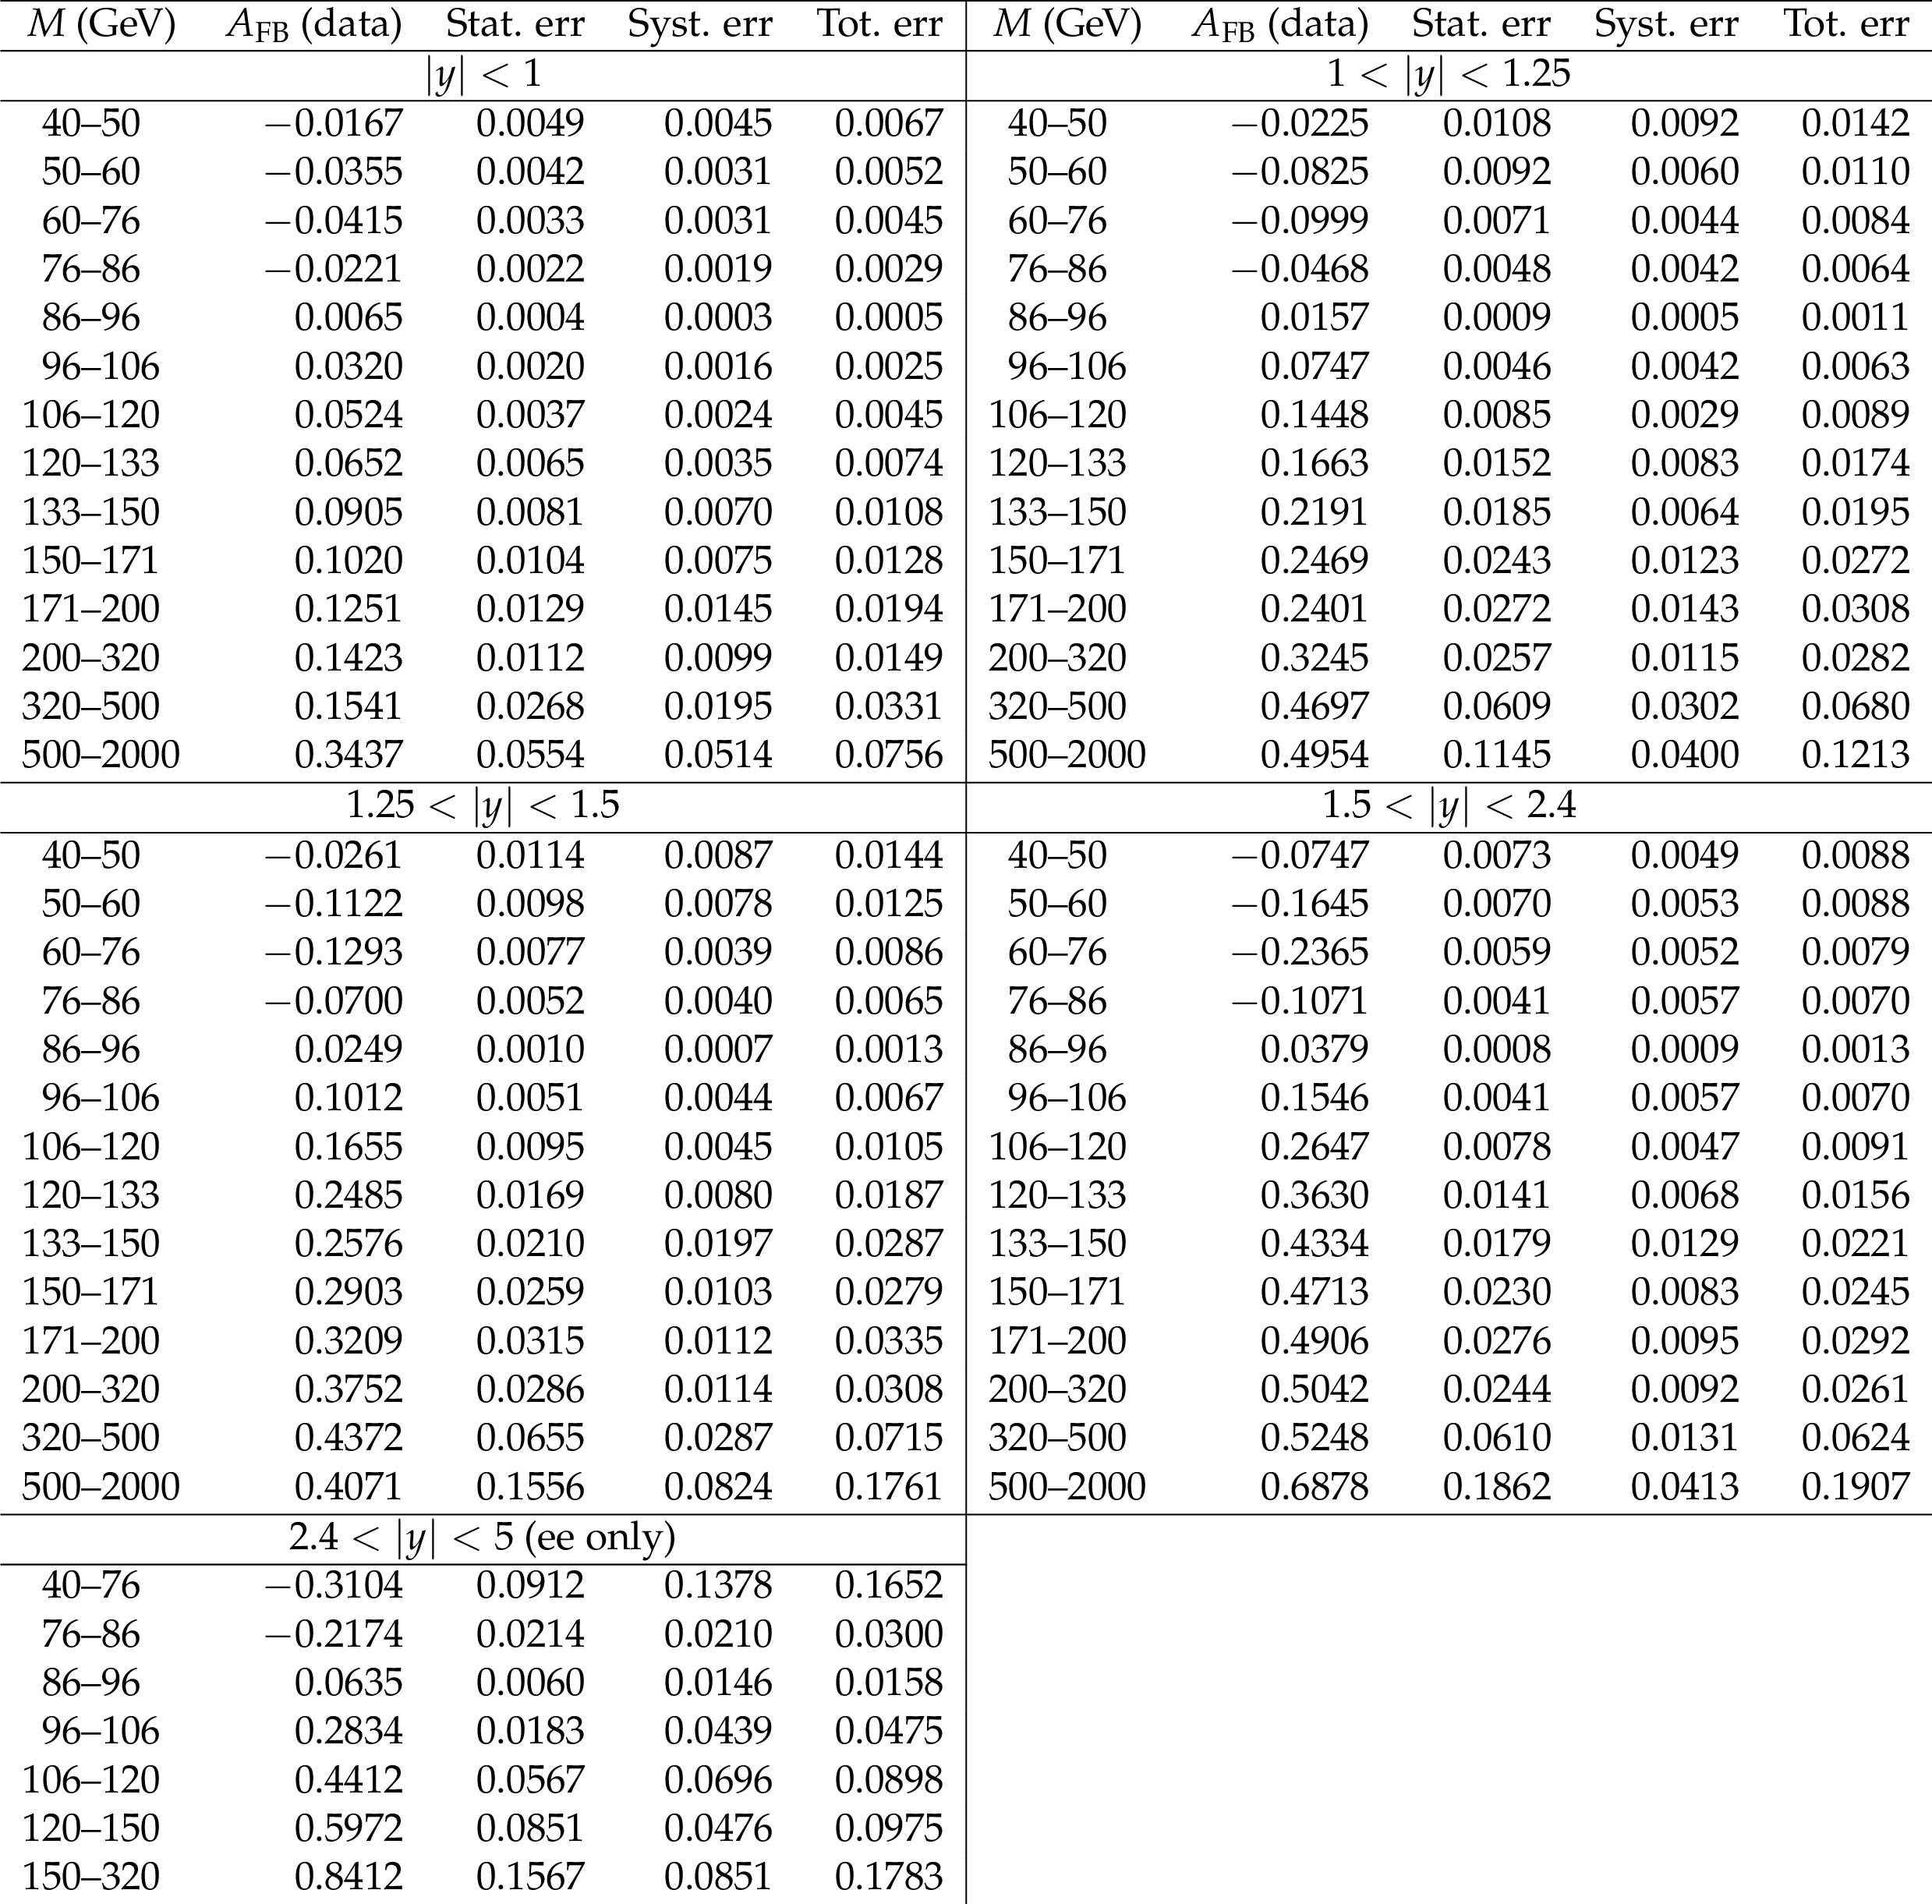
Table 2:
The combined ($\mathrm{ e } \mathrm{ e } $ and $\mu \mu $) ${A_\mathrm {FB}}$ measurements, with statistical and systematic uncertainties for the four rapidity regions with $ {| y | }< $ 2.4. The ${A_\mathrm {FB}}$ quantity for $\mathrm{ e } \mathrm{ e } $ events is also shown for 2.4 $ < {| y | }< $ 5. |
| Summary |
| We report a measurement of the forward-backward asymmetry of oppositely charged $\mu\mu$ and $\mathrm{ e }\mathrm{ e }$ pairs produced via a $\mathrm{Z}/\gamma^*$ boson exchange at $\sqrt{s} = $ 8 TeV with a data sample corresponding to an integrated luminosity of 19.7 fb$^{-1}$. The $A_{\mathrm{FB}}$ measurement is performed as a function of the dilepton invariant mass between 40 GeV and 2 TeV for $\mu\mu$ and $\mathrm{ e }\mathrm{ e }$ events in 4 dilepton rapidity bins up to $| y | = $ 2.4. For $\mathrm{ e }\mathrm{ e }$ events with 2.4 $ < | y | < $ 5, the $A_{\mathrm{FB}}$ measurement is performed for dielectron masses between 40 and 320 GeV. The large data sample collected at 8 TeV extends the measurement of $A_{\mathrm{FB}}$ in the high mass region compared to previous results. The final $A_{\mathrm{FB}}$ values are corrected for detector resolution, acceptance, and final state radiation effects. The measurements of $A_{\mathrm{FB}}$M are consistent with standard model predictions. |
| References | ||||
| 1 | D. London and J. L. Rosner | Extra Gauge Bosons in E$ _6 $ | PRD 34 (1986) 1530 | |
| 2 | J. L. Rosner | Off-Peak Lepton Asymmetries from New Z's | PRD 35 (1987) 2244 | |
| 3 | M. Cvetic and S. Godfrey | Discovery and identification of extra gauge bosons | in Electroweak Symmetry Breaking and New Physics at the TeV Scale, T. Barklow, S. Dawson, H. Haber, and J. Siegrist, eds., p. 383 World Scientific, Singapore | hep-ph/9504216 |
| 4 | J. L. Rosner | Forward-backward asymmetries in hadronically produced lepton pairs | PRD 54 (1996) 1078 | hep-ph/9512299 |
| 5 | A. Bodek and U. Baur | Implications of a 300-500 GeV/$ c^2 $ $ Z' $ boson on $ \rm p\bar{p} $ collider data at $ \sqrt{s}=1.8 $~TeV | EPJC 21 (2001) 607 | hep-ph/0102160 |
| 6 | CDF Collaboration | Limits on Quark-Lepton Compositeness Scales from Dileptons Produced in 1.8 TeV $ p\bar{p} $ Collisions | PRL 79 (1997) 2198 | |
| 7 | H. Davoudiasl, J. L. Hewett, and T. G. Rizzo | Phenomenology of the Randall-Sundrum Gauge Hierarchy Model | PRL 84 (2000) 2080 | hep-ph/9909255 |
| 8 | ATLAS Collaboration | Measurement of the forward-backward asymmetry of electron and muon pair-production in $ pp $ collisions at $ \sqrt{s} $ = 7 TeV with the ATLAS detector | JHEP 09 (2015) 049 | 1503.03709 |
| 9 | CMS Collaboration | Measurement of the weak mixing angle with the Drell-Yan process in proton-proton collisions at the LHC | PRD 84 (2011) 112002 | 1110.2682 |
| 10 | D0 Collaboration | Measurement of the Forward-Backward Charge Asymmetry and Extraction of $ \sin{}^{2}\theta{}_{W}^{\rm eff} $ in $ \rm{p\bar{p}}\rightarrow Z $/$ \gamma^{*} + X\rightarrow \rm{e^{+}e^{-}}+X $ Events Produced at $ \sqrt{s}=1.96 $ TeV | PRL 101 (2008) 191801 | 0804.3220 |
| 11 | CDF Collaboration | Indirect measurement of $ \sin^2\theta_{W} $ (or $ M_W $) using $ \rm e^{+}e^{-} $ pairs in the Z-boson region with $ \rm p\bar p $ collisions at a center-of-momentum energy of 1.96 TeV | PRD 88 (2013) 072002 | 1307.0770 |
| 12 | CDF Collaboration | Indirect measurement of $ \sin^2\theta_{W} $ (or $ M_W $) using $ \mu^+\mu^- $ pairs from $ \gamma^* $/Z bosons produced in $ \rm p\bar p $ collisions at a center-of-momentum energy of 1.96 TeV | PRD 89 (2014) 072005 | 1402.2239 |
| 13 | J. C. Collins and D. E. Soper | Angular Distribution of Dileptons in High-Energy Hadron Collisions | PRD 16 (1977) 2219 | |
| 14 | P. Fisher, U. Becker, and J. Kirkby | Very high precision tests of the electroweak theory | PLB 356 (1995) 404 | |
| 15 | M. Dittmar | Neutral current interference in the TeV region: The experimental sensitivity at the CERN LHC | PRD 55 (1997) 161 | hep-ex/9606002 |
| 16 | CMS Collaboration | Forward-backward asymmetry of Drell--Yan lepton pairs in pp collisions at $ \sqrt{s} = $ 7 TeV | PLB 718 (2013) 752 | |
| 17 | CMS Collaboration | The CMS experiment at the CERN LHC | JINST 3 (2008) S08004 | CMS-00-001 physics.ins-det/1206.4071 |
| 18 | CMS Collaboration | Performance of CMS muon reconstruction in pp collision events at $ \sqrt{s}=7 $ TeV | JINST 7 (2012) P10002 | physics.ins-det/1206.4071 |
| 19 | CMS Collaboration | Performance of electron reconstruction and selection with the CMS detector in proton-proton collisions at $ \sqrt{s}=8 $$ TeV $ | JINST 10 (2015) P06005 | physics.ins-det/1502.02701 |
| 20 | CMS HCAL Collaboration | Design, performance, and calibration of CMS forward calorimeter wedges | EPJC 53 (2008) 139 | |
| 21 | CMS Collaboration | The TriDAS Project: Technical Design Report, Volume 1: The Trigger System | CDS | |
| 22 | CMS Collaboration | The TriDAS Project: Technical Design Report, Volume 2: Data Acquisition and High-level Trigger | CDS | |
| 23 | P. Nason | A New Method for Combining NLO QCD with Shower Monte Carlo Algorithms | JHEP 11 (2004) 040 | hep-ph/0409146 |
| 24 | S. Frixione, P. Nason, and C. Oleari | Matching NLO QCD computations with Parton Shower simulations: the POWHEG method | JHEP 11 (2007) 070 | hep-ph/0709.2092 |
| 25 | S. Alioli, P. Nason, C. Oleari, and E. Re | NLO vector-boson production matched with shower in POWHEG | JHEP 07 (2008) 060 | hep-ph/0805.4802 |
| 26 | S. Alioli, P. Nason, C. Oleari, and E. Re | A general framework for implementing NLO calculations in shower Monte Carlo programs: the POWHEG BOX | JHEP 06 (2010) 043 | hep-ph/1002.2581 |
| 27 | H.-L. Lai et al. | New parton distributions for collider physics | PRD 82 (2010) 074024 | hep-ph/1007.2241 |
| 28 | T. Sj\"ostrand, S. Mrenna, and P. Skands | PYTHIA 6.4 Physics and Manual | JHEP 05 (2006) 026 | hep-ph/0603175 |
| 29 | CMS Collaboration | Study of the underlying event at forward rapidity in pp collisions at $ \sqrt{s}= $ 0.9, 2.76, and 7 TeV | JHEP 04 (2013) 072 | hep-ph/1302.2394 |
| 30 | J. Alwall et al. | MadGraph 5: going beyond | JHEP 06 (2011) 128 | 1106.0522 |
| 31 | N. Davidson et al. | Universal interface of TAUOLA technical and physics documentation | CPC 183 (2012) 821 | hep-ph/1002.0543 |
| 32 | GEANT4 Collaboration | GEANT4---a simulation toolkit | NIMA 506 (2003) 250 | |
| 33 | J. Allison et al. | GEANT4 developments and applications | IEEE Trans. Nucl. Sci. 53 (2006) 270 | |
| 34 | CMS Collaboration, D. W. Jang | Parameterized Simulation of the CMS Calorimeter using GFlash | in Nuclear Science Symposium Conference record (NSS/MIC), 2009 IEEE, p. 2074 Orlando, FL | |
| 35 | CMS Collaboration | Measurement of the rapidity and transverse momentum distributions of Z bosons in pp collisions at $ \sqrt{s} $ = 7 TeV | PRD 85 (2013) 032002 | 1110.4973 |
| 36 | CMS Collaboration | Particle-Flow Event Reconstruction in CMS and Performance for Jets, Taus, and $ E^{miss}_{\rm T} $ | CDS | |
| 37 | CMS Collaboration | Commissioning of the Particle-flow Event Reconstruction with the first LHC collisions recorded in the CMS detector | CDS | |
| 38 | CMS Collaboration | Measurement of the Inclusive $ W $ and $ Z $ Production Cross Sections in pp Collisions at $ \sqrt{s}=7 $ TeV | JHEP 10 (2011) 132 | 1107.4789 |
| 39 | A. Bodek et al. | Extracting muon momentum scale corrections for hadron collider experiments | EPJC 72 (2012) 10 | 1208.3710 |
| 40 | Y. Li and F. Petriello | Combining QCD and electroweak corrections to dilepton production in the framework of the FEWZ simulation code | PRD 86 (2012) 094034 | hep-ph/1208.5967 |
| 41 | G. D'Agostini | A Multidimensional unfolding method based on Bayes' theorem | NIMA 362 (1995) 487 | |
| 42 | T. Adye | Unfolding algorithms and tests using RooUnfold | Proceedings of the PHYSTAT 2011 Workshop on Statistical Issues Related to Discovery Claims in Search Experiments and Unfolding (Jan., 2011) 313 | physics.data-an/1105.1160 |
| 43 | P. M. Nadolsky et al. | Implications of CTEQ global analysis for collider observables | PRD 78 (2008) 013004 | 0802.0007 |
| 44 | NNPDF Collaboration | A first unbiased global NLO determination of parton distributions and their uncertainties | Nucl. Phys. B 838 (2010) 136 | 1002.4407 |
| 45 | CMS Collaboration | Measurements of Inclusive $ W $ and $ Z $ Cross Sections in pp Collisions at $ \sqrt{s}=7 $ TeV | JHEP 01 (2011) 080 | 1012.2466 |
|
|
Compact Muon Solenoid LHC, CERN |
|

|

|

|

|

|