

Compact Muon Solenoid
LHC, CERN
| CMS-SMP-14-016 ; CERN-PH-EP-2015-122 | ||
| Measurement of the WW cross section in pp collisions at $\sqrt{s} =$ 8 TeV and limits on anomalous gauge couplings | ||
| CMS Collaboration | ||
| 13 July 2015 | ||
| Eur. Phys. J. C 76 (2016) 401 | ||
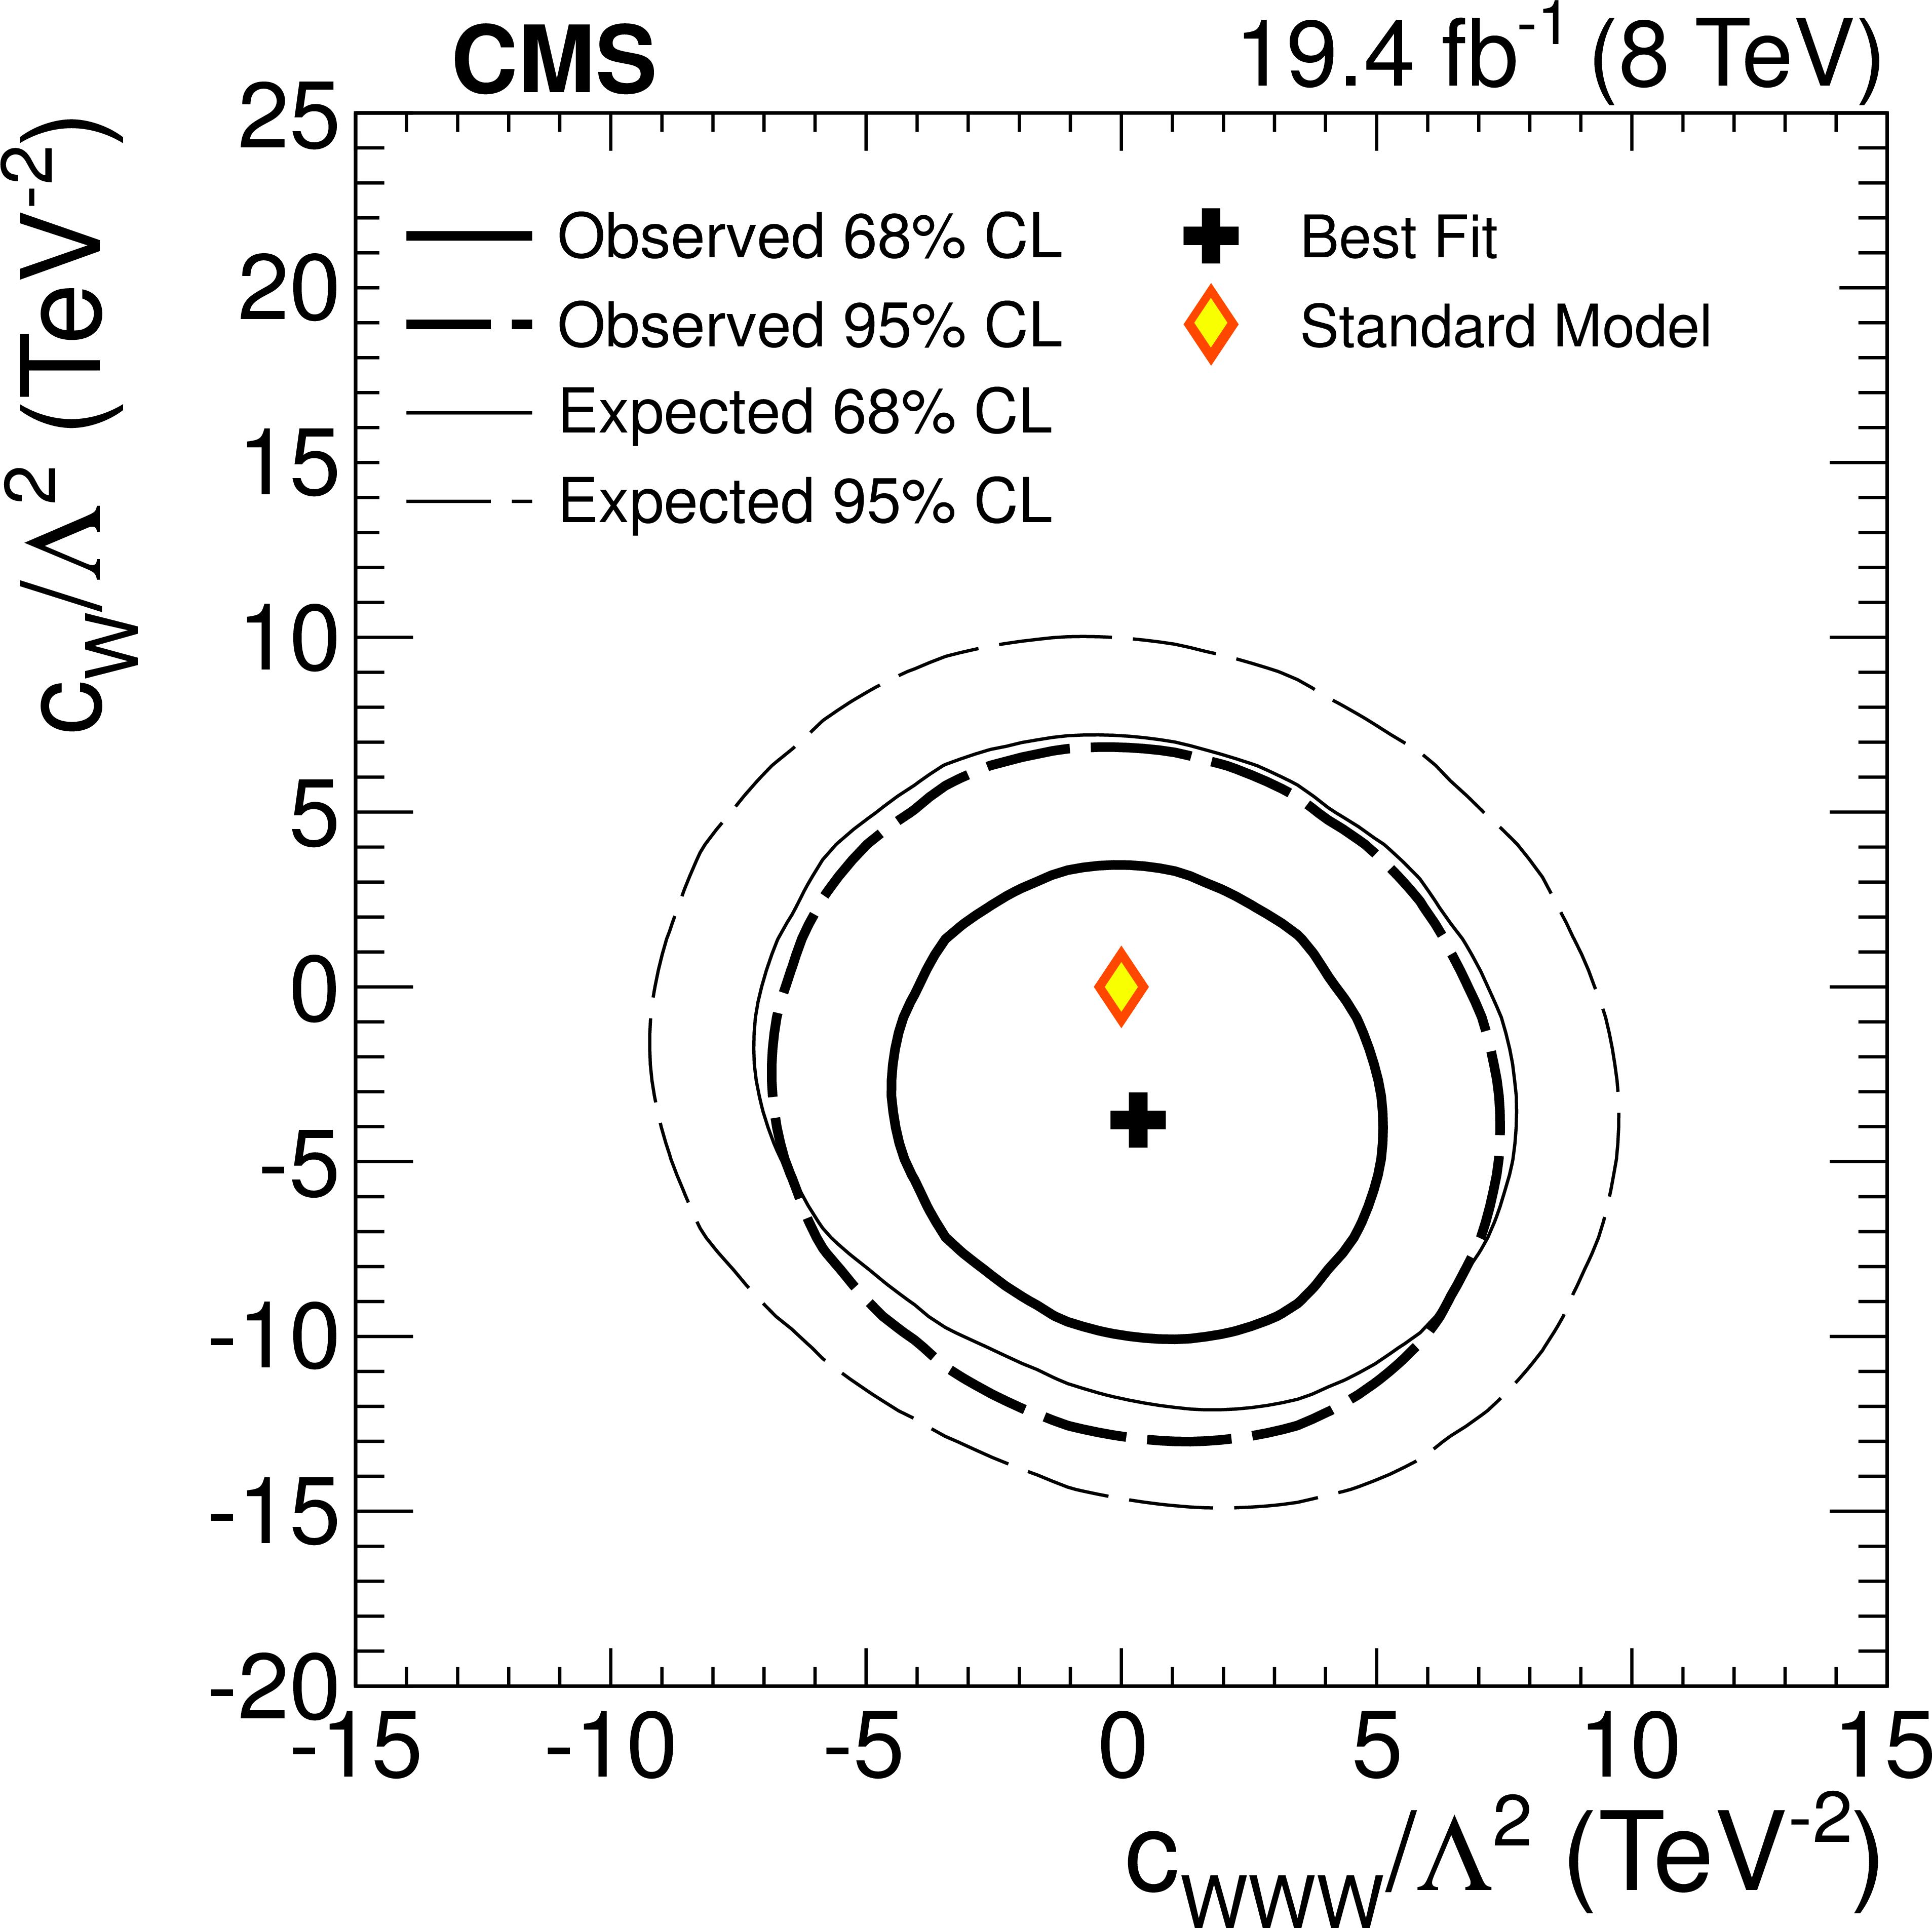
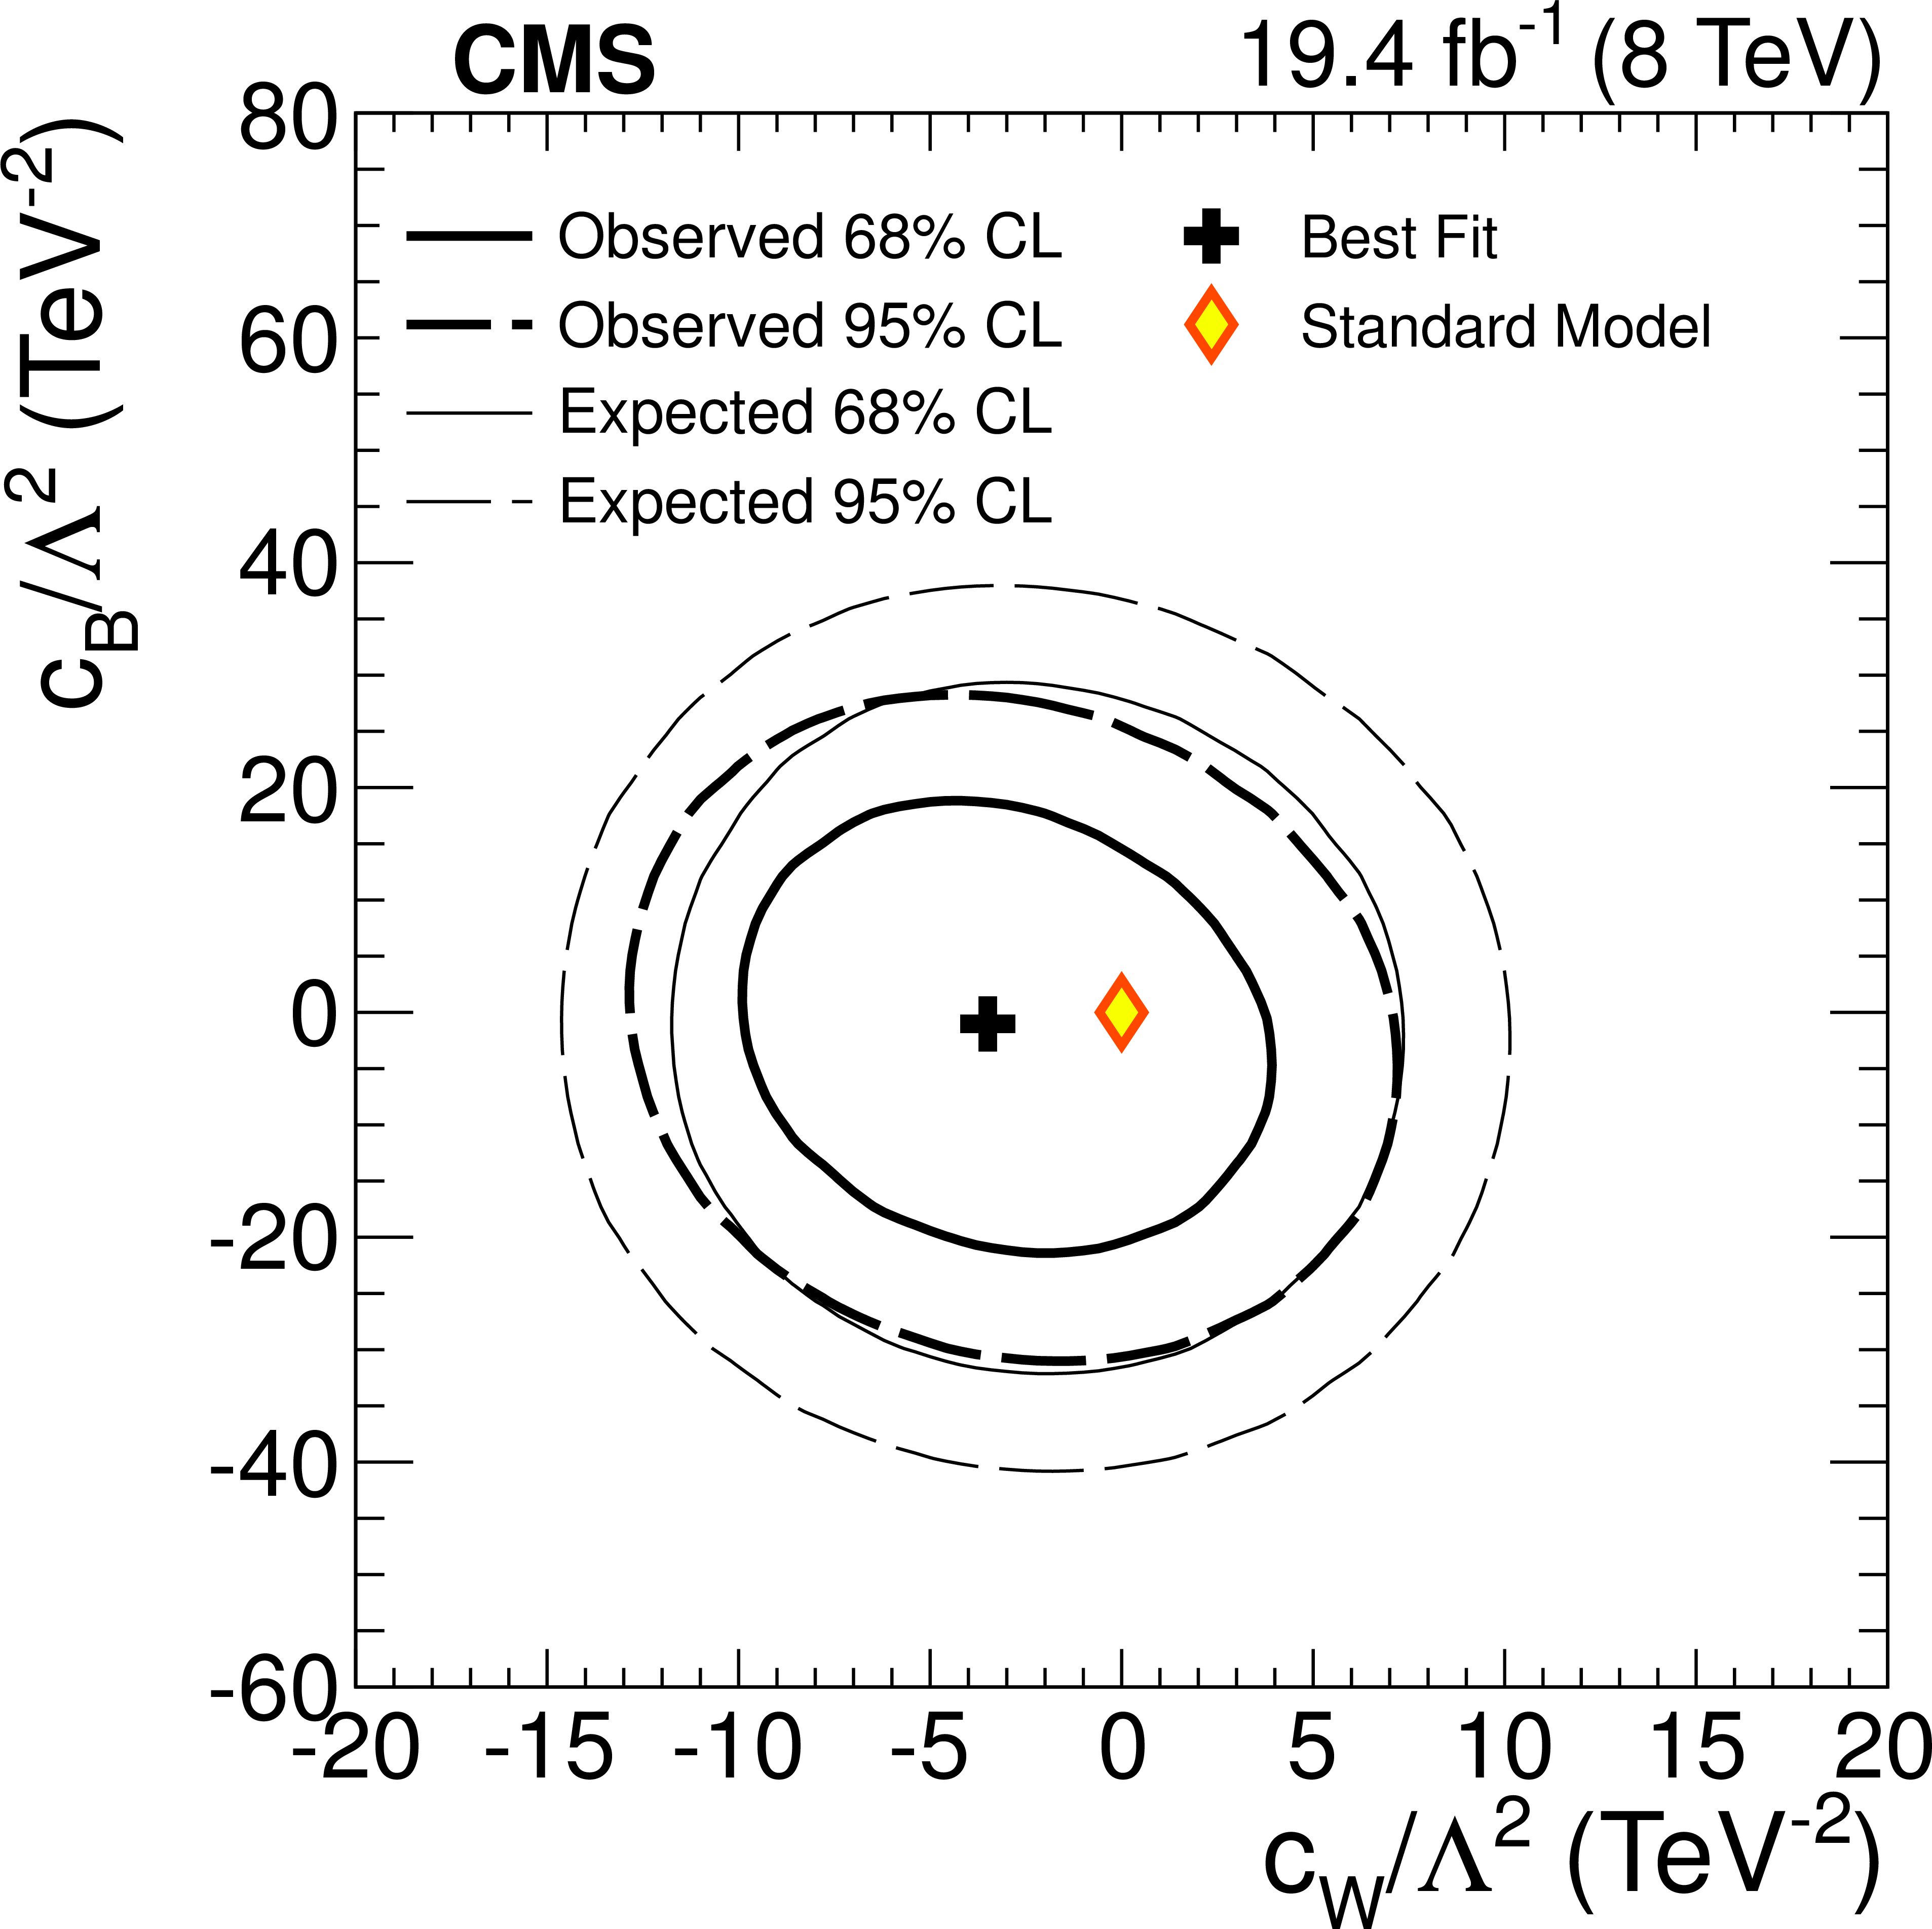
| Abstract: A measurement of the W boson pair production cross section in proton-proton collisions at $\sqrt{s} =$ 8 TeV is presented. The data collected with the CMS detector at the LHC correspond to an integrated luminosity of 19.4 fb$^{-1}$. The $\mathrm{W}^+ \mathrm{W}^-$ candidates are selected from events with two charged leptons, electrons or muons, and large missing transverse energy. The measured $\mathrm{W}^+ \mathrm{W}^-$ cross section is 60.1 $\pm$ 0.9 (stat) $\pm$ 3.2 (exp) $\pm$ 3.1 (theo) $\pm$ 1.6 (lumi) pb = 60.1 $\pm$ 4.8 pb, consistent with the standard model prediction.The $\mathrm{W}^+ \mathrm{W}^-$ cross sections are also measured in two different fiducial phase space regions. The normalized differential cross section is measured as a function of kinematic variables of the final-state charged leptons and compared with several perturbative QCD predictions. Limits on anomalous gauge couplings associated with dimension-six operators are also given in the framework of an effective field theory. The corresponding 95% confidence level intervals are $-5.7 < c_{\mathrm{WWW}}/\Lambda^2 < 5.9$ TeV$^{-2}$, $-11.4 < c_{\mathrm{W}}/\Lambda^2 < 5.4$ TeV$^{-2}$, $-29.2 < c_{\mathrm{B}}/\Lambda^2 < 23.9$ TeV$^{-2}$, in the HISZ basis. | ||
| Links: e-print arXiv:1507.03268 [hep-ex] (PDF) ; CDS record ; inSPIRE record ; HepData record ; CADI line (restricted) ; | ||
| Figures | |

png pdf |
Figure 1-a:
The data and MC distributions for the zero-jet category of the leading lepton $ {p_{\mathrm {T}}} $ ($p_{{\mathrm {T}},\text { max}}^{\ell }$), the $ {p_{\mathrm {T}}} $ of the dilepton system ($ {p_{\mathrm {T}}} ^{\ell \ell }$), the dilepton invariant mass ($m_{\ell \ell }$) and the azimuthal angle between the two leptons ($\Delta \phi _{\ell \ell }$). The hatched areas represent the total systematic uncertainty in each bin. The error bars in the ratio plots are calculated considering the statistical uncertainty from the data sample and the systematic uncertainties in the background estimation and signal efficiencies. The last bin includes the overflow. |
png pdf |
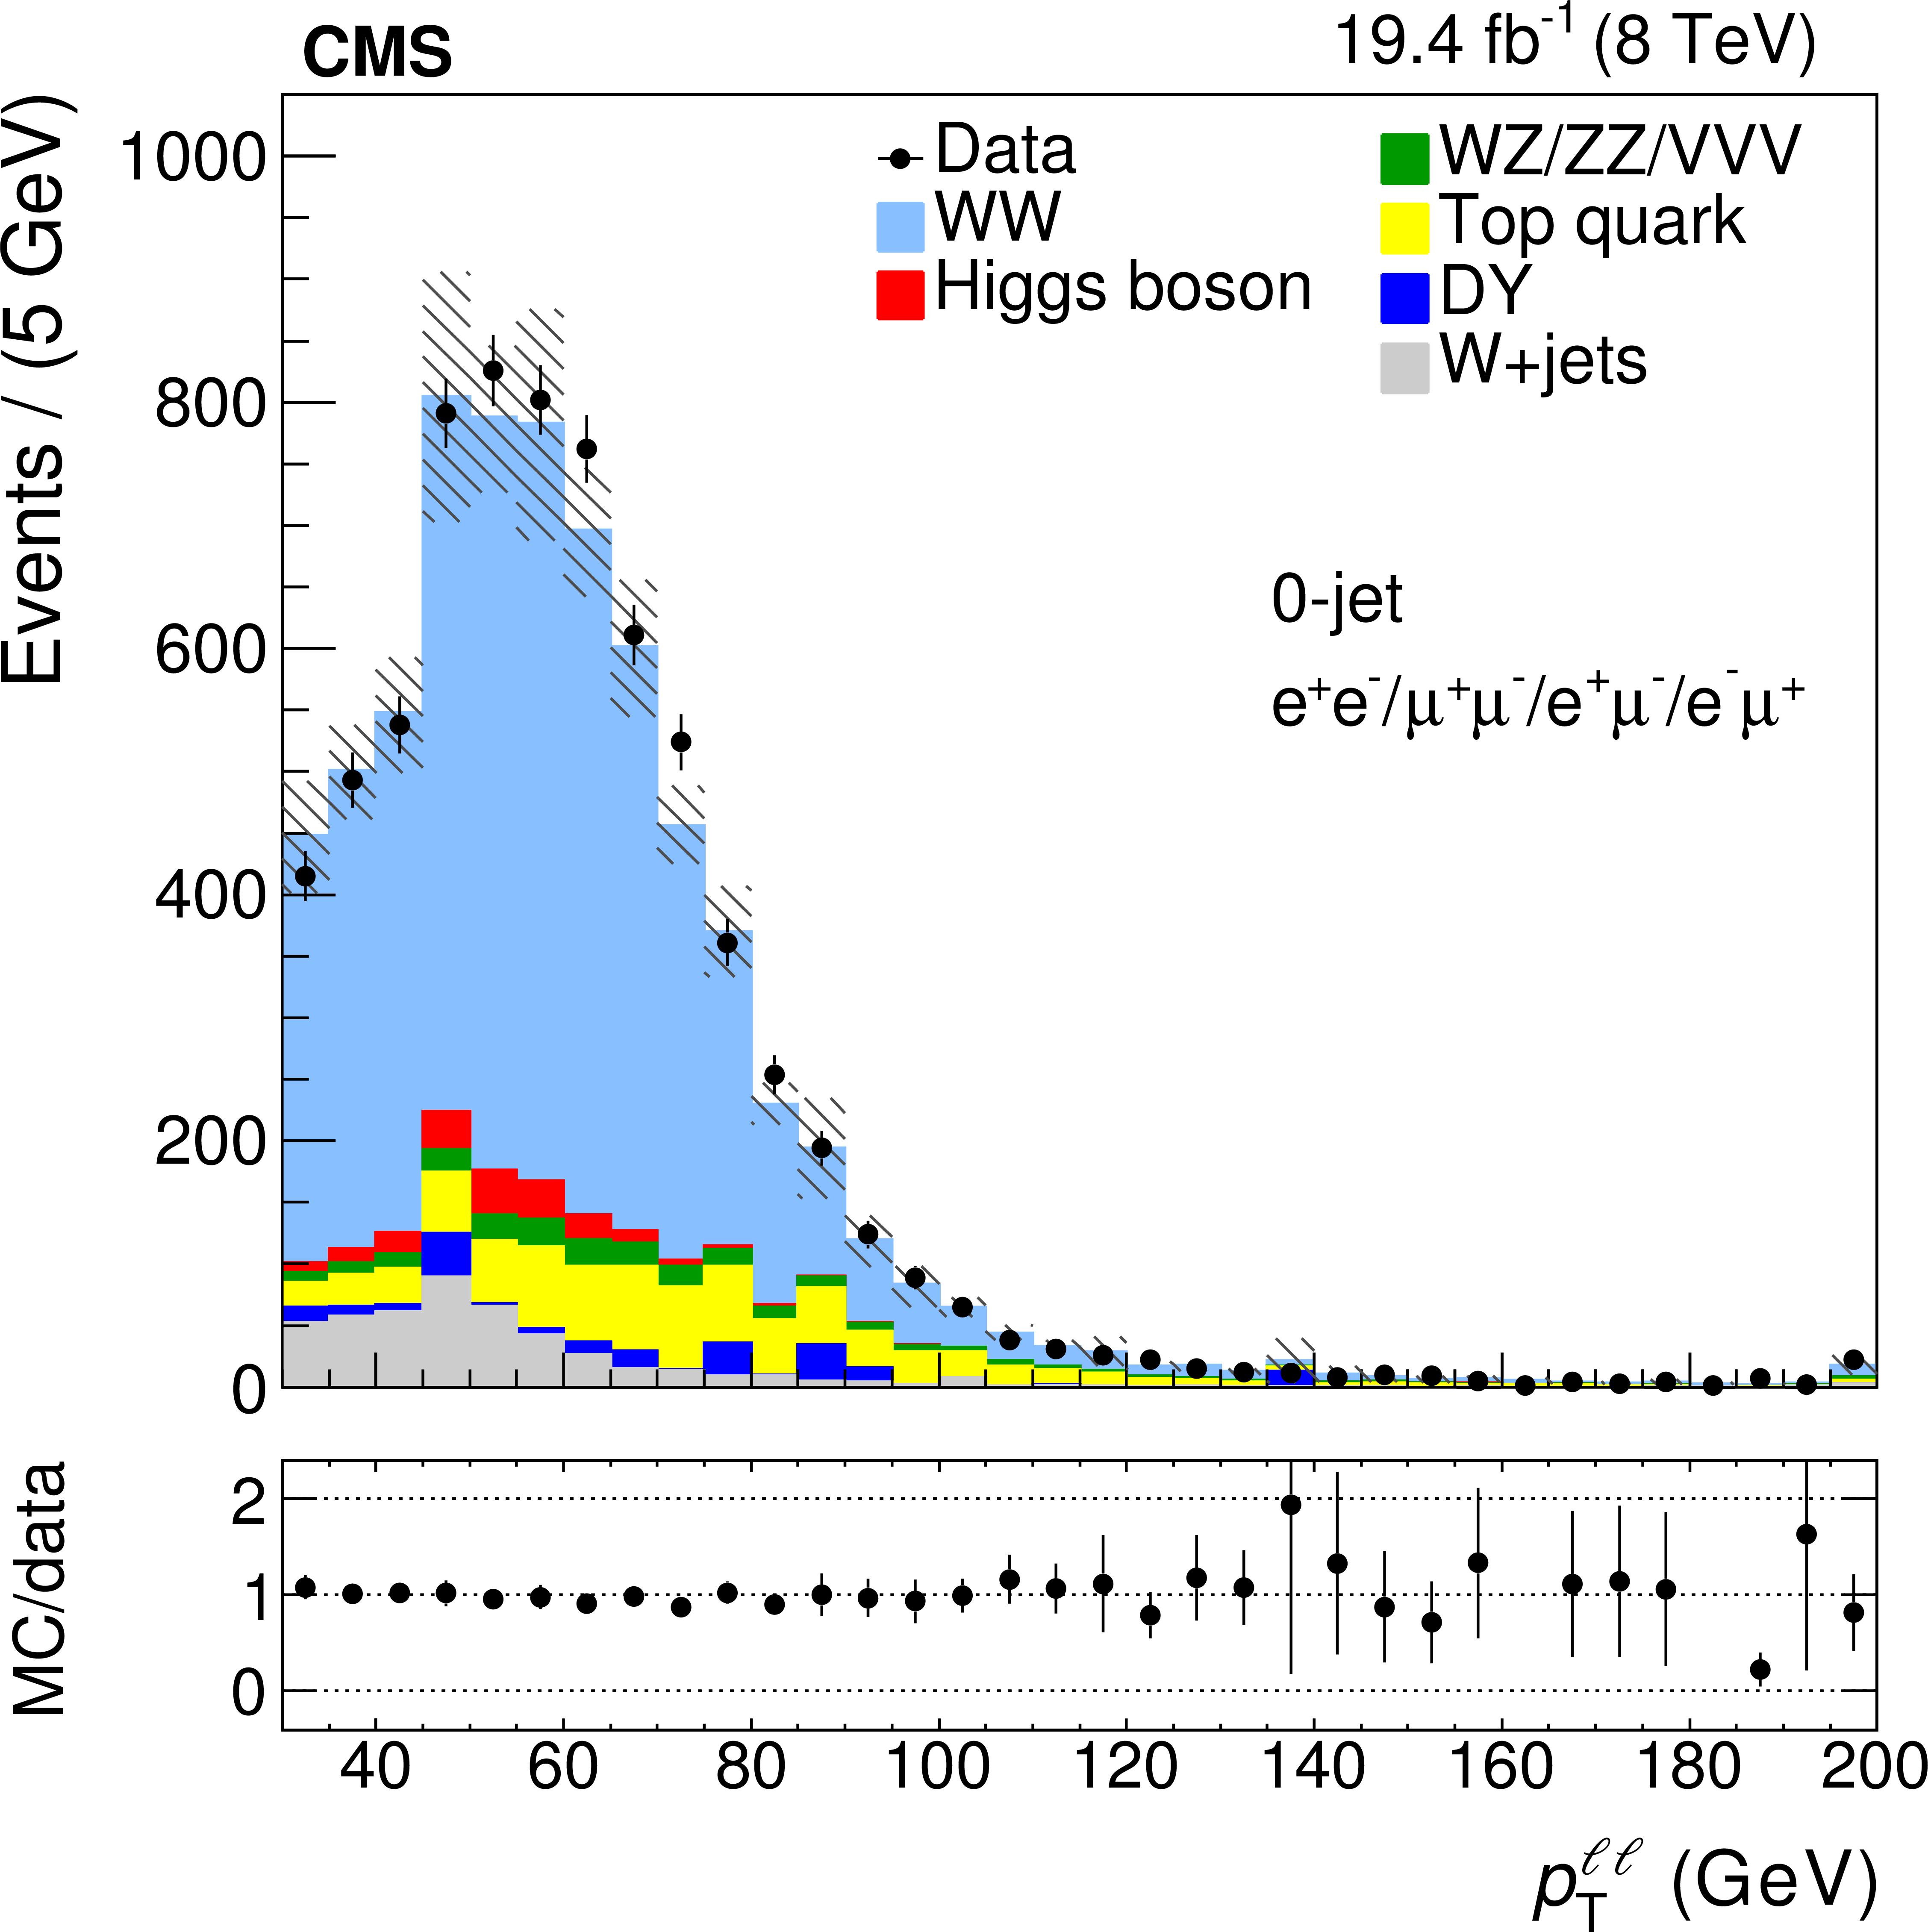
Figure 1-b:
The data and MC distributions for the zero-jet category of the leading lepton $ {p_{\mathrm {T}}} $ ($p_{{\mathrm {T}},\text { max}}^{\ell }$), the $ {p_{\mathrm {T}}} $ of the dilepton system ($ {p_{\mathrm {T}}} ^{\ell \ell }$), the dilepton invariant mass ($m_{\ell \ell }$) and the azimuthal angle between the two leptons ($\Delta \phi _{\ell \ell }$). The hatched areas represent the total systematic uncertainty in each bin. The error bars in the ratio plots are calculated considering the statistical uncertainty from the data sample and the systematic uncertainties in the background estimation and signal efficiencies. The last bin includes the overflow. |
png pdf |
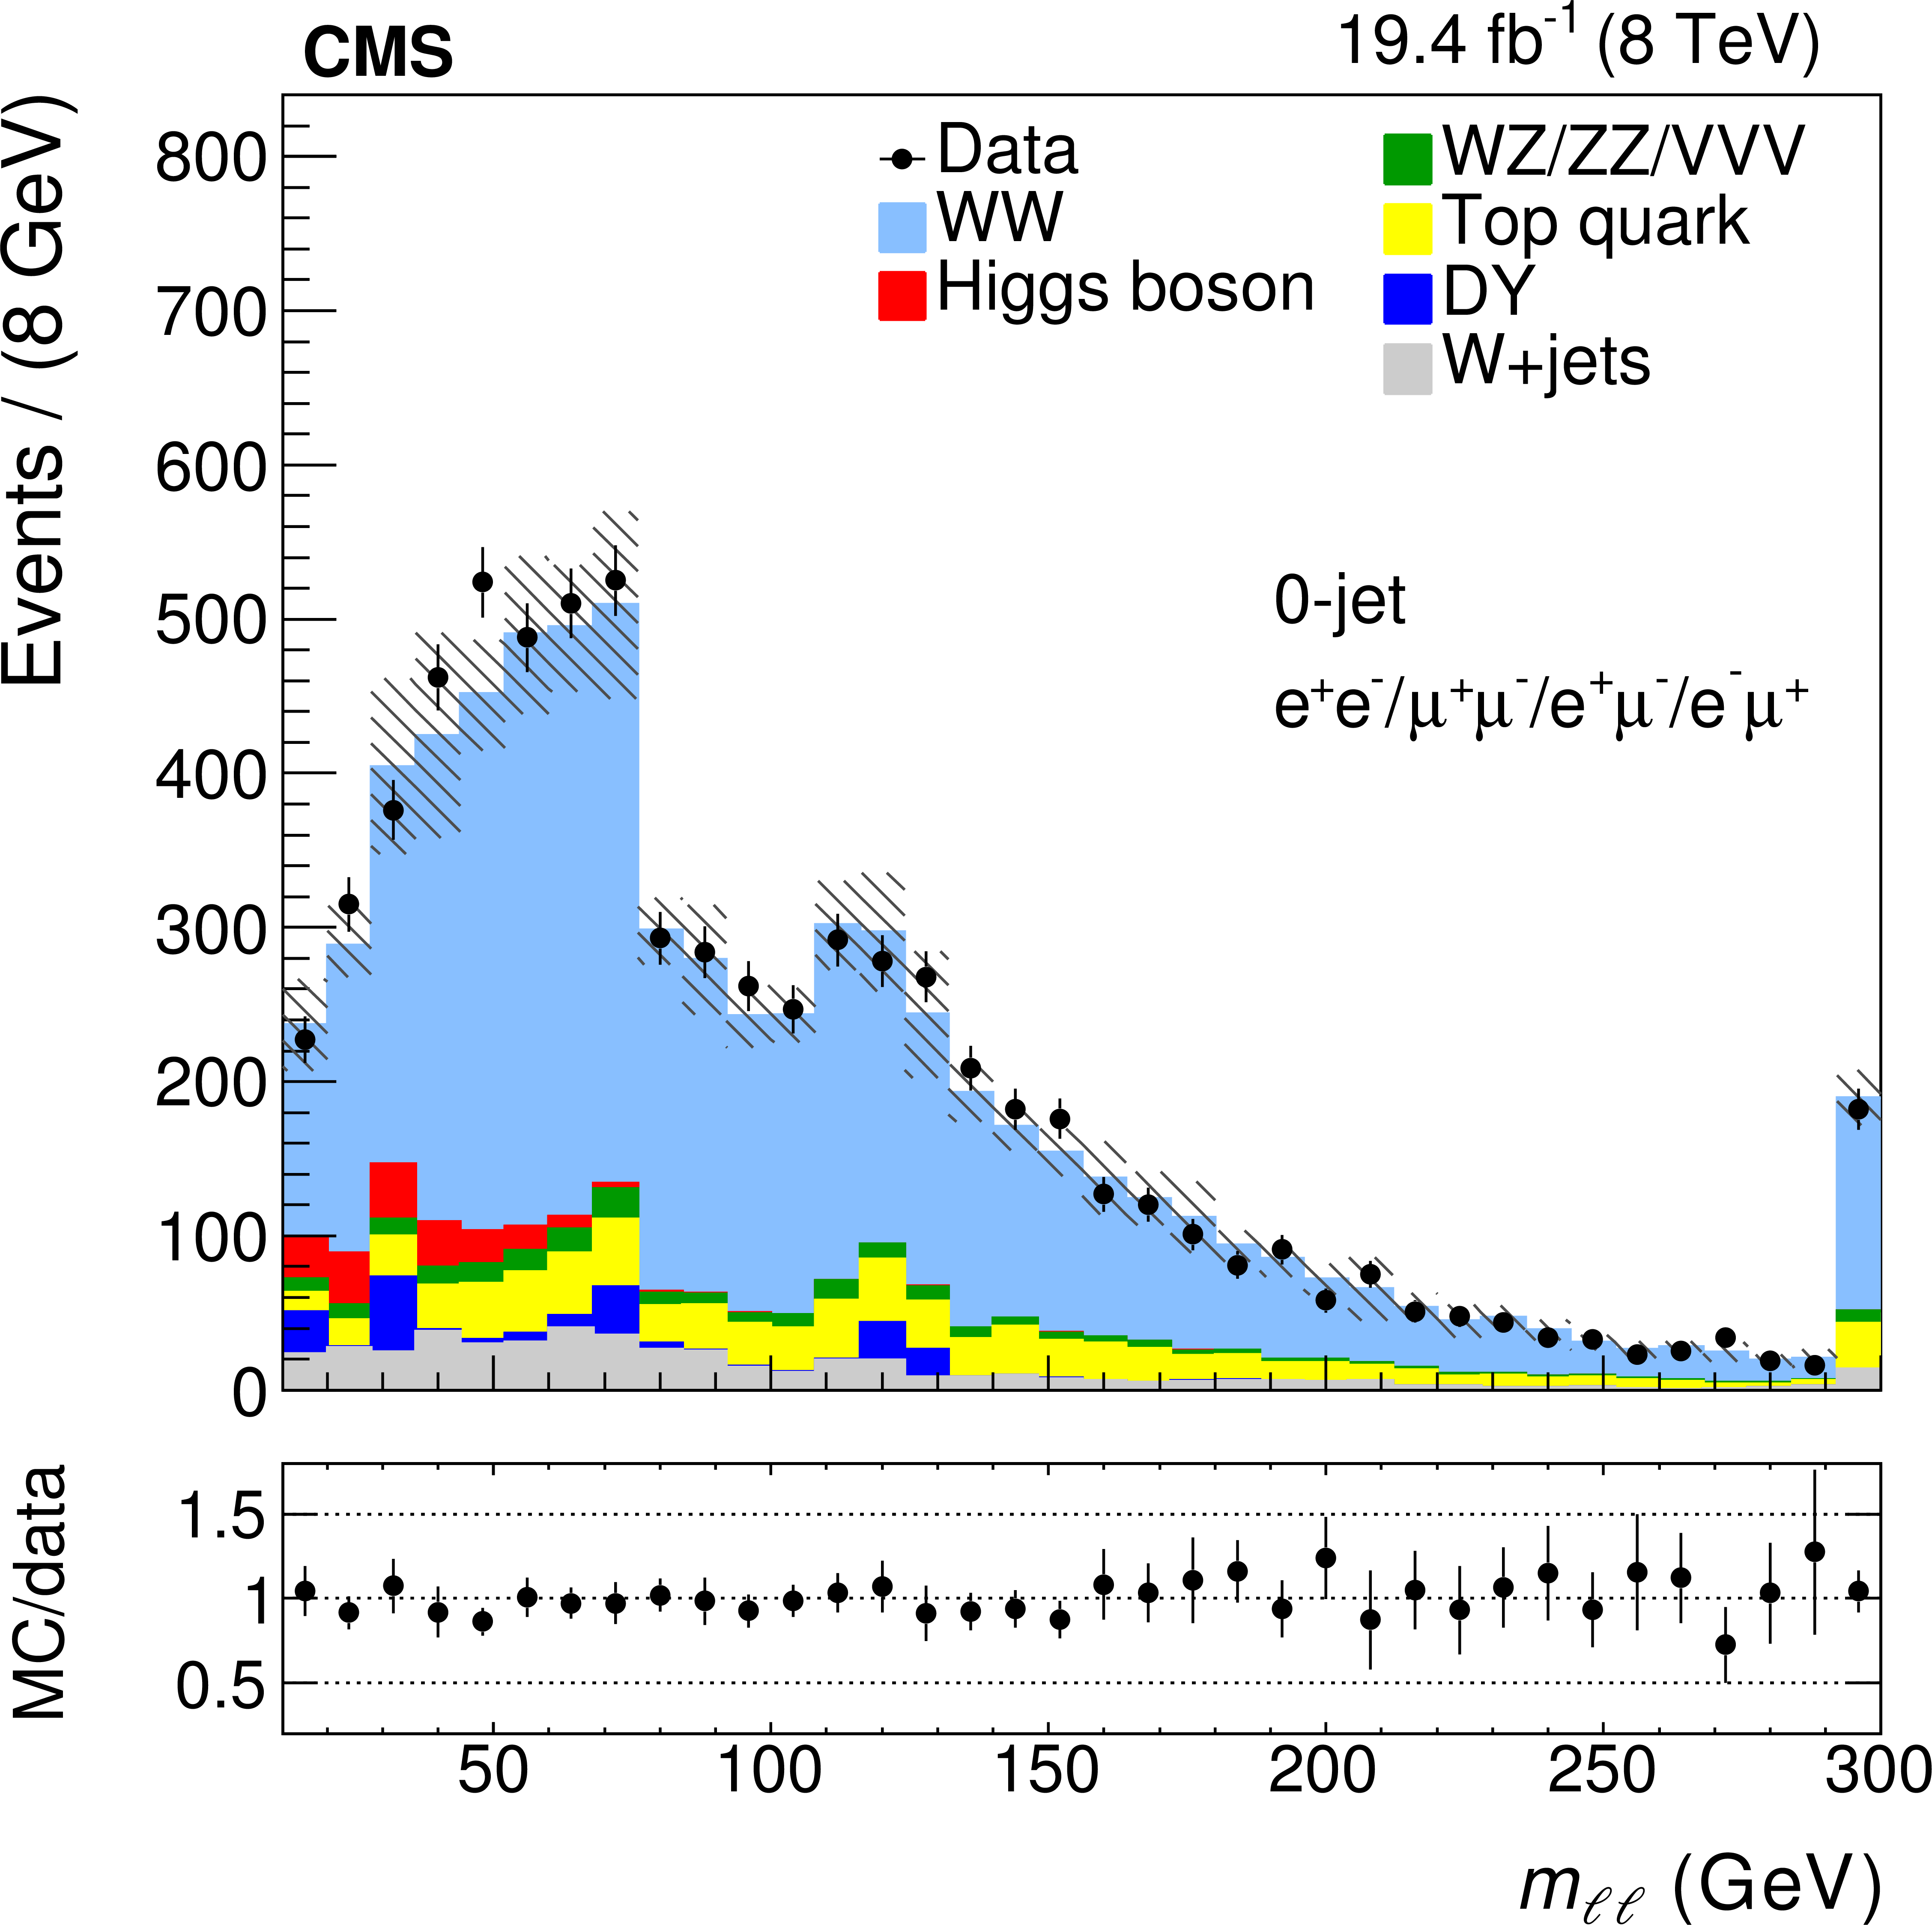
Figure 1-c:
The data and MC distributions for the zero-jet category of the leading lepton $ {p_{\mathrm {T}}} $ ($p_{{\mathrm {T}},\text { max}}^{\ell }$), the $ {p_{\mathrm {T}}} $ of the dilepton system ($ {p_{\mathrm {T}}} ^{\ell \ell }$), the dilepton invariant mass ($m_{\ell \ell }$) and the azimuthal angle between the two leptons ($\Delta \phi _{\ell \ell }$). The hatched areas represent the total systematic uncertainty in each bin. The error bars in the ratio plots are calculated considering the statistical uncertainty from the data sample and the systematic uncertainties in the background estimation and signal efficiencies. The last bin includes the overflow. |
png pdf |
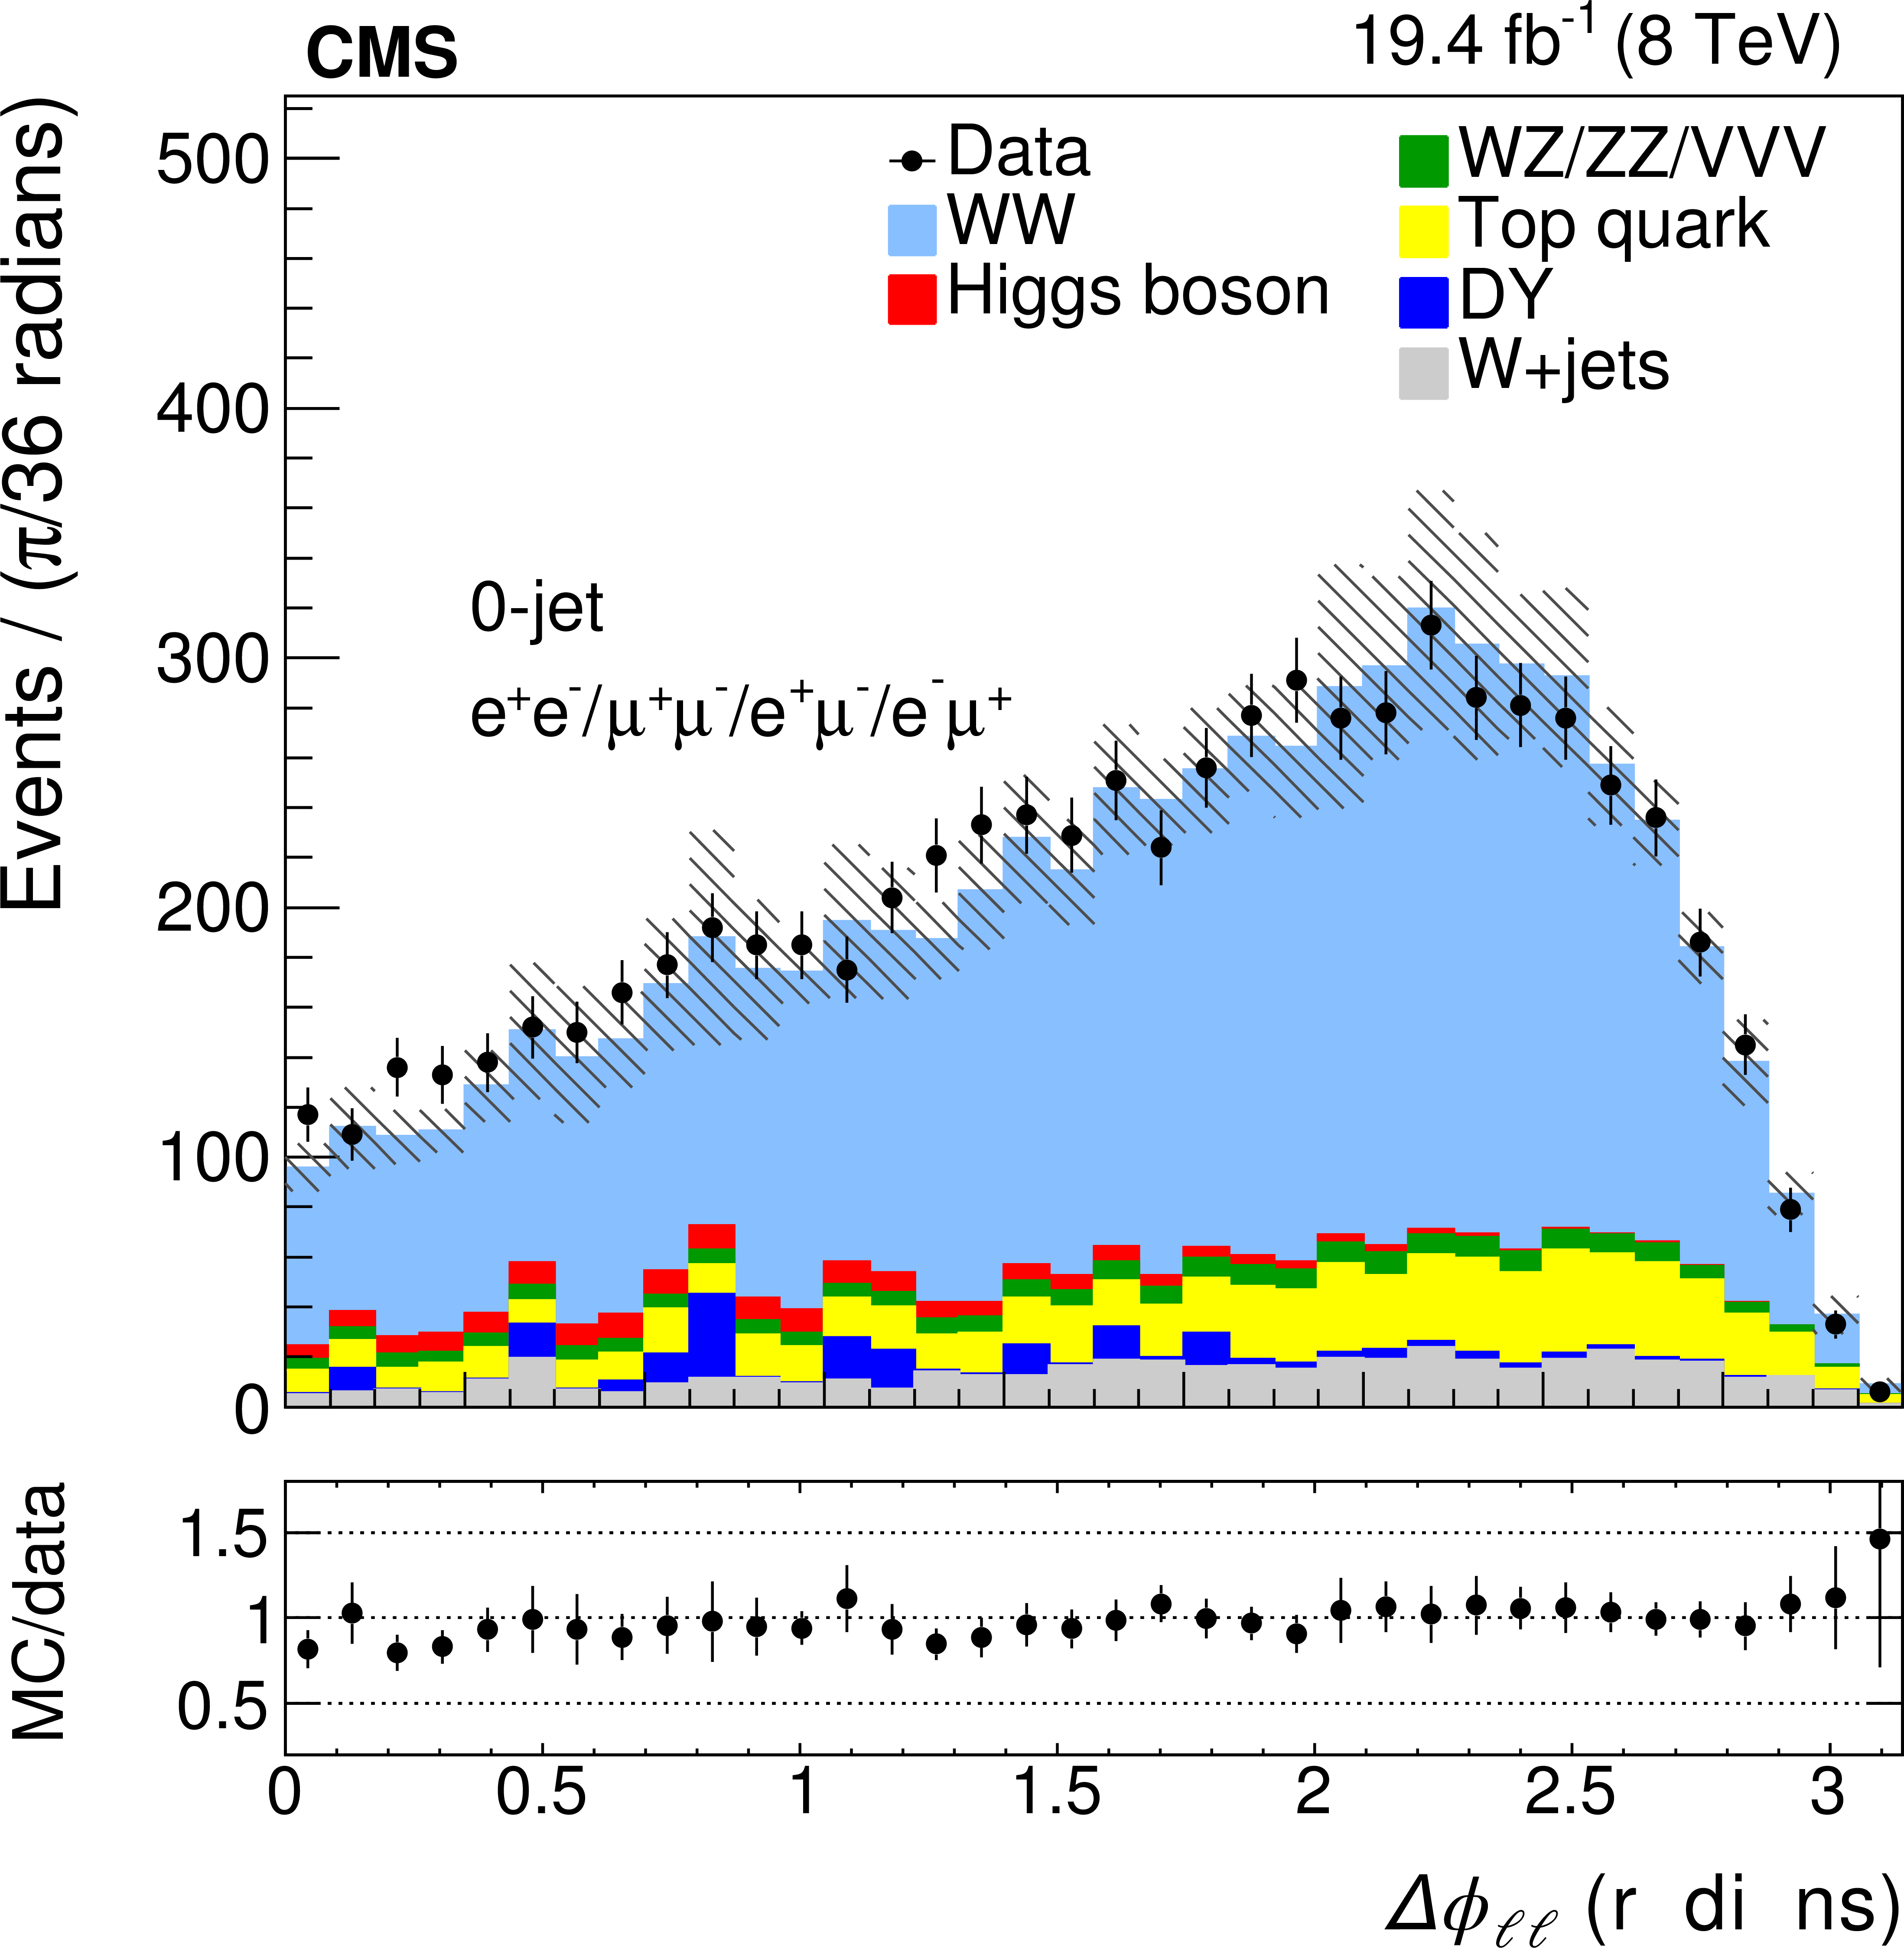
Figure 1-d:
The data and MC distributions for the zero-jet category of the leading lepton $ {p_{\mathrm {T}}} $ ($p_{{\mathrm {T}},\text { max}}^{\ell }$), the $ {p_{\mathrm {T}}} $ of the dilepton system ($ {p_{\mathrm {T}}} ^{\ell \ell }$), the dilepton invariant mass ($m_{\ell \ell }$) and the azimuthal angle between the two leptons ($\Delta \phi _{\ell \ell }$). The hatched areas represent the total systematic uncertainty in each bin. The error bars in the ratio plots are calculated considering the statistical uncertainty from the data sample and the systematic uncertainties in the background estimation and signal efficiencies. The last bin includes the overflow. |

png pdf |
Figure 2-a:
The data and MC distributions for the one-jet category of the leading lepton $ {p_{\mathrm {T}}} $ ($p_{{\rm {T}},\text { max}}^{\ell }$), the $ {p_{\mathrm {T}}} $ of the dilepton system ($ {p_{\mathrm {T}}} ^{\ell \ell }$), the dilepton invariant mass ($m_{\ell \ell }$) and the azimuthal angle between the two leptons ($\Delta \phi _{\ell \ell }$). The hatched areas represent the total systematic uncertainty in each bin. The error bars in the ratio plots are calculated considering the statistical uncertainty from the data sample and the systematic uncertainties in the background estimation and signal efficiency. The last bin includes the overflow. |

png pdf |
Figure 2-b:
The data and MC distributions for the one-jet category of the leading lepton $ {p_{\mathrm {T}}} $ ($p_{{\rm {T}},\text { max}}^{\ell }$), the $ {p_{\mathrm {T}}} $ of the dilepton system ($ {p_{\mathrm {T}}} ^{\ell \ell }$), the dilepton invariant mass ($m_{\ell \ell }$) and the azimuthal angle between the two leptons ($\Delta \phi _{\ell \ell }$). The hatched areas represent the total systematic uncertainty in each bin. The error bars in the ratio plots are calculated considering the statistical uncertainty from the data sample and the systematic uncertainties in the background estimation and signal efficiency. The last bin includes the overflow. |

png pdf |
Figure 2-c:
The data and MC distributions for the one-jet category of the leading lepton $ {p_{\mathrm {T}}} $ ($p_{{\rm {T}},\text { max}}^{\ell }$), the $ {p_{\mathrm {T}}} $ of the dilepton system ($ {p_{\mathrm {T}}} ^{\ell \ell }$), the dilepton invariant mass ($m_{\ell \ell }$) and the azimuthal angle between the two leptons ($\Delta \phi _{\ell \ell }$). The hatched areas represent the total systematic uncertainty in each bin. The error bars in the ratio plots are calculated considering the statistical uncertainty from the data sample and the systematic uncertainties in the background estimation and signal efficiency. The last bin includes the overflow. |

png pdf |
Figure 2-d:
The data and MC distributions for the one-jet category of the leading lepton $ {p_{\mathrm {T}}} $ ($p_{{\rm {T}},\text { max}}^{\ell }$), the $ {p_{\mathrm {T}}} $ of the dilepton system ($ {p_{\mathrm {T}}} ^{\ell \ell }$), the dilepton invariant mass ($m_{\ell \ell }$) and the azimuthal angle between the two leptons ($\Delta \phi _{\ell \ell }$). The hatched areas represent the total systematic uncertainty in each bin. The error bars in the ratio plots are calculated considering the statistical uncertainty from the data sample and the systematic uncertainties in the background estimation and signal efficiency. The last bin includes the overflow. |

png pdf |
Figure 3-a:
Normalized differential $ { {\mathrm {W^+}} {\mathrm {W^-}}} $ cross section as a function of the leading lepton $ {p_{\mathrm {T}}} $ ($p_{{\mathrm {T}},\text { max}}^{\ell }$) (a), the transverse momentum of the dilepton system ($ {p_{\mathrm {T}}} ^{\ell \ell }$) (b), the invariant mass ($ {m_{\ell \ell }} $) (c) and the angular separation between leptons ($\Delta \phi _{\ell \ell }$) (d). Both statistical and systematic uncertainties are included. The hatched area in the ratio plots corresponds to the relative error of the data in each bin. The measurement, including $ {\mathrm {g}} {\mathrm {g}} \to {\mathrm {W^+}} {\mathrm {W^-}}$ is compared to predictions from MADGRAPH, POWHEG, and MC@NLO. |
png pdf |
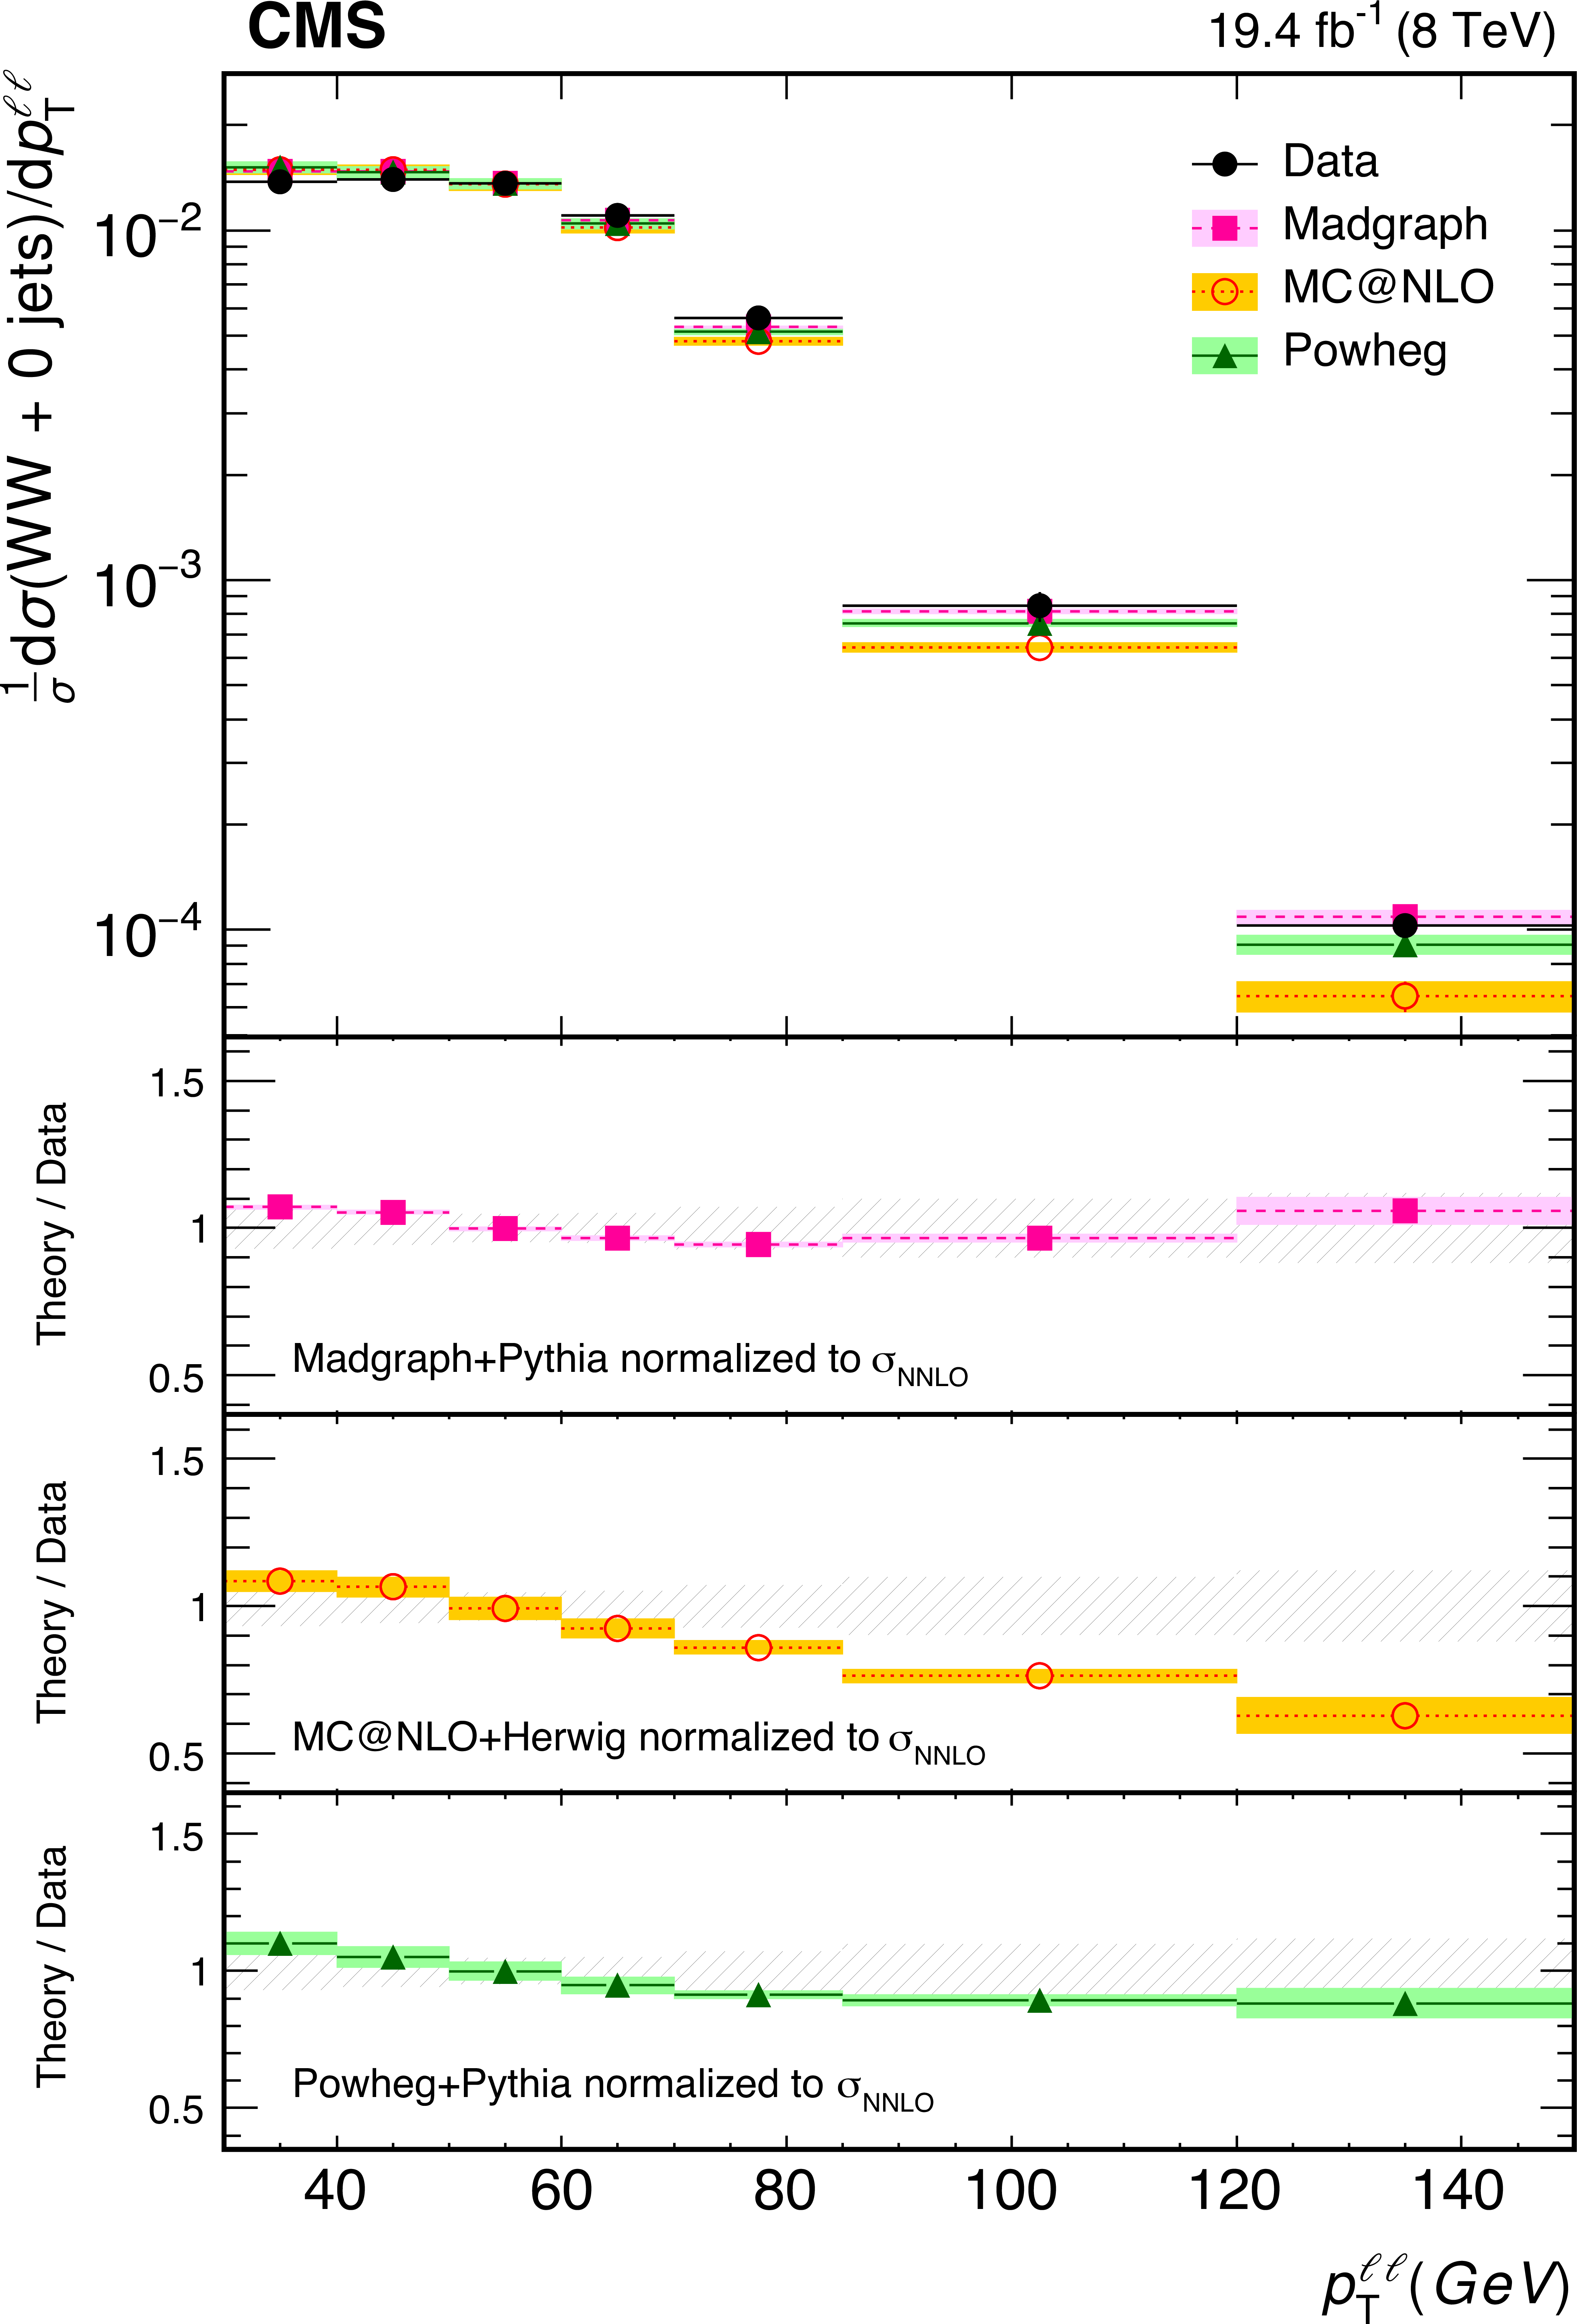
Figure 3-b:
Normalized differential $ { {\mathrm {W^+}} {\mathrm {W^-}}} $ cross section as a function of the leading lepton $ {p_{\mathrm {T}}} $ ($p_{{\mathrm {T}},\text { max}}^{\ell }$) (a), the transverse momentum of the dilepton system ($ {p_{\mathrm {T}}} ^{\ell \ell }$) (b), the invariant mass ($ {m_{\ell \ell }} $) (c) and the angular separation between leptons ($\Delta \phi _{\ell \ell }$) (d). Both statistical and systematic uncertainties are included. The hatched area in the ratio plots corresponds to the relative error of the data in each bin. The measurement, including $ {\mathrm {g}} {\mathrm {g}} \to {\mathrm {W^+}} {\mathrm {W^-}}$ is compared to predictions from MADGRAPH, POWHEG, and MC@NLO. |

png pdf |
Figure 3-c:
Normalized differential $ { {\mathrm {W^+}} {\mathrm {W^-}}} $ cross section as a function of the leading lepton $ {p_{\mathrm {T}}} $ ($p_{{\mathrm {T}},\text { max}}^{\ell }$) (a), the transverse momentum of the dilepton system ($ {p_{\mathrm {T}}} ^{\ell \ell }$) (b), the invariant mass ($ {m_{\ell \ell }} $) (c) and the angular separation between leptons ($\Delta \phi _{\ell \ell }$) (d). Both statistical and systematic uncertainties are included. The hatched area in the ratio plots corresponds to the relative error of the data in each bin. The measurement, including $ {\mathrm {g}} {\mathrm {g}} \to {\mathrm {W^+}} {\mathrm {W^-}}$ is compared to predictions from MADGRAPH, POWHEG, and MC@NLO. |
png pdf |
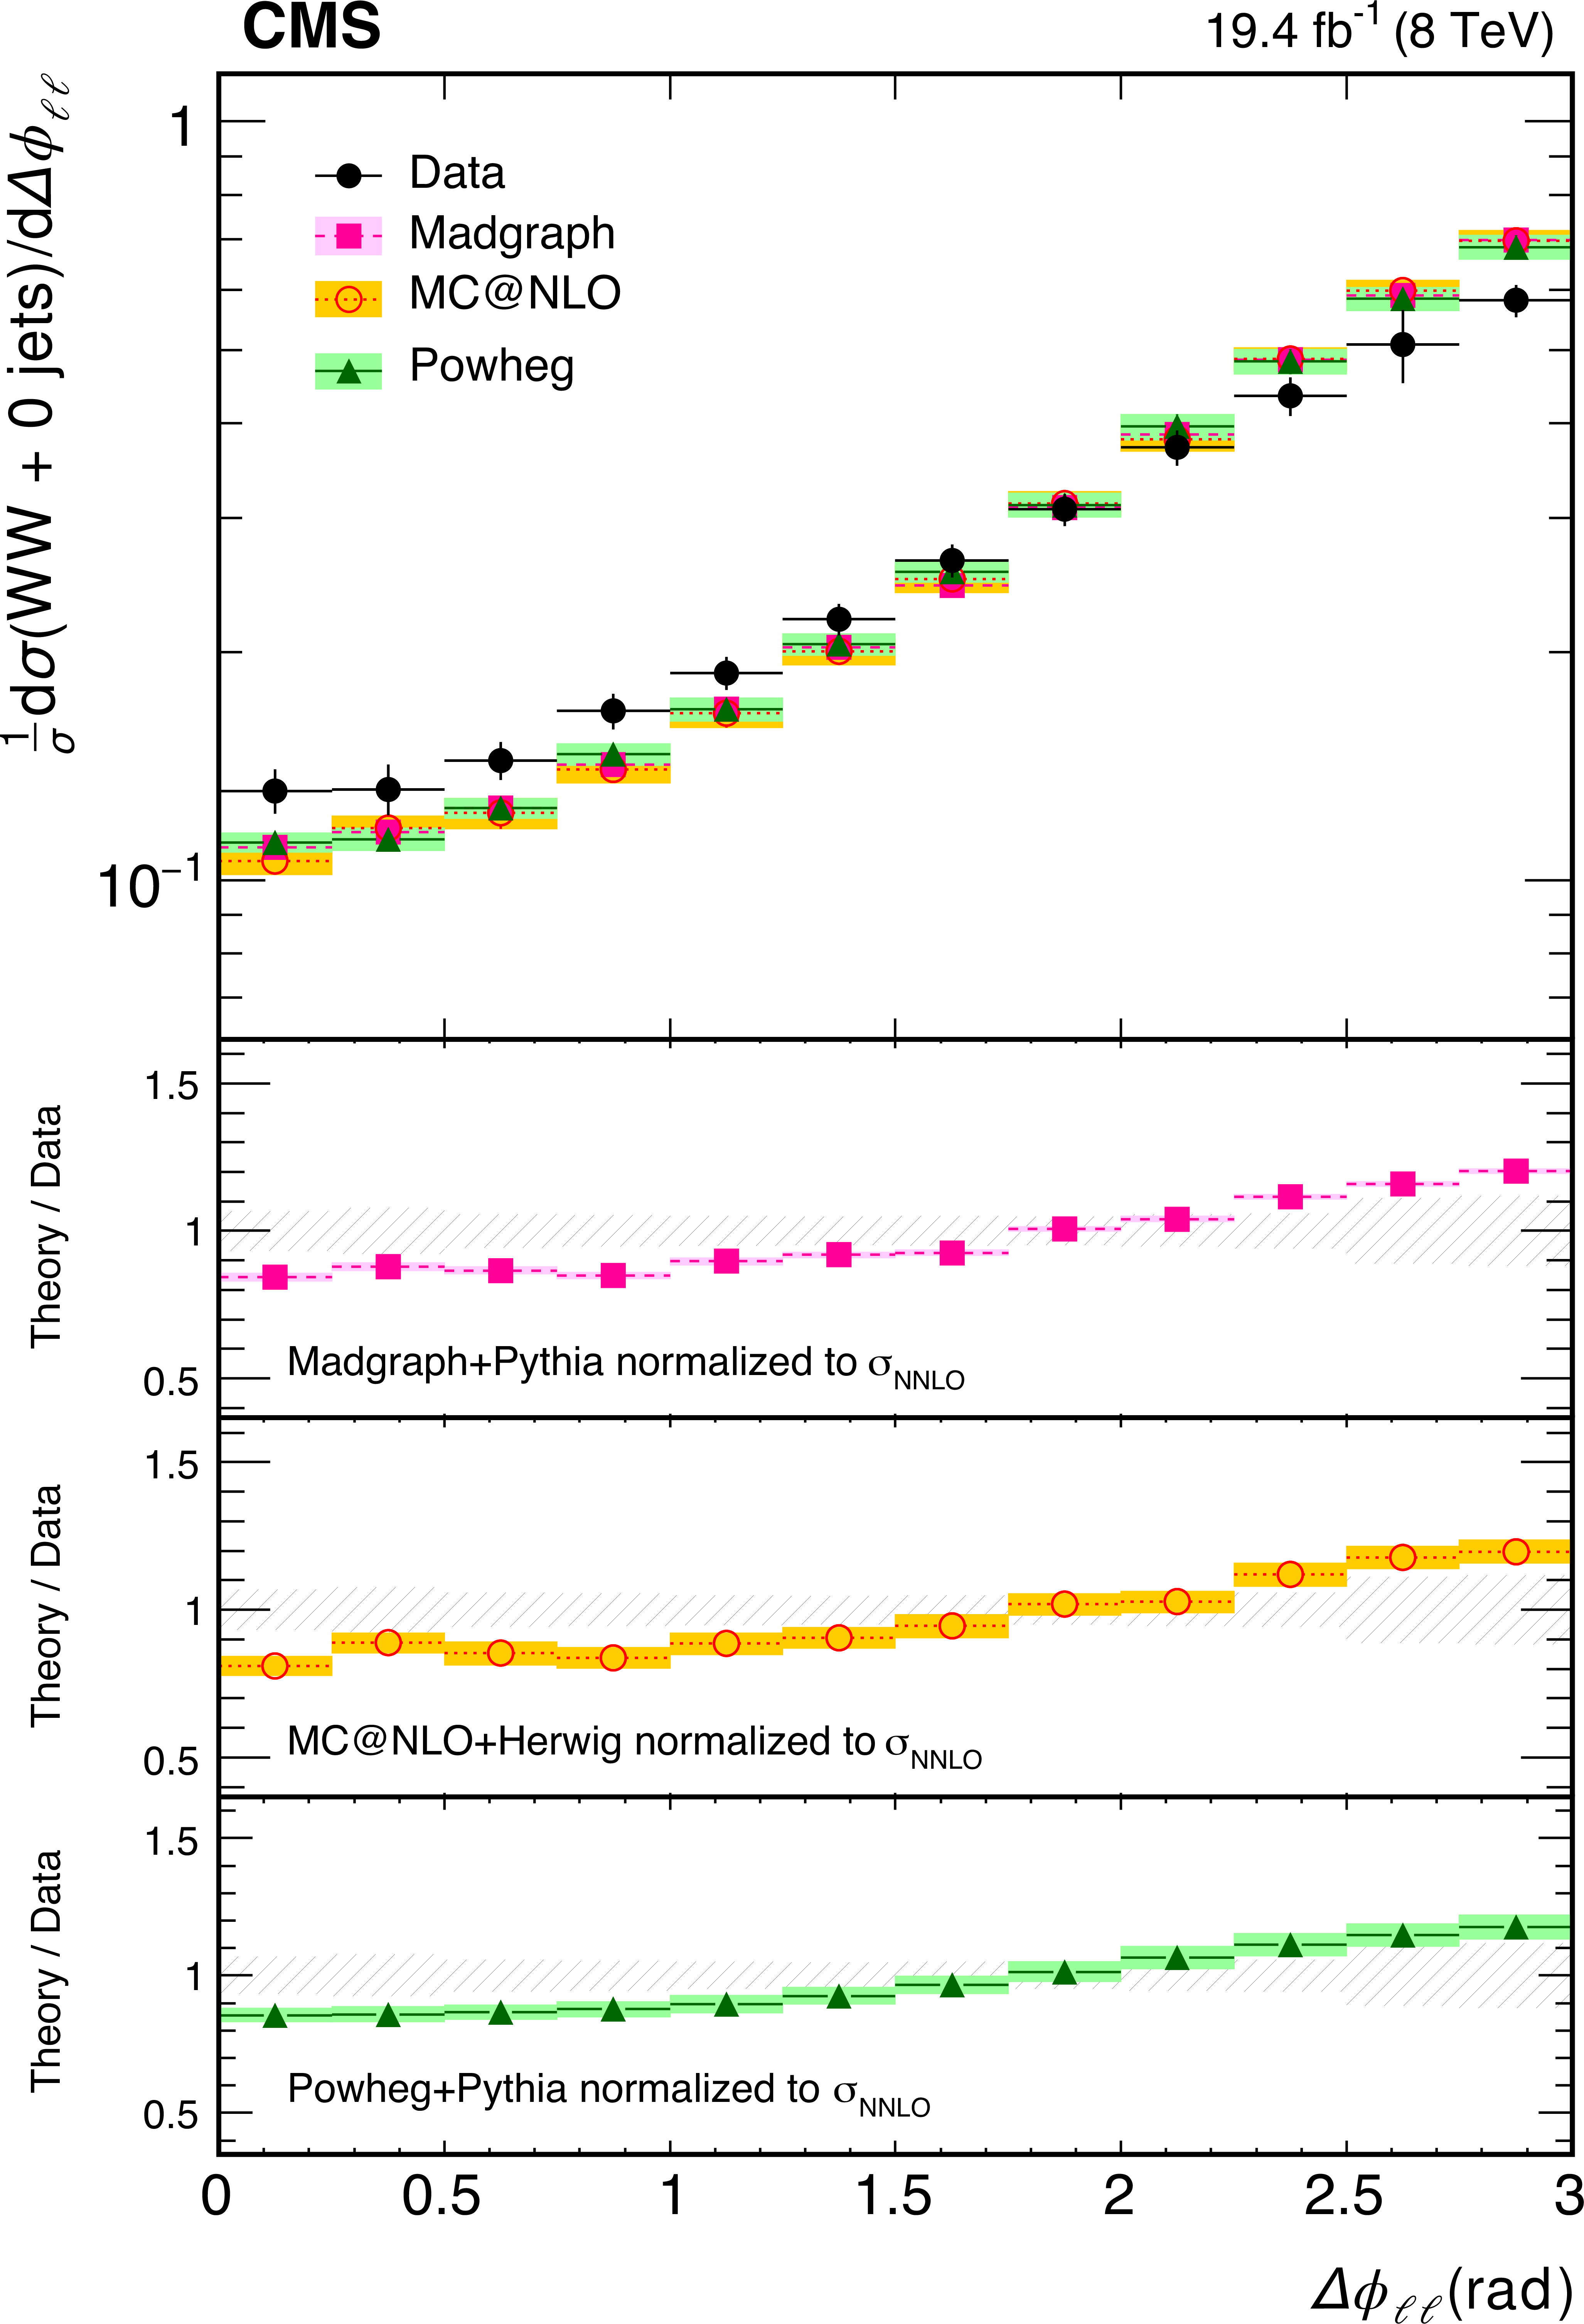
Figure 3-d:
Normalized differential $ { {\mathrm {W^+}} {\mathrm {W^-}}} $ cross section as a function of the leading lepton $ {p_{\mathrm {T}}} $ ($p_{{\mathrm {T}},\text { max}}^{\ell }$) (a), the transverse momentum of the dilepton system ($ {p_{\mathrm {T}}} ^{\ell \ell }$) (b), the invariant mass ($ {m_{\ell \ell }} $) (c) and the angular separation between leptons ($\Delta \phi _{\ell \ell }$) (d). Both statistical and systematic uncertainties are included. The hatched area in the ratio plots corresponds to the relative error of the data in each bin. The measurement, including $ {\mathrm {g}} {\mathrm {g}} \to {\mathrm {W^+}} {\mathrm {W^-}}$ is compared to predictions from MADGRAPH, POWHEG, and MC@NLO. |

png pdf |
Figure 4:
The $ {m_{\ell \ell }} $ distribution with all SM backgrounds and $c_{\mathrm {W}}/\Lambda ^2 =$ 20 TeV$^{-2}$, $c_{\mathrm {WWW}}/\Lambda ^2 =$ 20 TeV$^{-2}$, and $c_{\mathrm {B}}/\Lambda ^2 =$ 55 TeV$^{-2}$. The events are selected requiring no reconstructed jets with $ {p_{\mathrm {T}}} > 30 $ GeV and $ {| \eta | } < 4.7$. The last bin includes all events with $ {m_{\ell \ell }} > 575 $ GeV. The hatched area around the SM distribution is the total systematic uncertainty in each bin. The signal component is simulated with MADGRAPH and contains the $ {\mathrm {q}} {\overline {\mathrm {q}}}\to {\mathrm {W^+}} {\mathrm {W^-}}$, the nonresonant $ {\mathrm {g}} {\mathrm {g}}\to {\mathrm {W^+}} {\mathrm {W^-}}$, and the $ {\mathrm {g}} {\mathrm {g}}\to {\mathrm {H}} \to {\mathrm {W^+}} {\mathrm {W^-}}$ components. |
png pdf |
Figure 5-a:
Two-dimensional observed (thick lines) and expected (thin lines) 68% and 95% CL contours. The contours are obtained from profile log-likelihood comparisons to data assuming two nonzero coupling constants: $c_{\mathrm {WWW}}/\Lambda ^2 \times c_{\mathrm {W}}/\Lambda ^2$, $c_{\mathrm {WWW}}/\Lambda ^2 \times c_{\mathrm {B}}/\Lambda ^2$, and $c_{\mathrm {W}}/\Lambda ^2 \times c_{\mathrm {B}}/\Lambda ^2$. The cross markers indicate the best-fit values, and the diamond markers indicate the SM ones. |

png pdf |
Figure 5-b:
Two-dimensional observed (thick lines) and expected (thin lines) 68% and 95% CL contours. The contours are obtained from profile log-likelihood comparisons to data assuming two nonzero coupling constants: $c_{\mathrm {WWW}}/\Lambda ^2 \times c_{\mathrm {W}}/\Lambda ^2$, $c_{\mathrm {WWW}}/\Lambda ^2 \times c_{\mathrm {B}}/\Lambda ^2$, and $c_{\mathrm {W}}/\Lambda ^2 \times c_{\mathrm {B}}/\Lambda ^2$. The cross markers indicate the best-fit values, and the diamond markers indicate the SM ones. |
png pdf |
Figure 5-c:
Two-dimensional observed (thick lines) and expected (thin lines) 68% and 95% CL contours. The contours are obtained from profile log-likelihood comparisons to data assuming two nonzero coupling constants: $c_{\mathrm {WWW}}/\Lambda ^2 \times c_{\mathrm {W}}/\Lambda ^2$, $c_{\mathrm {WWW}}/\Lambda ^2 \times c_{\mathrm {B}}/\Lambda ^2$, and $c_{\mathrm {W}}/\Lambda ^2 \times c_{\mathrm {B}}/\Lambda ^2$. The cross markers indicate the best-fit values, and the diamond markers indicate the SM ones. |
| Tables | |
png pdf |
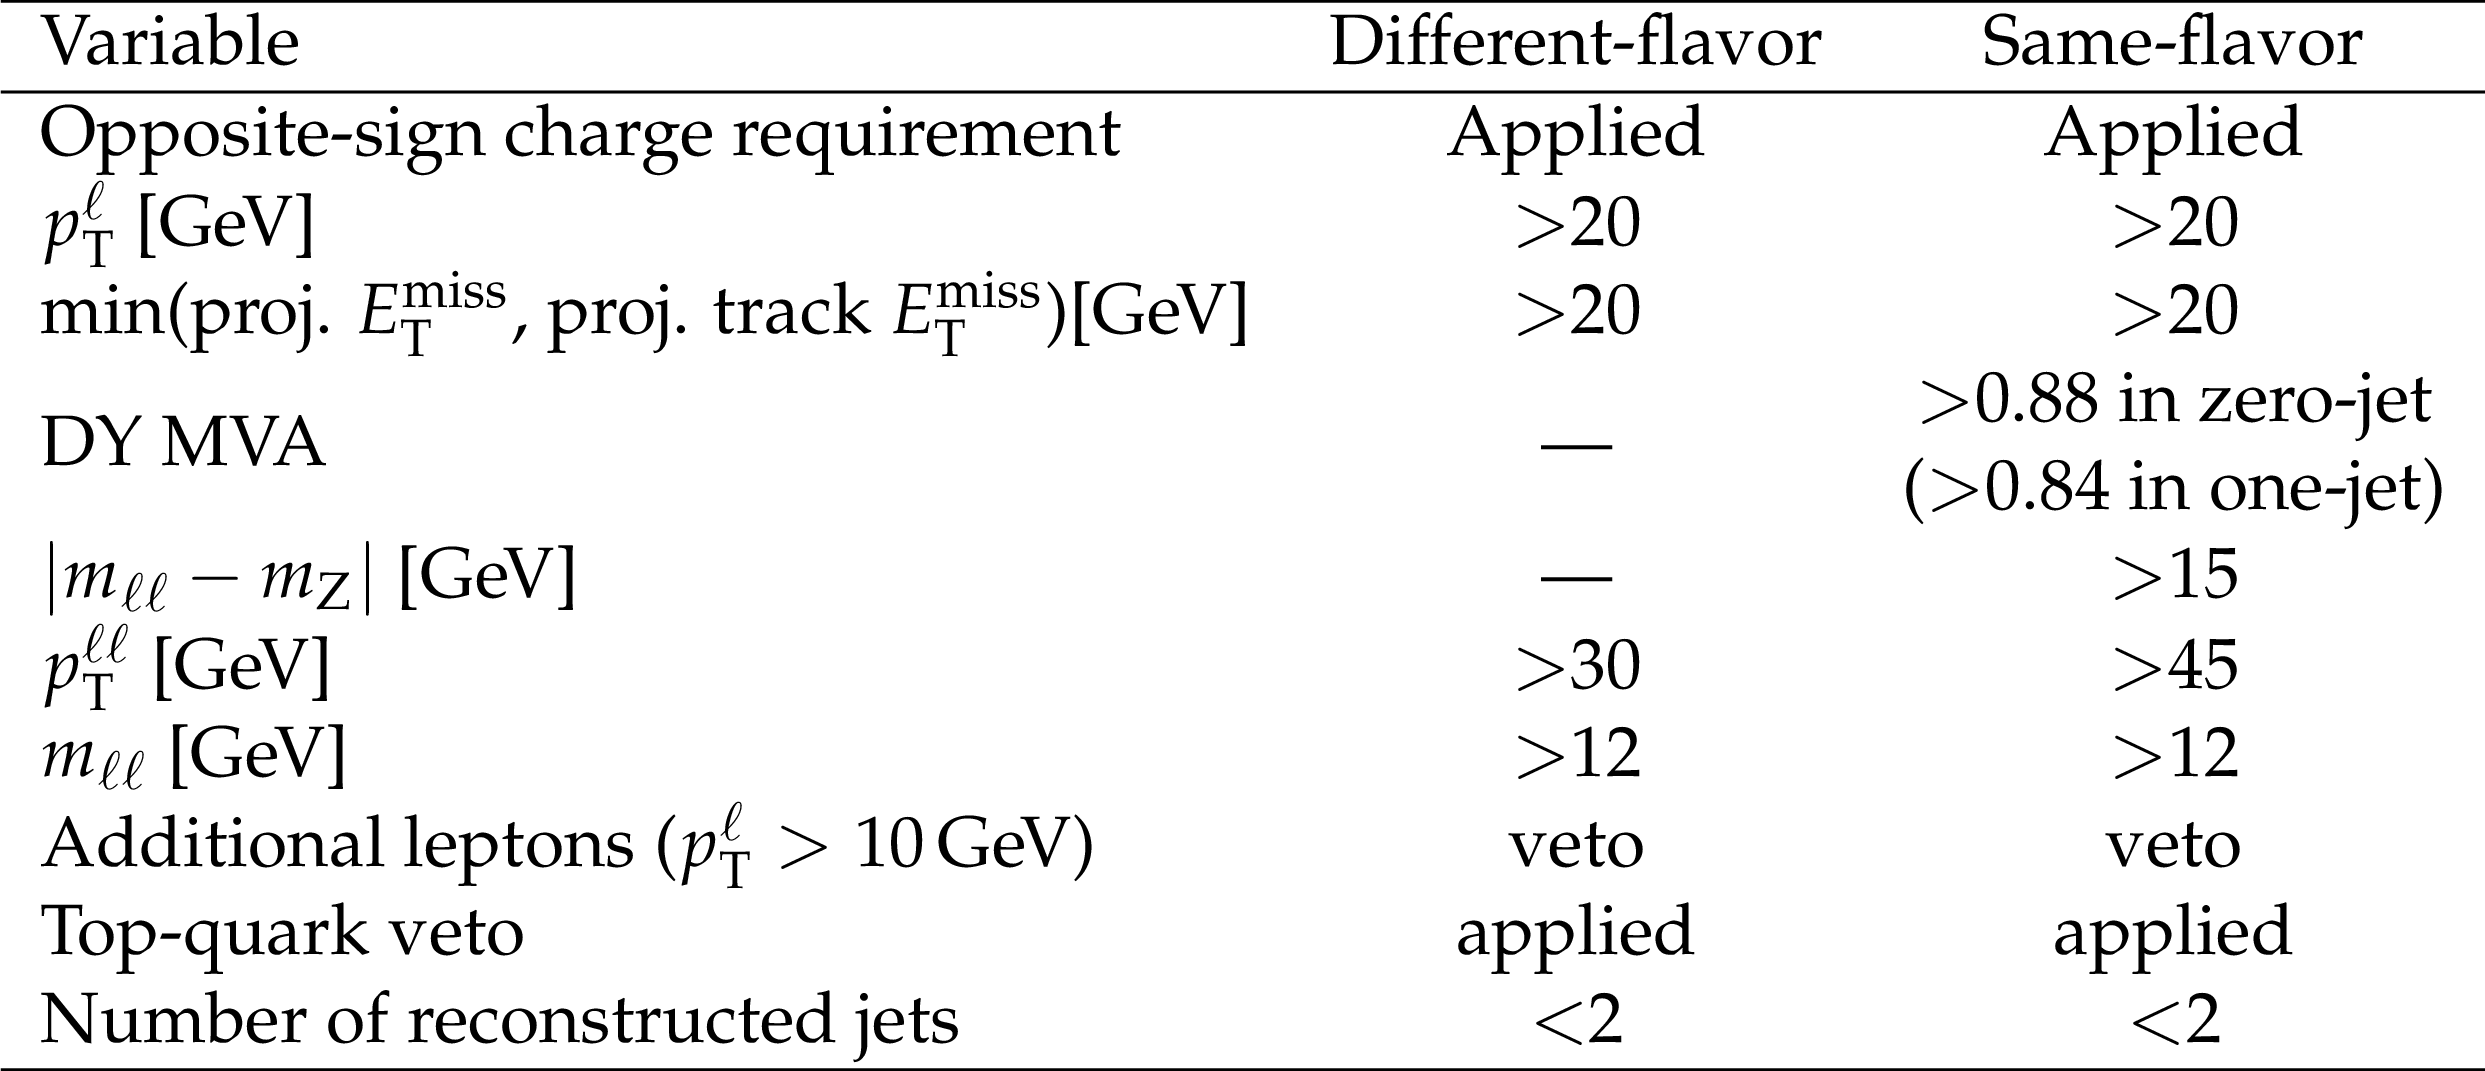
Table 1:
Summary of the event selection for the different-flavor and same-flavor final states. |
png pdf |
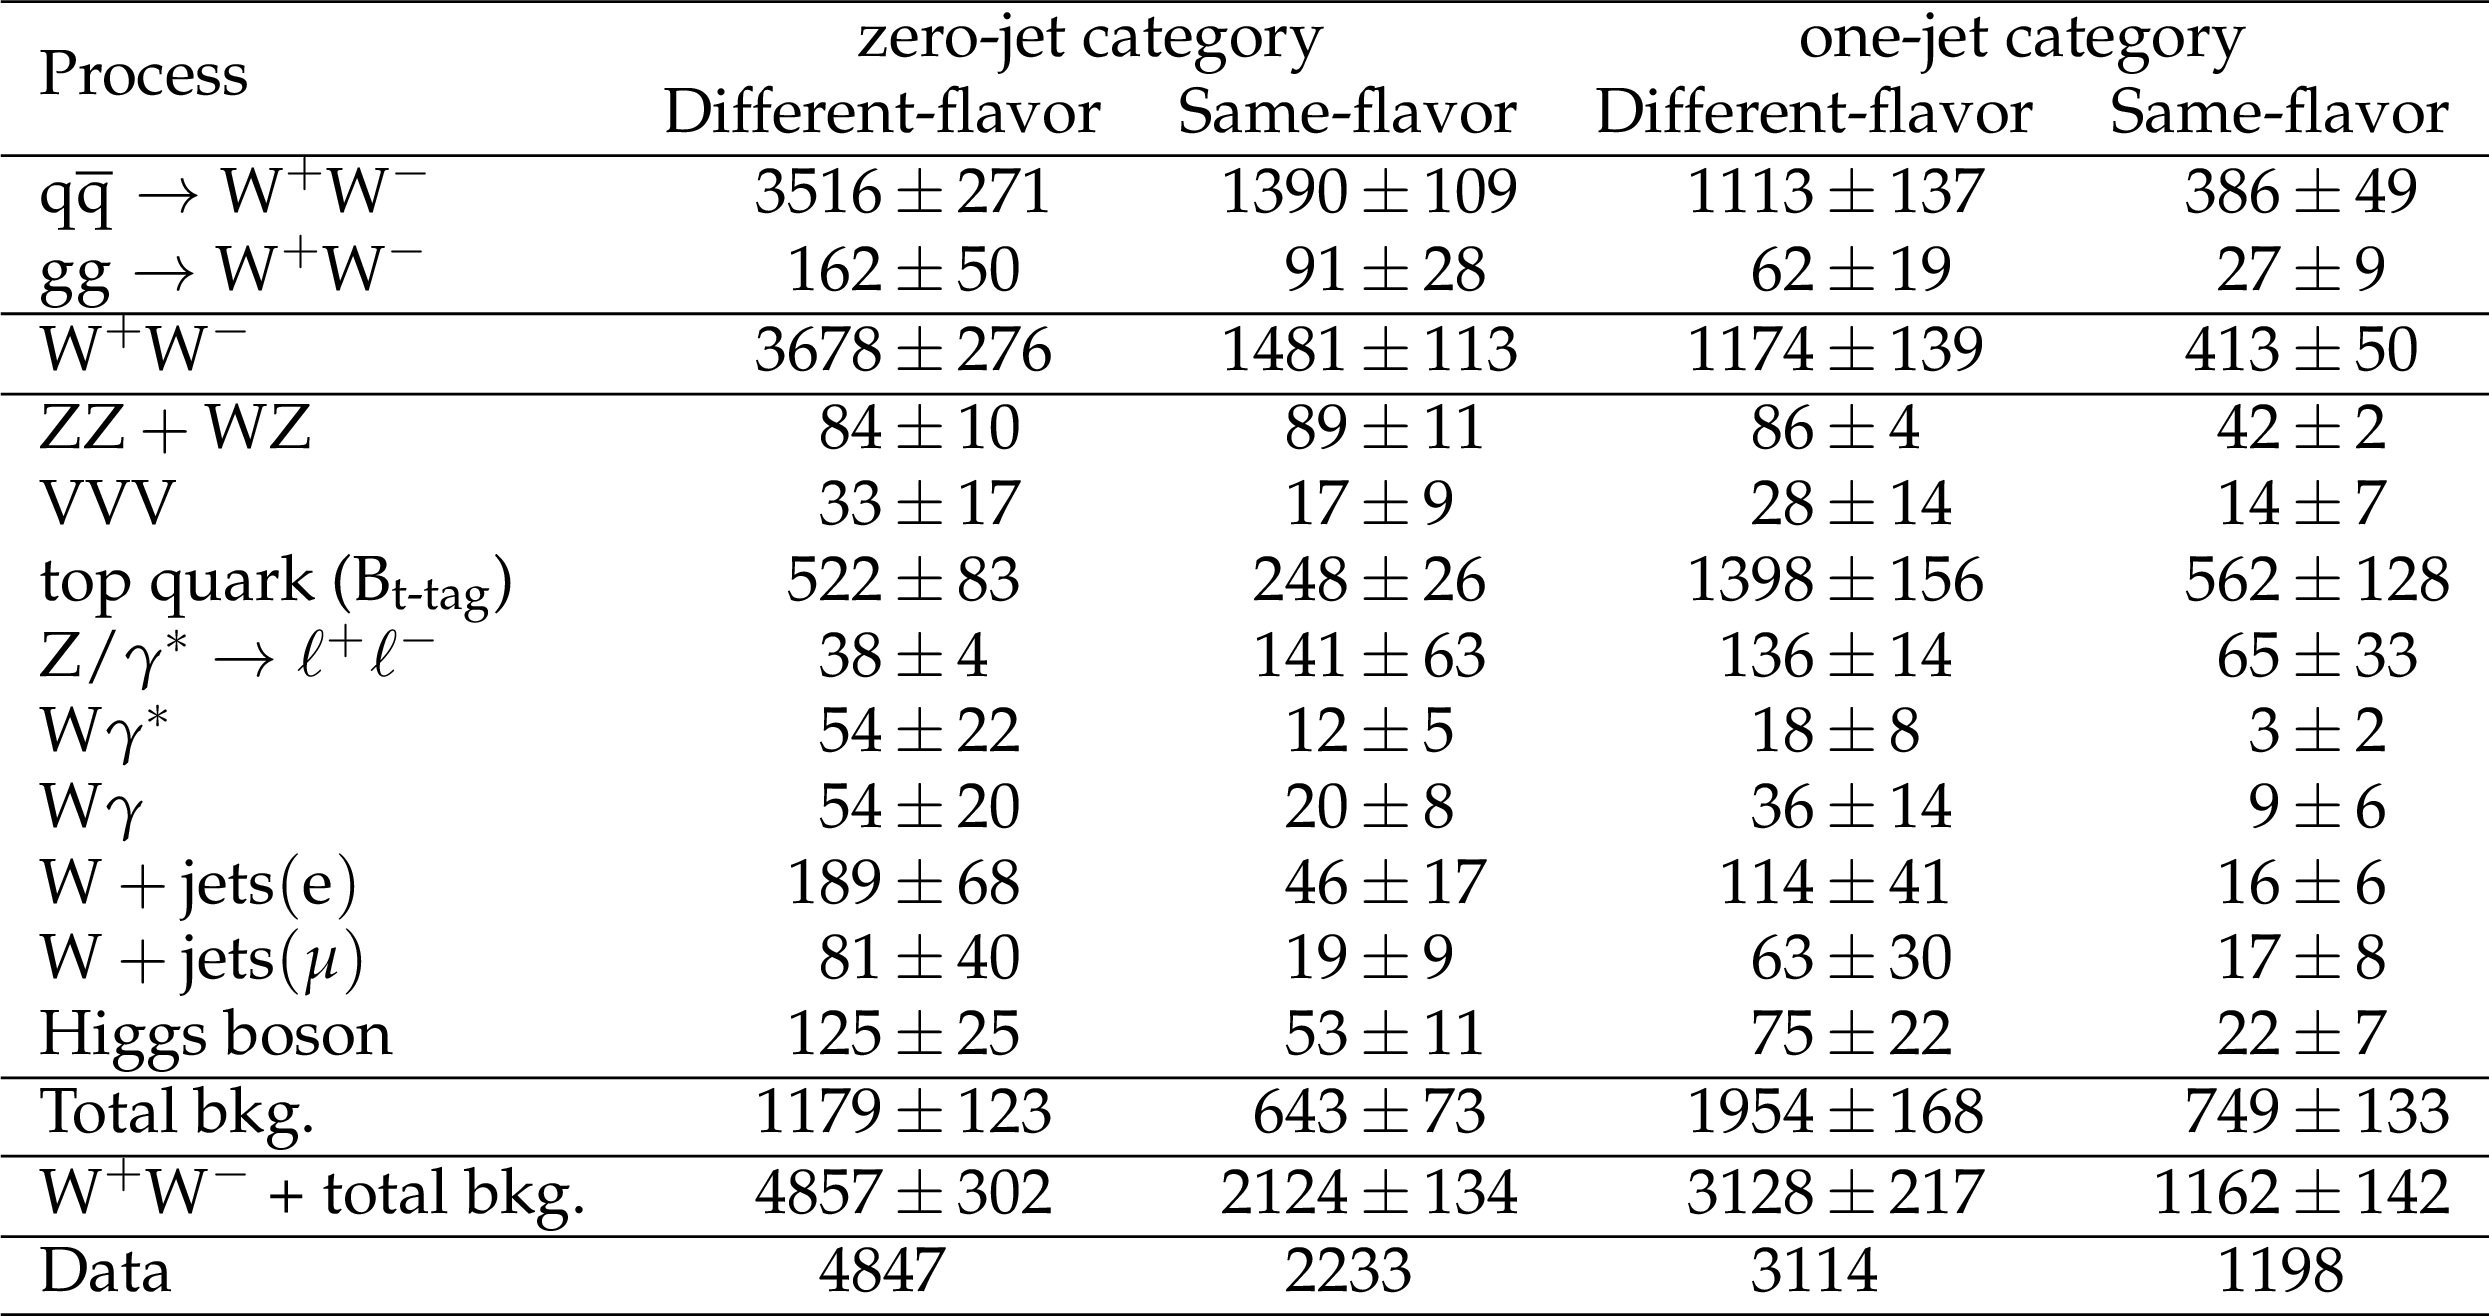
Table 2:
Data, signal, and background yields for the four different event categories used for the $ { {\mathrm {p}} {\mathrm {p}}\to {\mathrm {W^+}} {\mathrm {W^-}}} $ cross section measurement. The reported uncertainties include both statistical and systematic components as described in Section 6. |
png pdf |
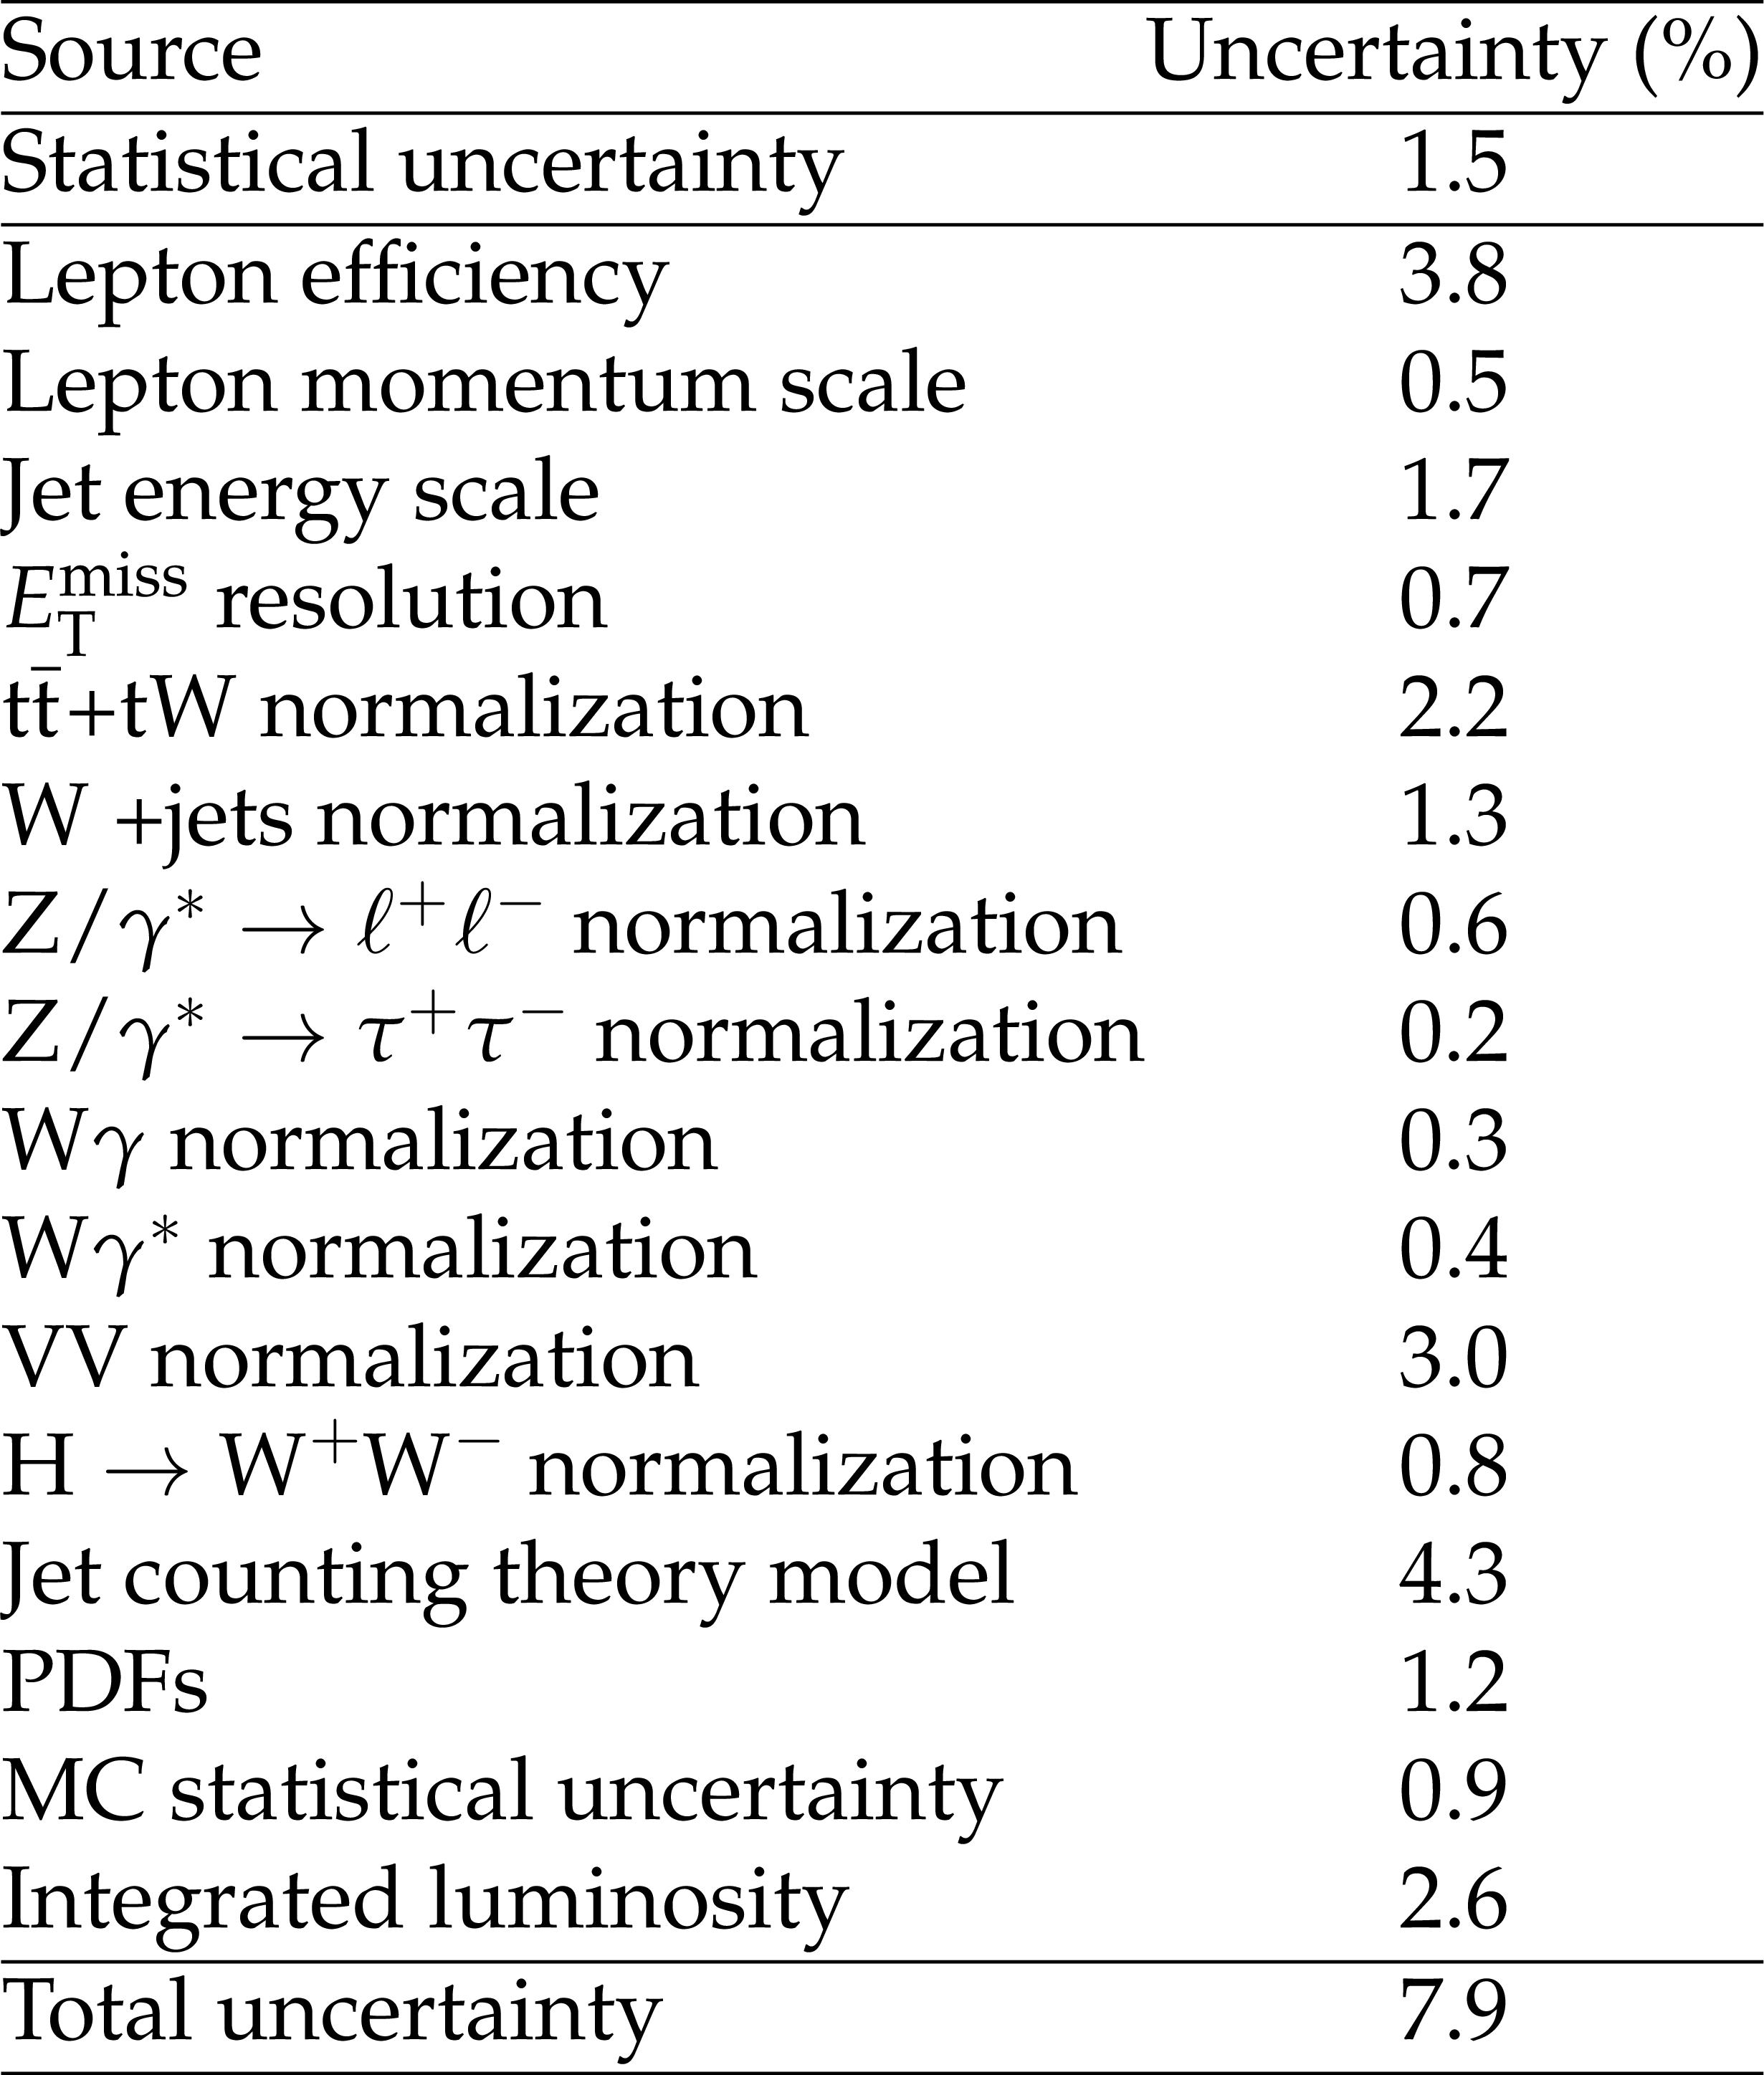
Table 3:
Relative systematic uncertainties in the $ {\mathrm {W^+}} {\mathrm {W^-}}$ cross section measurement. |

png pdf |
Table 4:
Signal efficiency for the four event categories used in the $ { {\mathrm {p}} {\mathrm {p}}\to {\mathrm {W^+}} {\mathrm {W^-}}} $ cross section measurement. The values reported are a product of the detector geometrical acceptance and the object reconstruction and event identification efficiency. The statistical uncertainty is from the limited size of the MC samples. |
png pdf |
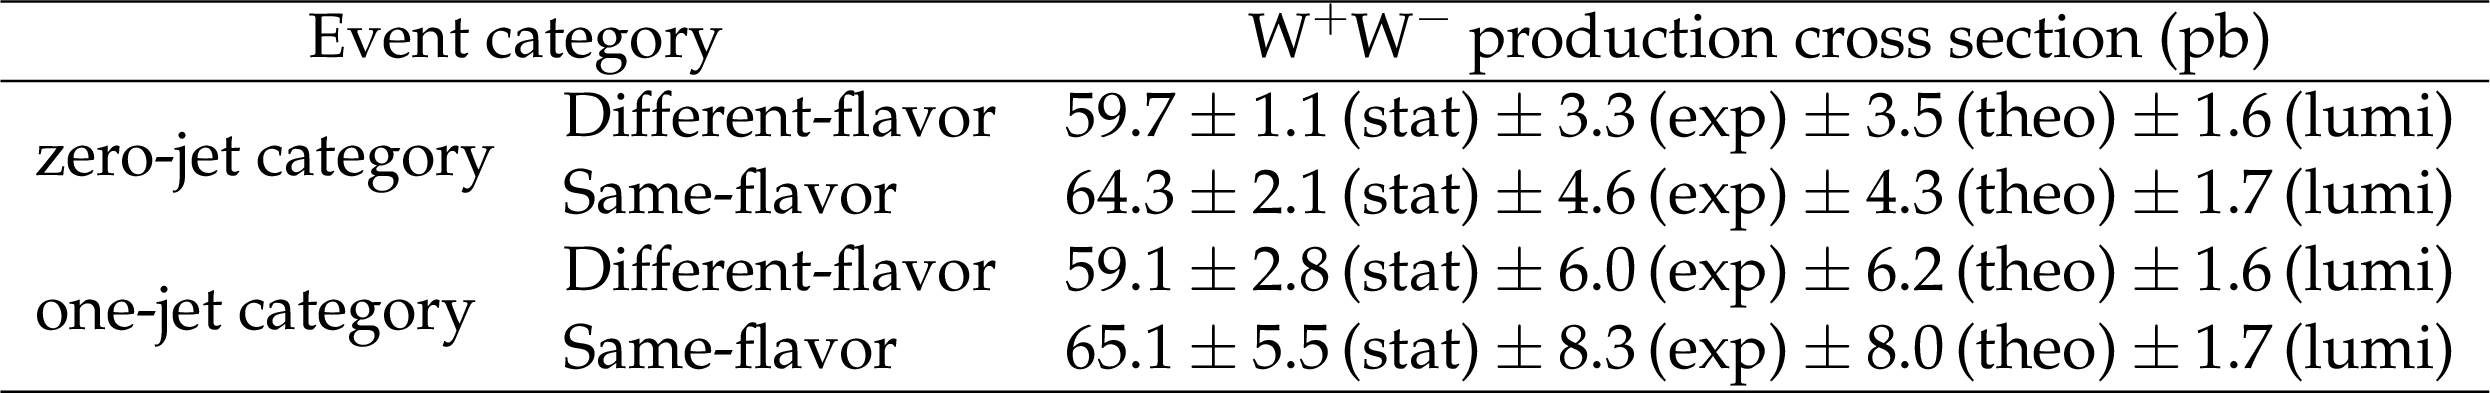
Table 5:
The $ { {\mathrm {W^+}} {\mathrm {W^-}}} $ production cross section in each of the four event categories. |
png pdf |
Table 6:
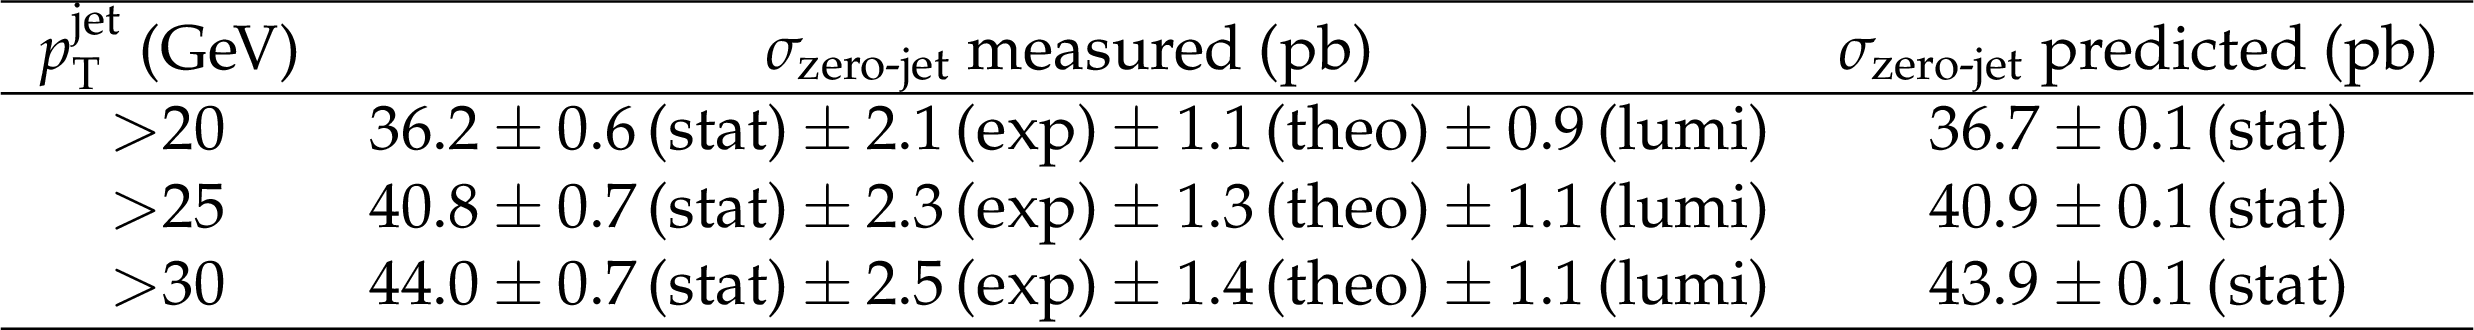
The $ { {\mathrm {W^+}} {\mathrm {W^-}}} $ production cross section in fiducial regions defined by requiring no jets at particle level with jet $ {p_{\mathrm {T}}} $ thresholds as listed. |
png pdf |
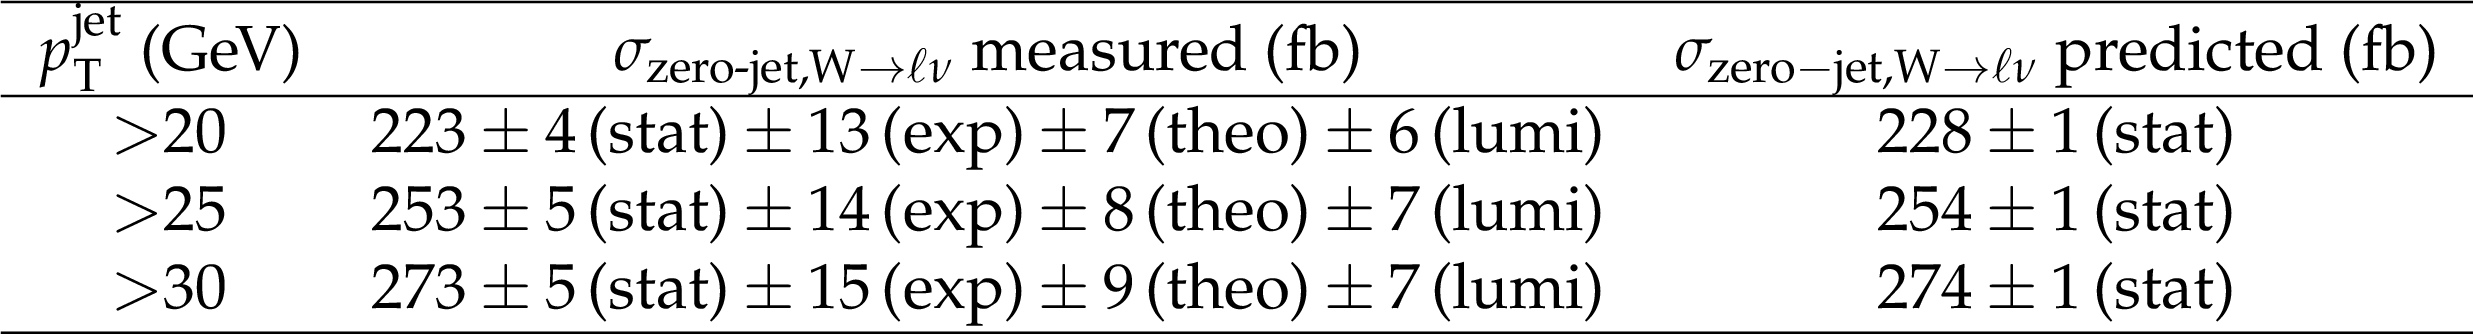
Table 7:
The $ { {\mathrm {W^+}} {\mathrm {W^-}}} $ production cross section in fiducial regions defined by requiring zero jets at particle level with varying jet $ {p_{\mathrm {T}}} $ thresholds and requiring prompt leptons with $ {p_{\mathrm {T}}} > $ 20 GeV and $ {| \eta | }<$ 2.5, before final-state radiation. |
png pdf |
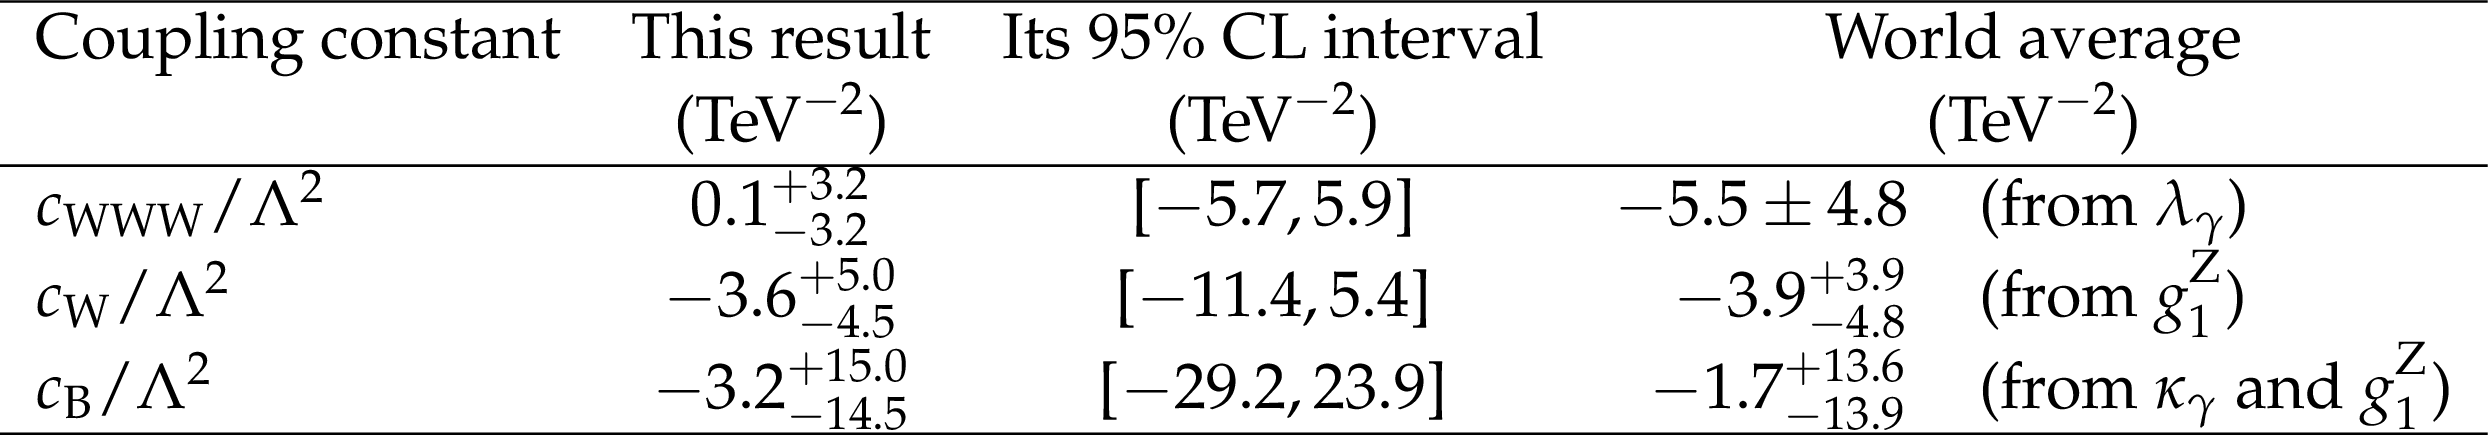
Table 8:
Measured $c_{\mathrm {WWW}}/\Lambda ^2$, $c_{\mathrm {W}}/\Lambda ^2$, and $c_{\mathrm {B}}/\Lambda ^2$ coupling constants and its corresponding 95% CL intervals. Results are compared to the world average values, as explained in the text. |
| Summary |
| This paper reports a measurement of the $\mathrm{W}^{+}\mathrm{W}^{-}$ cross section in pp collisions at a center of mass energy of 8 TeV, using an integrated luminosity of $\mathcal{L} =$ 19.4 $\pm$ 0.5 fb$^{-1}$. The measured $\mathrm{W}^{+}\mathrm{W}^{-}$ cross section is 60.1 $\pm$ 0.9 (stat) $\pm$ 3.2 (exp) $\pm$ 3.1 (theo) $\pm$ 1.6 (lumi) pb = 60.1 $\pm$ 4.8 pb, consistent with the NNLO theoretical prediction $\sigma^{\text{NNLO}}( pp \to \mathrm{W}^{+}\mathrm{W}^{-} ) = 59.8^{+1.3}_{-1.1}$ pb. We also report results on the normalized differential cross section measured as a function of kinematic variables of the final-state charged leptons and compared with several predictions from perturbative QCD calculations. Data and theory show a good agreement for the $m^{\ell \ell}$ and the $p_{\mathrm{T}}^{\ell \ell}$ distributions within uncertainties, but the MC@NLO generator predicts a softer $p_{\mathrm{T}}^{\ell \ell}$ spectrum compared with the data events. In case of the $p_{\mathrm{T,max}}^{\ell}$ distribution, the MADGRAPH prediction shows an excess of events in the tail of the distribution compared to data, while POWHEG shows a reasonable agreement and MC@NLO shows a good agreement. We also observed differences in the shape of the $\Delta phi_{\ell\ell}$ for the three generators compared to the data. No evidence for anomalous WWZ and WW$\gamma$ triple gauge-boson couplings is found, and limits on their magnitudes are set. These new limits are comparable to the current world average, and represent an improvement in the measurement of the coupling constant $c_{\mathrm{WWW}}/\Lambda^2$. This paper reports a measurement of the $\mathrm{W}^{+}\mathrm{W}^{-}$ cross section in pp collisions at a center of mass energy of 8 TeV, using an integrated luminosity of $\mathcal{L} =$ 19.4 $\pm$ 0.5 fb$^{-1}$. The measured $\mathrm{W}^{+}\mathrm{W}^{-}$ cross section is 60.1 $\pm$ 0.9 (stat) $\pm$ 3.2 (exp) $\pm$ 3.1 (theo) $\pm$ 1.6 (lumi) pb = 60.1 $\pm$ 4.8 pb, consistent with the NNLO theoretical prediction $\sigma^{\text{NNLO}}( pp \to \mathrm{W}^{+}\mathrm{W}^{-} ) = 59.8^{+1.3}_{-1.1}$ pb. We also report results on the normalized differential cross section measured as a function of kinematic variables of the final-state charged leptons and compared with several predictions from perturbative QCD calculations. Data and theory show a good agreement for the $m^{\ell \ell}$ and the $p_{\mathrm{T}}^{\ell \ell}$ distributions within uncertainties, but the MC@NLO generator predicts a softer $p_{\mathrm{T}}^{\ell \ell}$ spectrum compared with the data events. In case of the $p_{\mathrm{T,max}}^{\ell}$ distribution, the MADGRAPH prediction shows an excess of events in the tail of the distribution compared to data, while POWHEG shows a reasonable agreement and MC@NLO shows a good agreement. We also observed differences in the shape of the $\Delta phi_{\ell\ell}$ for the three generators compared to the data. No evidence for anomalous WWZ and WW$\gamma$ triple gauge-boson couplings is found, and limits on their magnitudes are set. These new limits are comparable to the current world average, and represent an improvement in the measurement of the coupling constant $c_{\mathrm{WWW}}/\Lambda^2$. |
| References | ||||
| 1 | J. M. Campbell, R. K. Ellis, and C. Williams | Vector boson pair production at the LHC | JHEP 07 (2011) 018 | 1105.0020 |
| 2 | CMS Collaboration | $ \mathrm{ W }^+\mathrm{ W }^- $ cross section in pp at $ \sqrt{s} $ = 7 TeV and limits on anomalous couplings | EPJC 73 (2013) 2610 | |
| 3 | ATLAS Collaboration | Measurement of the $ WW $ cross section in $ \sqrt{s} $ = 7 TeV pp collisions with the ATLAS detector and limits on anomalous gauge couplings | PLB 712 (2012) 289 | 1203.6232 |
| 4 | CMS Collaboration | Measurement of the $ \mathrm{ W }^+\mathrm{ W }^- $ and $ \mathrm{ Z }\mathrm{ Z } $ production cross sections in pp collisions at $ \sqrt{s} = $ 8 TeV | PLB 721 (2013) 190 | |
| 5 | CDF Collaboration | Measurement of the production and differential cross sections of $ WW $ bosons in association with jets in $ p\bar{p} $ collisions at $ \sqrt{s} $ = 1.96 TeV | PRD. 91 (2015) 11110 | 1505.00801 |
| 6 | T. Gehrmann, M. Grazzini, S. Kallweit, P. Maierhofer, A. von Manteuffel, S. Pozzorini, D. Rathlev, and L. Tancredi | $ WW $ production at hadron colliders in NNLO QCD | PRL 113 (2014) 212001 | 1408.5243 |
| 7 | S. Heinemeyer et al. | Handbook of LHC Higgs cross sections: 3. Higgs properties | CERN Report CERN-2013-004 | 1307.1347 |
| 8 | P. Meade, H. Ramani, and M. Zeng | Transverse momentum resummation effects in $ W^+W^- $ measurements | PRD 90 (2014) 114006 | 1407.4481 |
| 9 | P. Jaiswal, and T. Okui | Explanation of the $ {\mathrm{WW}} $ excess at the LHC by jet-veto resummation | PRD 90 (2014) 073009 | 1407.4537 |
| 10 | C. Degrande et al. | Effective field theory: a modern approach to anomalous couplings | Annals Phys. 335 (2013) 21 | 1205.4231 |
| 11 | CMS Collaboration | The CMS experiment at the CERN LHC | JINST 3 (2008) S08004 | CMS-00-001 |
| 12 | CMS Collaboration | CMS luminosity based on pixel cluster counting - summer 2013 update | CMS-PAS-LUM-13-001 | CMS-PAS-LUM-13-001 |
| 13 | CMS Collaboration | Measurements of inclusive W and Z cross sections in pp collisions at $ \sqrt{s} $ = 7 TeV | JHEP 01 (2011) 080 | CMS-EWK-10-002 1012.2466 |
| 14 | GEANT4 Collaboration | GEANT4 --- a simulation toolkit | NIMA 506 (2003) 250 | |
| 15 | S. Frixione, P. Nason, and C. Oleari | Matching NLO QCD computations with parton shower simulations: the POWHEG method | JHEP 11 (2007) 070 | hep-ph/0709.2092 |
| 16 | P. Nason | A New method for combining NLO QCD with shower Monte Carlo algorithms | JHEP 11 (2004) 040 | hep-ph/0409146 |
| 17 | S. Alioli, P. Nason, C. Oleari, and E. Re | A general framework for implementing NLO calculations in shower Monte Carlo programs: the POWHEG BOX | JHEP 06 (2010) 043 | hep-ph/1002.2581 |
| 18 | T. Melia, P. Nason, R. Rontsch, and G. Zanderighi | $ WW $, $ WZ $ and $ ZZ $ production in the POWHEG BOX | JHEP 11 (2011) 078 | hep-ph/1107.5051 |
| 19 | P. Nason and G. Zanderighi | $ WW $, $ WZ $ and $ ZZ $ production in the POWHEG BOX V2 | EPJC 74 (2014) 2702 | hep-ph/1311.1365 |
| 20 | J. Alwall et al. | MadGraph 5: going beyond | JHEP 06 (2011) 128 | 1106.0522 |
| 21 | S. Frixione and B. R. Webber | Matching NLO QCD computations and parton showers simulations | JHEP 06 (2002) 029 | hep-ph/0204244 |
| 22 | T. Binoth, M. Ciccolini, N. Kauer, and M. Kramer | Gluon-induced W-boson pair production at the LHC | JHEP 12 (2006) 046 | hep-ph/0611170 |
| 23 | LHC Higgs Cross Section Working Group, S. Dittmaier, C. Mariotti, G. Passarino, R. Tanaka (Eds.) | Handbook of LHC Higgs Cross Sections: Inclusive Observables | CERN Report CERN-2011-002 | 1101.0593 |
| 24 | T. Sjostrand, S. Mrenna, and P. Skands | PYTHIA 6.4 physics and manual | JHEP 05 (2006) 026 | hep-ph/0603175 |
| 25 | H.-L. Lai et al. | Uncertainty induced by QCD coupling in the CTEQ global analysis of parton distributions | PRD 82 (2010) 054021 | 1004.4624 |
| 26 | H.-L. Lai et al. | New parton distributions for collider physics | PRD 82 (2010) 074024 | 1007.2241 |
| 27 | G. Corcella et al. | HERWIG 6: an event generator for hadron emisssion reactions with interfering gluons (including supersymmetric processes) | JHEP 01 (2001) 010 | hep-ph/0011363 |
| 28 | S. Jadach, J. H. Kuhn, and Z. W\cas | TAUOLA --- a library of Monte Carlo programs to simulate decays of polarized tau leptons | Comp. Phys. Commun. 64 (1991) 275 | |
| 29 | D. de Florian, G. Ferrera, M. Grazzini, and D. Tommasini | Transverse-momentum resummation: Higgs boson production at the Tevatron and the LHC | JHEP 11 (2011) 064 | 1109.2109 |
| 30 | CMS Collaboration | Particle--flow event reconstruction in CMS and performance for jets, taus, and $ E_{\mathrm{T}}^{\text{miss}} $ | CDS | |
| 31 | CMS Collaboration | Commissioning of the particle-flow event reconstruction with the first LHC collisions recorded in the CMS detector | CDS | |
| 32 | H. Voss, A. Hocker, J. Stelzer, and F. Tegenfeldt | TMVA, the Toolkit for Multivariate Data Analysis with ROOT | in XIth International Workshop on Advanced Computing and Analysis Techniques in Physics Research (ACAT) | physics/0703039 |
| 33 | CMS Collaboration | Performance of electron reconstruction and selection with the CMS detector in proton-proton collisions at $ \sqrt{s} $ = $ \; $ 8 TeV | JINST 10 (2015) P06005 | CMS-EGM-13-001 1502.02701 |
| 34 | CMS Collaboration | Performance of CMS muon reconstruction in pp collision events at $ \sqrt{s} = 7 $ TeV | JINST 7 (2012) P10002 | |
| 35 | M. Cacciari and G. P. Salam | Pileup subtraction using jet areas | PLB 659 (2008) 119 | 0707.1378 |
| 36 | CMS Collaboration | Measurement of Higgs boson production and properties in the WW decay channel with leptonic final states | JHEP 01 (2014) 096 | 1312.1129v2 |
| 37 | M. Cacciari, G. P. Salam, and G. Soyez | The anti-$ k_t $ jet clustering algorithm | JHEP 04 (2008) 063 | 0802.1189 |
| 38 | M. Cacciari, G. P. Salam, and G. Soyez | FastJet user manual | EPJC 72 (2012) 1896 | hep-ph/1111.6097 |
| 39 | M. Cacciari and G. P. Salam | Dispelling the $ N^{3} $ myth for the $ k_t $ jet-finder | PLB 641 (2006) 57 | hep-ph/0512210 |
| 40 | CMS Collaboration | Pileup jet identification | CMS-PAS-JME-13-005 | CMS-PAS-JME-13-005 |
| 41 | CMS Collaboration | Determination of jet energy calibration and transverse momentum resolution in CMS | JINST 6 (2011) P11002 | CMS-JME-10-011 1107.4277 |
| 42 | CMS Collaboration | Identification of b-quark jets with the CMS experiment | JINST 8 (2012) P04013 | CMS-BTV-12-001 1211.4462 |
| 43 | CMS Collaboration | Evidence for the 125$ GeV $ Higgs boson decaying to a pair of $ \tau $ leptons | JHEP 05 (2014) 104 | arXiv:1401.5041v2 |
| 44 | R. C. Gray et al. | Backgrounds to Higgs boson searches from asymmetric internal conversion | 1110.1368 | |
| 45 | M. Botje et al. | The PDF4LHC working group interim recommendations | 1101.0538 | |
| 46 | S. Alekhin et al. | The PDF4LHC Working Group Interim Report | 1101.0536 | |
| 47 | A. D. Martin, W. J. Stirling, R. S. Thorn, and G. Watt | Parton distributions for the LHC | EPJC 63 (2009) 189 | 0901.0002 |
| 48 | NNPDF Collaboration | Impact of heavy quark masses on parton distributions and LHC phenomenology | Nucl. Phys. B 849 (2011) 296 | 1101.1300 |
| 49 | Particle Data Group | The review of particle physics | CPC 38 (2014) 090001 | |
| 50 | ATLAS and CMS Collaborations, LHC Higgs Combination Group | Procedure for the LHC Higgs boson search combination in Summer 2011 | Technical Report ATL-PHYS-PUB 2011-11, CMS NOTE 2011/005 | |
| 51 | A. L. Read | Presentation of search results: the CLs technique | JPG 28 (2002) 2693 | |
| 52 | T. Junk | Confidence level computation for combining searches with small statistics | NIMA 434 (1999) 435 | |
| 53 | T. Adye | Unfolding algorithms and tests using RooUnfold | 1105.1160v1 | |
| 54 | A. Hoecker and V. Kartvelishvili | SVD approach to data unfolding | NIMA 372 (1996) 469 | hep-ph/9509307 |
| 55 | G. D'Agostini | A multidimensional unfolding method based on Bayes' theorem | NIMA 362 (1995) 487 | |
| 56 | K. Hagiwara, S. Ishihara, R. Szalapski, and D. Zeppenfeld | Low energy effects of new interactions in the electroweak boson sector | PRD 48 (1993) 2182 | |
| 57 | F. Caravaglios, M. L. Mangano, M. Moretti, and R. Pittau | A new approach to multi-jet calculations in hadron collisions | Nucl. Phys. B 539 (1999) 215 | hep-ph/9807570 |
| 58 | A. Biekotter et al. | Vices and virtues of Higgs effective field theories at large energy | PRD 91 (2015) 055029 | 1406.7320 |
| 59 | T. Corbett, O. J. P. \'Eboli, and M. C. Gonzalez-Garcia | Unitarity constraints on dimension-six operators | PRD 91 (2015) 035014 | 1411.5026 |
| 60 | DELPHI, OPAL, LEP Electroweak, ALEPH, L3 Collaboration | Electroweak measurements in electron-positron collisions at W-boson-pair energies at LEP | PR 532 (2013) 119 | 1302.3415 |
|
|
Compact Muon Solenoid LHC, CERN |
|

|

|

|

|

|