

Compact Muon Solenoid
LHC, CERN
| CMS-SMP-14-022 ; CERN-EP-2016-043 | ||
| Measurement of the differential cross section and charge asymmetry for inclusive pp $ \to \mathrm{ W }^{\pm}+X$ production at $ \sqrt{s} = $ 8 TeV | ||
| CMS Collaboration | ||
| 5 March 2016 | ||
| Eur. Phys. J. C 76 (2016) 469 | ||
| Abstract: The differential cross section and charge asymmetry for inclusive pp $ \to \mathrm{ W }^{\pm}+X \to \mu^{\pm}\nu+X$ production at $ \sqrt{s} = $ 8 TeV are measured as a function of muon pseudorapidity. The data sample corresponds to an integrated luminosity of 18.8 fb$^{-1}$ recorded with the CMS detector at the LHC. These results provide important constraints on the parton distribution functions of the proton in the range of the Bjorken scaling variable $x$ from 10$^{-3}$ to 10$^{-1}$. | ||
| Links: e-print arXiv:1603.01803 [hep-ex] (PDF) ; CDS record ; inSPIRE record ; HepData record ; CADI line (restricted) ; | ||
| Figures | |
png pdf |
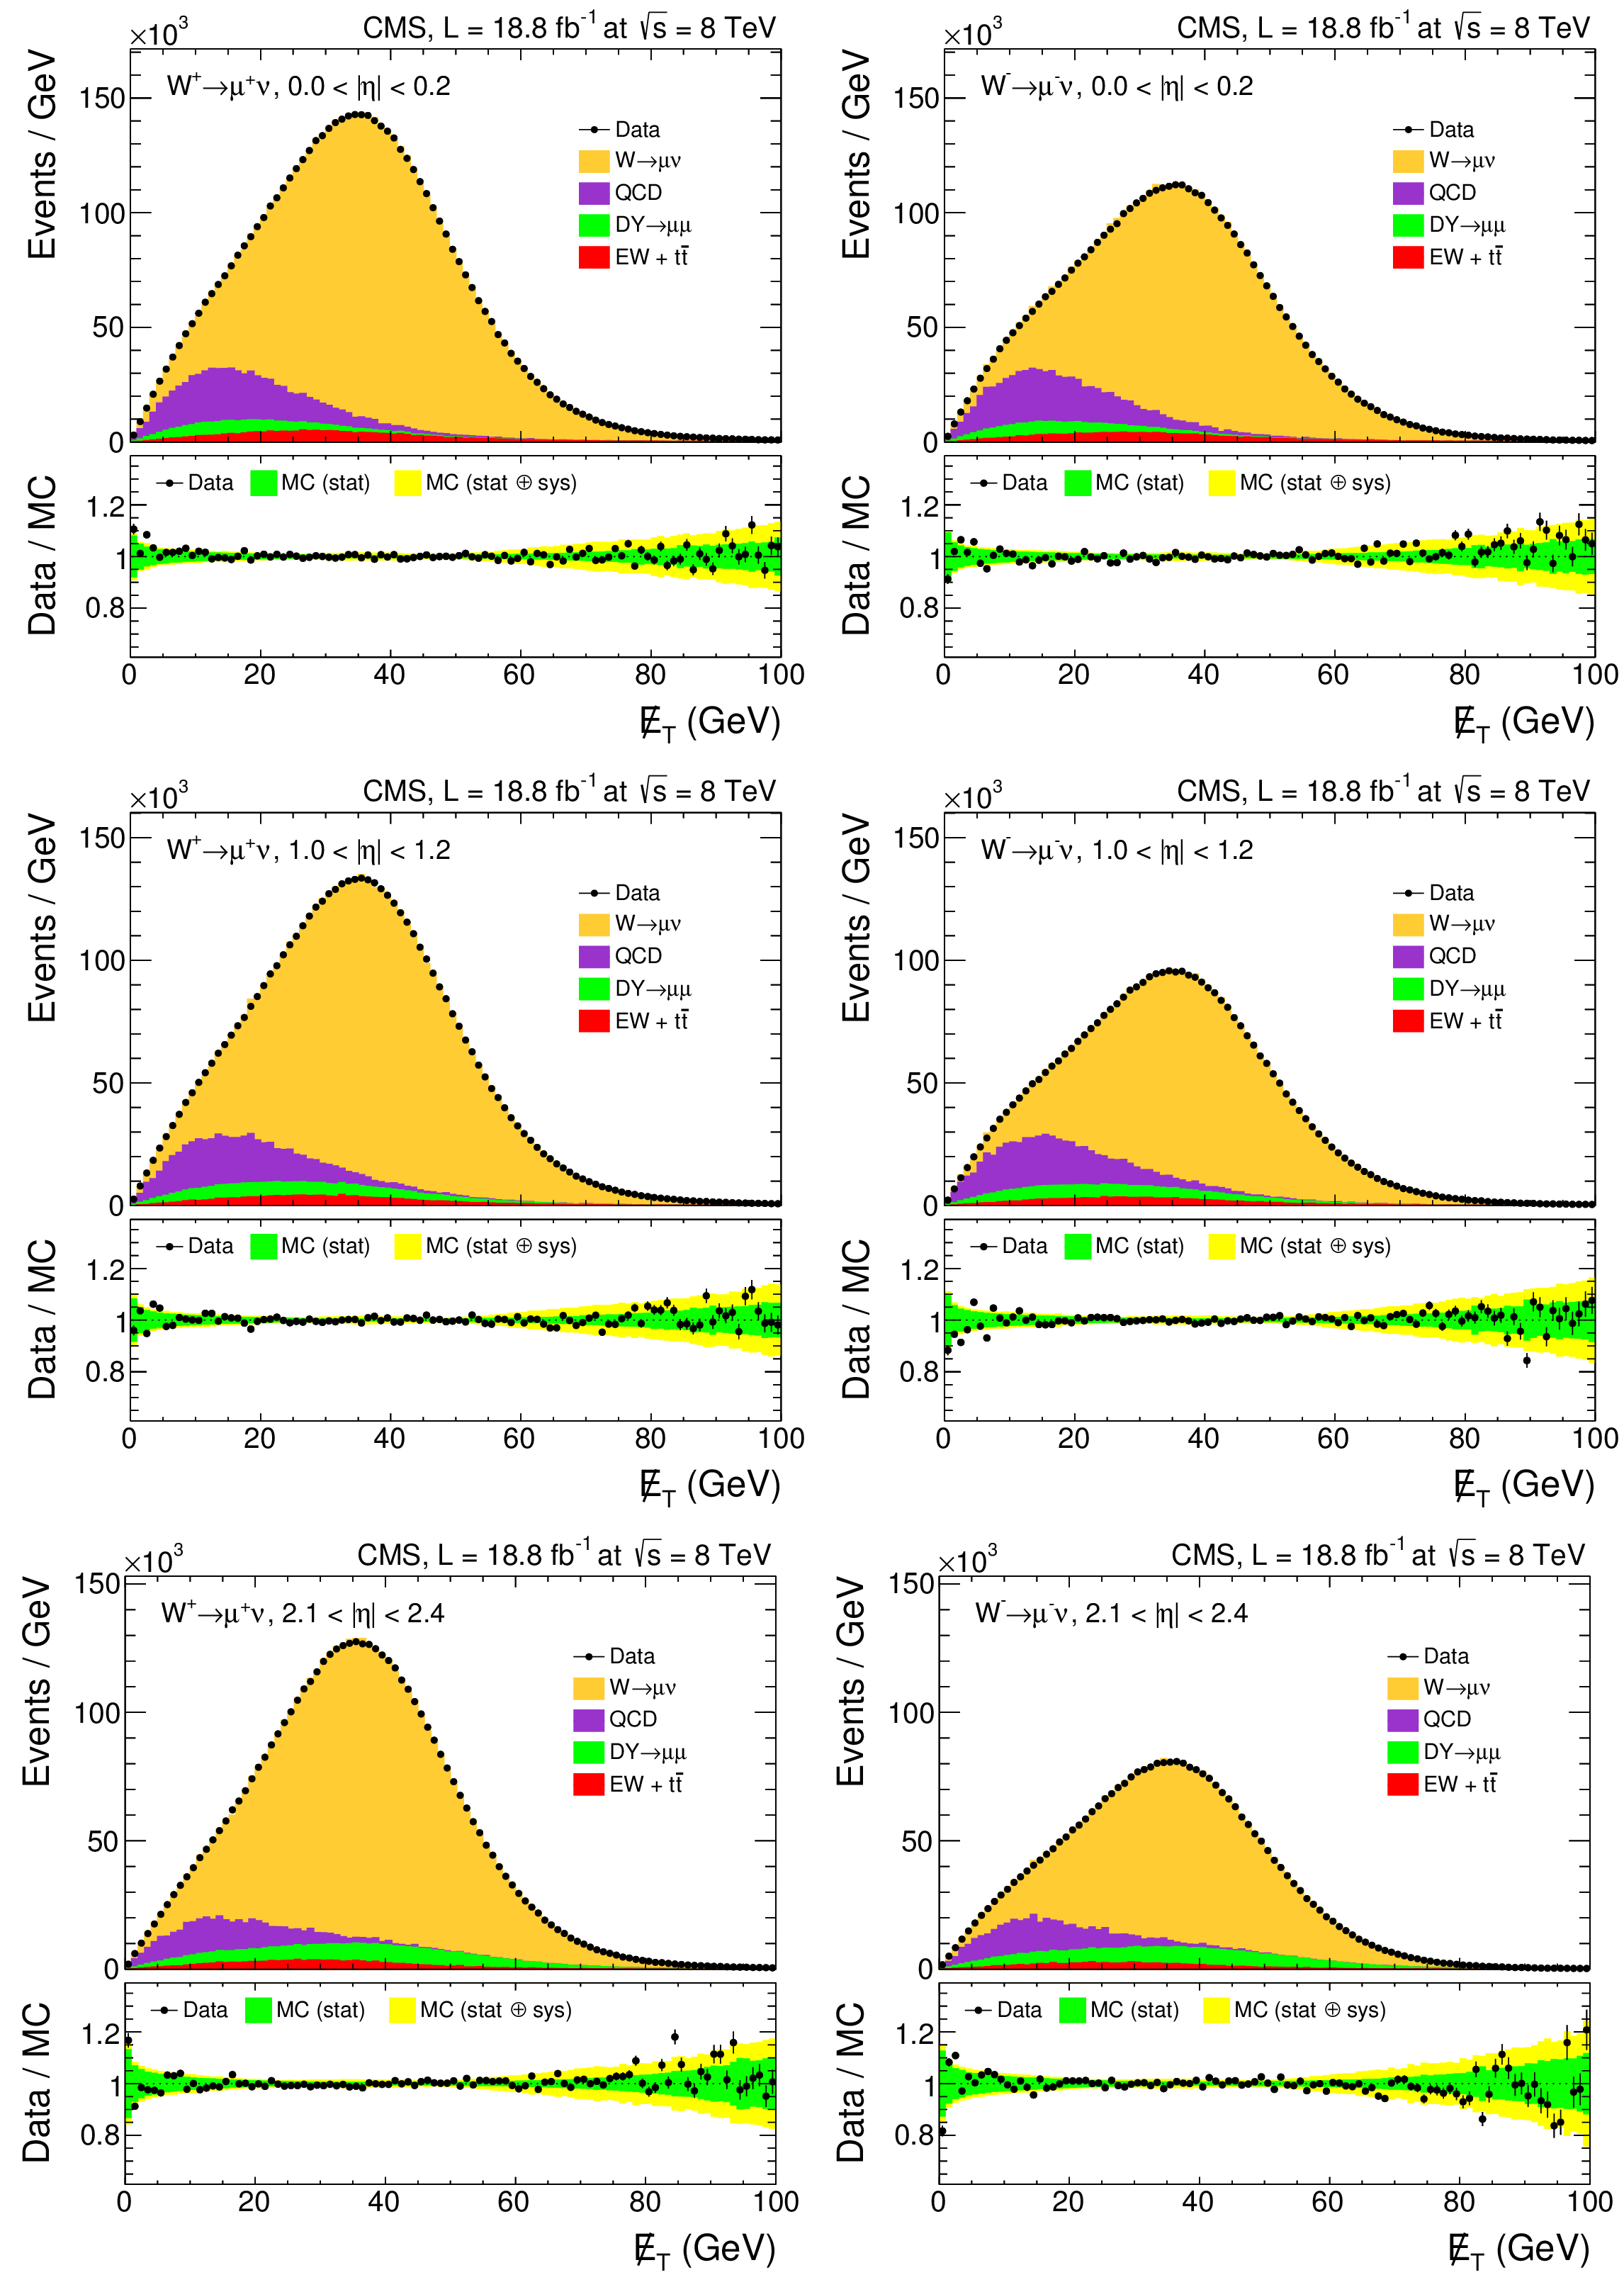
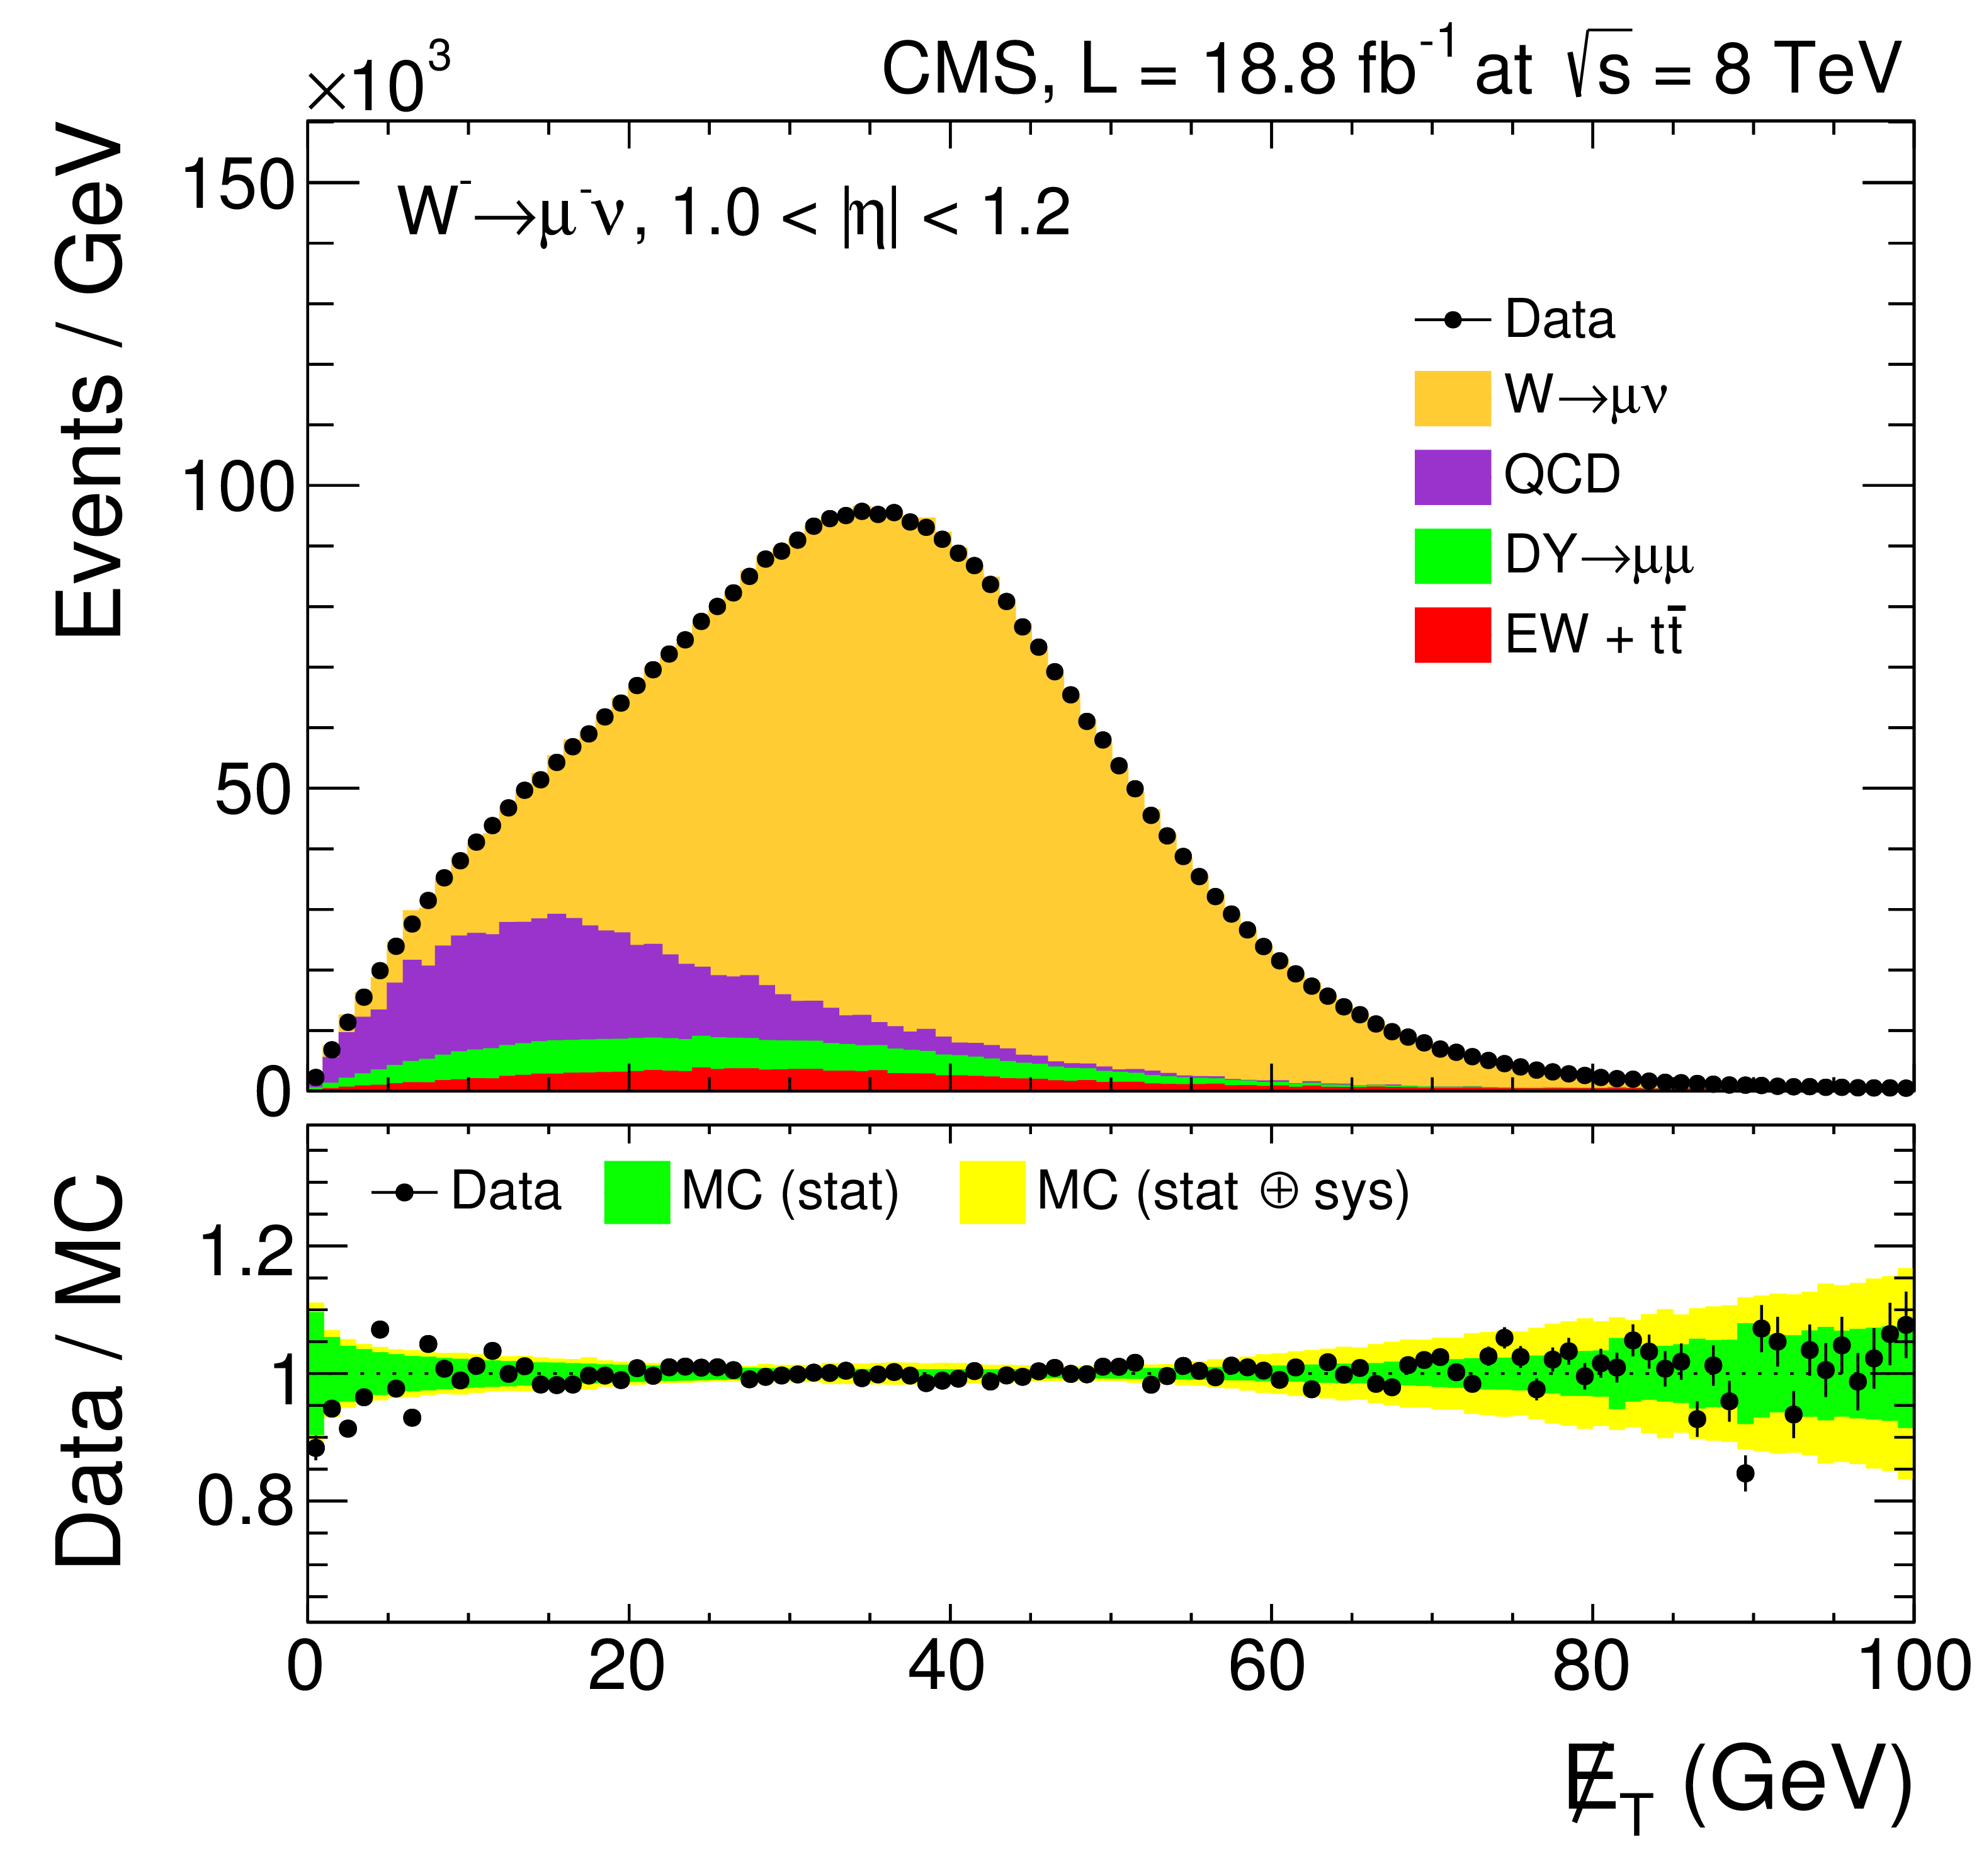
Figure 1:
Examples of fits in three $ { {| \eta | }} $ ranges: 0.0 $ < { {| \eta | }} < $ 0.2 (top), 1.0 $ < { {| \eta | }} < $ 1.2 (center), and 2.1 $ < { {| \eta | }} < $ 2.4 (bottom). For each $\eta $ range, results for $\mathrm{ W^{+} } $ (left) and $\mathrm{ W^{-} } $ (right) are shown. The ratios between the data points and the final fits are shown at the bottom of each panel. |
png pdf |
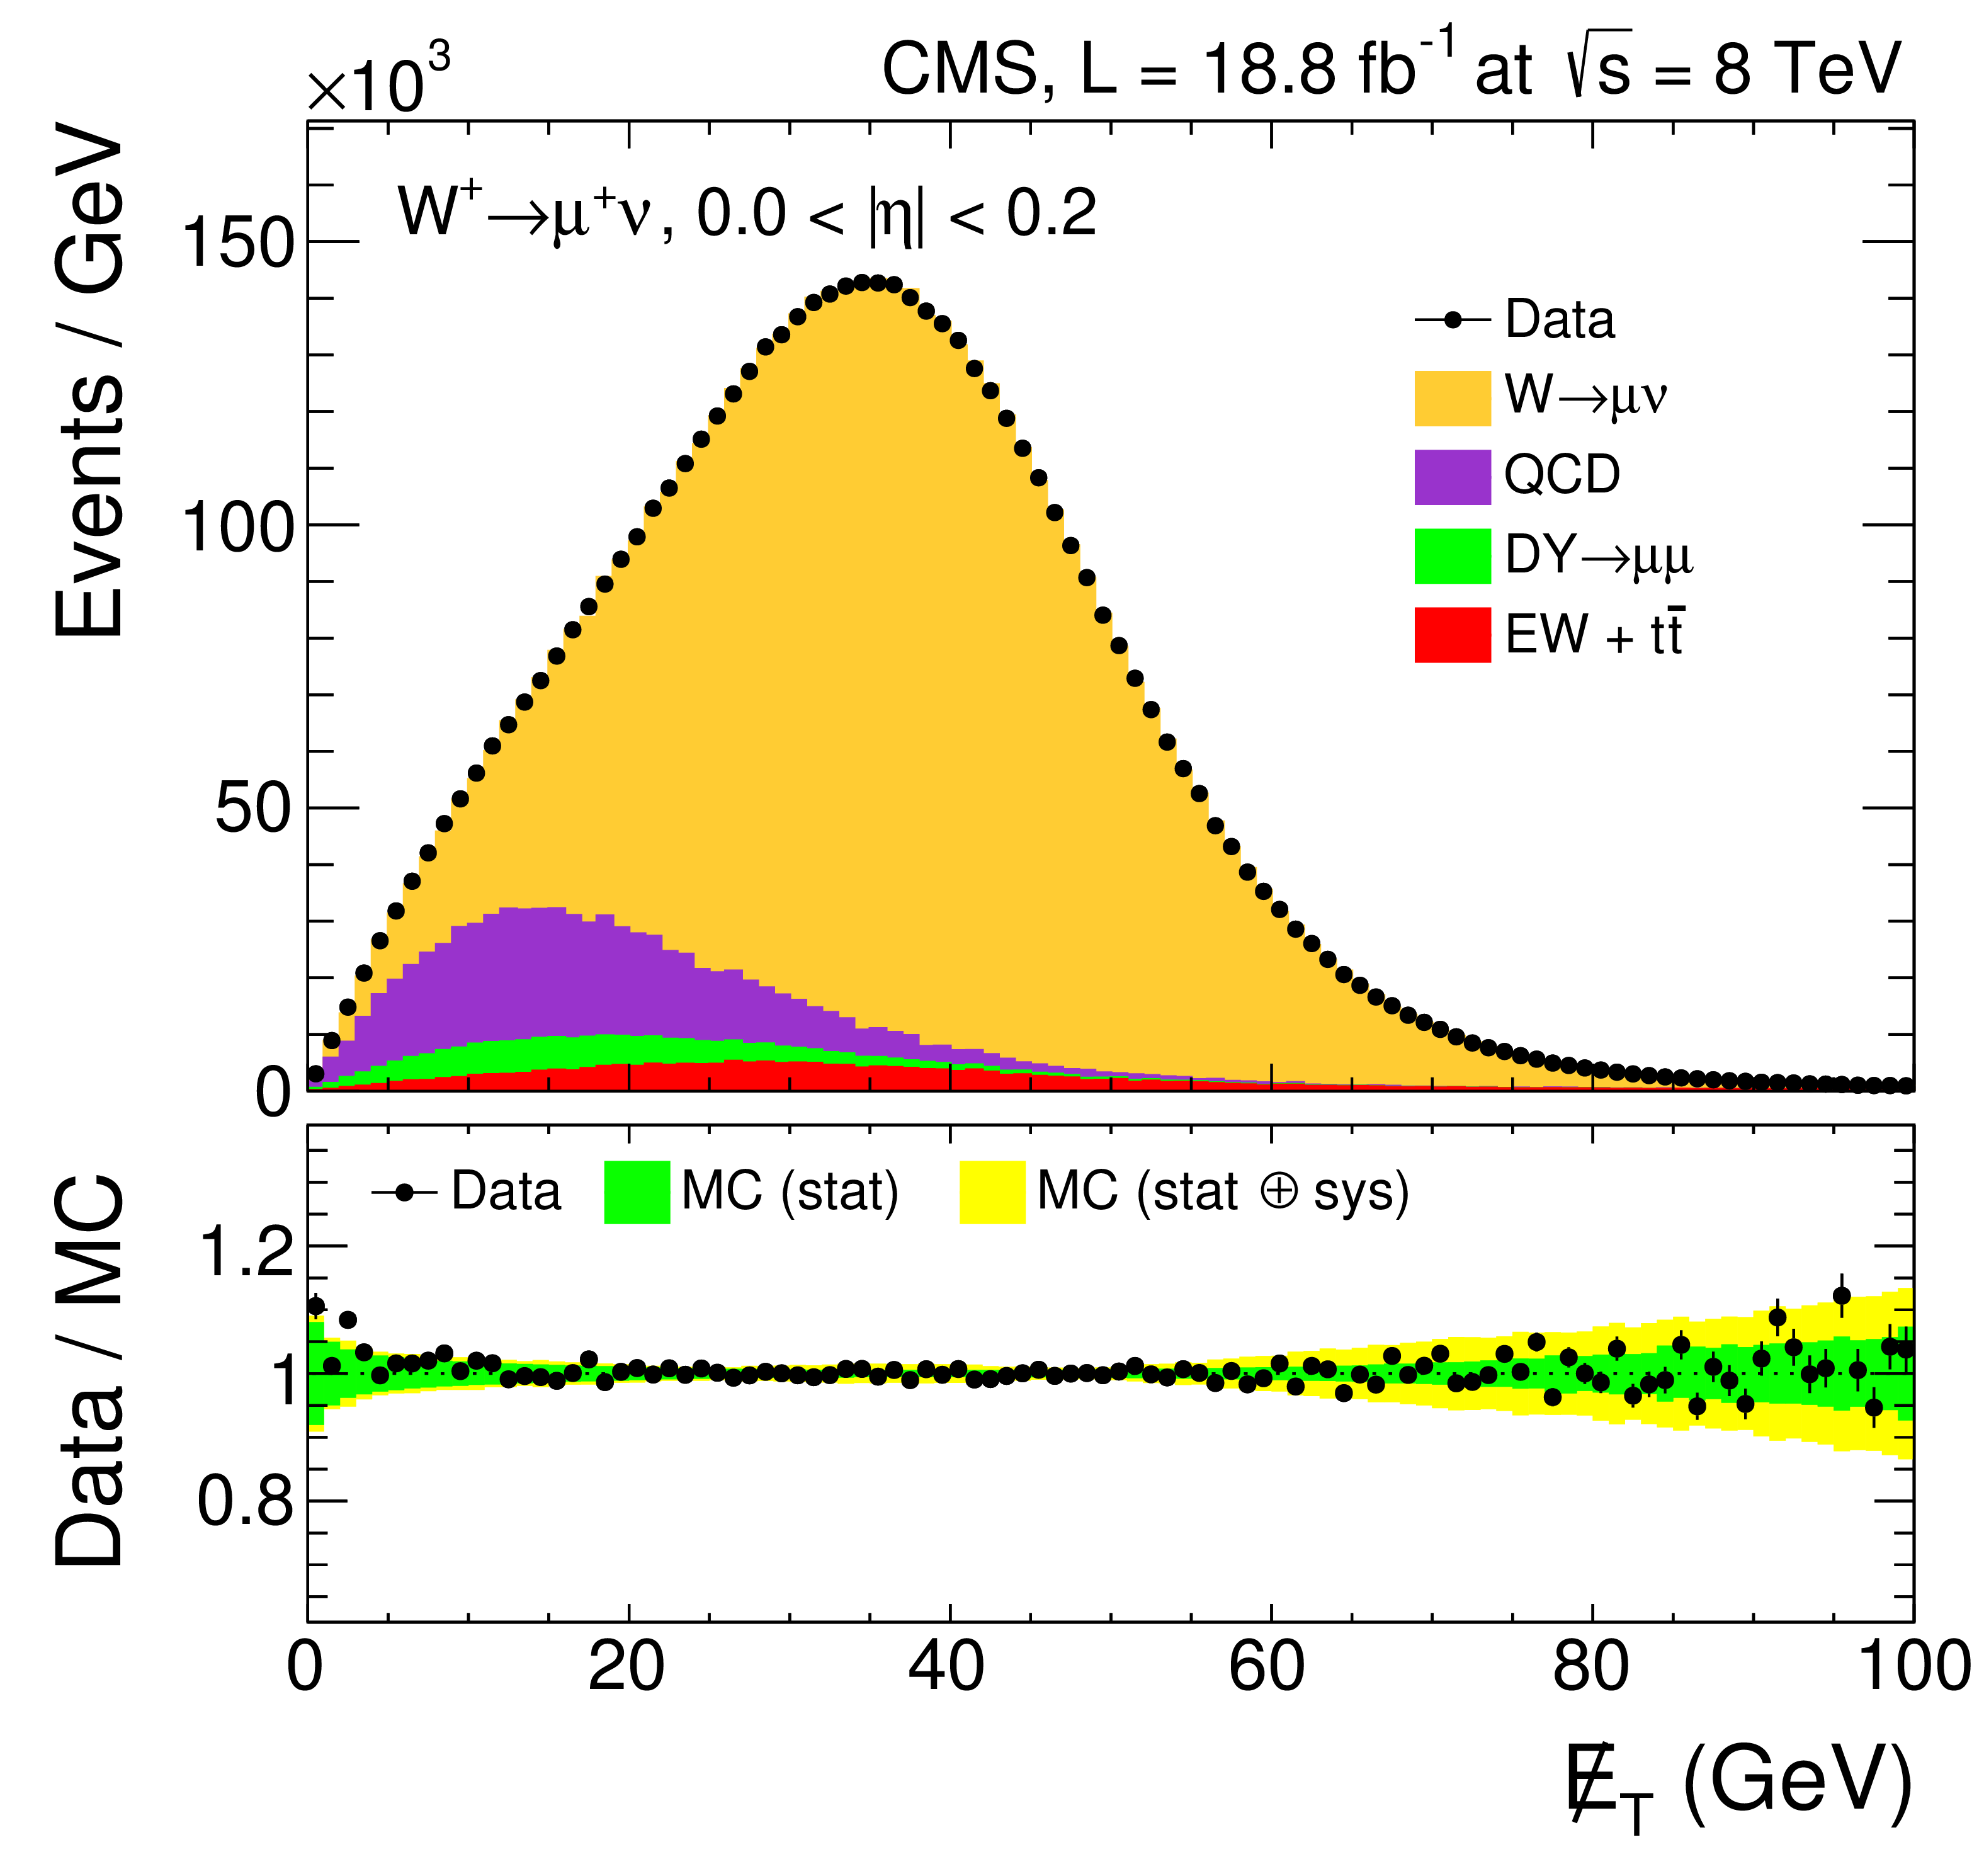
Figure 1-a:
Example of fit for $\mathrm{ W^{+} } $ in $ | \eta | $ range 0.0 $ < { {| \eta | }} < $ 0.2. The ratios between the data points and the final fits are shown at the bottom of each panel. |
png pdf |
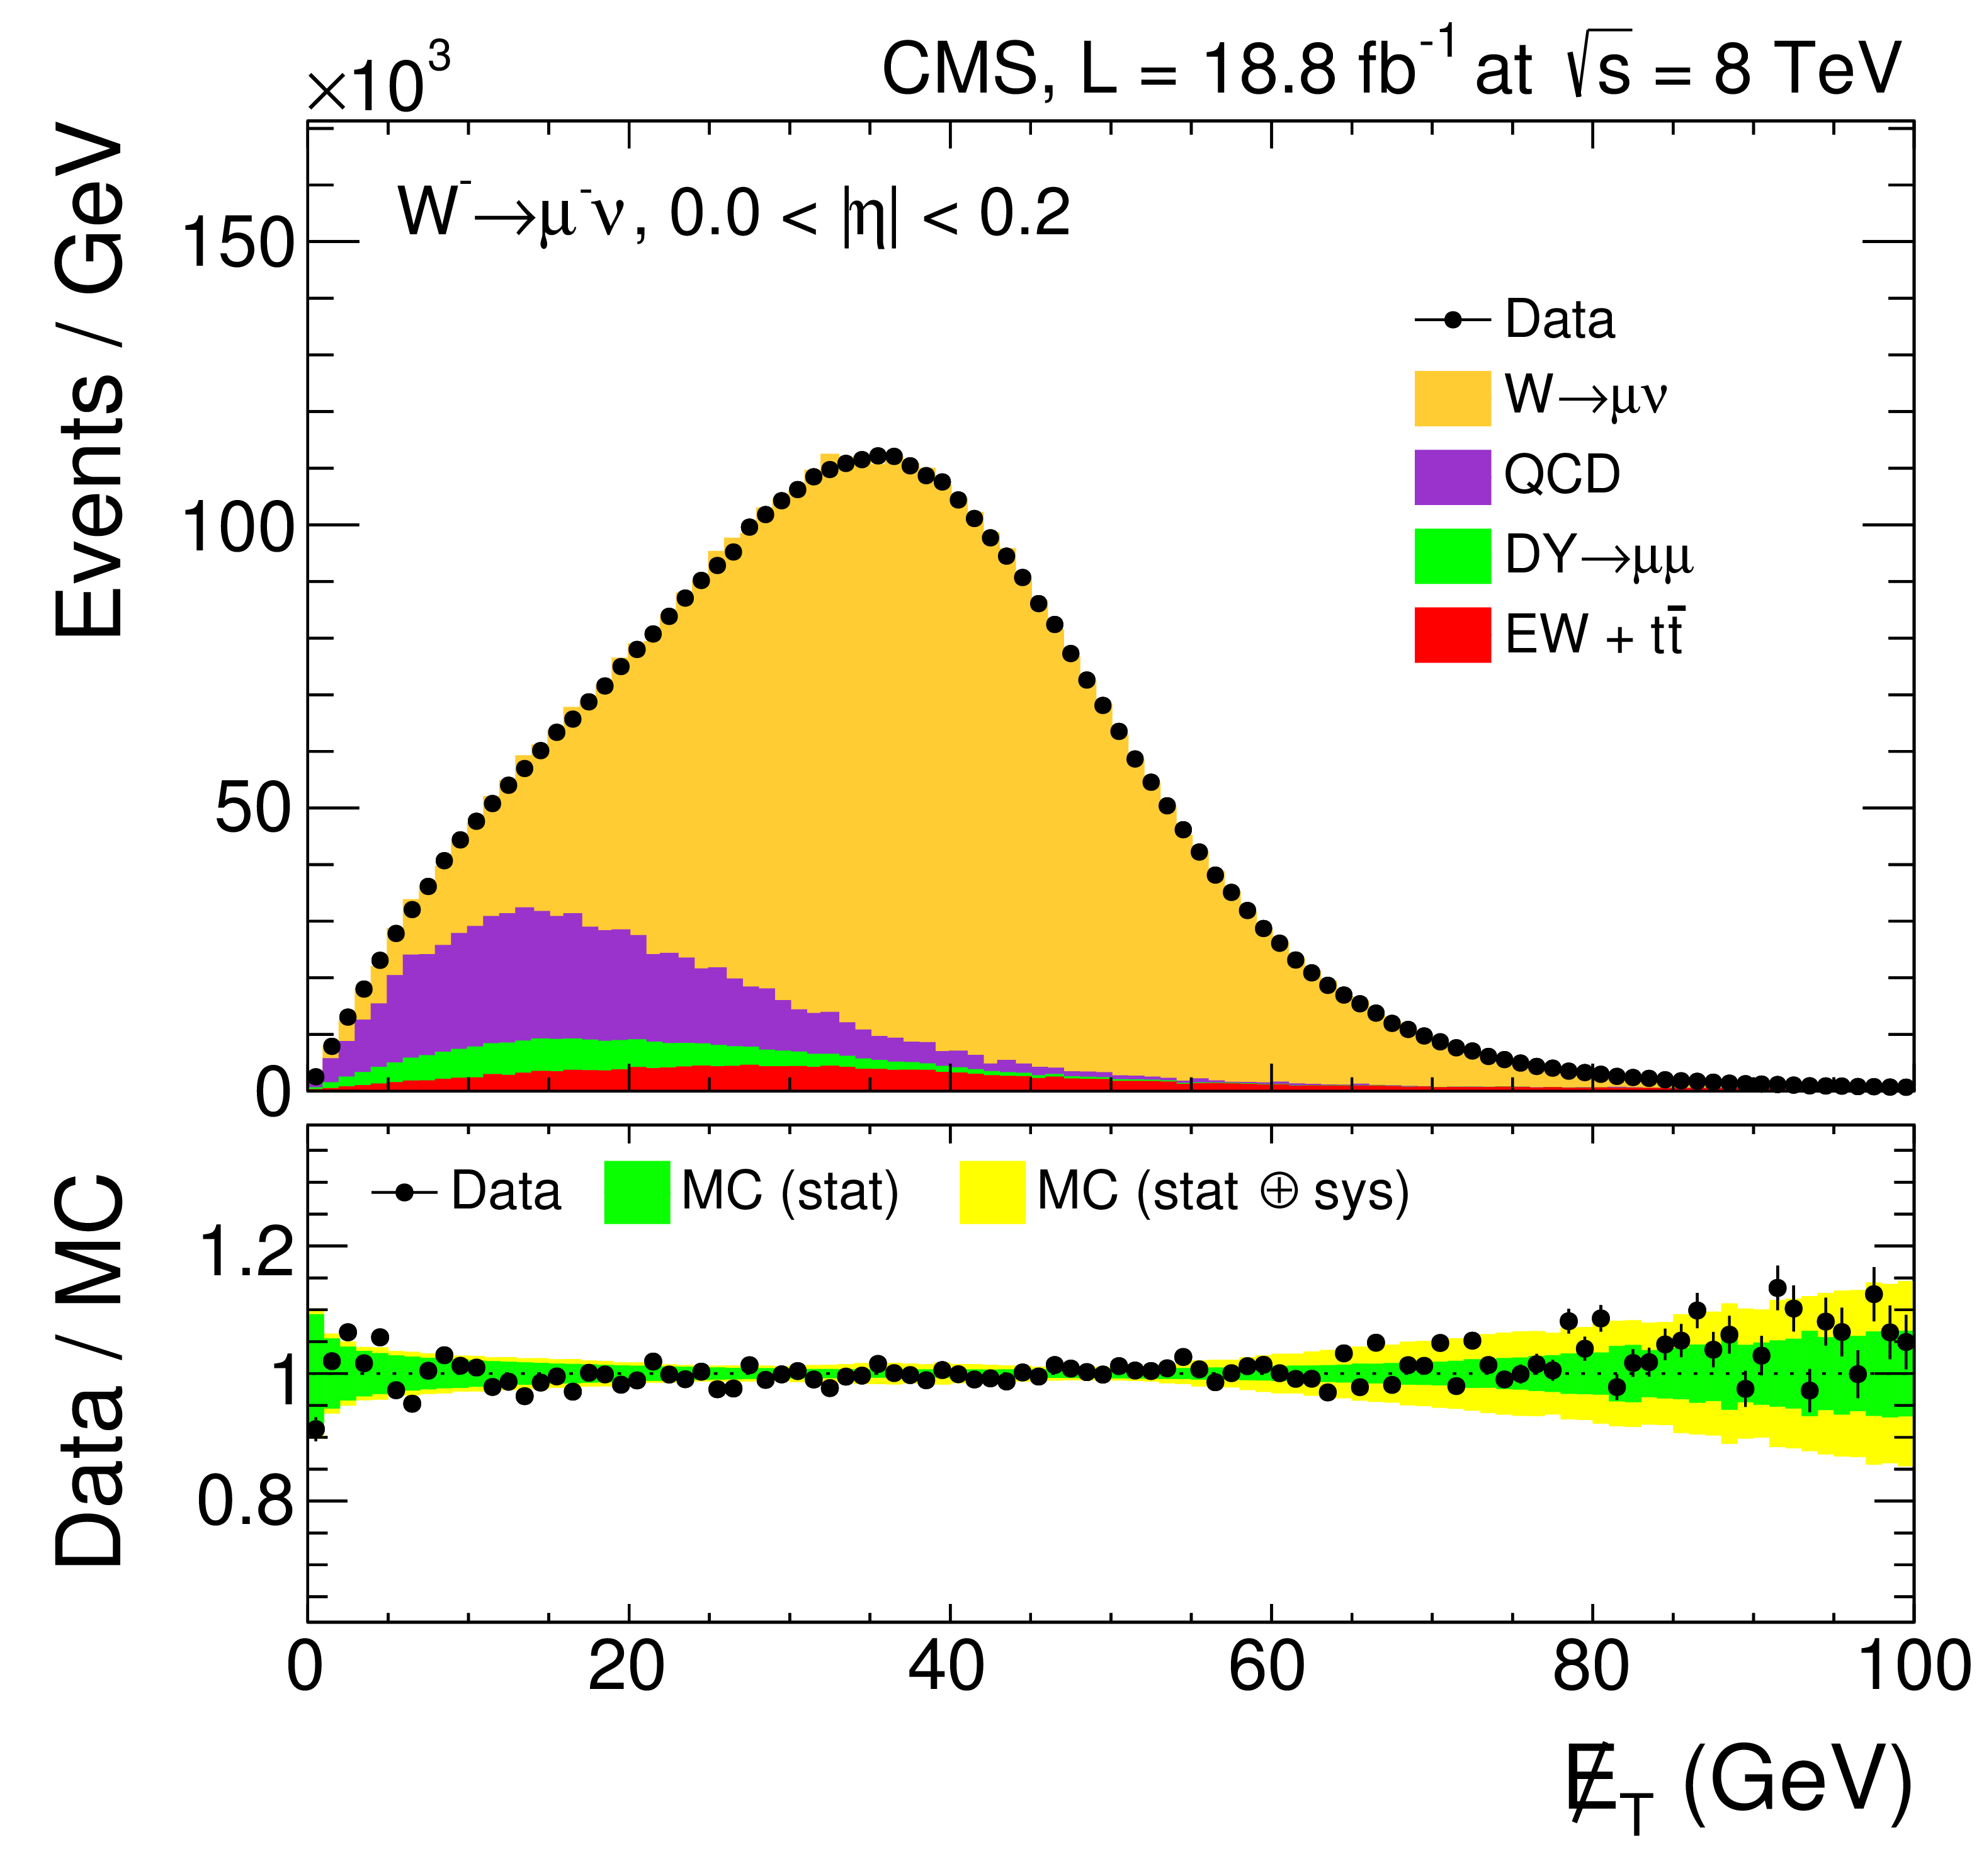
Figure 1-b:
Example of fit for $\mathrm{ W^{-} } $ in $ | \eta | $ range 0.0 $ < { {| \eta | }} < $ 0.2. The ratios between the data points and the final fits are shown at the bottom of each panel. |
png pdf |
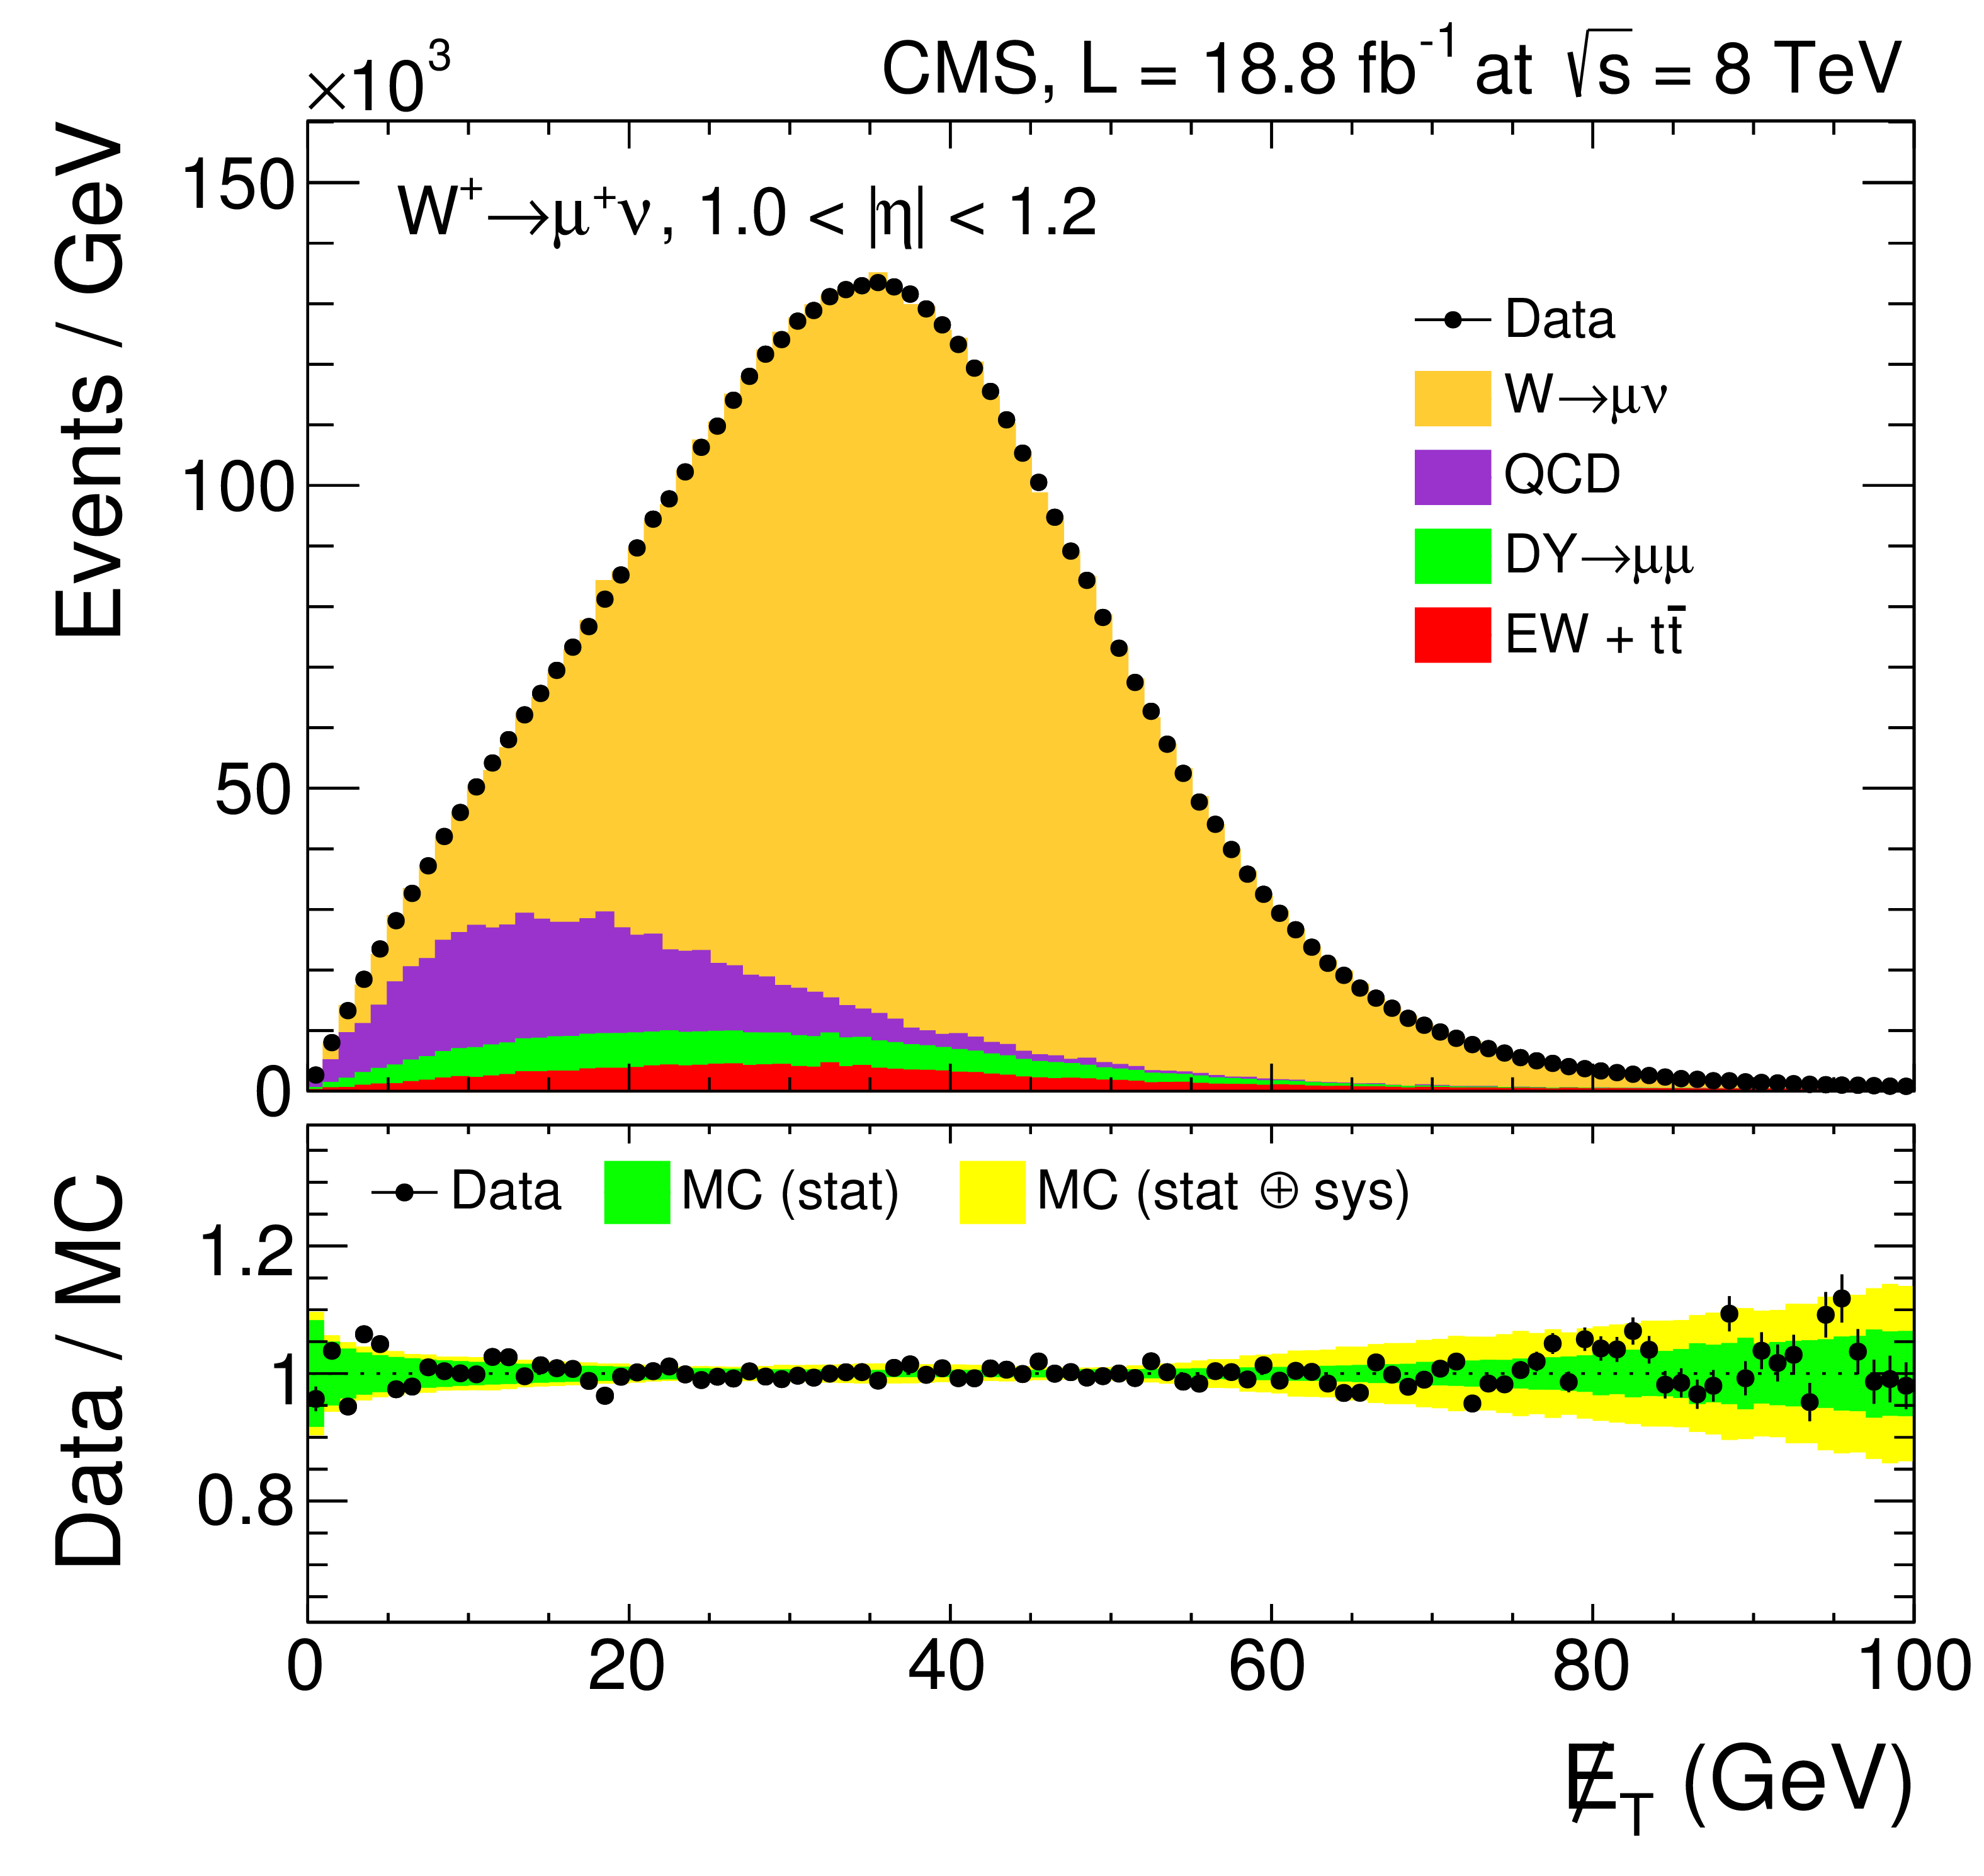
Figure 1-c:
Example of fit for $\mathrm{ W^{+} } $ in 1.0 $ < { {| \eta | }} < $ 1.2. The ratios between the data points and the final fits are shown at the bottom of each panel. |
png pdf |
Figure 1-d:
Example of fit for $\mathrm{ W^{-} } $ in 1.0 $ < { {| \eta | }} < $ 1.2. The ratios between the data points and the final fits are shown at the bottom of each panel. |
png pdf |
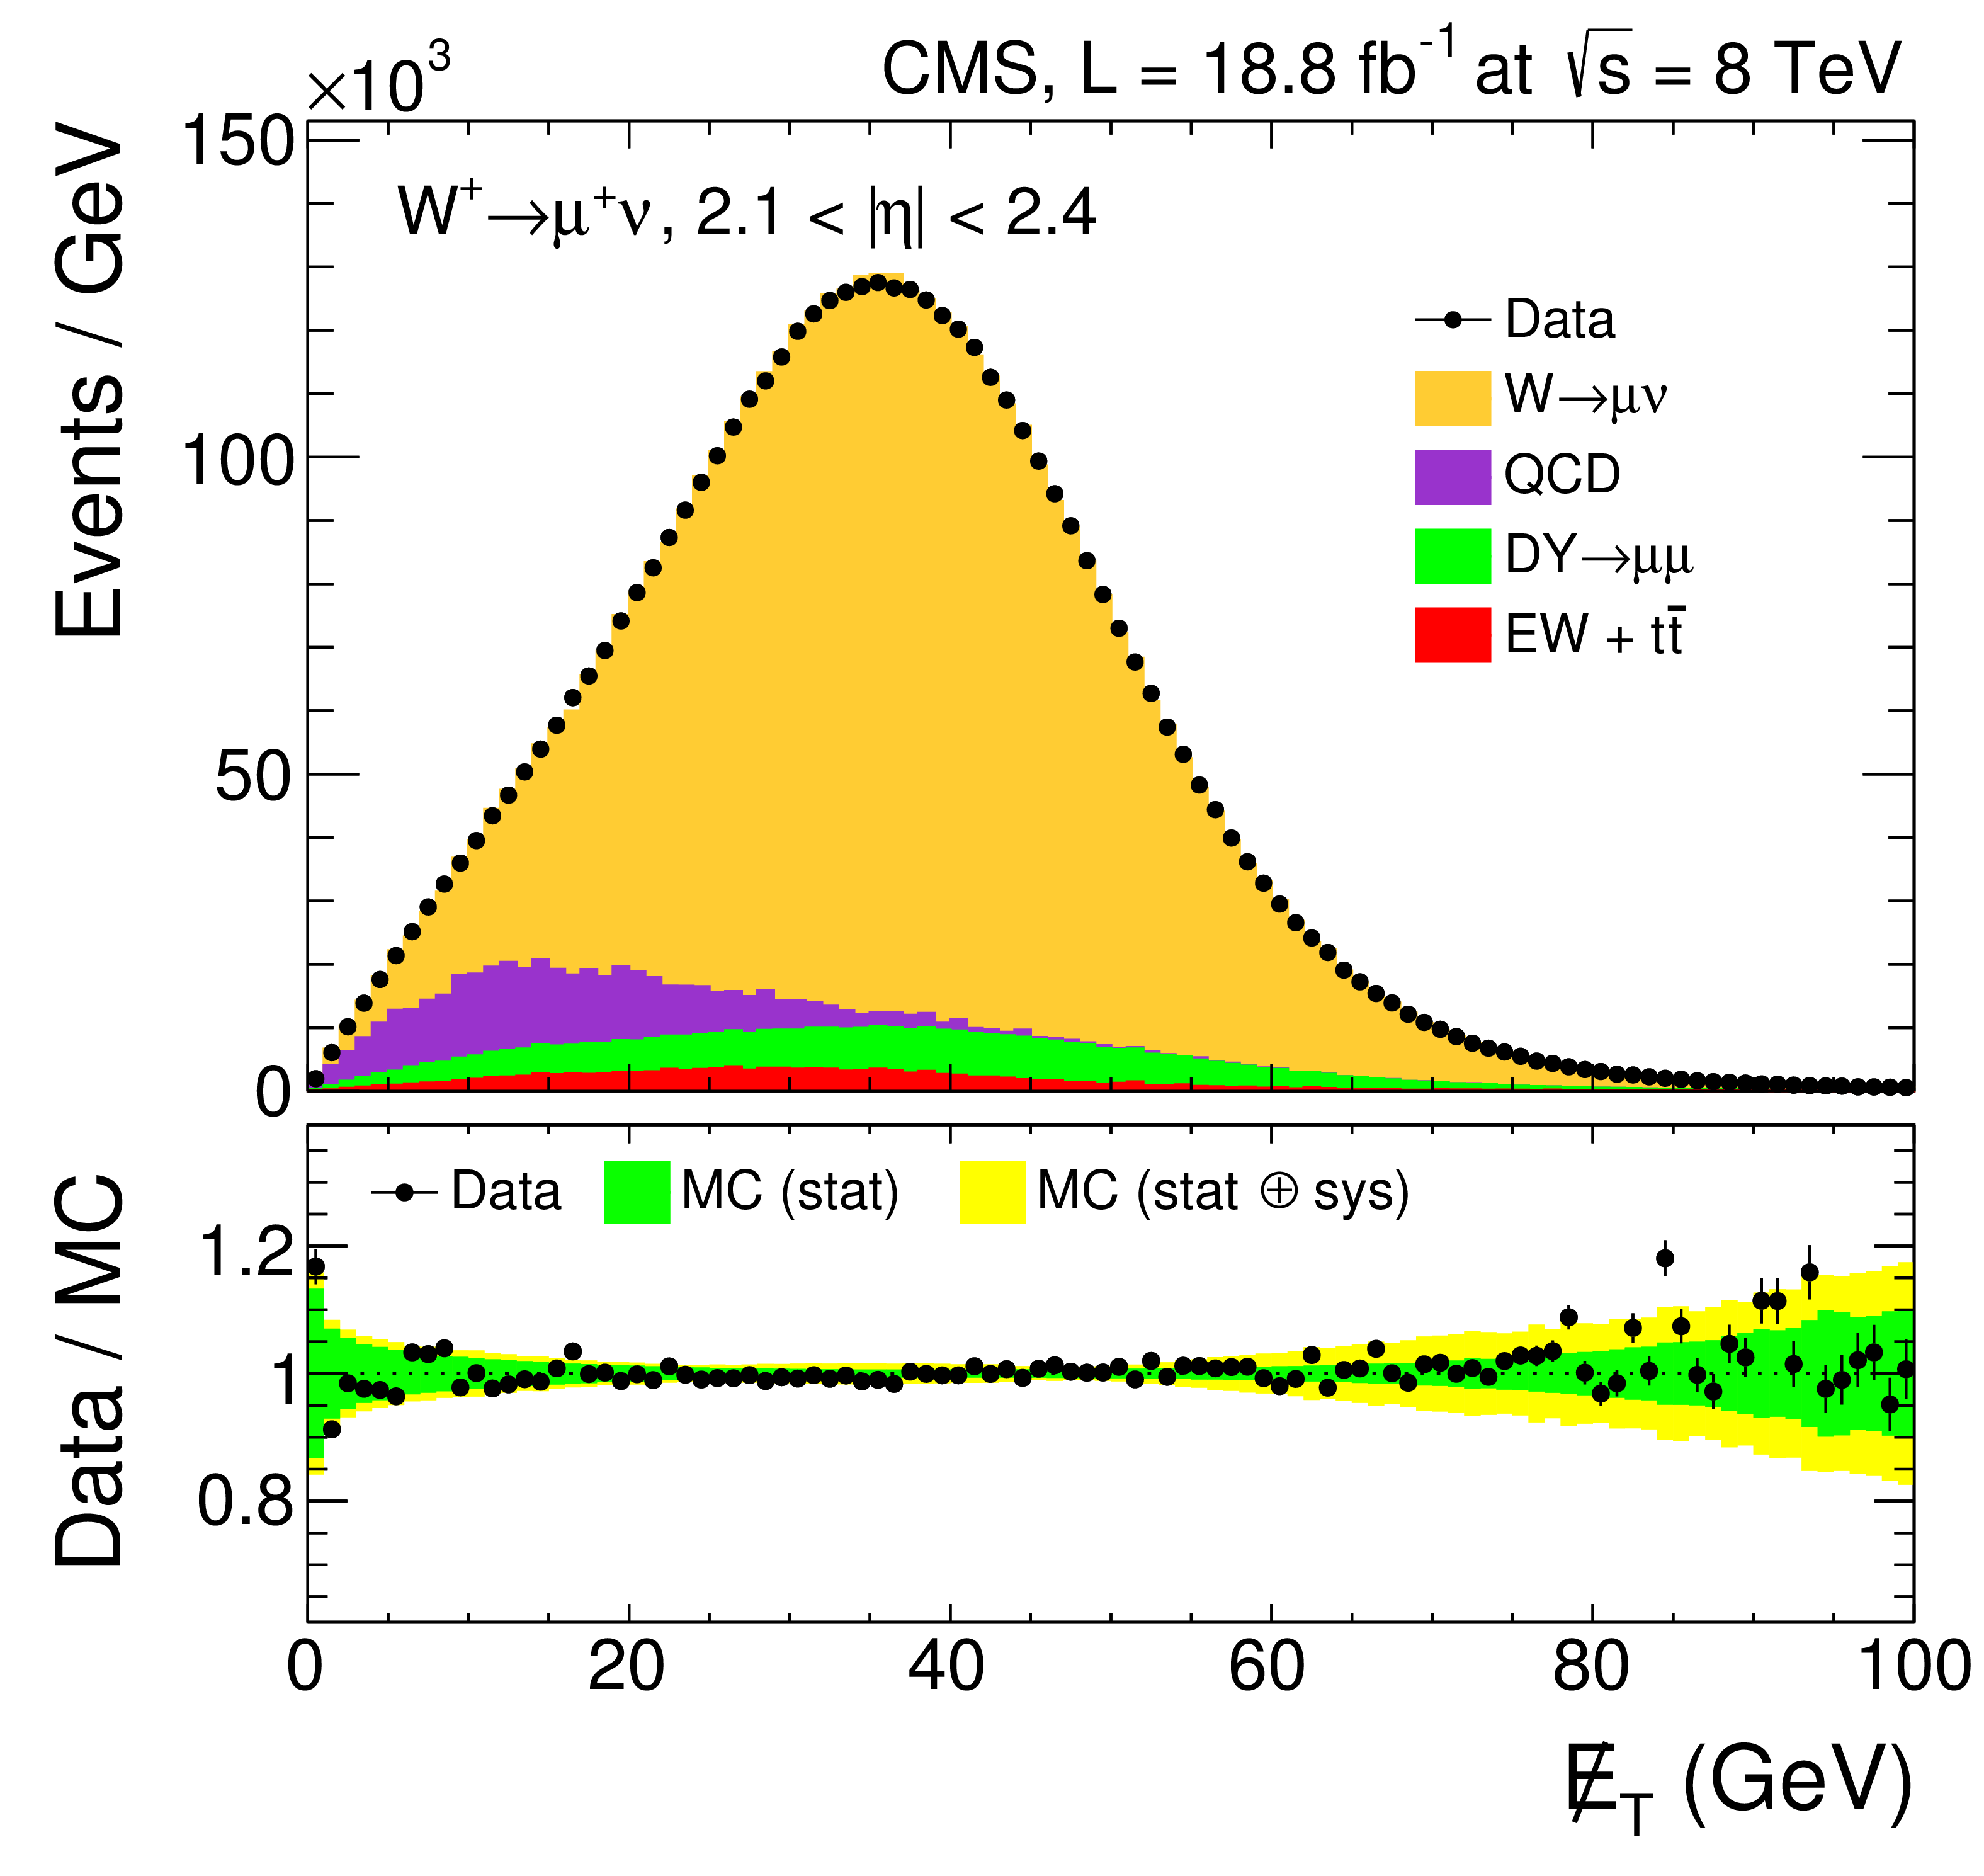
Figure 1-e:
Example of fit for $\mathrm{ W^{+} } $ in 2.1 $ < { {| \eta | }} < $ 2.4. The ratios between the data points and the final fits are shown at the bottom of each panel. |
png pdf |
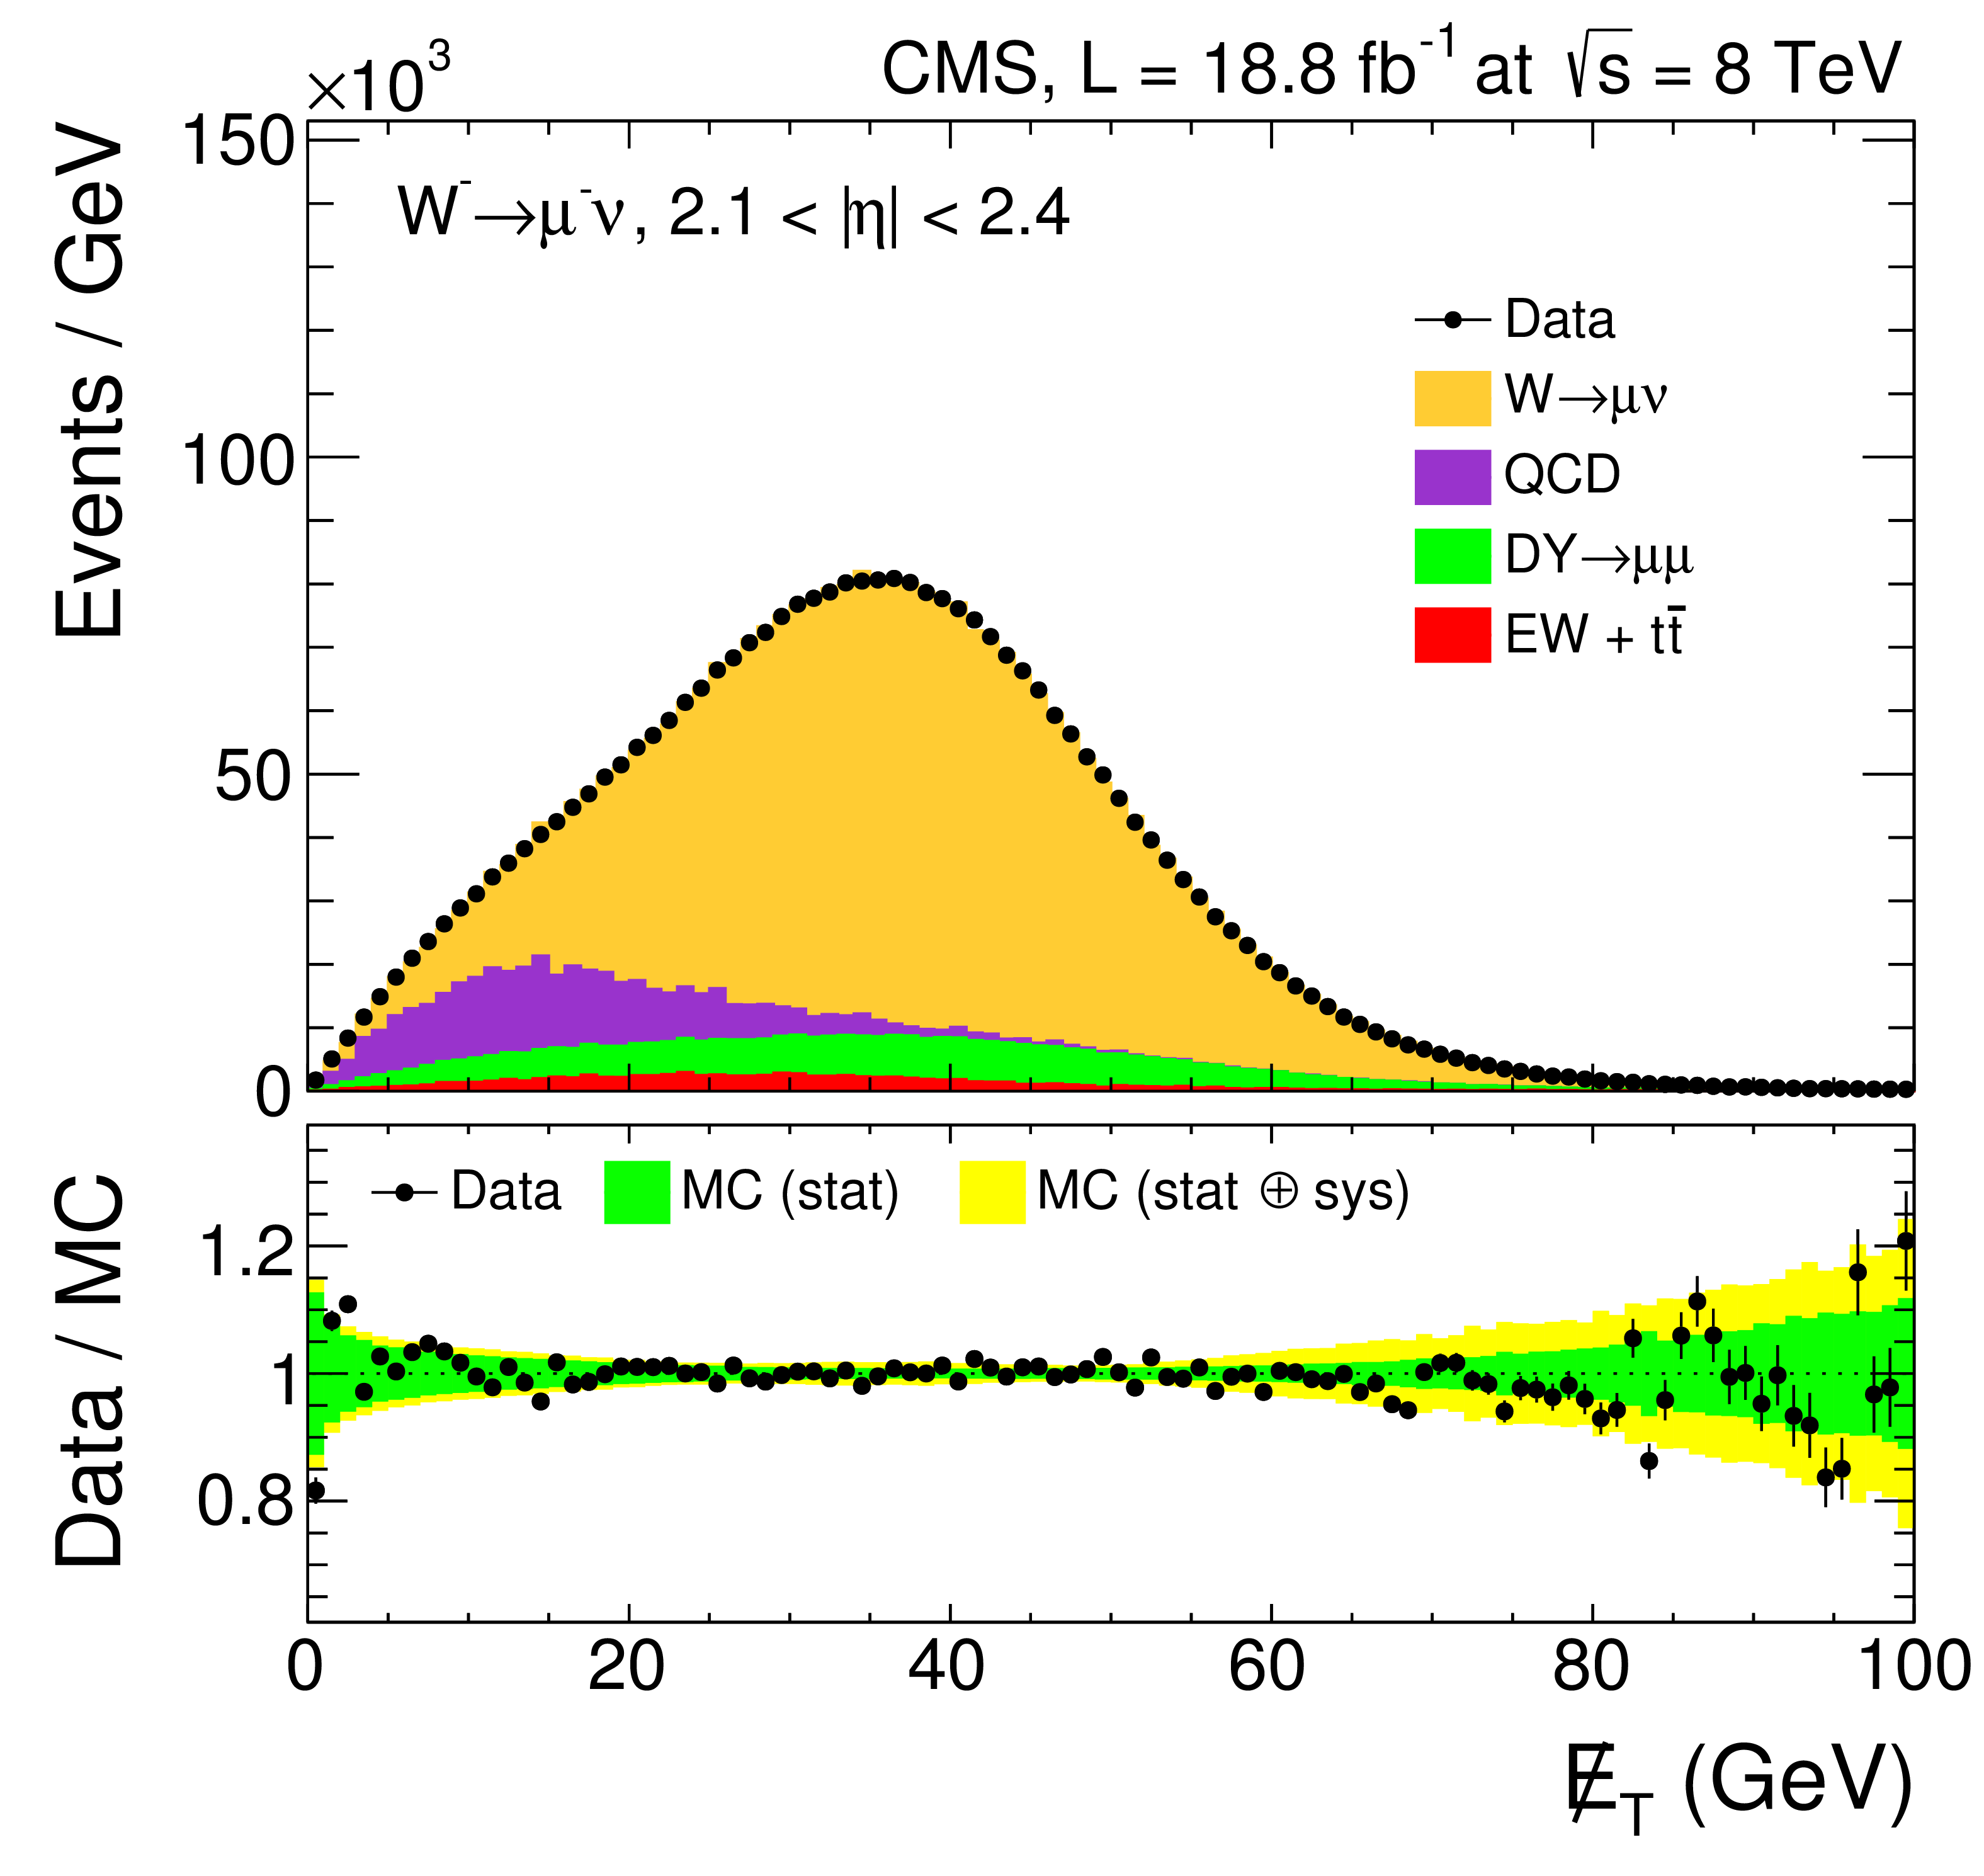
Figure 1-f:
Example of fit for $\mathrm{ W^{-} } $ in 2.1 $ < { {| \eta | }} < $ 2.4. The ratios between the data points and the final fits are shown at the bottom of each panel. |
png pdf |
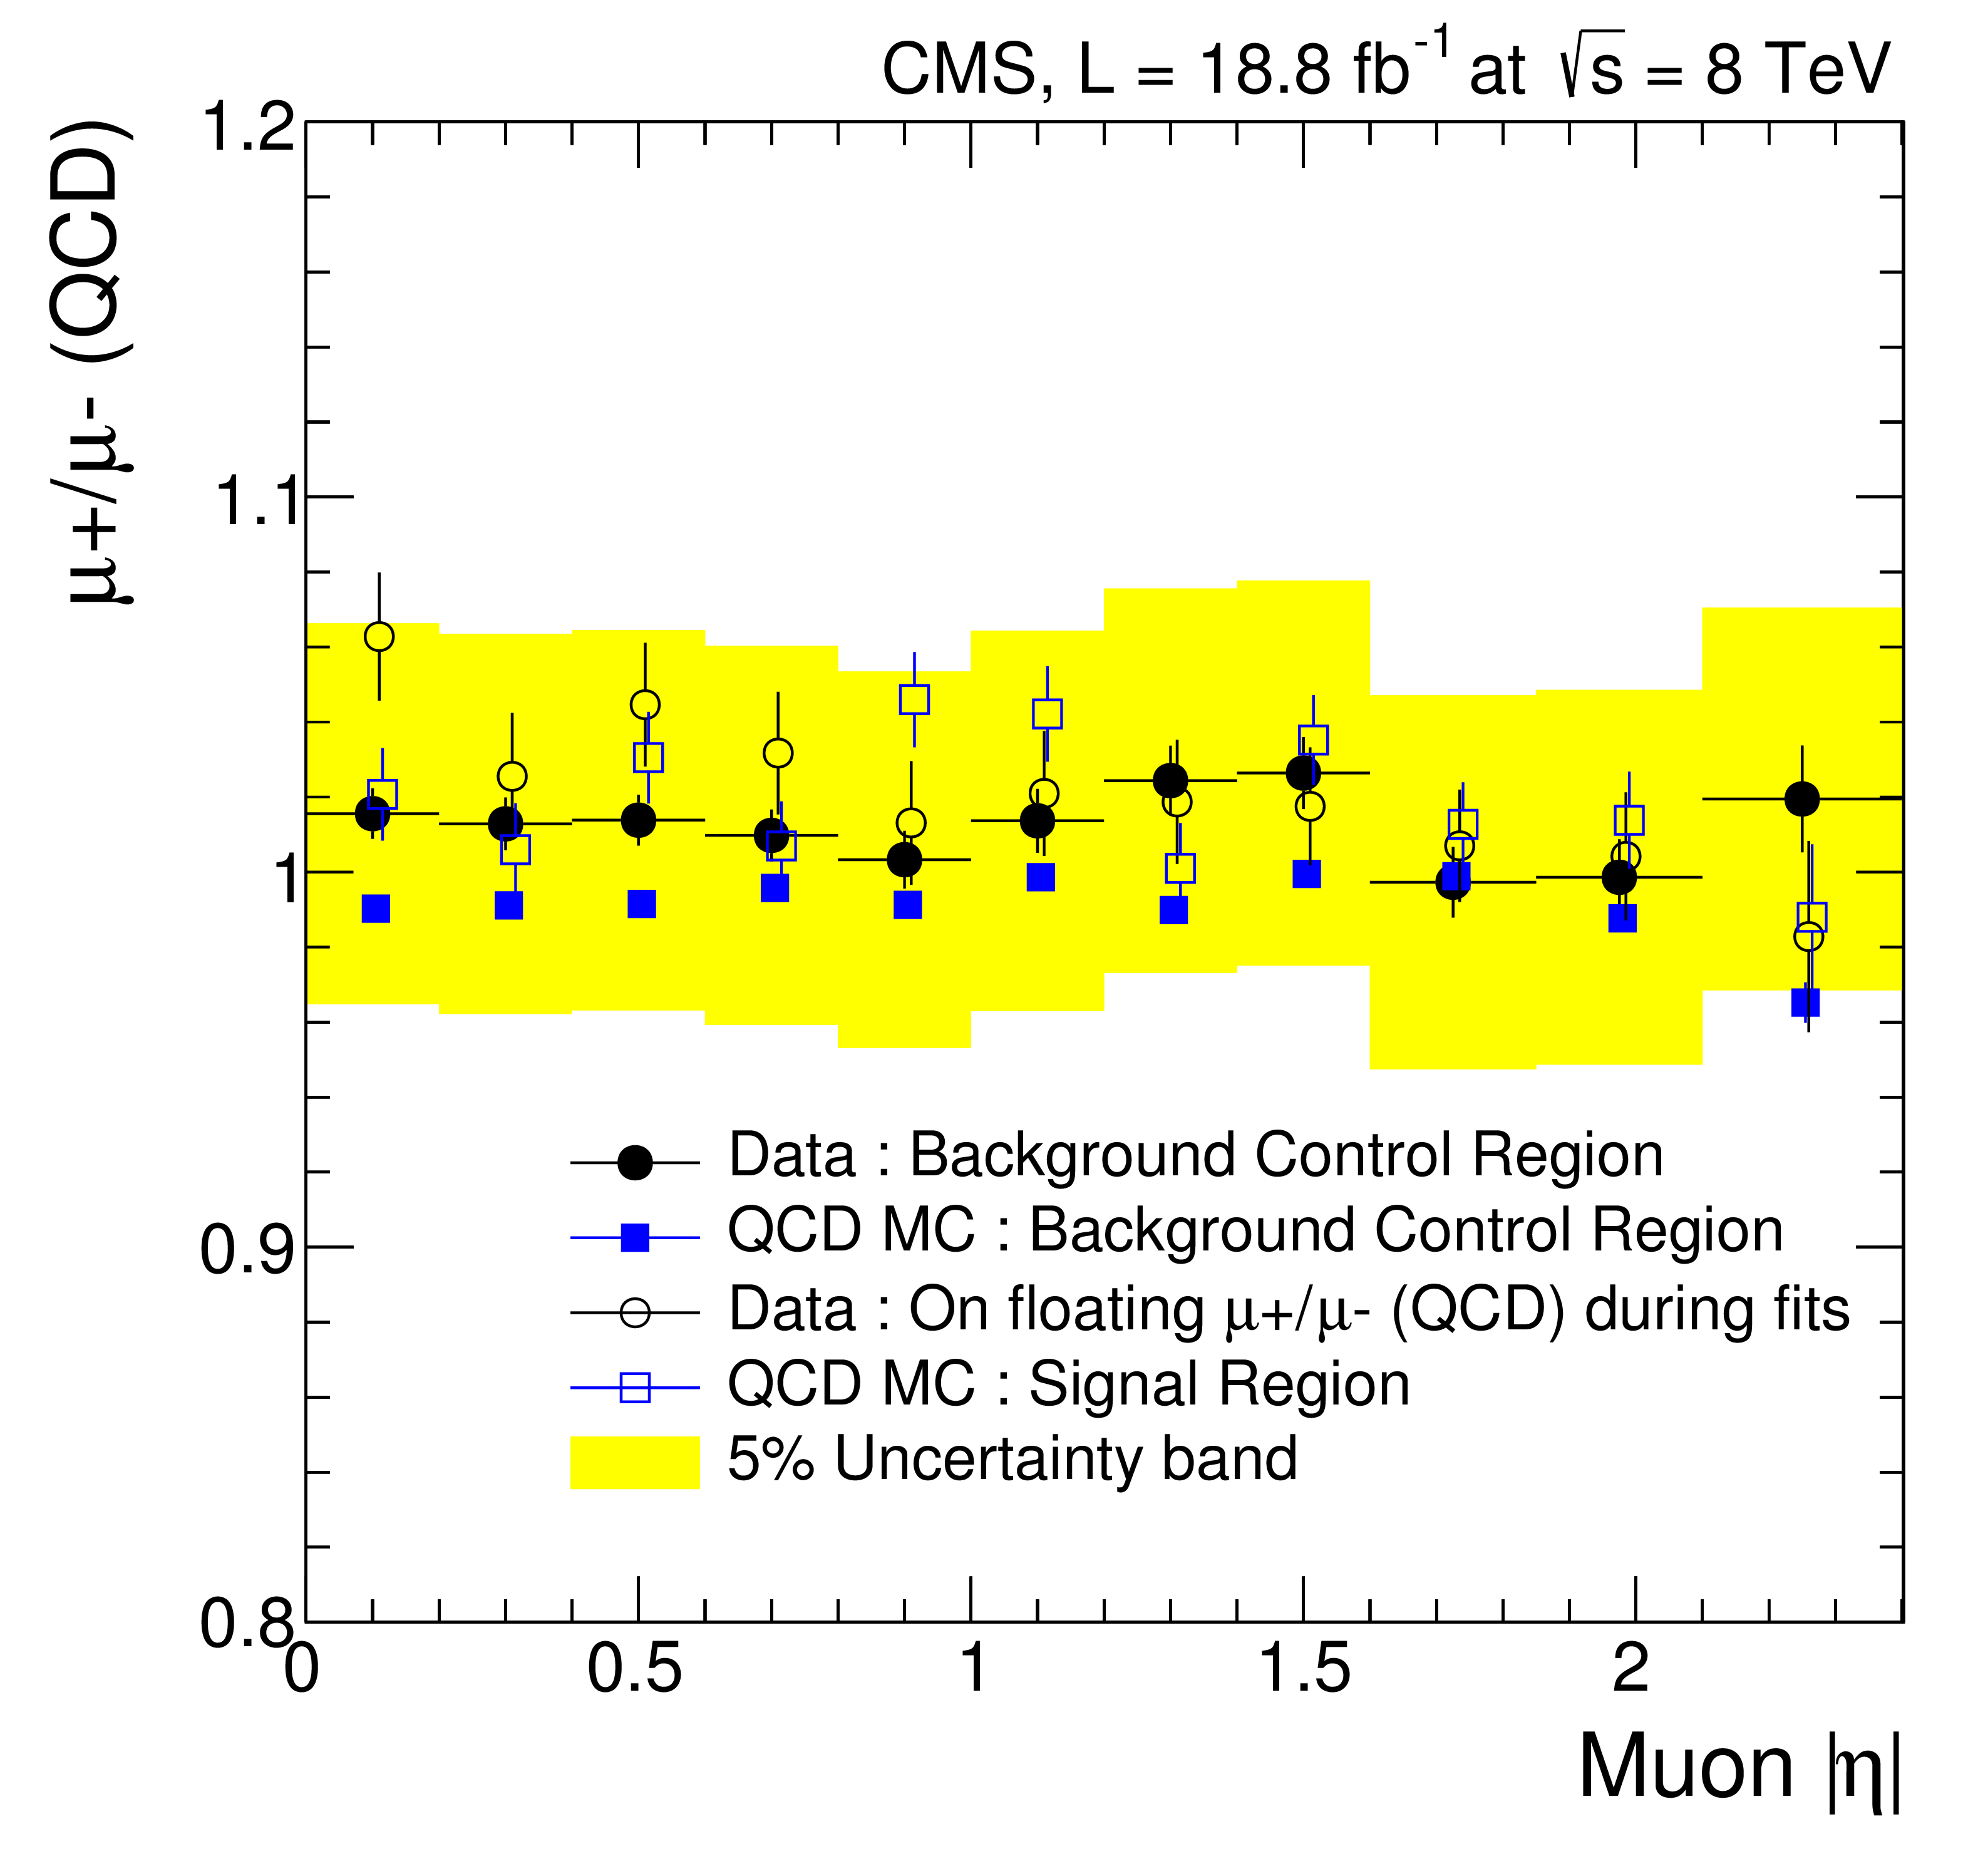
Figure 2:
Distribution of ${R_{\pm }^{\mathrm {QCD}}}$ in QCD control region for data (solid circles), QCD control region for simulation (solid squares), and signal region for simulation (open squares). Open circles show the ${R_{\pm }^{\mathrm {QCD}}}$distribution when QCD contributions in $ {\mathrm {W^+}}$ and $ {\mathrm {W^-}}$ events are not constrained. Shaded area indicates assigned systematic uncertainty. |
png pdf |
Figure 3:
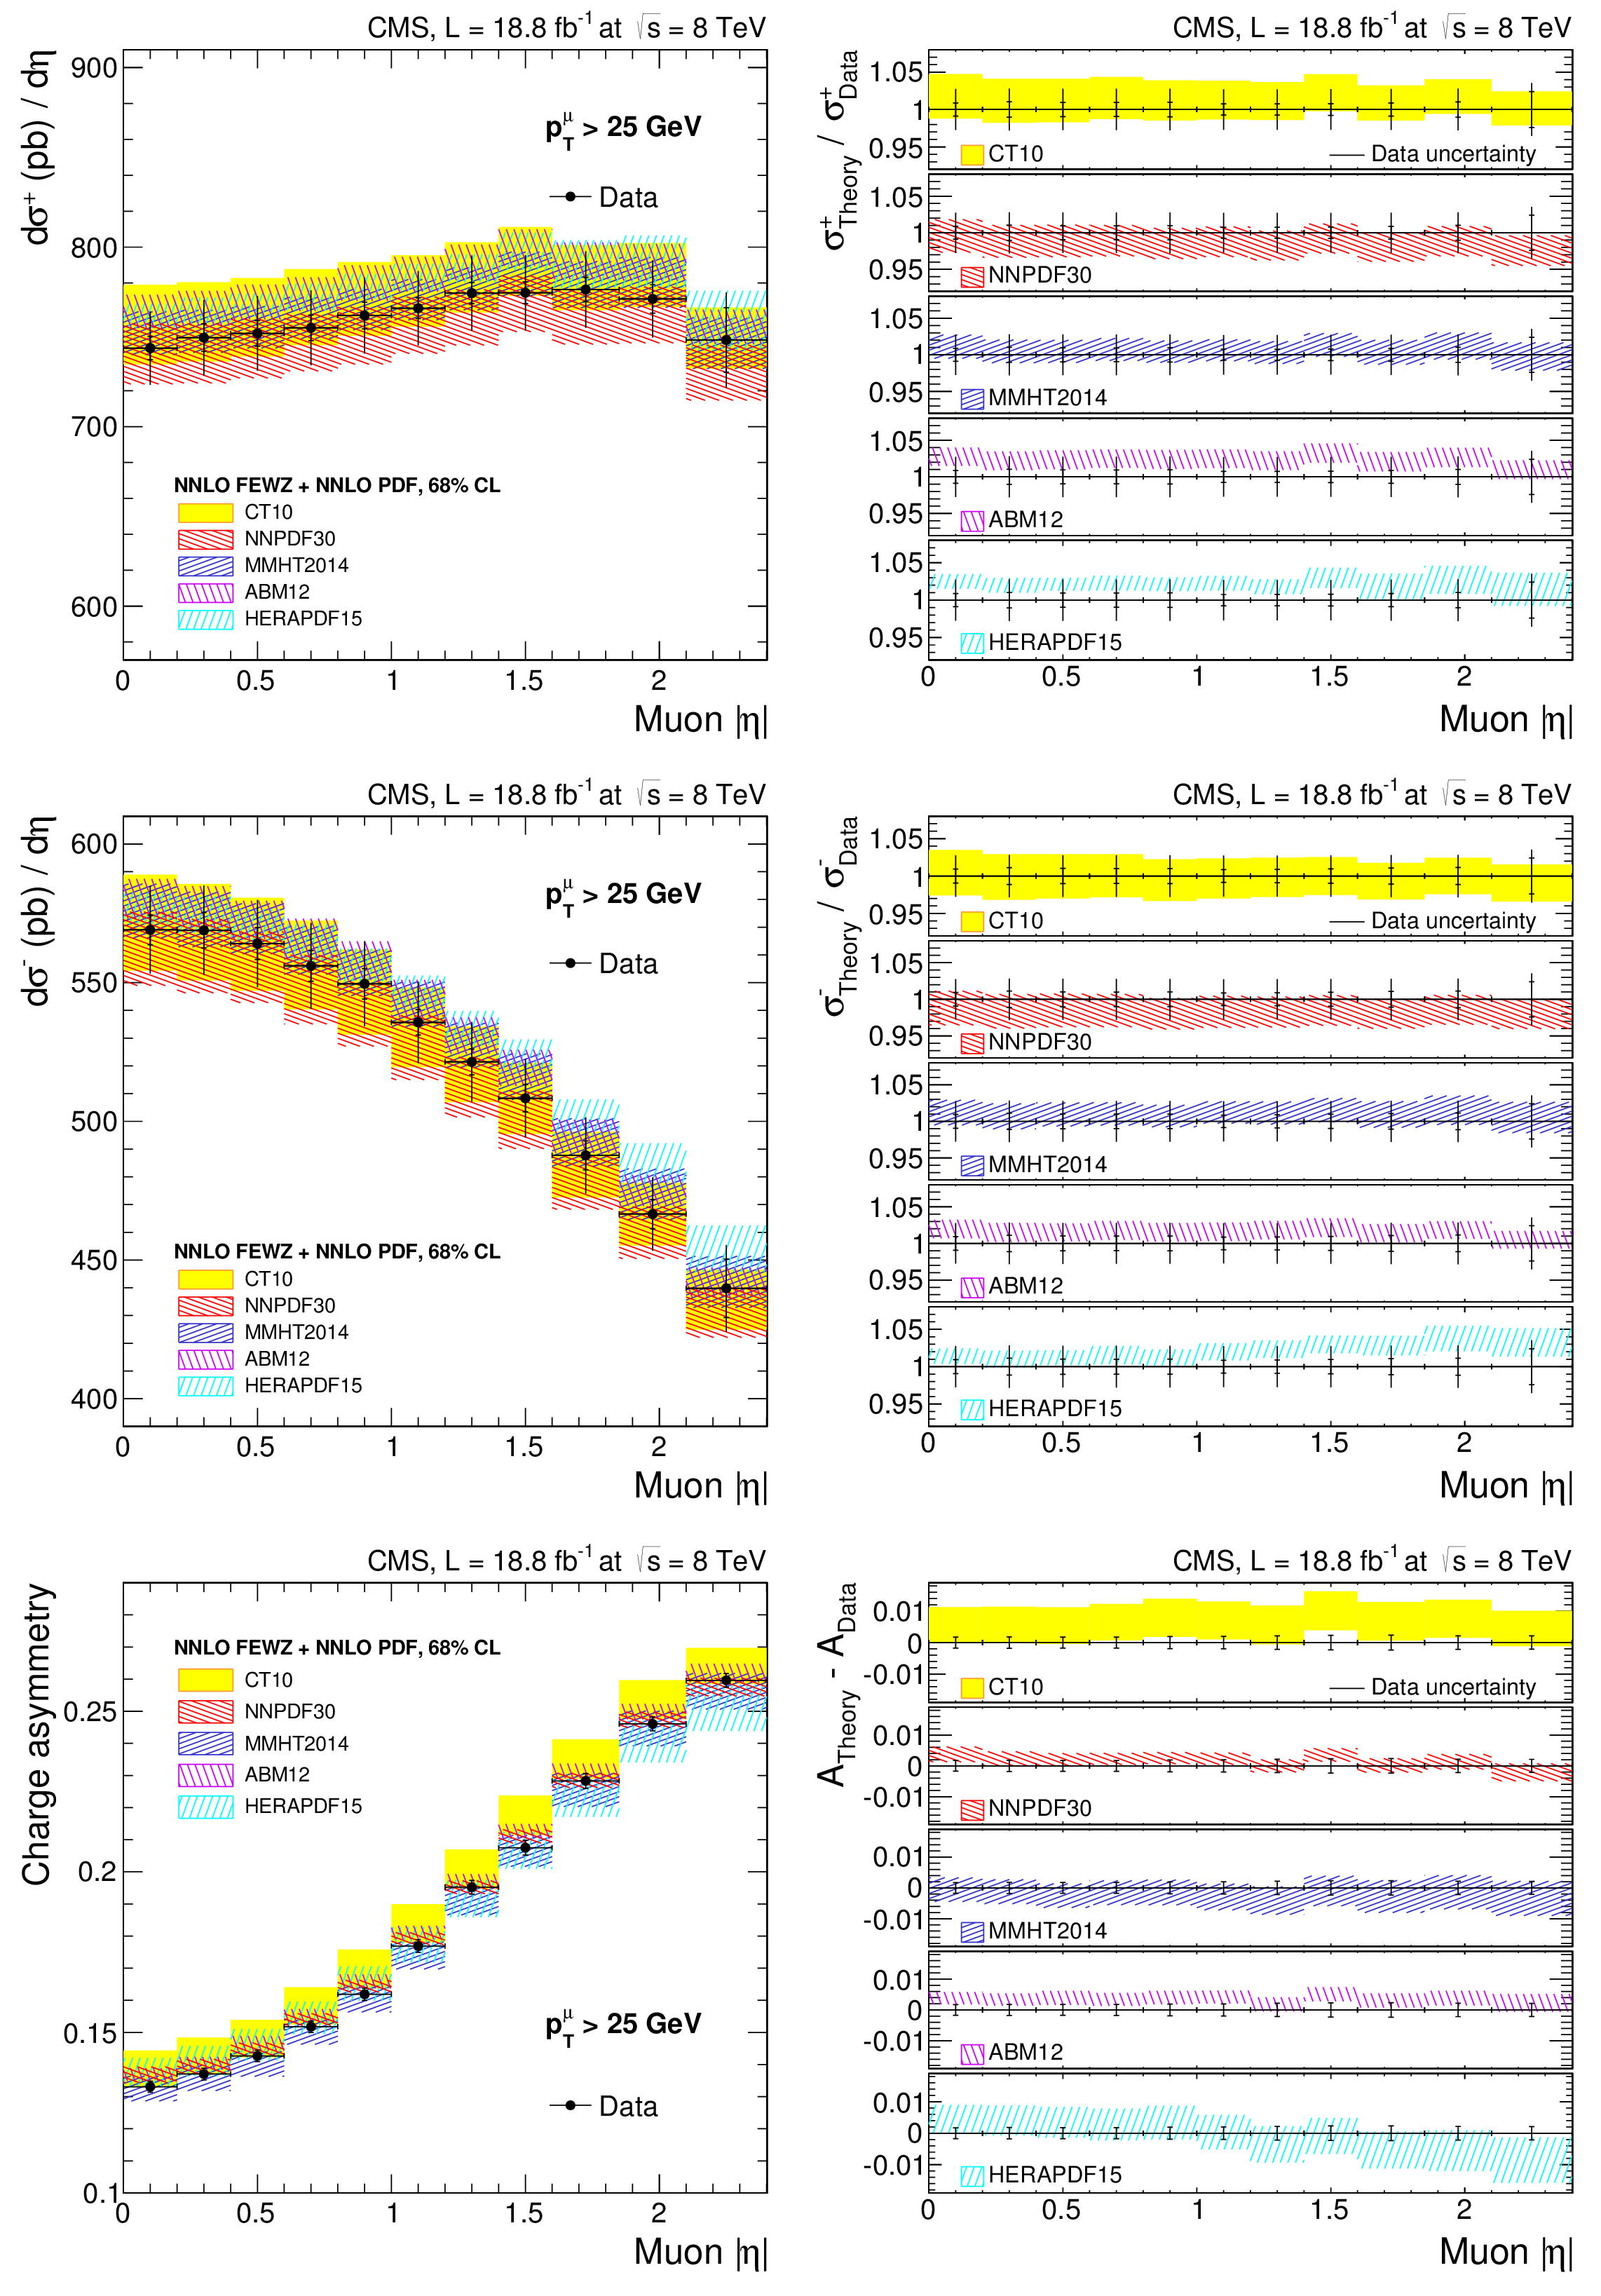
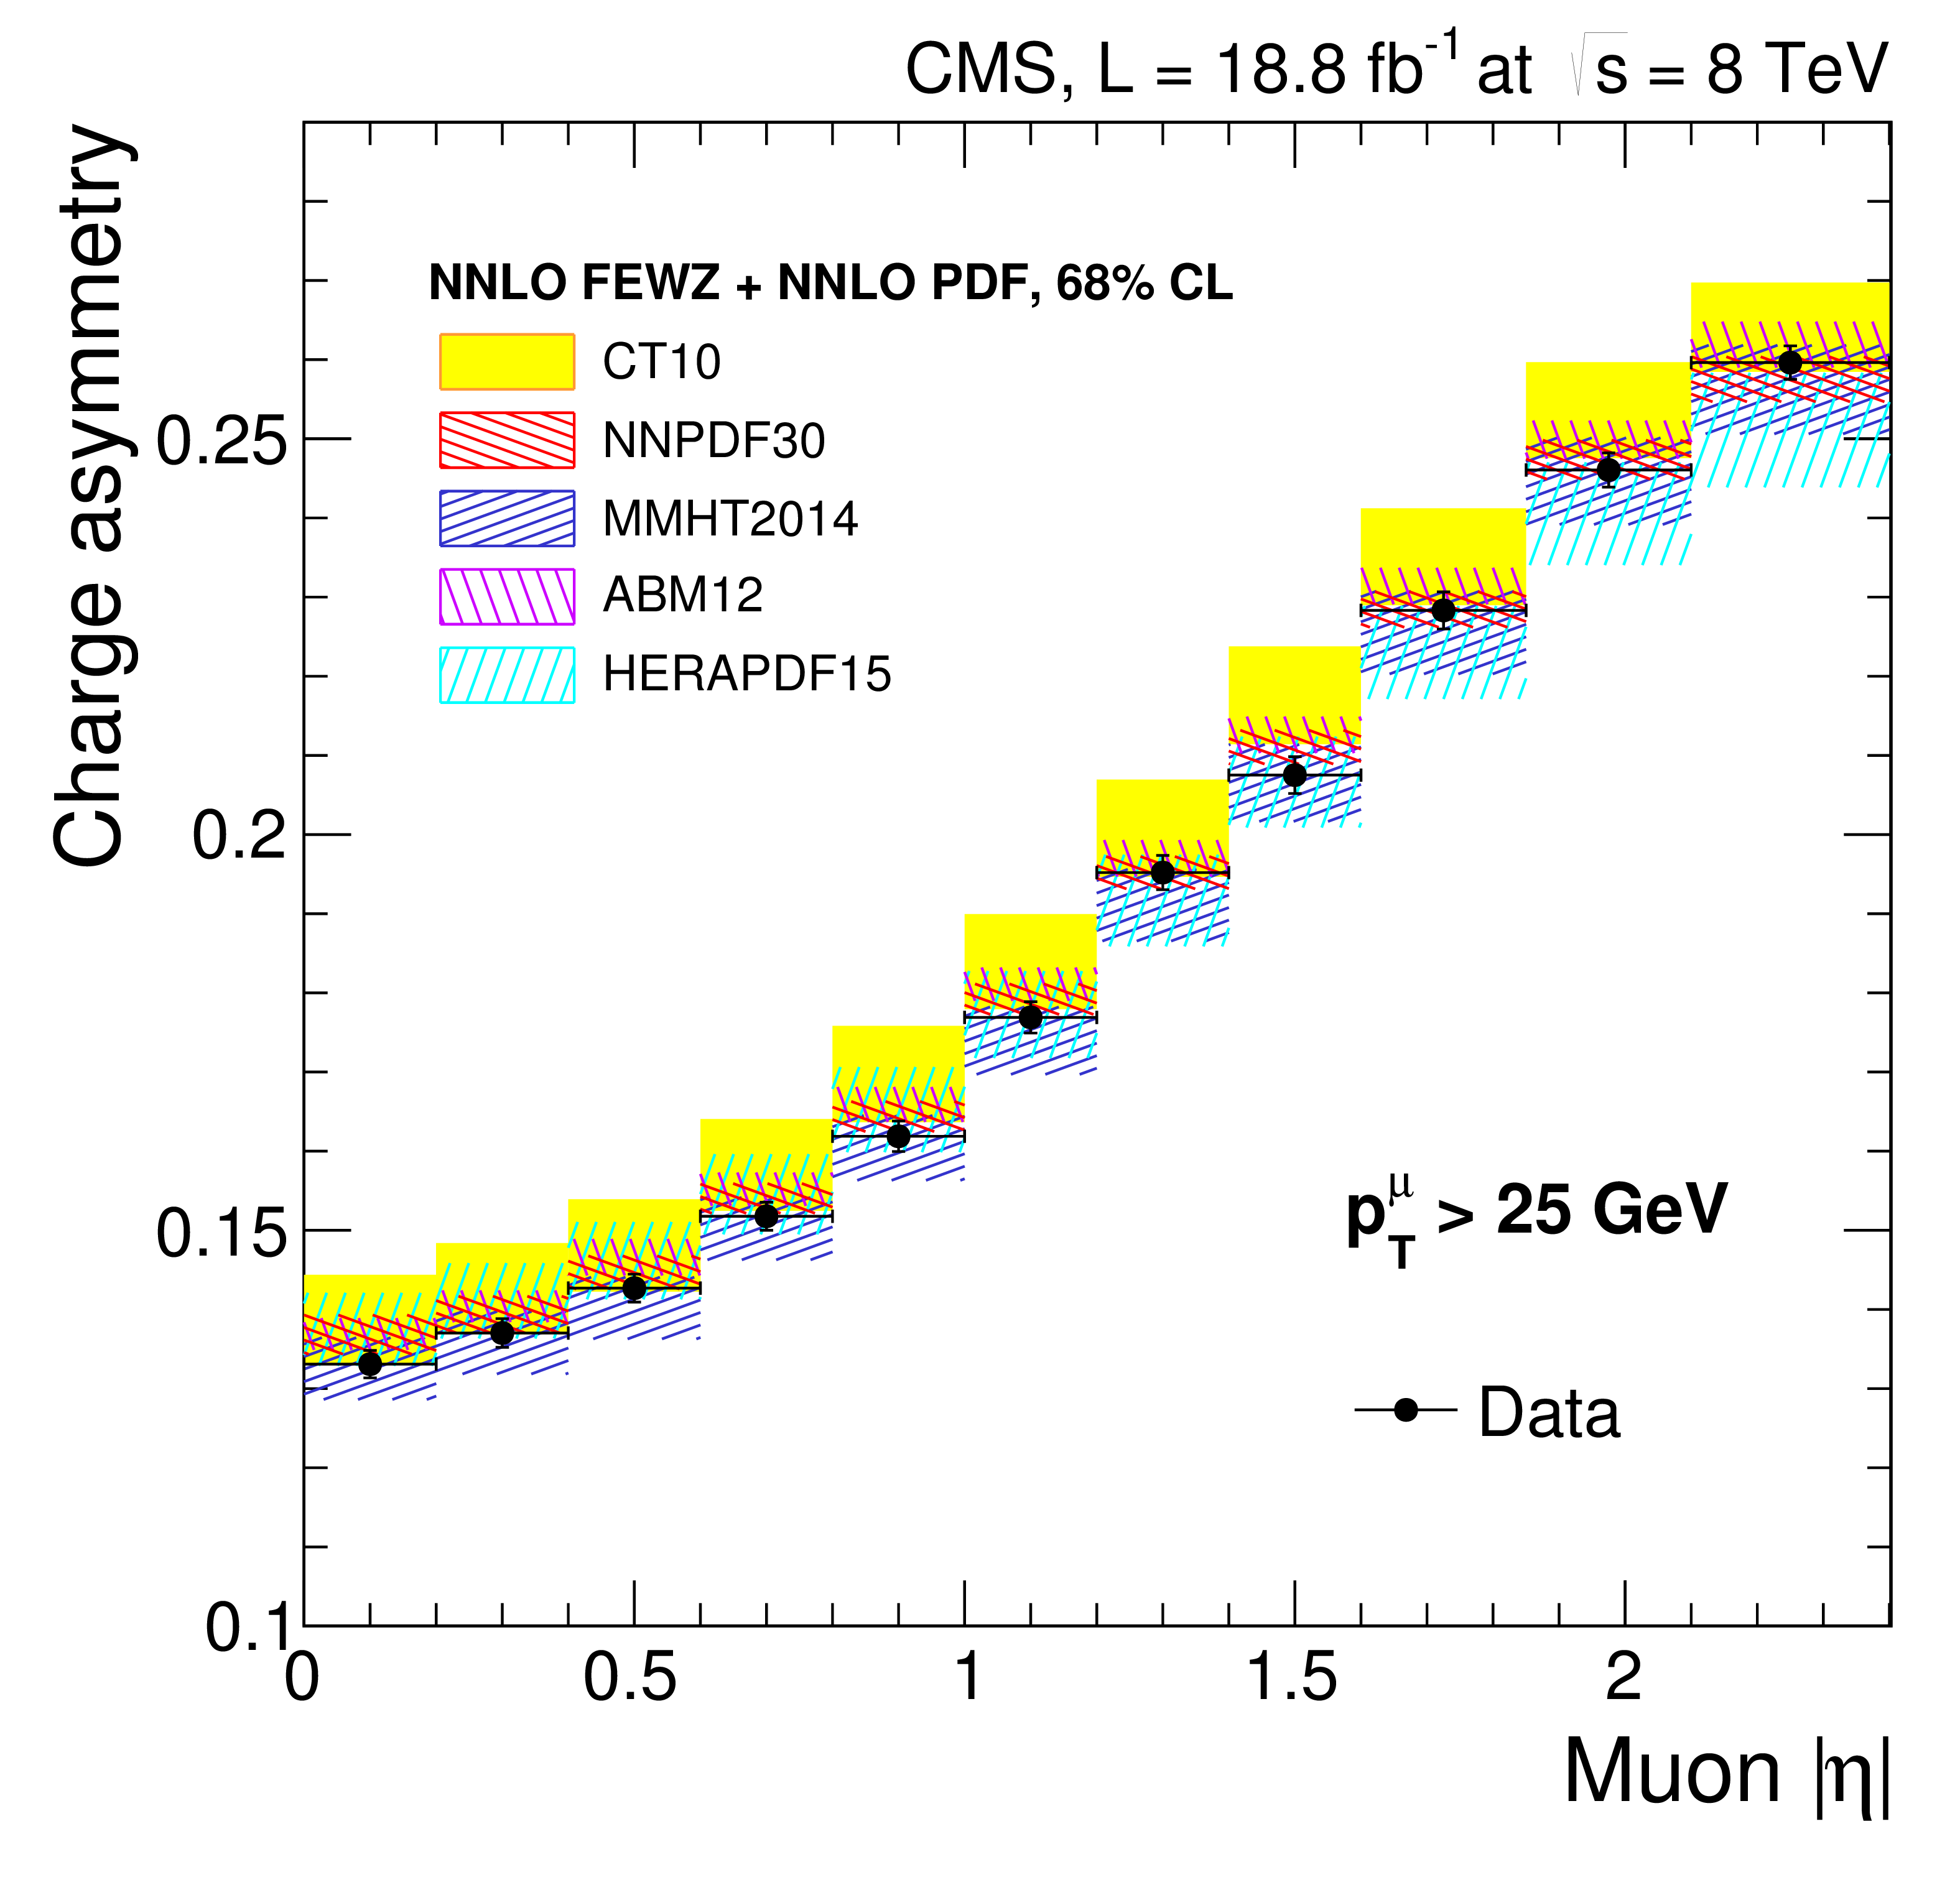
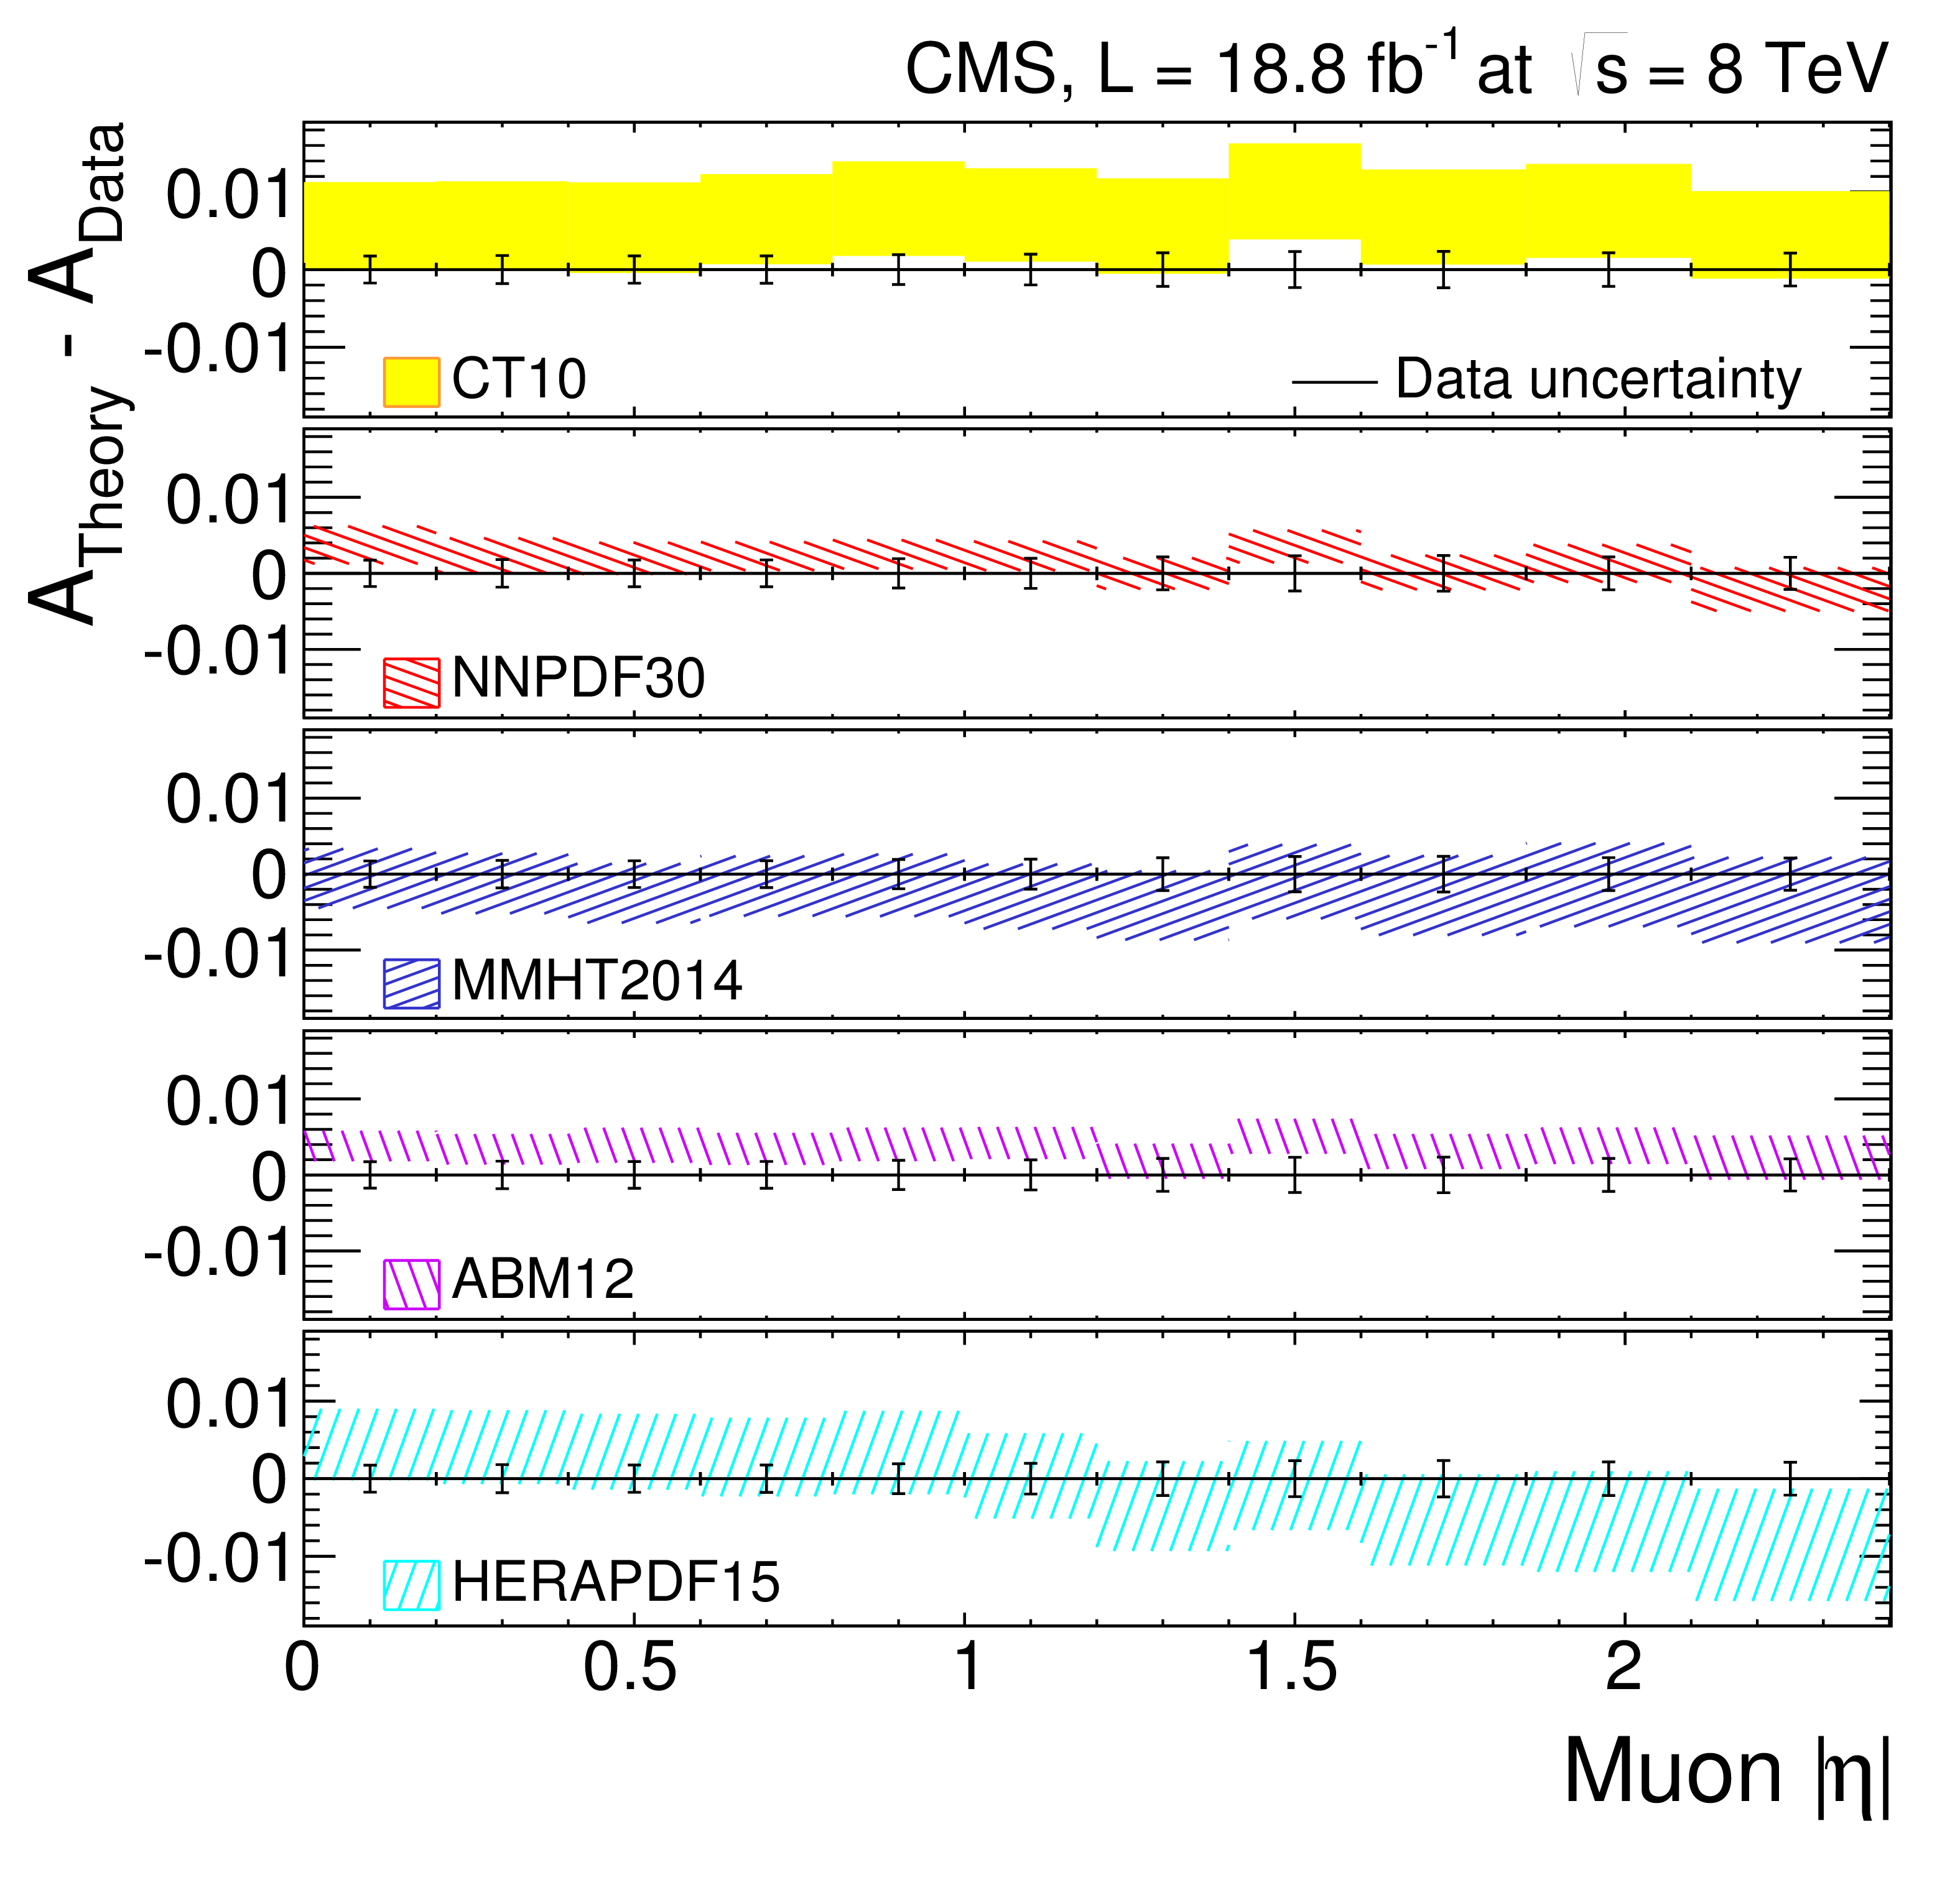
Comparison of the measured cross sections (upper plot for $ {\sigma _\eta } ^+$ and middle for $ {\sigma _\eta } ^-$) and asymmetries (lower plot) to NNLO predictions calculated using the FEWZ3.1 MC tool interfaced with different PDF sets. The right column shows the ratios (differences) between the theoretical predictions and the measured cross sections (asymmetries). The smaller vertical error bars on the data points represent the statistical and systematic uncertainties. The full error bars include the integrated luminosity uncertainty. The PDF uncertainty of each PDF set is shown by a shaded (or hatched) band and corresponds to 68% CL . |

png pdf |
Figure 3-a:
Comparison of the measured cross sections for $ {\sigma _\eta } ^+$ to NNLO predictions calculated using the FEWZ3.1 MC tool interfaced with different PDF sets. The smaller vertical error bars on the data points represent the statistical and systematic uncertainties. The full error bars include the integrated luminosity uncertainty. The PDF uncertainty of each PDF set is shown by a shaded (or hatched) band and corresponds to 68% CL . |
png pdf |
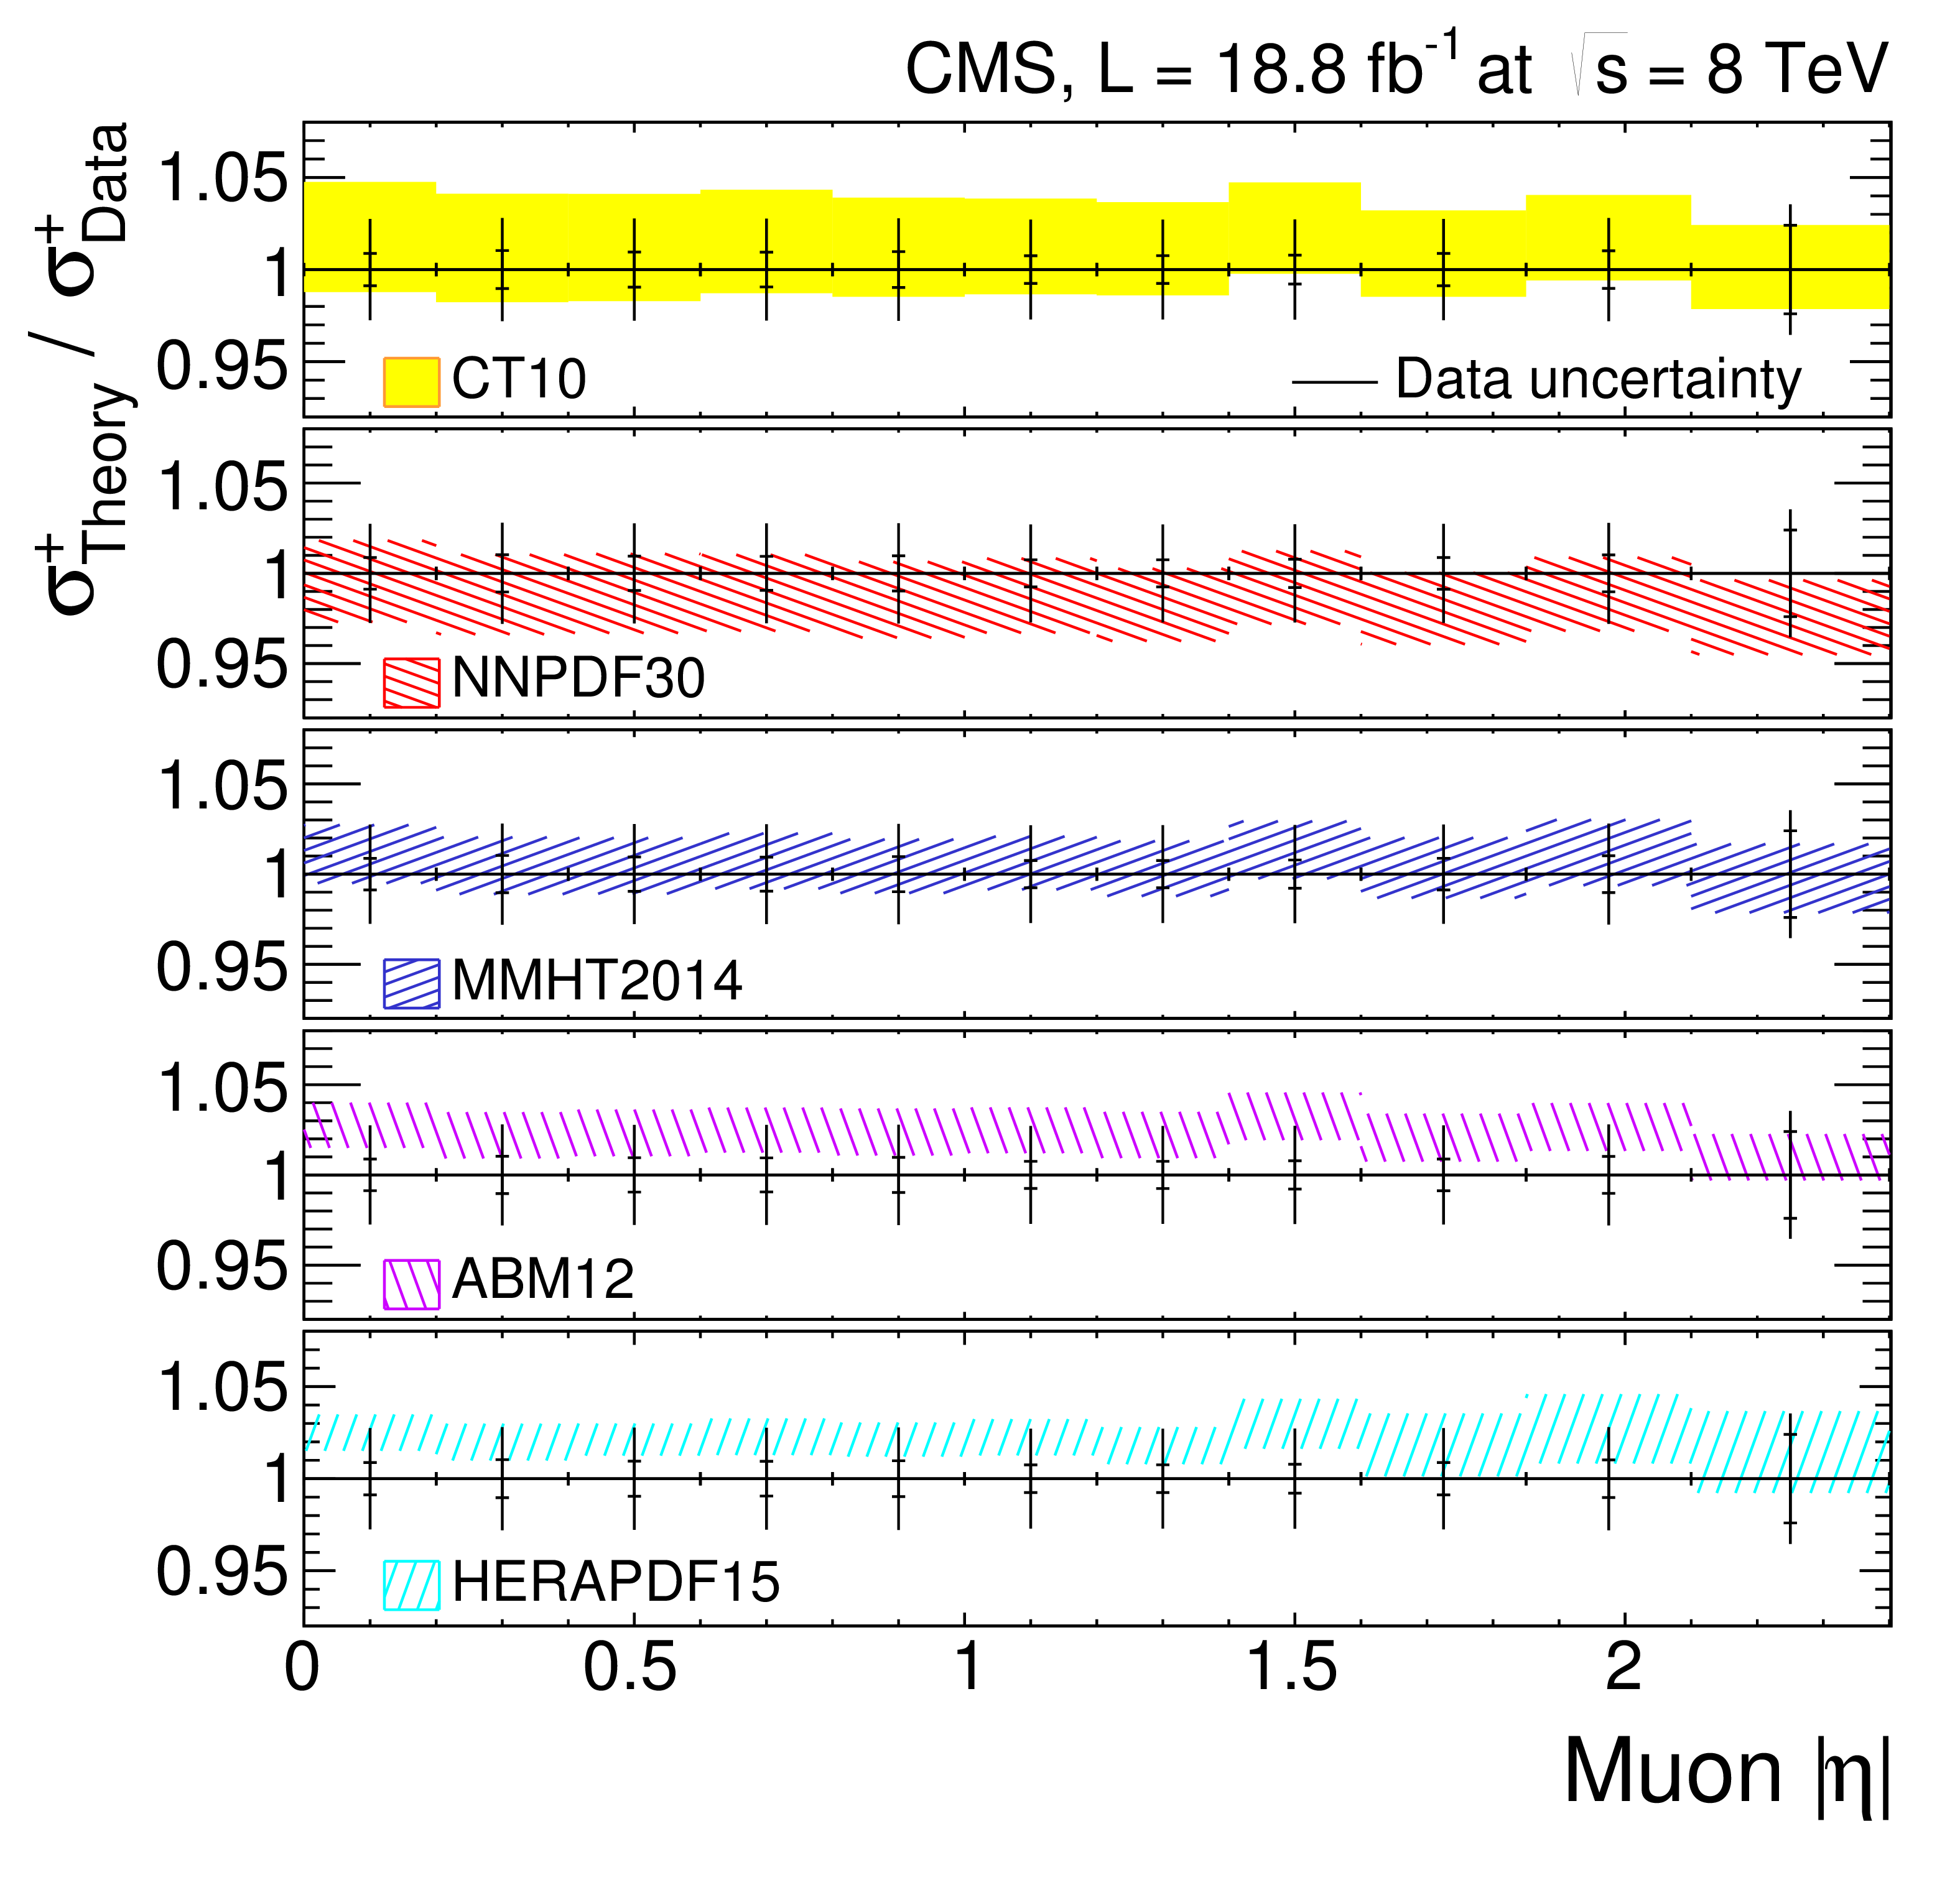
Figure 3-b:
Ratios between the theoretical predictions and the measured cross sections plot for $ {\sigma _\eta } ^+$. The smaller vertical error bars on the data points represent the statistical and systematic uncertainties. The full error bars include the integrated luminosity uncertainty. The PDF uncertainty of each PDF set is shown by a shaded (or hatched) band and corresponds to 68% CL . |
png pdf |
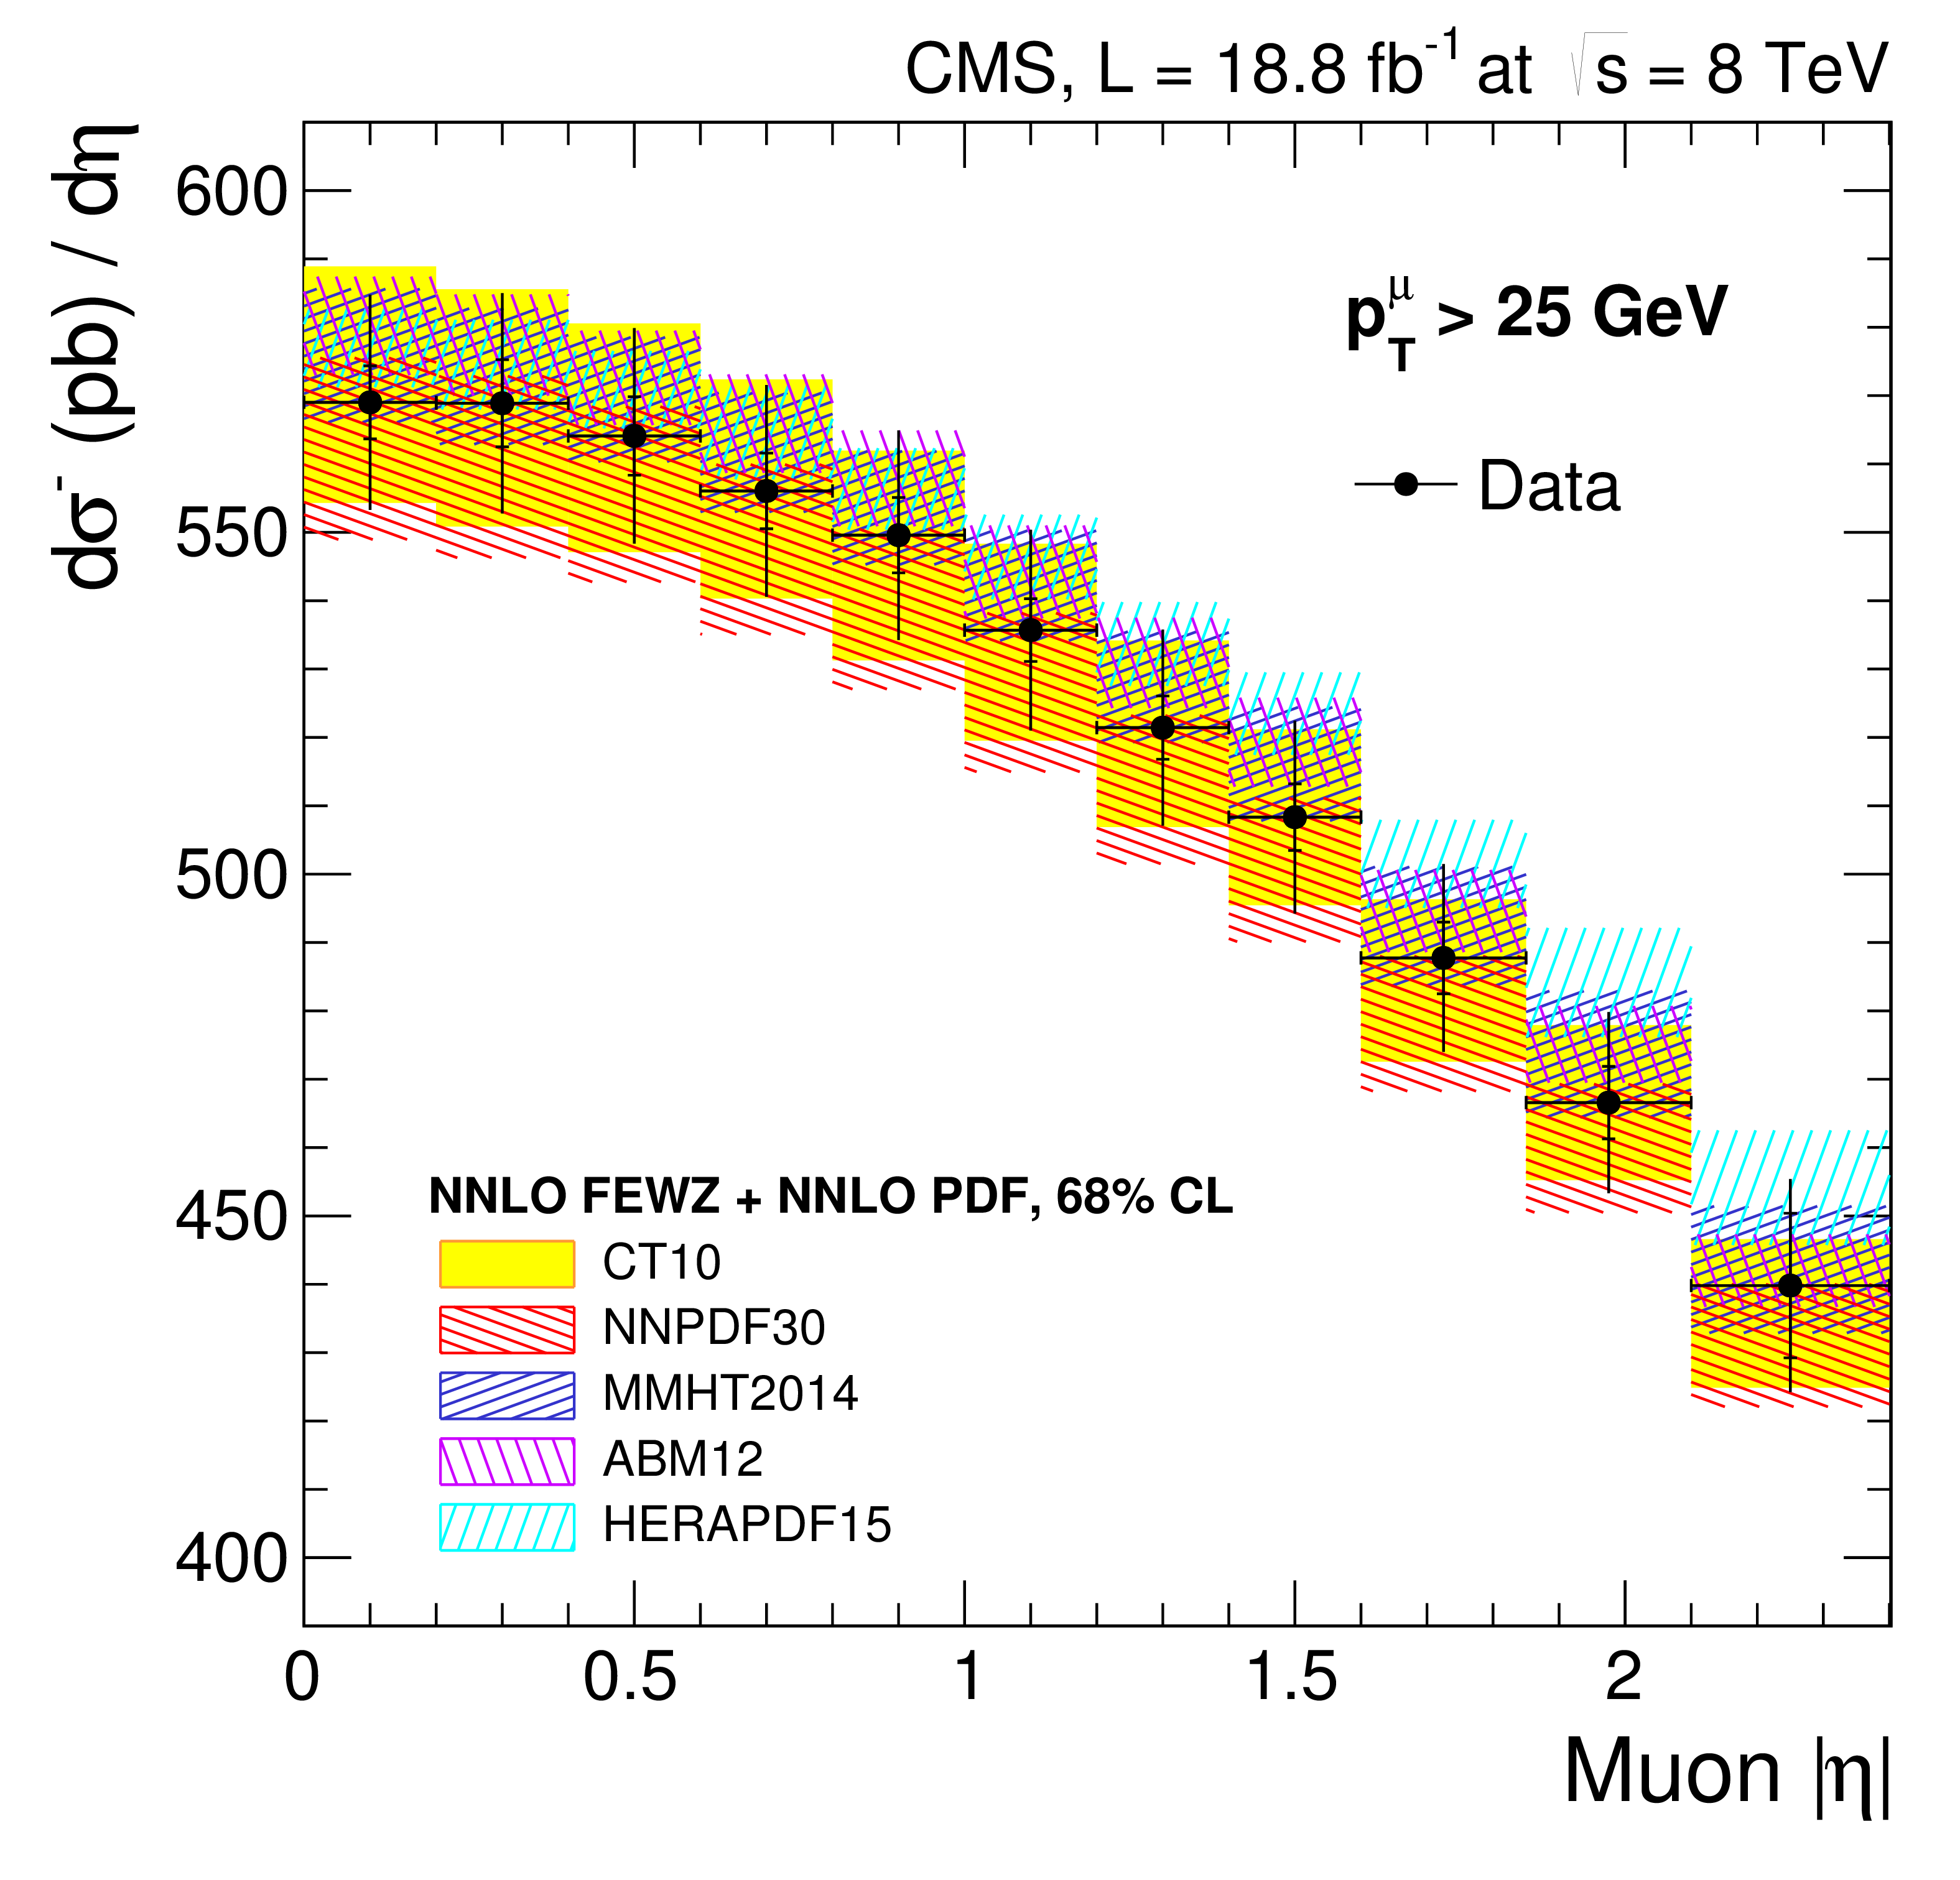
Figure 3-c:
Comparison of the measured cross sections for $ {\sigma _\eta } ^-$ to NNLO predictions calculated using the FEWZ3.1 MC tool interfaced with different PDF sets. The smaller vertical error bars on the data points represent the statistical and systematic uncertainties. The full error bars include the integrated luminosity uncertainty. The PDF uncertainty of each PDF set is shown by a shaded (or hatched) band and corresponds to 68% CL . |
png pdf |
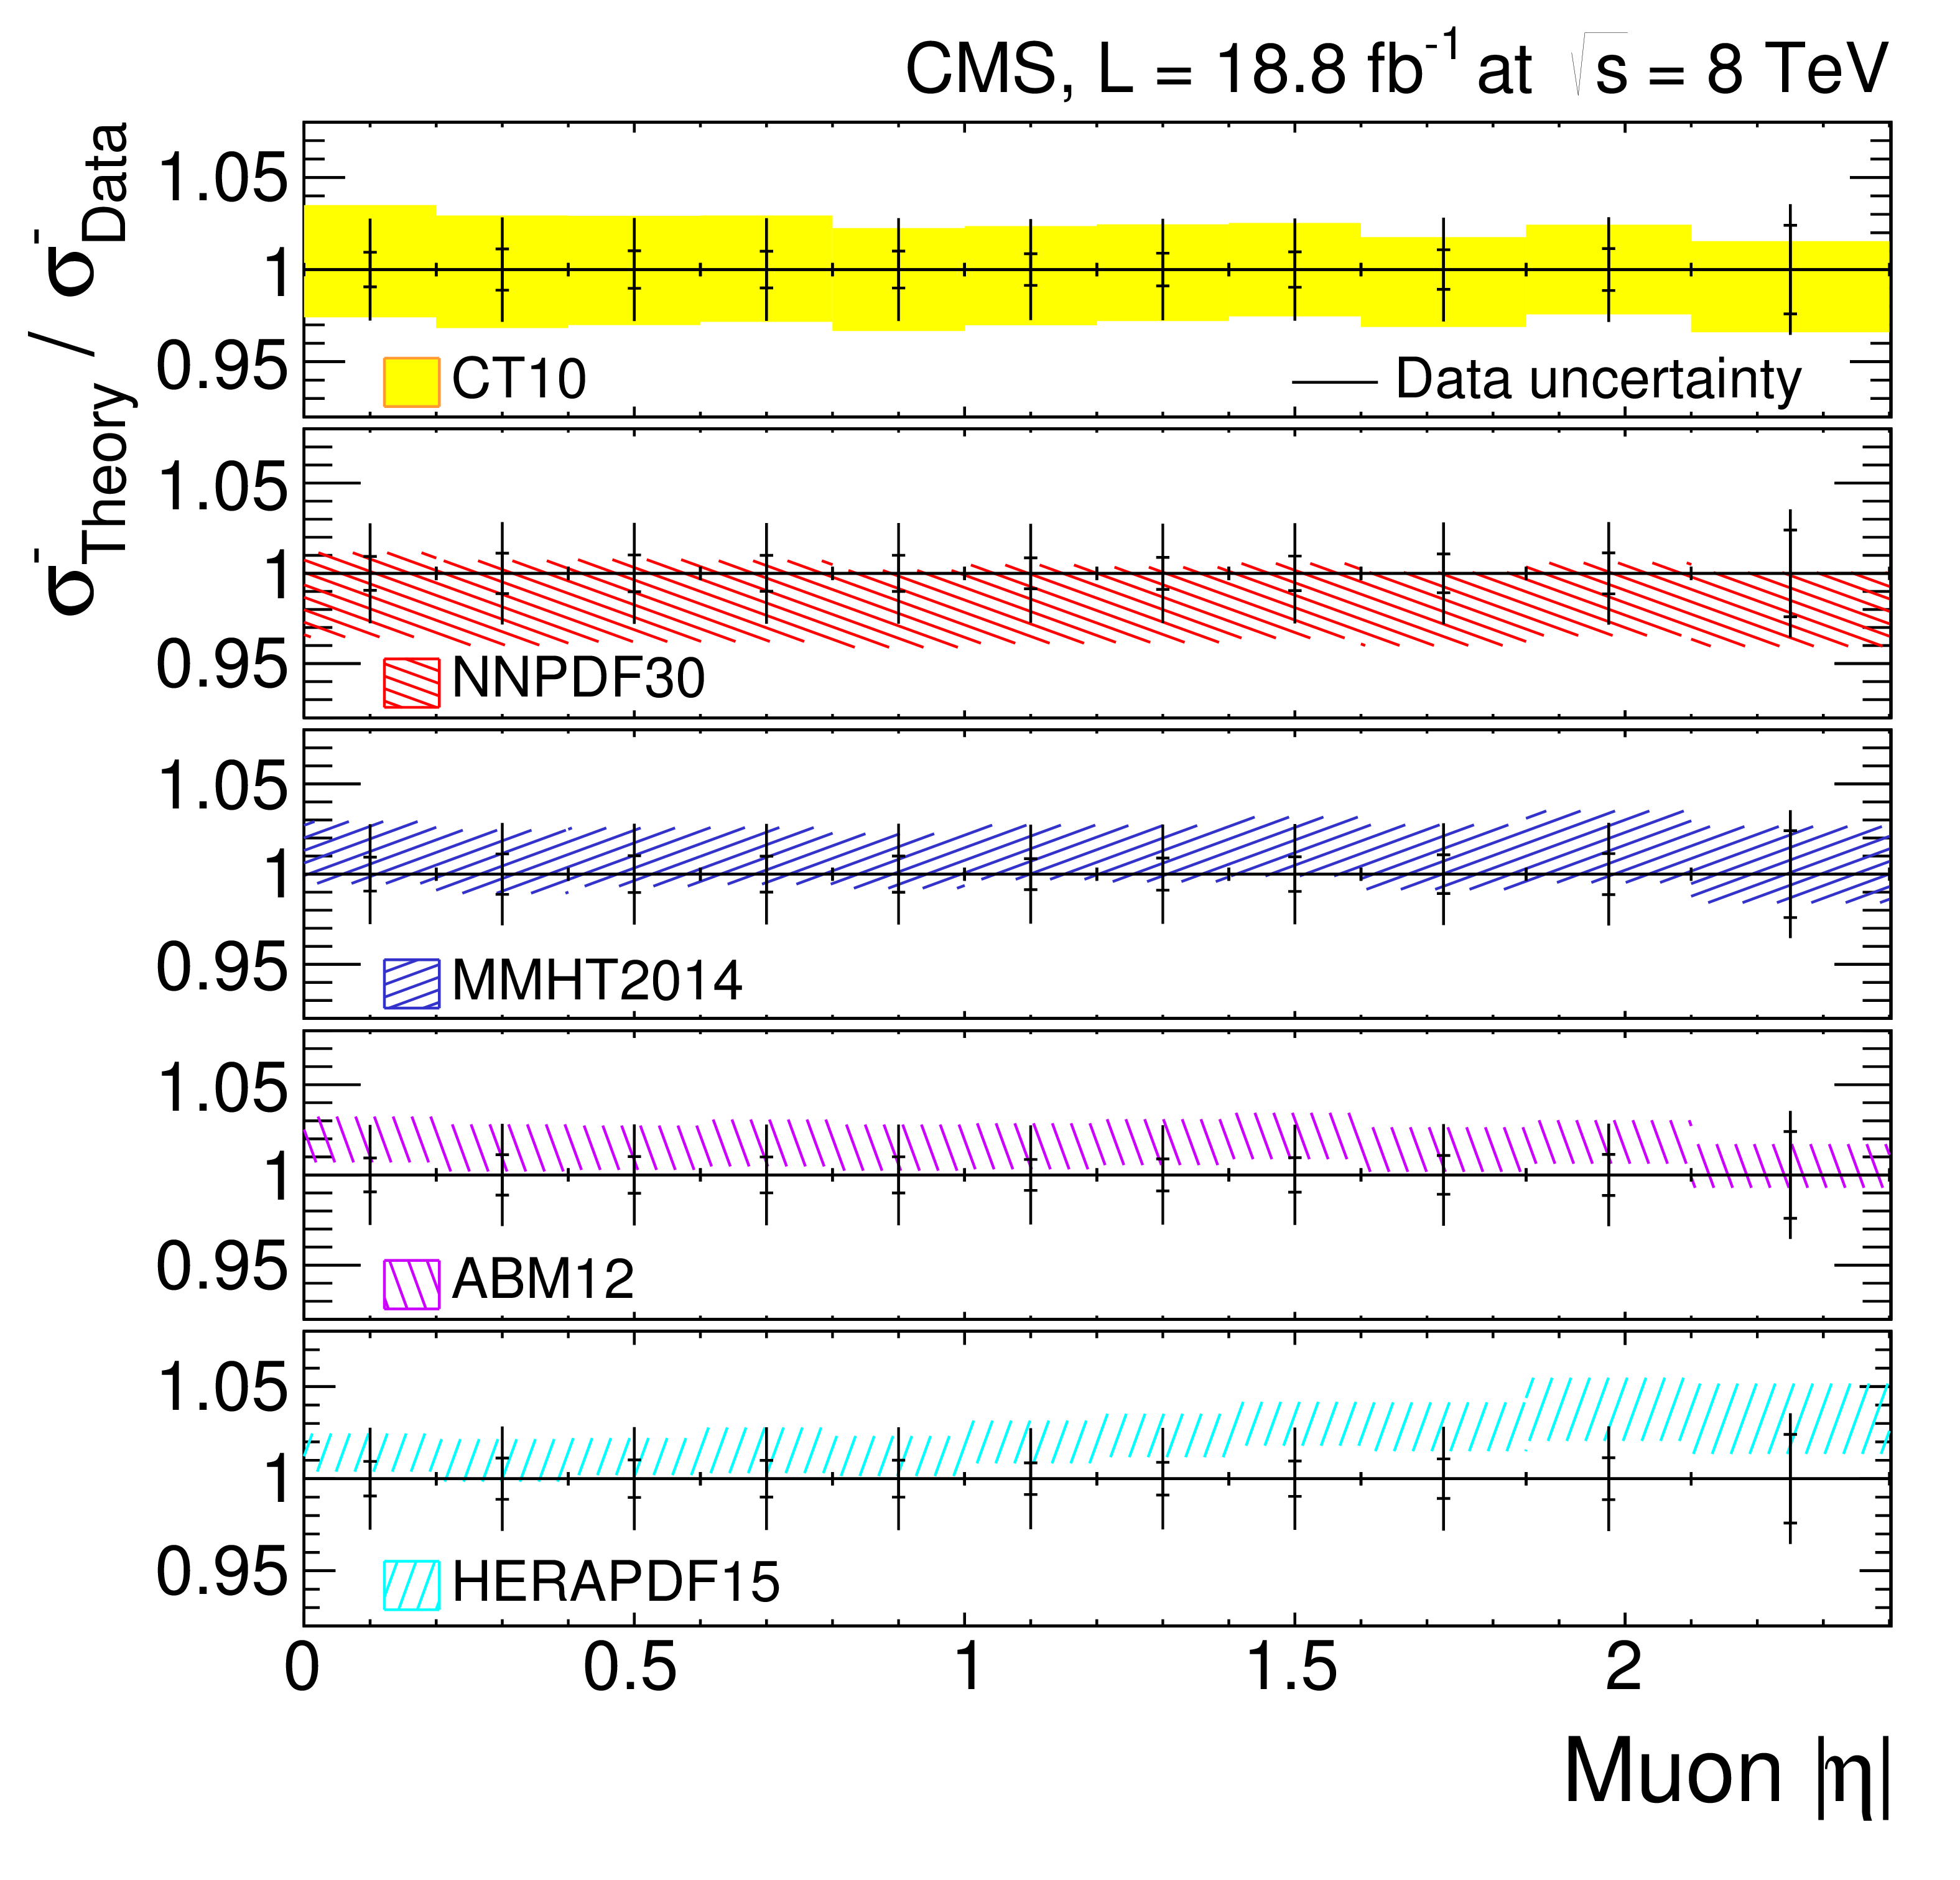
Figure 3-d:
Ratios between the theoretical predictions and the measured cross sections for $ {\sigma _\eta } ^-$. The smaller vertical error bars on the data points represent the statistical and systematic uncertainties. The full error bars include the integrated luminosity uncertainty. The PDF uncertainty of each PDF set is shown by a shaded (or hatched) band and corresponds to 68% CL . |
png pdf |
Figure 3-e:
Comparison of asymmetries to NNLO predictions calculated using the FEWZ3.1 MC tool interfaced with different PDF sets. The smaller vertical error bars on the data points represent the statistical and systematic uncertainties. The full error bars include the integrated luminosity uncertainty. The PDF uncertainty of each PDF set is shown by a shaded (or hatched) band and corresponds to 68% CL . |
png pdf |
Figure 3-f:
Differences between the theoretical predictions and the measured asymmetries. The smaller vertical error bars on the data points represent the statistical and systematic uncertainties. The full error bars include the integrated luminosity uncertainty. The PDF uncertainty of each PDF set is shown by a shaded (or hatched) band and corresponds to 68% CL . |
png pdf |
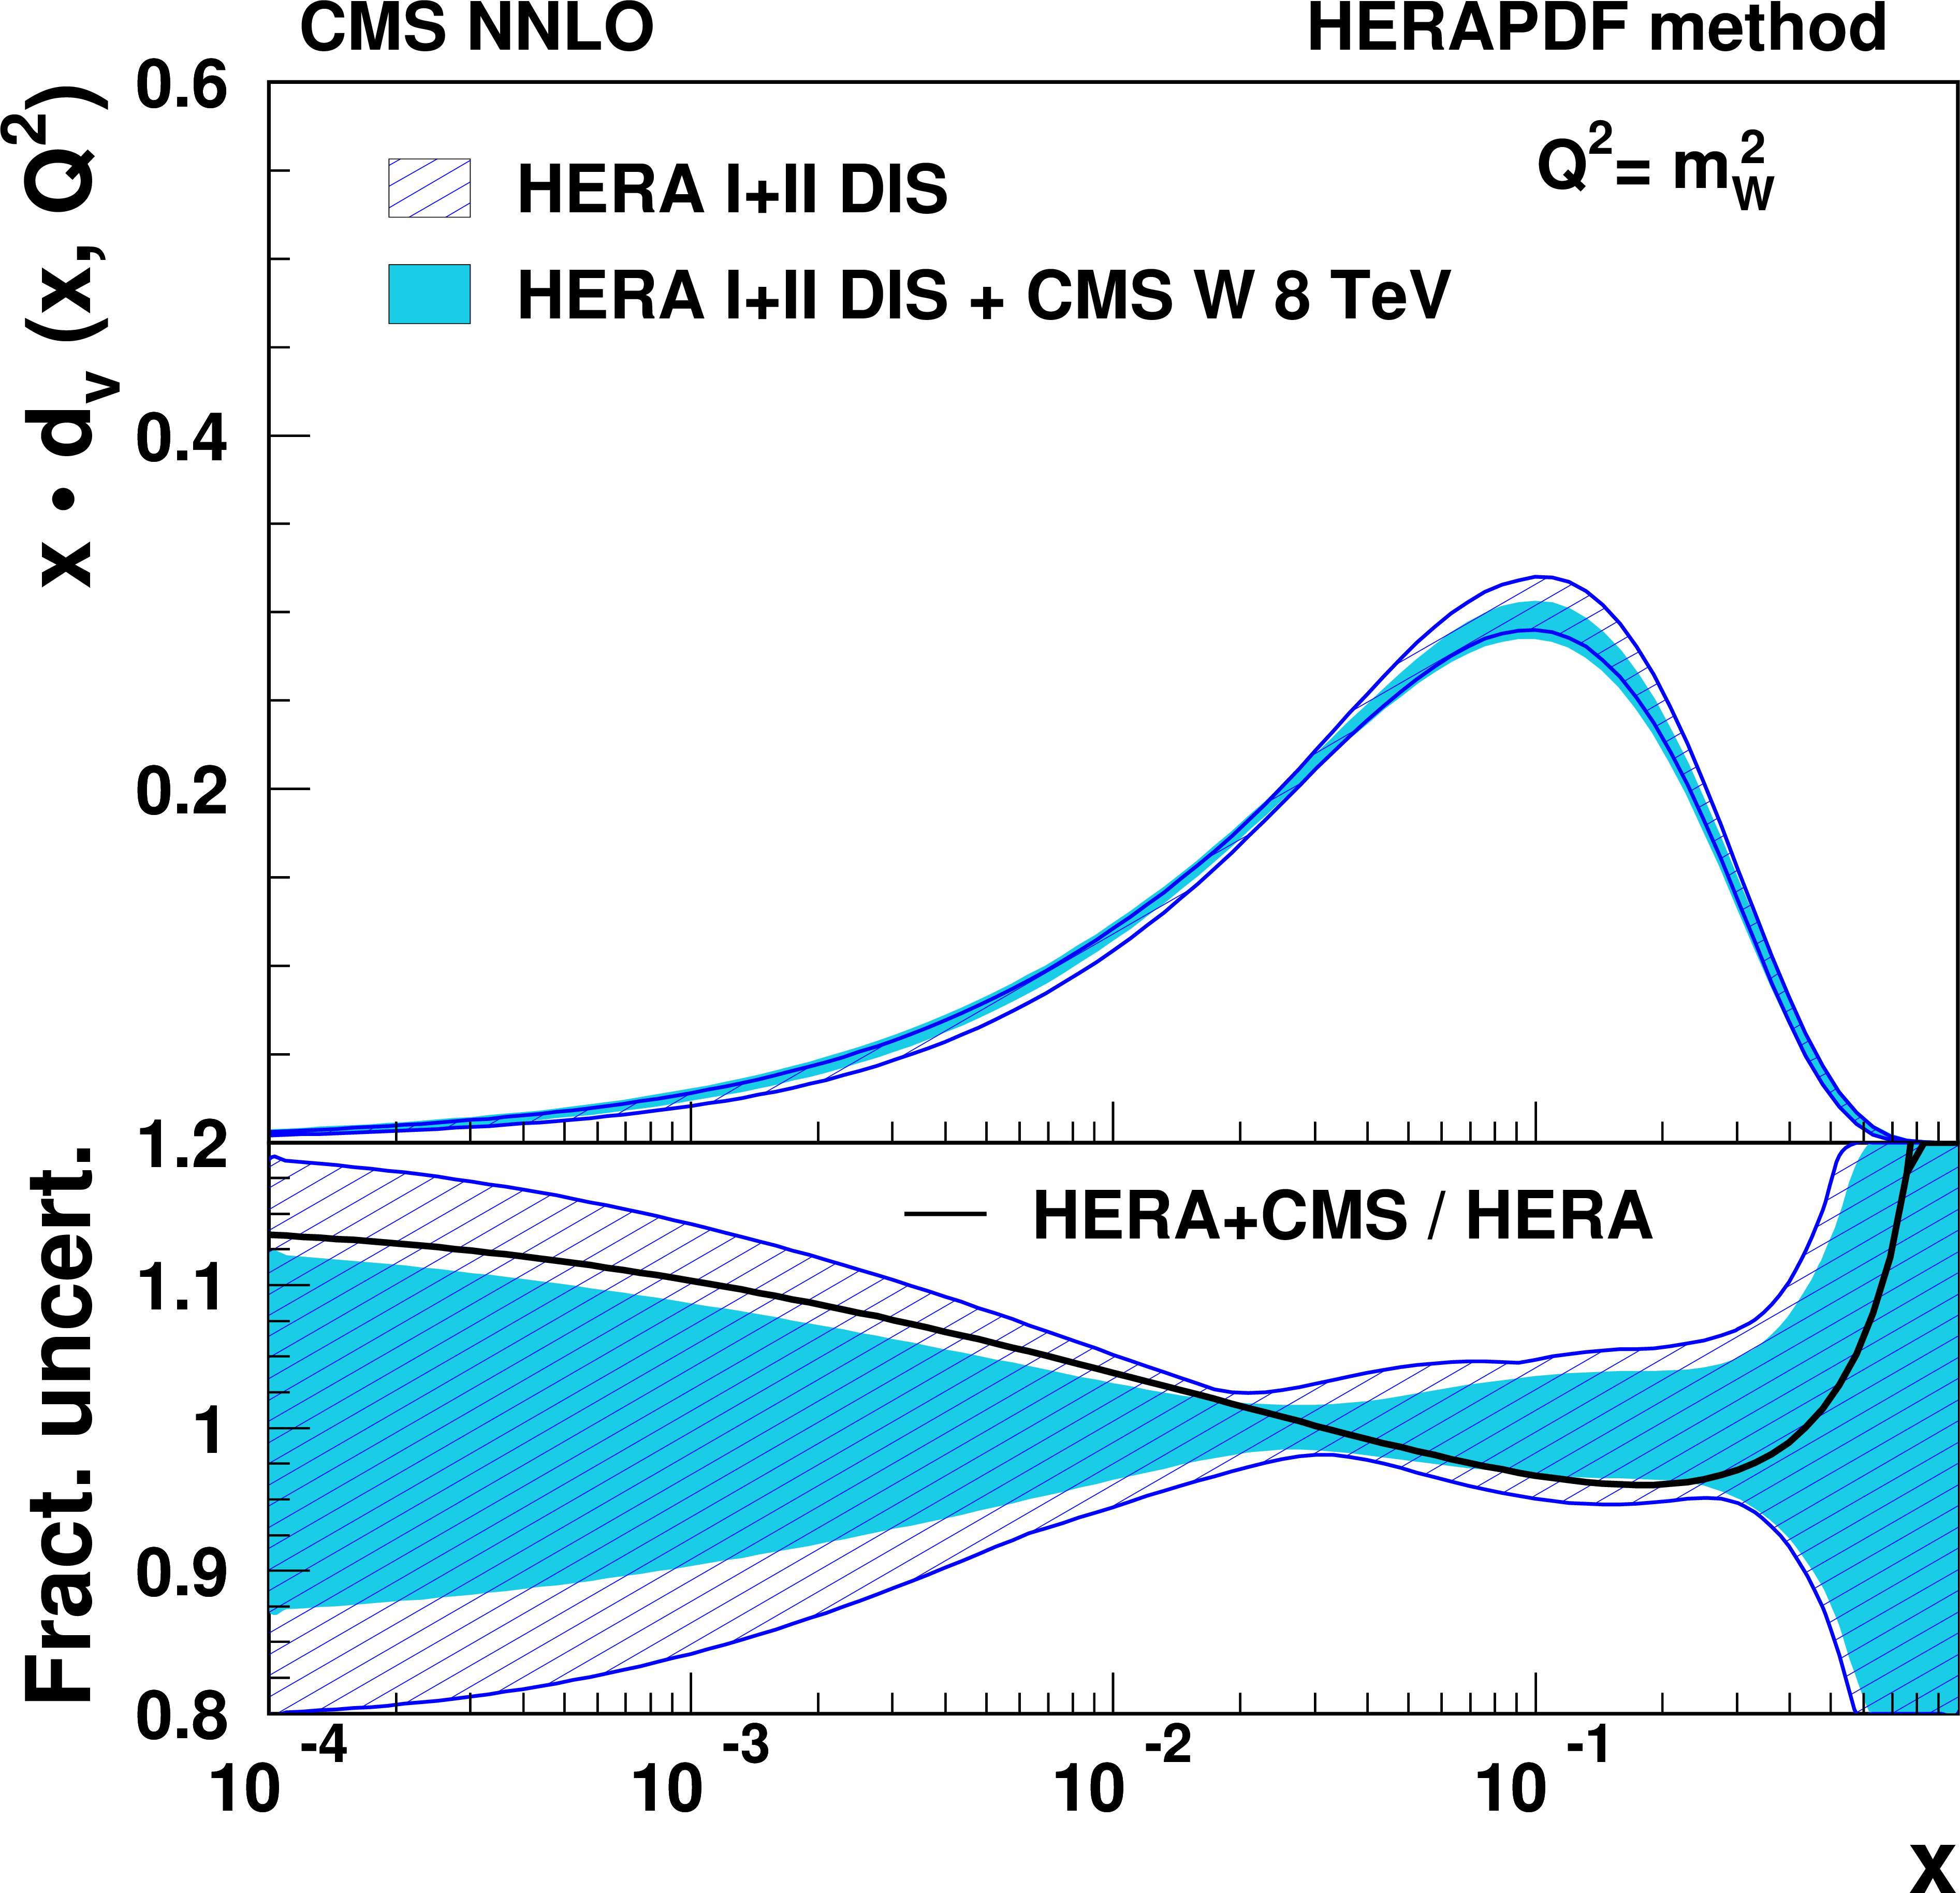
Figure 4:
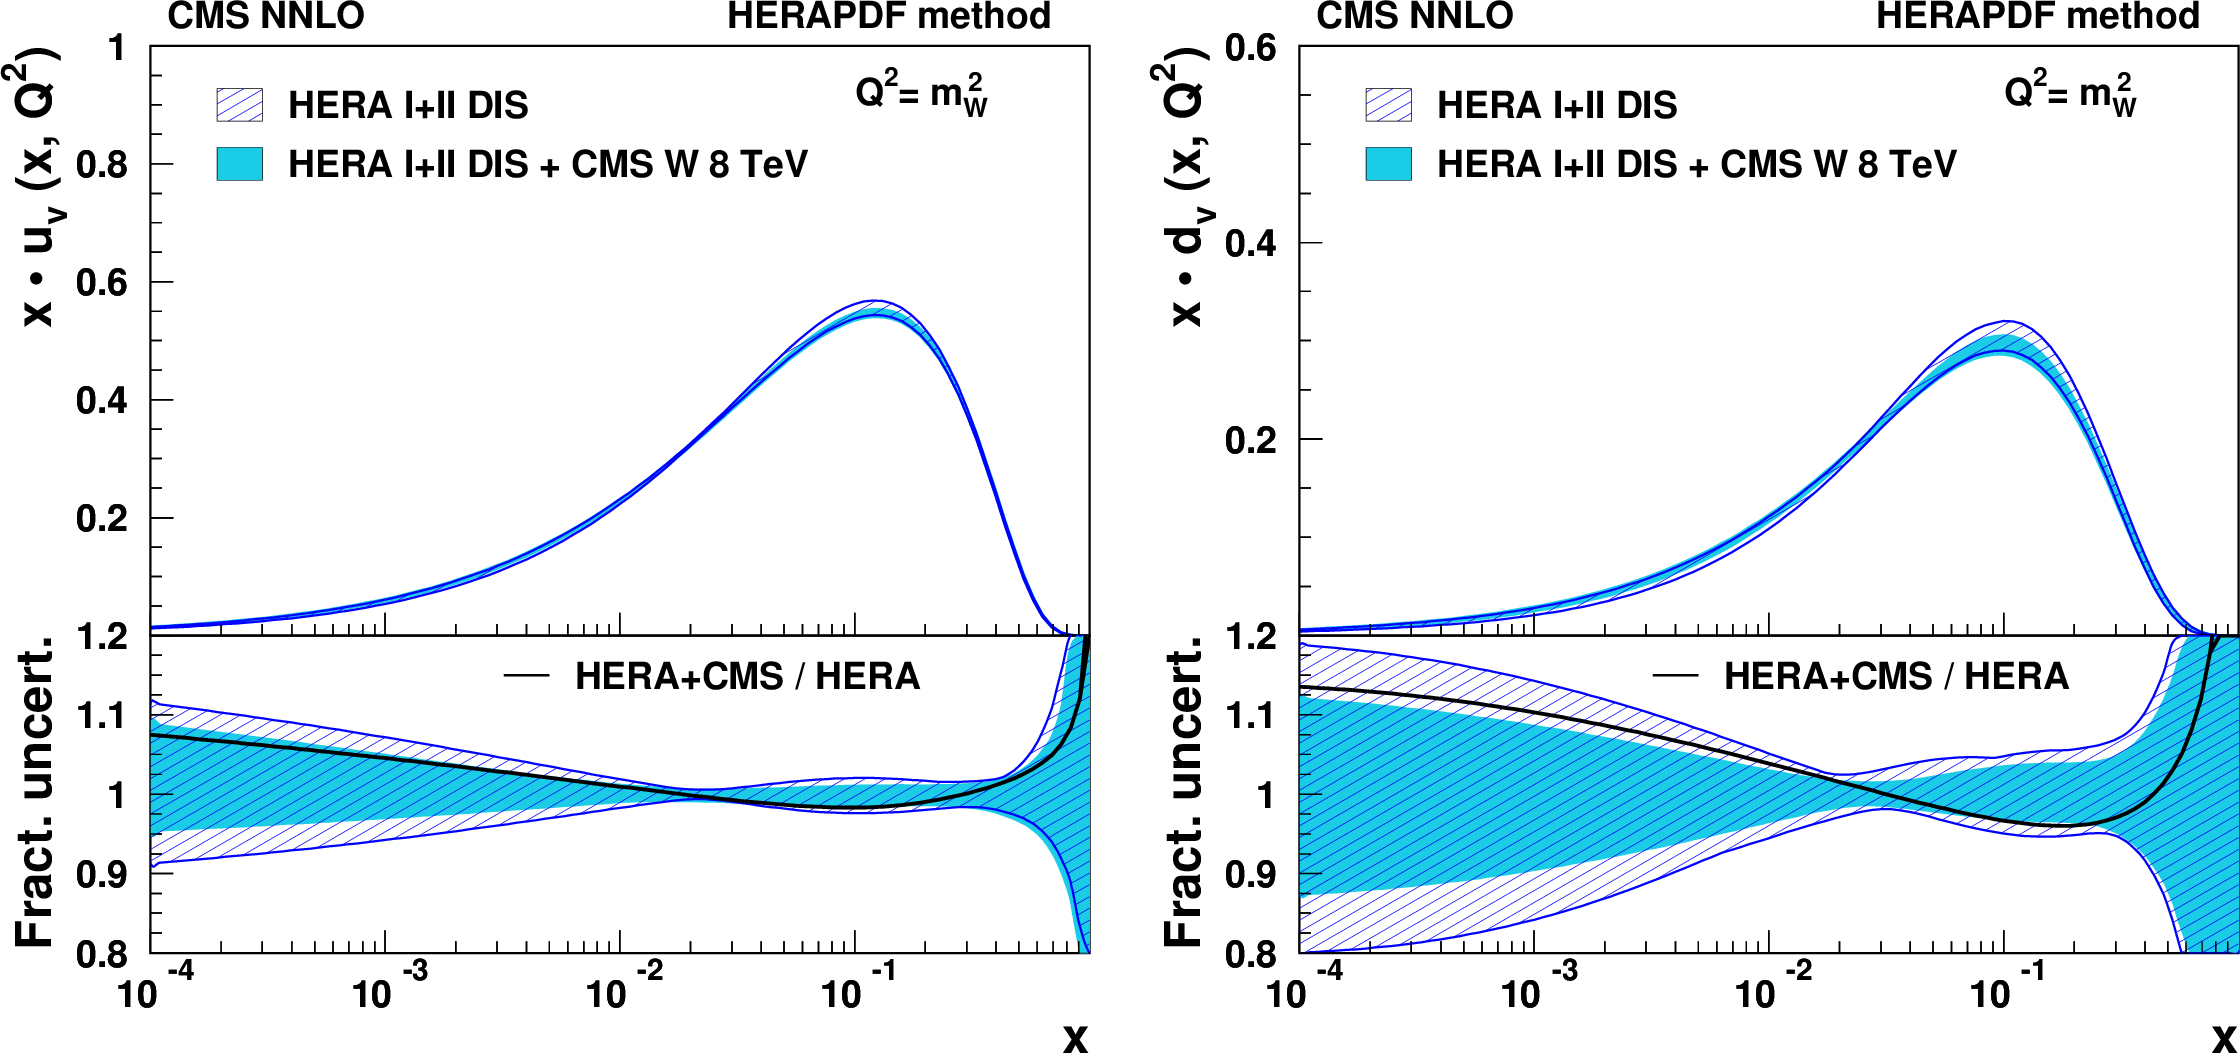
Distributions of u valence (left) and d valence (right) quarks as functions of $x$ at the scale $Q^2=m^2_{\mathrm{ W } }$. The results of the fit to the HERA data and muon asymmetry measurements (light shaded band), and to HERA data only (hatched band) are compared. The total PDF uncertainties are shown. In the bottom panels the distributions are normalized to 1 for a direct comparison of the uncertainties. The change of the PDFs with respect to the HERA-only fit is represented by a solid line. |
png pdf |
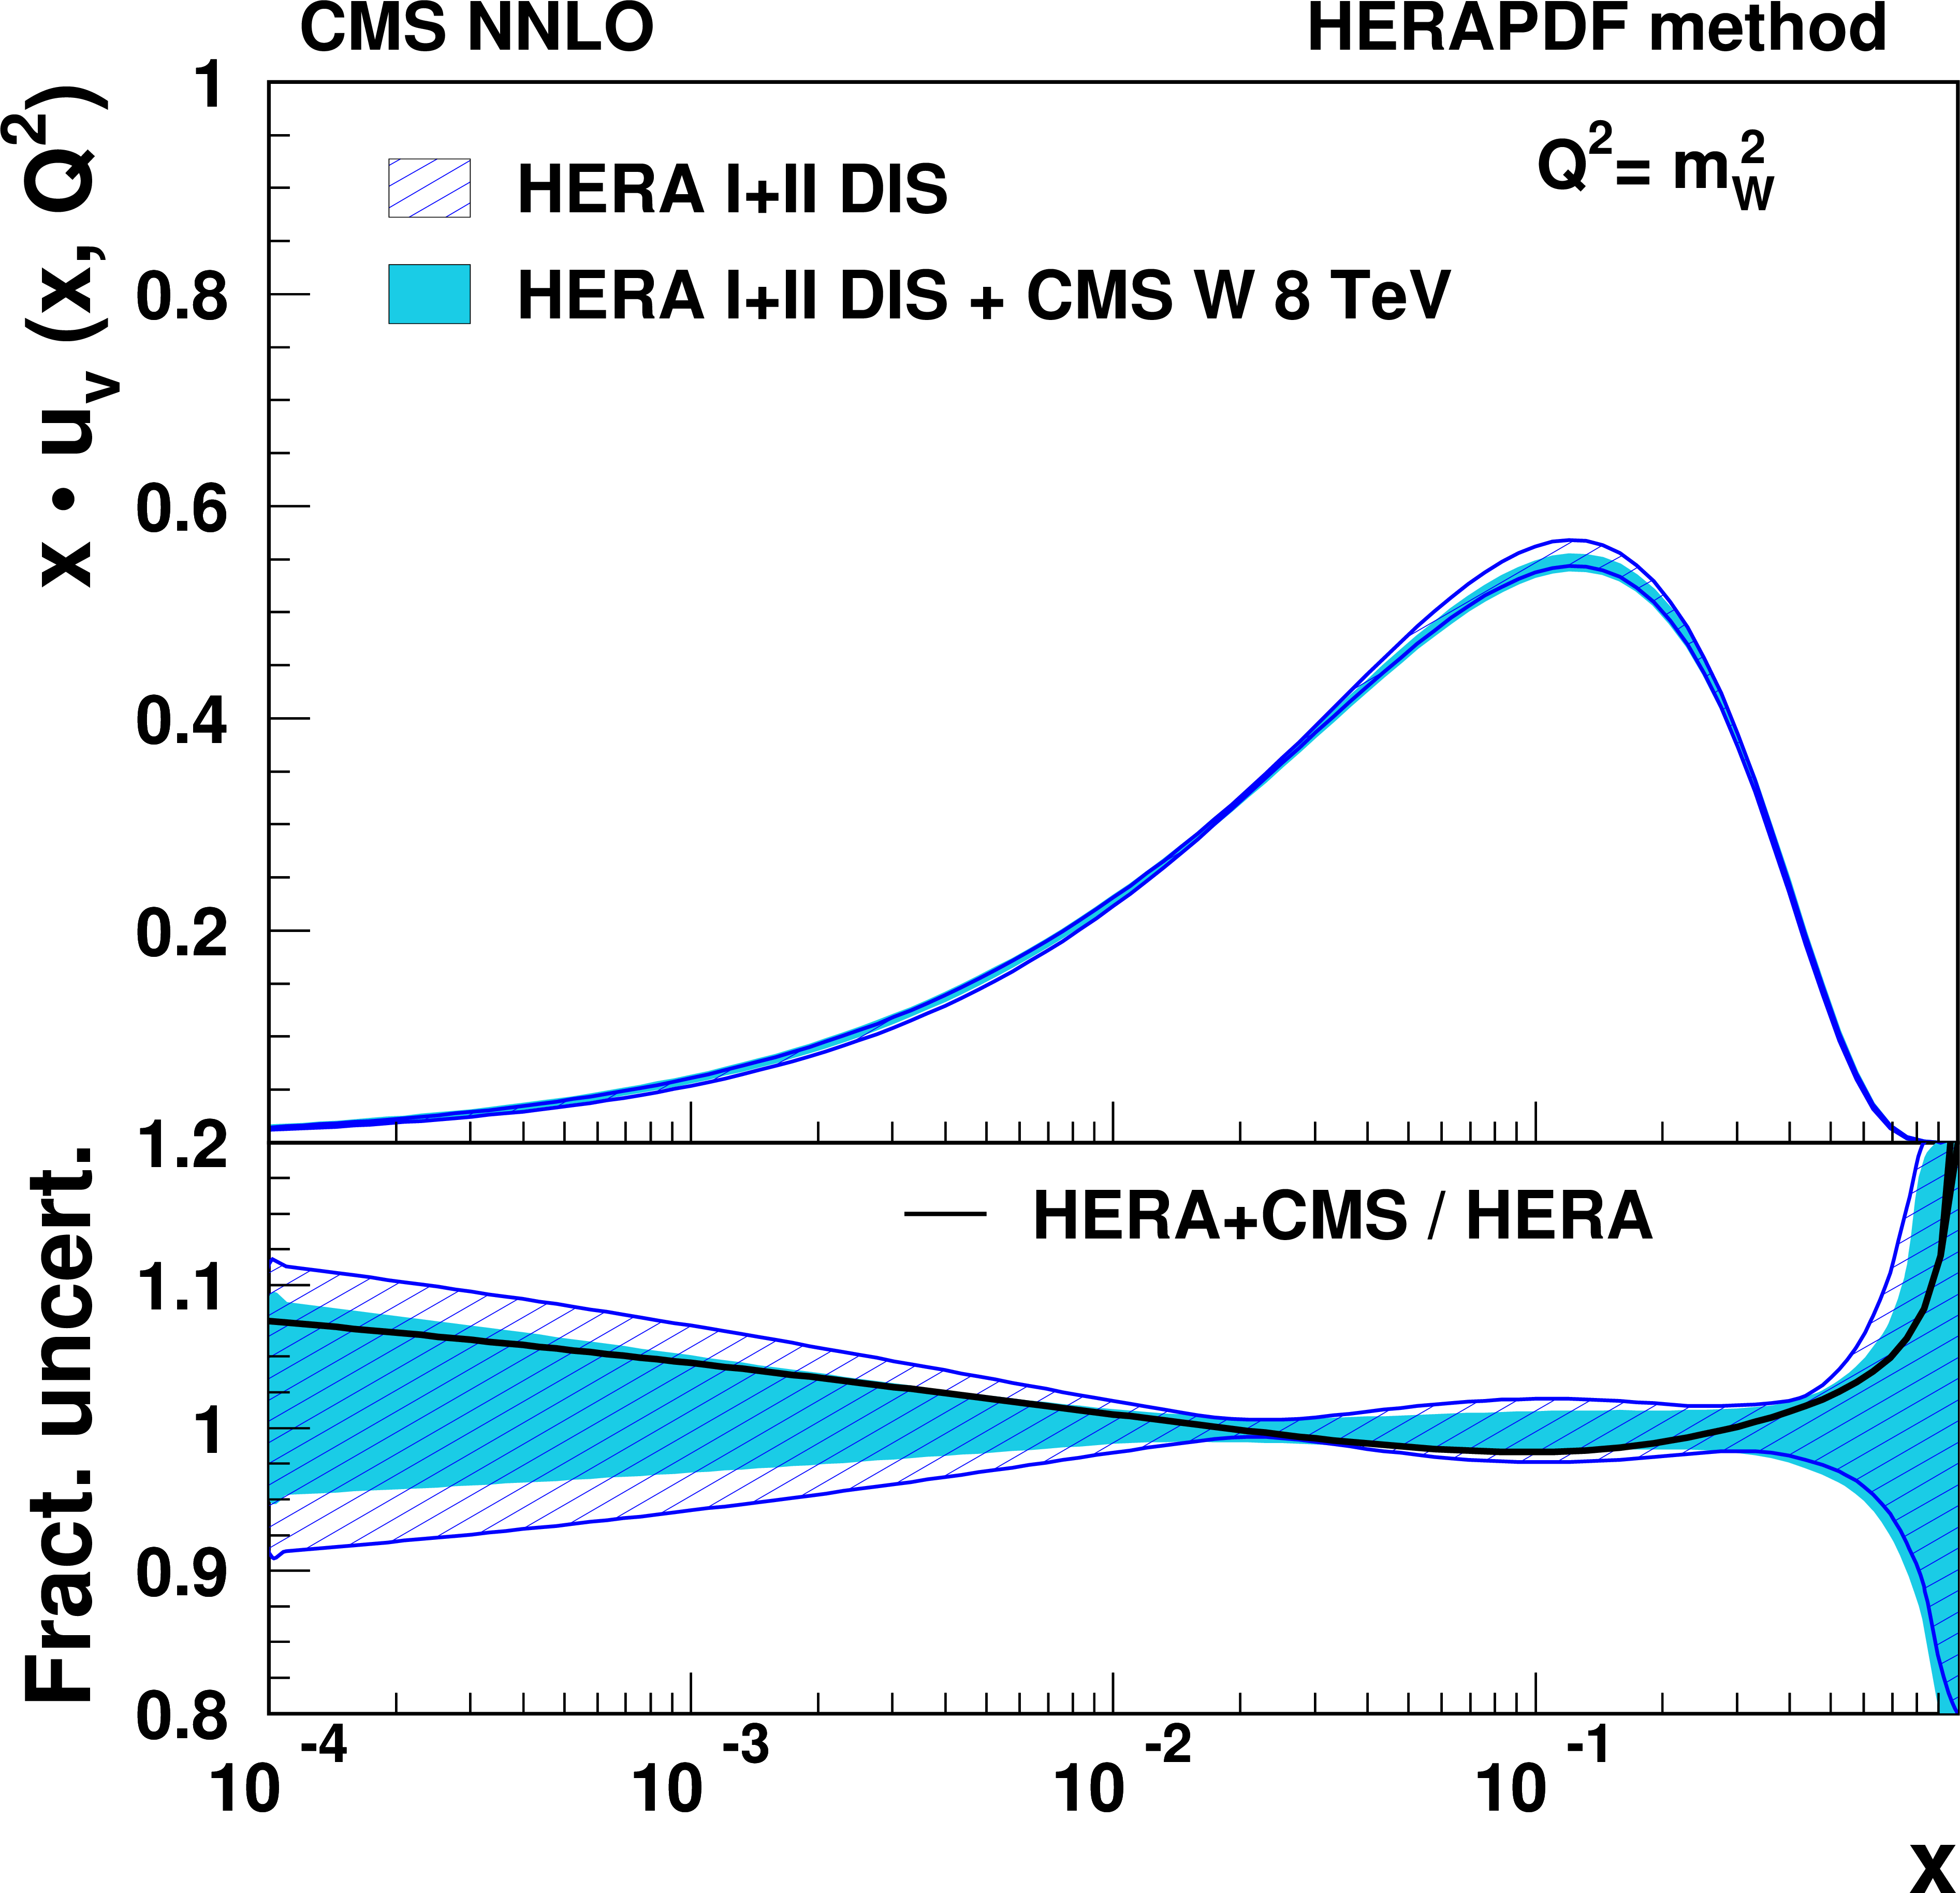
Figure 4-a:
Distribution of u valence quarks as a function of $x$ at the scale $Q^2=m^2_{\mathrm{ W } }$. The results of the fit to the HERA data and muon asymmetry measurements (light shaded band), and to HERA data only (hatched band) are compared. The total PDF uncertainties are shown. In the bottom panel the distribution is normalized to 1 for a direct comparison of the uncertainties. The change of the PDFs with respect to the HERA-only fit is represented by a solid line. |
png pdf |
Figure 4-b:
Distributions of d valence quarks as a function of $x$ at the scale $Q^2=m^2_{\mathrm{ W } }$. The results of the fit to the HERA data and muon asymmetry measurements (light shaded band), and to HERA data only (hatched band) are compared. The total PDF uncertainties are shown. In the bottom panel the distribution is normalized to 1 for a direct comparison of the uncertainties. The change of the PDFs with respect to the HERA-only fit is represented by a solid line. |
| Tables | |
png pdf |
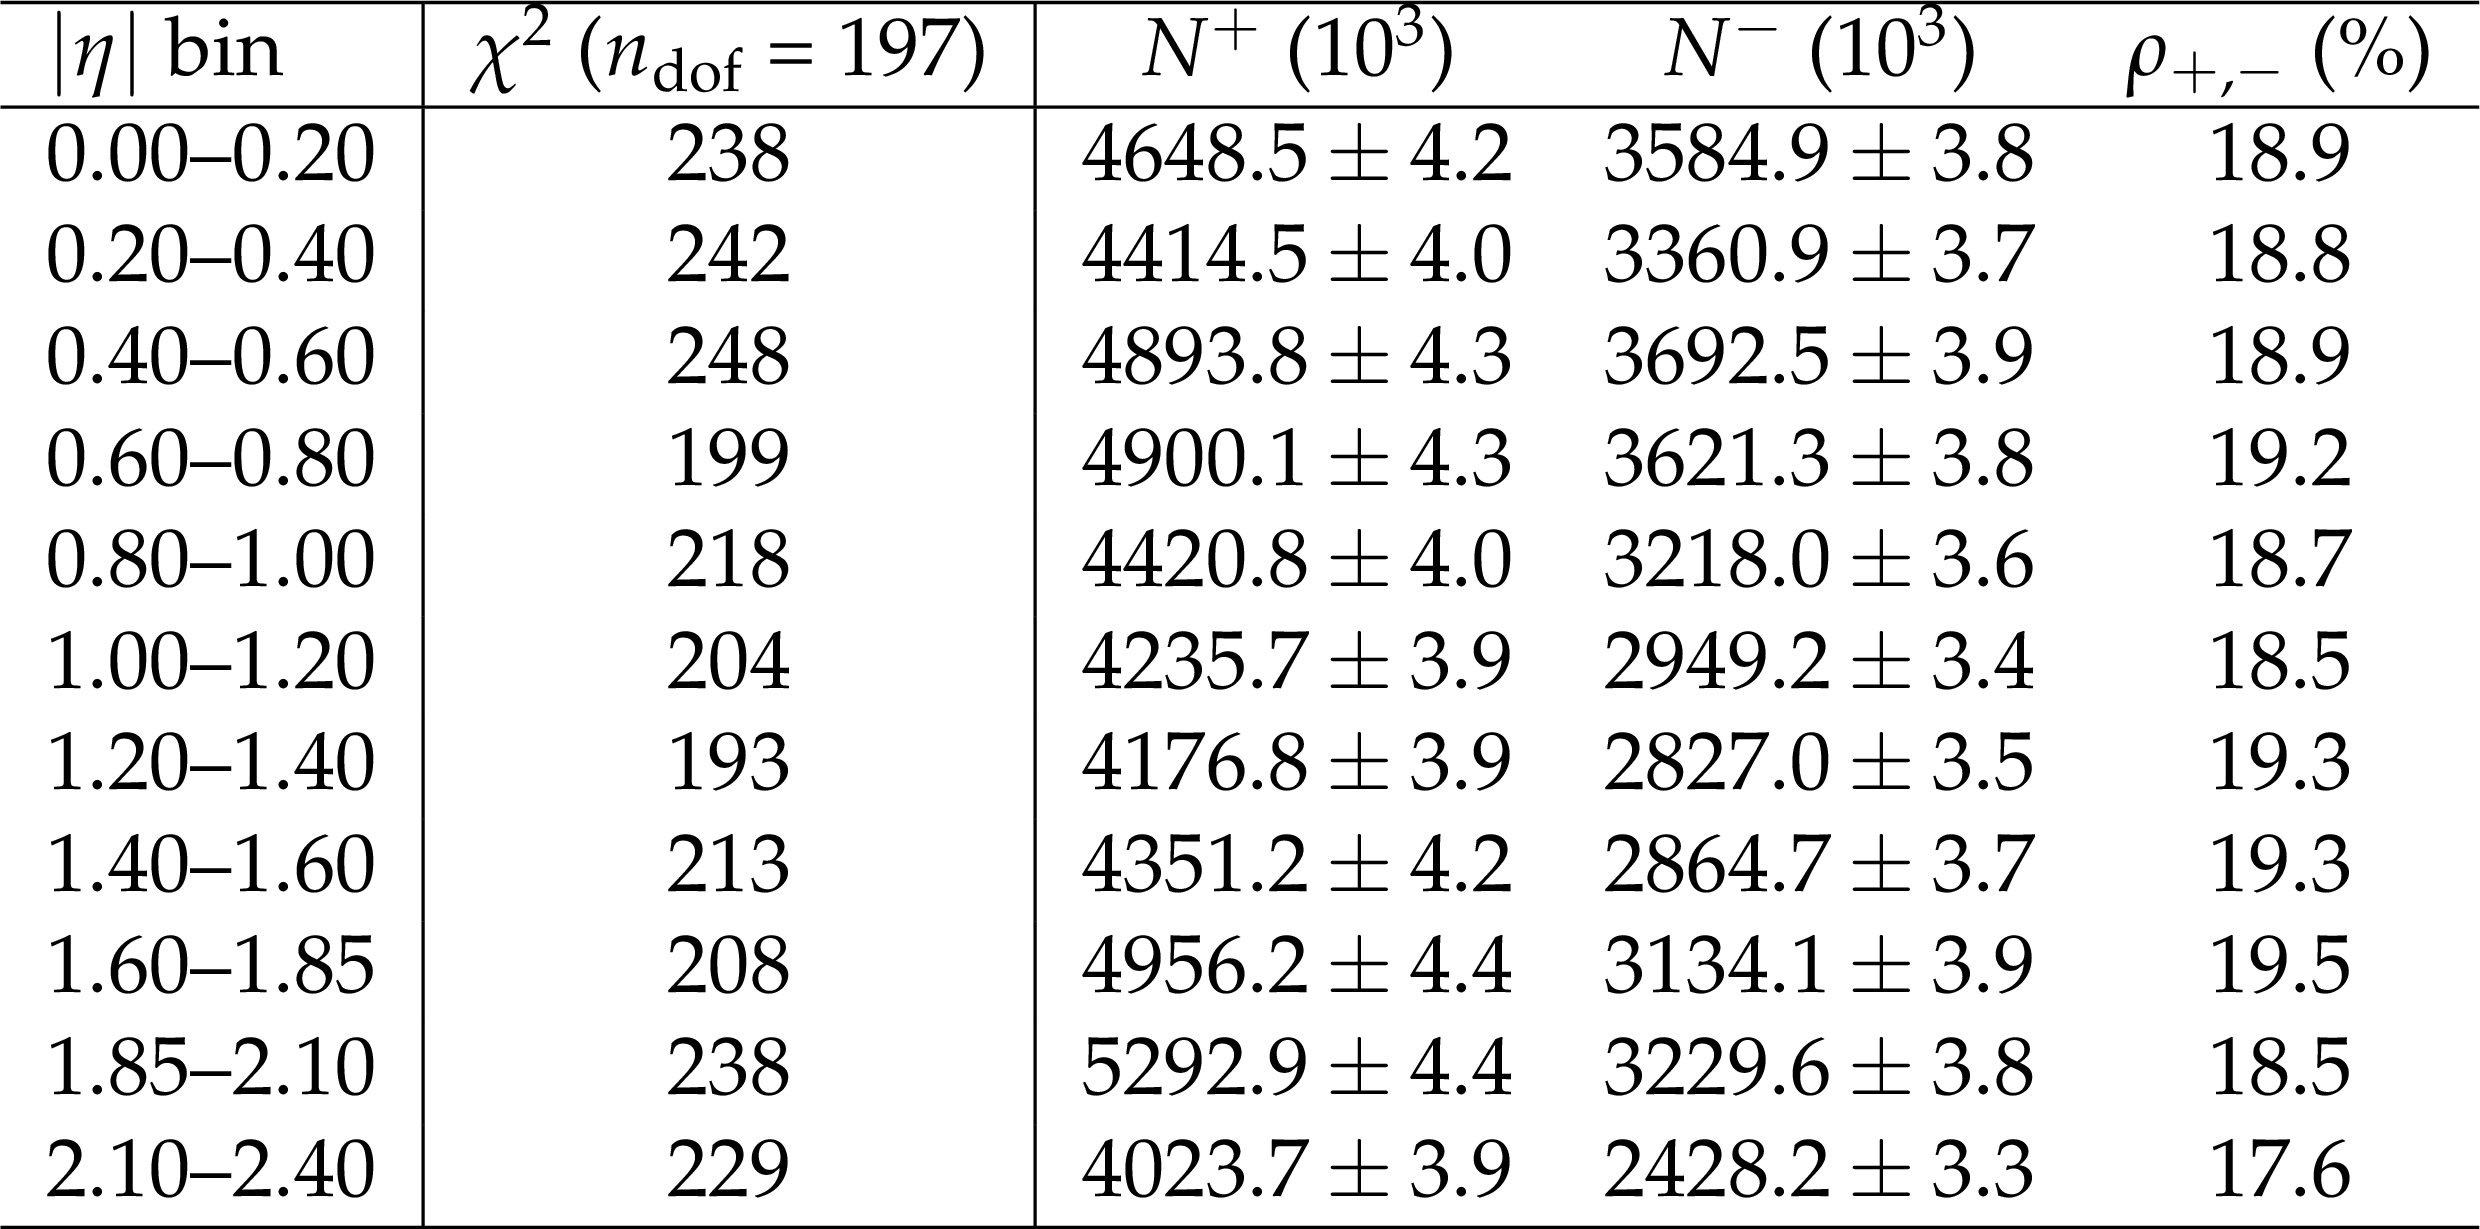
Table 1:
Summary of the fitted $N^{+}$, $N^{-}$, the correlation ($\rho _{+,-}$) between the uncertainties in $N^{+}$ and $N^{-}$, and the $\chi ^{2}$ of the fit for each $ {| \eta | }$ bin. The number of degrees of freedom($n_{\text {dof}}$) in each fit is 197. The quoted uncertainties are statistical and include statistical uncertainties in the templates. The correlation coefficients are expressed as percentages. |
png pdf |
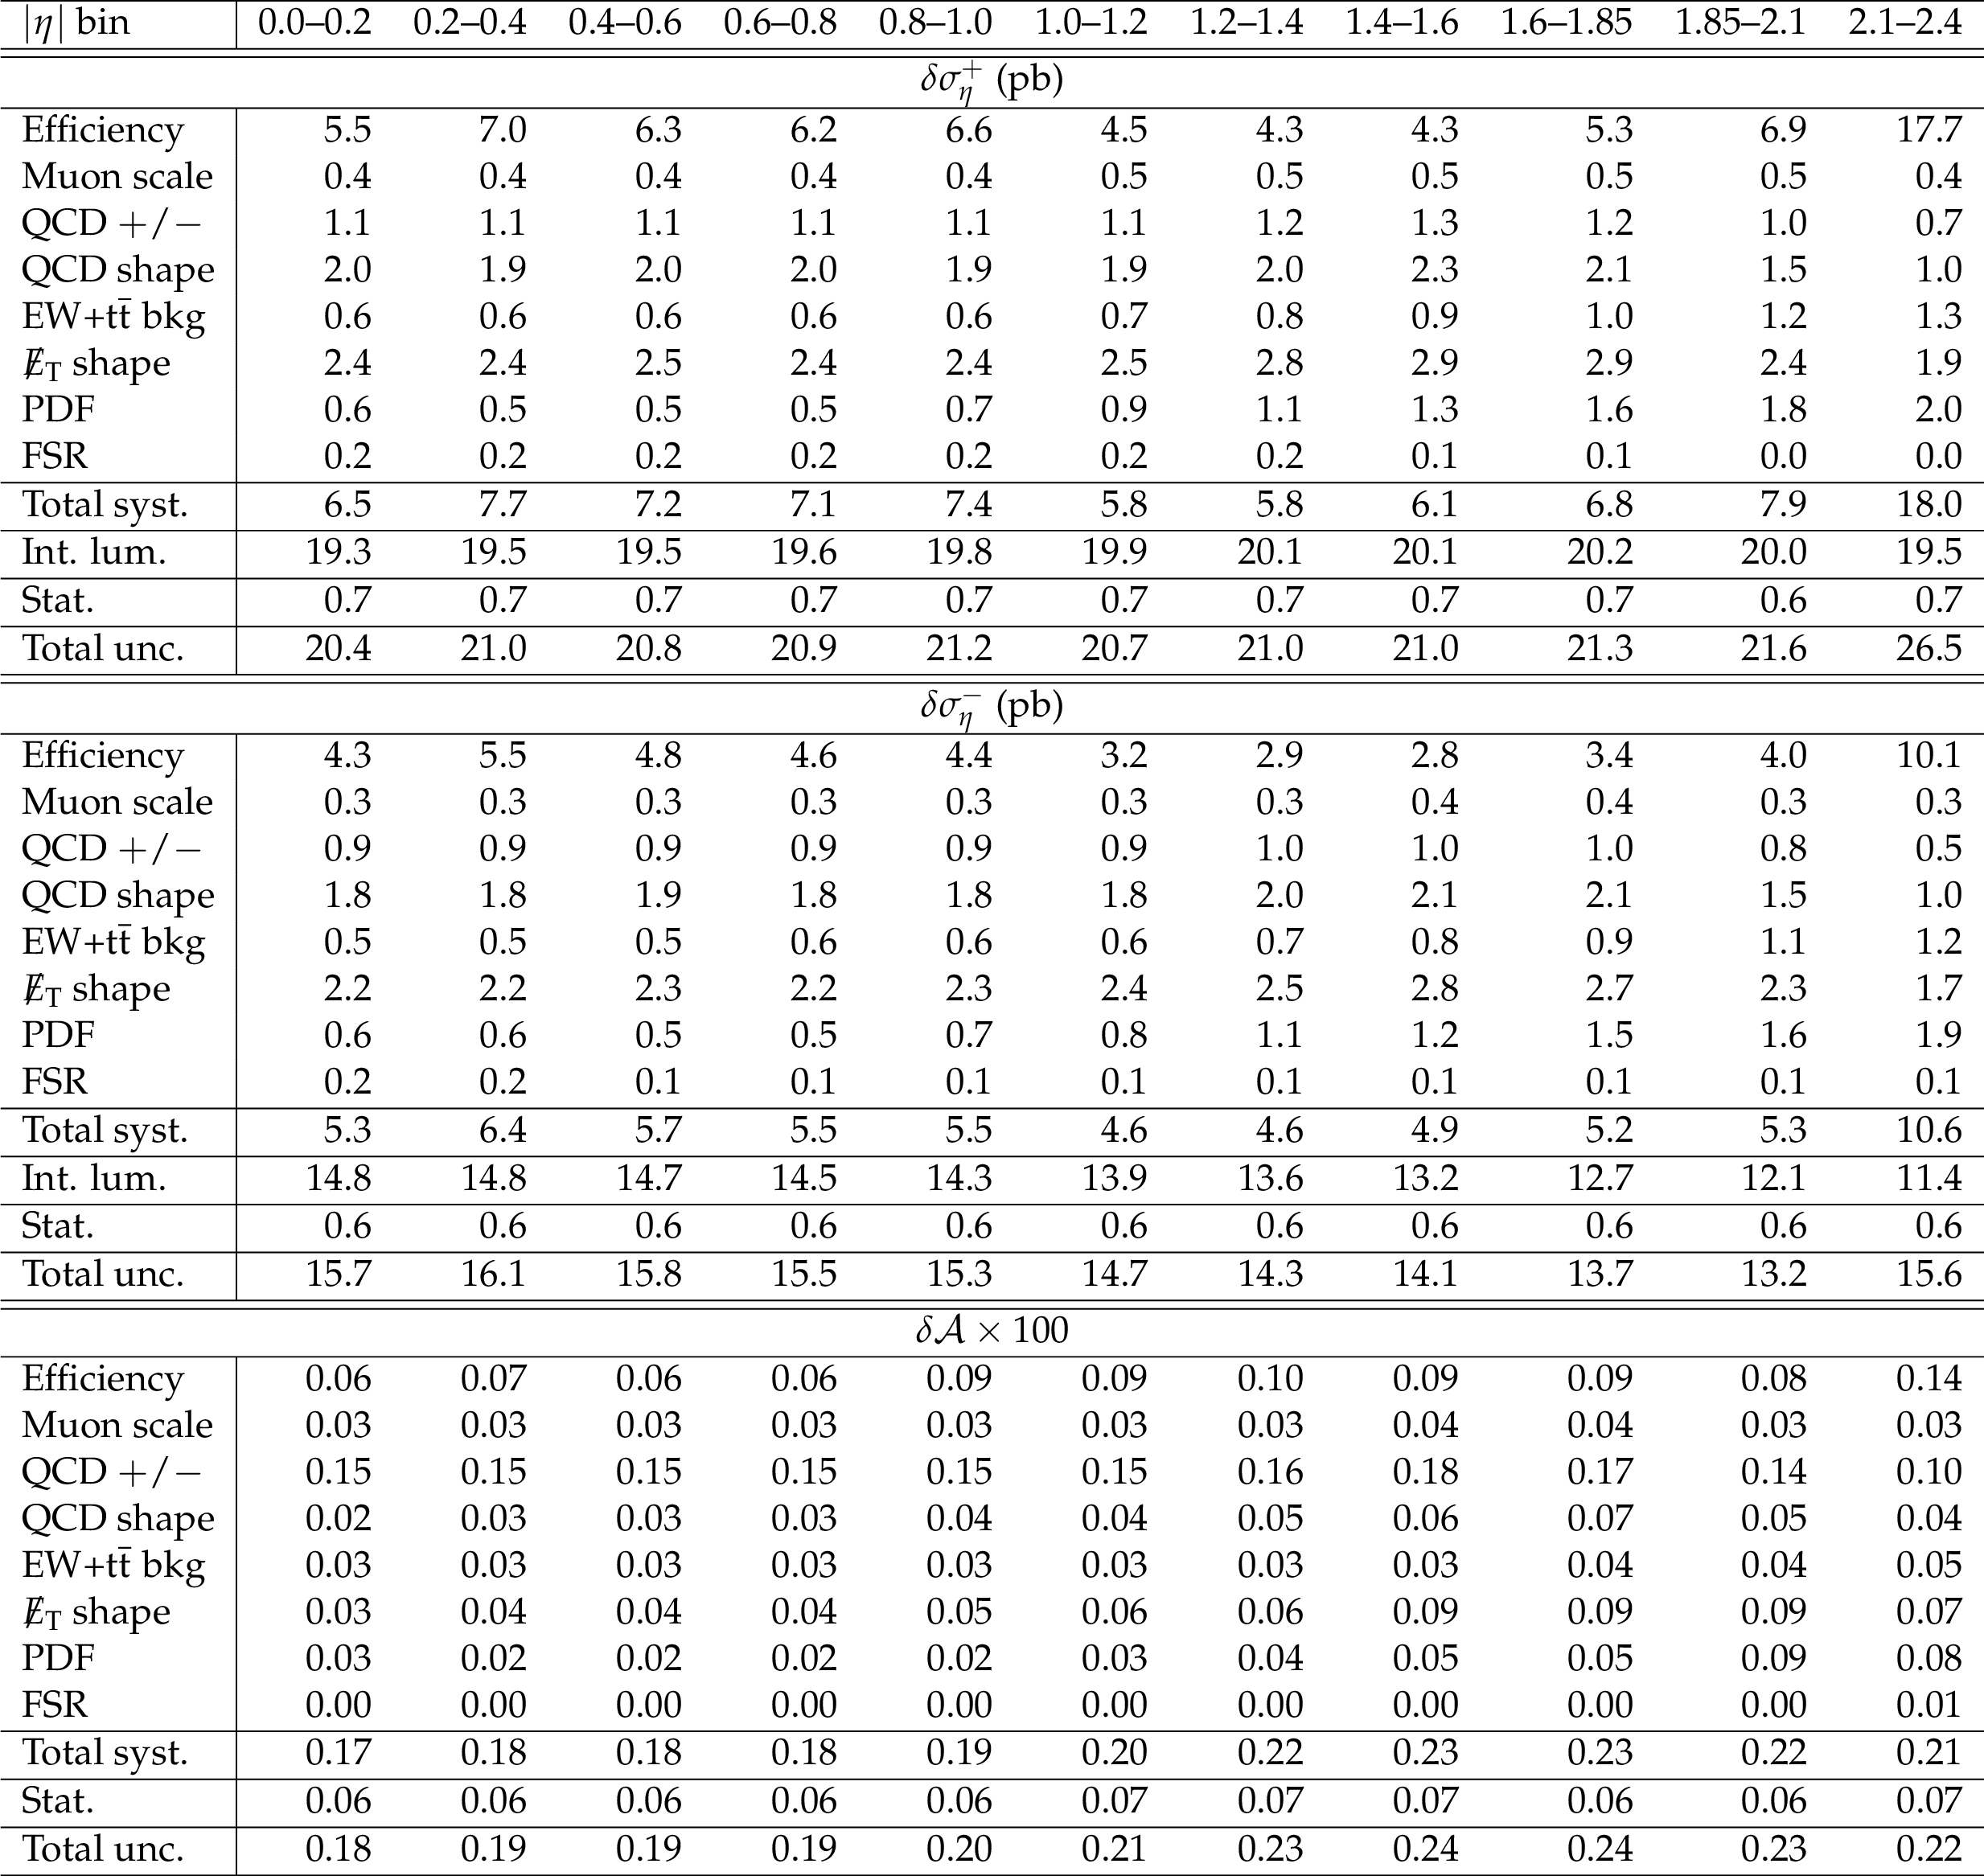
Table 2:
Systematic uncertainties in cross sections ($\delta {\sigma _\eta } ^\pm $) and charge asymmetry ($\delta \mathcal {A}$) for each $ {| \eta | }$ bin. The statistical and integrated luminosity uncertainties are also shown for comparison. A detailed description of each systematic uncertainty is given in the text. |
png pdf |
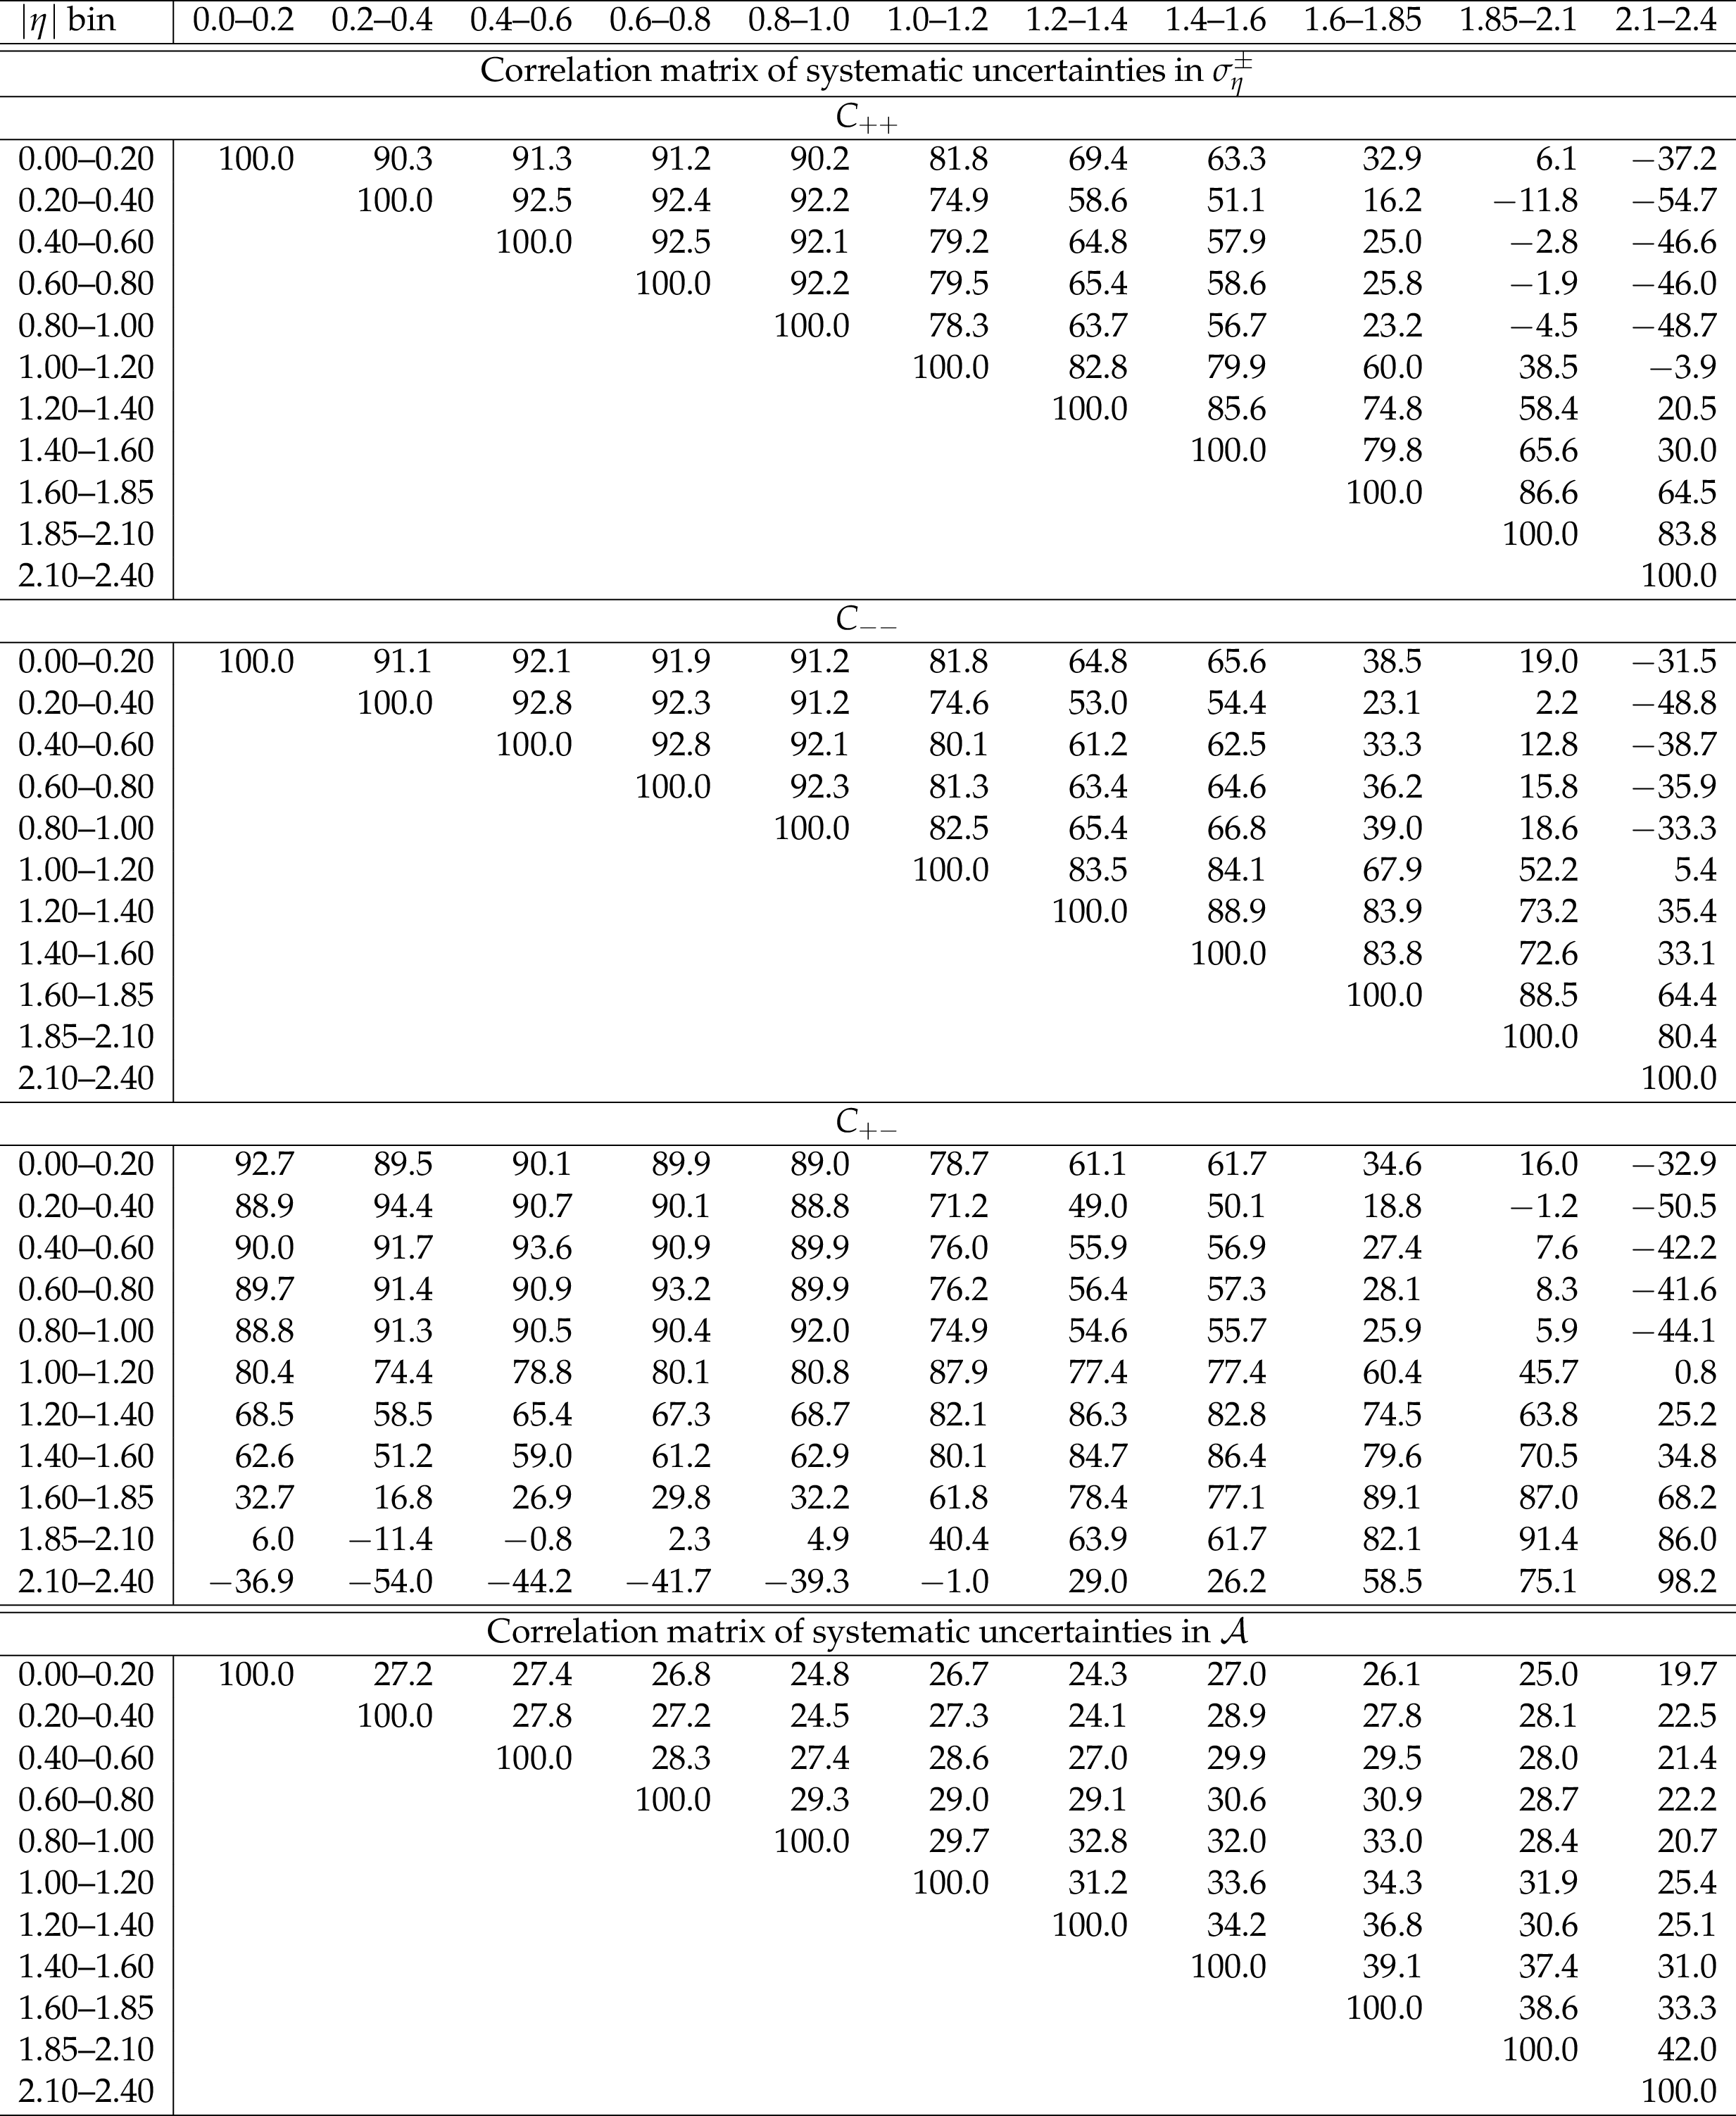
Table 3:
Correlation matrices of systematic uncertainties for $ {\sigma _\eta } ^\pm $ and $\mathcal {A}$. The statistical and integrated luminosity uncertainties are not included. The full 22$\times $22 correlation matrix for $ {\sigma _\eta } ^\pm $ is presented as four blocks of 11$\times $11 matrices. The $C_{++}$ and $C_{-}$ blocks on the diagonal represent the bin-to-bin correlations of $\delta {\sigma _\eta } ^+$ and $\delta {\sigma _\eta } ^-$, respectively. The off-diagonal $C_{+-}$ and $C_{+-}^T$ blocks describe the correlations between the two charges. The values are expressed as percentages. |
png pdf |
Table 4:
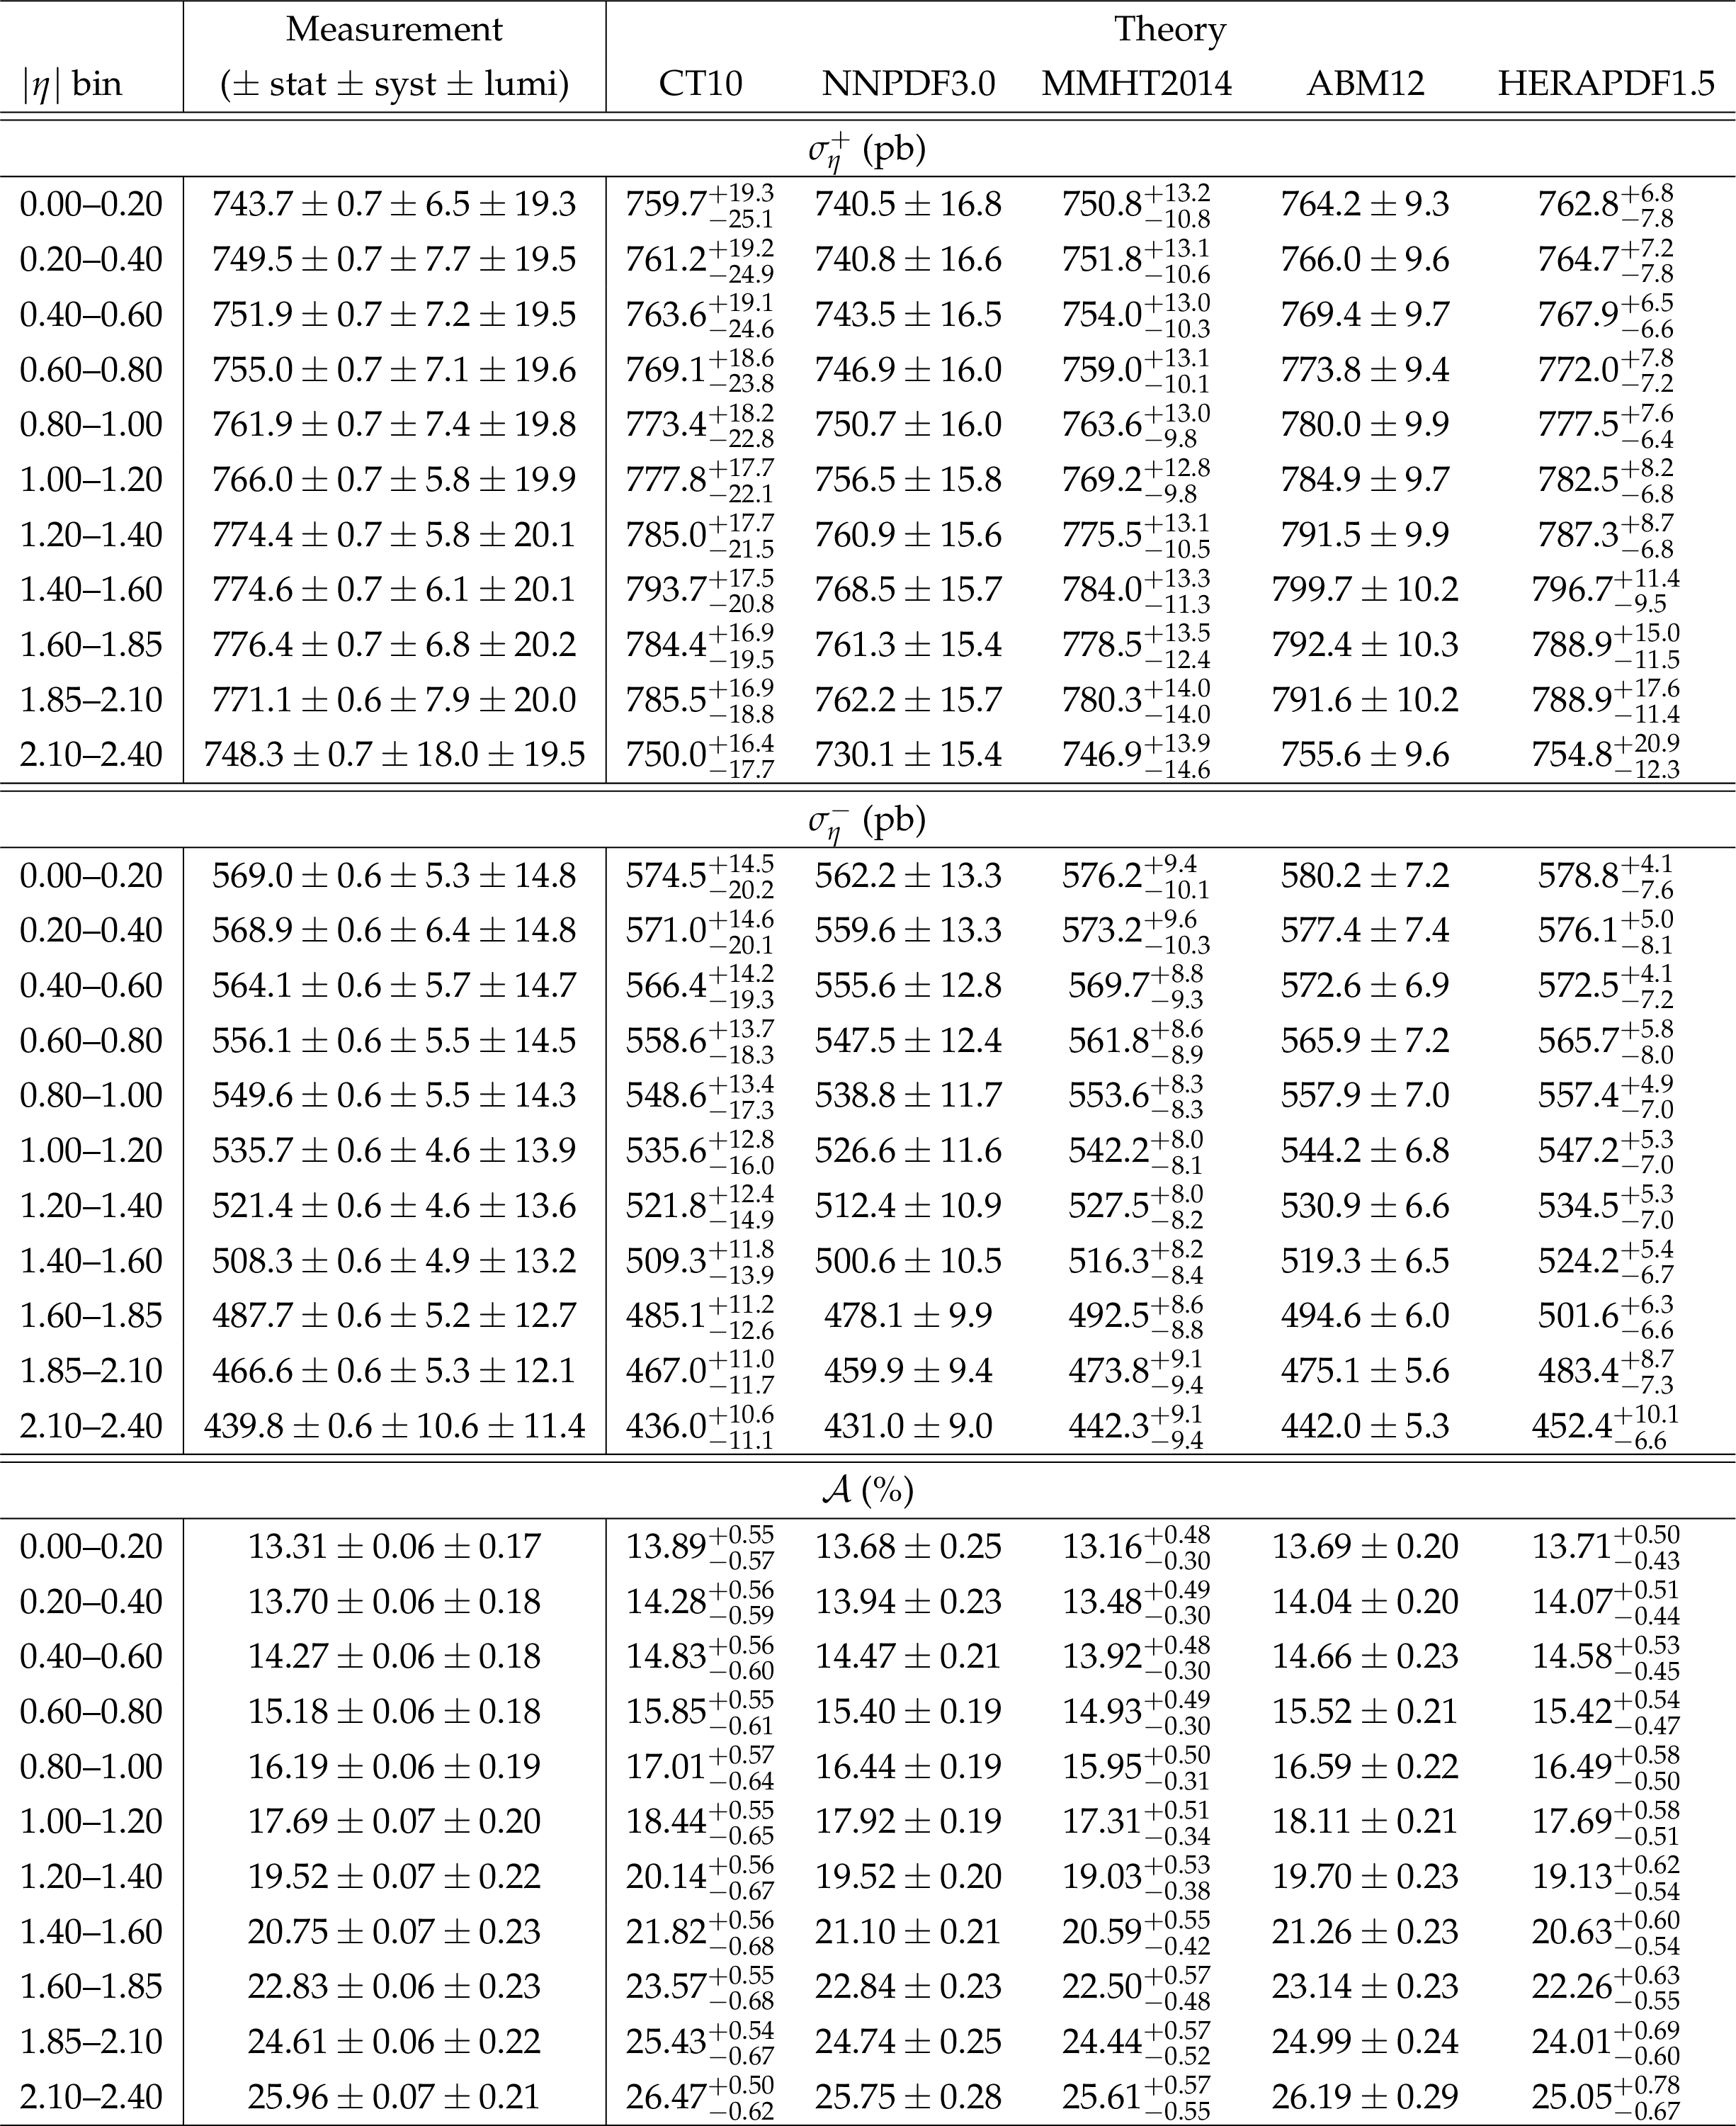
Summary of the measured differential cross sections $ {\sigma _\eta } ^\pm $ (pb) and charge asymmetry $\mathcal {A}$. The first uncertainty is statistical, the second uncertainty is systematic, and the third is the integrated luminosity uncertainty. The theoretical predictions are obtained using the fewz3.1 [37] NNLO MC tool interfaced with five different PDF sets. |
png pdf |
Table 5:
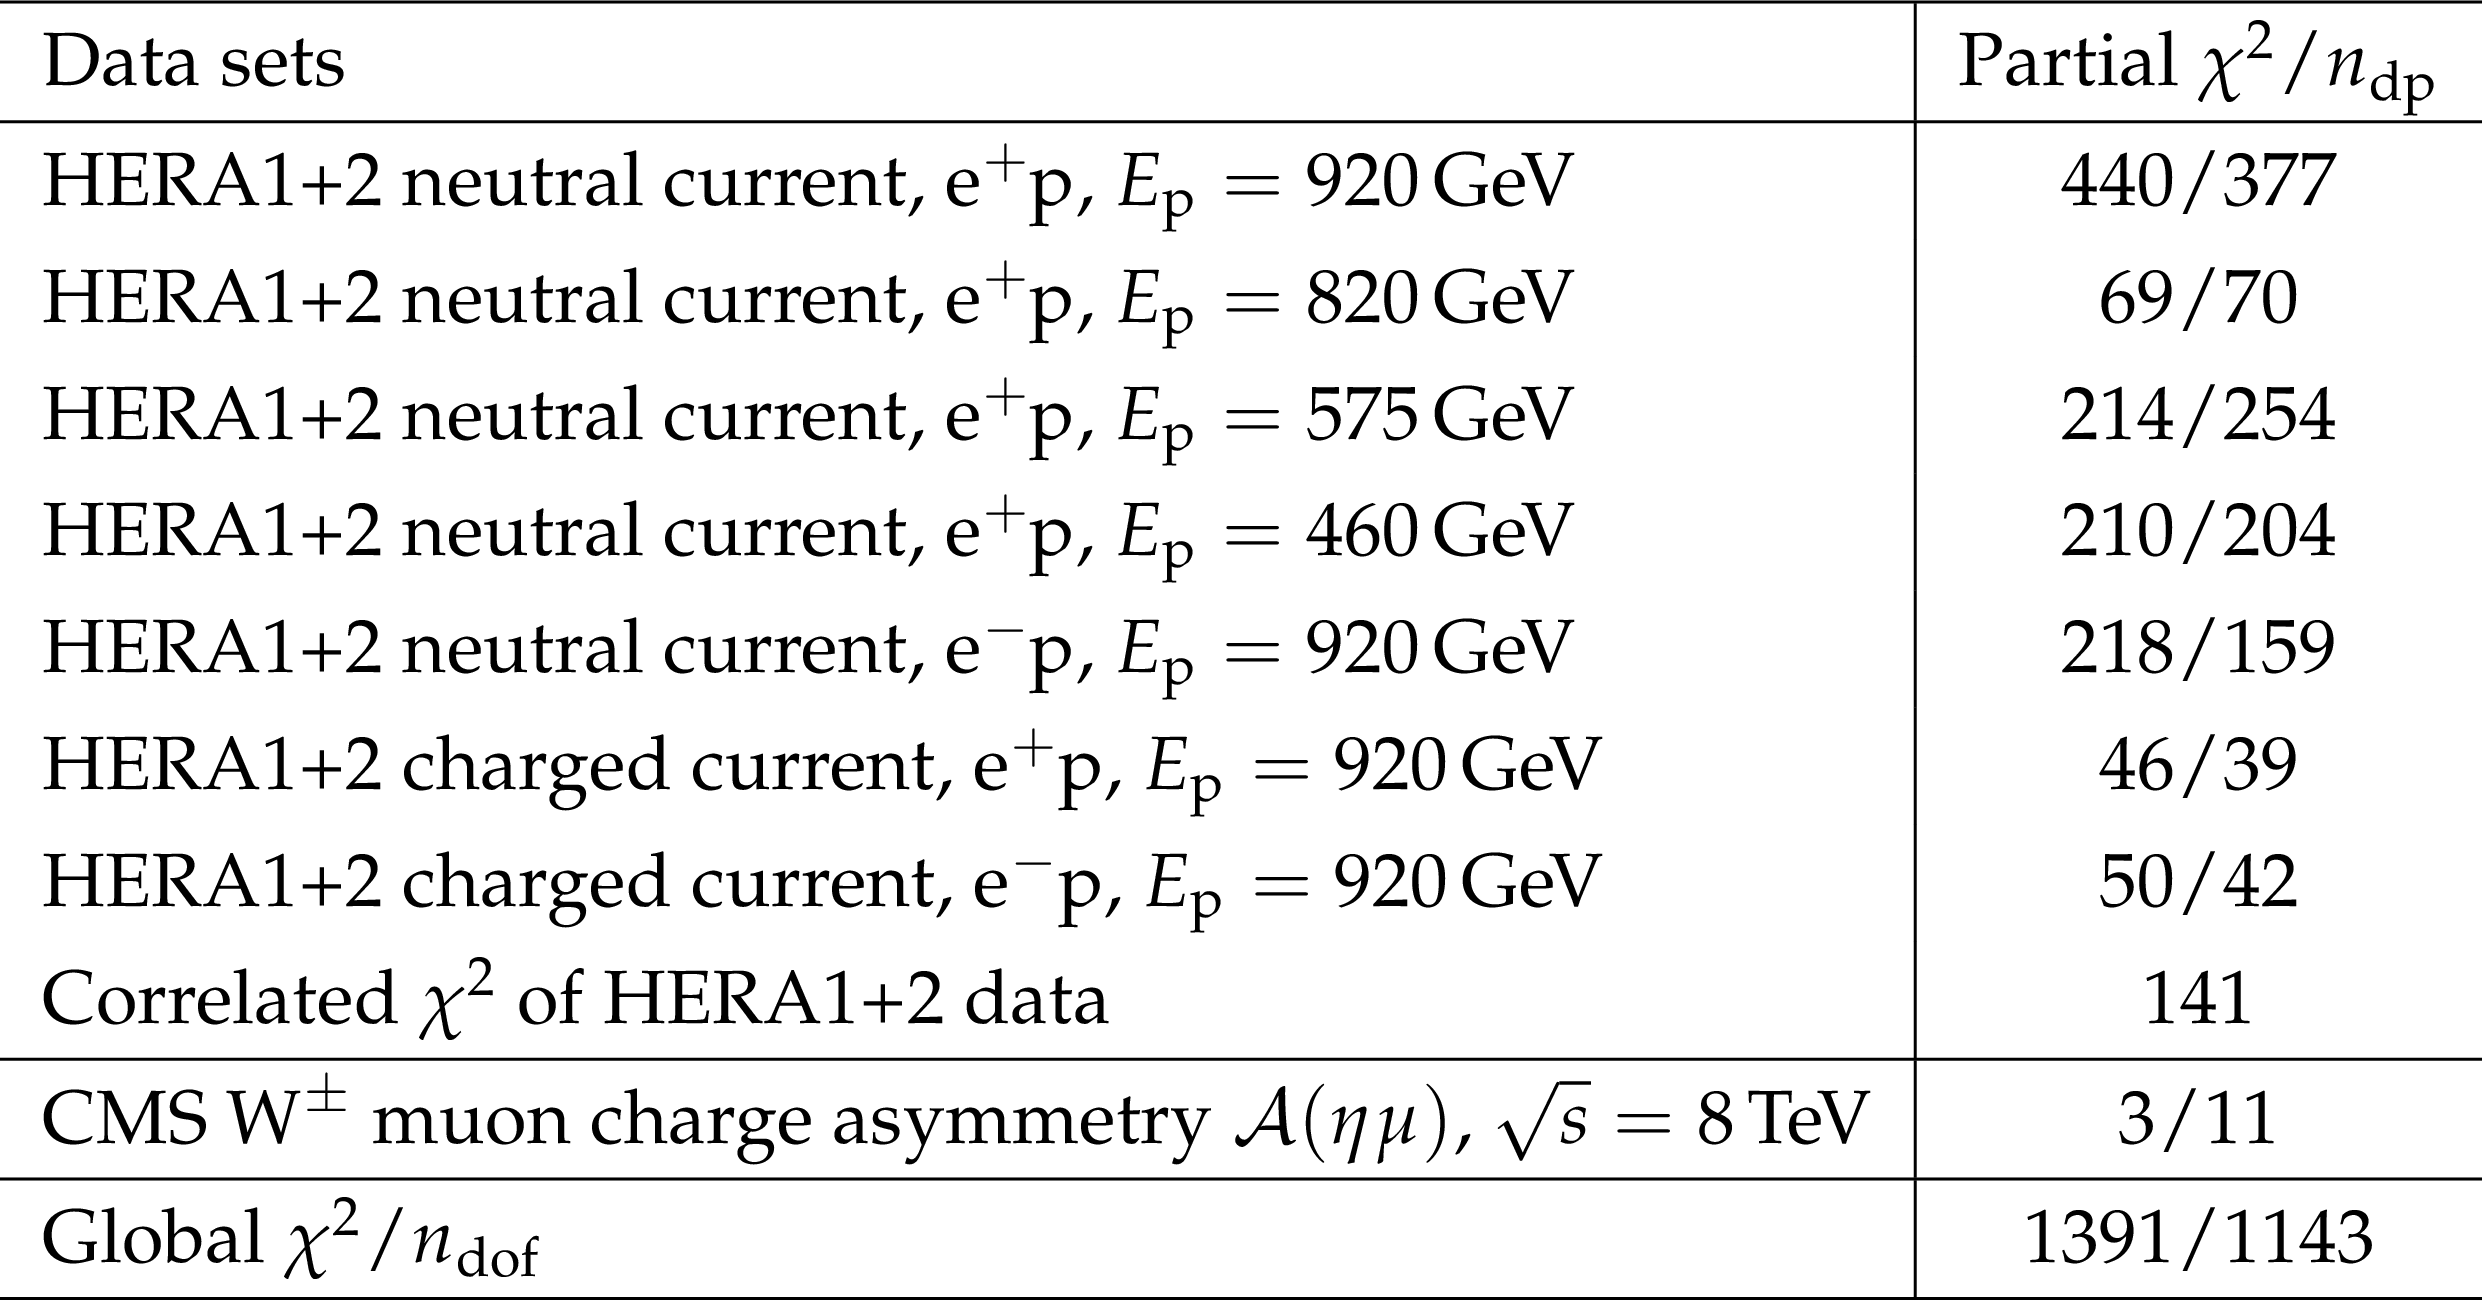
Partial $\chi ^2$ per number of data points, $n_{\text {dp}}$, and the global $\chi ^2$ per degrees of freedom, $n_{\text {dof}}$, as obtained in the QCD analysis of HERA DIS and the CMS muon charge asymmetry data. For HERA measurements, the energy of the proton beam is listed for each data set, with electron energy being $E_{ {\mathrm {e}}}=$ 27.5 GeV. |
| Summary |
| In summary, we have measured the differential cross section and charge asymmetry of the $\mathrm{W}^{\pm} \to \mu^{\pm}\nu$ production in pp collisions at $ \sqrt{s} = $ 8 TeV using a data sample corresponding to an integrated luminosity of 18.8 fb$^{-1}$ collected with the CMS detector at the LHC. The measurements were performed in 11 bins of absolute muon pseudorapidity $| \eta |$ for muons with $p_{\mathrm{T}}>$ 25 GeV. The results have been incorporated into a QCD analysis at next-to-next-to-leading-order together with the inclusive deep inelastic scattering data from HERA. A significant improvement in the accuracy of the valence quark distributions is observed in the range $10^{-3} < x <10^{-1}$, demonstrating the power of these muon charge asymmetry measurements to improve the main constraints on the valence distributions imposed by the HERA data, in the kinematics range probed. This strongly suggests the use of these measurements in future PDF determinations. |
| References | ||||
| 1 | J. D. Bjorken and E. A. Paschos | Inelastic electron--proton and $ \gamma $--proton scattering and the structure of the nucleon | PR185 (1969) 1975 | |
| 2 | CDF Collaboration | Measurement of the lepton charge asymmetry in $ \mathrm{ W } $ boson decays produced in $ \mathrm{ p } \mathrm{ \bar{p} } $ collisions | PRL 81 (1998) 5754 | hep-ex/9809001 |
| 3 | CDF Collaboration | Direct measurement of the $ \mathrm{ W } $ production charge asymmetry in $ \mathrm{ p } \mathrm{ \bar{p} } $ Collisions at $ \sqrt{s} = $ 1.96 TeV | PRL 102 (2009) 181801 | 0901.2169 |
| 4 | D0 Collaboration | Measurement of the muon charge asymmetry from $ \mathrm{ W } $ boson decays | PRD 77 (2008) 011106 | 0709.4254 |
| 5 | D0 Collaboration | Measurement of the electron charge asymmetry in $ \mathrm{ p } \mathrm{ \bar{p} } \to \mathrm{ W } + X \to \mathrm{ e } \nu + X $ events at $ \sqrt{s} = $ 1.96 TeV | PRL 101 (2008) 211801 | 0807.3367 |
| 6 | D0 Collaboration | Measurement of the muon charge asymmetry in $ \mathrm{ p } \mathrm{ \bar{p} } \to \mathrm{ W } + X \to \mu \nu + X $ events at $ \sqrt{s} = $ 1.96 TeV | PRD 88 (2013) 091102 | 1309.2591 |
| 7 | CMS Collaboration | Measurement of the lepton charge asymmetry in inclusive $ \mathrm{ W } $ production in $ \mathrm{ p }\mathrm{ p } $ collisions at $ \sqrt{s} = $ 7 TeV | JHEP 04 (2011) 050 | CMS-EWK-10-006 1103.3470 |
| 8 | ATLAS Collaboration | Measurement of the inclusive $ \mathrm{ W }^\pm $ and $ \mathrm{ Z }/\gamma $ cross sections in the $ \mathrm{ e } $ and $ \mu $ decay channels in $ \mathrm{ p }\mathrm{ p } $ collisions at $ \sqrt{s} = $ 7 TeV with the ATLAS detector | PRD 85 (2012) 072004 | 1109.5141 |
| 9 | LHCb Collaboration | Inclusive $ \mathrm{ W } $ and $ \mathrm{ Z } $ production in the forward region at $ \sqrt{s} = $ 7 TeV | JHEP 06 (2012) 058 | 1204.1620 |
| 10 | CMS Collaboration | Measurement of the Electron Charge Asymmetry in Inclusive $ \mathrm{ W } $ Production in $ \mathrm{ p }\mathrm{ p } $ Collisions at $ \sqrt{s} = $ 7 TeV | PRL 109 (2012) 111806 | CMS-SMP-12-001 1206.2598 |
| 11 | CMS Collaboration | Measurement of the muon charge asymmetry in inclusive $ \mathrm{ p }\mathrm{ p } \rightarrow \mathrm{ W }+X $ production at $ \sqrt s = 7 TeV $ and an improved determination of light parton distribution functions | PRD 90 (2014) 032004 | CMS-SMP-12-021 1312.6283 |
| 12 | CMS Collaboration | The CMS experiment at the CERN LHC | JINST 3 (2008) S08004 | CMS-00-001 |
| 13 | S. Alioli, P. Nason, C. Oleari, and E. Re | NLO vector-boson production matched with shower in POWHEG | JHEP 07 (2008) 060 | 0805.4802 |
| 14 | P. Nason | A new method for combining NLO QCD with shower Monte Carlo algorithms | JHEP 11 (2004) 040 | hep-ph/0409146 |
| 15 | S. Frixione, P. Nason, and C. Oleari | Matching NLO QCD computations with parton shower simulations: the POWHEG method | JHEP 11 (2007) 070 | 0709.2092 |
| 16 | S. Alioli, P. Nason, C. Oleari, and E. Re | A general framework for implementing NLO calculations in shower Monte Carlo programs: the POWHEG BOX | JHEP 06 (2010) 043 | 1002.2581 |
| 17 | T. Sj\"ostrand, S. Mrenna, and P. Skands | PYTHIA 6.4 physics and manual | JHEP 05 (2006) 026 | hep-ph/0603175 |
| 18 | H.-L. Lai et al. | New parton distributions for collider physics | PRD 82 (2010) 074024 | 1007.2241 |
| 19 | N. Davidson et al. | Universal Interface of TAUOLA Technical and Physics Documentation | CPC 183 (2012) 821 | 1002.0543 |
| 20 | J. Pumplin et al. | New generation of parton distributions with uncertainties from global QCD analysis | JHEP 07 (2002) 012 | hep-ph/0201195 |
| 21 | GEANT4 Collaboration | GEANT4---a simulation toolkit | NIMA 506 (2003) 250 | |
| 22 | A. Bodek et al. | Extracting muon momentum scale corrections for hadron collider experiments | EPJC 72 (2012) 2194 | 1208.3710 |
| 23 | CMS Collaboration | Measurements of inclusive $ \mathrm{ W } $ and $ \mathrm{ Z } $ cross sections in $ \mathrm{ p }\mathrm{ p } $ collisions at $ \sqrt{s} = $ 7 TeV with the CMS experiment | JHEP 10 (2011) 132 | CMS-EWK-10-005 1107.4789 |
| 24 | CMS Collaboration | Performance of CMS muon reconstruction in $ \mathrm{ p }\mathrm{ p } $ collision events at $ \sqrt{s} = $ 7 TeV | JINST 7 (2012) P10002 | CMS-MUO-10-004 1206.4071 |
| 25 | CMS Collaboration | Particle-flow event reconstruction in CMS and performance for jets, taus, and $ E_{\mathrm{T}}^{\text{miss}} $ | CDS | |
| 26 | CMS Collaboration | Commissioning of the particle-flow event reconstruction with the first LHC collisions recorded in the CMS detector | CDS | |
| 27 | CMS Collaboration | Performance of the CMS missing transverse momentum reconstruction in pp data at $ \sqrt{s} = $ 8 TeV | JINST 10 (2015) P02006 | CMS-JME-13-003 1411.0511 |
| 28 | D0 Collaboration | A novel method for modeling the recoil in $ \mathrm{ W } $ boson events at hadron collider | NIMA 609 (2009) 250 | 0907.3713 |
| 29 | CMS Collaboration | Missing transverse energy performance of the CMS detector | JINST 6 (2011) P09001 | CMS-JME-10-009 1106.5048 |
| 30 | M. Czakon and A. Mitov | Top++: a program for the calculation of the top-pair cross-section at hadron colliders | CPC 185 (2014) 2930 | 1112.5675 |
| 31 | Particle Data Group Collaboration | Review of particle physics | CPC 38 (2014) 090001 | |
| 32 | G. Nanava and Z. Was | How to use SANC to improve the PHOTOS Monte Carlo simulation of bremsstrahlung in leptonic $ \mathrm{ W } $ boson decays | Acta Phys. Polon. B 34 (2003) 4561 | hep-ph/0303260 |
| 33 | H. Burkhardt and B. Pietrzyk | Update of the hadronic contribution to the QED vacuum polarization | PLB 513 (2001) 46 | |
| 34 | A. D. Martin, W. J. Stirling, R. S. Thorne, and G. Watt | Parton distributions for the LHC | EPJC 63 (2009) 189 | 0901.0002 |
| 35 | NNPDF Collaboration | Impact of heavy quark masses on parton distributions and LHC phenomenology | Nucl. Phys. B 849 (2011) 296 | 1101.1300 |
| 36 | CMS Collaboration | CMS luminosity based on pixel cluster counting -- Summer 2013 update | CMS-PAS-LUM-13-001 | CMS-PAS-LUM-13-001 |
| 37 | Y. Li and F. Petriello | Combining QCD and electroweak corrections to dilepton production in the framework of the FEWZ simulation code | PRD 86 (2012) 094034 | 1208.5967 |
| 38 | NNPDF Collaboration | Parton distributions for the LHC Run II | JHEP 04 (2015) 040 | 1410.8849 |
| 39 | H1 and ZEUS Collaborations | Combination and QCD Analysis of the HERA Inclusive Cross Sections | in Proc. of the 35th Int. Conf. of High Energy Physics, volume 168 2010 PoS(ICHEP2010)168 | |
| 40 | L. A. Harland-Lang, A. D. Martin, P. Motylinski, and R. S. Thorne | Parton distributions in the LHC era: MMHT 2014 PDFs | EPJC 75 (2015) 204 | 1412.3989 |
| 41 | S. Alekhin, J. Blumlein, and S. Moch | The ABM parton distributions tuned to LHC data | PRD 89 (2014) 054028 | 1310.3059 |
| 42 | H1 and ZEUS Collaborations | Combination of measurements of inclusive deep inelastic $ {\mathrm{ e }^{\pm }\mathrm{ p }} $ scattering cross sections and QCD analysis of HERA data | EPJC 75 (2015) 580 | 1506.06042 |
| 43 | J. M. Campbell and R. K. Ellis | Update on vector boson pair production at hadron colliders | PRD 60 (1999) 113006 | hep-ph/9905386 |
| 44 | J. M. Campbell and R. K. Ellis | MCFM for the Tevatron and the LHC | NPPS 205--206 (2010) 10 | 1007.3492 |
| 45 | T. Carli et al. | A posteriori inclusion of parton density functions in NLO QCD final-state calculations at hadron colliders: the APPLGRID project | EPJC 66 (2010) 503 | 0911.2985 |
| 46 | S. Alekhin et al. | HERAFitter, Open source QCD fit project | EPJC 75 (2015) 304 | 1410.4412 |
| 47 | HERAFitter Collaboration | HERAFitter | HERAFitter web site | |
| 48 | V. N. Gribov and L. N. Lipatov | Deep inelastic $ \mathrm{ e } $-$ \mathrm{ p } $ scattering in perturbation theory | Sov. J. Nucl. Phys. 15 (1972)438 | |
| 49 | G. Altarelli and G. Parisi | Asymptotic freedom in parton language | Nucl. Phys. B 126 (1977) 298 | |
| 50 | G. Curci, W. Furmanski, and R. Petronzio | Evolution of parton densities beyond leading order: The non-singlet case | Nucl. Phys. B 175 (1980) 27 | |
| 51 | W. Furmanski and R. Petronzio | Singlet parton densities beyond leading order | PLB 97 (1980) 437 | |
| 52 | S. Moch, J. A. M. Vermaseren, and A. Vogt | The three-loop splitting functions in QCD: the non-singlet case | Nucl. Phys. B 688 (2004) 101 | hep-ph/0403192 |
| 53 | A. Vogt, S. Moch, and J. A. M. Vermaseren | The three-loop splitting functions in QCD: the singlet case | Nucl. Phys. B 691 (2004) 129 | hep-ph/0404111 |
| 54 | M. Botje | QCDNUM: fast QCD evolution and convolution | CPC 182 (2011) 490 | 1005.1481 |
| 55 | R. S. Thorne | Variable-flavor number scheme for NNLO | PRD 73 (2006) 054019 | hep-ph/0601245 |
| 56 | H1 and ZEUS Collaborations | Combined measurement and QCD analysis of the inclusive $ \mathrm{ e }^\pm \mathrm{ p } $ scattering cross sections at HERA | JHEP 01 (2010) 109 | 0911.0884 |
|
|
Compact Muon Solenoid LHC, CERN |
|

|

|

|

|

|