

Compact Muon Solenoid
LHC, CERN
| CMS-SUS-14-010 ; CERN-PH-EP-2014-286 | ||
| Searches for supersymmetry based on events with b jets and four W bosons in pp collisions at 8 TeV | ||
| CMS Collaboration | ||
| 13 December 2014 | ||
| Phys. Lett. B 745 (2015) 5 | ||
| Abstract: Five mutually exclusive searches for supersymmetry are presented based on events in which b jets and four W bosons are produced in proton-proton collisions at $\sqrt{s}$ = 8 TeV. The data, corresponding to an integrated luminosity of 19.5 fb$^{-1}$, were collected with the CMS experiment at the CERN LHC in 2012. The five studies differ in the leptonic signature from the W boson decays, and correspond to all-hadronic, single-lepton, opposite-sign dilepton, same-sign dilepton, and $ \ge $ 3 lepton final states. The results of the five studies are combined to yield 95% confidence level limits for the gluino and bottom-squark masses in the context of gluino and bottom-squark pair production, respectively. In the limit when the lightest supersymmetric particle is light, gluino and bottom-squark masses are excluded below 1280 and 570 GeV, respectively. | ||
| Links: e-print arXiv:1412.4109 [hep-ex] (PDF) ; CDS record ; inSPIRE record ; Public twiki page ; CADI line (restricted) ; | ||
| Figures | |
png pdf |
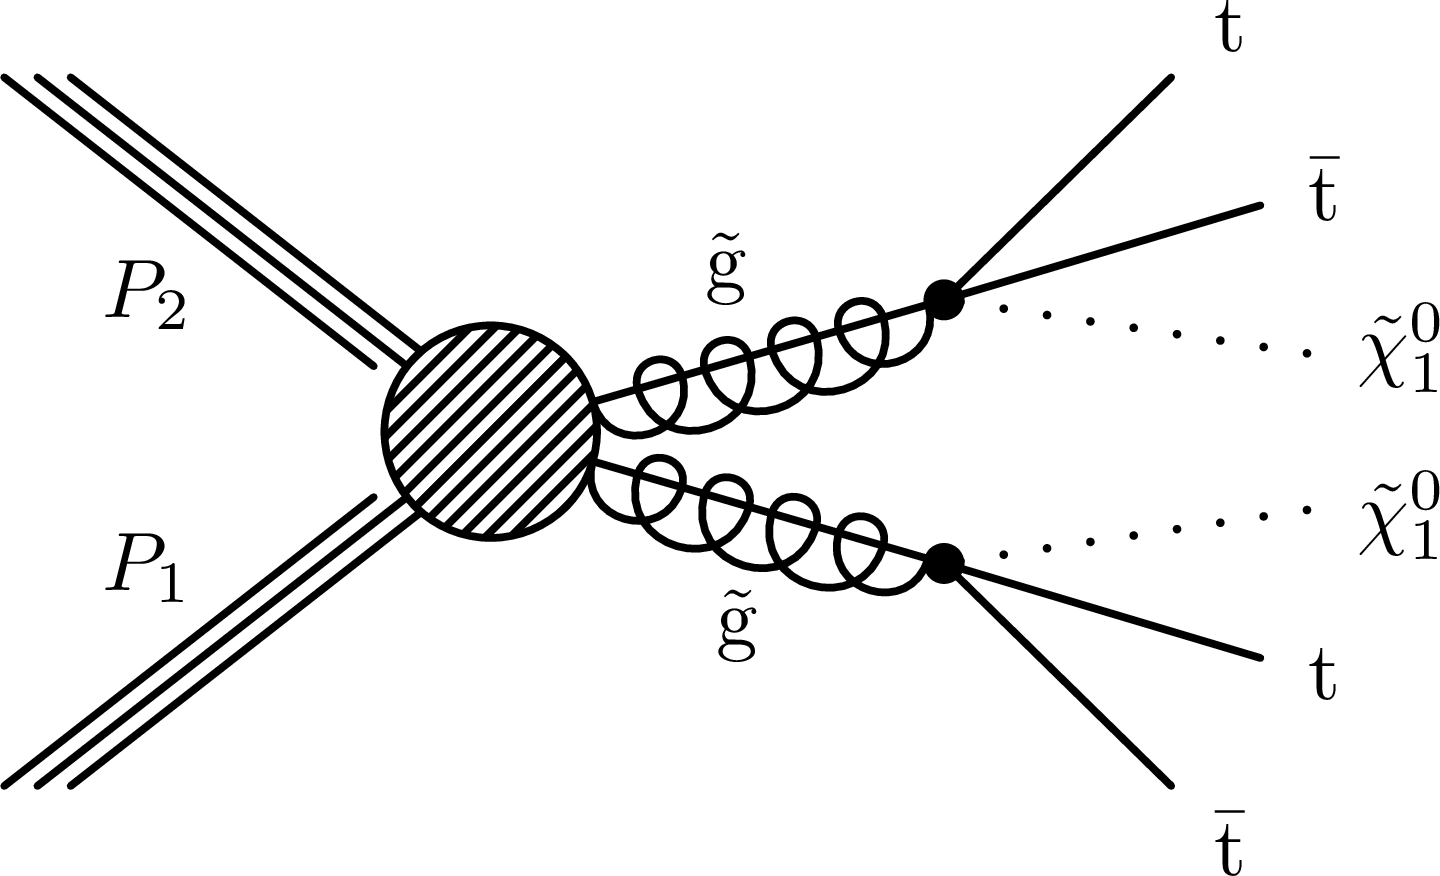
Figure 1-a:
Feynman diagrams for the signals from: (a) gluino pair production with intermediate virtual top squarks (T1tttt), (b) gluino pair production with intermediate on-shell top squarks (T5tttt), and (c) bottom squark pair production (T6ttWW). |
png pdf |
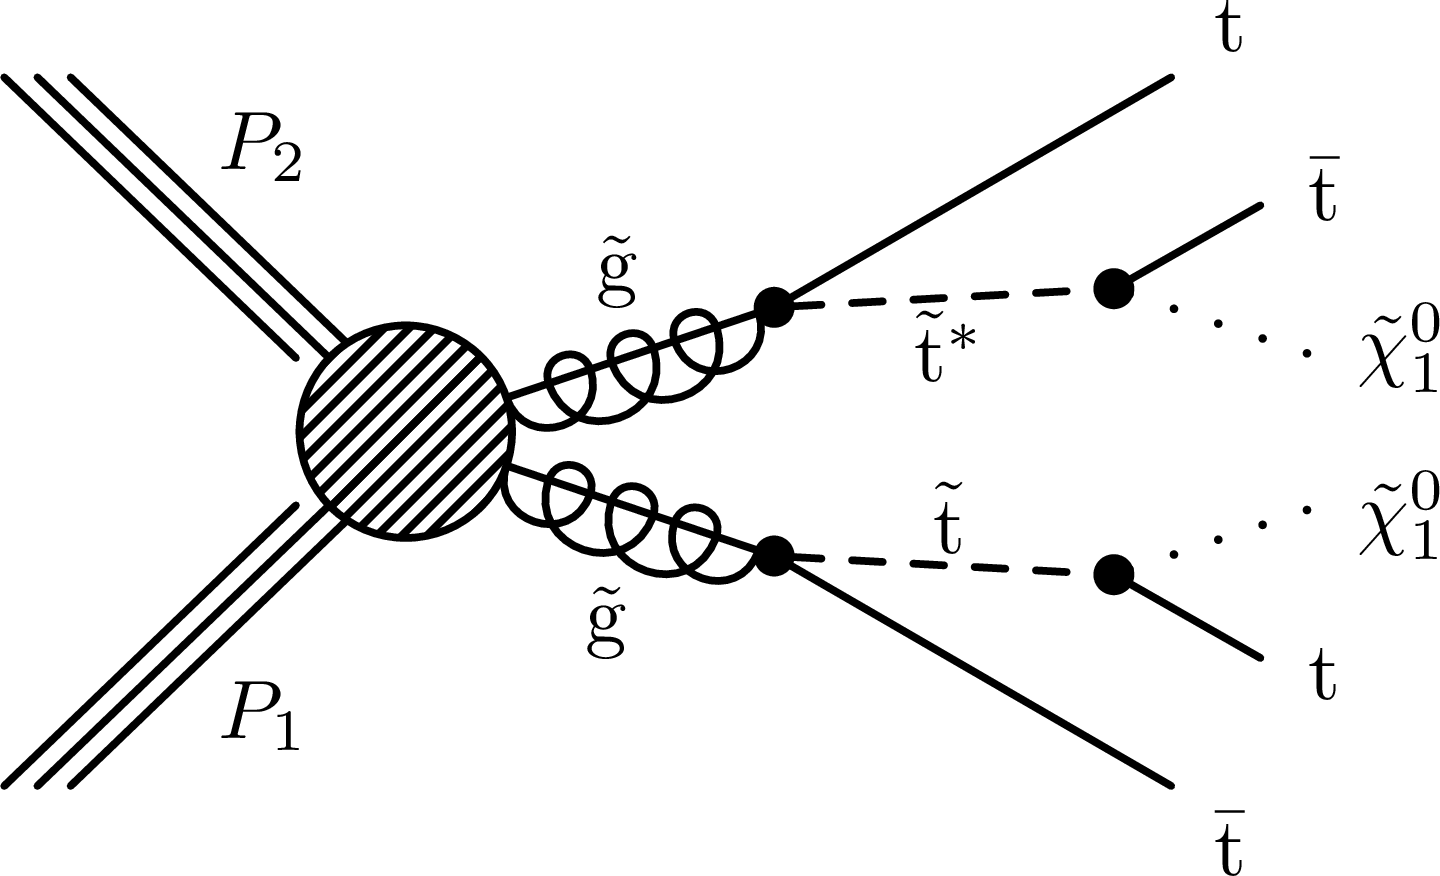
Figure 1-b:
Feynman diagrams for the signals from: (a) gluino pair production with intermediate virtual top squarks (T1tttt), (b) gluino pair production with intermediate on-shell top squarks (T5tttt), and (c) bottom squark pair production (T6ttWW). |

png pdf |
Figure 1-c:
Feynman diagrams for the signals from: (a) gluino pair production with intermediate virtual top squarks (T1tttt), (b) gluino pair production with intermediate on-shell top squarks (T5tttt), and (c) bottom squark pair production (T6ttWW). |

png pdf |
Figure 2:
Extrapolation factors from the control region to the signal region, $R_\text {ext}$, as a function of ${E_{\mathrm {T}}^{\text {miss}}} $ , for simulated events with $ {N_{ {\mathrm {b}}\text {jets}}} = 2$ (black triangles) and $ {N_{ {\mathrm {b}}\text {jets}}} \geq 3$ (red points). All the other signal selection criteria have been applied. The lower panel shows the ratio of the $ {N_{ {\mathrm {b}}\text {jets}}} \geq 3$ to the $ {N_{ {\mathrm {b}}\text {jets}}} =2$ results. |

png pdf |
Figure 3-a:
$ {E_{\mathrm {T}}^{\text {miss}}} $ distribution predicted for SM backgrounds by extrapolation from the control region with the statistical and systematic uncertainties (red bands), compared to actual distribution (black points) for (a) simulated events in the cross-check region, (b) data events in the cross-check region, and (c) simulated events in the search region. The lower panels show the ratios of the actual to predicted distributions. |
png pdf |
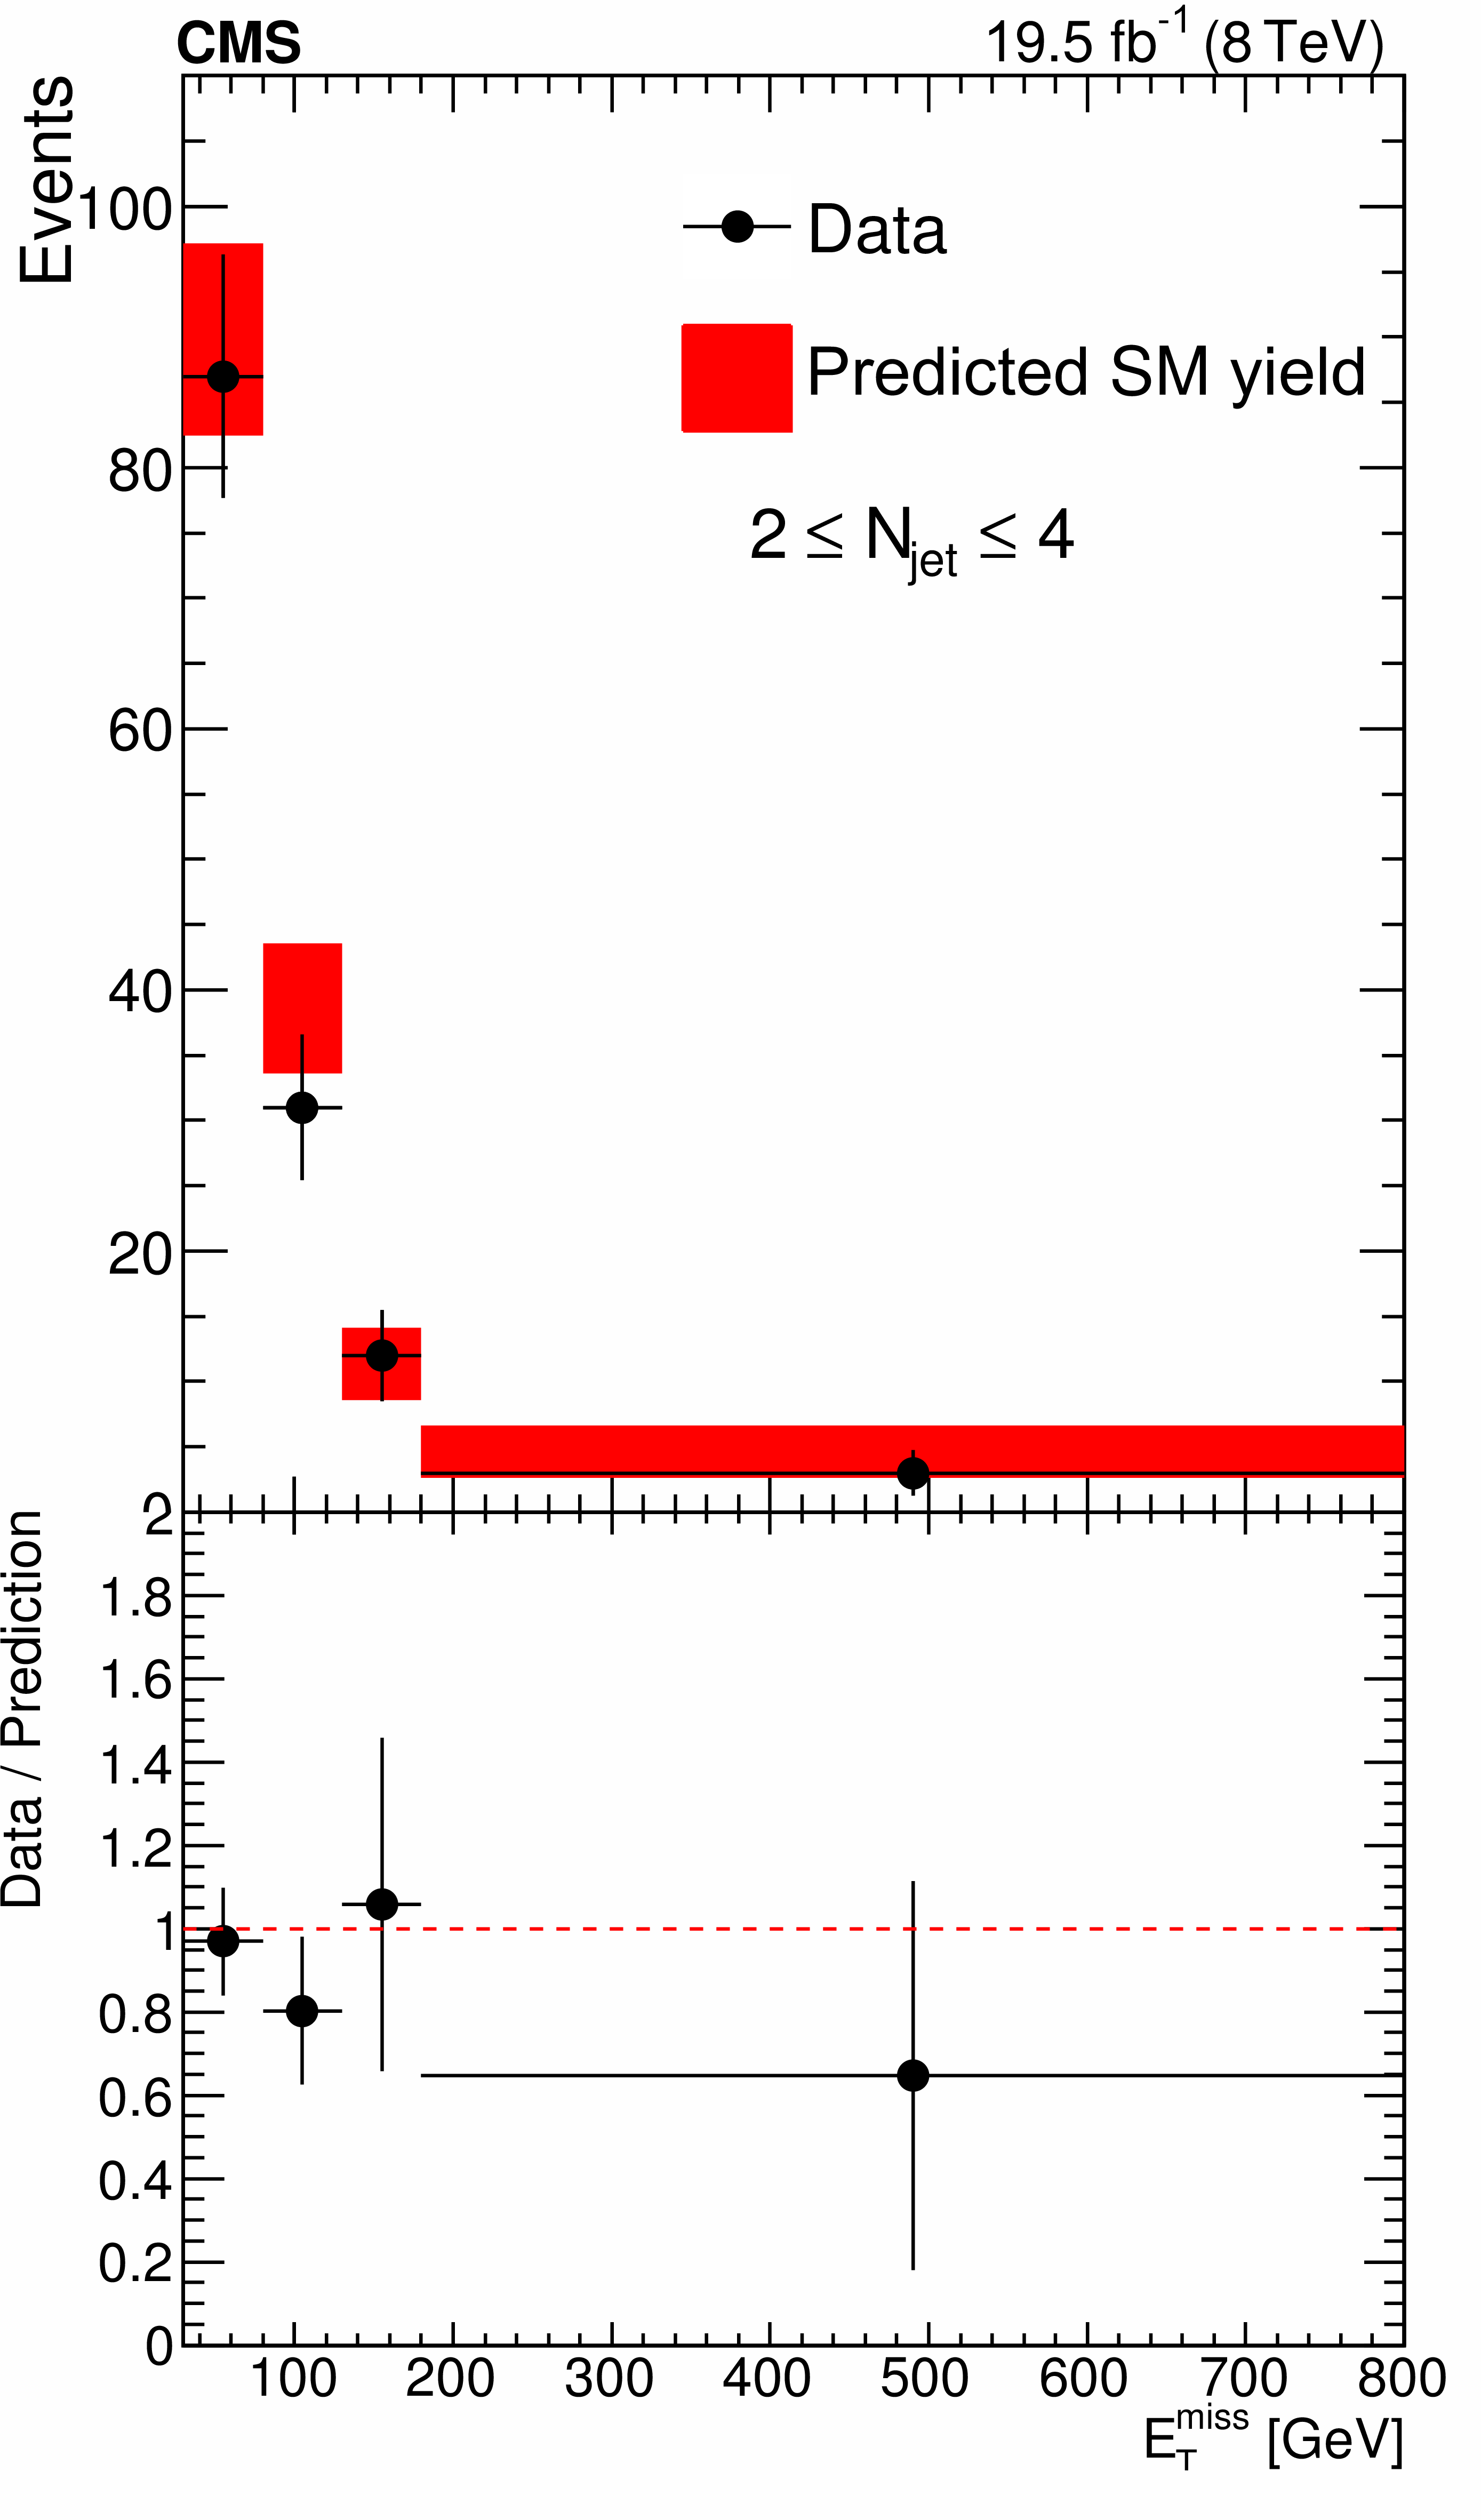
Figure 3-b:
$ {E_{\mathrm {T}}^{\text {miss}}} $ distribution predicted for SM backgrounds by extrapolation from the control region with the statistical and systematic uncertainties (red bands), compared to actual distribution (black points) for (a) simulated events in the cross-check region, (b) data events in the cross-check region, and (c) simulated events in the search region. The lower panels show the ratios of the actual to predicted distributions. |
png pdf |
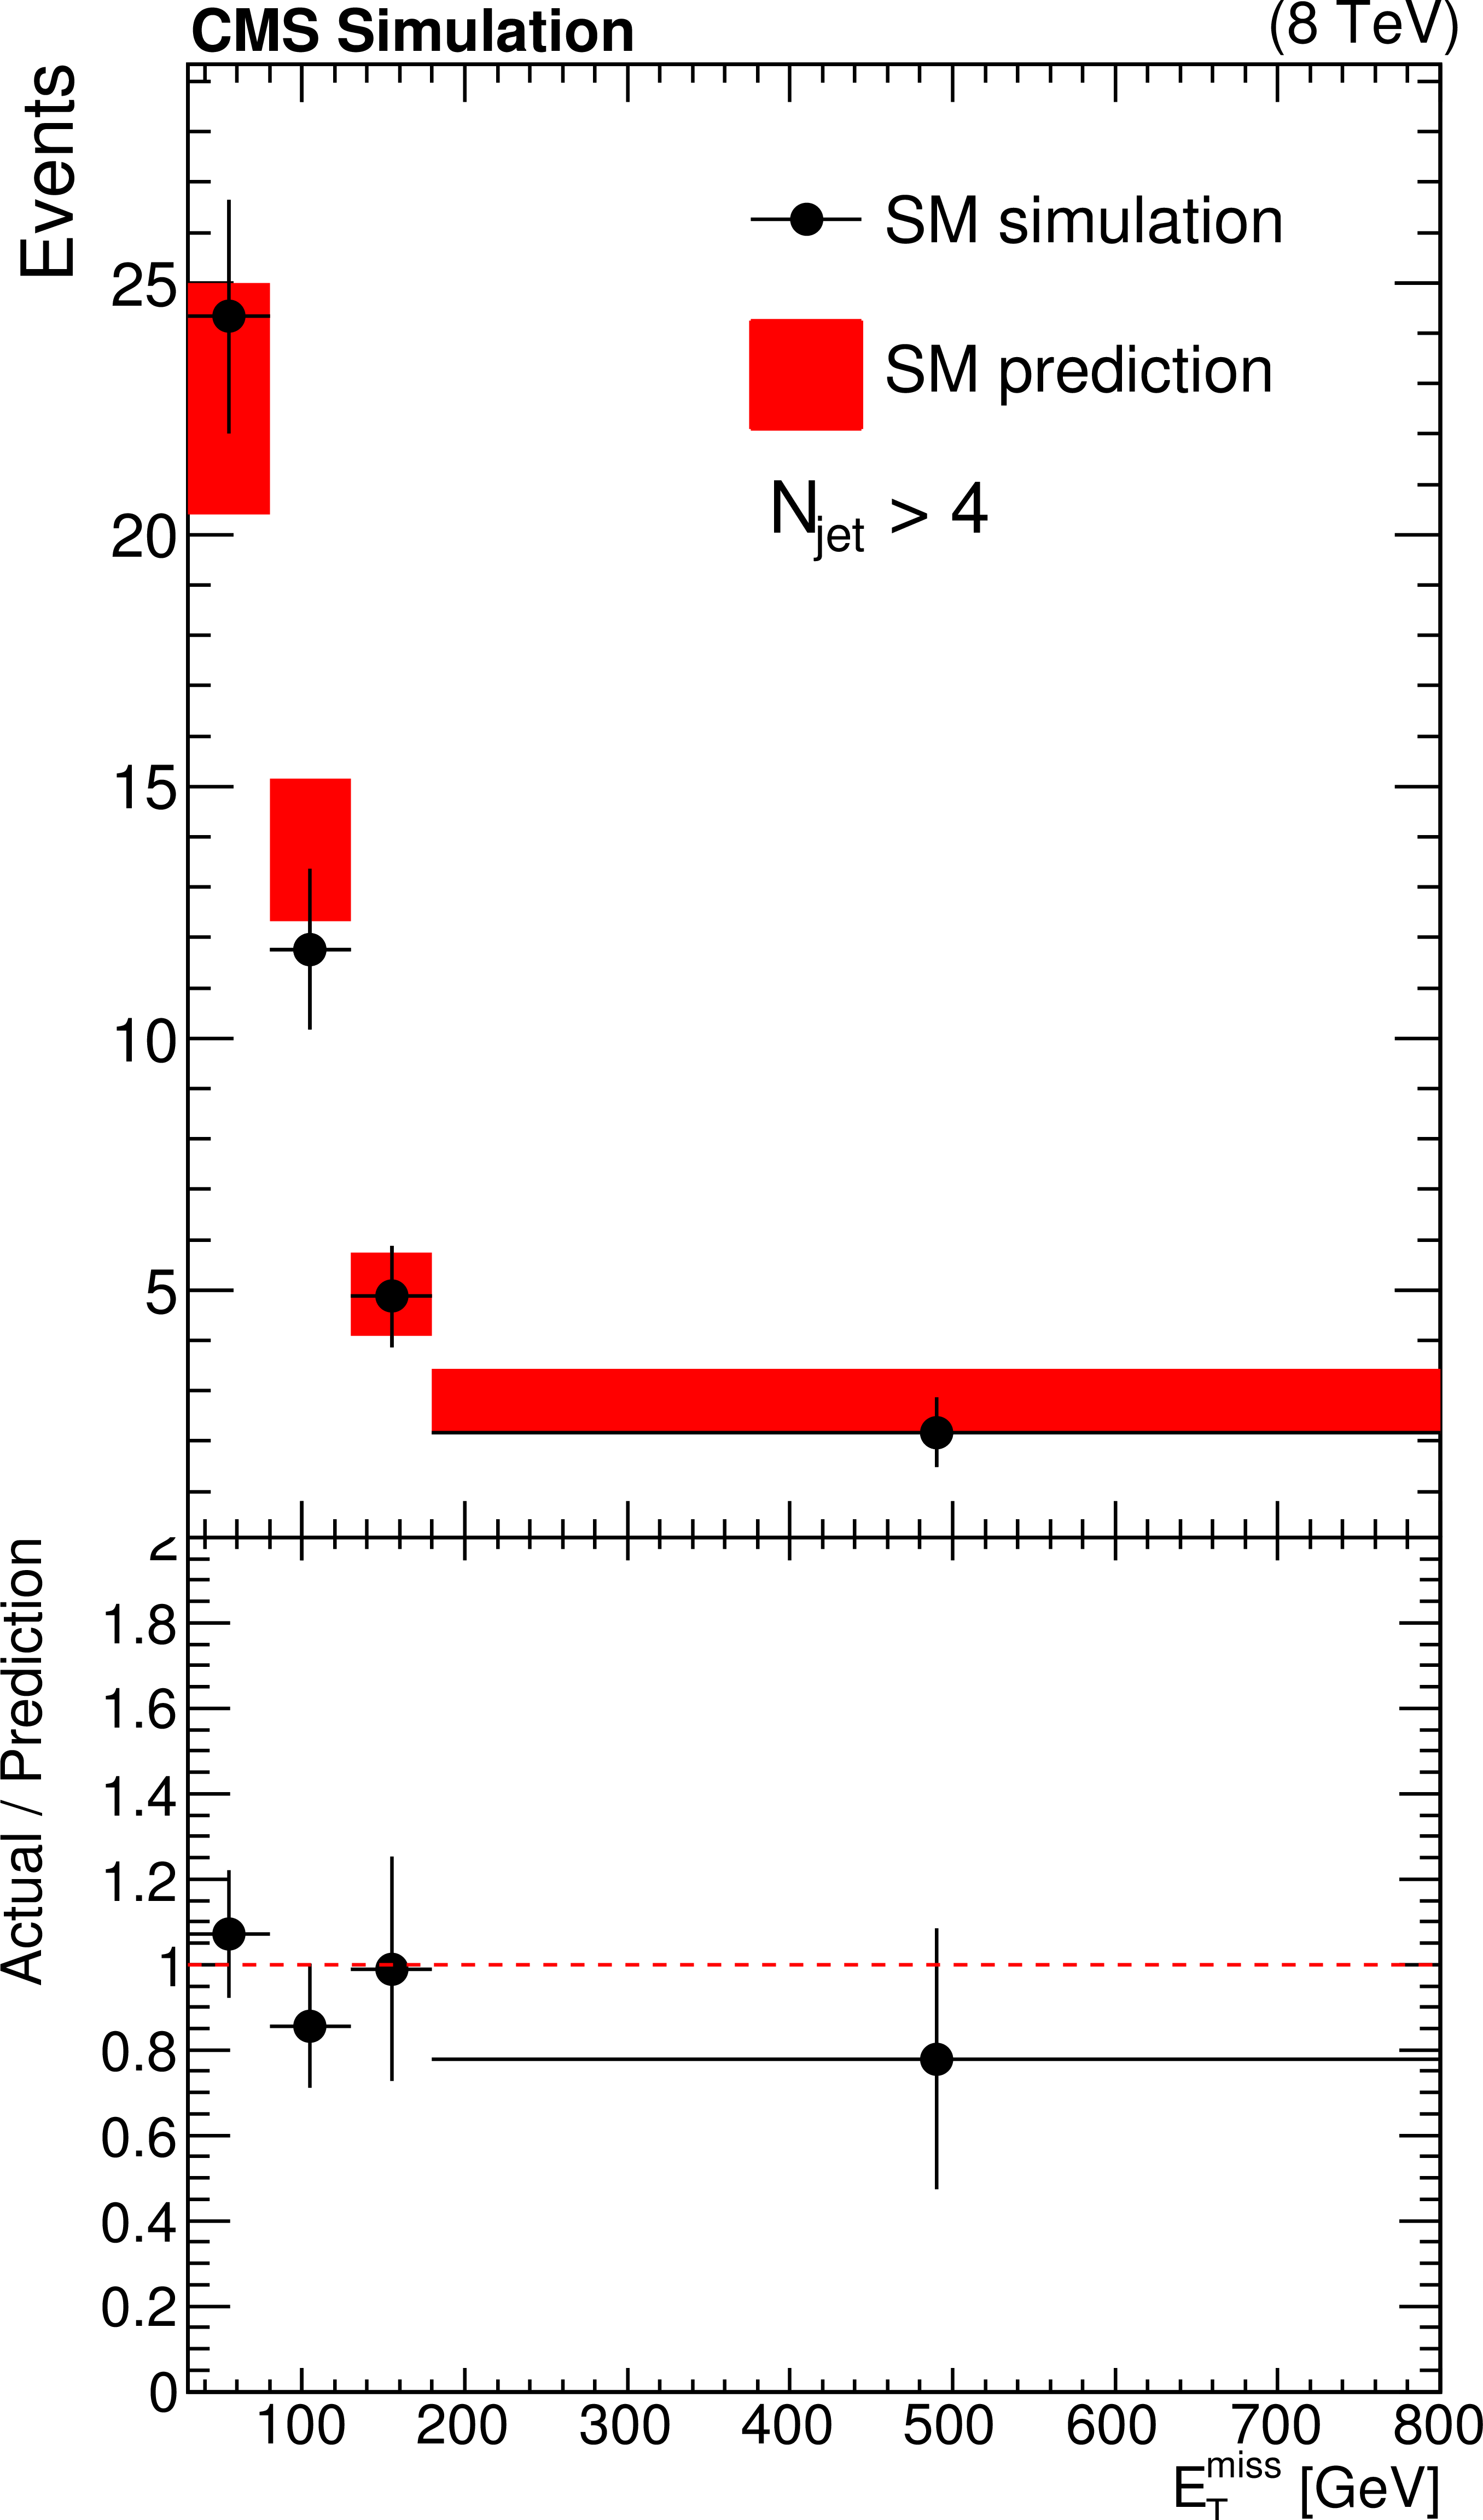
Figure 3-c:
$ {E_{\mathrm {T}}^{\text {miss}}} $ distribution predicted for SM backgrounds by extrapolation from the control region with the statistical and systematic uncertainties (red bands), compared to actual distribution (black points) for (a) simulated events in the cross-check region, (b) data events in the cross-check region, and (c) simulated events in the search region. The lower panels show the ratios of the actual to predicted distributions. |

png pdf |
Figure 4:
$ {E_{\mathrm {T}}^{\text {miss}}} $ distribution in the signal region (black points) compared to the SM background prediction with its statistical and systematic uncertainties (red band). The expected signal for the T1tttt model with a gluino mass of 1150 GeV and an LSP mass of 300 GeV, multiplied by a factor of 3 for better visibility, is indicated by the blue curve. |
png pdf |
Figure 5-a:
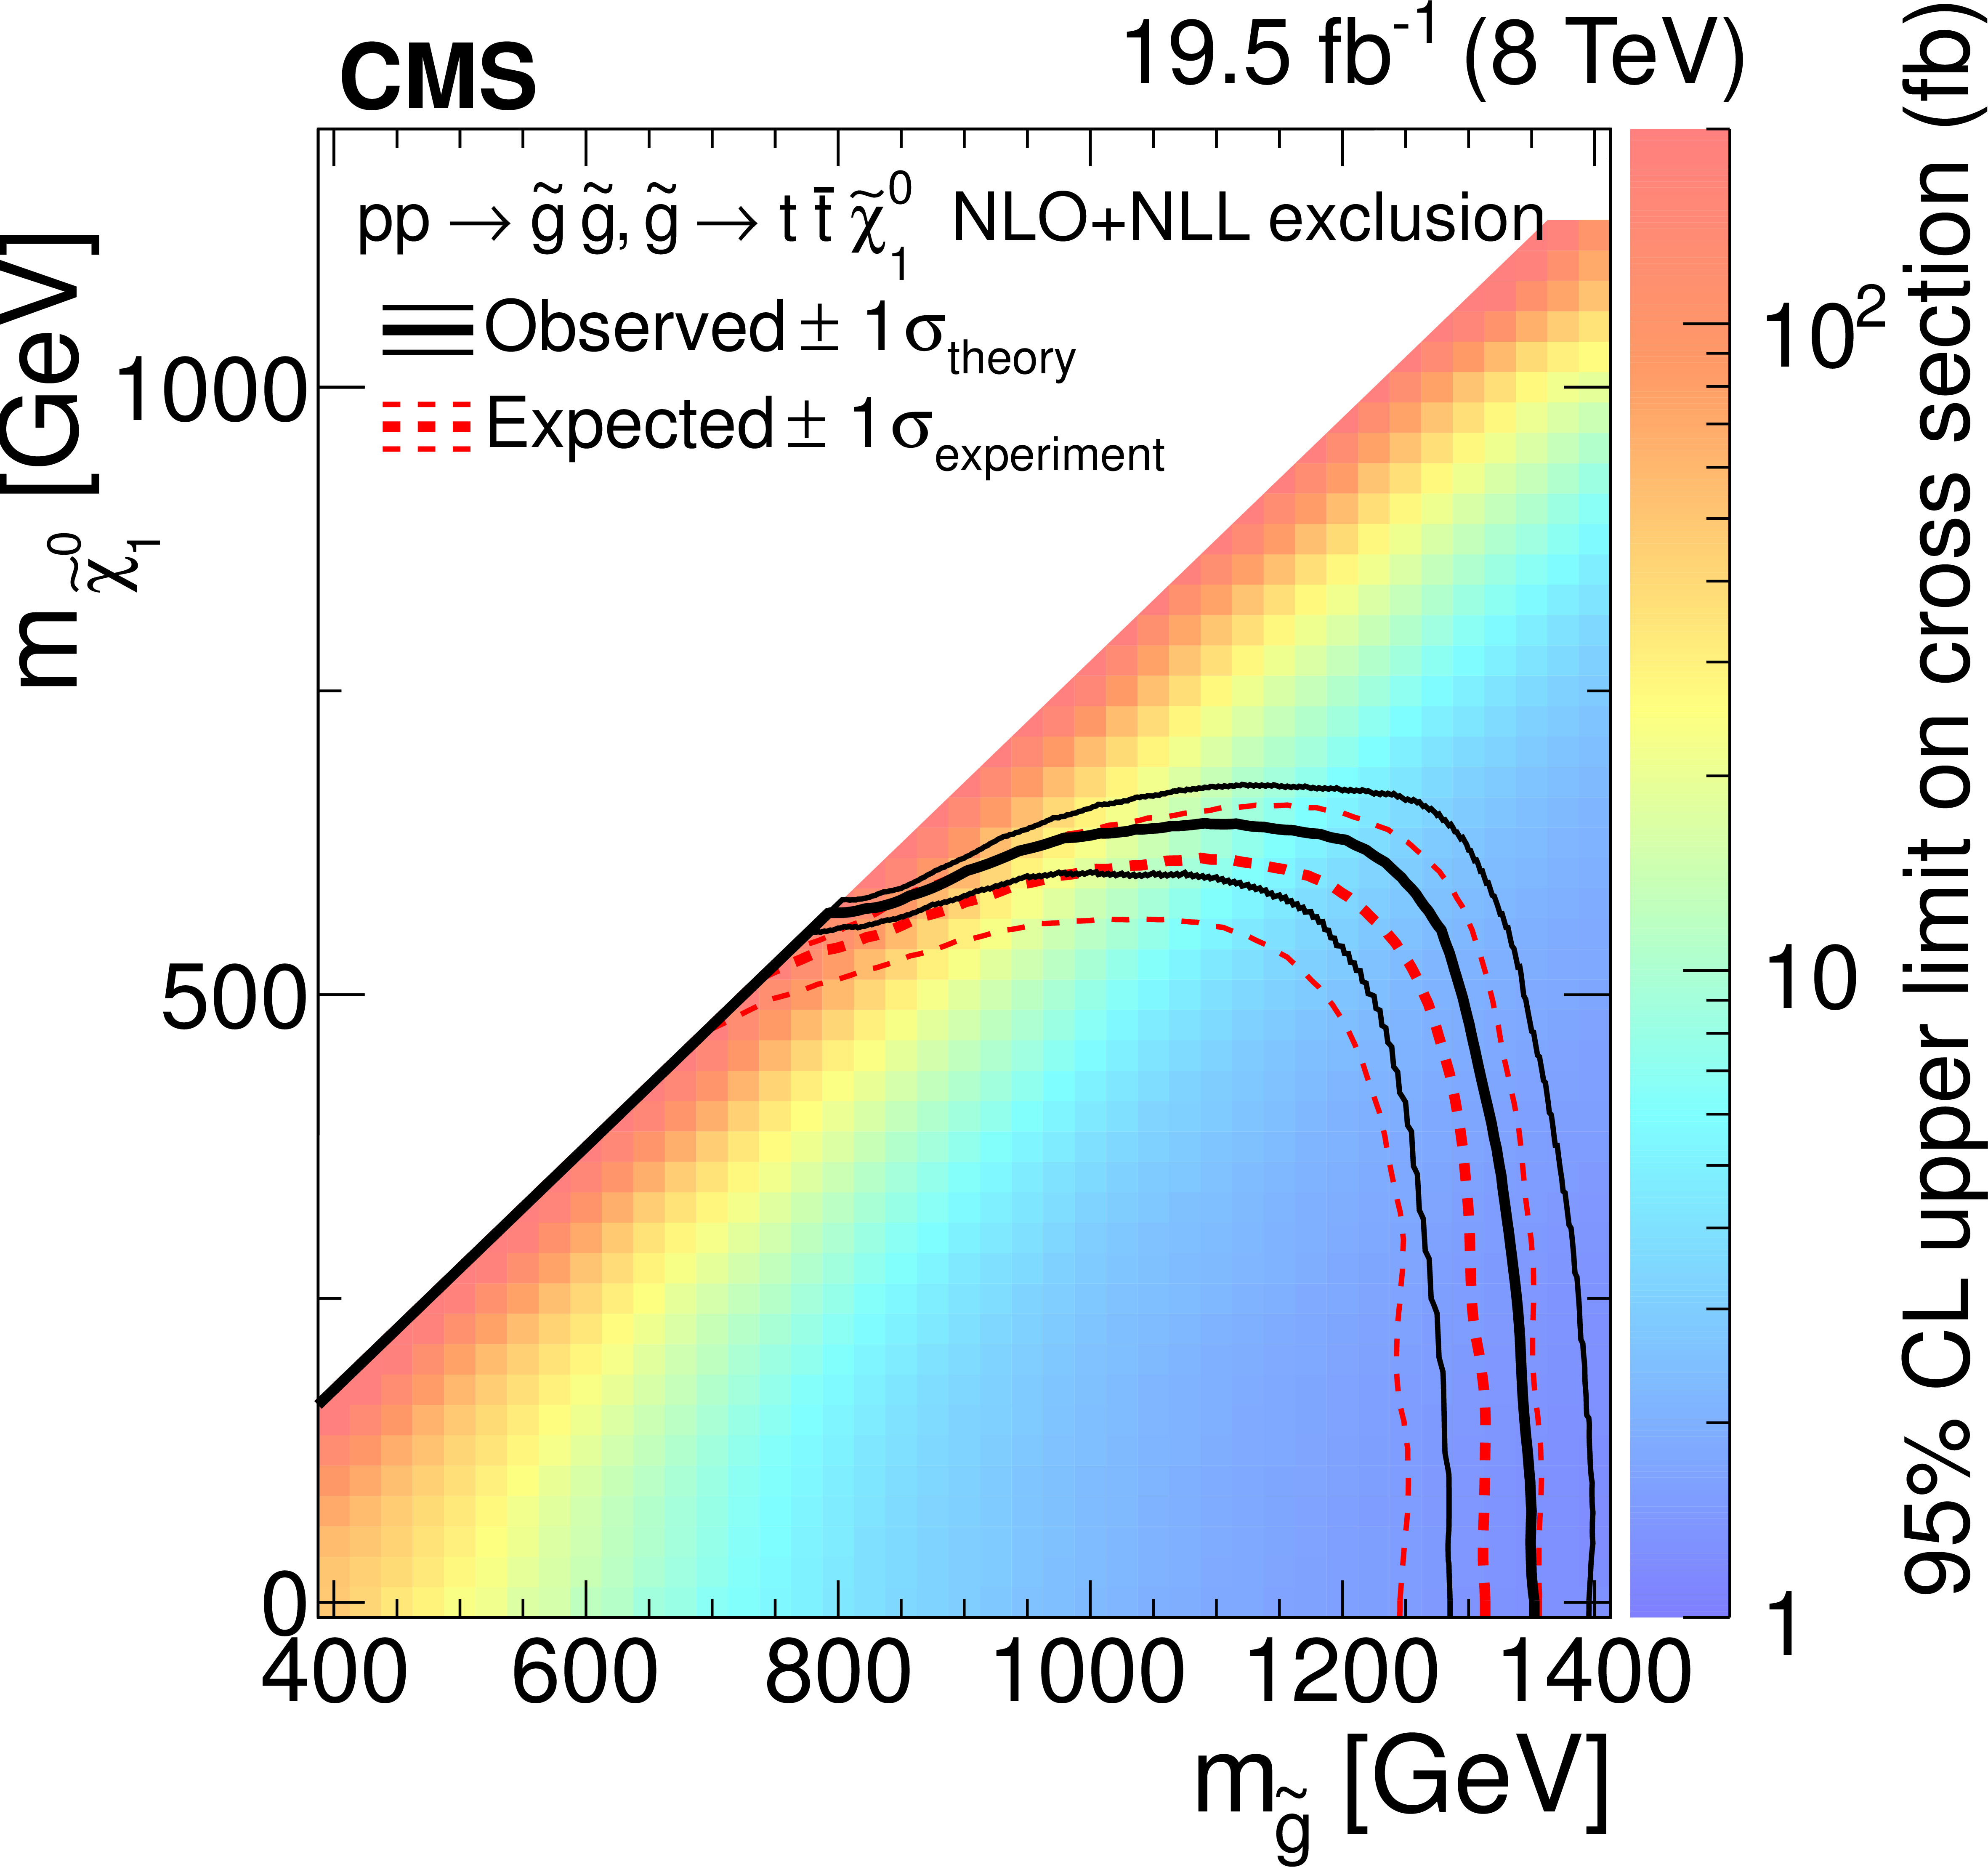
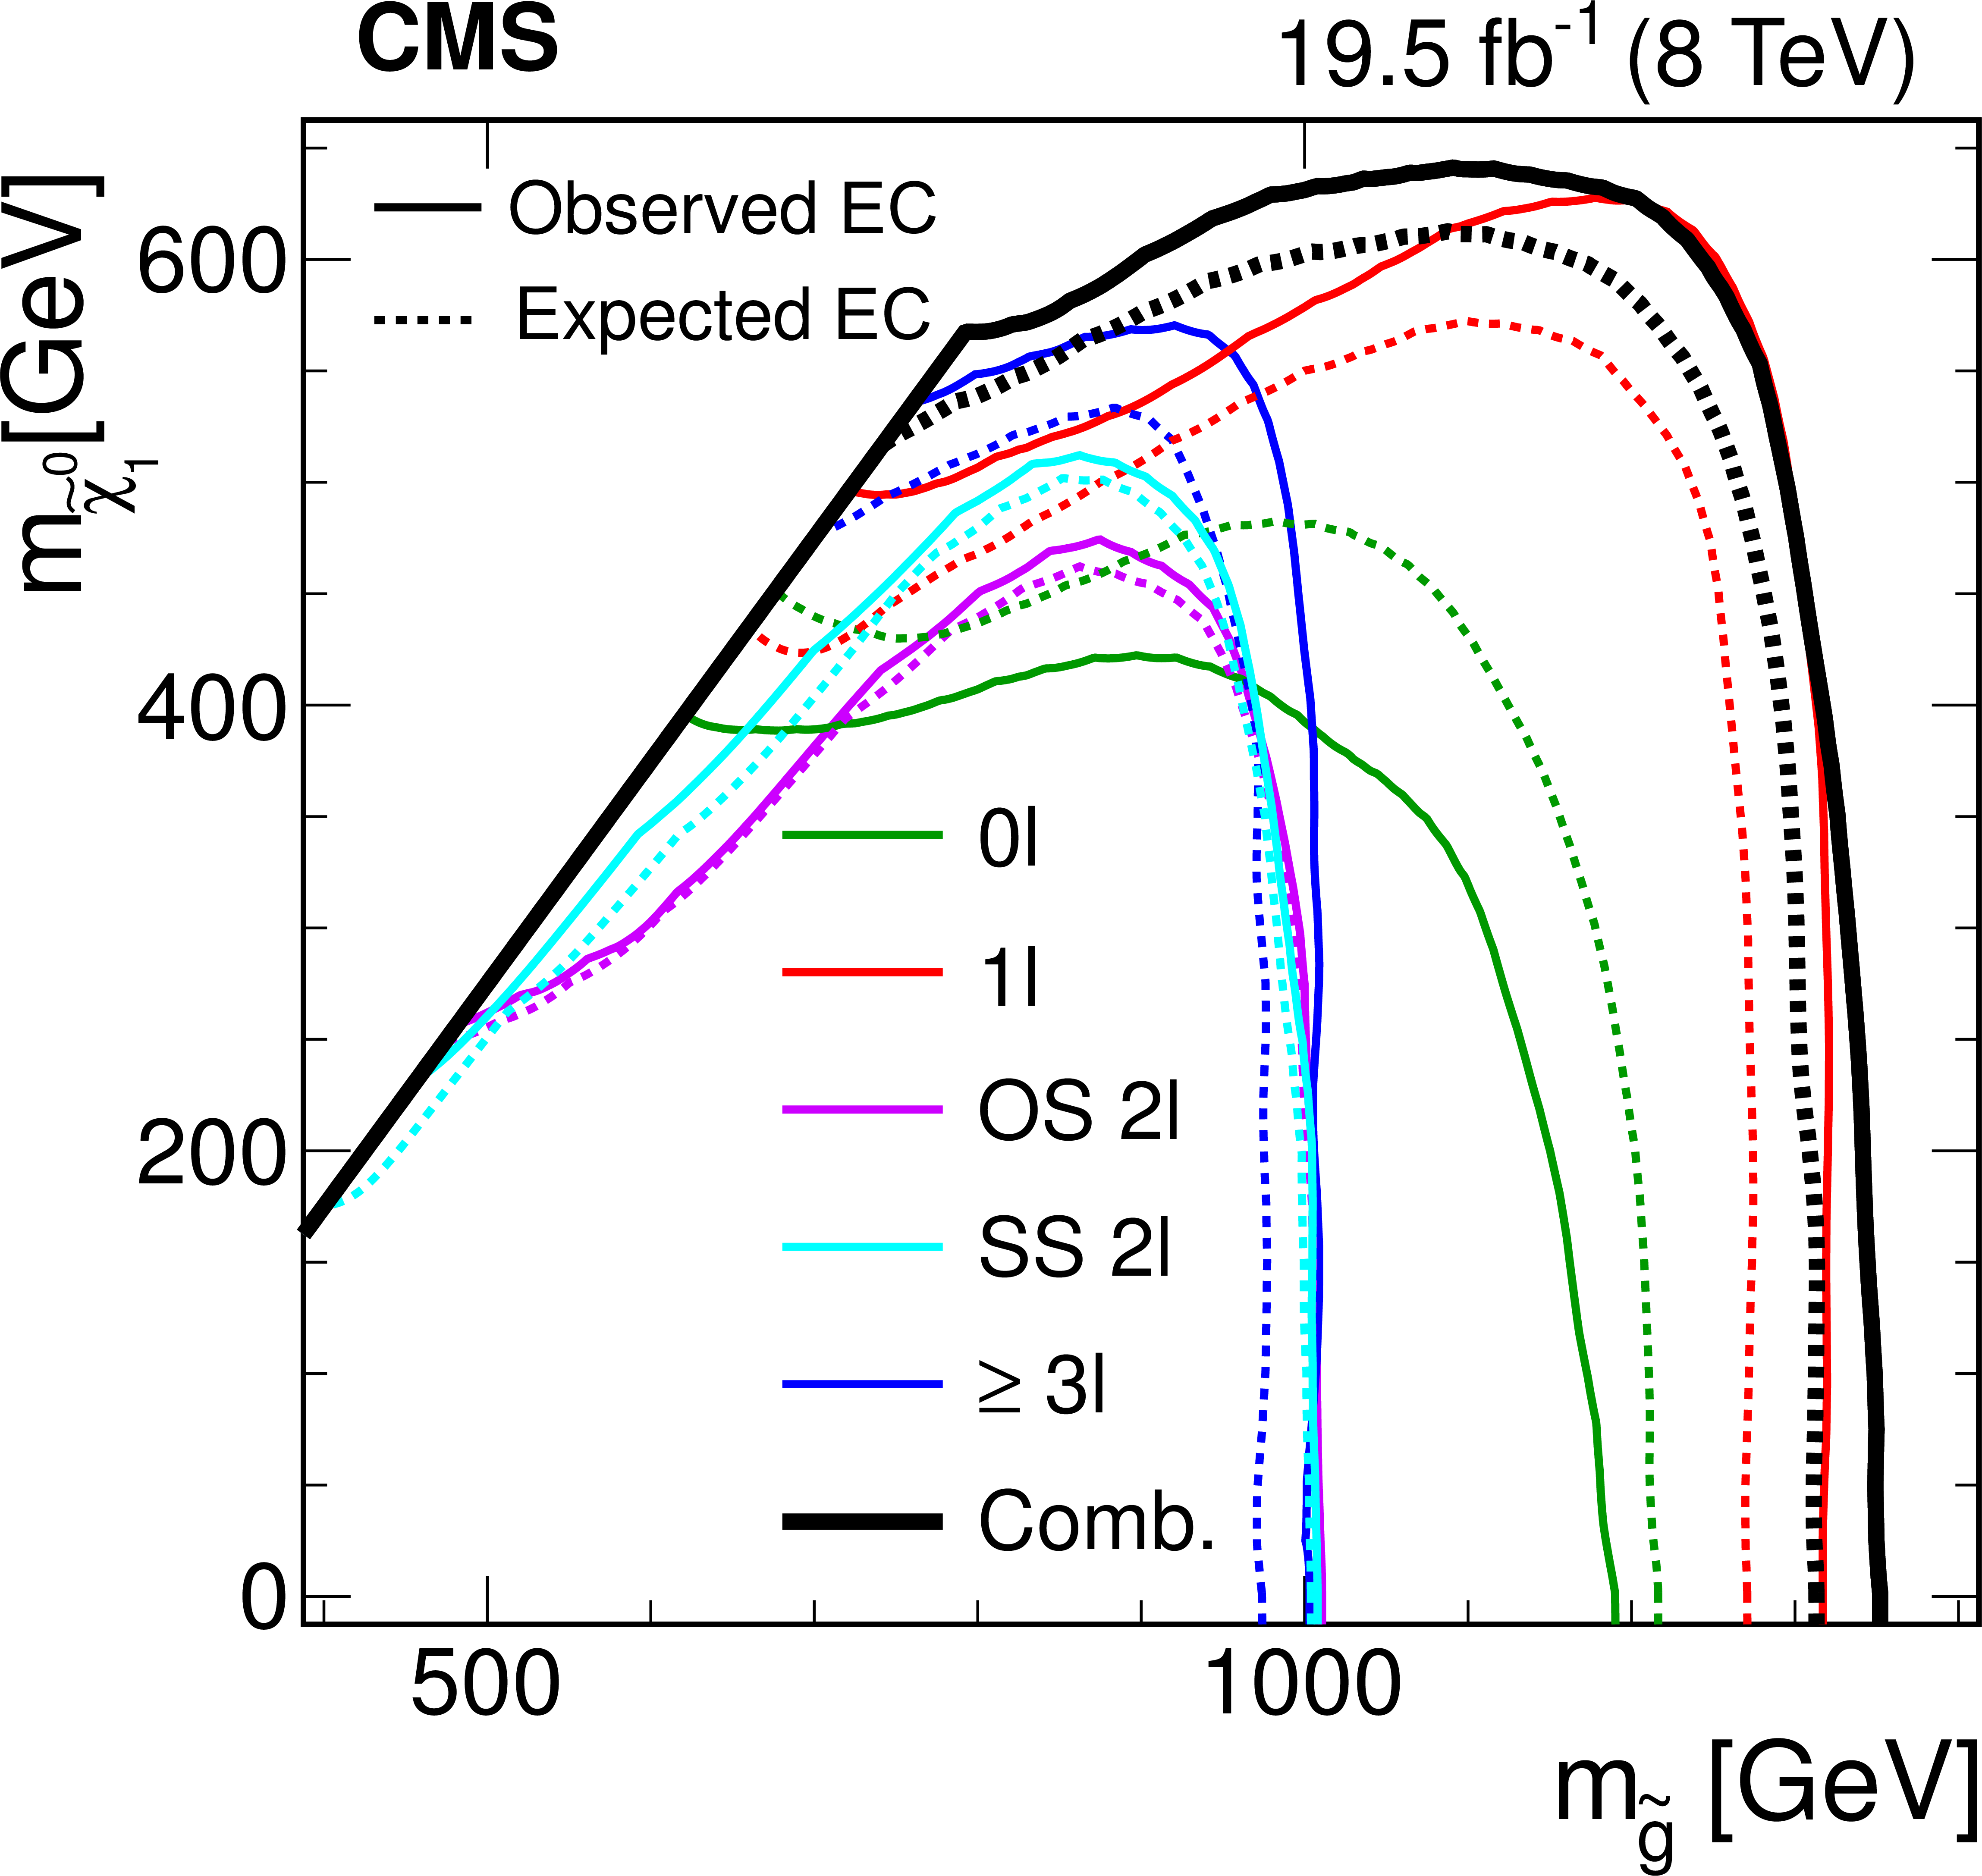
(a) The 95% CL cross section upper limits for gluino-mediated squark production with virtual top squarks, based on an NLO+NLL reference cross section for gluino pair production. The solid and dashed lines indicate, respectively, the observed and expected exclusion contours for the combination of the five analyses. The thin contours indicate the $\pm $1 standard deviation regions. (b) Exclusion contours (EC) for the individual searches, plus the combination. |
png pdf |
Figure 5-b:
(a) The 95% CL cross section upper limits for gluino-mediated squark production with virtual top squarks, based on an NLO+NLL reference cross section for gluino pair production. The solid and dashed lines indicate, respectively, the observed and expected exclusion contours for the combination of the five analyses. The thin contours indicate the $\pm $1 standard deviation regions. (b) Exclusion contours (EC) for the individual searches, plus the combination. |

png pdf |
Figure 6-a:
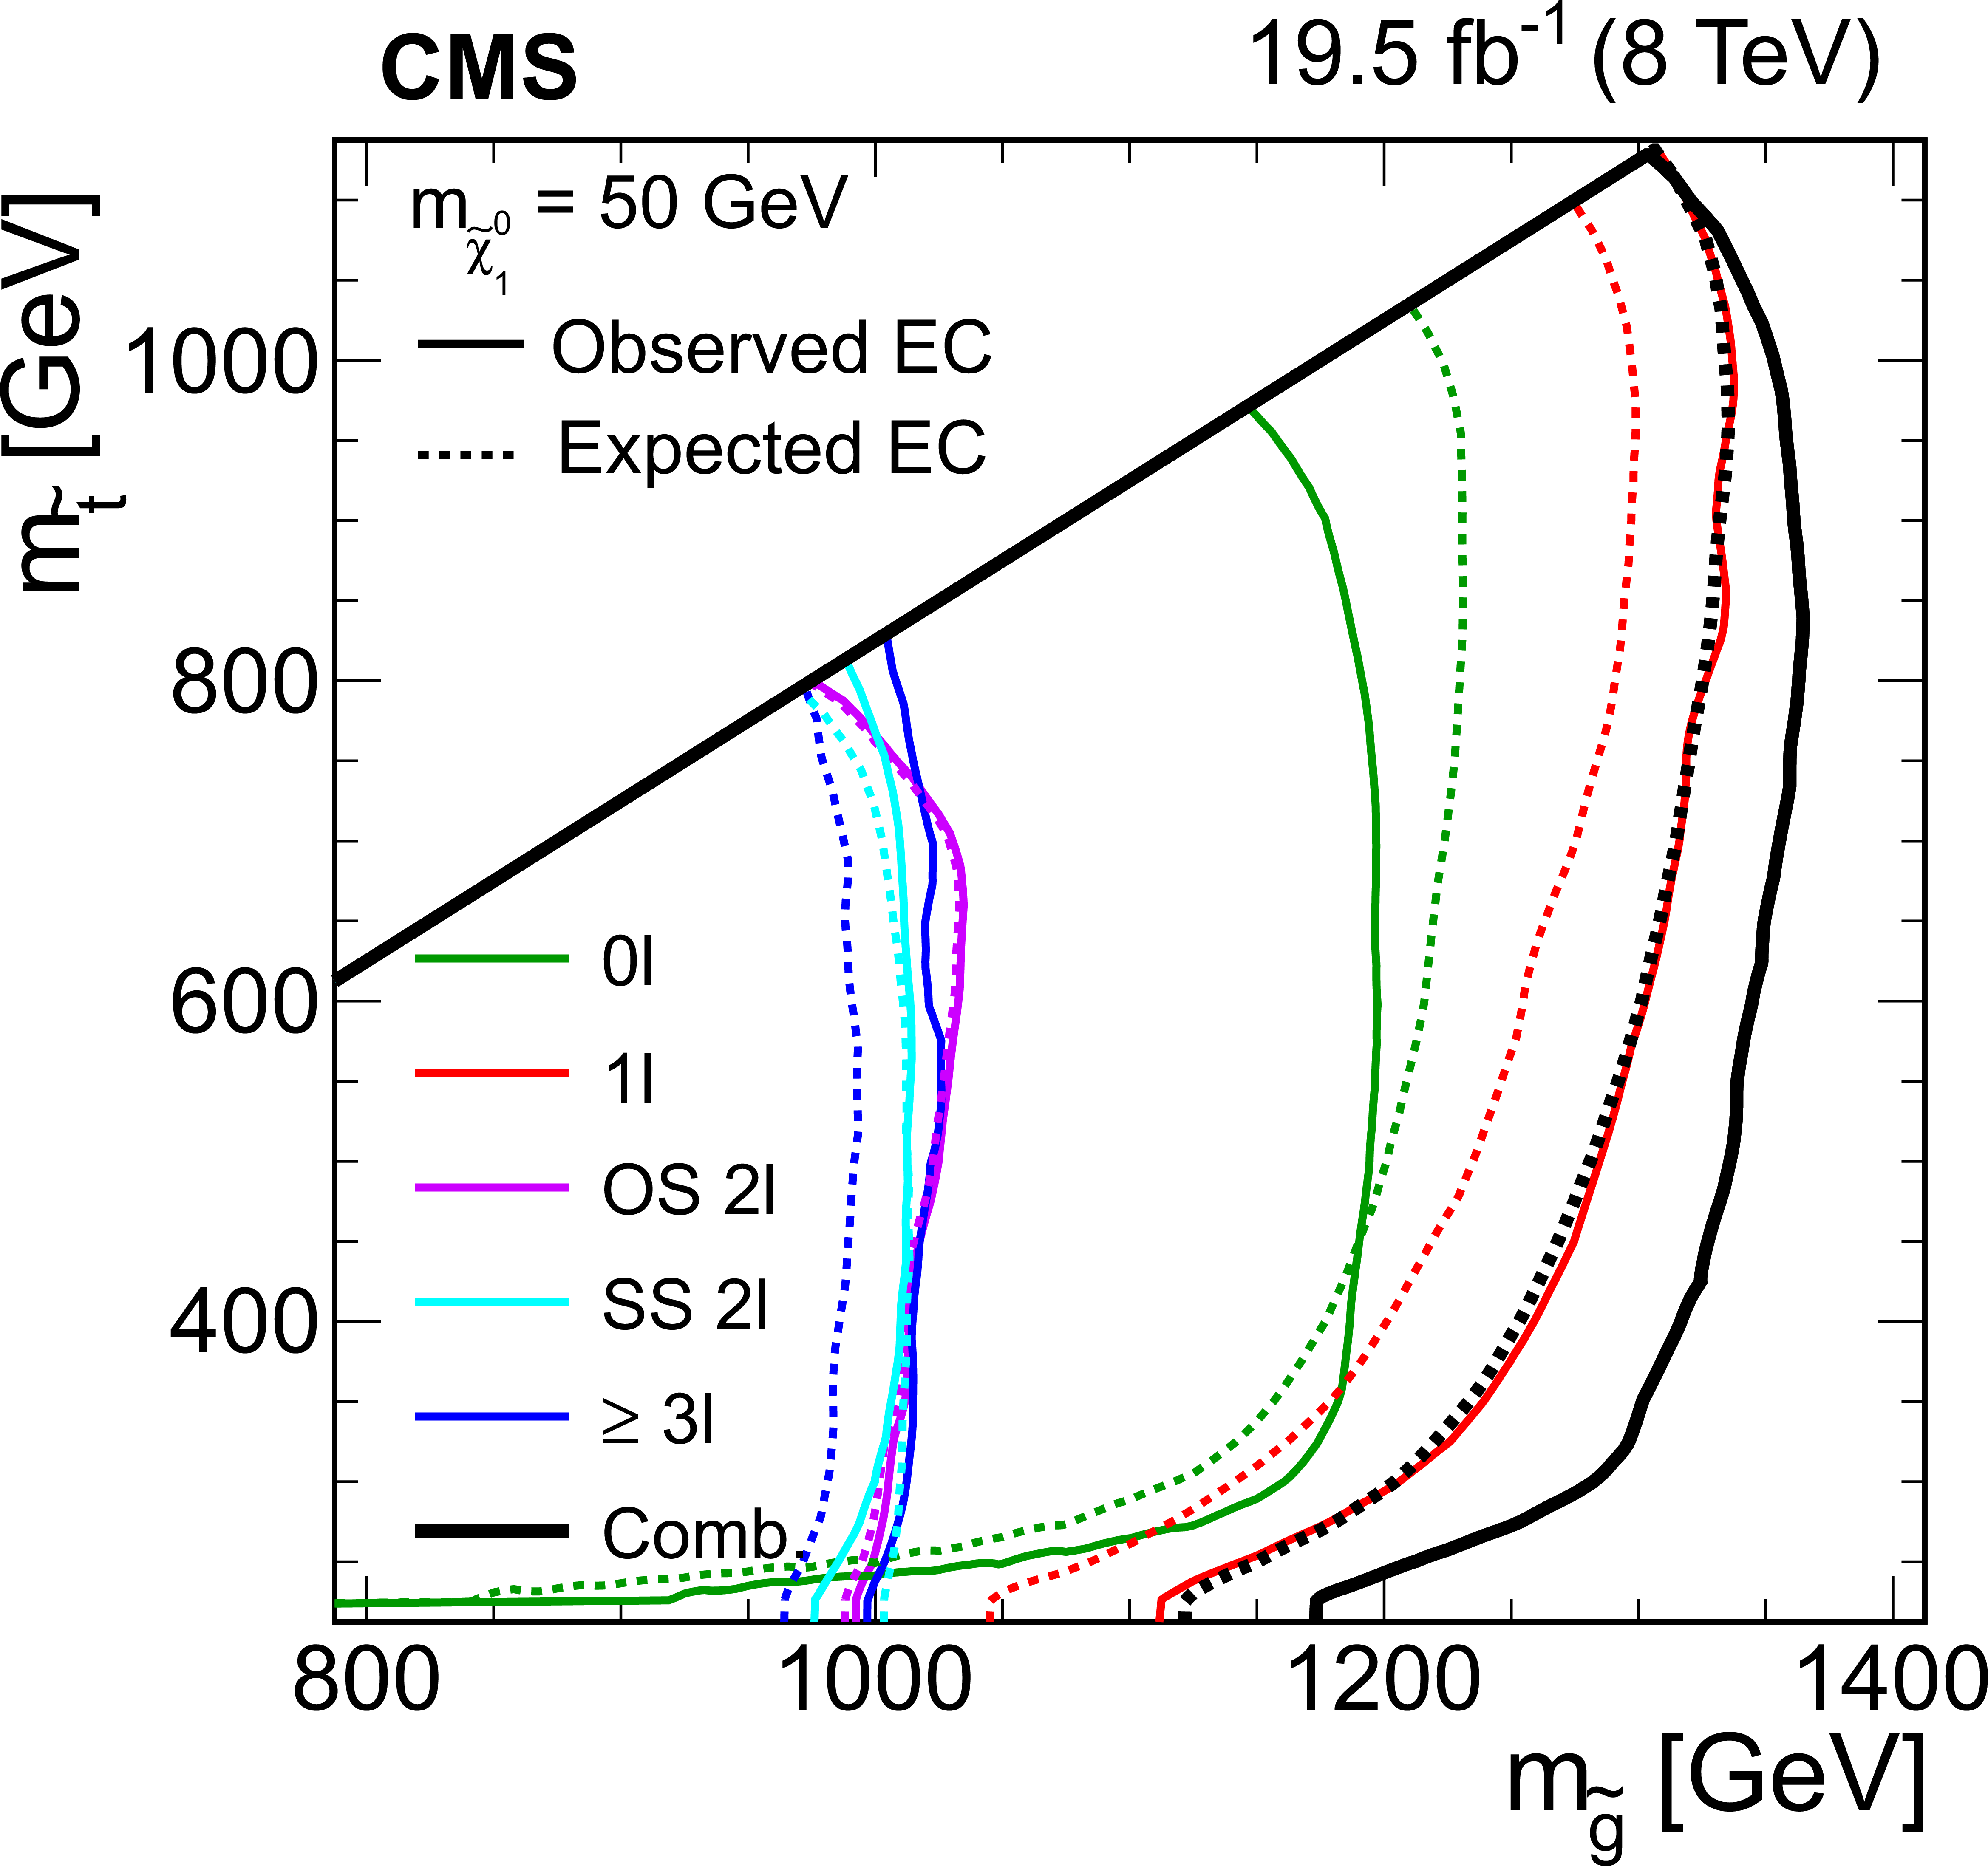
(a) The 95% CL cross section upper limits for gluino-mediated squark production with on-shell top squarks, assuming an LSP mass of $m_{ \tilde{\chi}^{0}_{1} }$ = 50 GeV, based on an NLO+NLL reference cross section for gluino pair production. The solid and dashed lines indicate, respectively, the observed and expected exclusion contours for the combination of the five analyses. The thin contours indicate the $\pm $1 standard deviation regions. (b) Exclusion contours (EC) for the individual searches, plus the combination. |
png pdf |
Figure 6-b:
(a) The 95% CL cross section upper limits for gluino-mediated squark production with on-shell top squarks, assuming an LSP mass of $m_{ \tilde{\chi}^{0}_{1} }$ = 50 GeV, based on an NLO+NLL reference cross section for gluino pair production. The solid and dashed lines indicate, respectively, the observed and expected exclusion contours for the combination of the five analyses. The thin contours indicate the $\pm $1 standard deviation regions. (b) Exclusion contours (EC) for the individual searches, plus the combination. |

png pdf |
Figure 7-a:
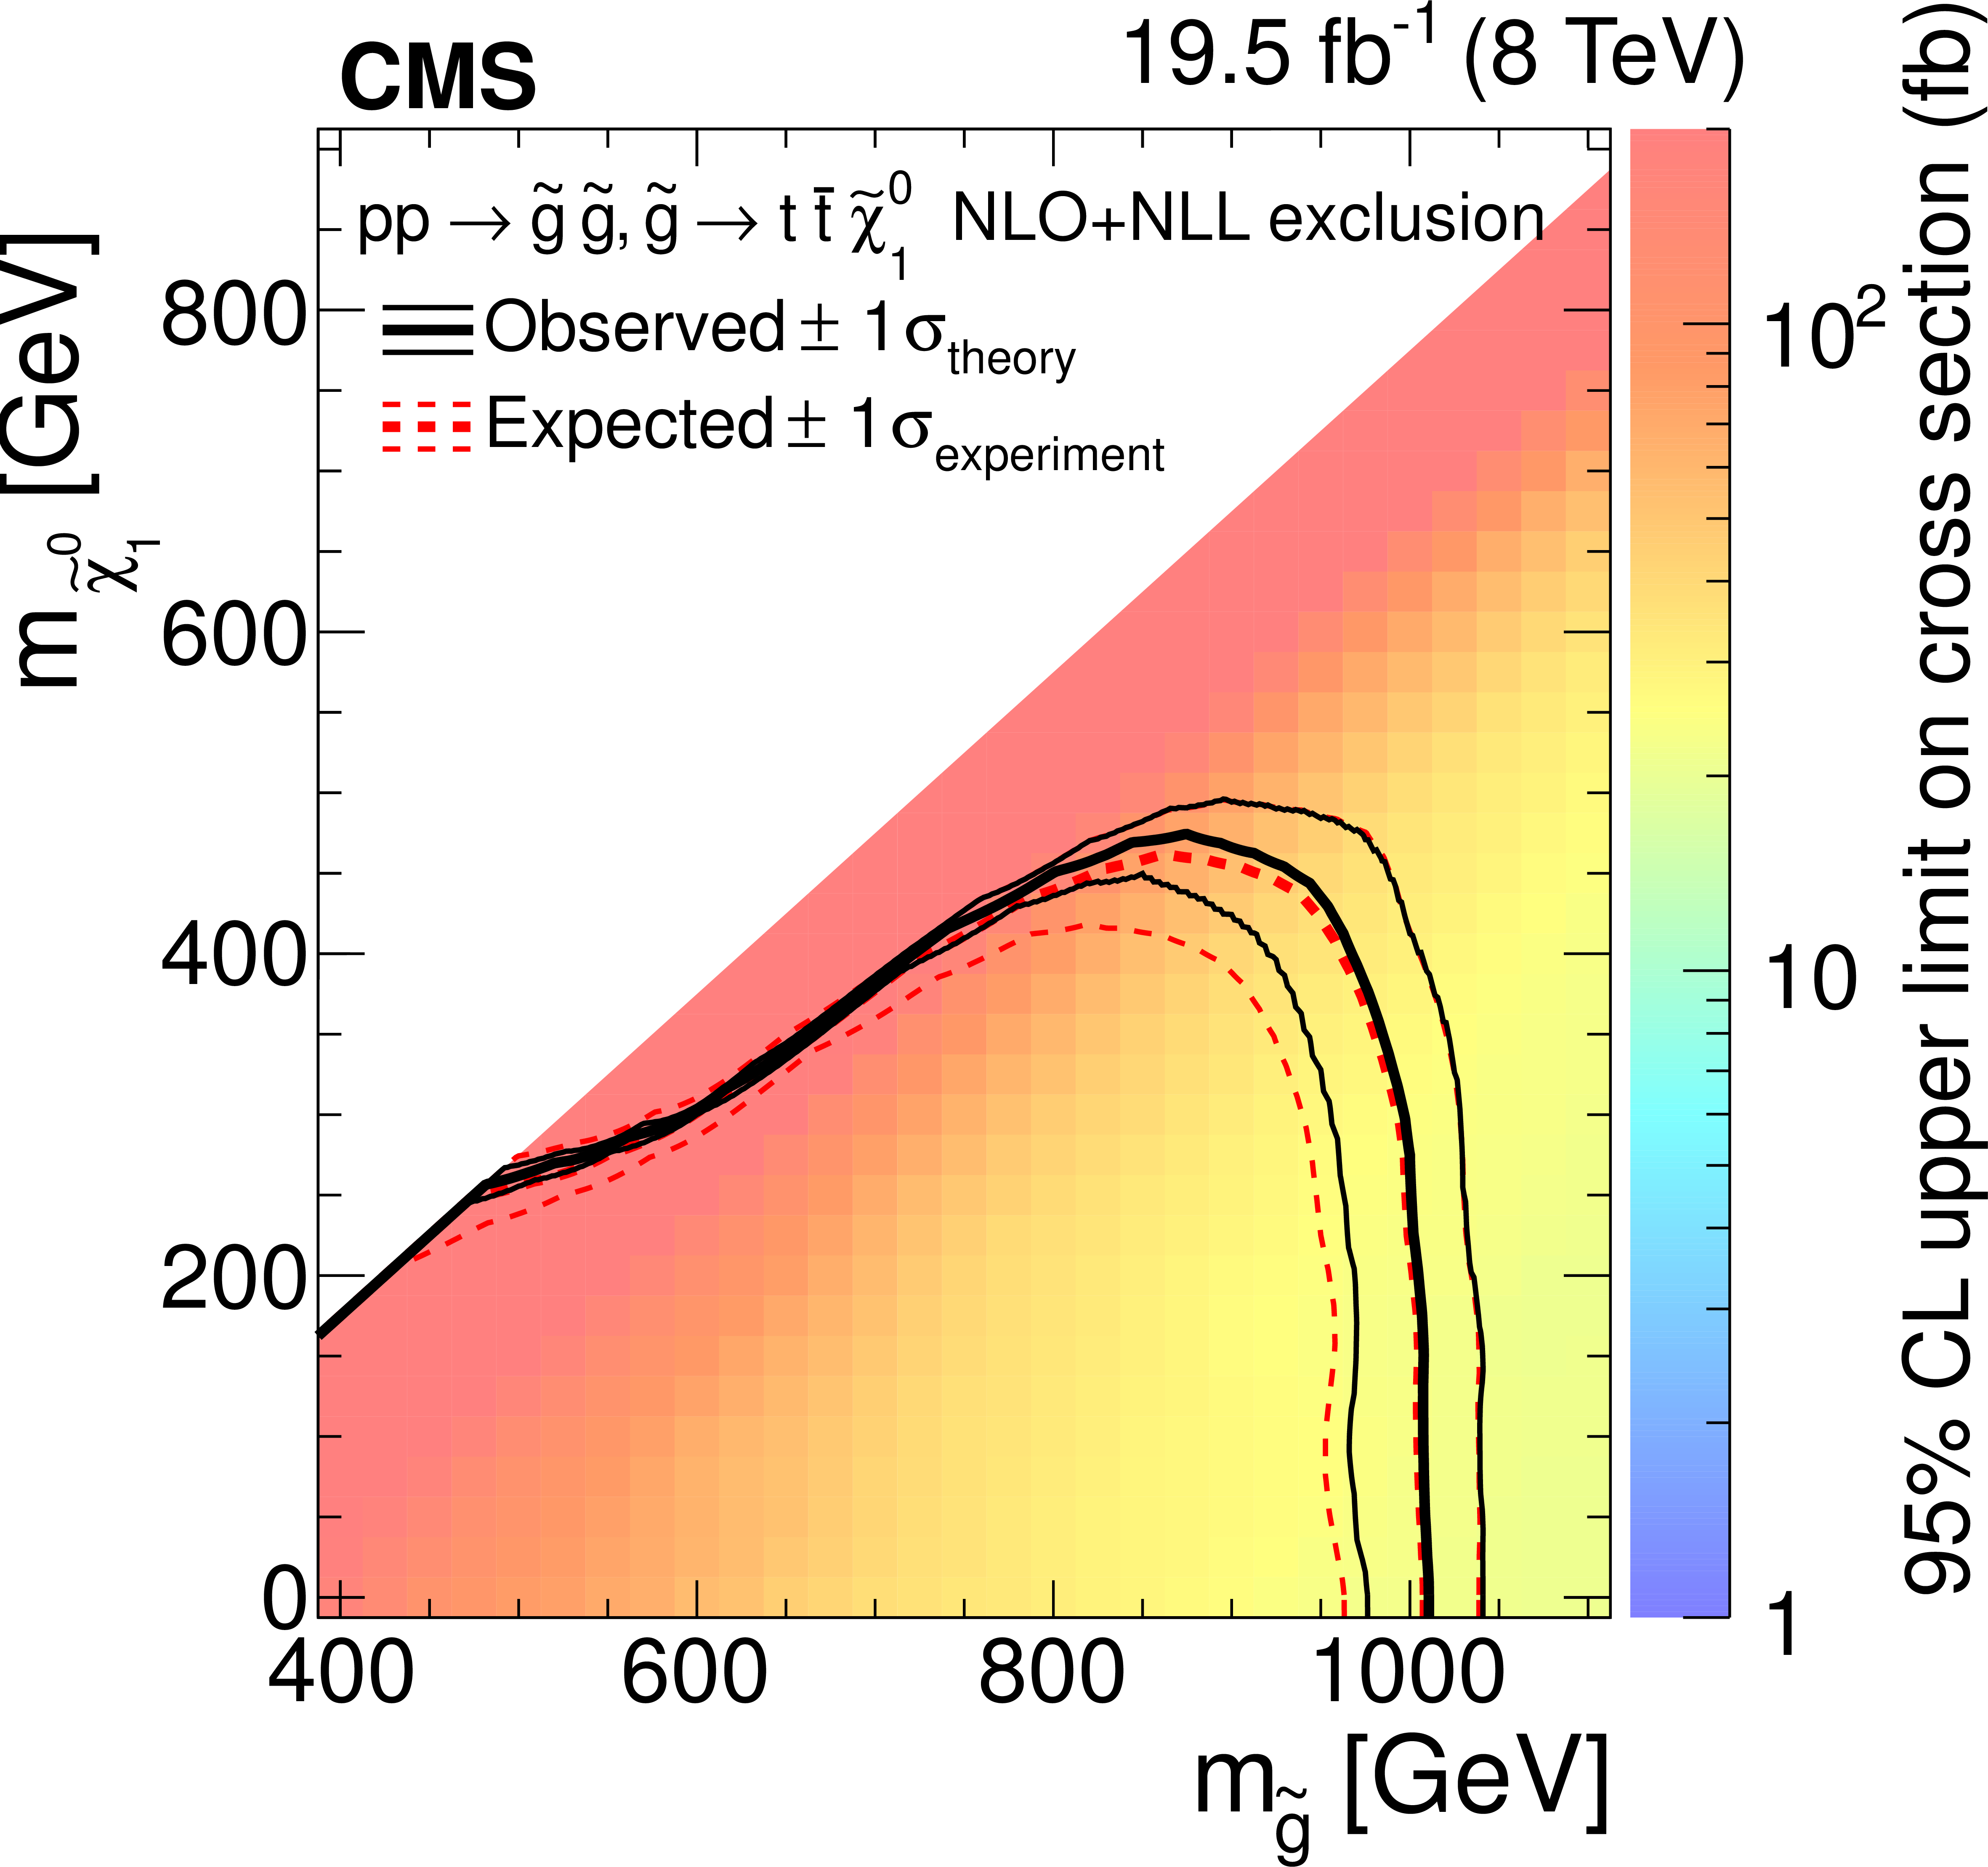
(a) The 95% CL cross section upper limits for bottom-squark pair production, assuming an LSP mass of $m_{ \tilde{\chi}^{0}_{1} }$ = 50 GeV, based on an NLO+NLL reference cross section. The solid and dashed lines indicate, respectively, the observed and expected exclusion contours for the combination of the fully hadronic, same-sign dilepton, and multilepton analyses. The thin contours indicate the $\pm $1 standard deviation regions. (b) Exclusion contours (EC) for the individual searches, plus the combination, assuming a bottom squark mass of 600 GeV. |

png pdf |
Figure 7-b:
(a) The 95% CL cross section upper limits for bottom-squark pair production, assuming an LSP mass of $m_{ \tilde{\chi}^{0}_{1} }$ = 50 GeV, based on an NLO+NLL reference cross section. The solid and dashed lines indicate, respectively, the observed and expected exclusion contours for the combination of the fully hadronic, same-sign dilepton, and multilepton analyses. The thin contours indicate the $\pm $1 standard deviation regions. (b) Exclusion contours (EC) for the individual searches, plus the combination, assuming a bottom squark mass of 600 GeV. |
png pdf |
Figure 8-a:
(a) The 95% CL cross section upper limits for gluino-mediated squark production with virtual top squarks, based on an NLO+NLL reference cross section for gluino pair production, derived from the opposite-sign dilepton analysis. The solid and dashed lines indicate, respectively, the observed and expected exclusion contours. The thin contours indicate the $\pm $1 standard deviation regions. (b) The corresponding results for gluino-mediated squark production with on-shell top squarks. |

png pdf |
Figure 8-b:
(a) The 95% CL cross section upper limits for gluino-mediated squark production with virtual top squarks, based on an NLO+NLL reference cross section for gluino pair production, derived from the opposite-sign dilepton analysis. The solid and dashed lines indicate, respectively, the observed and expected exclusion contours. The thin contours indicate the $\pm $1 standard deviation regions. (b) The corresponding results for gluino-mediated squark production with on-shell top squarks. |
|
|
Compact Muon Solenoid LHC, CERN |
|

|

|

|

|

|