

Compact Muon Solenoid
LHC, CERN
| CMS-TOP-12-007 ; CERN-PH-EP-2013-234 | ||
| Measurement of the $ \mathrm{ t \bar{t} } $ production cross section in the dilepton channel in pp collisions at $\sqrt{s}$ = 8 TeV | ||
| CMS Collaboration | ||
| 30 December 2013 | ||
| J. High Energy Phys. 02 (2014) 024 | ||
| Abstract: The top-antitop quark ($ \mathrm{ t \bar{t} } $) production cross section is measured in proton-proton collisions at $ \sqrt{s} $ = 8 TeV with the CMS experiment at the LHC, using a data sample corresponding to an integrated luminosity of 5.3 inverse femtobarns. The measurement is performed by analysing events with a pair of electrons or muons, or one electron and one muon, and at least two jets, one of which is identified as originating from hadronisation of a bottom quark. The measured cross section is 239 $\pm$ 2 (stat.) $\pm$ 11 (syst.) $\pm$ 6 (lum.) pb, for an assumed top-quark mass of 172.5 GeV, in agreement with the prediction of the standard model. | ||
| Links: e-print arXiv:1312.7582 [hep-ex] (PDF) ; CDS record ; inSPIRE record ; Public twiki page ; HepData record ; CADI line (restricted) ; | ||
| Figures | |
png pdf |
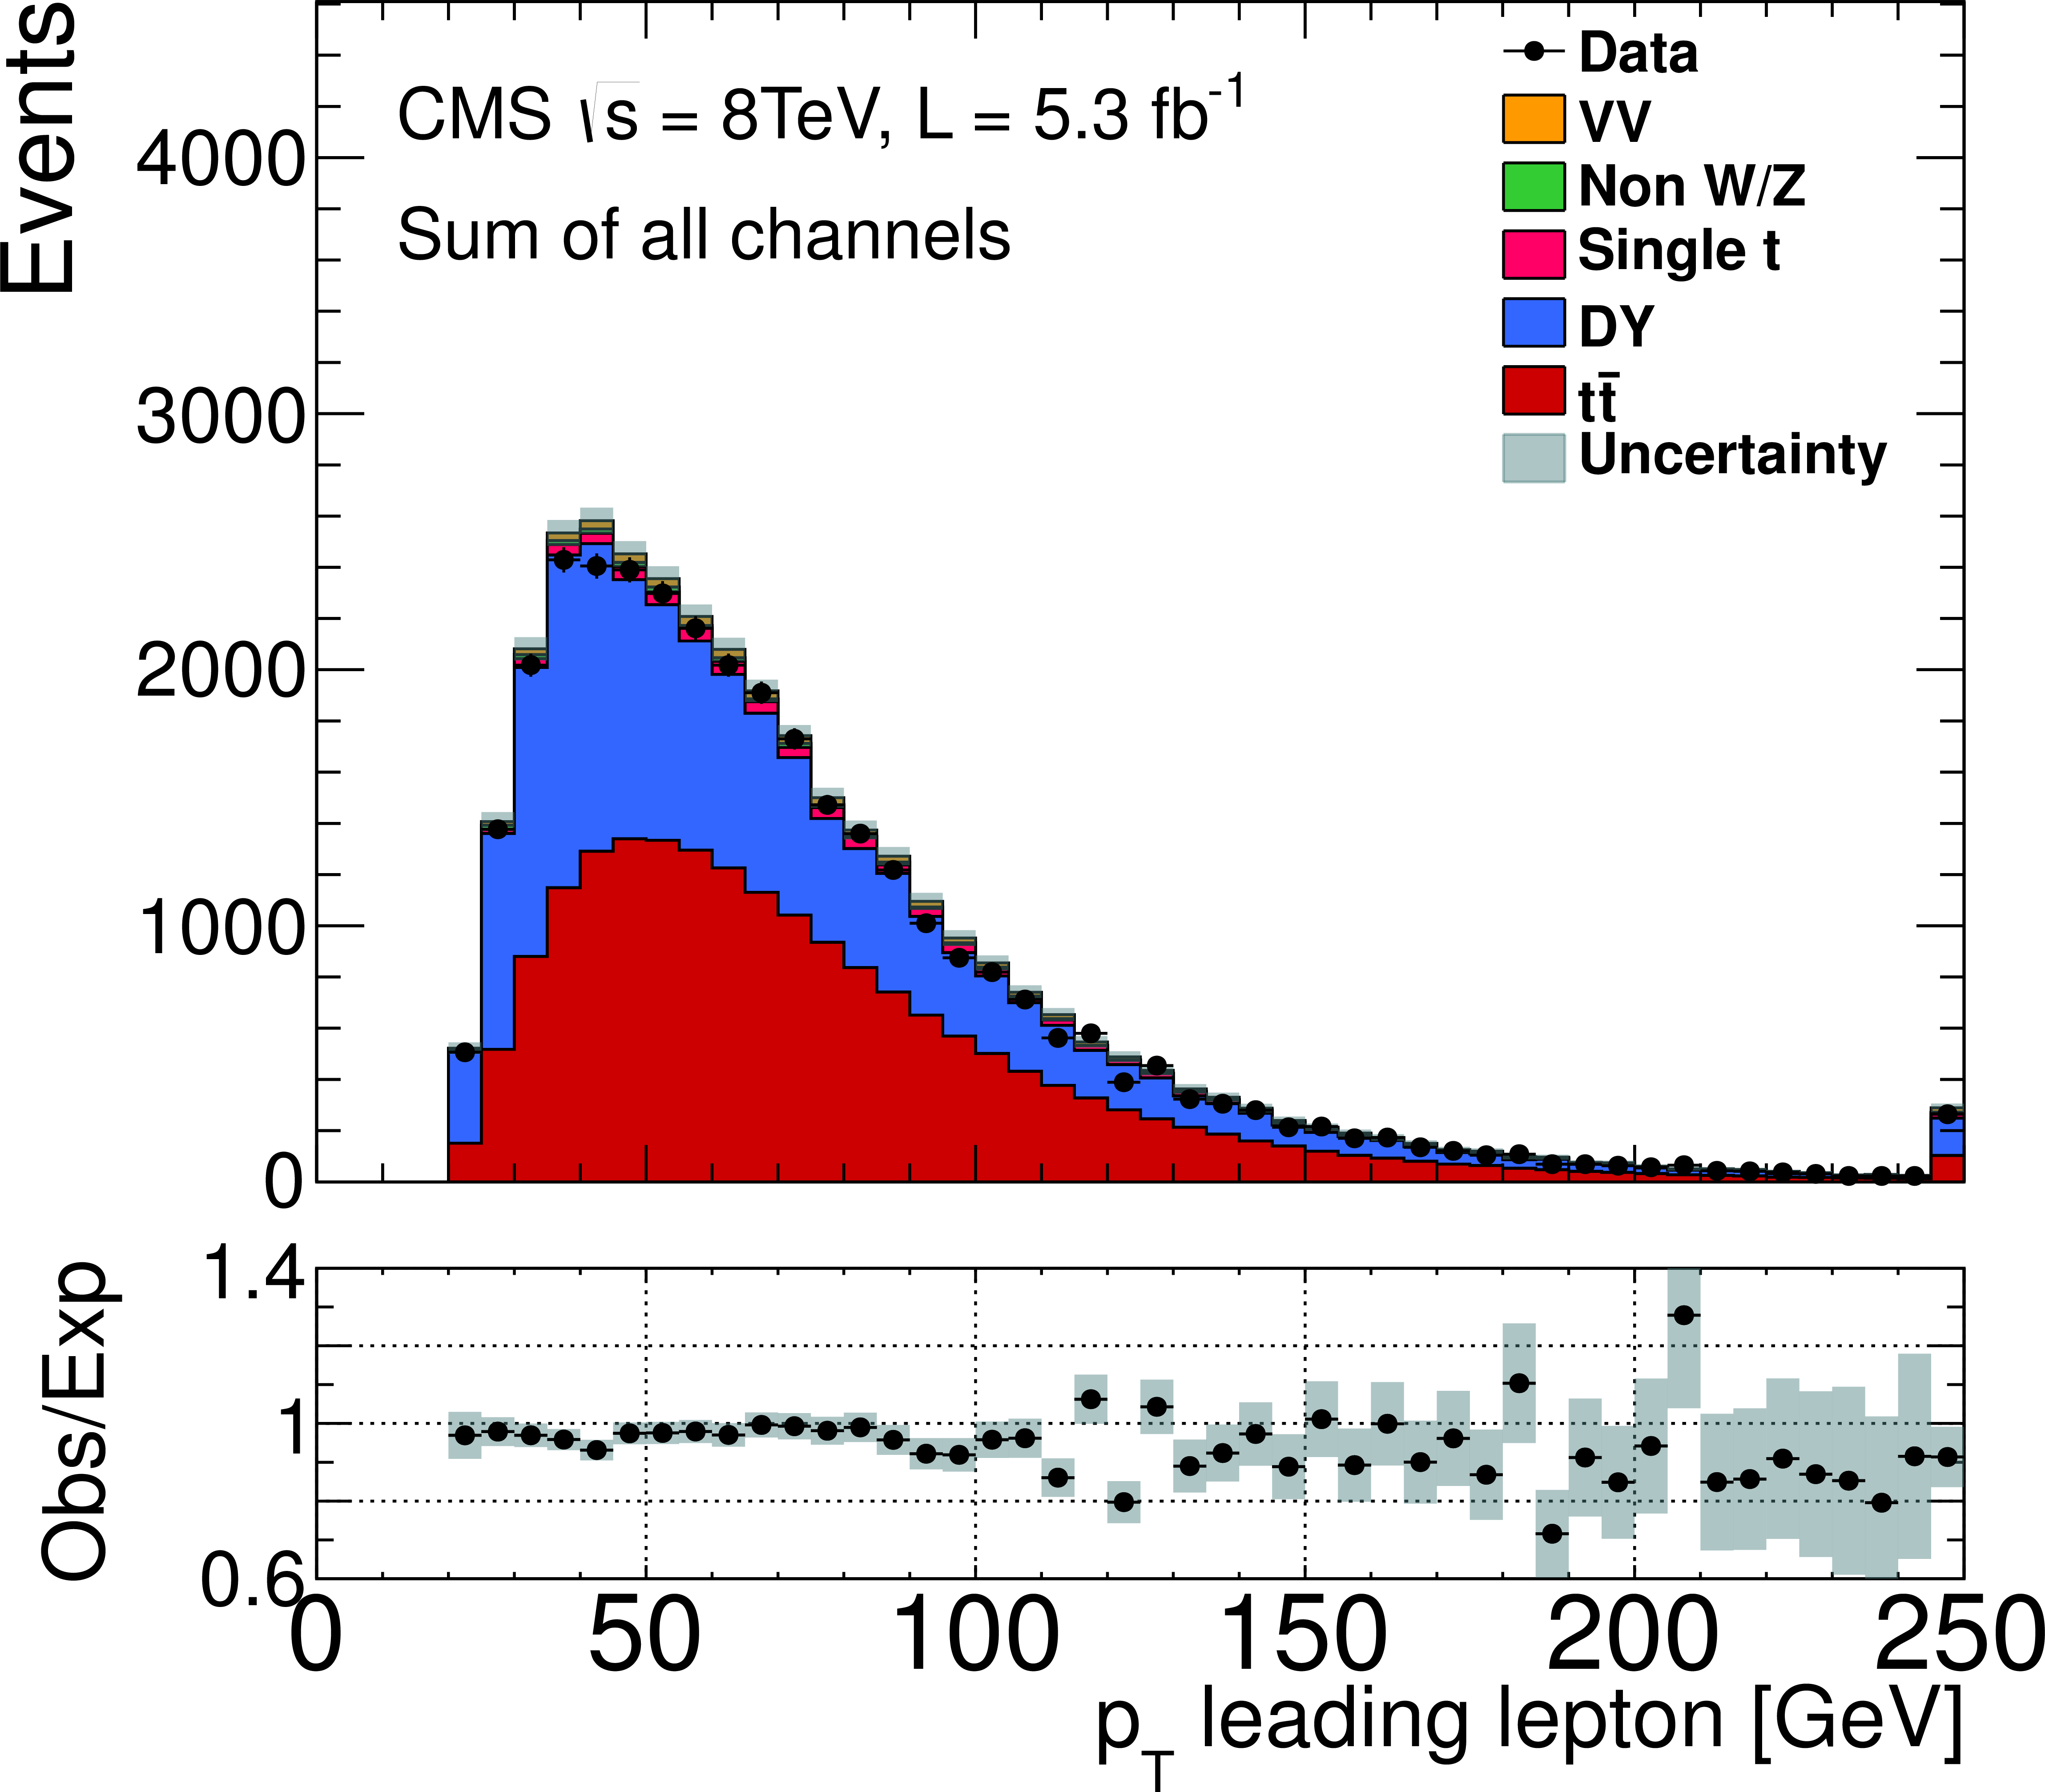
Figure 1-a:
The $ {p_{\mathrm {T}}} $ distributions of the highest-$ {p_{\mathrm {T}}} $ lepton (a) and jet (b) after the jet multiplicity selection, for all three final states. The expected distributions for $ {\mathrm {t}\overline {\mathrm {t}}} $ signal and individual backgrounds are shown after data-based corrections are applied; the last bin contains the overflow events. The hatched bands correspond to the total statistical uncertainty in the event yields for the sum of the $ {\mathrm {t}\overline {\mathrm {t}}} $ and background predictions. The ratios of data to the sum of the expected yields are given at the bottom. |
png pdf |
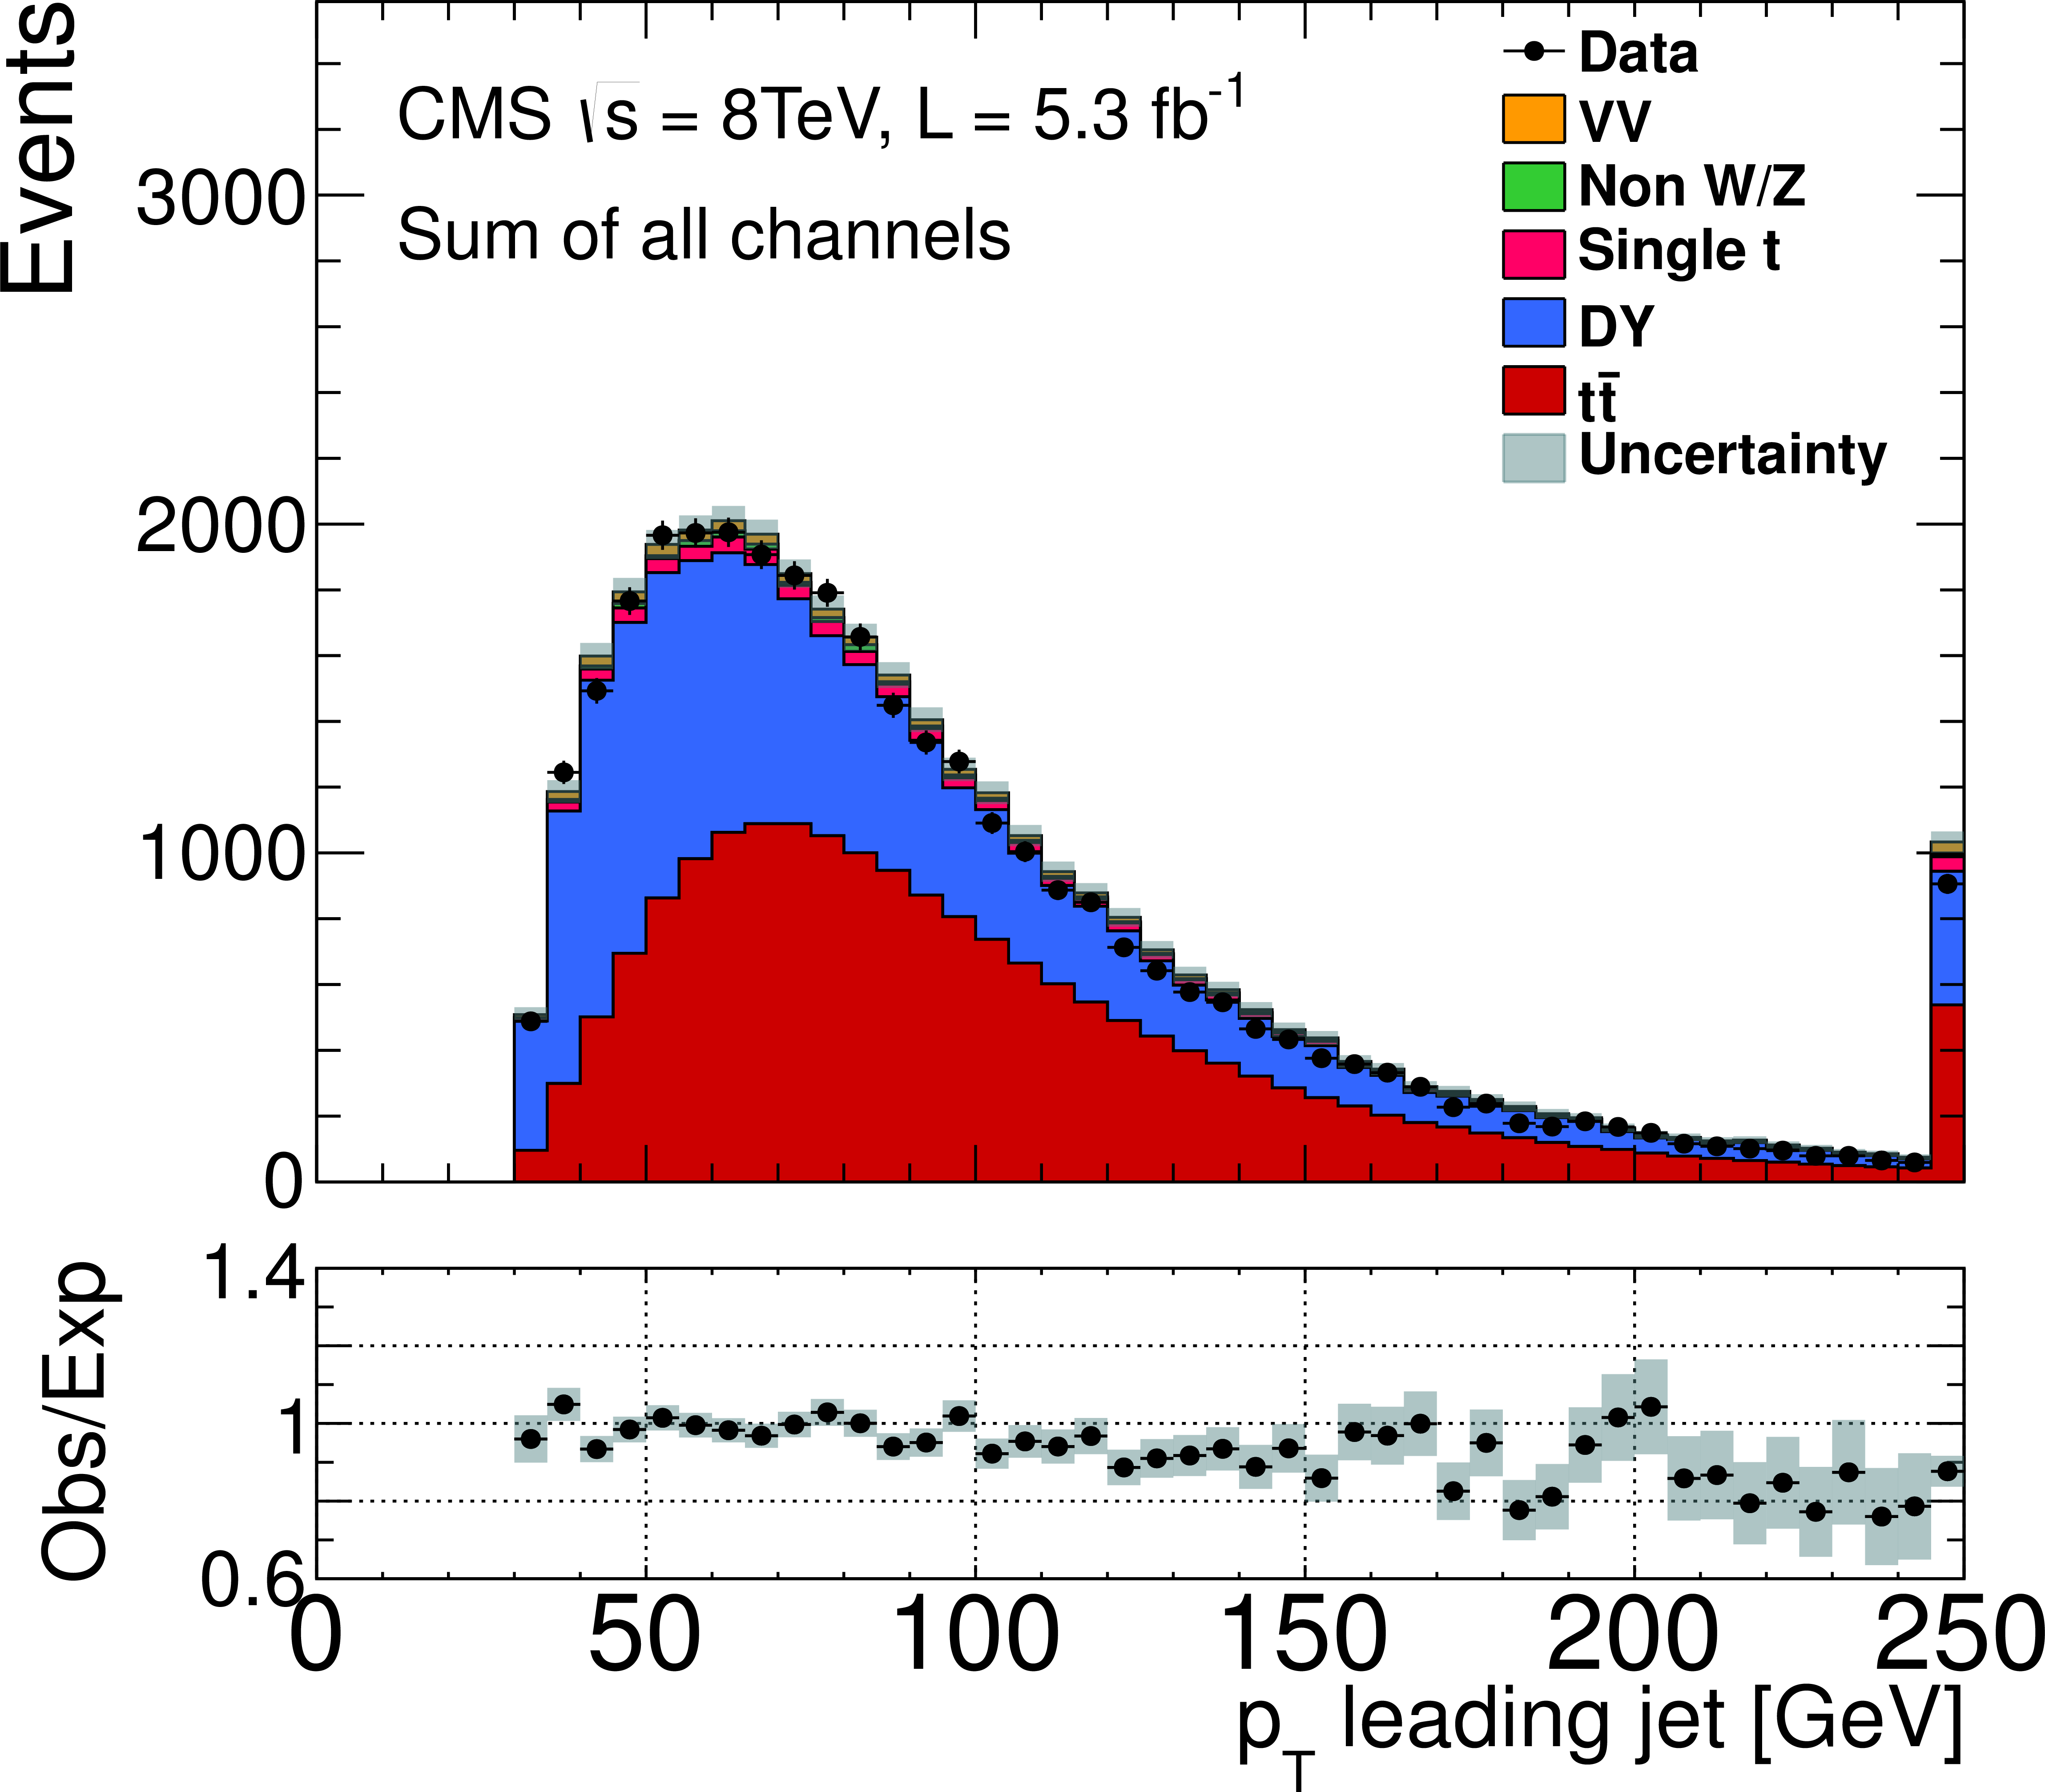
Figure 1-b:
The $ {p_{\mathrm {T}}} $ distributions of the highest-$ {p_{\mathrm {T}}} $ lepton (a) and jet (b) after the jet multiplicity selection, for all three final states. The expected distributions for $ {\mathrm {t}\overline {\mathrm {t}}} $ signal and individual backgrounds are shown after data-based corrections are applied; the last bin contains the overflow events. The hatched bands correspond to the total statistical uncertainty in the event yields for the sum of the $ {\mathrm {t}\overline {\mathrm {t}}} $ and background predictions. The ratios of data to the sum of the expected yields are given at the bottom. |
png pdf |
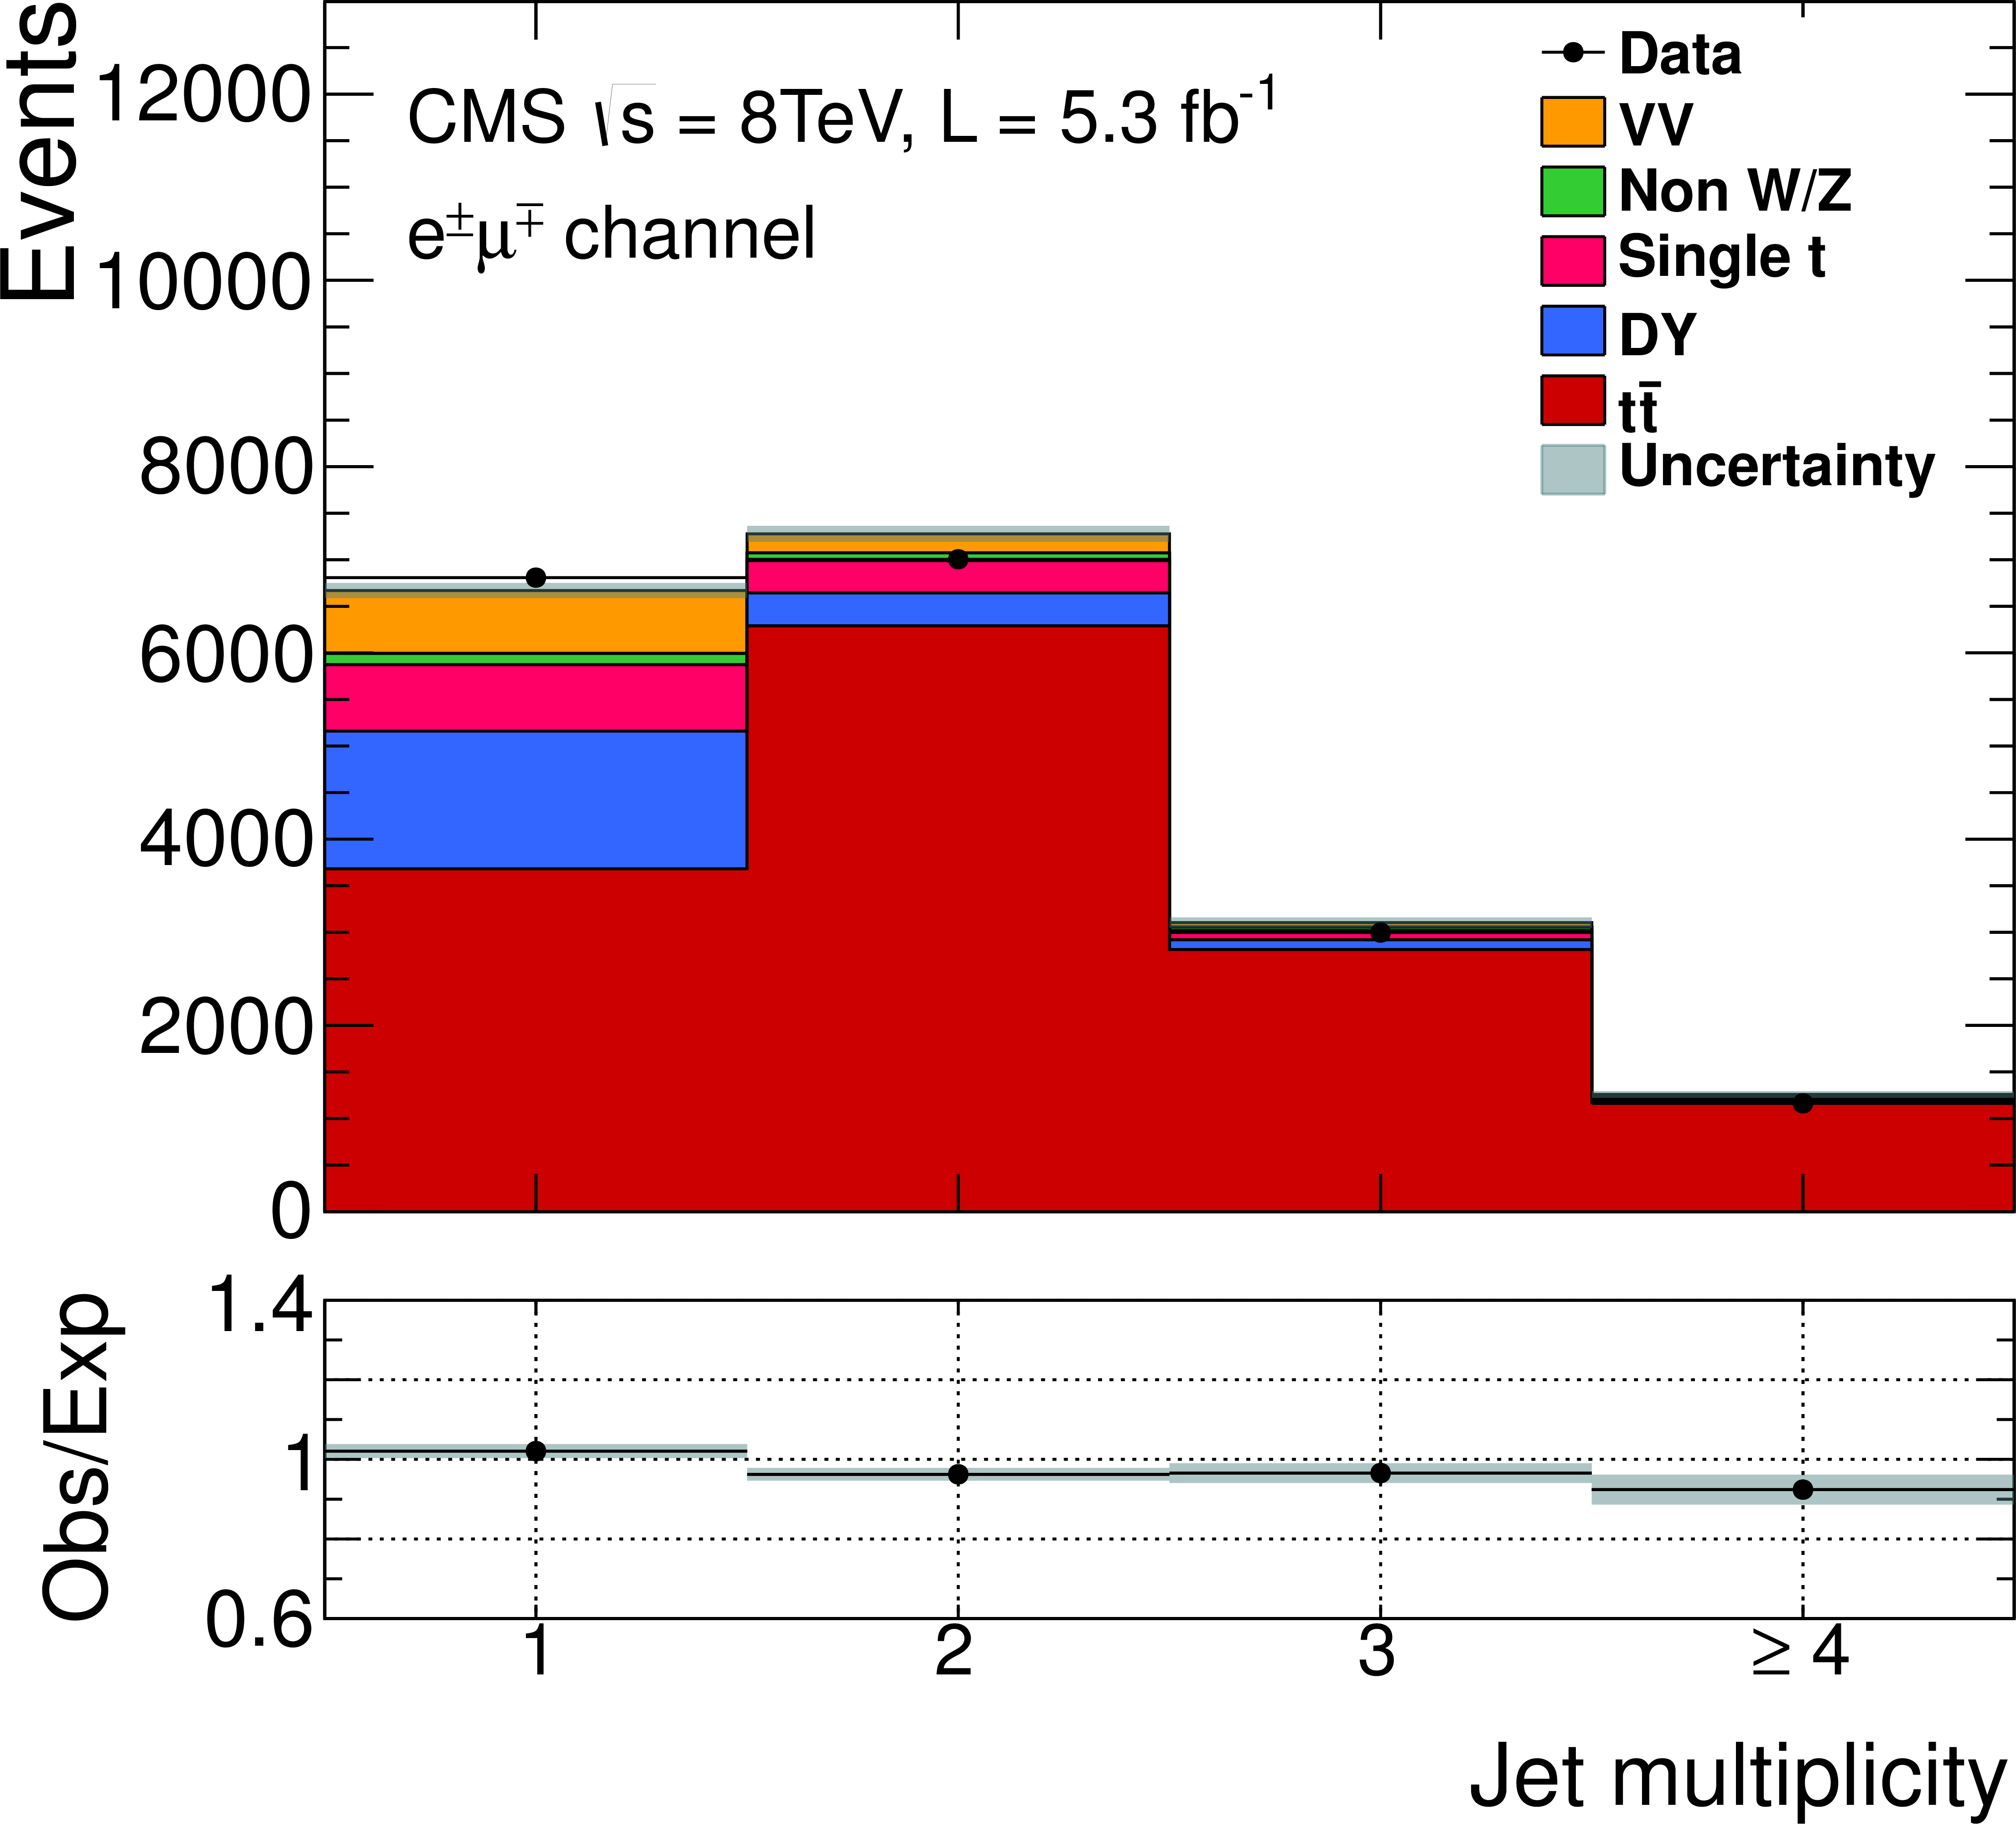
Figure 2-a:
Jet multiplicity (a) in events passing the dilepton criteria, and (b) b-jet multiplicity in events passing the full event selections but before the b-jet requirement, for the ${ {\mathrm {e}}^\pm {{\mu }}^\mp }$ channel. In Fig.2-b, the hatched bands show the total statistical and b-jet systematic uncertainties in the event yields for the sum of the ${\mathrm {t}\overline {\mathrm {t}}} $ and background predictions. The hatched bands in the left figure show only the total statistical uncertainty on the predicted event yields. The ratios of data to the sum of the expected yields are given at the bottom. |
png pdf |
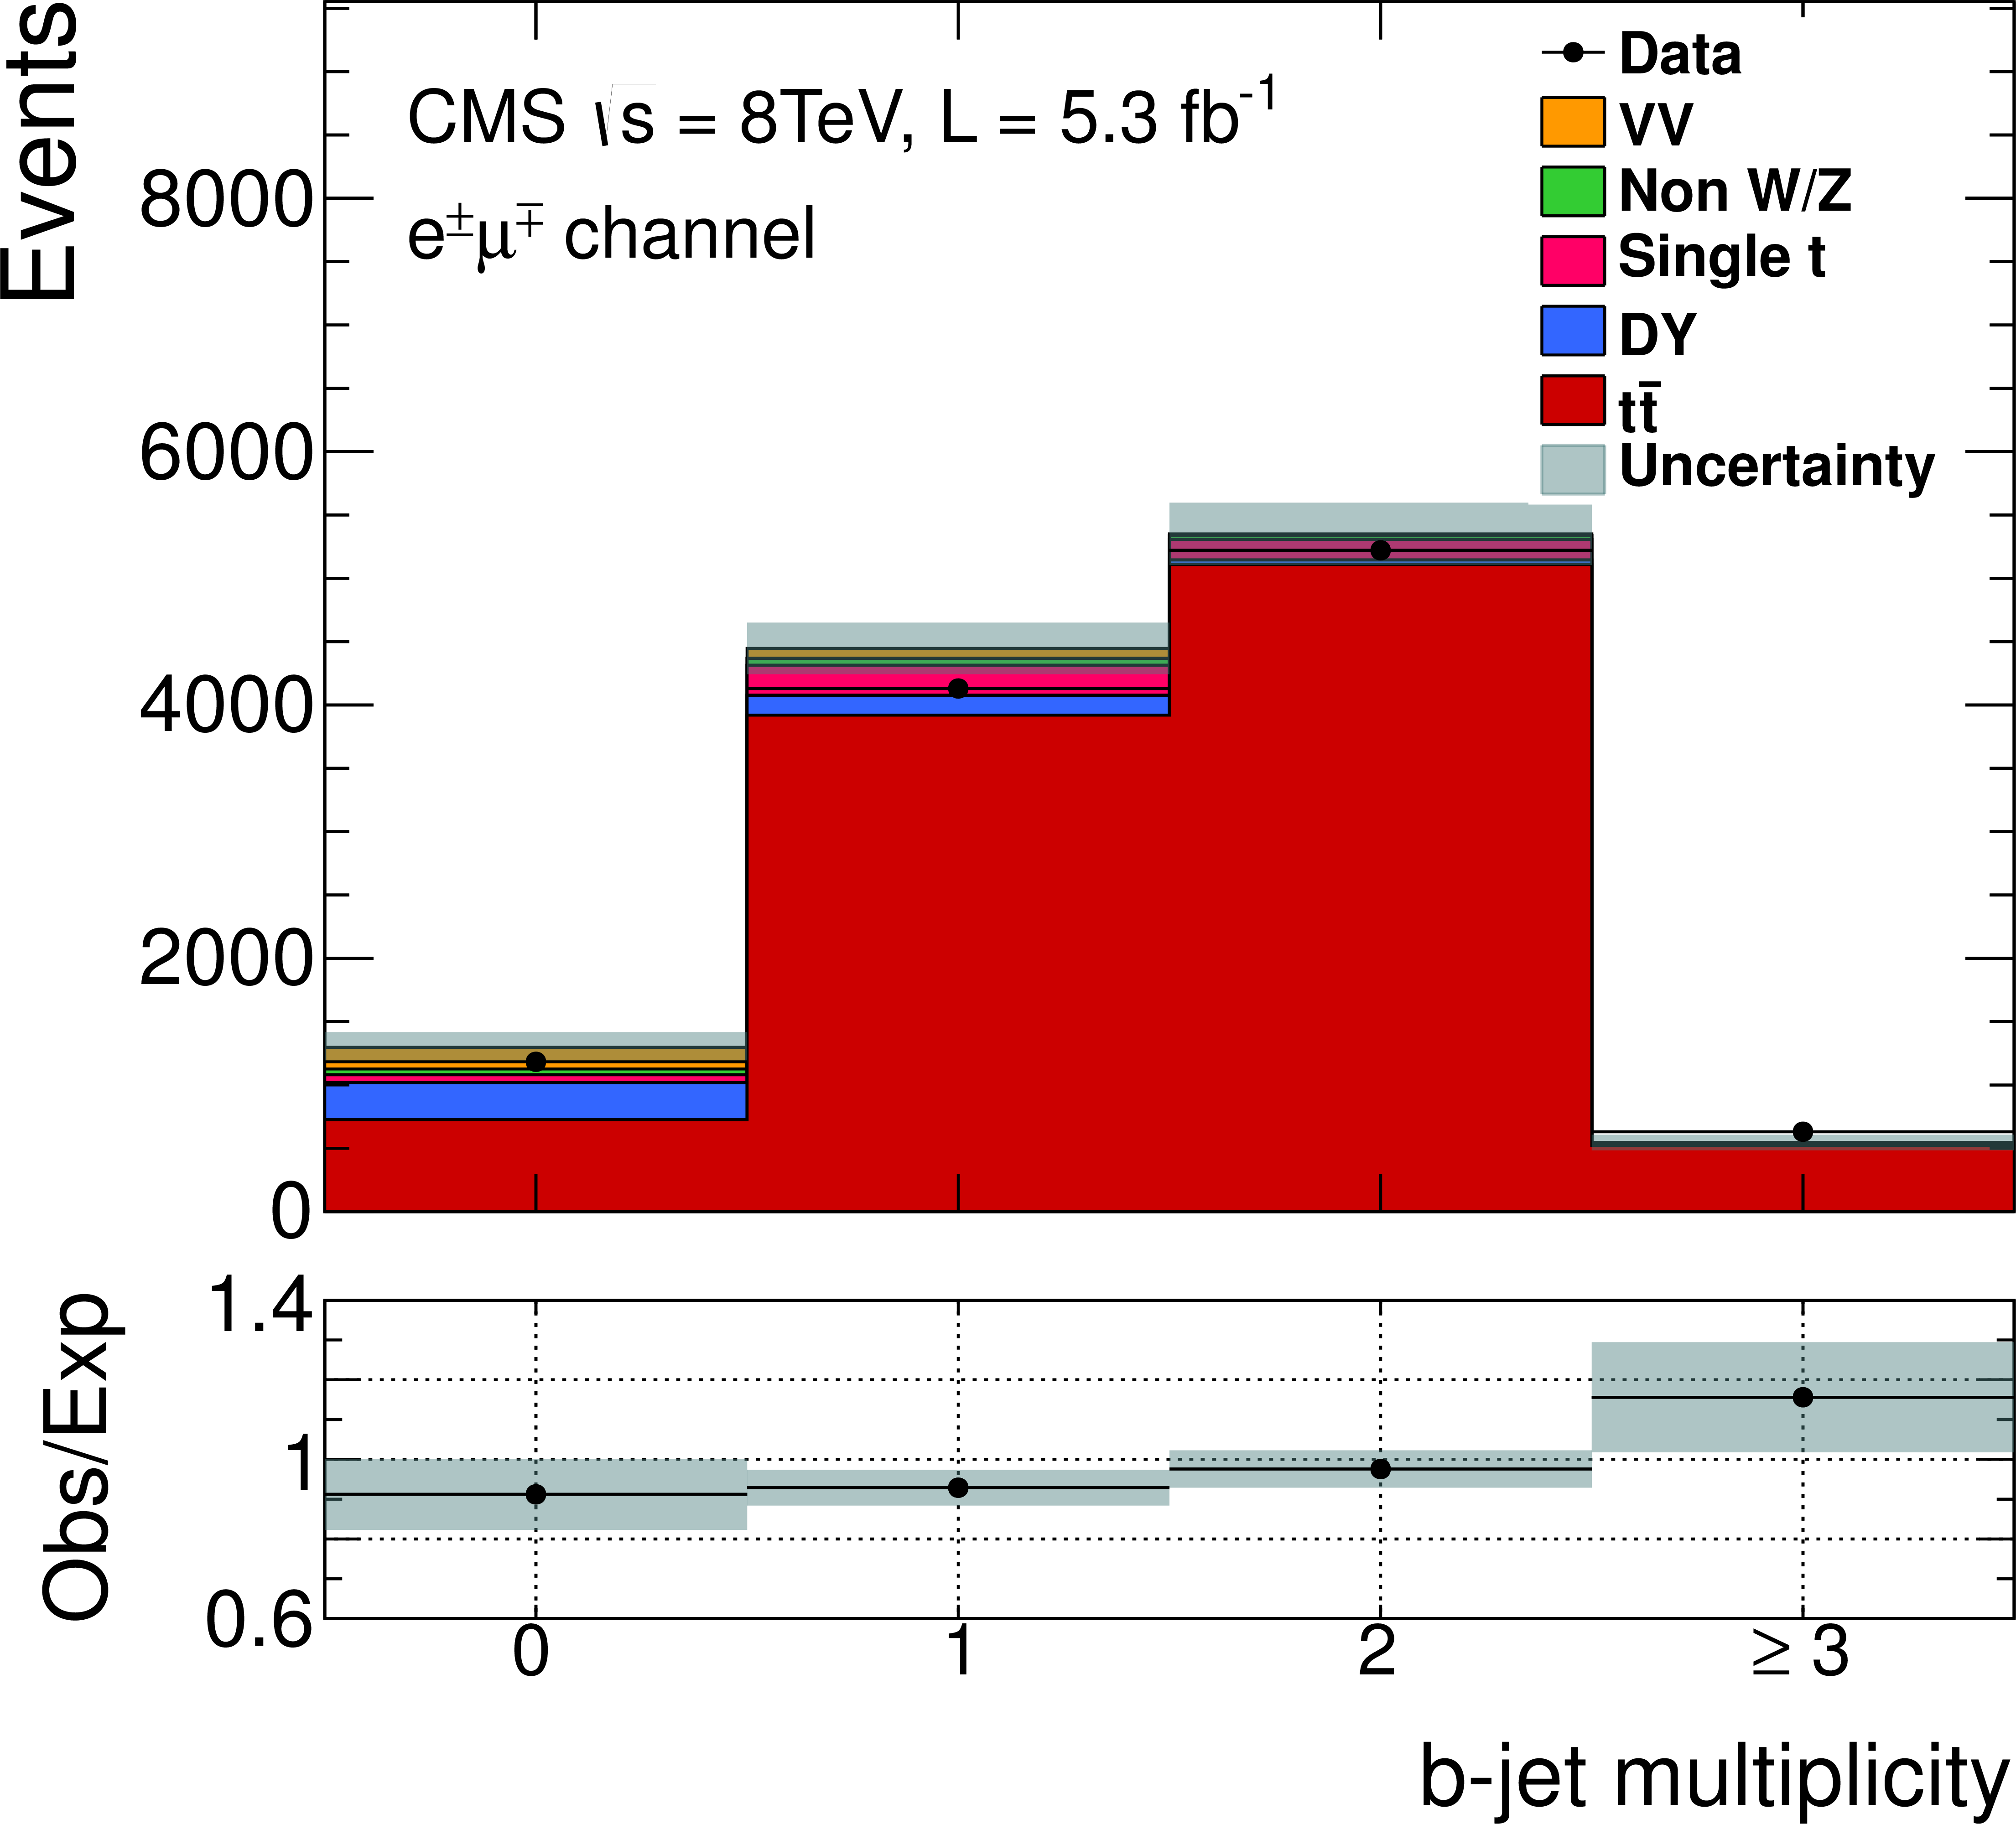
Figure 2-b:
Jet multiplicity (a) in events passing the dilepton criteria, and (b) b-jet multiplicity in events passing the full event selections but before the b-jet requirement, for the ${ {\mathrm {e}}^\pm {{\mu }}^\mp }$ channel. In Fig.2-b, the hatched bands show the total statistical and b-jet systematic uncertainties in the event yields for the sum of the ${\mathrm {t}\overline {\mathrm {t}}} $ and background predictions. The hatched bands in the left figure show only the total statistical uncertainty on the predicted event yields. The ratios of data to the sum of the expected yields are given at the bottom. |
png pdf |
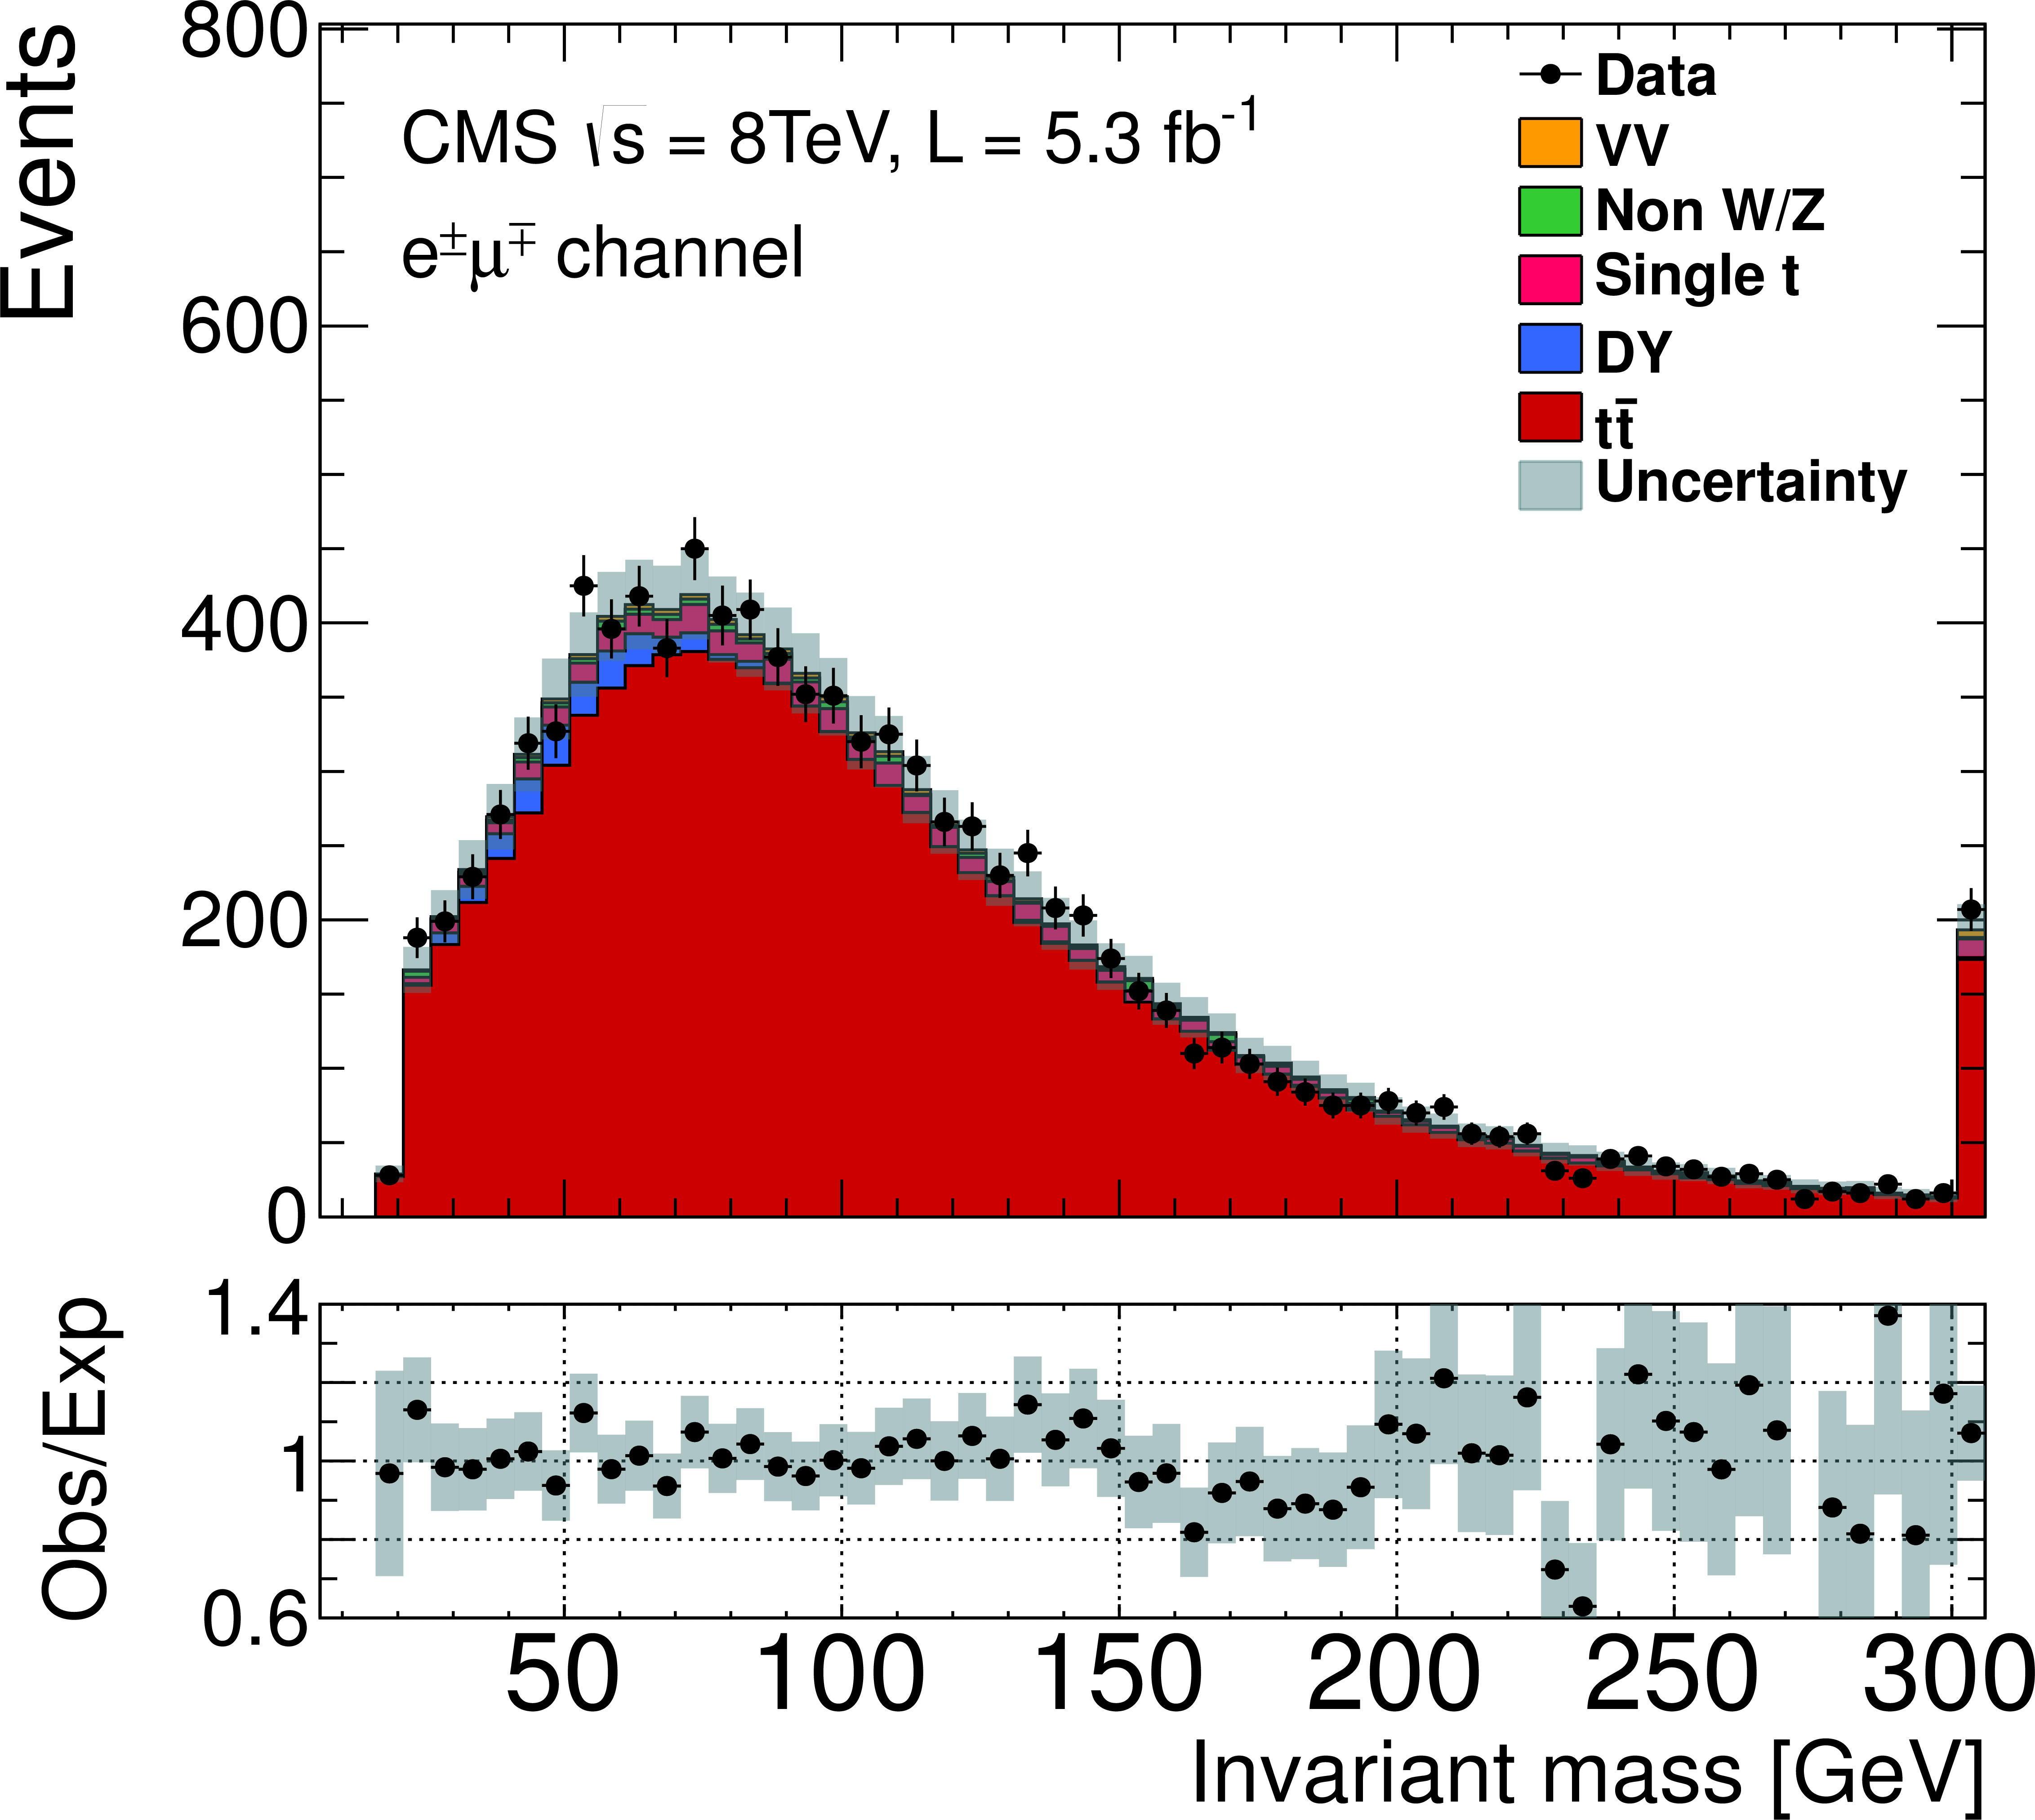
Figure 3-a:
Distributions of (a) the dilepton invariant-mass, (b) the $ {E_{\mathrm {T}} } $, and (c) the difference of the azimuthal angle between the two selected leptons, after the b-jet multiplicity selection and for the $ { {\mathrm {e}}^\pm {{\mu }}^\mp }$ channel. For the first two plots the last bin contains the overflow events. The expected distributions for $ {\mathrm {t}\overline {\mathrm {t}}} $ signal, in this case, are normalised to the measured $ {\mathrm {t}\overline {\mathrm {t}}} $ cross section. The hatched bands correspond to the total uncertainty in the predicted event yields for the sum of the $ {\mathrm {t}\overline {\mathrm {t}}} $ and background predictions. The ratios of data to the sum of the expected yields are given at the bottom. |
png pdf |
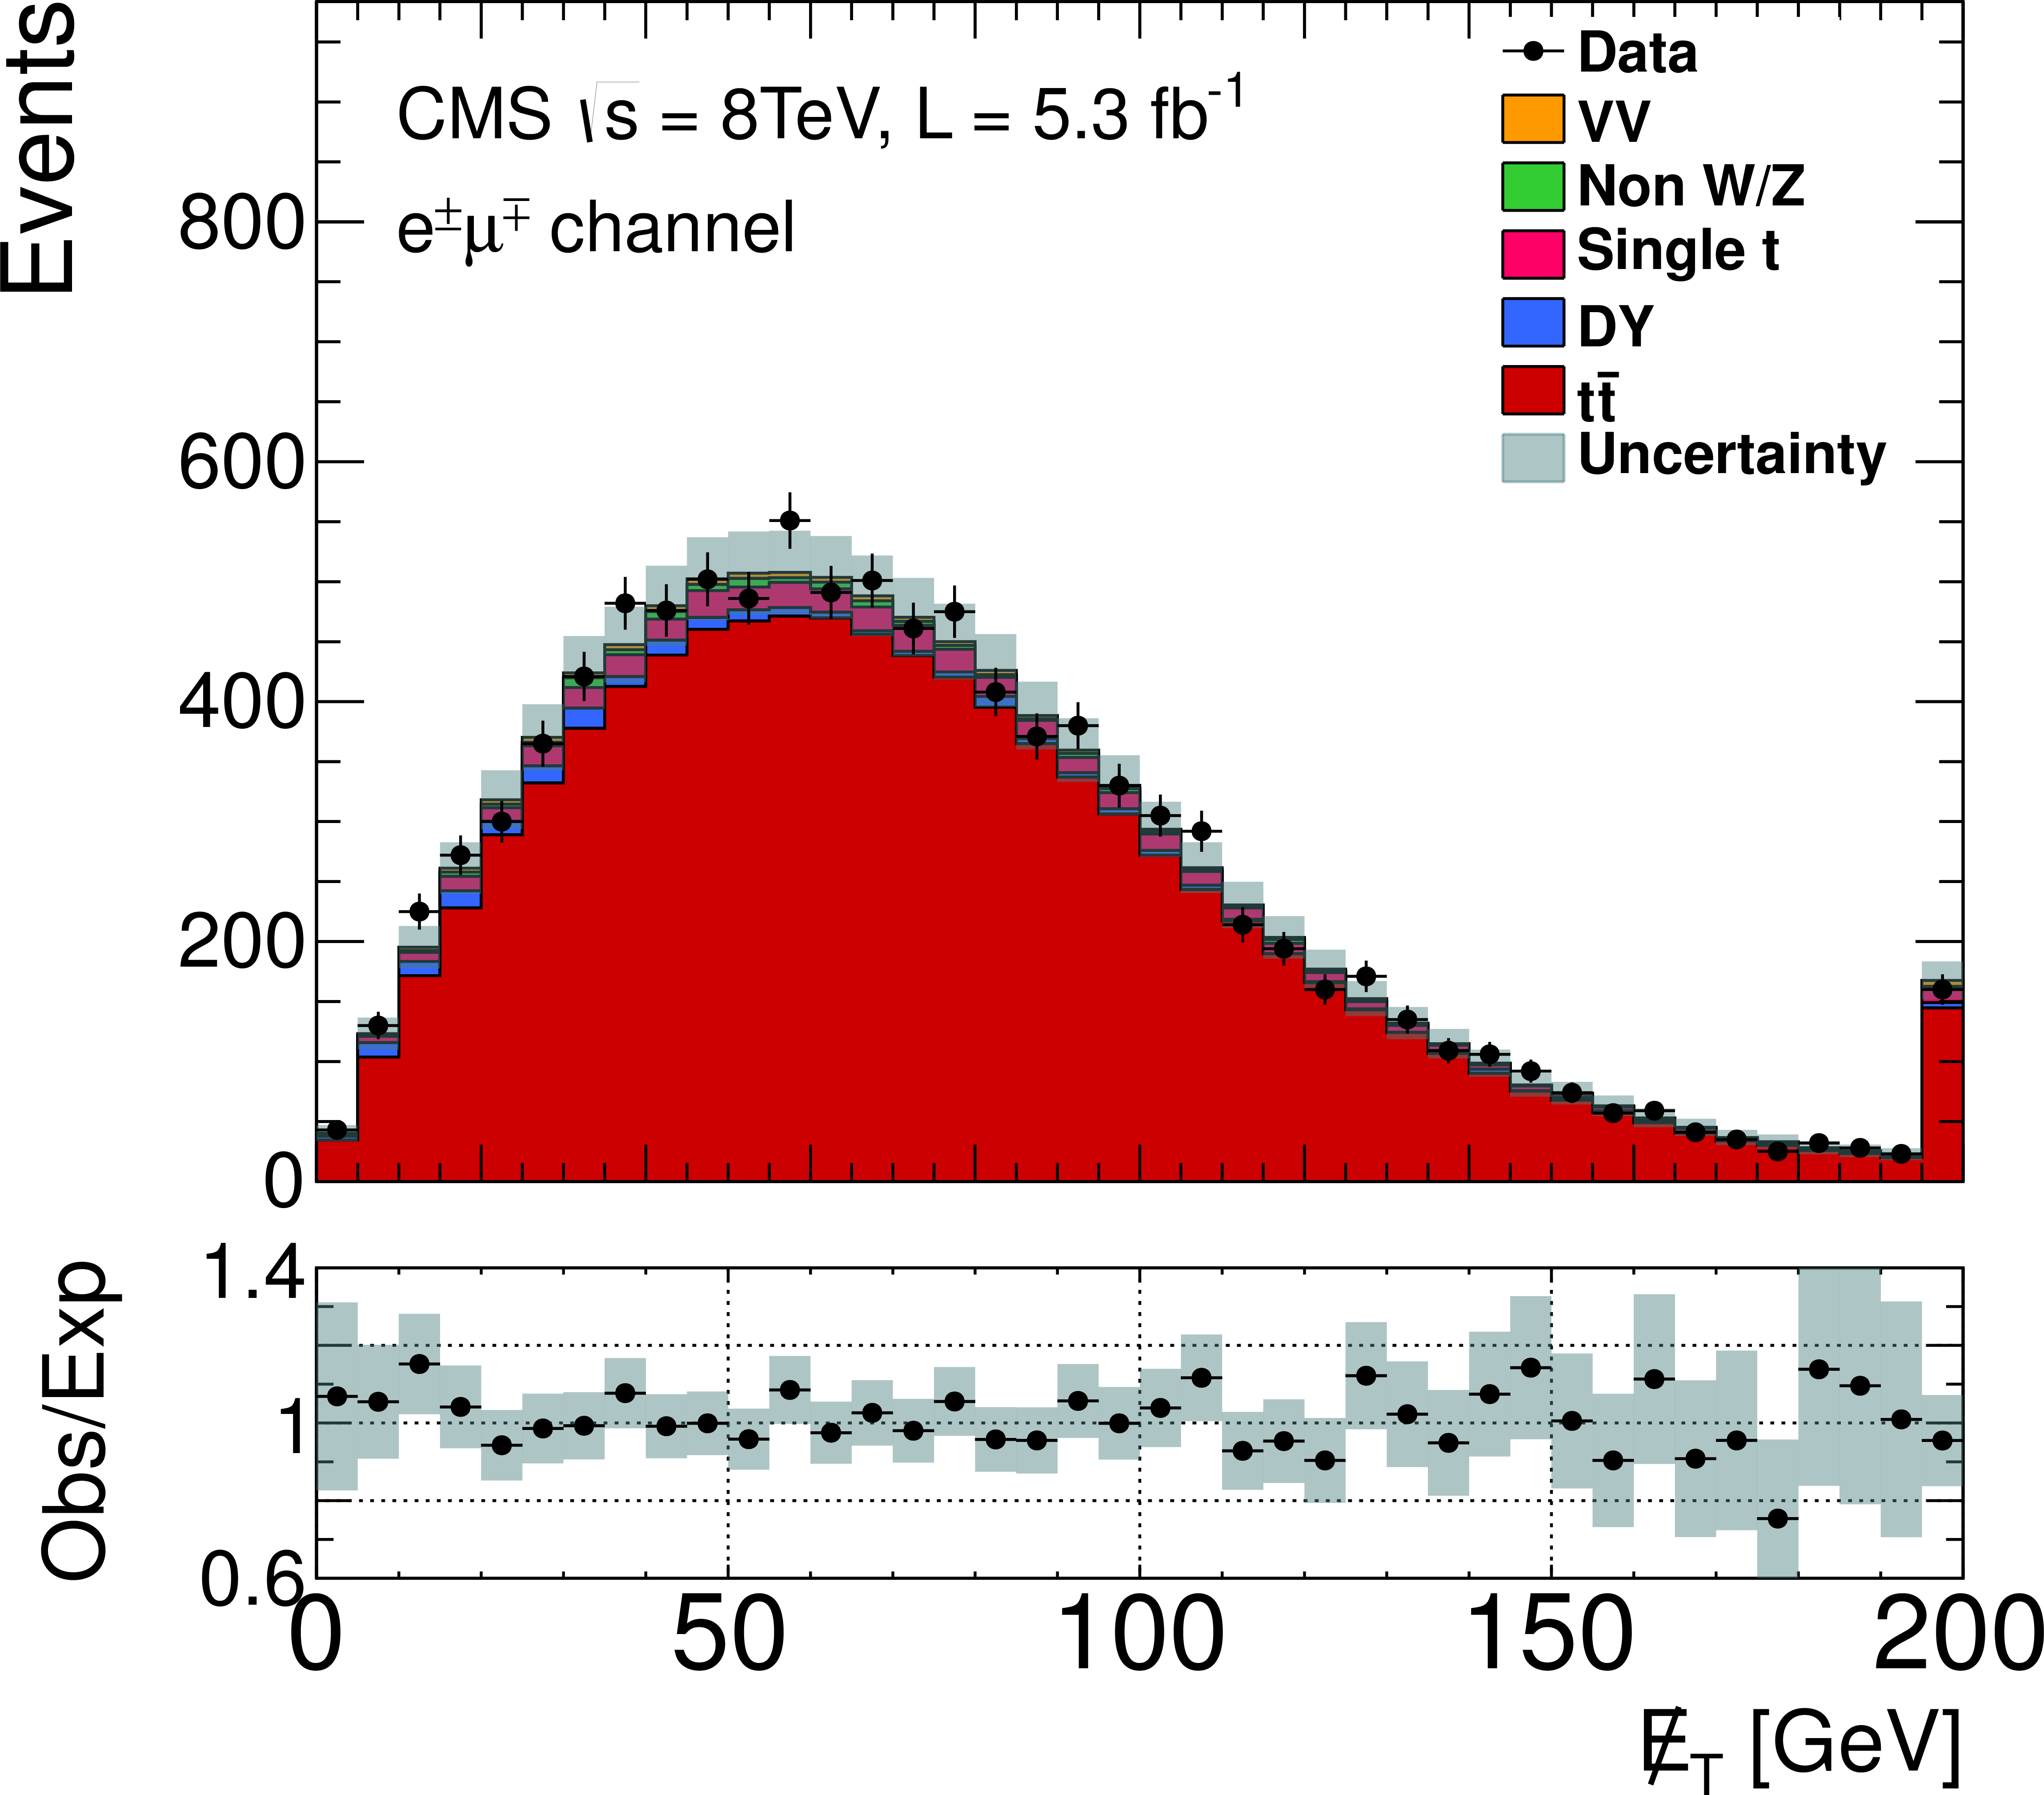
Figure 3-b:
Distributions of (a) the dilepton invariant-mass, (b) the $ {E_{\mathrm {T}} } $, and (c) the difference of the azimuthal angle between the two selected leptons, after the b-jet multiplicity selection and for the $ { {\mathrm {e}}^\pm {{\mu }}^\mp }$ channel. For the first two plots the last bin contains the overflow events. The expected distributions for $ {\mathrm {t}\overline {\mathrm {t}}} $ signal, in this case, are normalised to the measured $ {\mathrm {t}\overline {\mathrm {t}}} $ cross section. The hatched bands correspond to the total uncertainty in the predicted event yields for the sum of the $ {\mathrm {t}\overline {\mathrm {t}}} $ and background predictions. The ratios of data to the sum of the expected yields are given at the bottom. |

png pdf |
Figure 3-c:
Distributions of (a) the dilepton invariant-mass, (b) the $ {E_{\mathrm {T}} } $, and (c) the difference of the azimuthal angle between the two selected leptons, after the b-jet multiplicity selection and for the $ { {\mathrm {e}}^\pm {{\mu }}^\mp }$ channel. For the first two plots the last bin contains the overflow events. The expected distributions for $ {\mathrm {t}\overline {\mathrm {t}}} $ signal, in this case, are normalised to the measured $ {\mathrm {t}\overline {\mathrm {t}}} $ cross section. The hatched bands correspond to the total uncertainty in the predicted event yields for the sum of the $ {\mathrm {t}\overline {\mathrm {t}}} $ and background predictions. The ratios of data to the sum of the expected yields are given at the bottom. |
|
|
Compact Muon Solenoid LHC, CERN |
|

|

|

|

|

|