

Compact Muon Solenoid
LHC, CERN
| CMS-TOP-12-010 ; CERN-PH-EP-2014-010 | ||
| Measurements of the $ \mathrm{ t\bar{t} } $ charge asymmetry using the dilepton decay channel in pp collisions at $\sqrt{s}$ = 7 TeV | ||
| CMS Collaboration | ||
| 16 February 2014 | ||
| J. High Energy Phys. 04 (2014) 191 | ||
| Abstract: The $ \mathrm{ t\bar{t} } $ charge asymmetry in proton-proton collisions at $\sqrt{s}$ = 7 TeV is measured using the dilepton decay channel ($ \mathrm{ ee } , \mathrm{ e }\mu,$ or $\mu\mu$). The data correspond to a total integrated luminosity of 5.0 inverse-femtobarns, collected by the CMS experiment at the LHC. The top-antitop and lepton charge asymmetries, defined as the differences in absolute values of the rapidities between the reconstructed top quarks and antiquarks and of the pseudorapidities between the positive and negative leptons, respectively, are measured to be $A_C$ = -0.010 $\pm$ 0.017 (stat.) $\pm$ 0.008 (syst.) and $A_C^{lep}$ = 0.009 $\pm$ 0.010 (stat.) $\pm$ 0.006 (syst.). The lepton charge asymmetry is also measured as a function of the invariant mass, rapidity, and transverse momentum of the top-antitop system. All measurements are consistent with the expectations of the standard model. | ||
| Links: e-print arXiv:1402.3803 [hep-ex] (PDF) ; CDS record ; inSPIRE record ; Public twiki page ; HepData record ; CADI line (restricted) ; | ||
| Figures | |

png pdf |
Figure 1-a:
The reconstructed $M_{ {\mathrm {t}\overline {\mathrm {t}}} }$ (top), $\Delta {| y_ {\mathrm {t}} | }$ (bottom left), and $\Delta {| \eta _\ell | }$ (bottom right) distributions from data (points) and simulation (histogram). The simulated events are divided into signal (open histogram) and background (dashed histogram) contributions, where the background contribution includes all event categories stipulated in Table {tab:yields1}. The signal yield is normalised to the background-subtracted data. The first and last bins include underflow and overflow events, respectively. The error bars on the data points represent the statistical uncertainties only. |
png pdf |
Figure 1-b:
The reconstructed $M_{ {\mathrm {t}\overline {\mathrm {t}}} }$ (top), $\Delta {| y_ {\mathrm {t}} | }$ (bottom left), and $\Delta {| \eta _\ell | }$ (bottom right) distributions from data (points) and simulation (histogram). The simulated events are divided into signal (open histogram) and background (dashed histogram) contributions, where the background contribution includes all event categories stipulated in Table {tab:yields1}. The signal yield is normalised to the background-subtracted data. The first and last bins include underflow and overflow events, respectively. The error bars on the data points represent the statistical uncertainties only. |

png pdf |
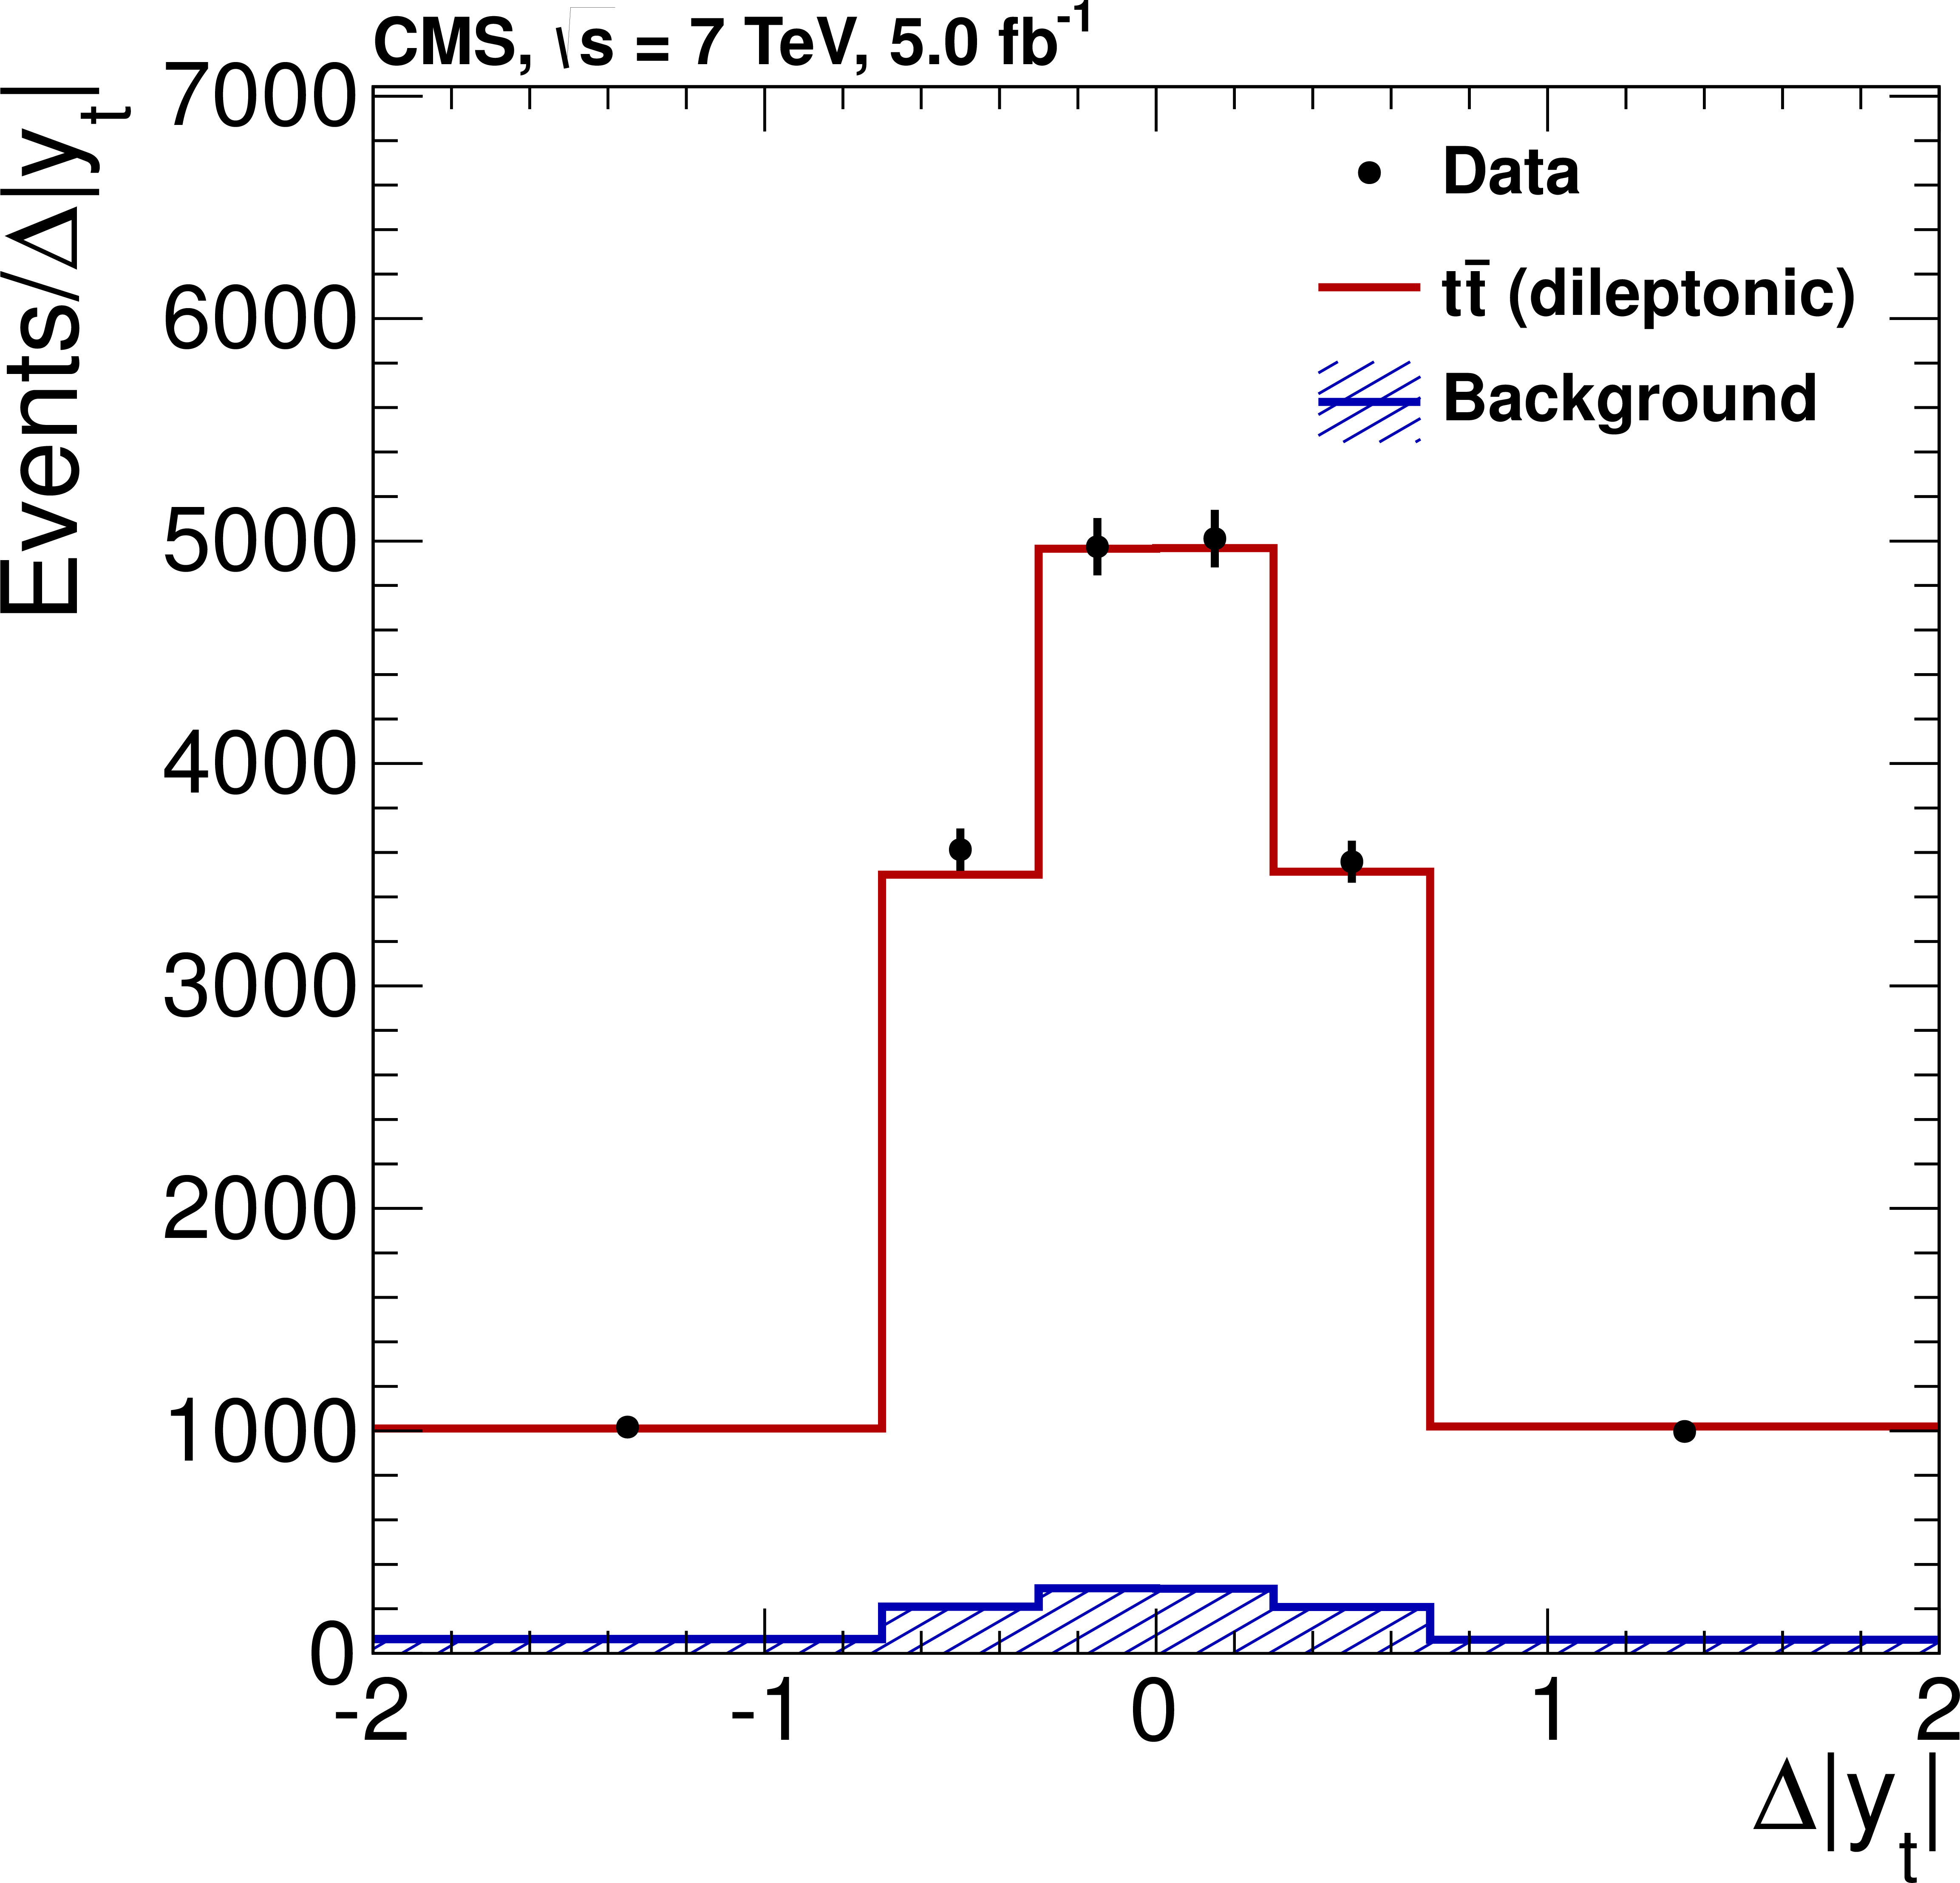
Figure 1-c:
The reconstructed $M_{ {\mathrm {t}\overline {\mathrm {t}}} }$ (top), $\Delta {| y_ {\mathrm {t}} | }$ (bottom left), and $\Delta {| \eta _\ell | }$ (bottom right) distributions from data (points) and simulation (histogram). The simulated events are divided into signal (open histogram) and background (dashed histogram) contributions, where the background contribution includes all event categories stipulated in Table {tab:yields1}. The signal yield is normalised to the background-subtracted data. The first and last bins include underflow and overflow events, respectively. The error bars on the data points represent the statistical uncertainties only. |

png pdf |
Figure 2-a:
Diagonal elements of the matrix $A$ describing the acceptance times efficiency of signal events as a function of $\Delta {| y_ {\mathrm {t}} | }$ (left) and $\Delta {| \eta _\ell | }$ (right) from simulated $\textsc {mc@nlo} \ {\mathrm {t}\overline {\mathrm {t}}} $ events. The statistical uncertainties are represented by the hatched band, and the first and last bins include underflow and overflow events, respectively. |
png pdf |
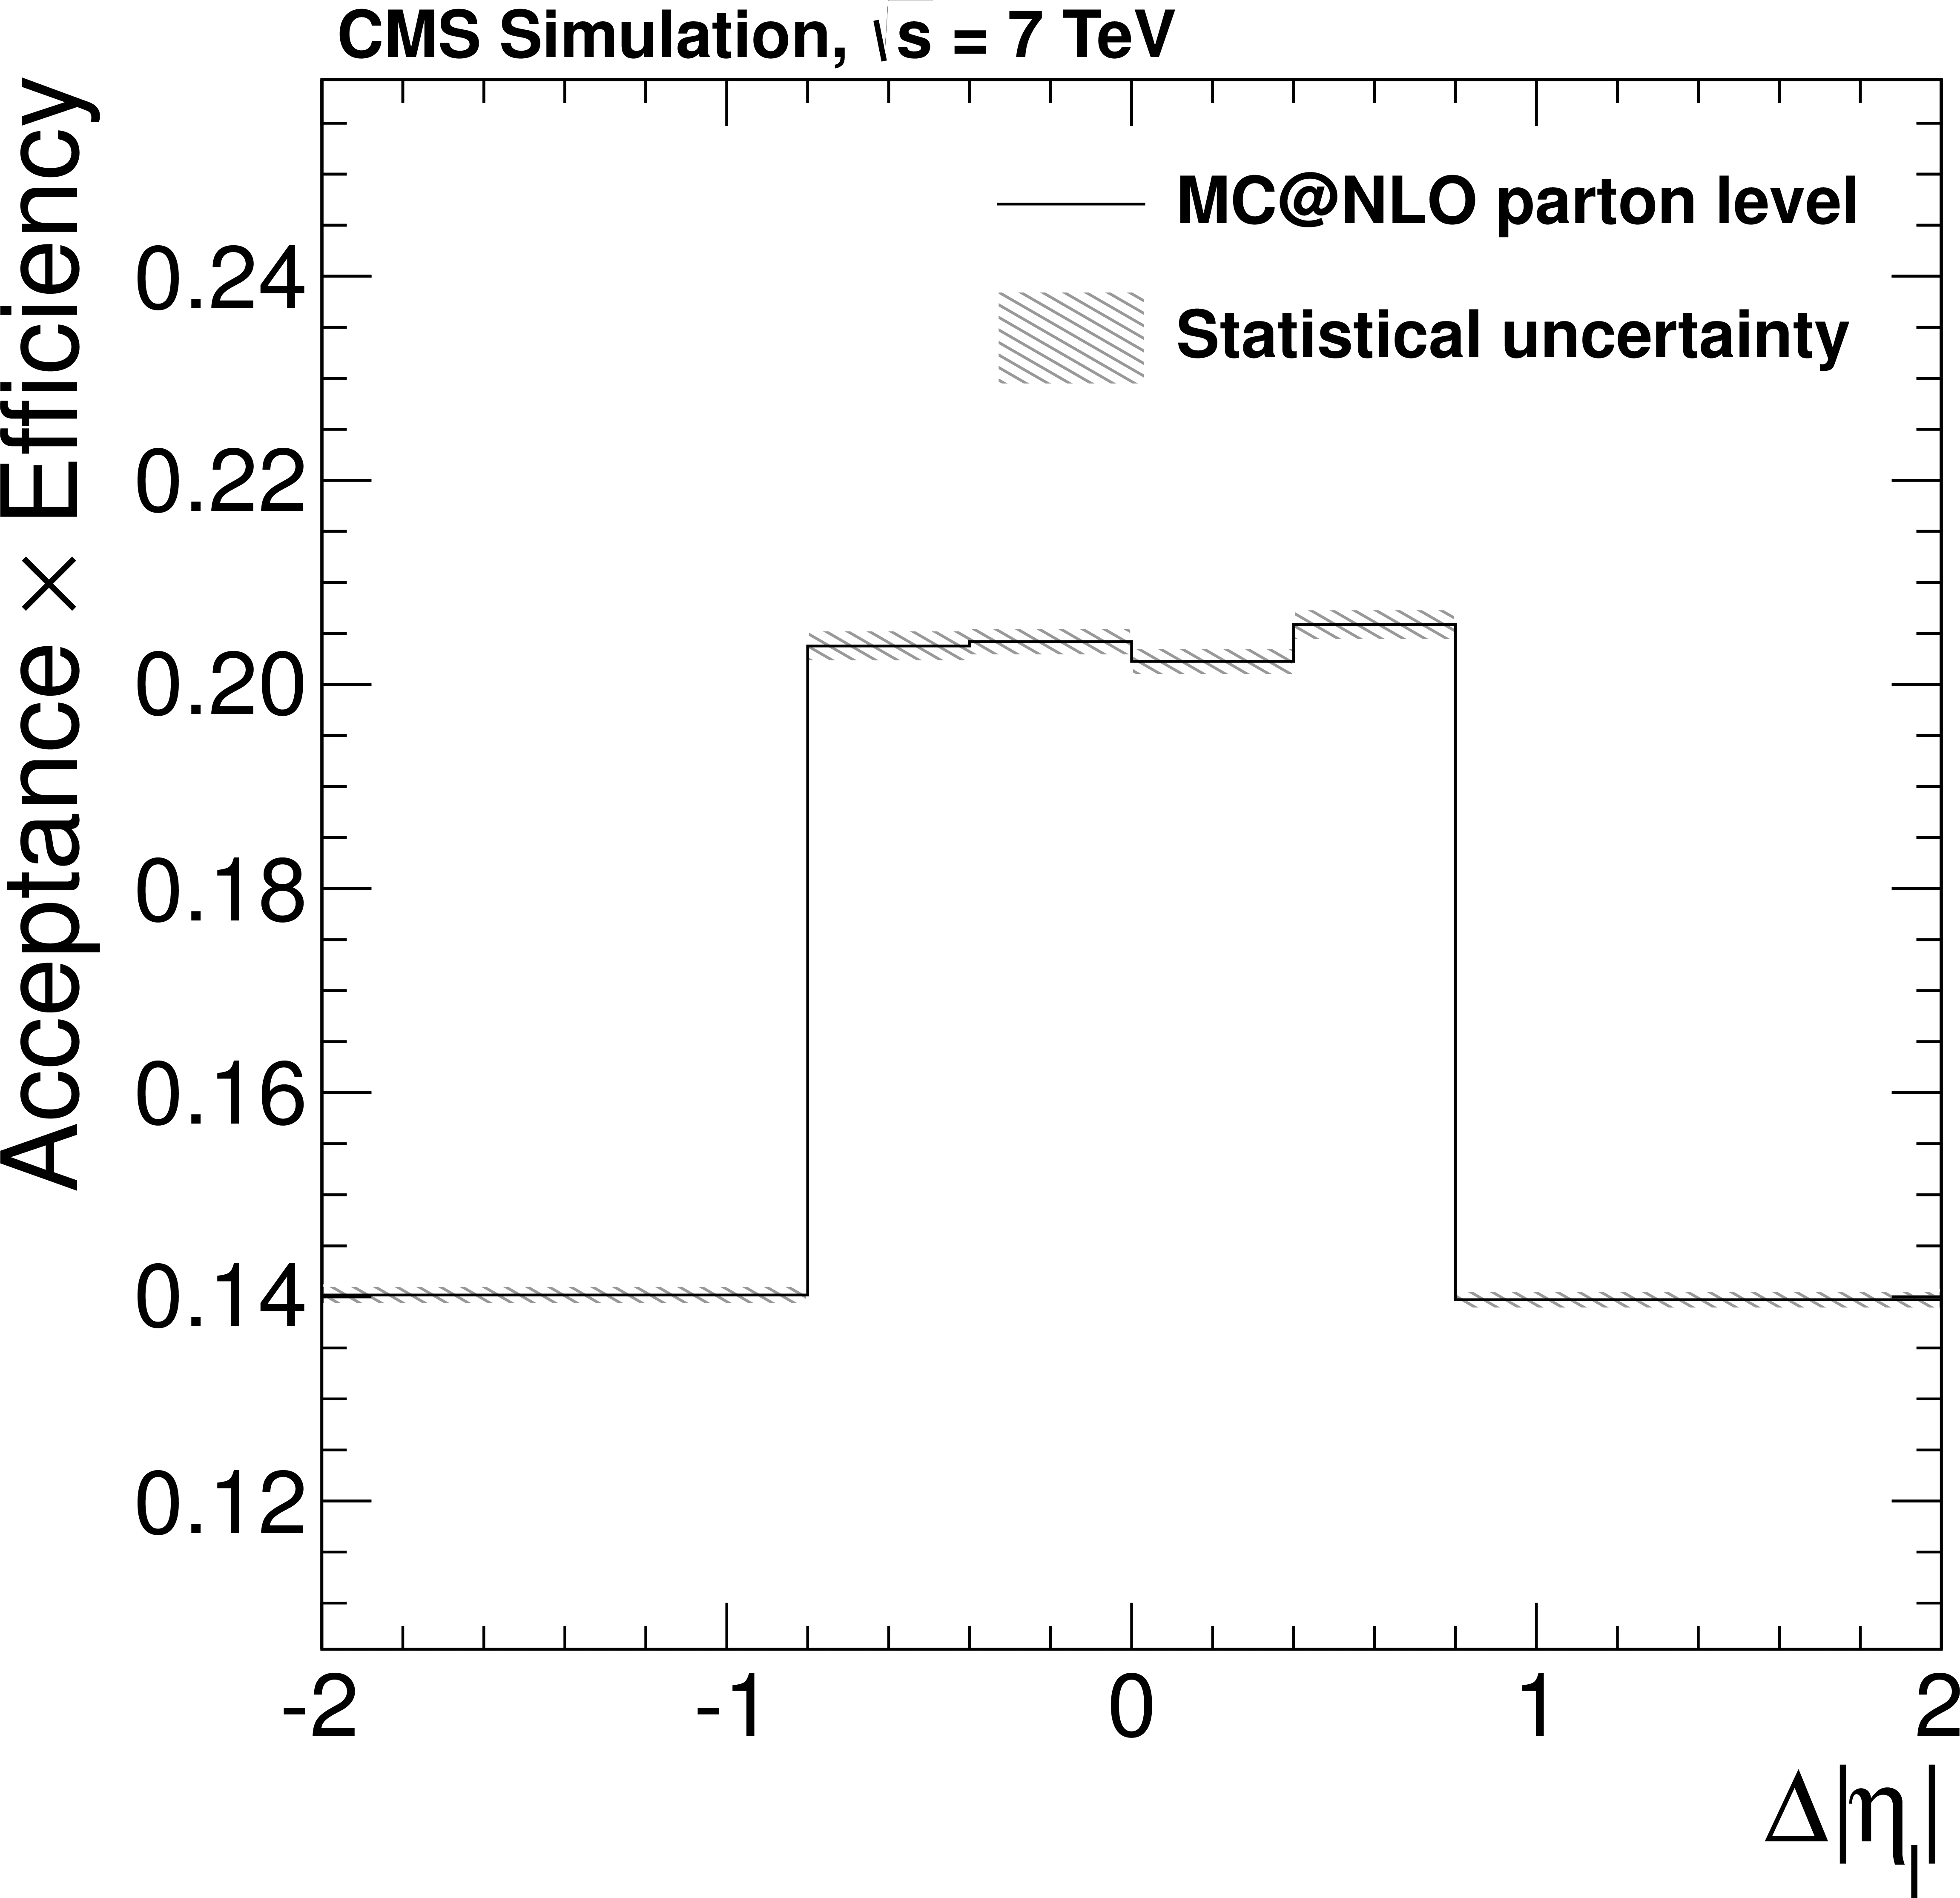
Figure 2-b:
Diagonal elements of the matrix $A$ describing the acceptance times efficiency of signal events as a function of $\Delta {| y_ {\mathrm {t}} | }$ (left) and $\Delta {| \eta _\ell | }$ (right) from simulated $\textsc {mc@nlo} \ {\mathrm {t}\overline {\mathrm {t}}} $ events. The statistical uncertainties are represented by the hatched band, and the first and last bins include underflow and overflow events, respectively. |
png pdf |
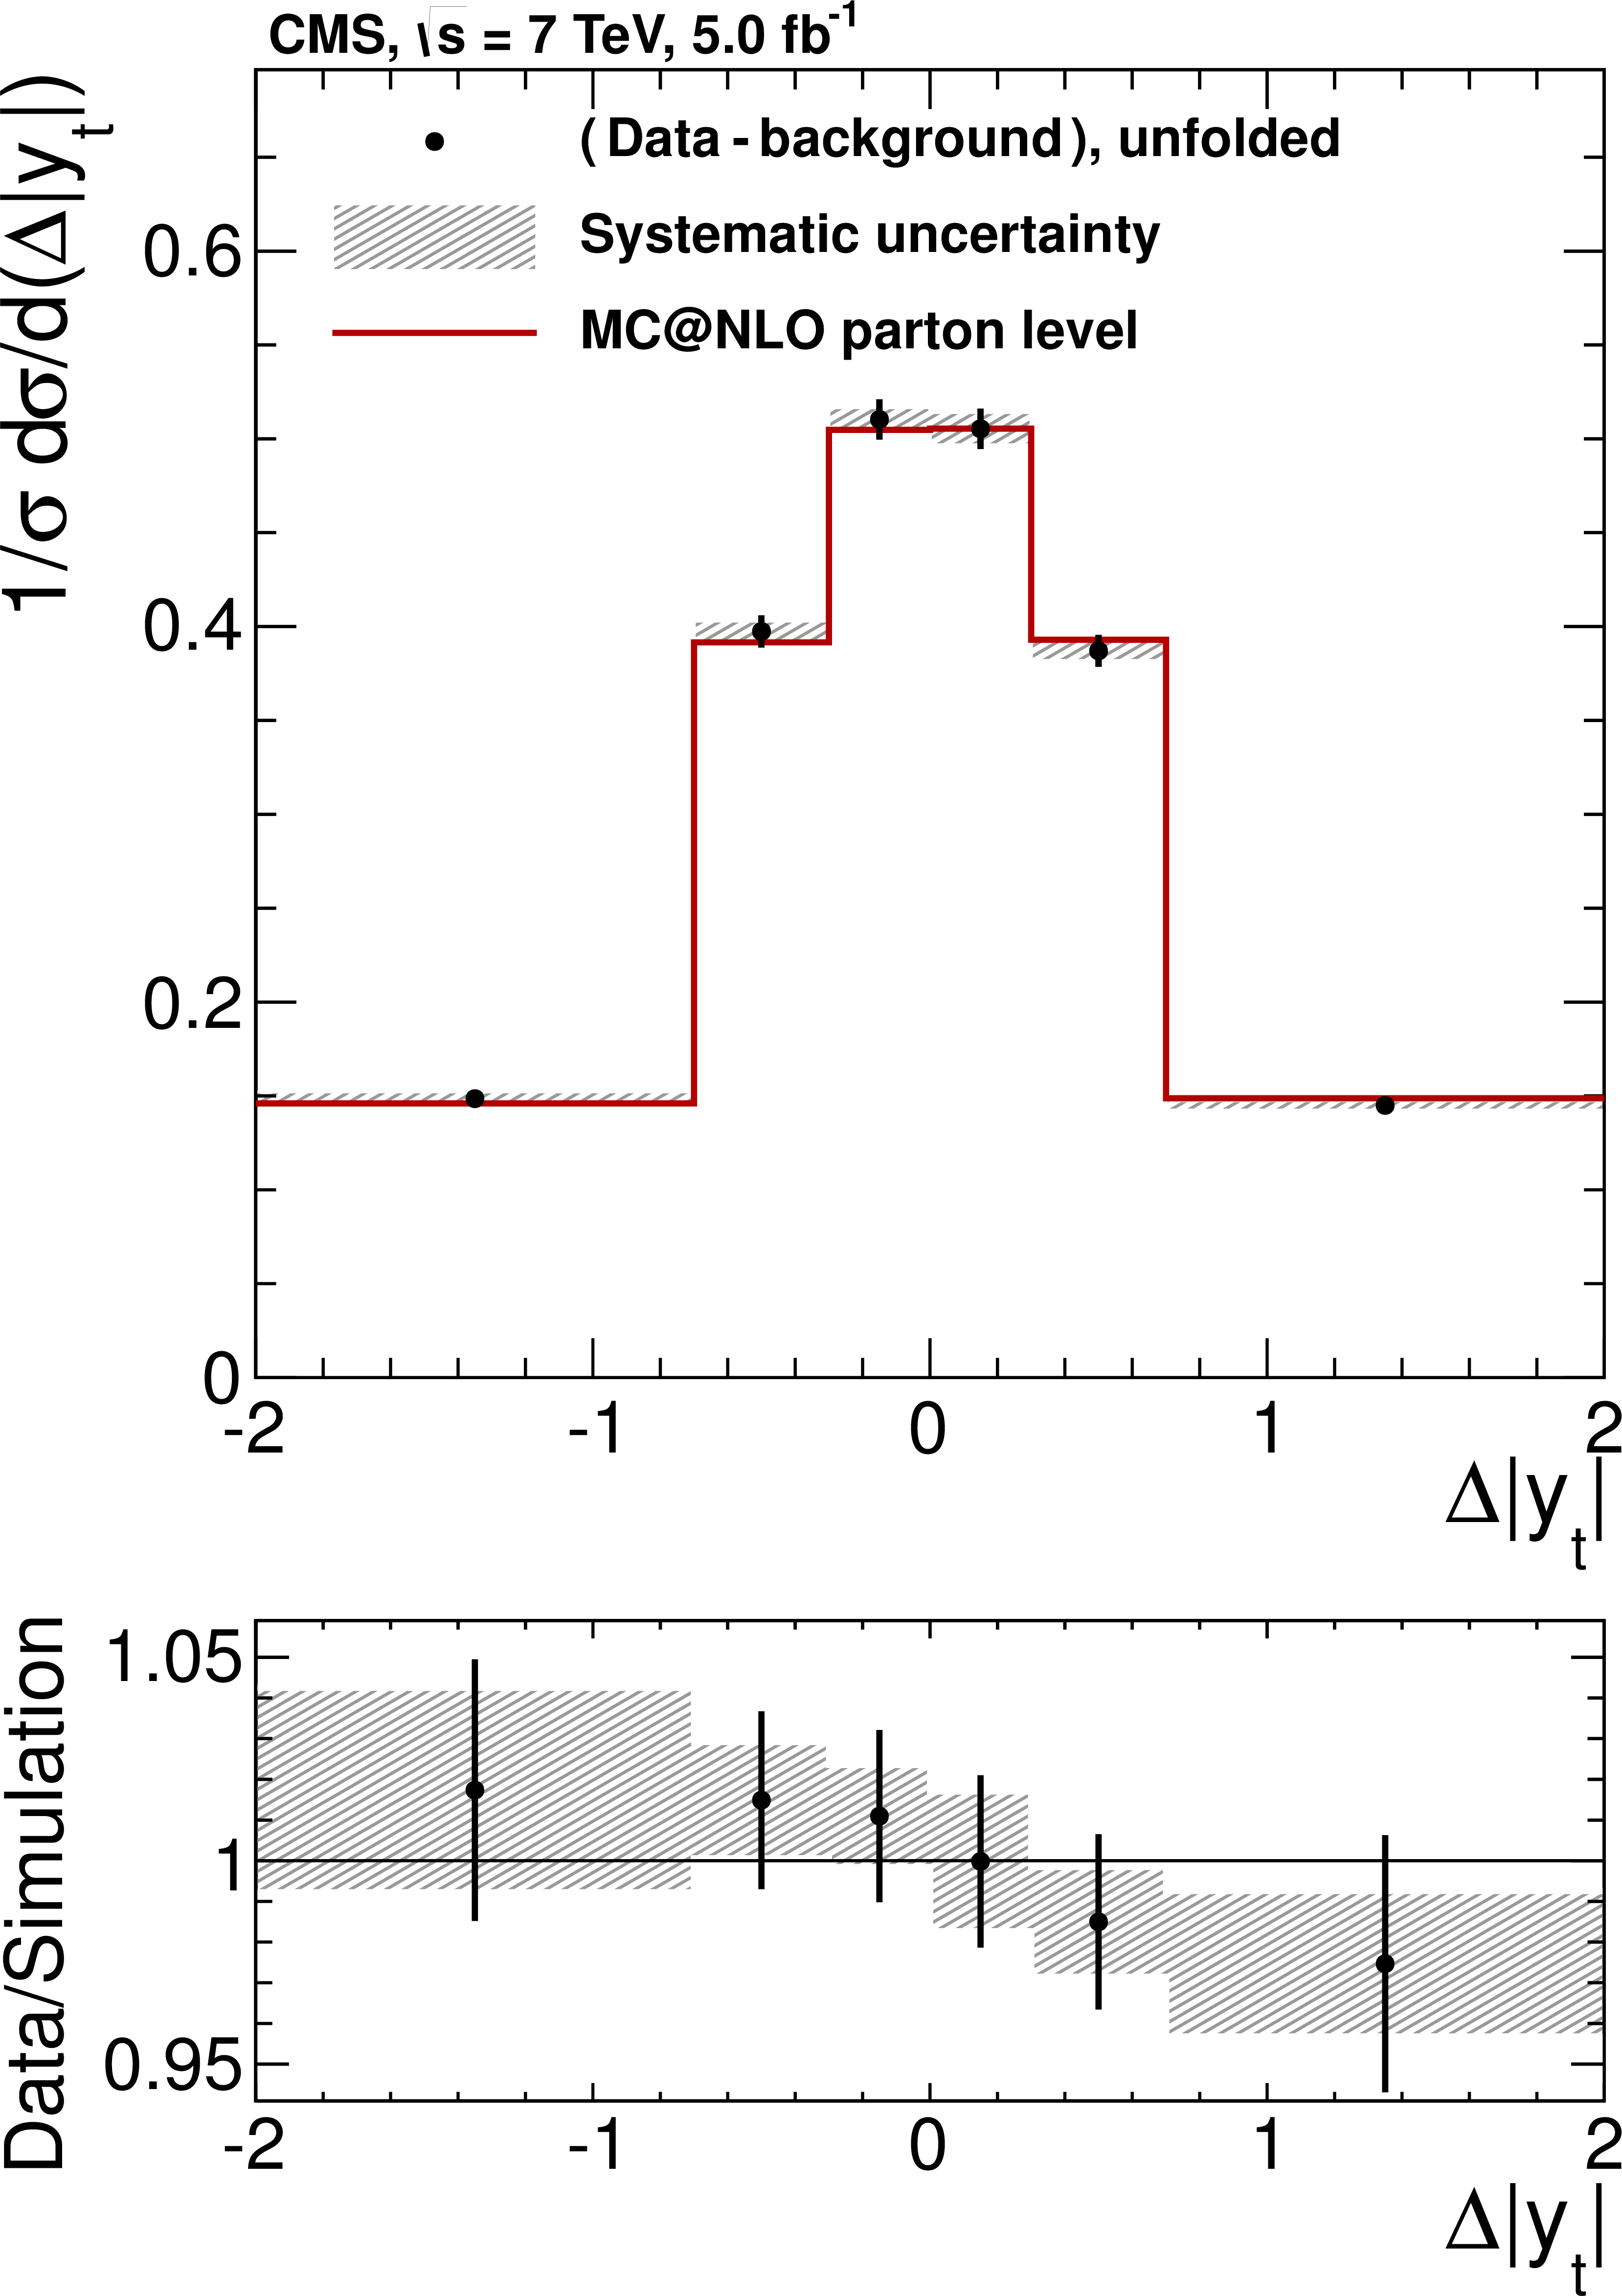
Figure 3-a:
|
png pdf |
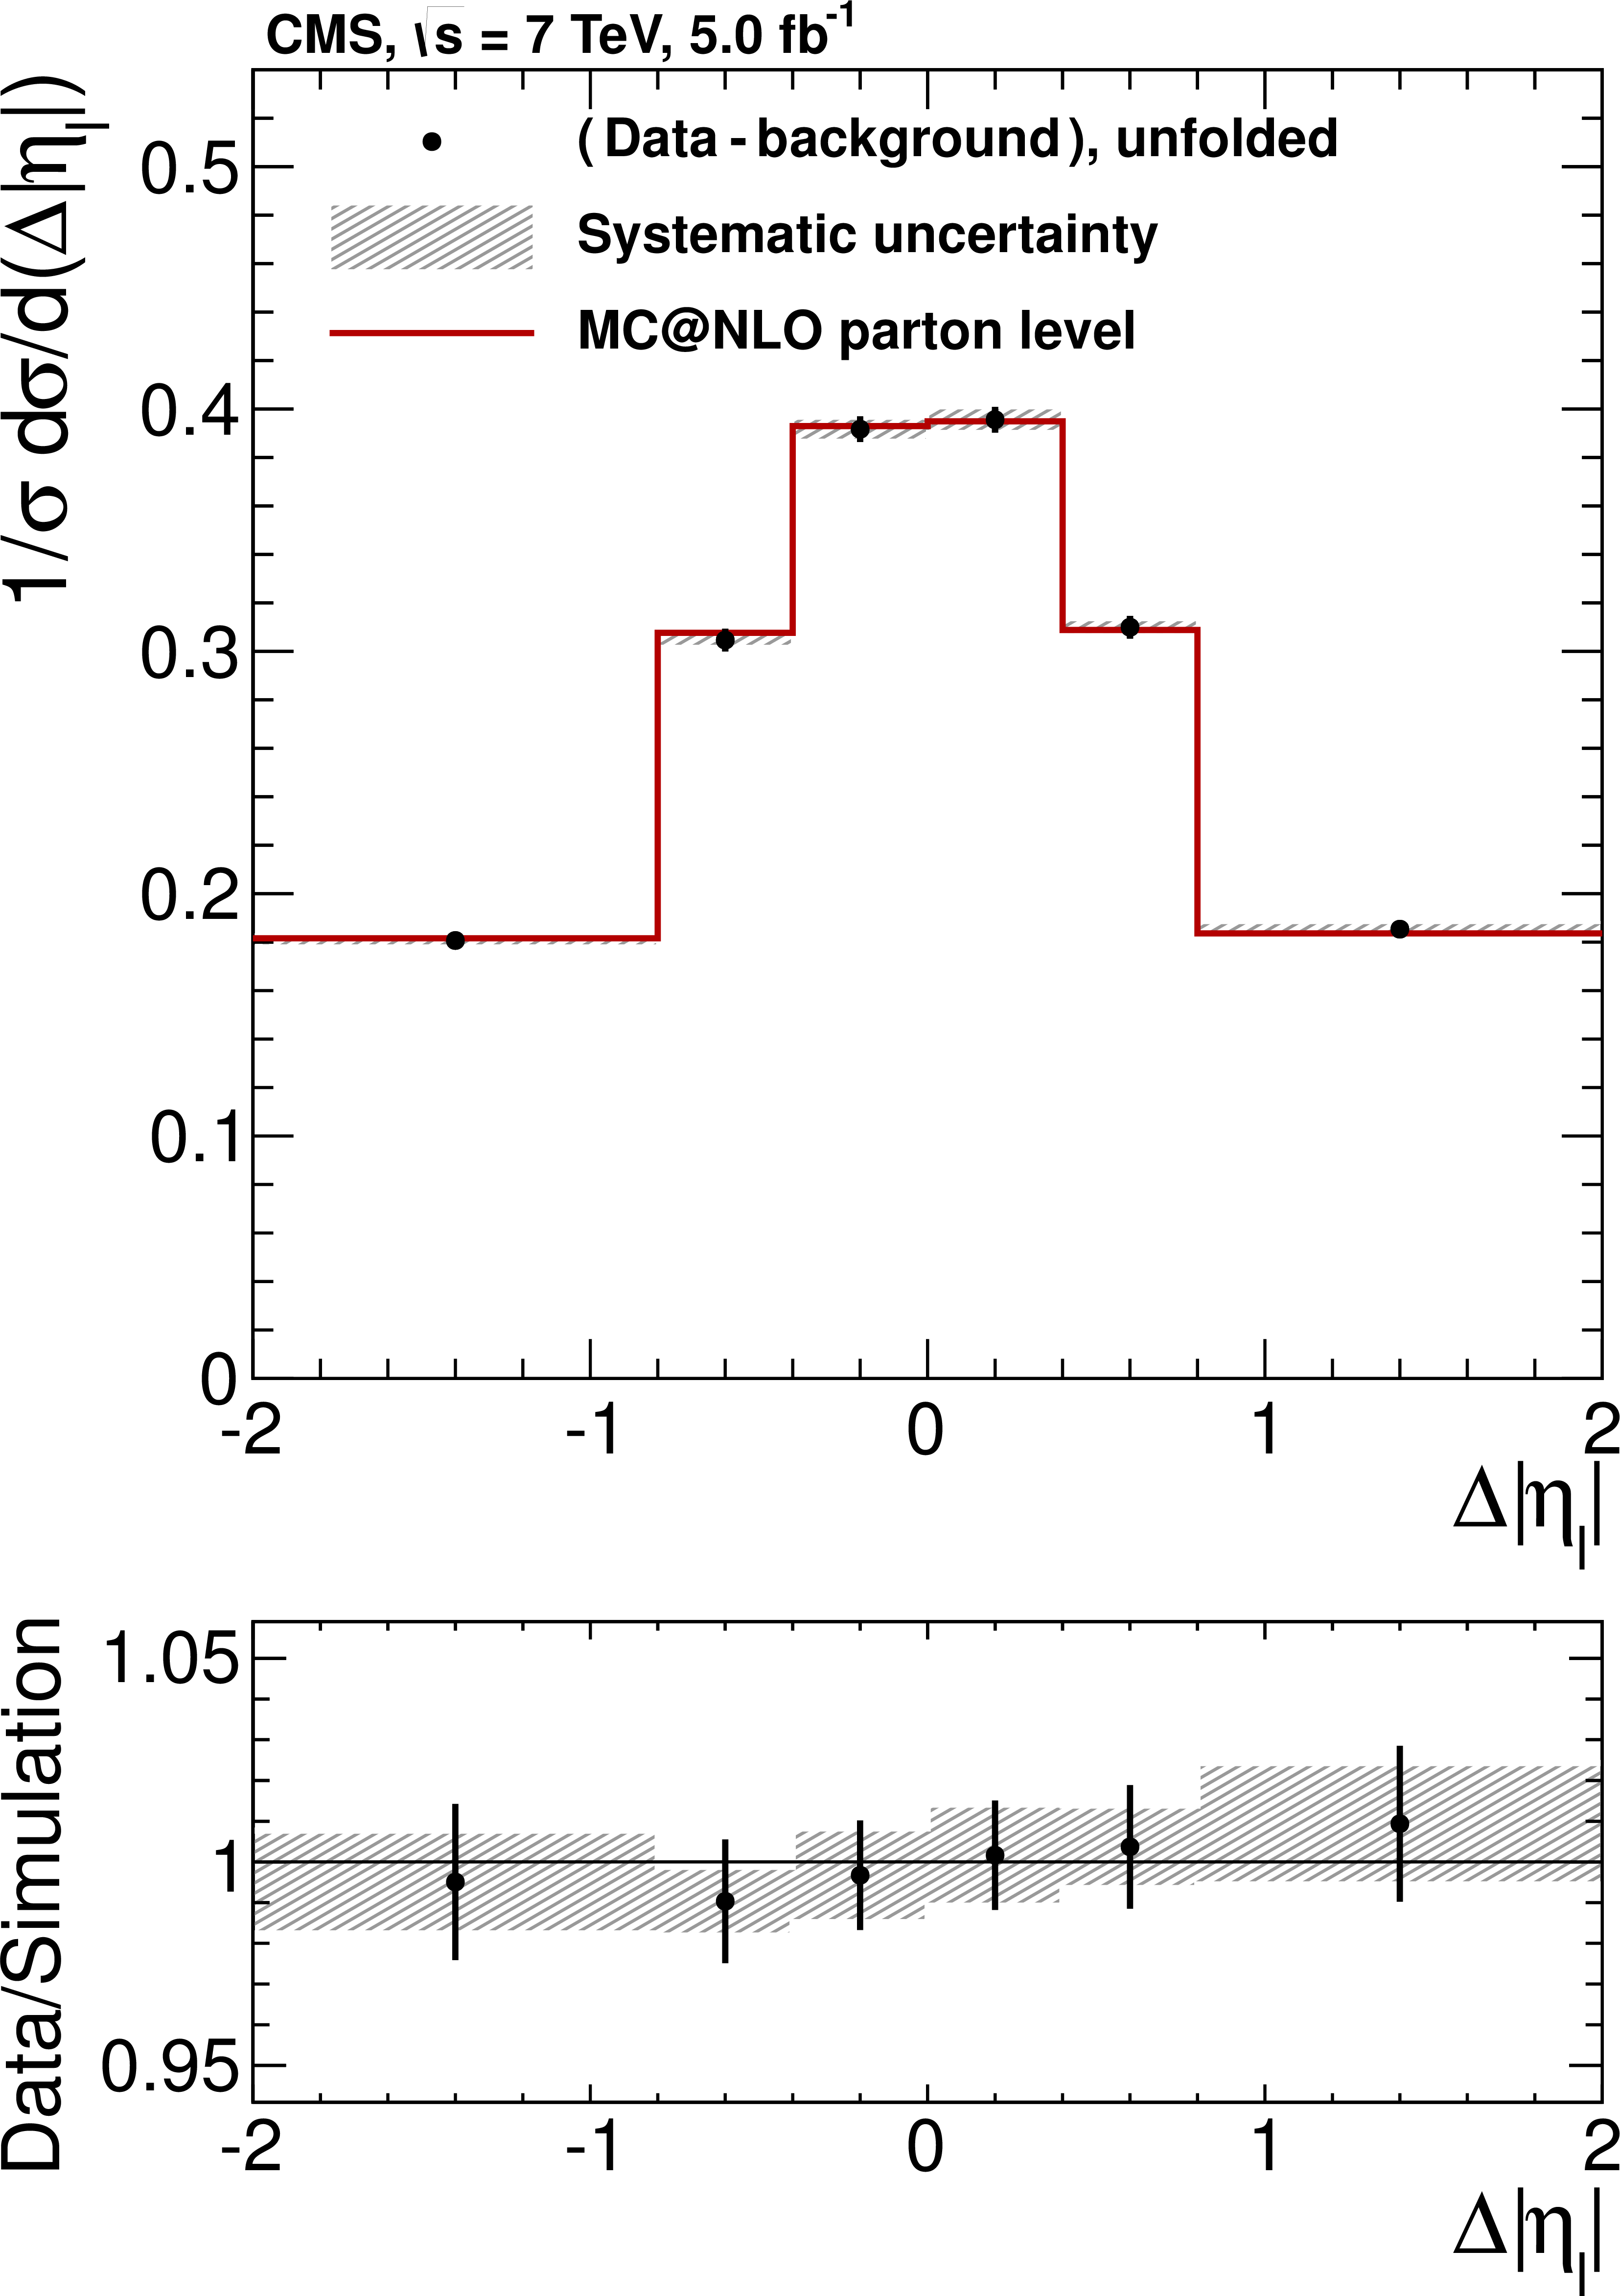
Figure 3-b:
|
png pdf |
Figure 4-a:
|
png pdf |
Figure 4-b:
|

png pdf |
Figure 5-a:
|

png pdf |
Figure 5-b:
|
png pdf |
Figure 5-c:
|
|
|
Compact Muon Solenoid LHC, CERN |
|

|

|

|

|

|