

Compact Muon Solenoid
LHC, CERN
| CMS-TOP-12-018 ; CERN-PH-EP-2014-048 | ||
| Measurement of jet multiplicity distributions in $ \mathrm { t\bar{t} } $ production in pp collisions at $\sqrt{s}$ = 7 TeV | ||
| CMS Collaboration | ||
| 12 April 2014 | ||
| Eur. Phys. J. C 74 (2014) 3014 [Erratum: Eur. Phys. J. C 75 (2015) 216] | ||
| Abstract: The normalised differential top quark-antiquark production cross section is measured as a function of the jet multiplicity in proton-proton collisions at a centre-of-mass energy of 7 TeV at the LHC with the CMS detector. The measurement is performed in both the dilepton and lepton+jets decay channels using data corresponding to an integrated luminosity of 5.0 inverse-femtobarns. Using a procedure to associate jets to decay products of the top quarks, the differential cross section of the $\mathrm{ t\bar{t} }$ production is determined as a function of the additional jet multiplicity in the lepton+jets channel. Furthermore, the fraction of events with no additional jets is measured in the dilepton channel, as a function of the threshold on the jet transverse momentum.The measurements are compared with predictions from perturbative quantum chromodynamics and no significant deviations are observed. | ||
| Links: e-print arXiv:1404.3171 [hep-ex] (PDF) ; CDS record ; inSPIRE record ; Public twiki page ; HepData record ; CADI line (restricted) ; | ||
| Figures | |
png pdf |
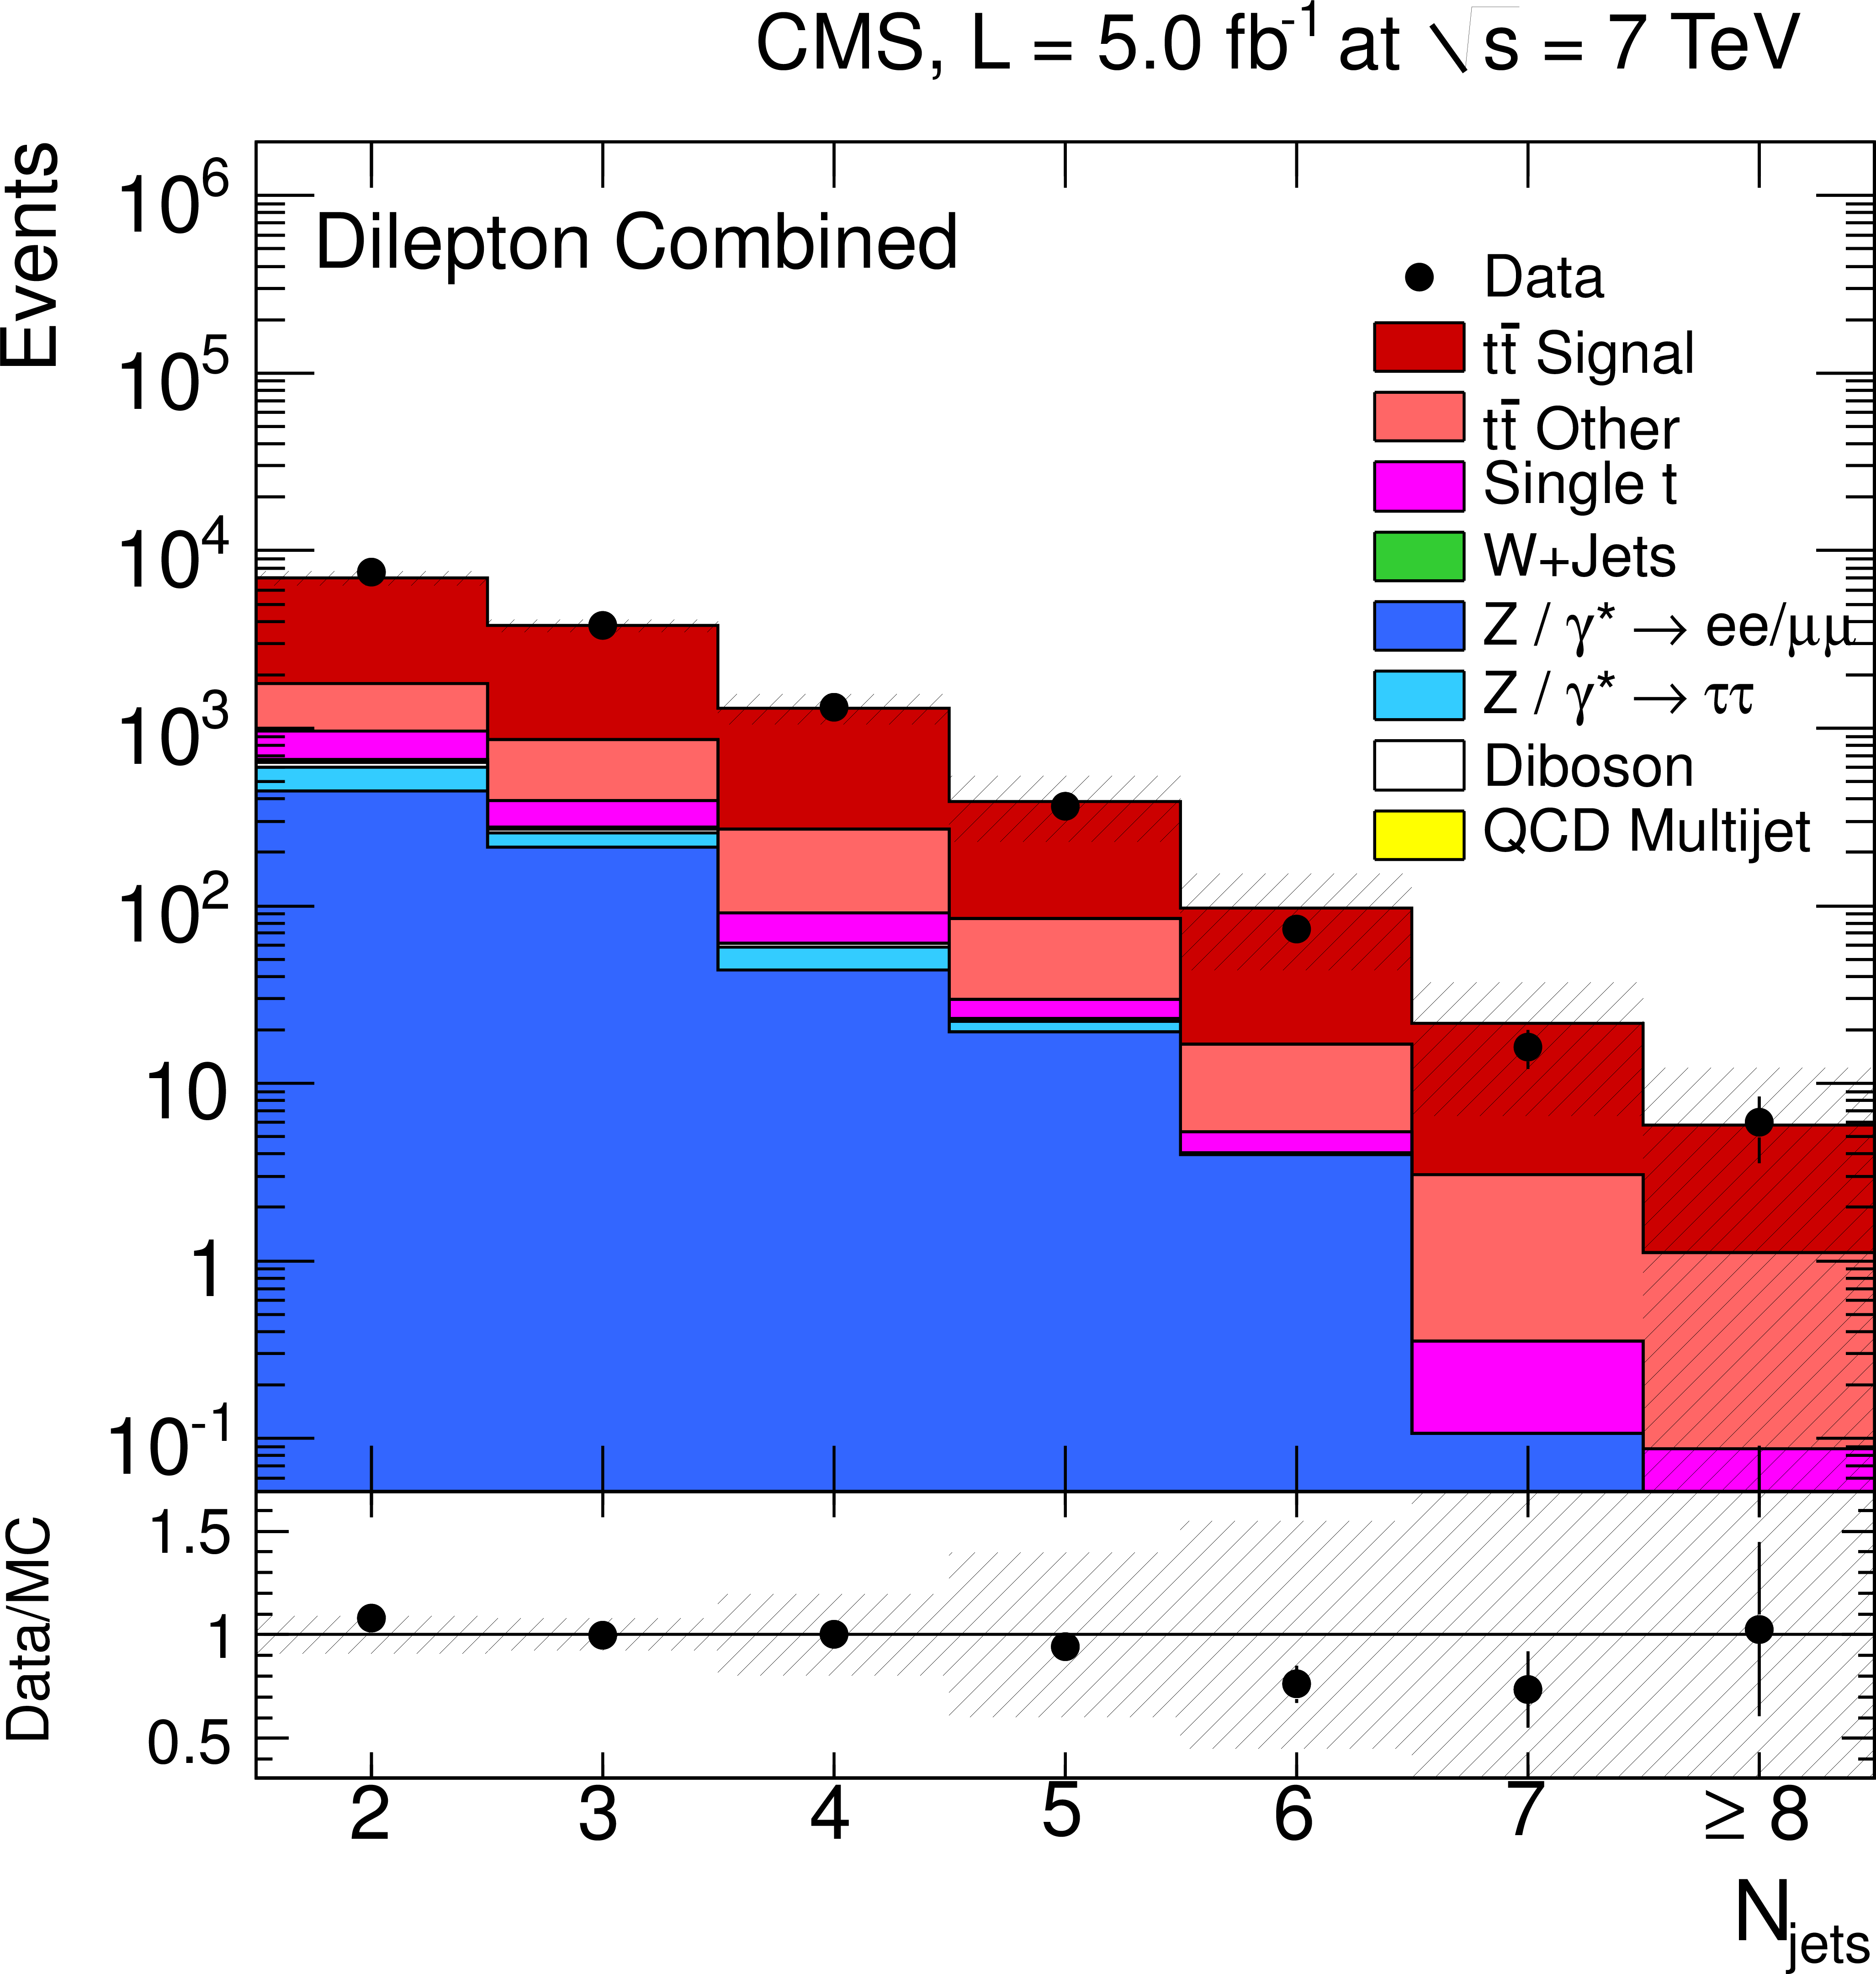
Figure 1-a:
Number of reconstructed jets (a, c) and jet $ {p_{\mathrm {T}}} $ spectrum (b, d) after event selection in the dilepton channel for jets with $ {p_{\mathrm {T}}} >$ 30 GeV (a, b), and in the $\ell $+jets channel for jets with $ {p_{\mathrm {T}}} >$ 35 GeV (c, d). The hatched band represents the combined effect of all sources of systematic uncertainty. |
png pdf |
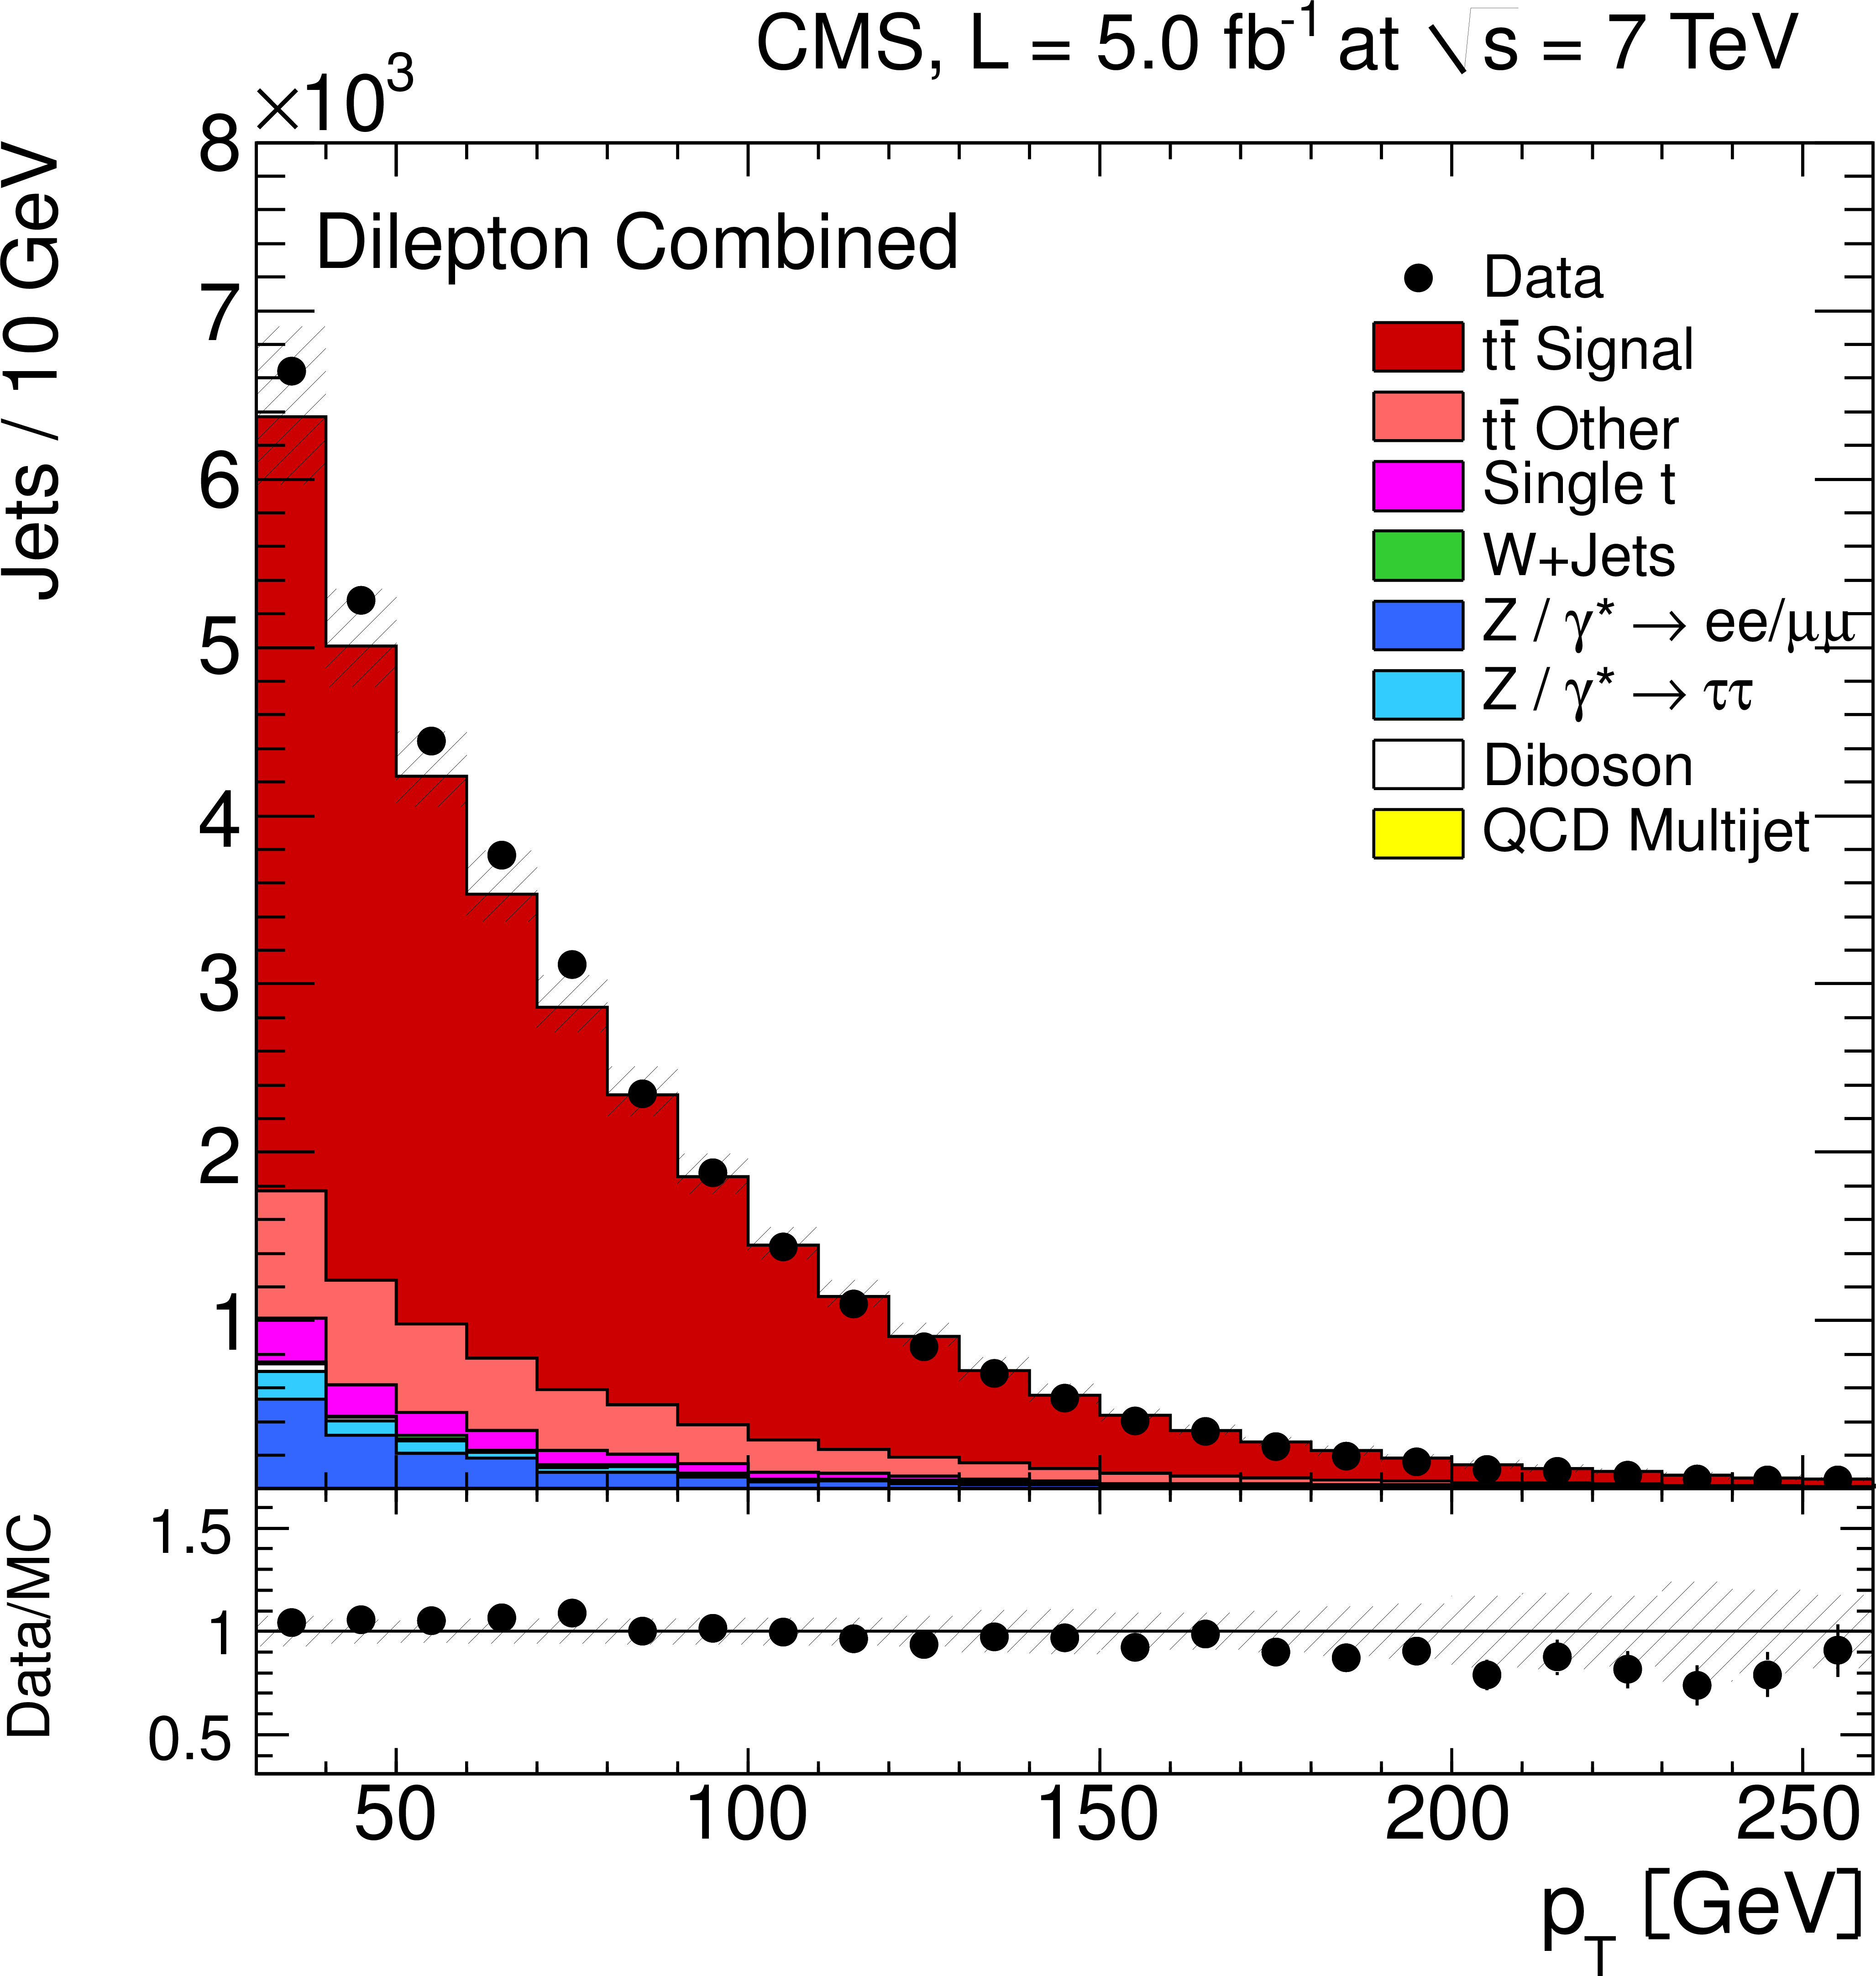
Figure 1-b:
Number of reconstructed jets (a, c) and jet $ {p_{\mathrm {T}}} $ spectrum (b, d) after event selection in the dilepton channel for jets with $ {p_{\mathrm {T}}} >$ 30 GeV (a, b), and in the $\ell $+jets channel for jets with $ {p_{\mathrm {T}}} >$ 35 GeV (c, d). The hatched band represents the combined effect of all sources of systematic uncertainty. |
png pdf |
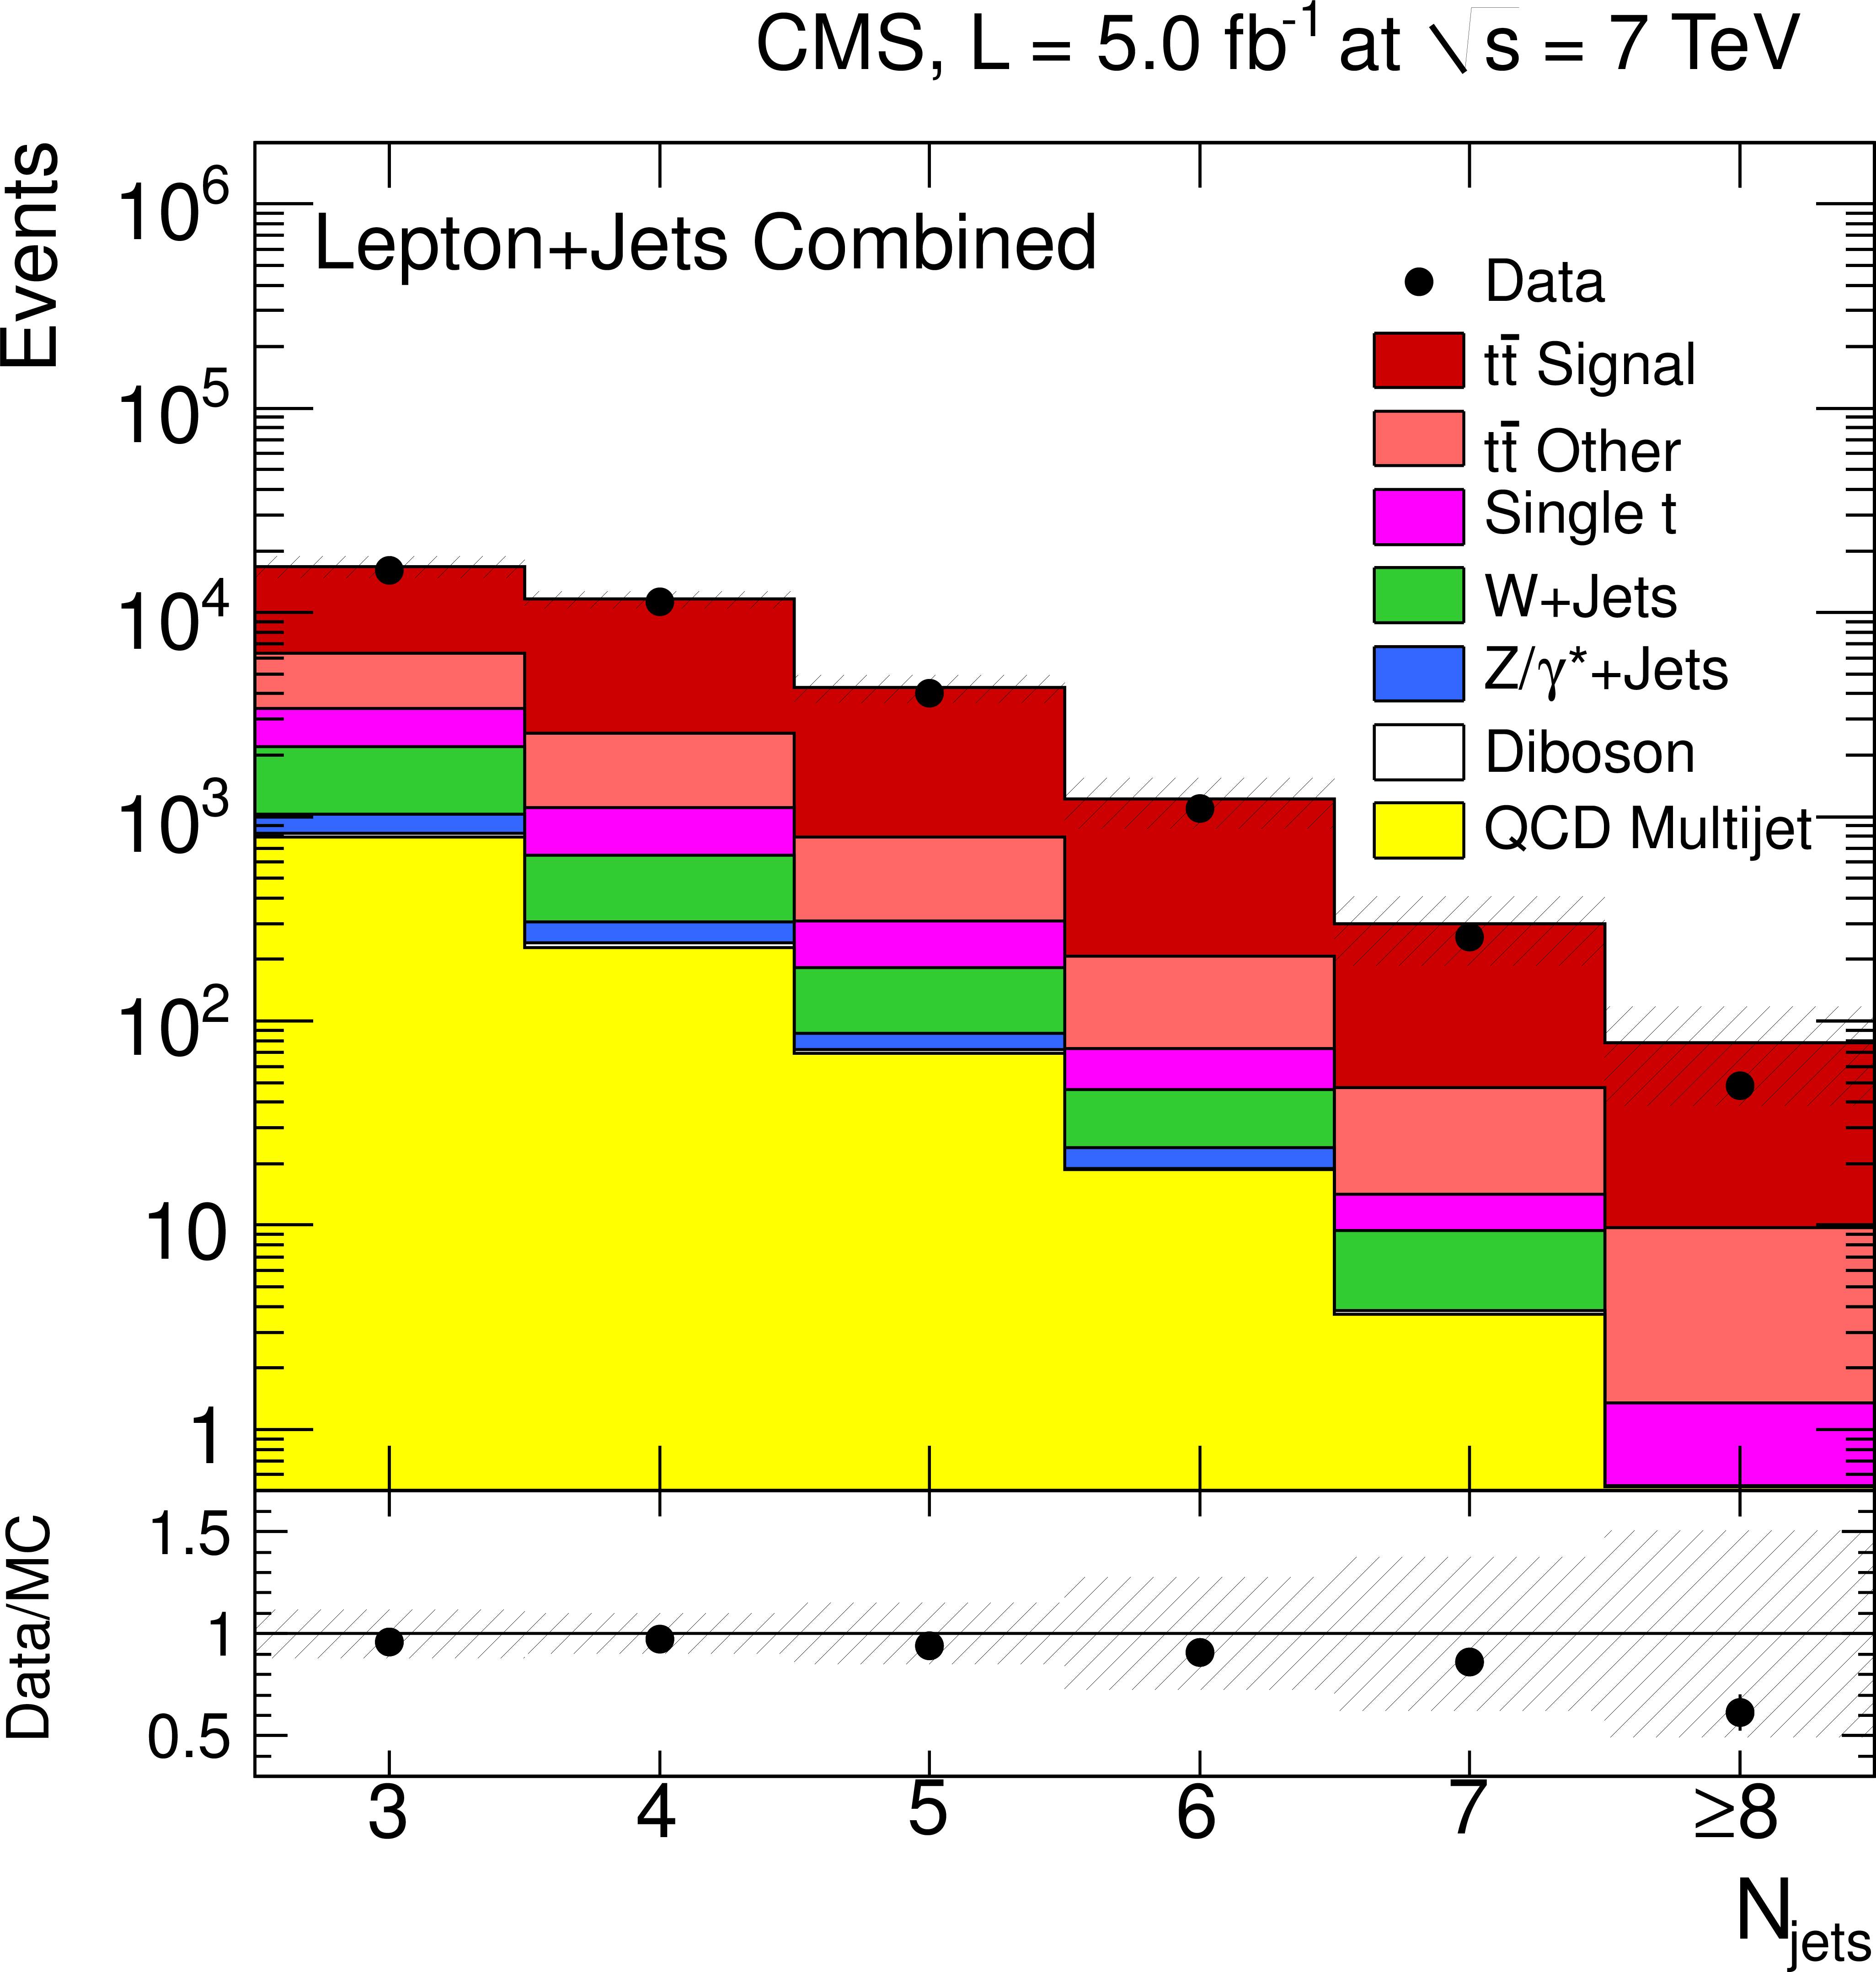
Figure 1-c:
Number of reconstructed jets (a, c) and jet $ {p_{\mathrm {T}}} $ spectrum (b, d) after event selection in the dilepton channel for jets with $ {p_{\mathrm {T}}} >$ 30 GeV (a, b), and in the $\ell $+jets channel for jets with $ {p_{\mathrm {T}}} >$ 35 GeV (c, d). The hatched band represents the combined effect of all sources of systematic uncertainty. |
png pdf |
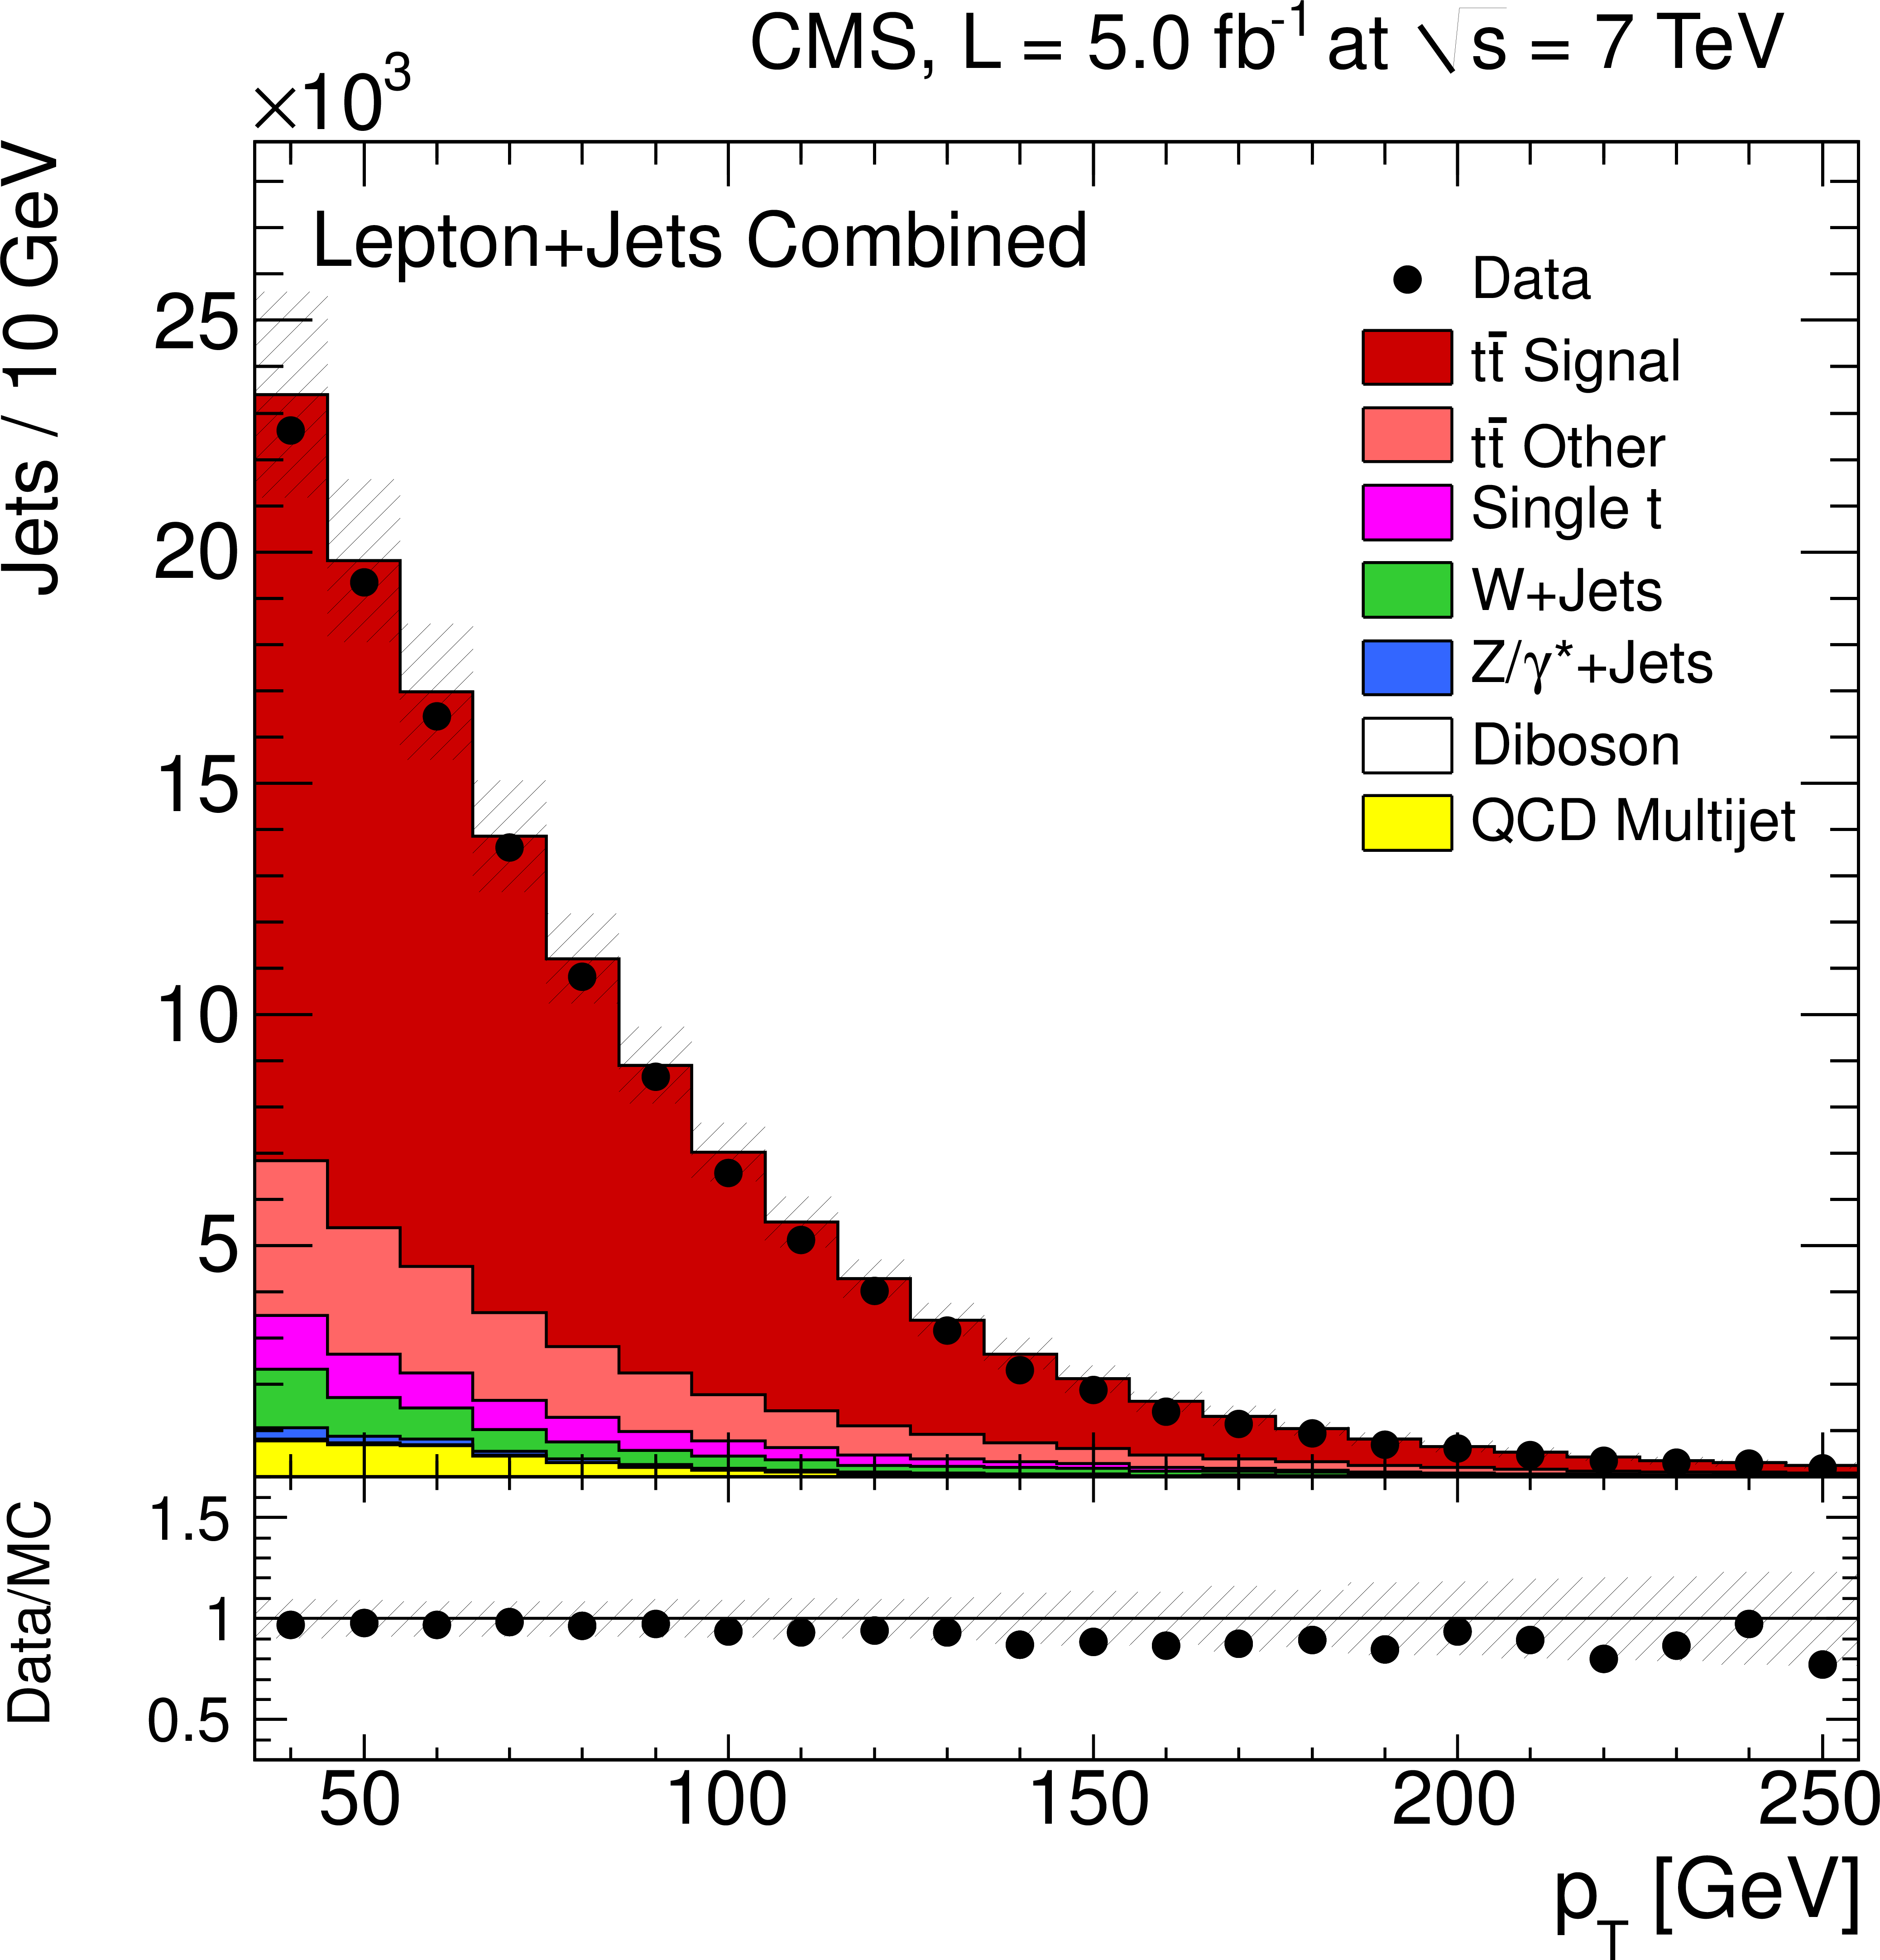
Figure 1-d:
Number of reconstructed jets (a, c) and jet $ {p_{\mathrm {T}}} $ spectrum (b, d) after event selection in the dilepton channel for jets with $ {p_{\mathrm {T}}} >$ 30 GeV (a, b), and in the $\ell $+jets channel for jets with $ {p_{\mathrm {T}}} >$ 35 GeV (c, d). The hatched band represents the combined effect of all sources of systematic uncertainty. |

png pdf |
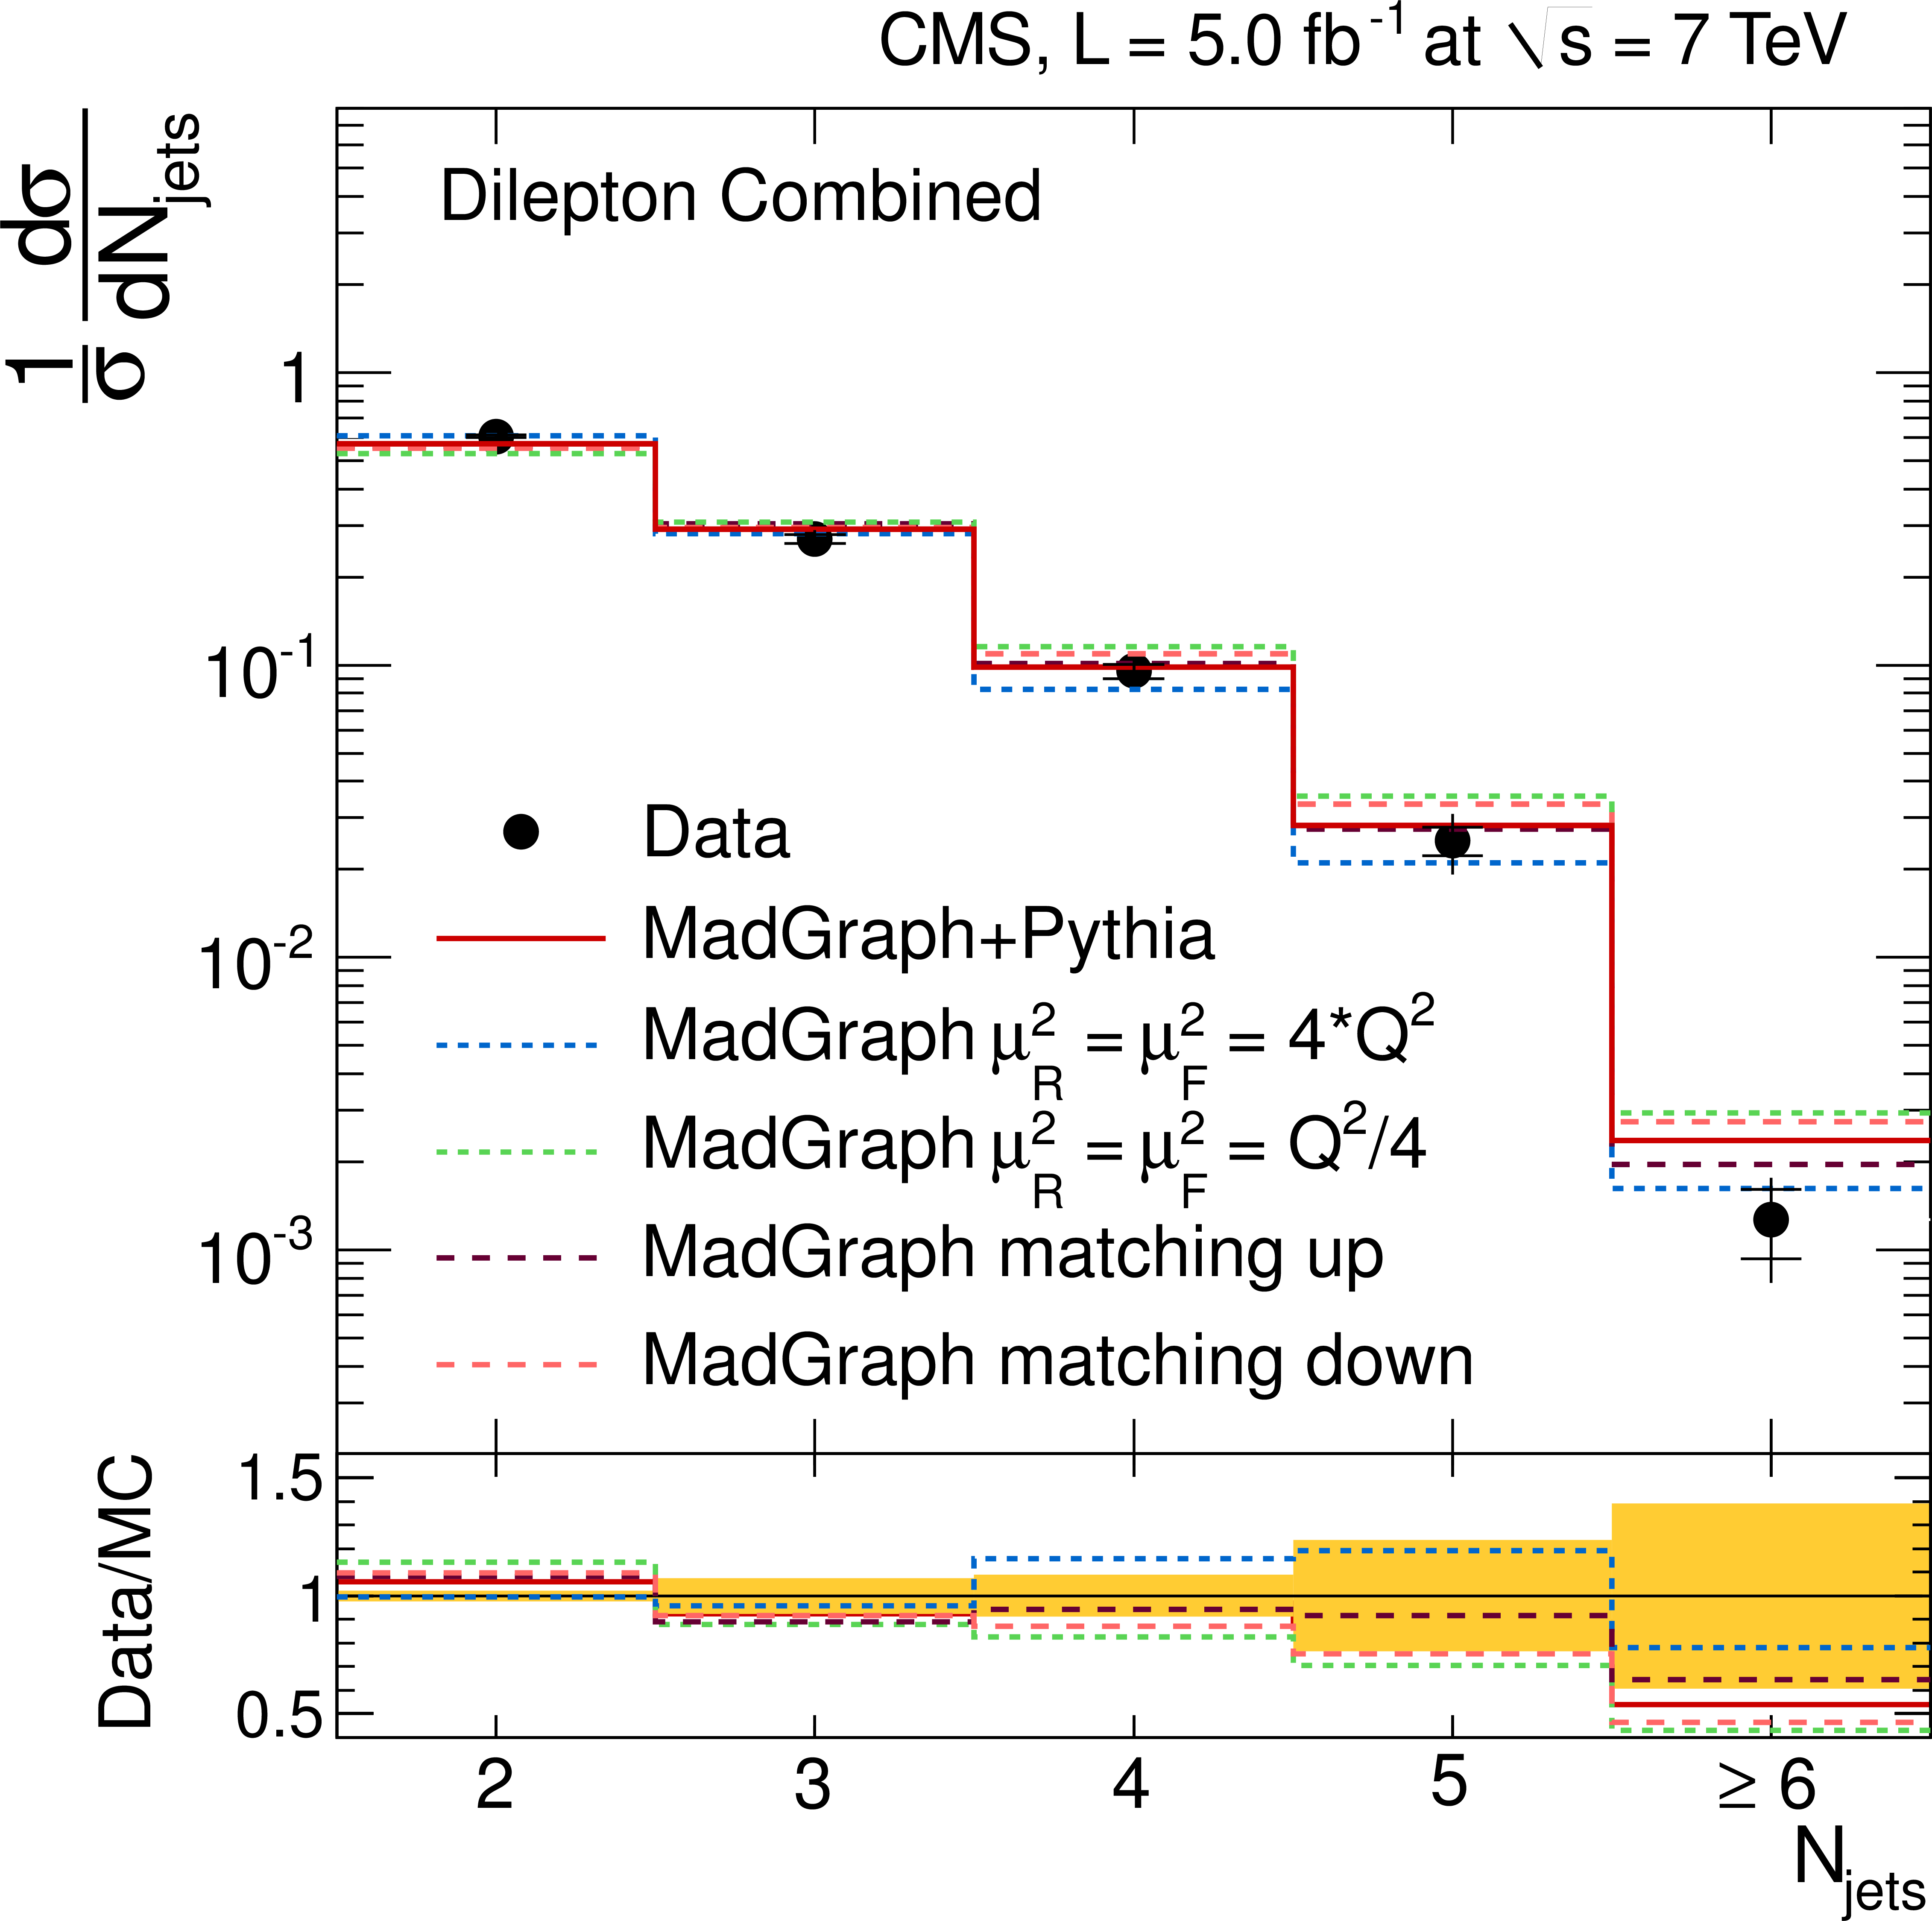
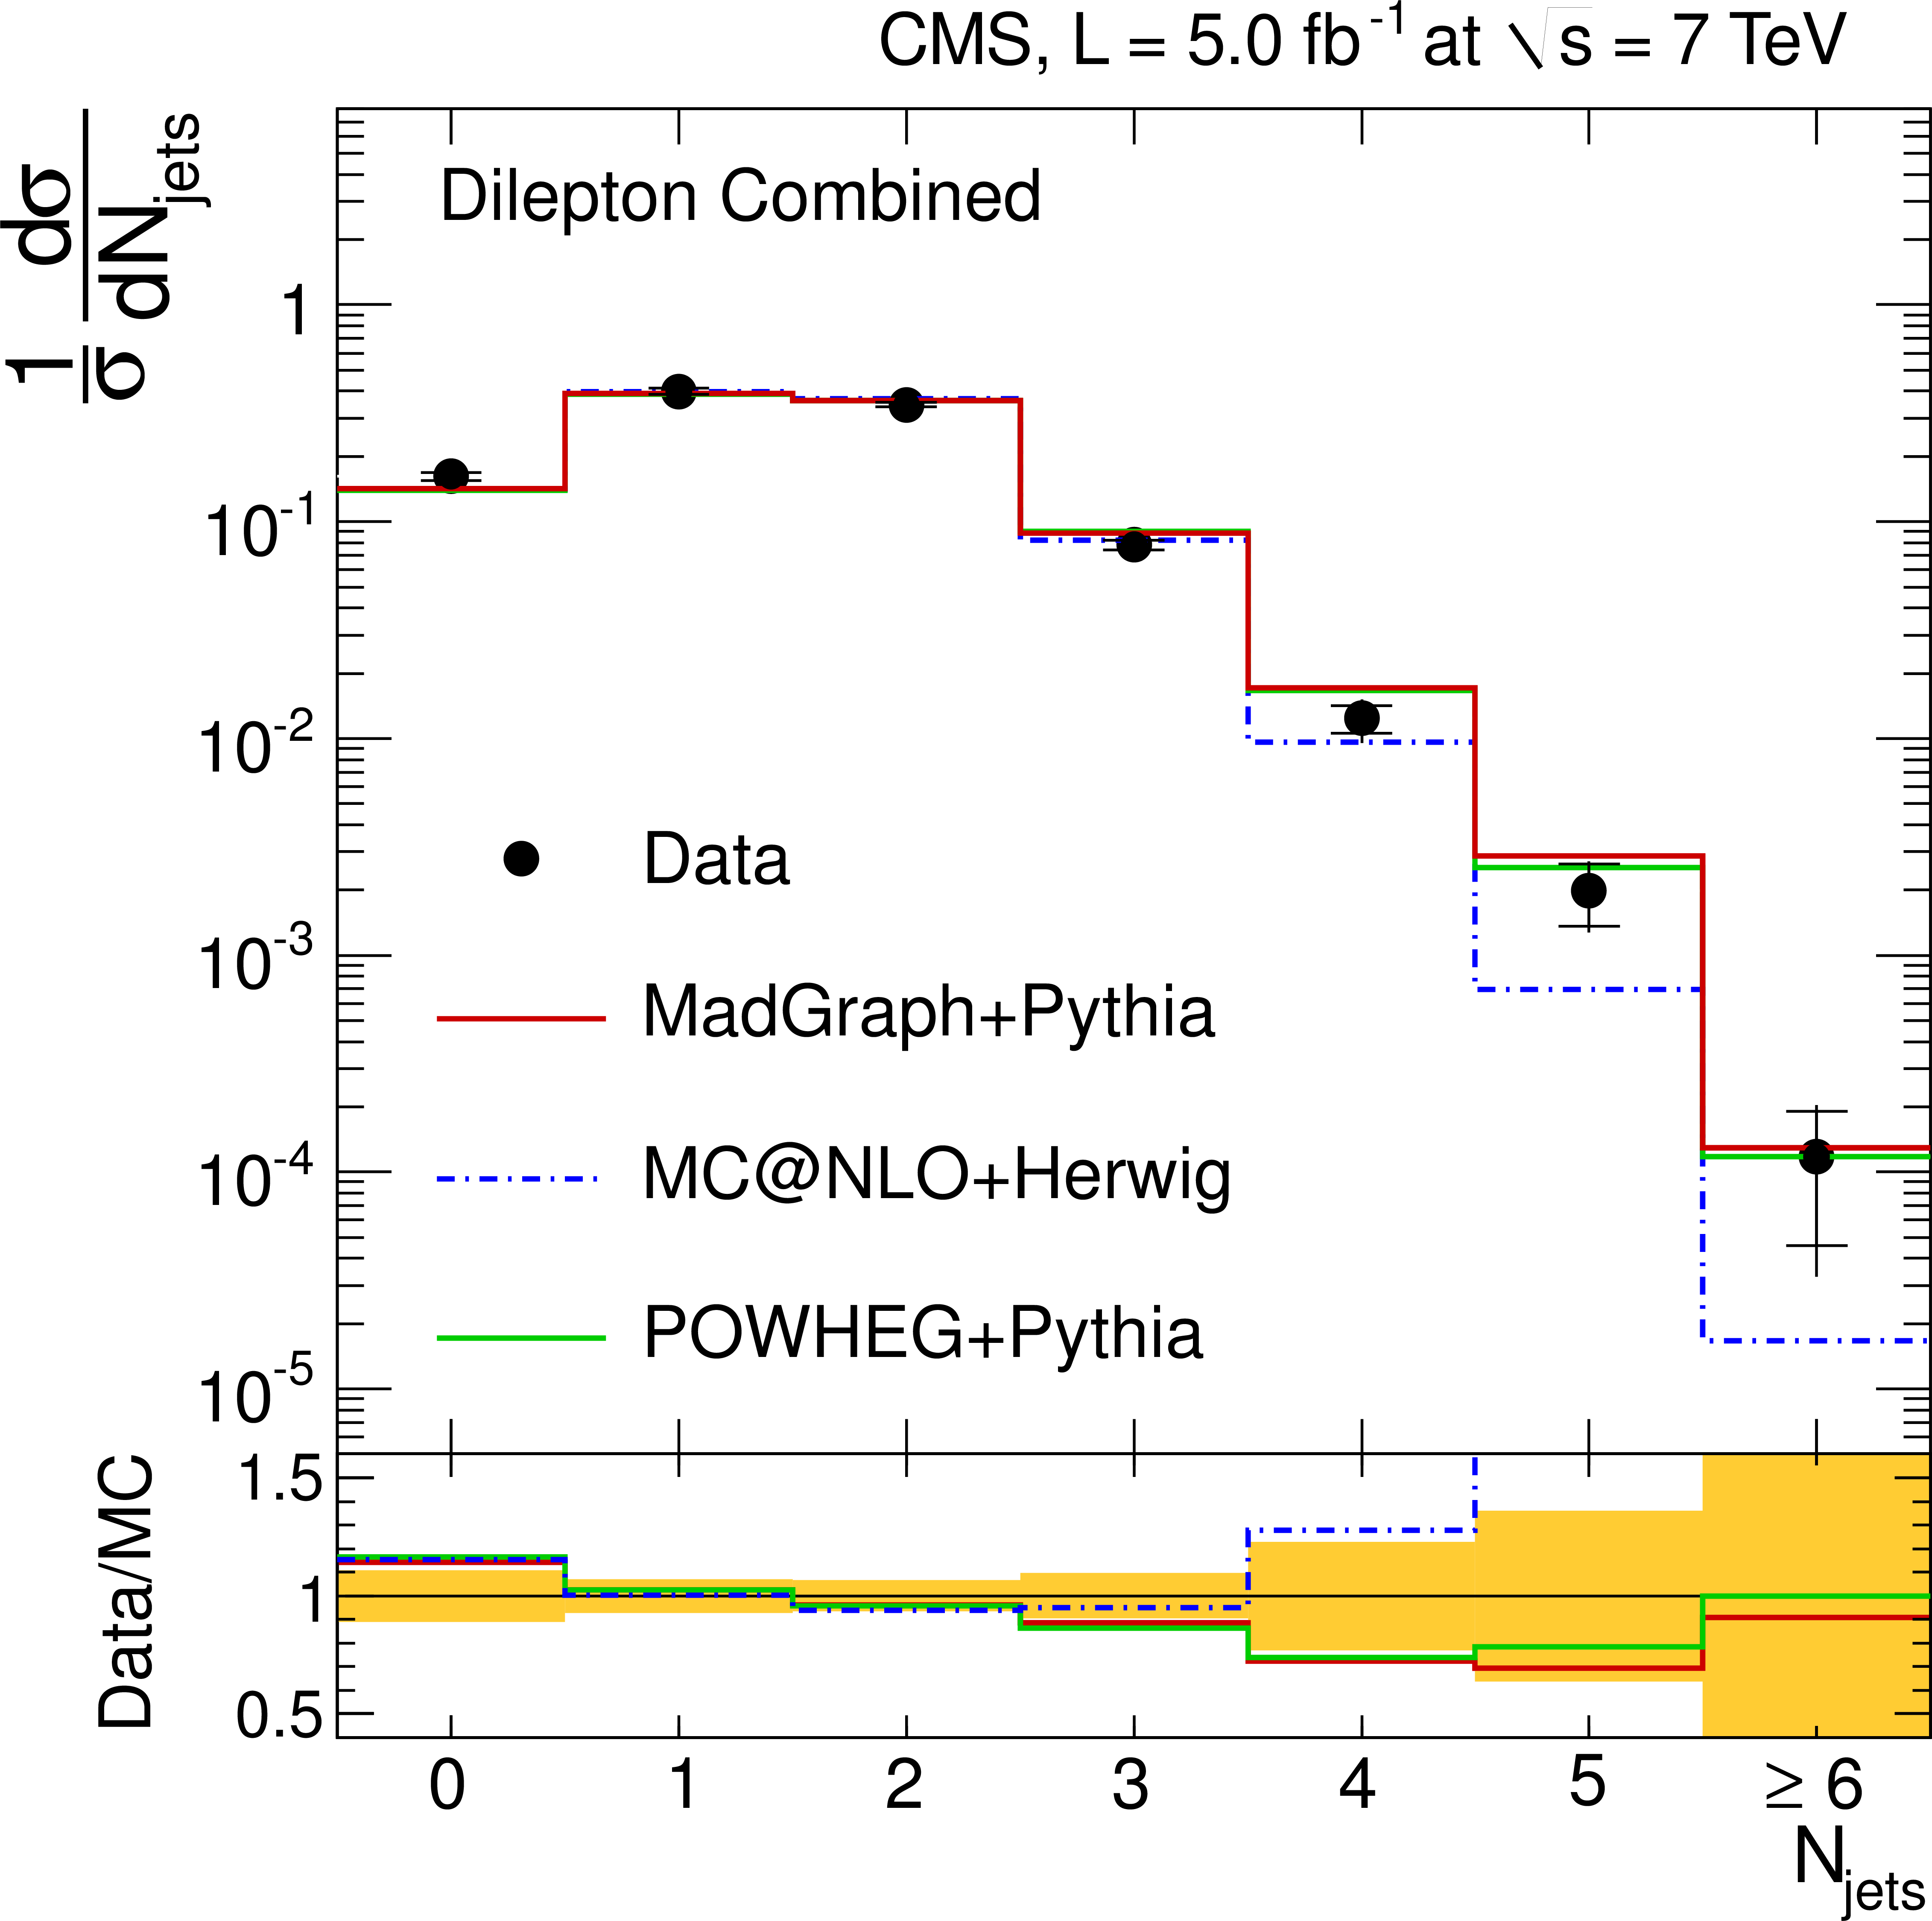
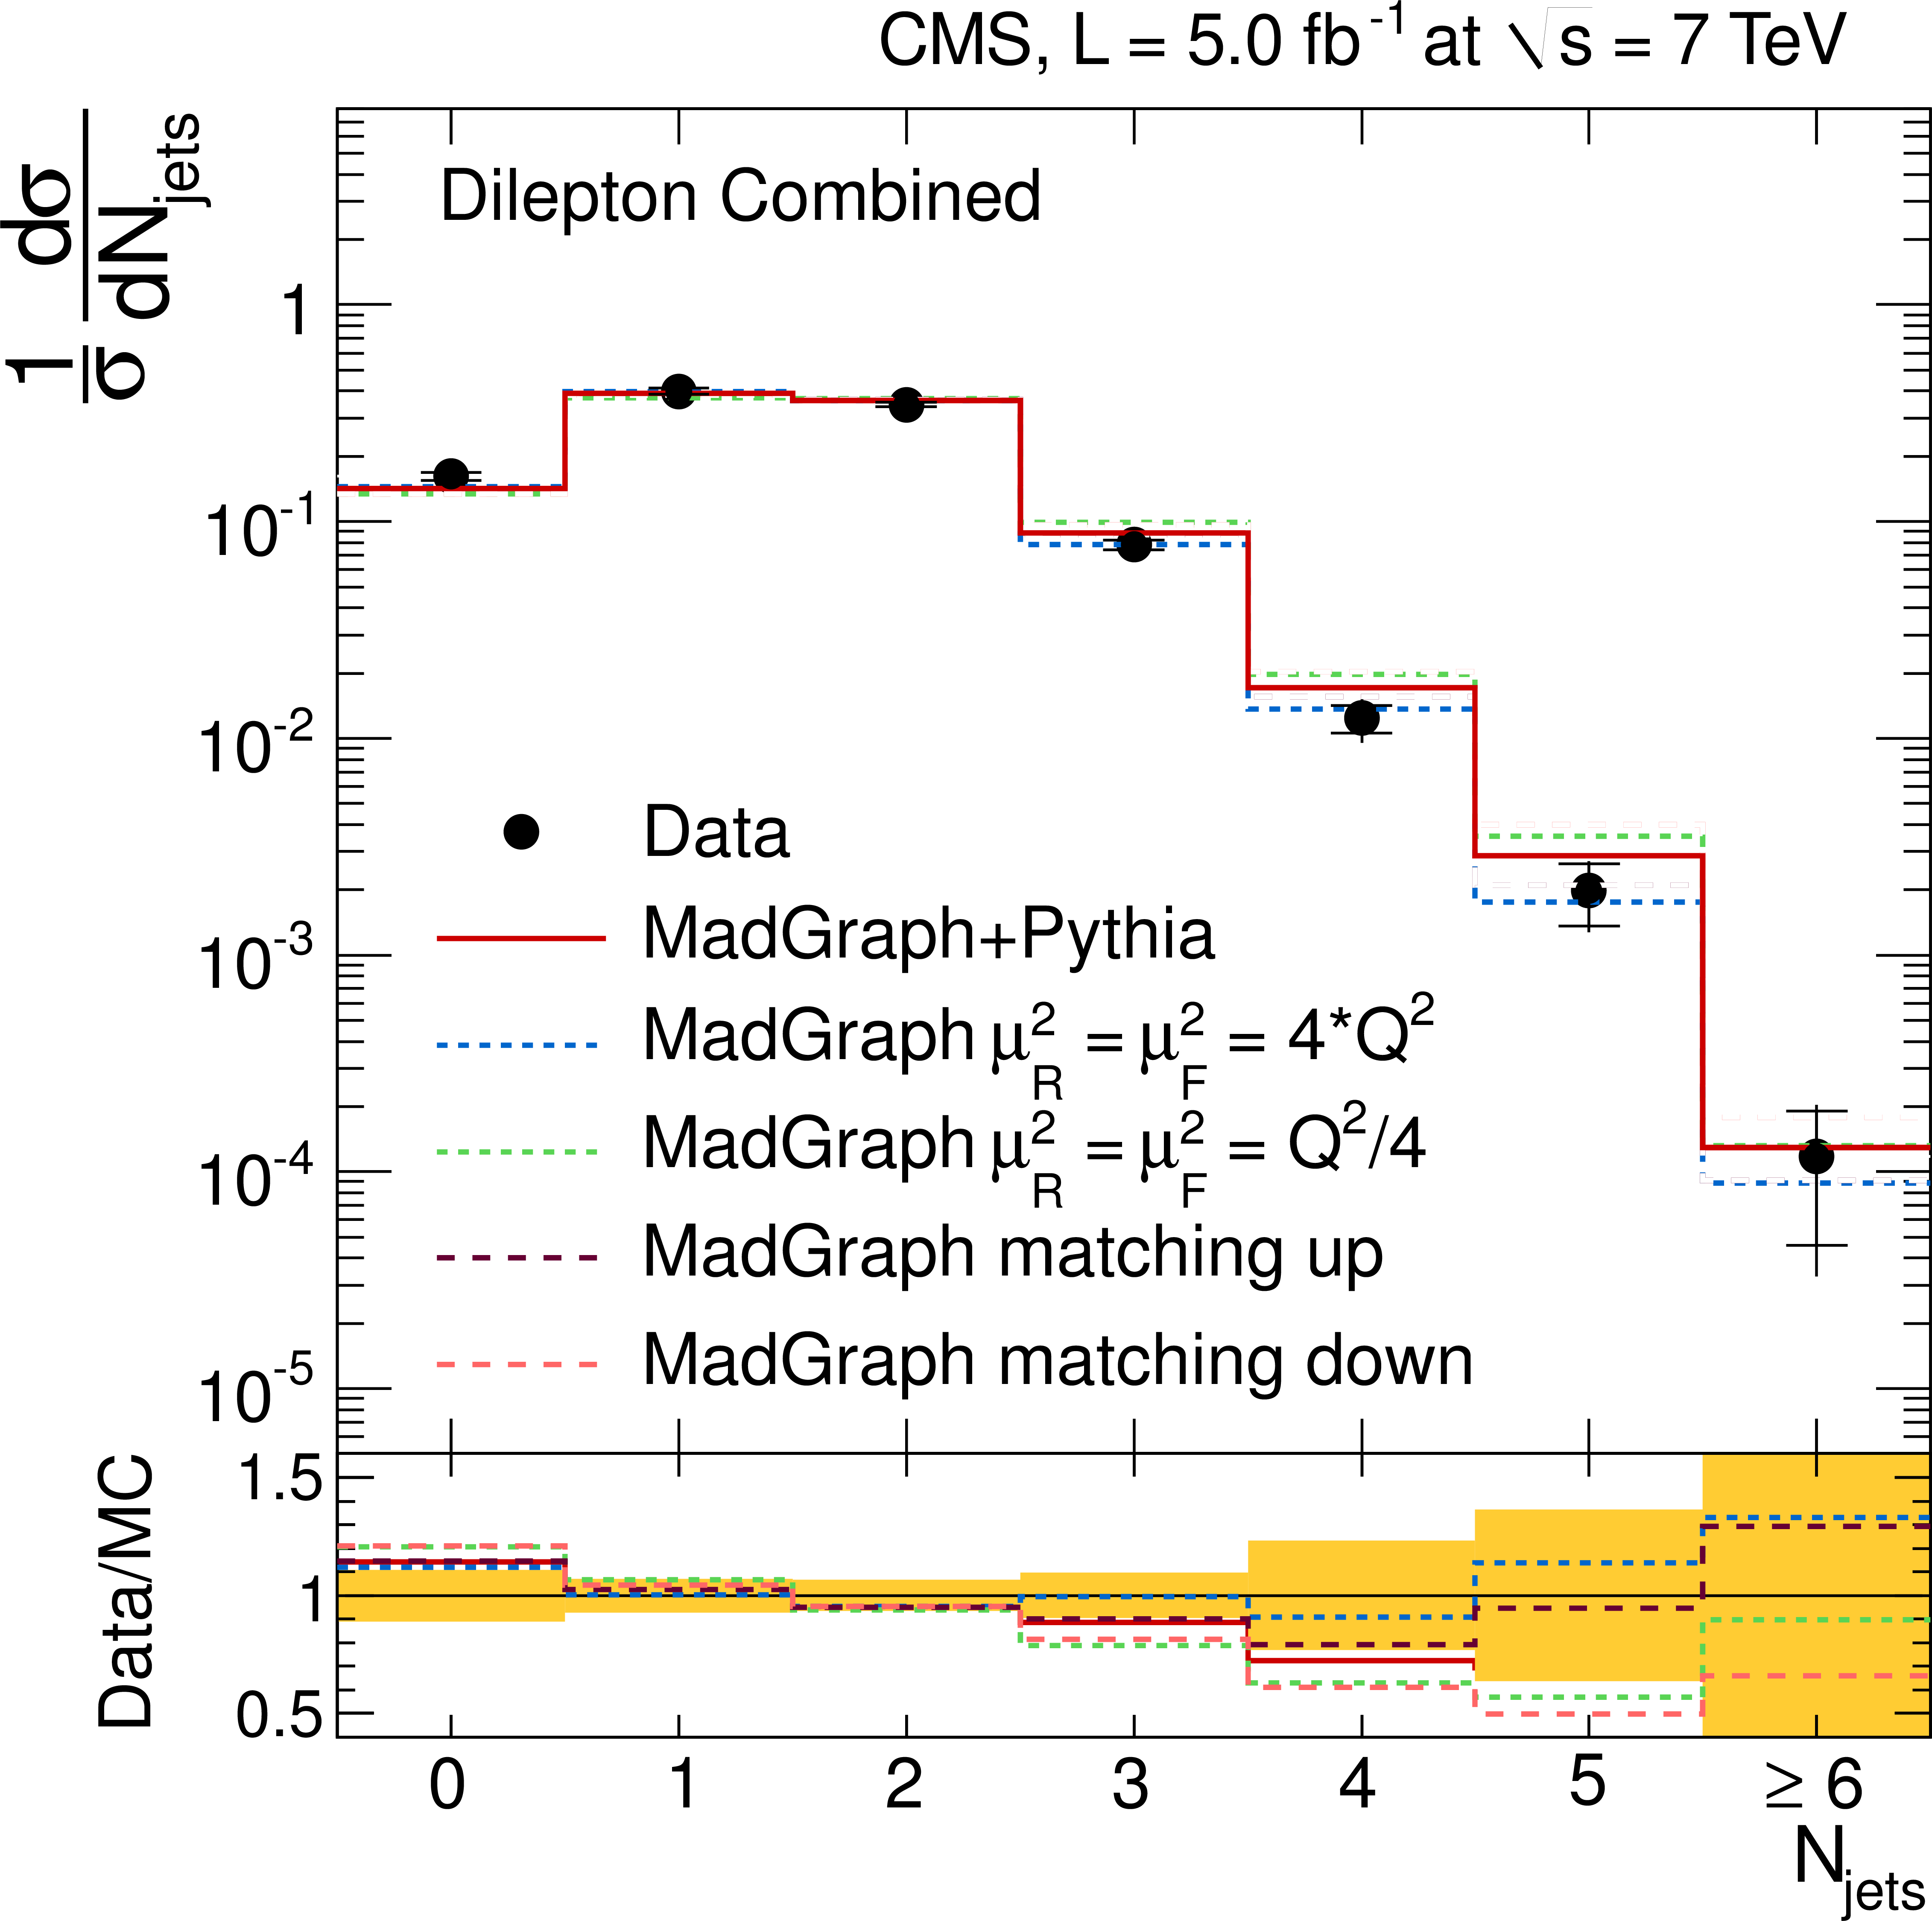
Figure 2-a:
Normalised differential $ {\mathrm {t}\overline {\mathrm {t}}} $ production cross section as a function of the jet multiplicity for jets with $ {p_{\mathrm {T}}} >$ 30 GeV (a,b) and $ {p_{\mathrm {T}}} >$ 60 GeV (c,d) in the dilepton channel. The measurements are compared to predictions from MadGraph+PYTHIA, POWHEG+PYTHIA, and MCatNLO+HERWIG (a,c), as well as from \textsc {MadGraph} with varied renormalisation and factorisation scales, and jet-parton matching threshold (b,d). The inner (outer) error bars indicate the statistical (combined statistical and systematic) uncertainty. The shaded band corresponds to the combined statistical and systematic uncertainty. |
png pdf |
Figure 2-b:
Normalised differential $ {\mathrm {t}\overline {\mathrm {t}}} $ production cross section as a function of the jet multiplicity for jets with $ {p_{\mathrm {T}}} >$ 30 GeV (a,b) and $ {p_{\mathrm {T}}} >$ 60 GeV (c,d) in the dilepton channel. The measurements are compared to predictions from MadGraph+PYTHIA, POWHEG+PYTHIA, and MCatNLO+HERWIG (a,c), as well as from \textsc {MadGraph} with varied renormalisation and factorisation scales, and jet-parton matching threshold (b,d). The inner (outer) error bars indicate the statistical (combined statistical and systematic) uncertainty. The shaded band corresponds to the combined statistical and systematic uncertainty. |
png pdf |
Figure 2-c:
Normalised differential $ {\mathrm {t}\overline {\mathrm {t}}} $ production cross section as a function of the jet multiplicity for jets with $ {p_{\mathrm {T}}} >$ 30 GeV (a,b) and $ {p_{\mathrm {T}}} >$ 60 GeV (c,d) in the dilepton channel. The measurements are compared to predictions from MadGraph+PYTHIA, POWHEG+PYTHIA, and MCatNLO+HERWIG (a,c), as well as from \textsc {MadGraph} with varied renormalisation and factorisation scales, and jet-parton matching threshold (b,d). The inner (outer) error bars indicate the statistical (combined statistical and systematic) uncertainty. The shaded band corresponds to the combined statistical and systematic uncertainty. |
png pdf |
Figure 2-d:
Normalised differential $ {\mathrm {t}\overline {\mathrm {t}}} $ production cross section as a function of the jet multiplicity for jets with $ {p_{\mathrm {T}}} >$ 30 GeV (a,b) and $ {p_{\mathrm {T}}} >$ 60 GeV (c,d) in the dilepton channel. The measurements are compared to predictions from MadGraph+PYTHIA, POWHEG+PYTHIA, and MCatNLO+HERWIG (a,c), as well as from \textsc {MadGraph} with varied renormalisation and factorisation scales, and jet-parton matching threshold (b,d). The inner (outer) error bars indicate the statistical (combined statistical and systematic) uncertainty. The shaded band corresponds to the combined statistical and systematic uncertainty. |
png pdf |
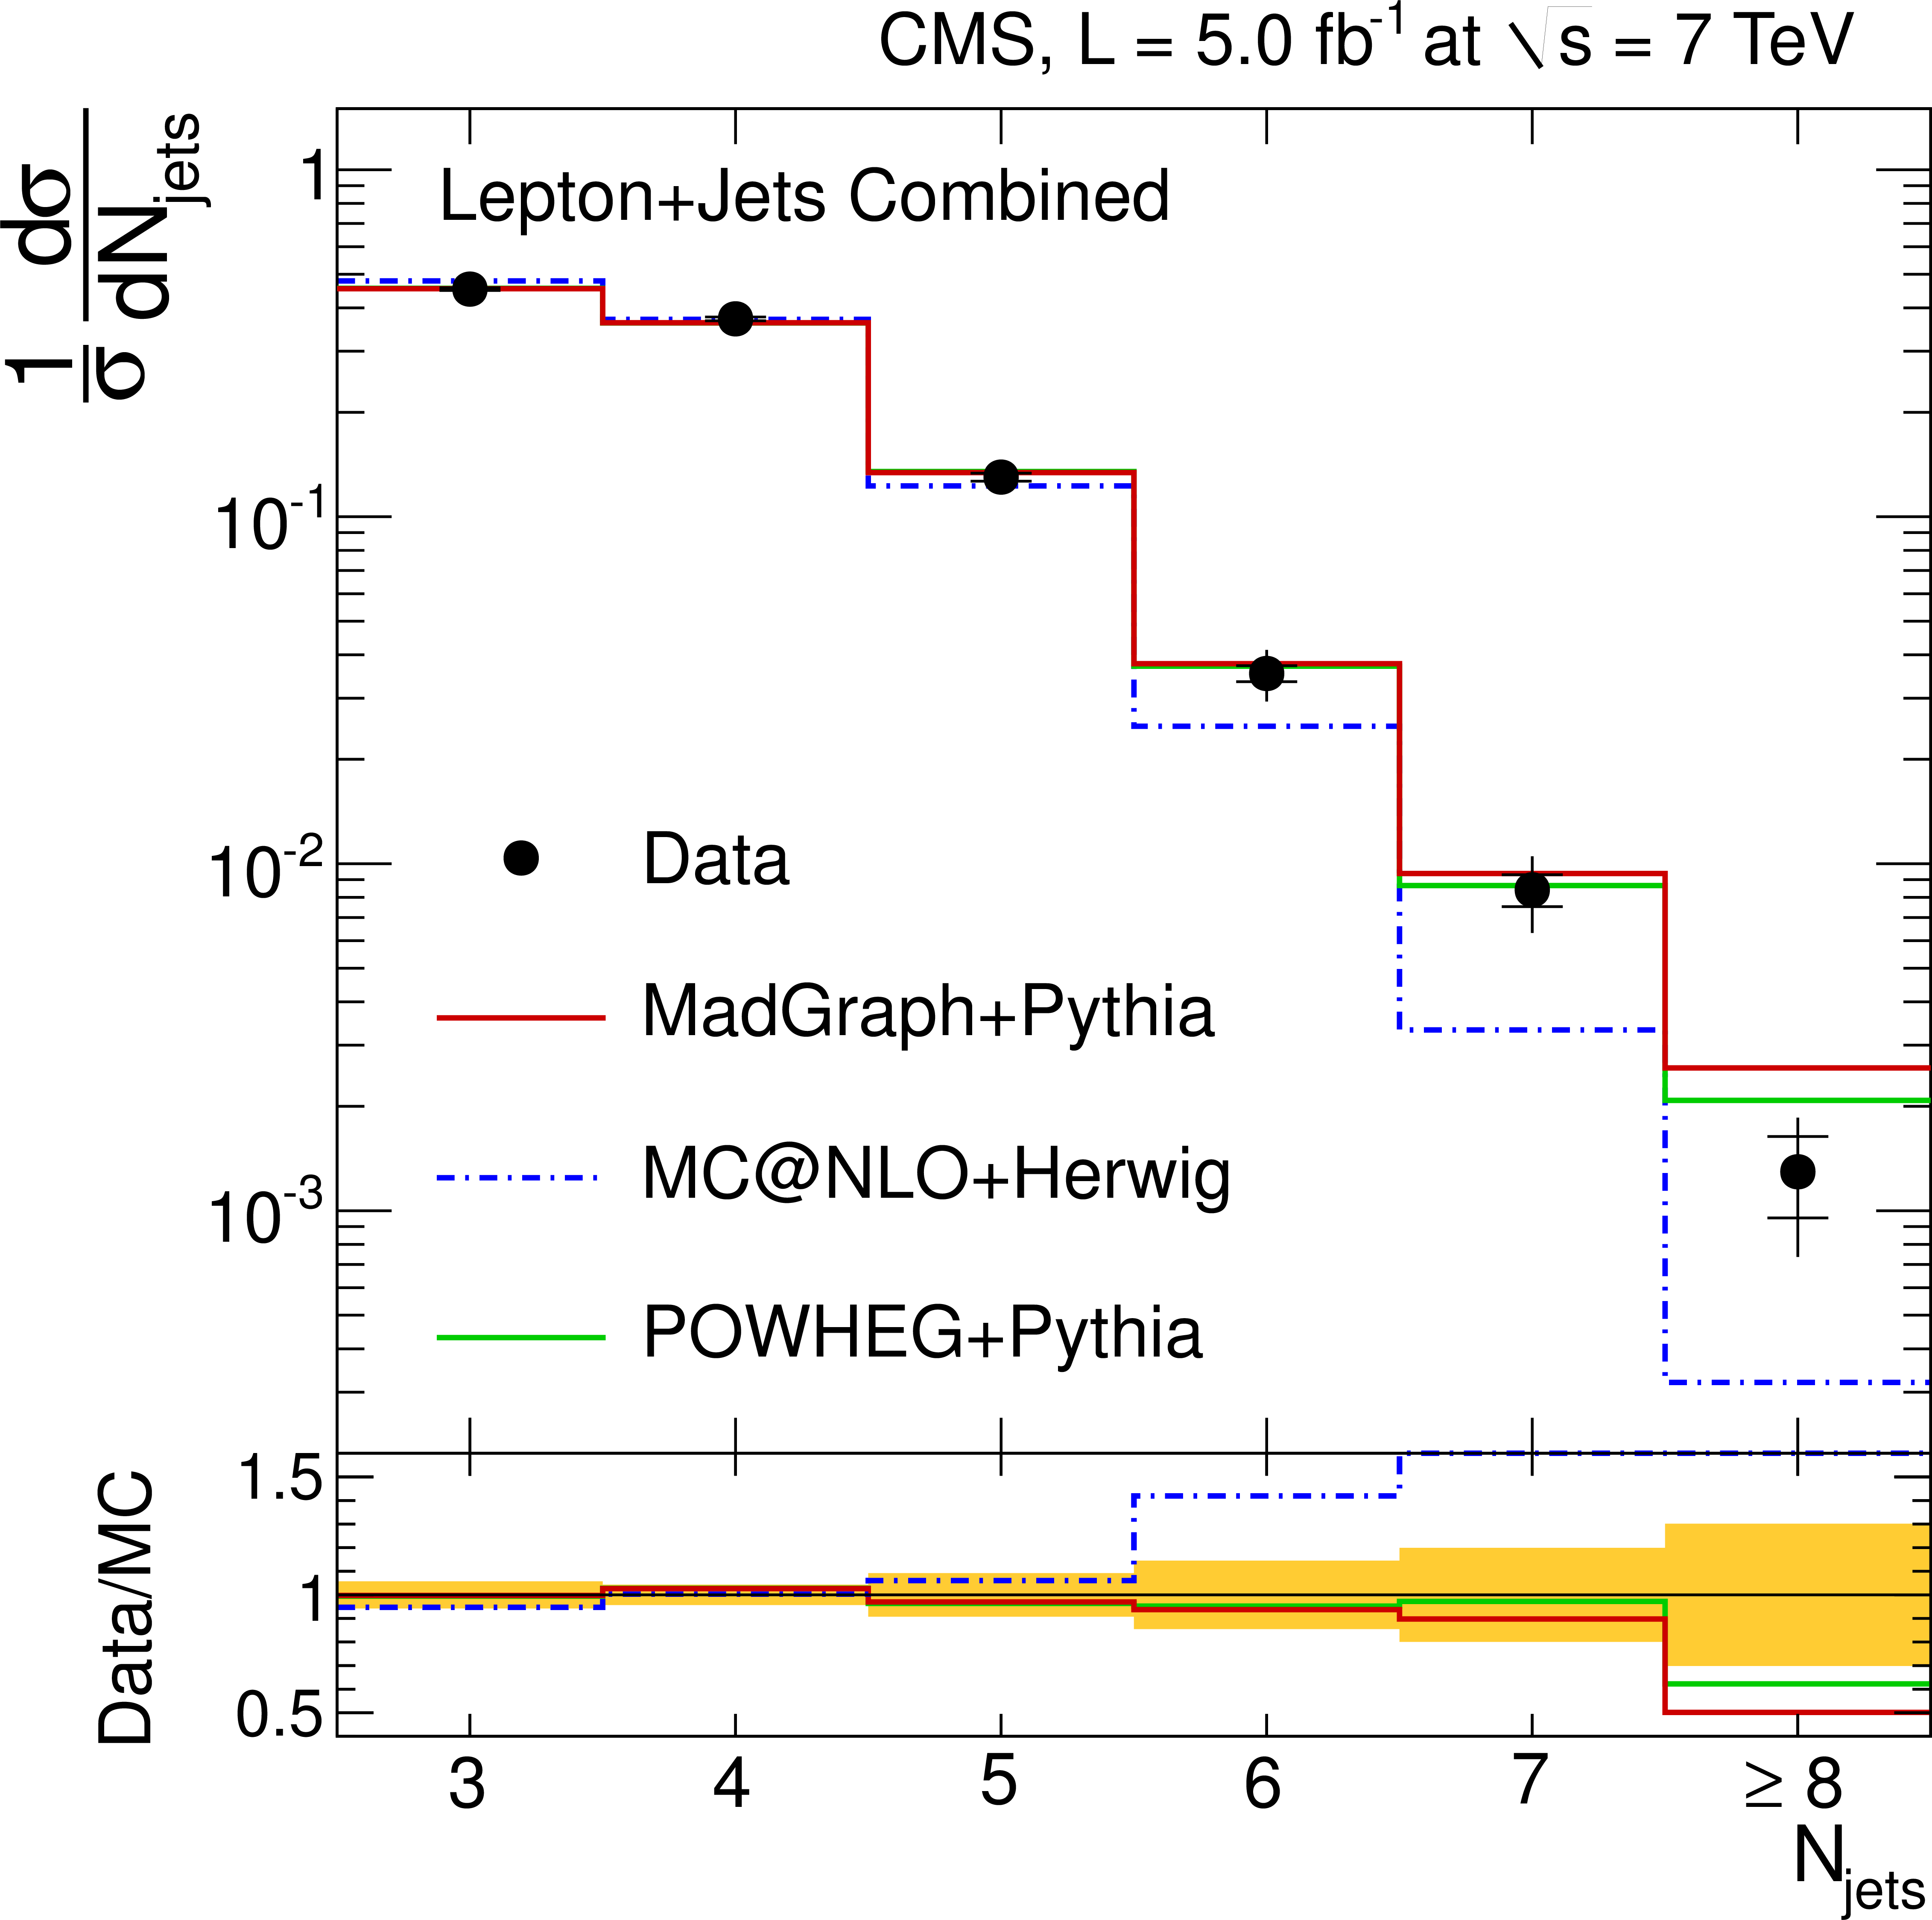
Figure 3-a:
Normalised differential $ {\mathrm {t}\overline {\mathrm {t}}} $ production cross section as a function of jet multiplicity for jets with $ {p_{\mathrm {T}}} >$ 35 GeV in the $\ell $+jets channel. The measurement is compared to predictions from MadGraph+PYTHIA, POWHEG+PYTHIA, and MCatNLO+HERWIG (a), as well as from MadGraph with varied renormalisation and factorisation scales, and jet-parton matching threshold (b). The inner (outer) error bars indicate the statistical (combined statistical and systematic) uncertainty. The shaded band corresponds to the combined statistical and systematic uncertainty. |

png pdf |
Figure 3-b:
Normalised differential $ {\mathrm {t}\overline {\mathrm {t}}} $ production cross section as a function of jet multiplicity for jets with $ {p_{\mathrm {T}}} >$ 35 GeV in the $\ell $+jets channel. The measurement is compared to predictions from MadGraph+PYTHIA, POWHEG+PYTHIA, and MCatNLO+HERWIG (a), as well as from MadGraph with varied renormalisation and factorisation scales, and jet-parton matching threshold (b). The inner (outer) error bars indicate the statistical (combined statistical and systematic) uncertainty. The shaded band corresponds to the combined statistical and systematic uncertainty. |

png pdf |
Figure 4:
Jet multiplicity distribution in simulated $ {\mathrm {t}\overline {\mathrm {t}}} $ events in the $\ell $+jets channel. The splitting into three categories, defined by the compatibility of the selected particle level jets with the $ {\mathrm {t}\overline {\mathrm {t}}} $ decay partons is also shown. |
png pdf |
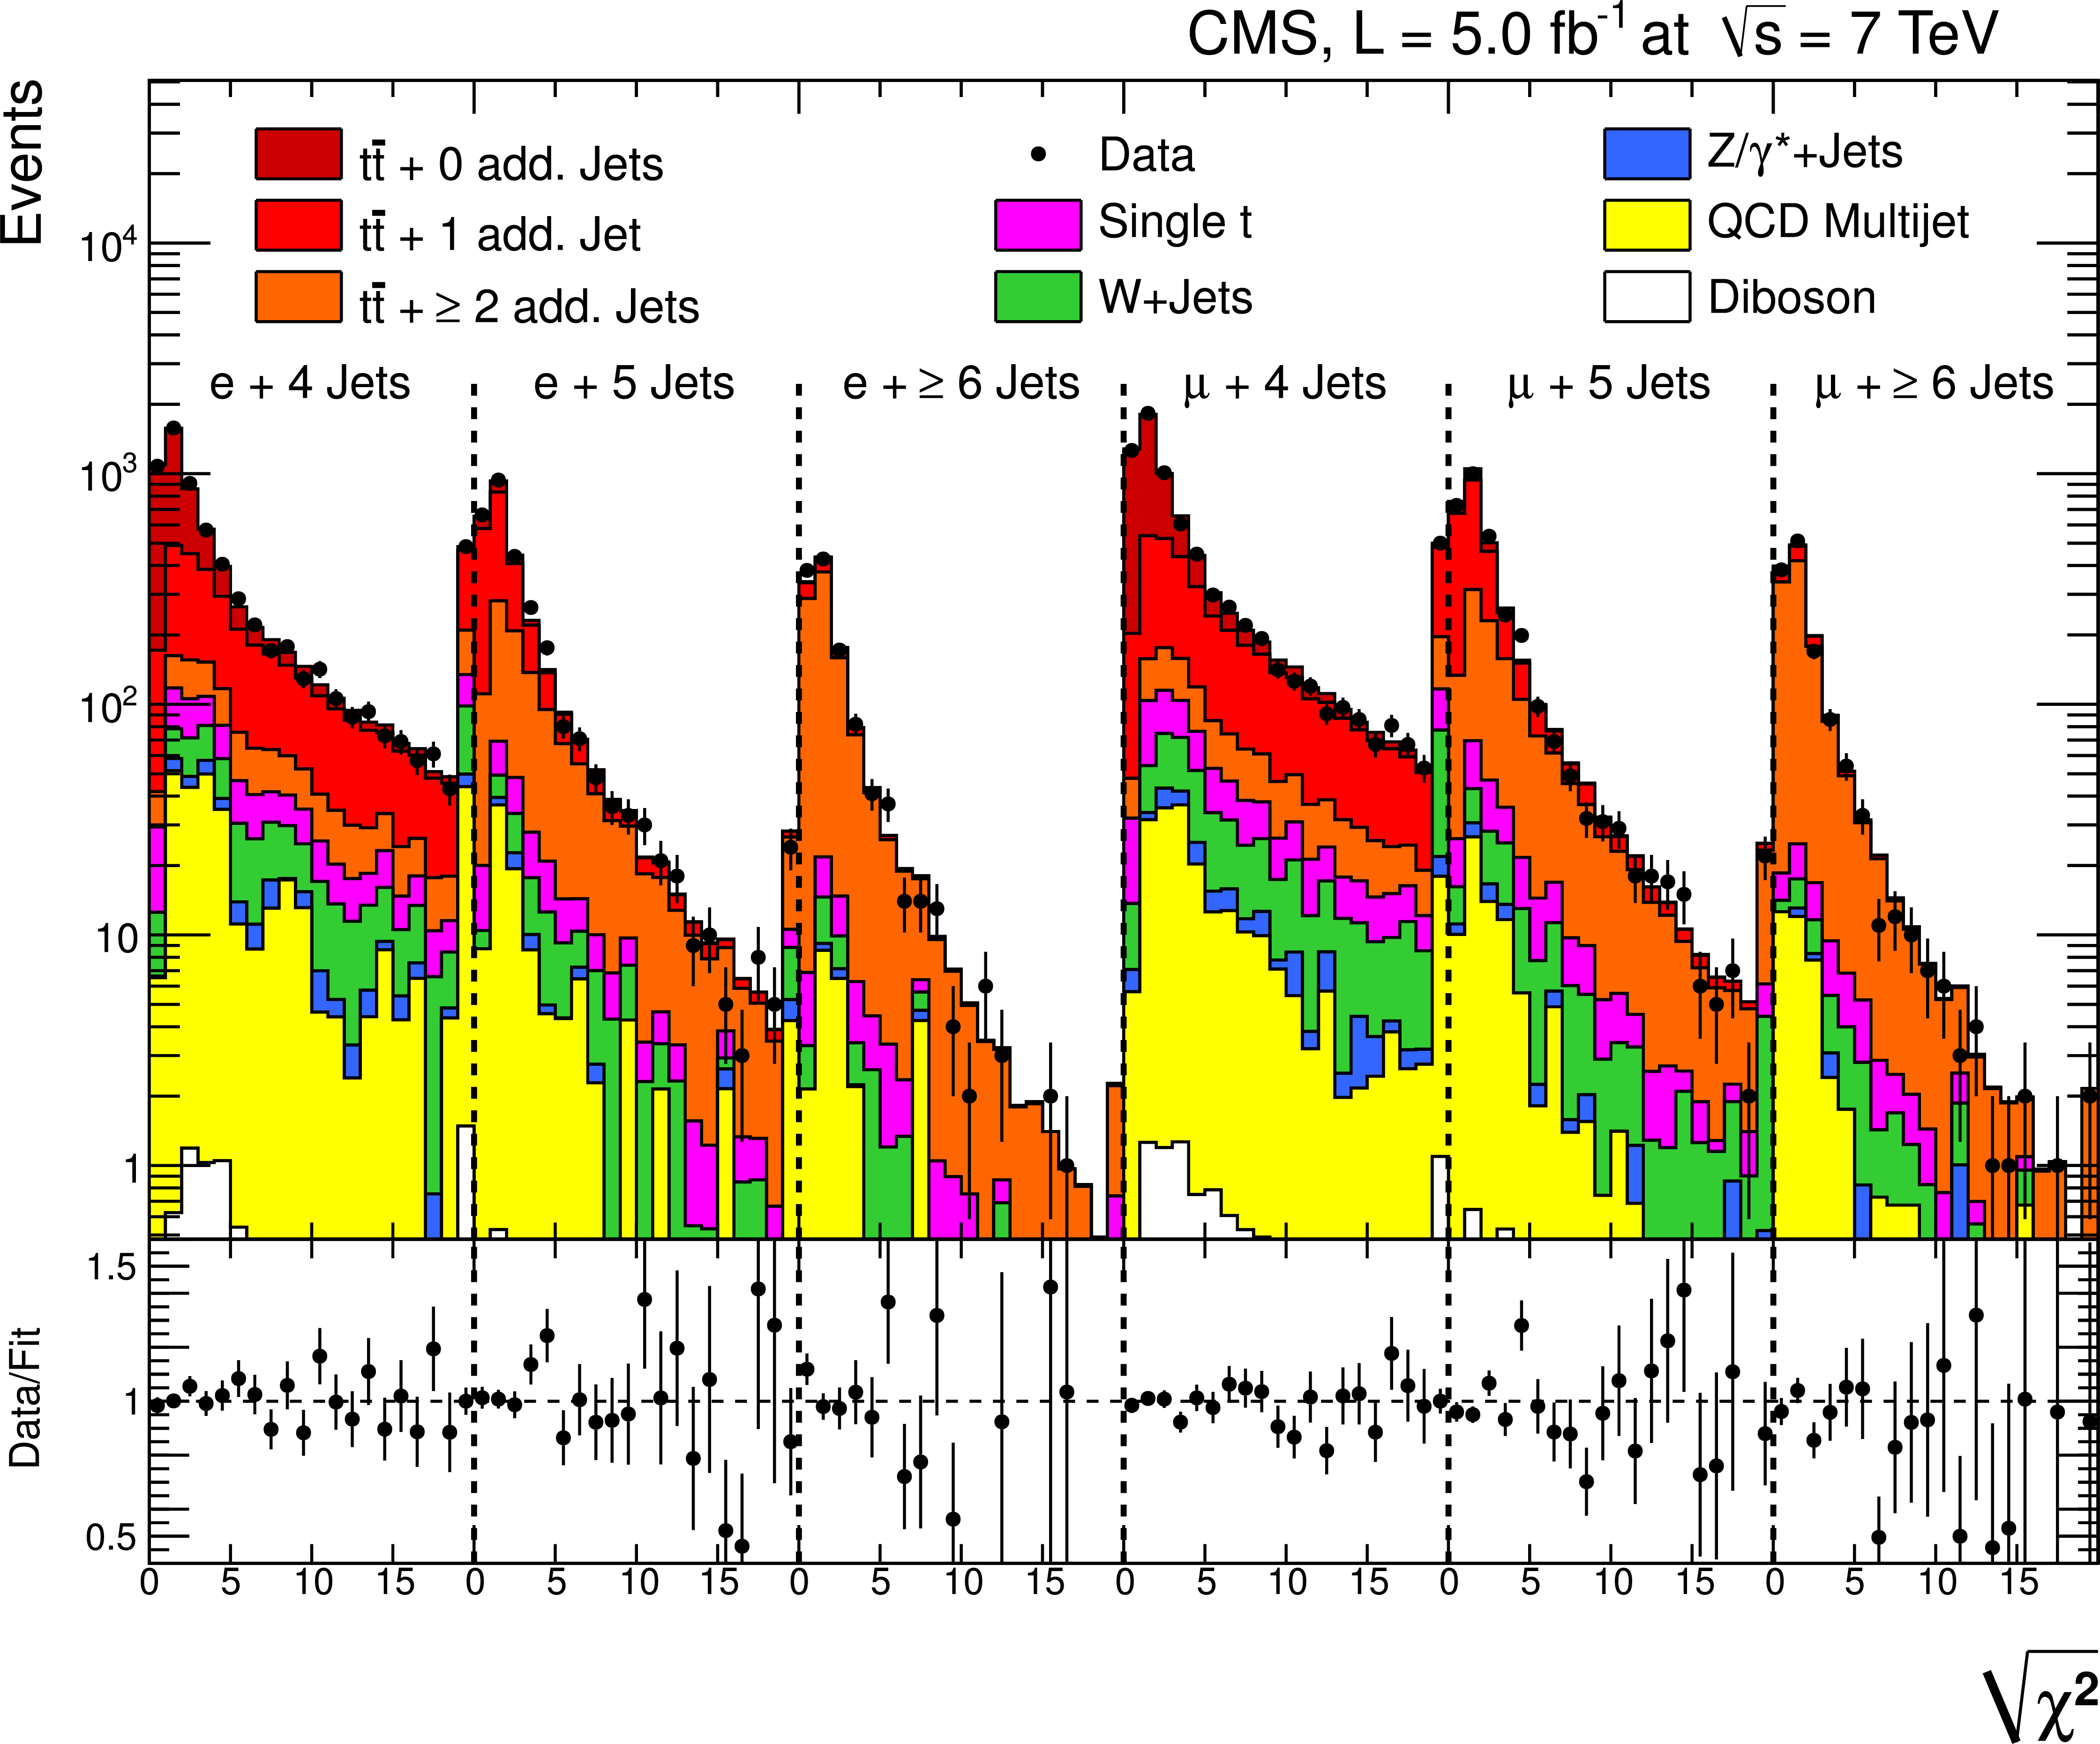
Figure 5:
Result of the simultaneous template fit to the $\sqrt {\chi ^2}$ distribution in the $\ell $+jets channel. All templates are scaled to the resulting fit parameters. |
png pdf |
Figure 6-a:
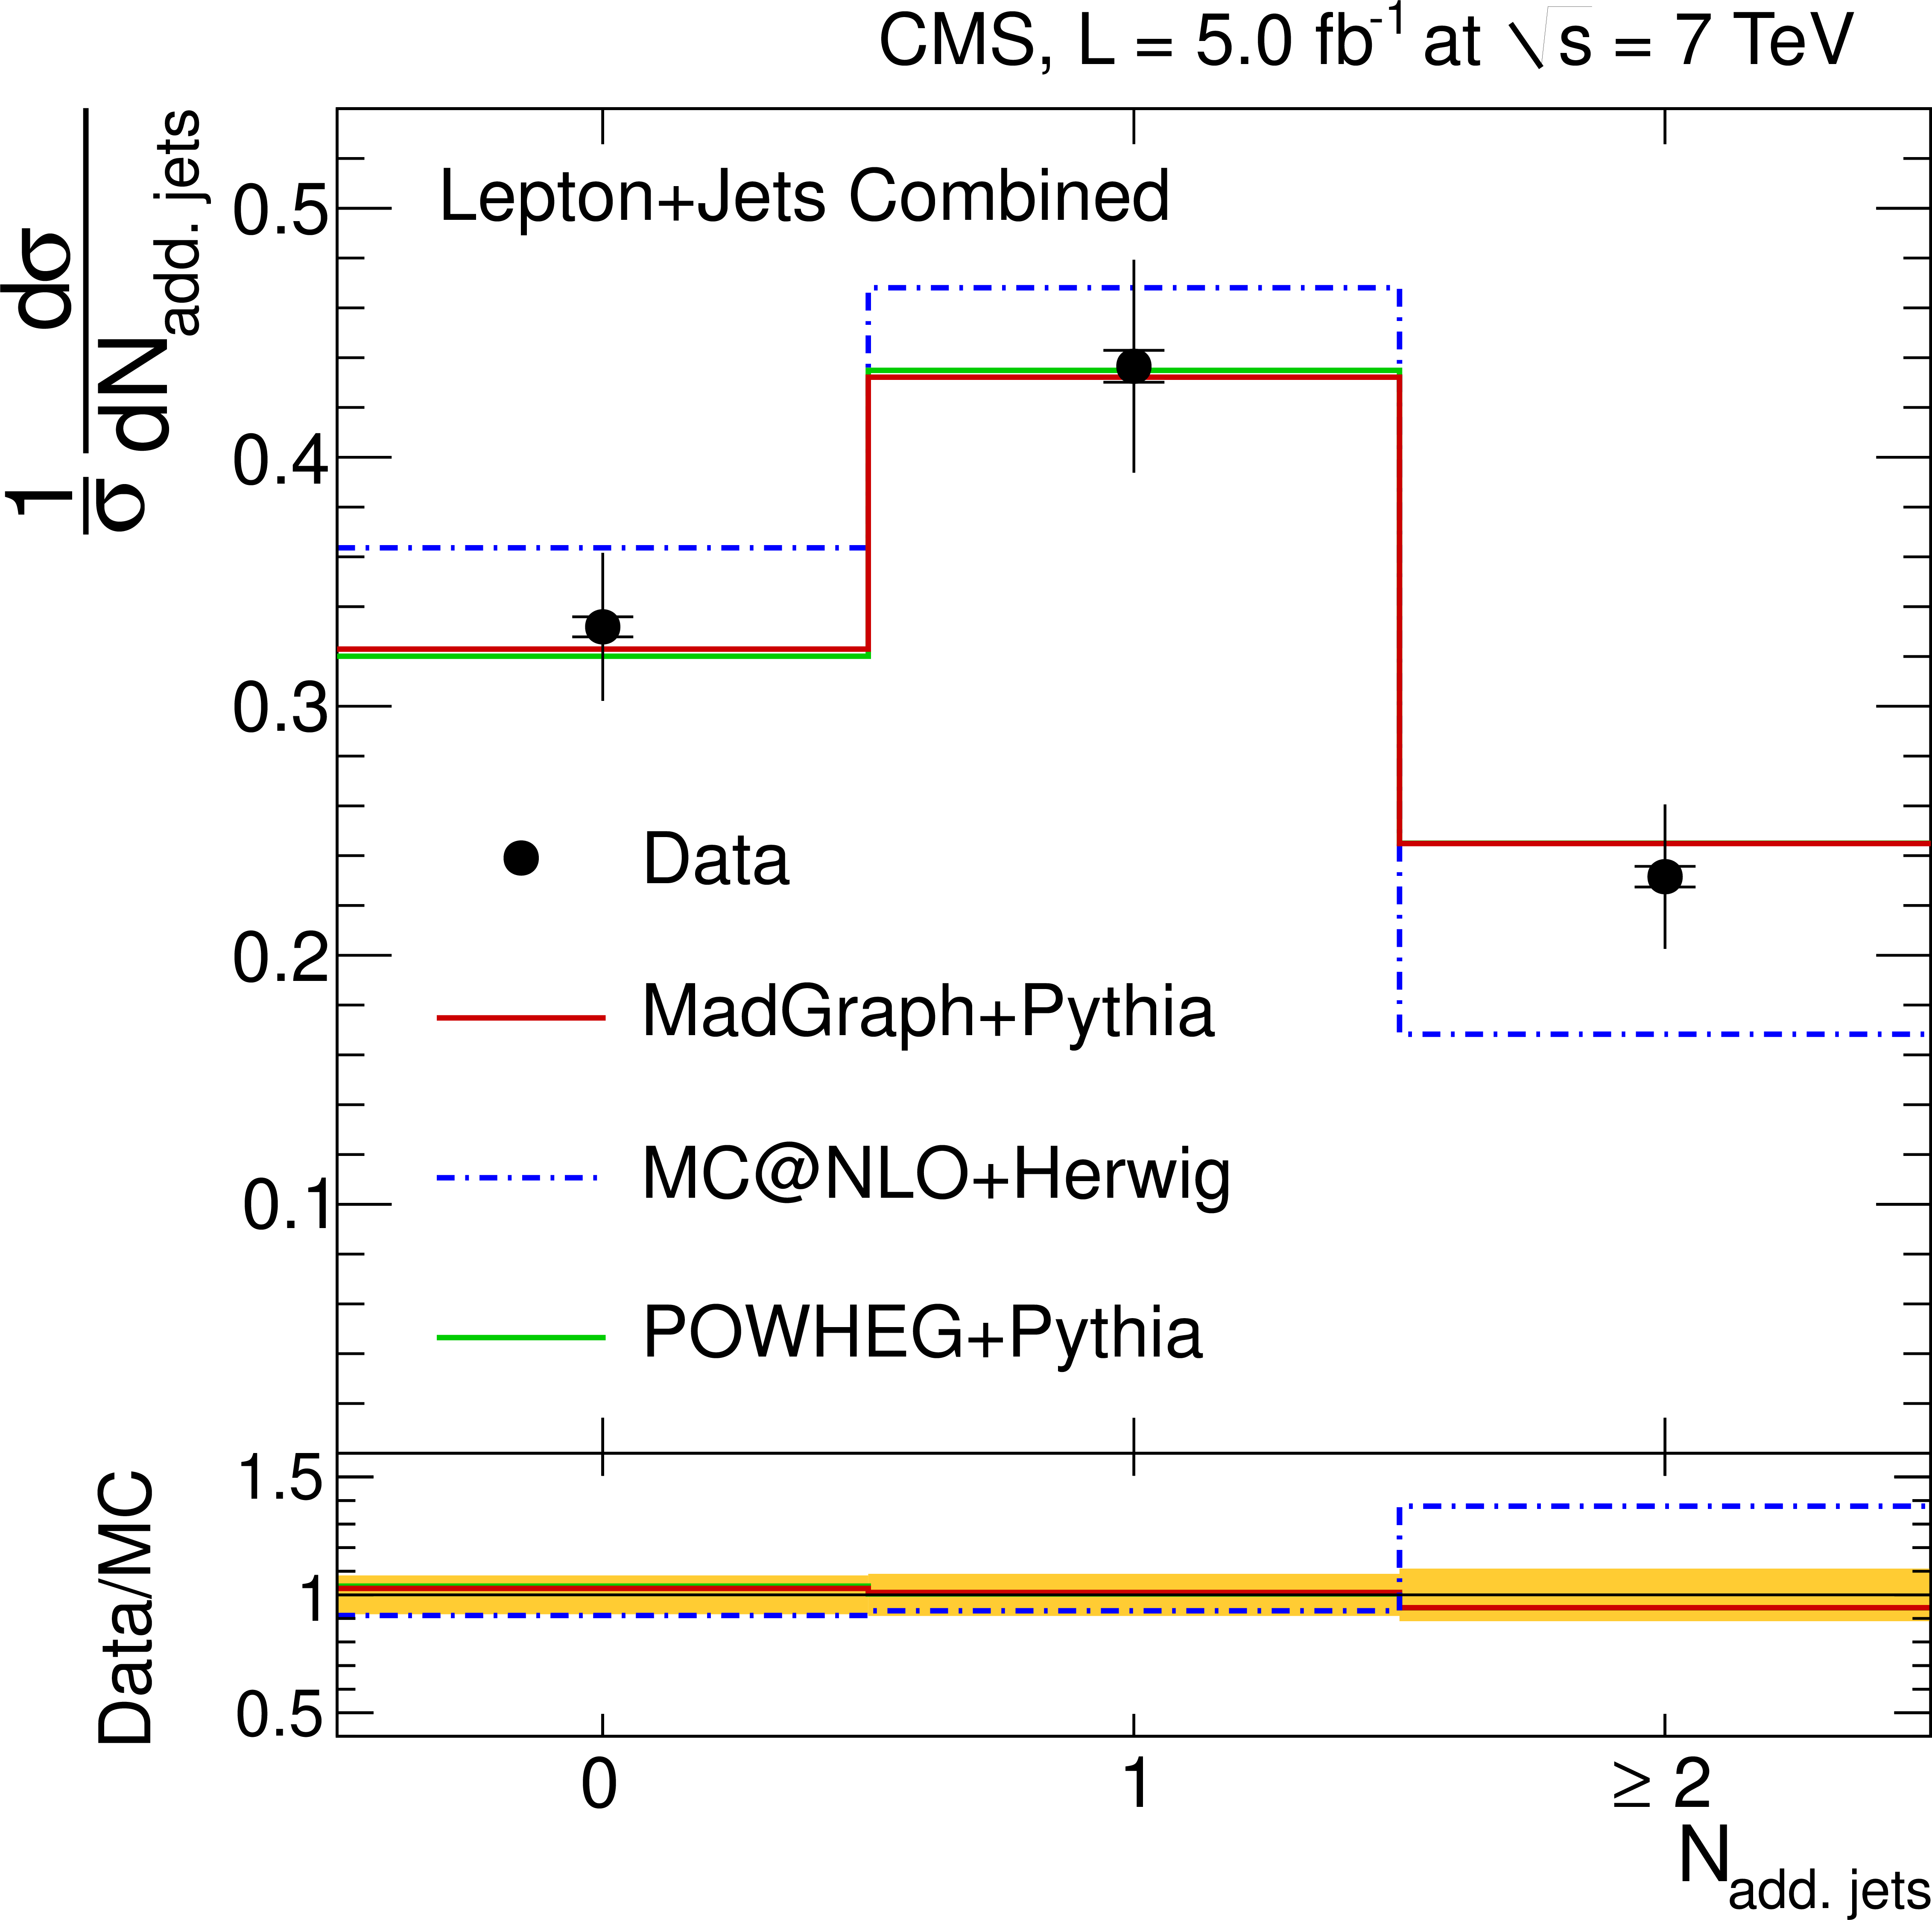
Normalised differential $ {\mathrm {t}\overline {\mathrm {t}}} $ production cross section as a function of the number of additional jets in the $\ell $+jets channel. The measurement is compared to predictions from MadGraph+PYTHIA, POWHEG+PYTHIA, and MCatNLO+HERWIG (a), as well as from MadGraph with varied renormalisation and factorisation scales, and jet-parton matching threshold (b). The inner (outer) error bars indicate the statistical (combined statistical and systematic) uncertainty. The shaded band corresponds to the combined statistical and systematic uncertainty |
png pdf |
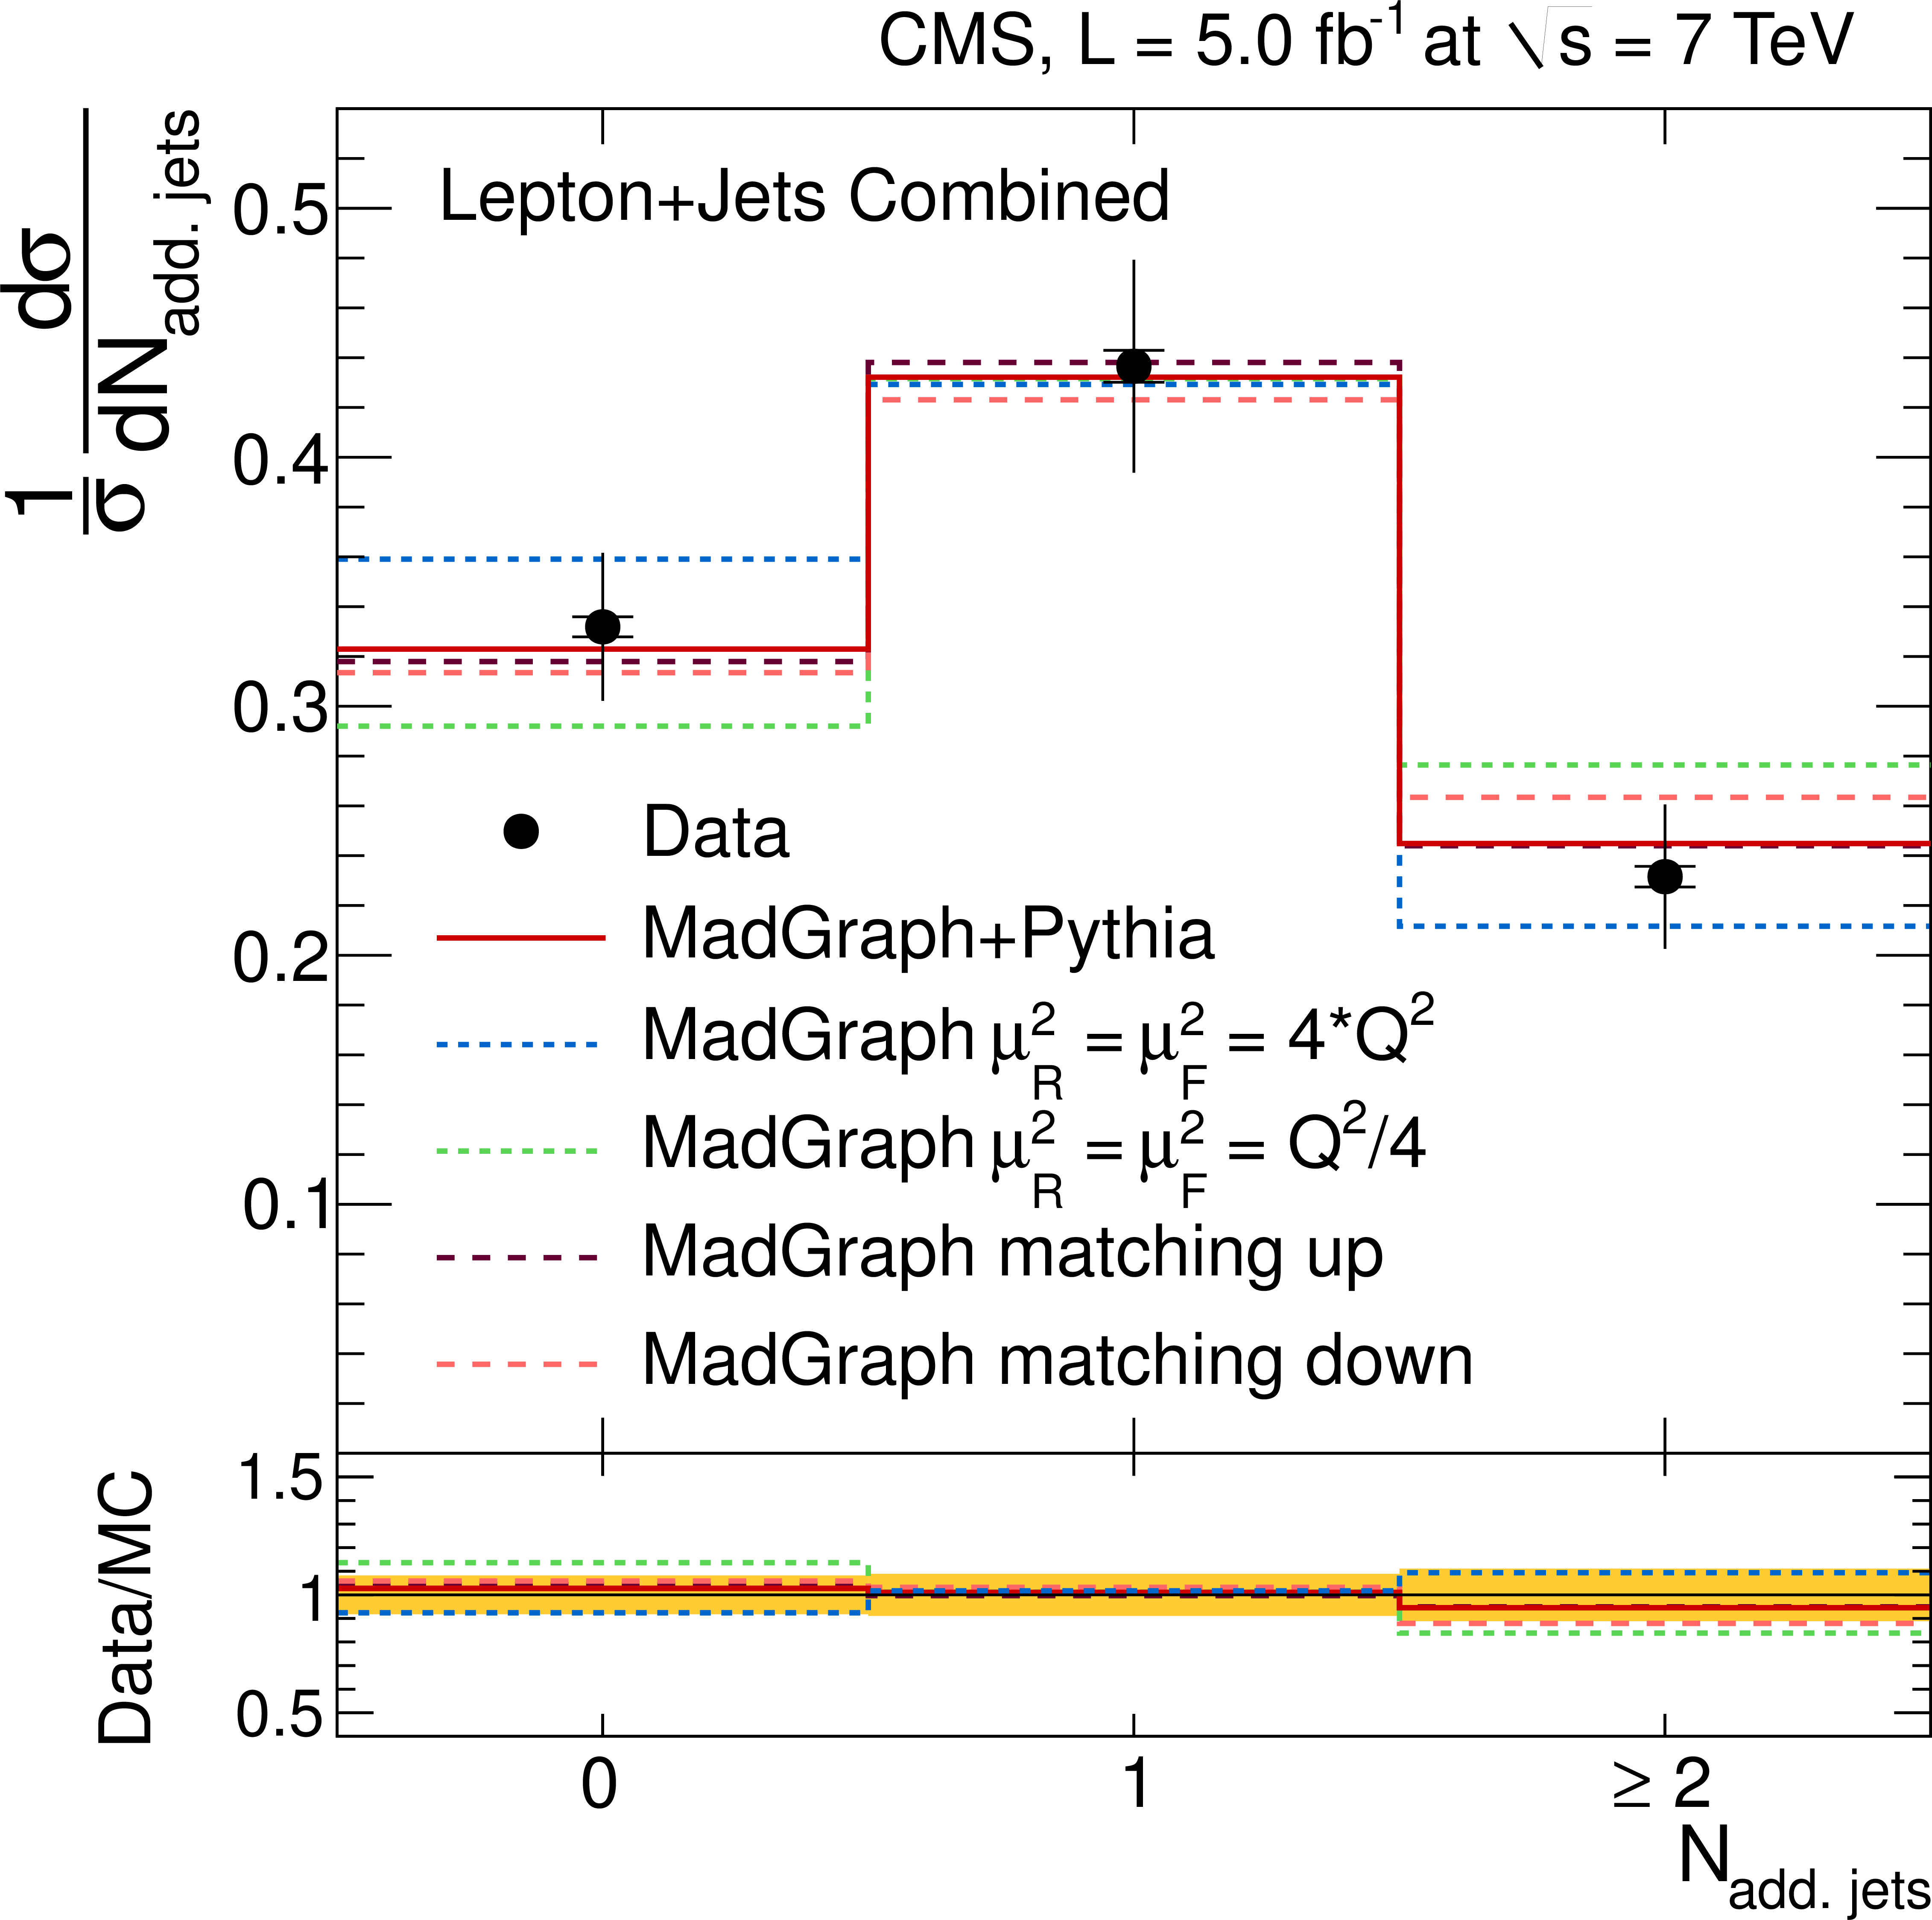
Figure 6-b:
Normalised differential $ {\mathrm {t}\overline {\mathrm {t}}} $ production cross section as a function of the number of additional jets in the $\ell $+jets channel. The measurement is compared to predictions from MadGraph+PYTHIA, POWHEG+PYTHIA, and MCatNLO+HERWIG (a), as well as from MadGraph with varied renormalisation and factorisation scales, and jet-parton matching threshold (b). The inner (outer) error bars indicate the statistical (combined statistical and systematic) uncertainty. The shaded band corresponds to the combined statistical and systematic uncertainty |
png pdf |
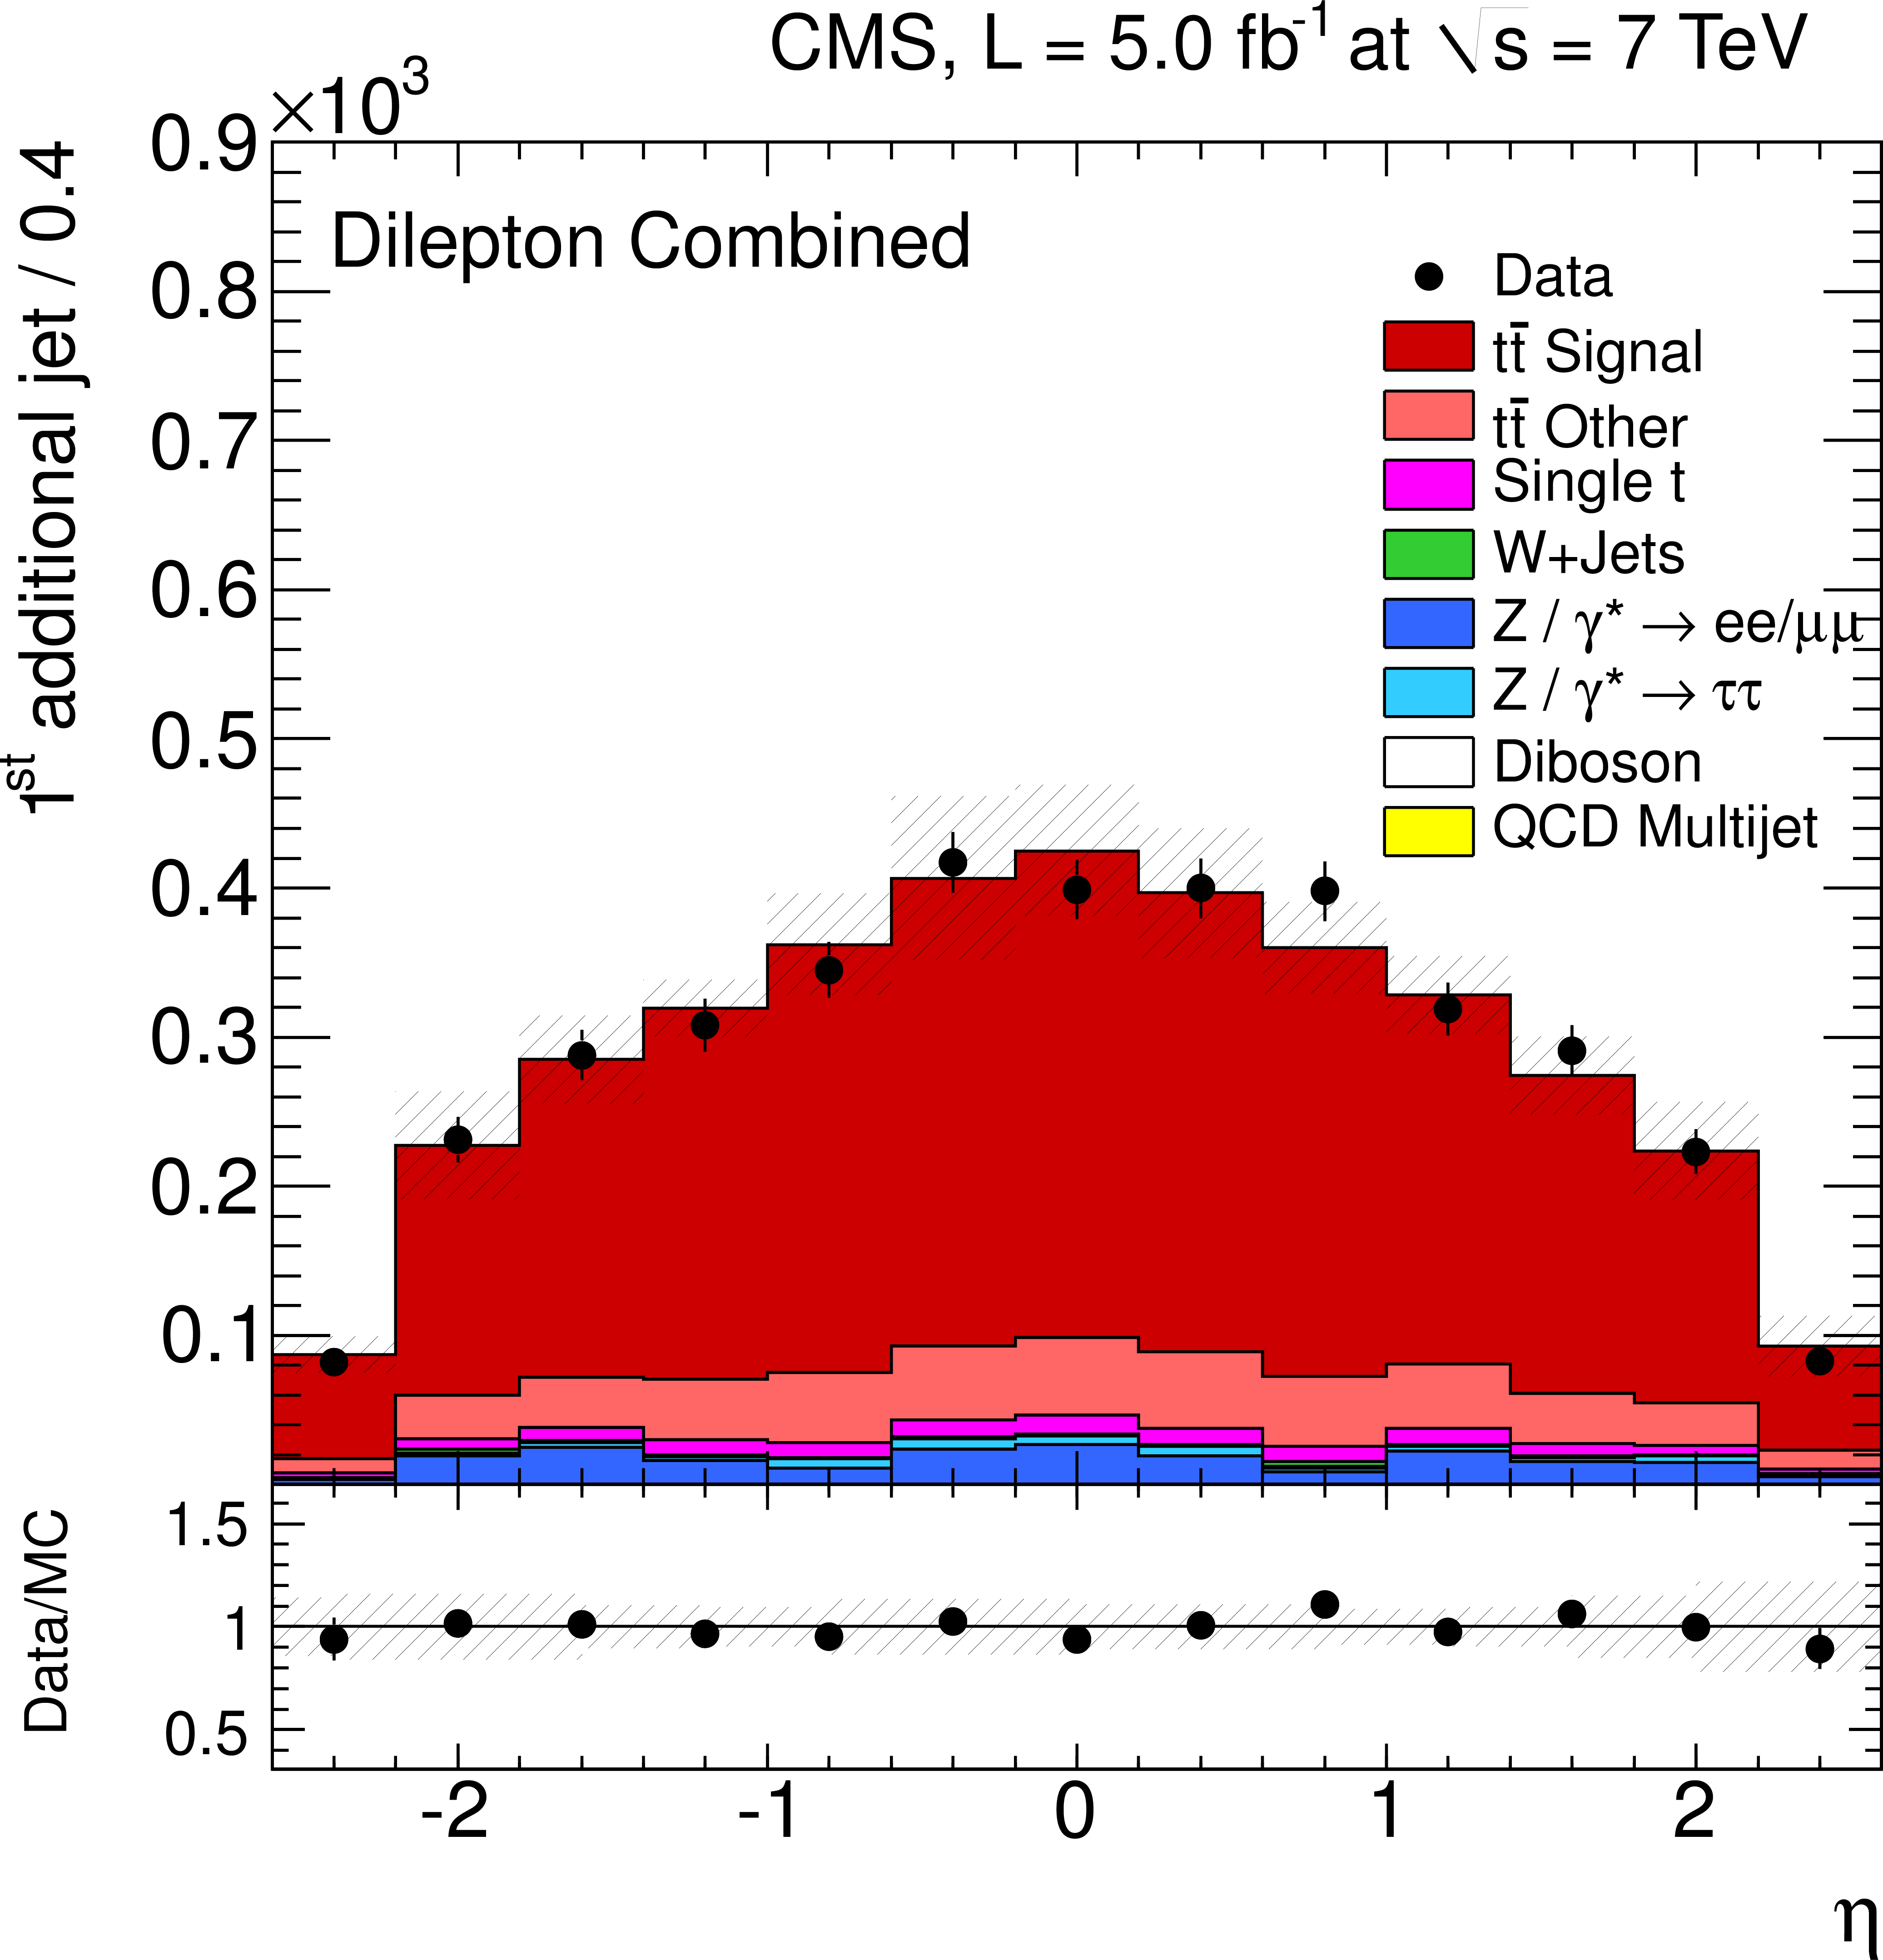
Figure 7-a:
Distribution of the $\eta $ (a,c) and the $ {p_{\mathrm {T}}} $ (b,d) of the first (a,b) and second (c,d) leading additional reconstructed jets compared to signal and background simulated samples. The error bars on the data points indicate the statistical uncertainty. The hatched band represents the combined effect of all sources of systematic uncertainty. |

png pdf |
Figure 7-b:
Distribution of the $\eta $ (a,c) and the $ {p_{\mathrm {T}}} $ (b,d) of the first (a,b) and second (c,d) leading additional reconstructed jets compared to signal and background simulated samples. The error bars on the data points indicate the statistical uncertainty. The hatched band represents the combined effect of all sources of systematic uncertainty. |
png pdf |
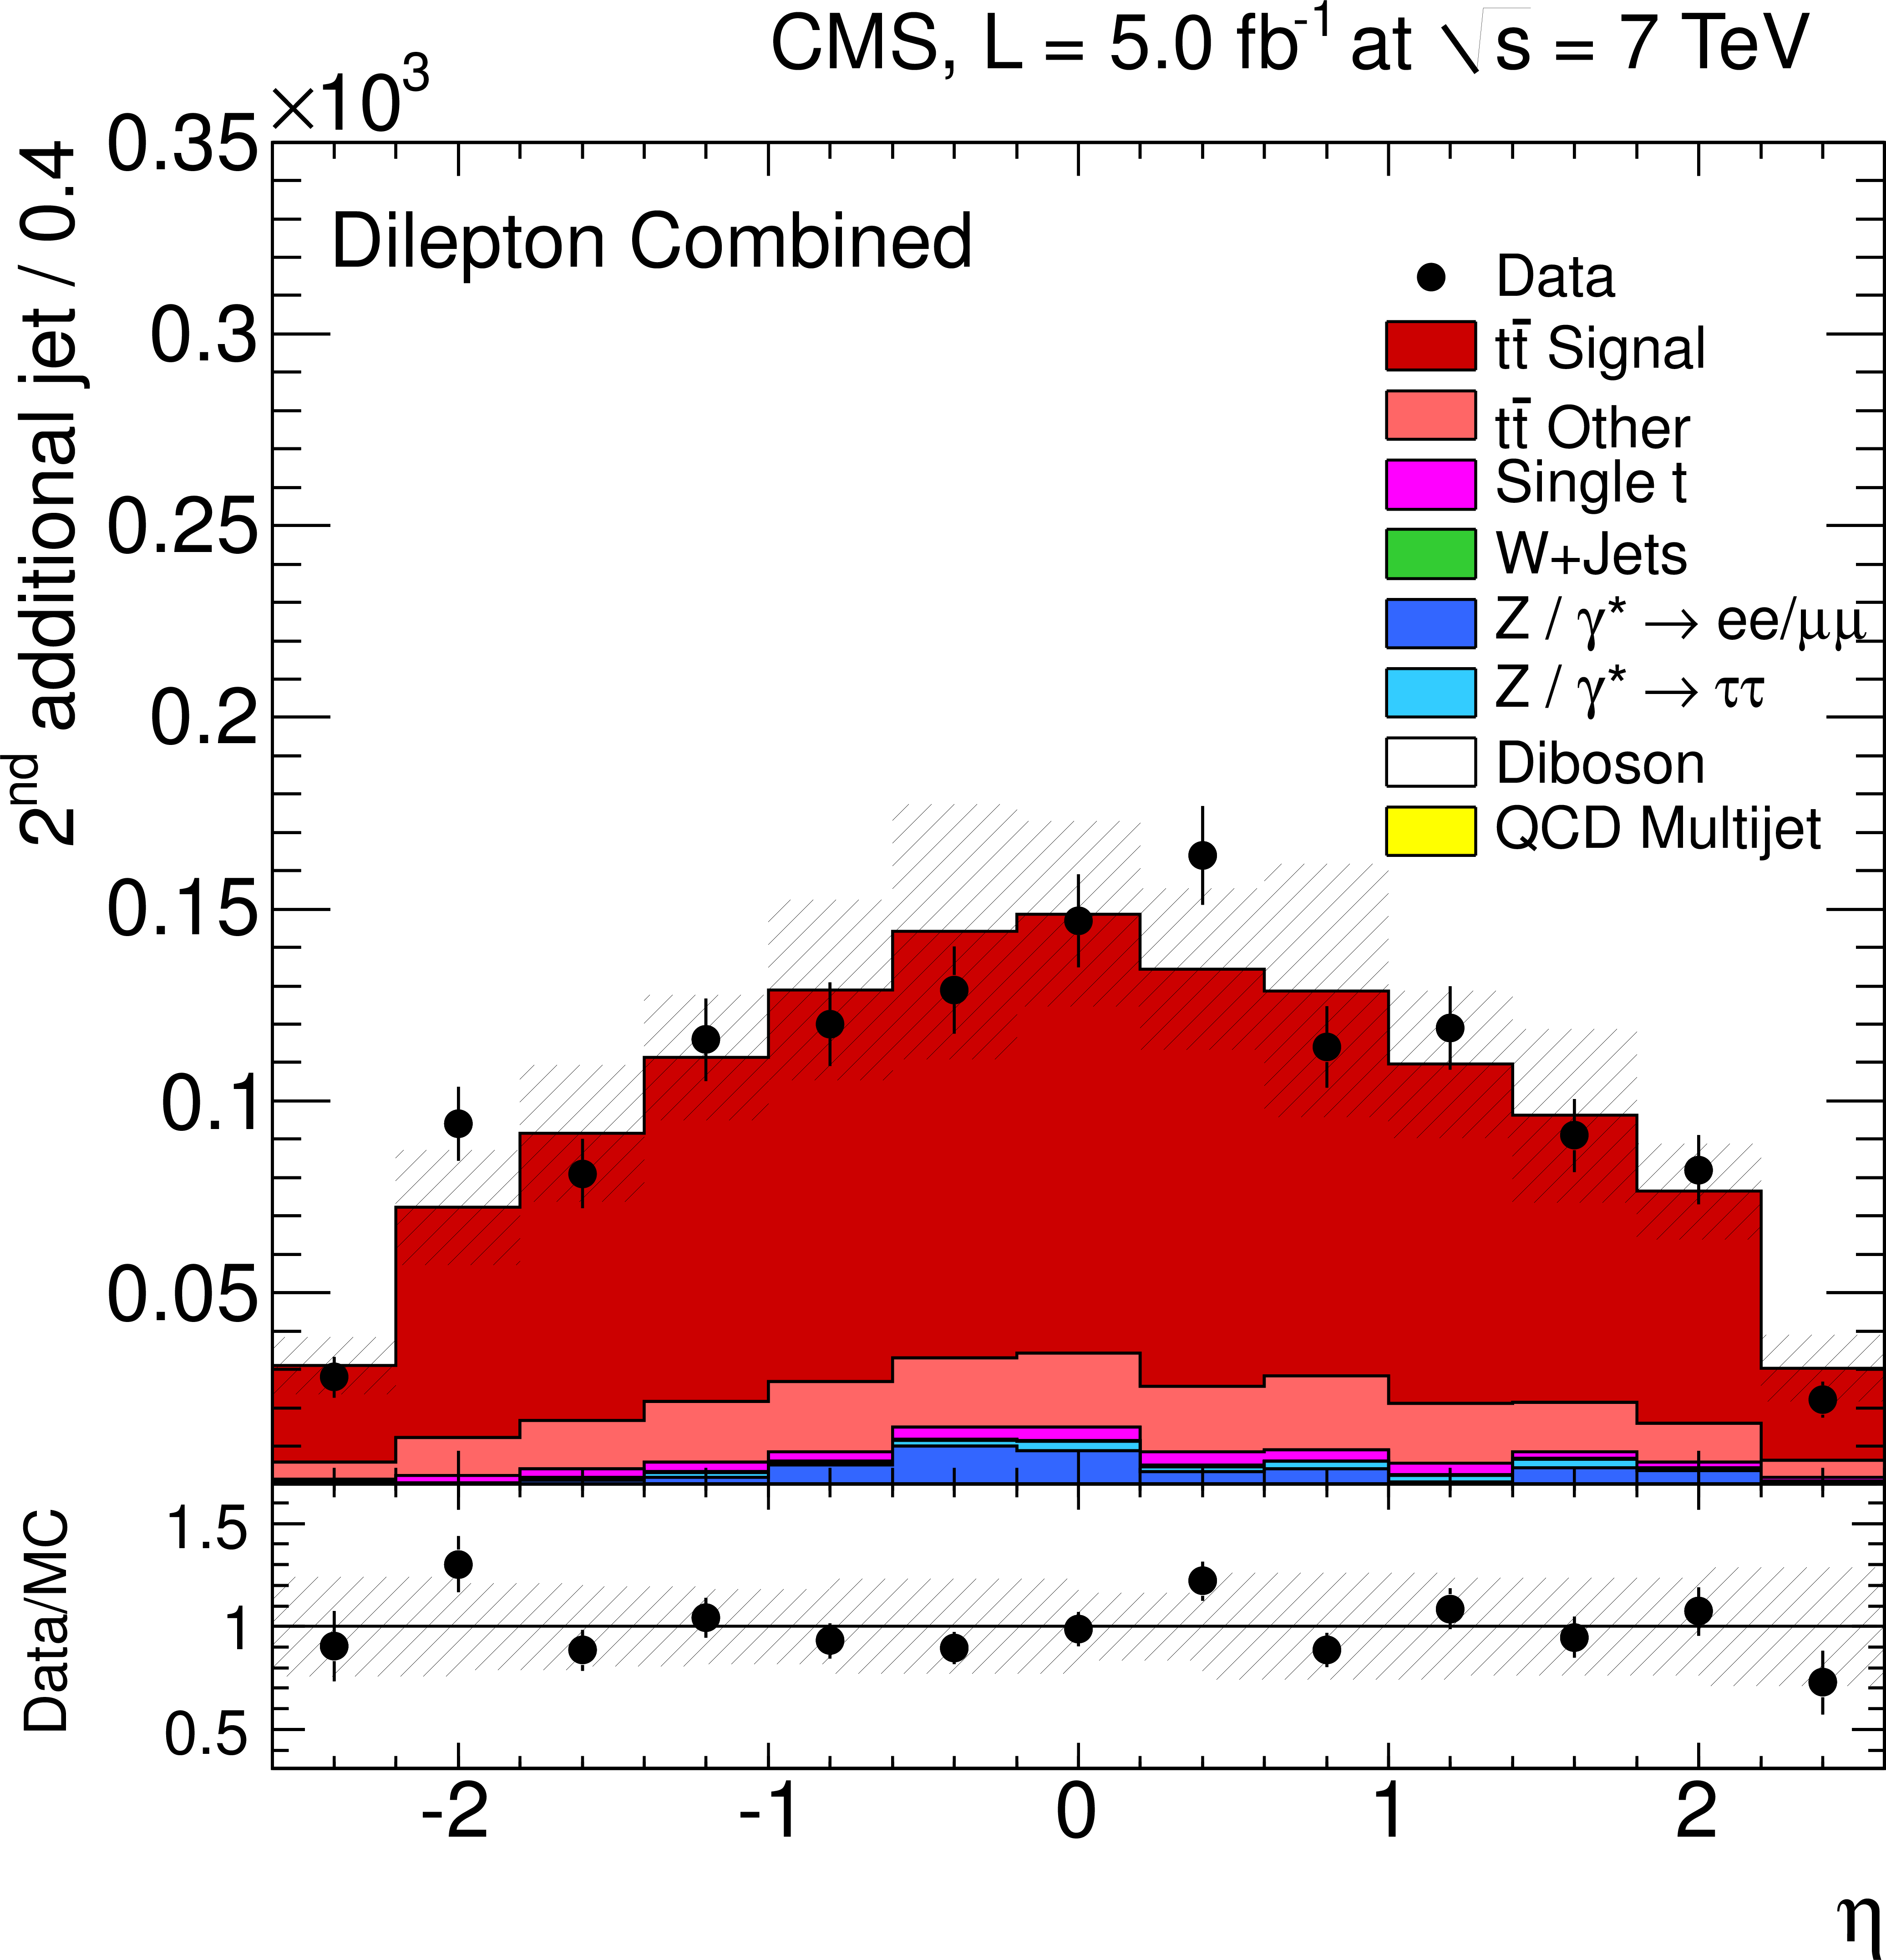
Figure 7-c:
Distribution of the $\eta $ (a,c) and the $ {p_{\mathrm {T}}} $ (b,d) of the first (a,b) and second (c,d) leading additional reconstructed jets compared to signal and background simulated samples. The error bars on the data points indicate the statistical uncertainty. The hatched band represents the combined effect of all sources of systematic uncertainty. |

png pdf |
Figure 7-d:
Distribution of the $\eta $ (a,c) and the $ {p_{\mathrm {T}}} $ (b,d) of the first (a,b) and second (c,d) leading additional reconstructed jets compared to signal and background simulated samples. The error bars on the data points indicate the statistical uncertainty. The hatched band represents the combined effect of all sources of systematic uncertainty. |
png pdf |
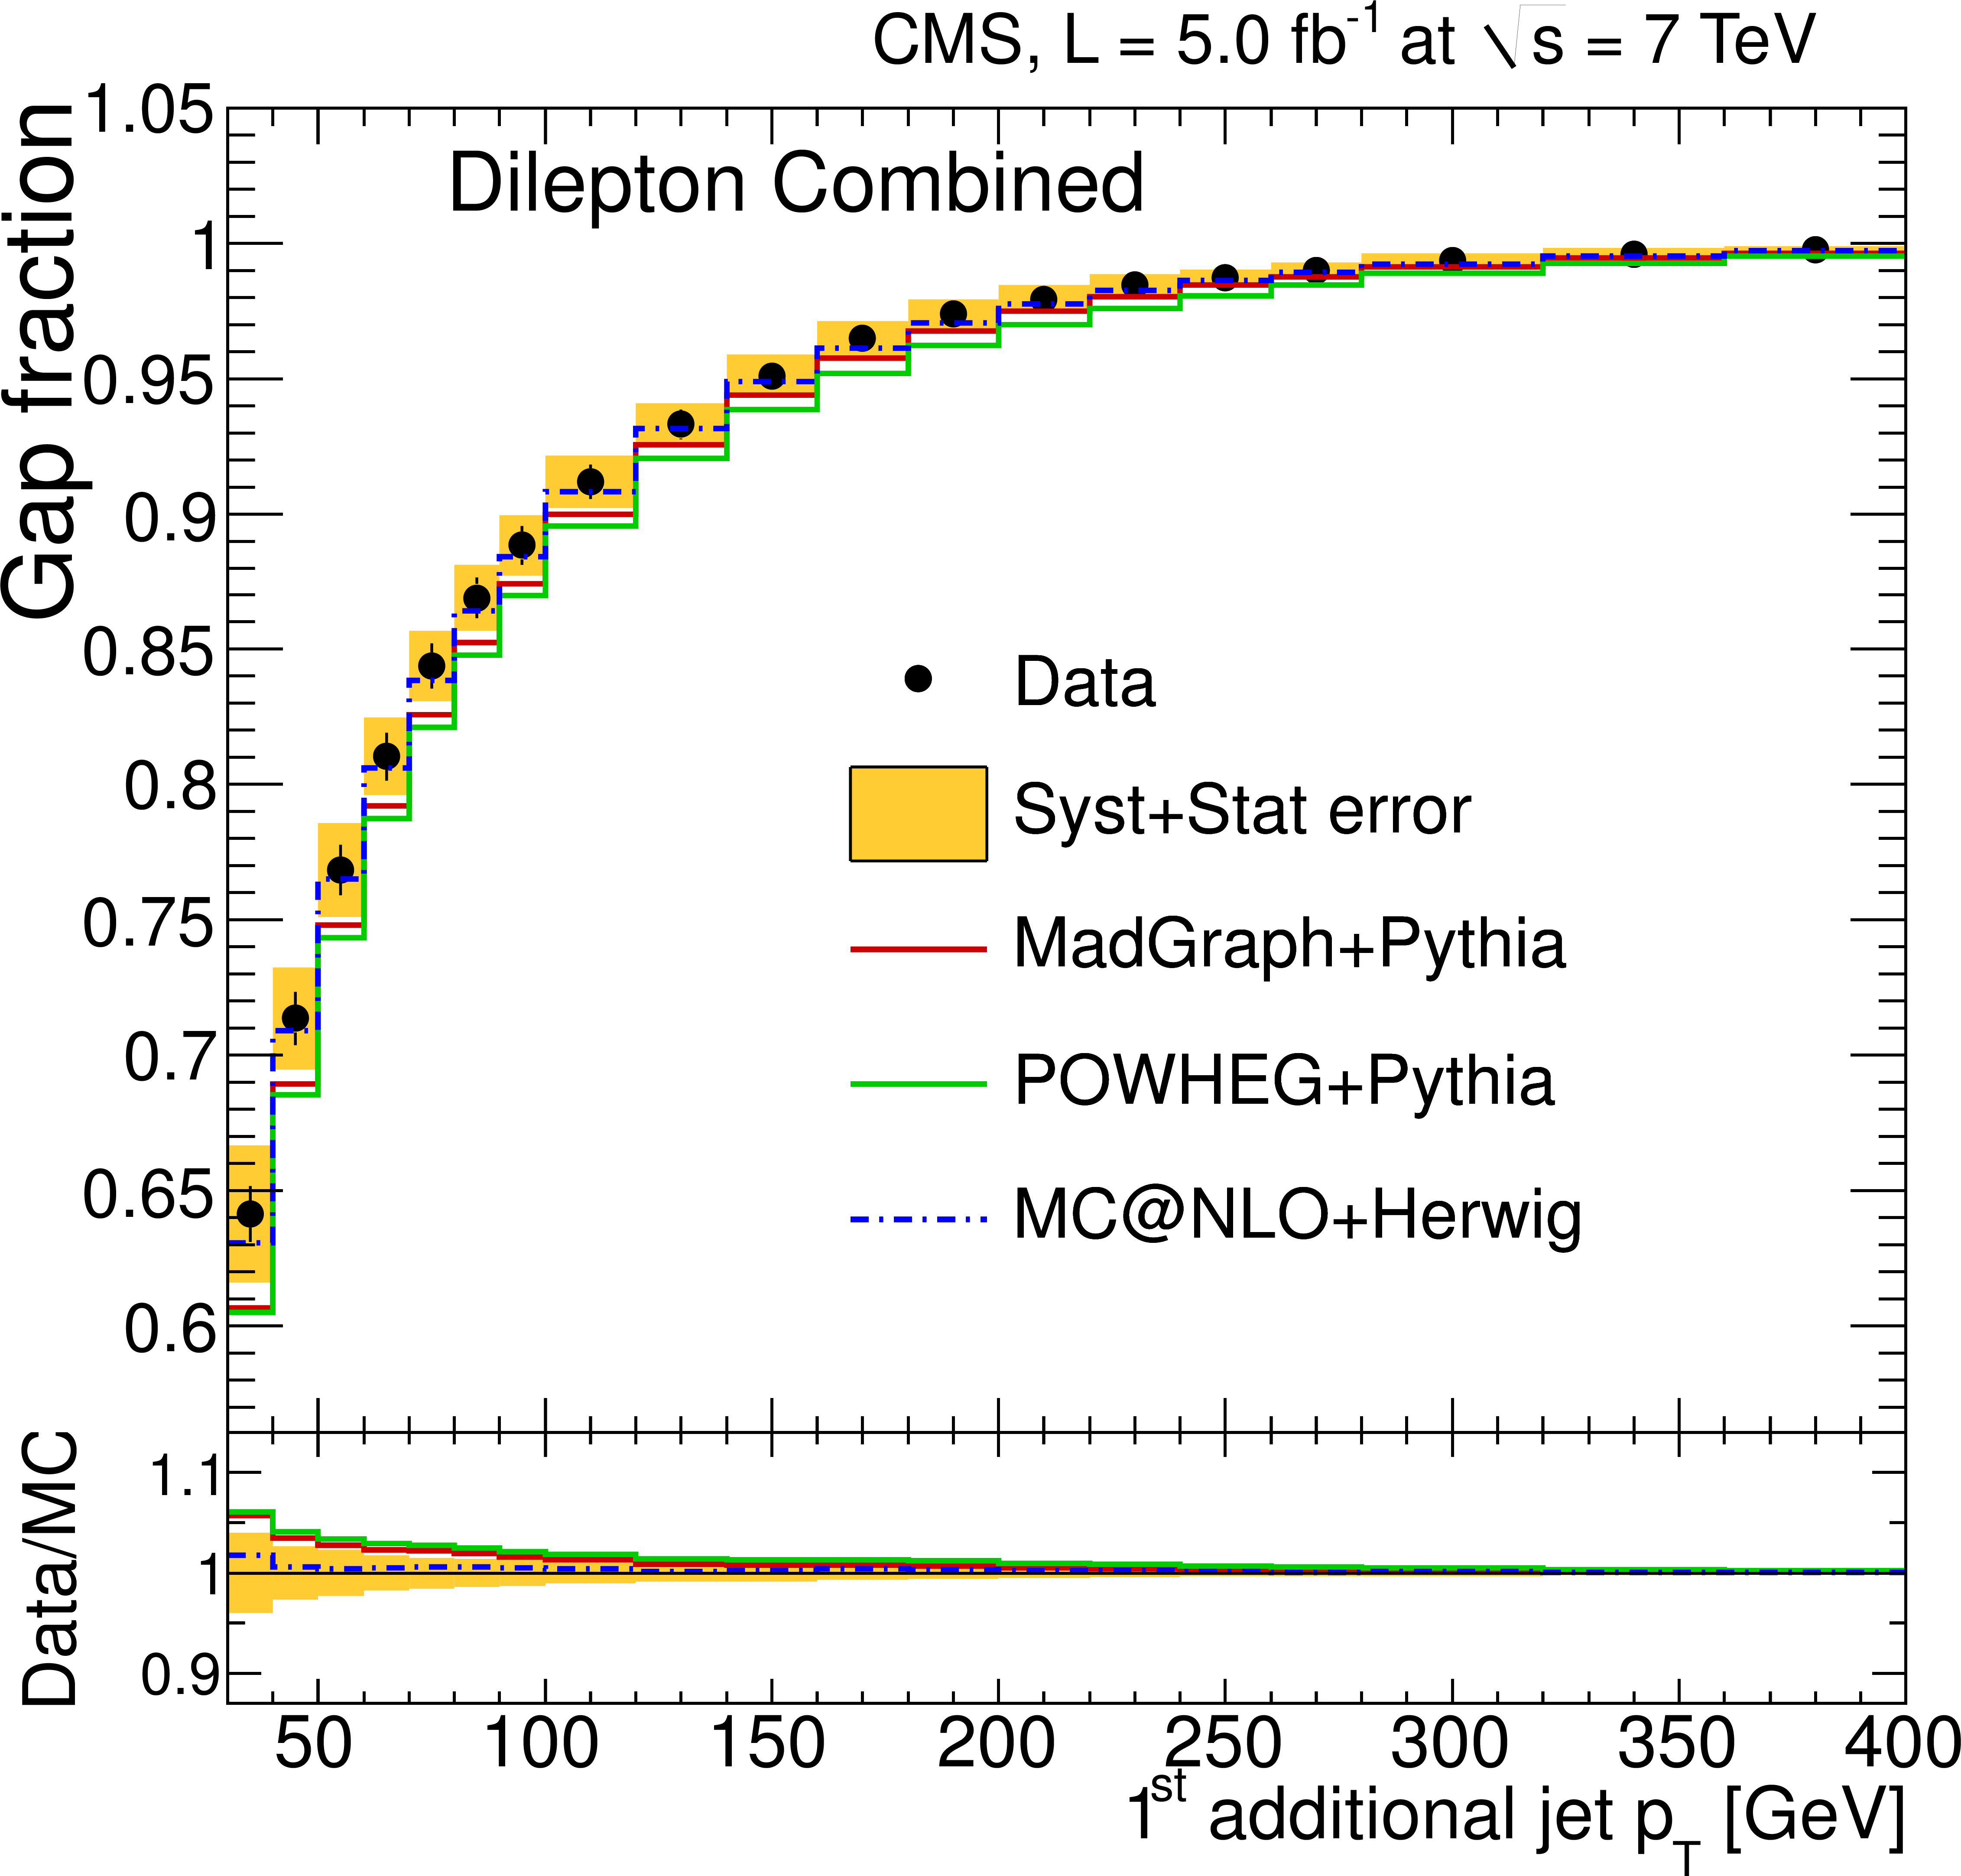
Figure 8-a:
Measured gap fraction as a function of the additional jet $ {p_{\mathrm {T}}} $ (a,c) and of $ {H_{\mathrm {T}}} = \sum { {p_{\mathrm {T}}} ^{\text {add. jets}}}$ (b,d) in the dilepton channels. Data are compared to predictions from MadGraph+PYTHIA, POWHEG+PYTHIA, and MCatNLO+HERWIG (a,b), as well as from MadGraph with varied renormalisation and factorisation scales, and jet-parton matching threshold (c,d). The error bars on the data points indicate the statistical uncertainty. The shaded band corresponds to the combined statistical and total systematic uncertainty (added in quadrature). |
png pdf |
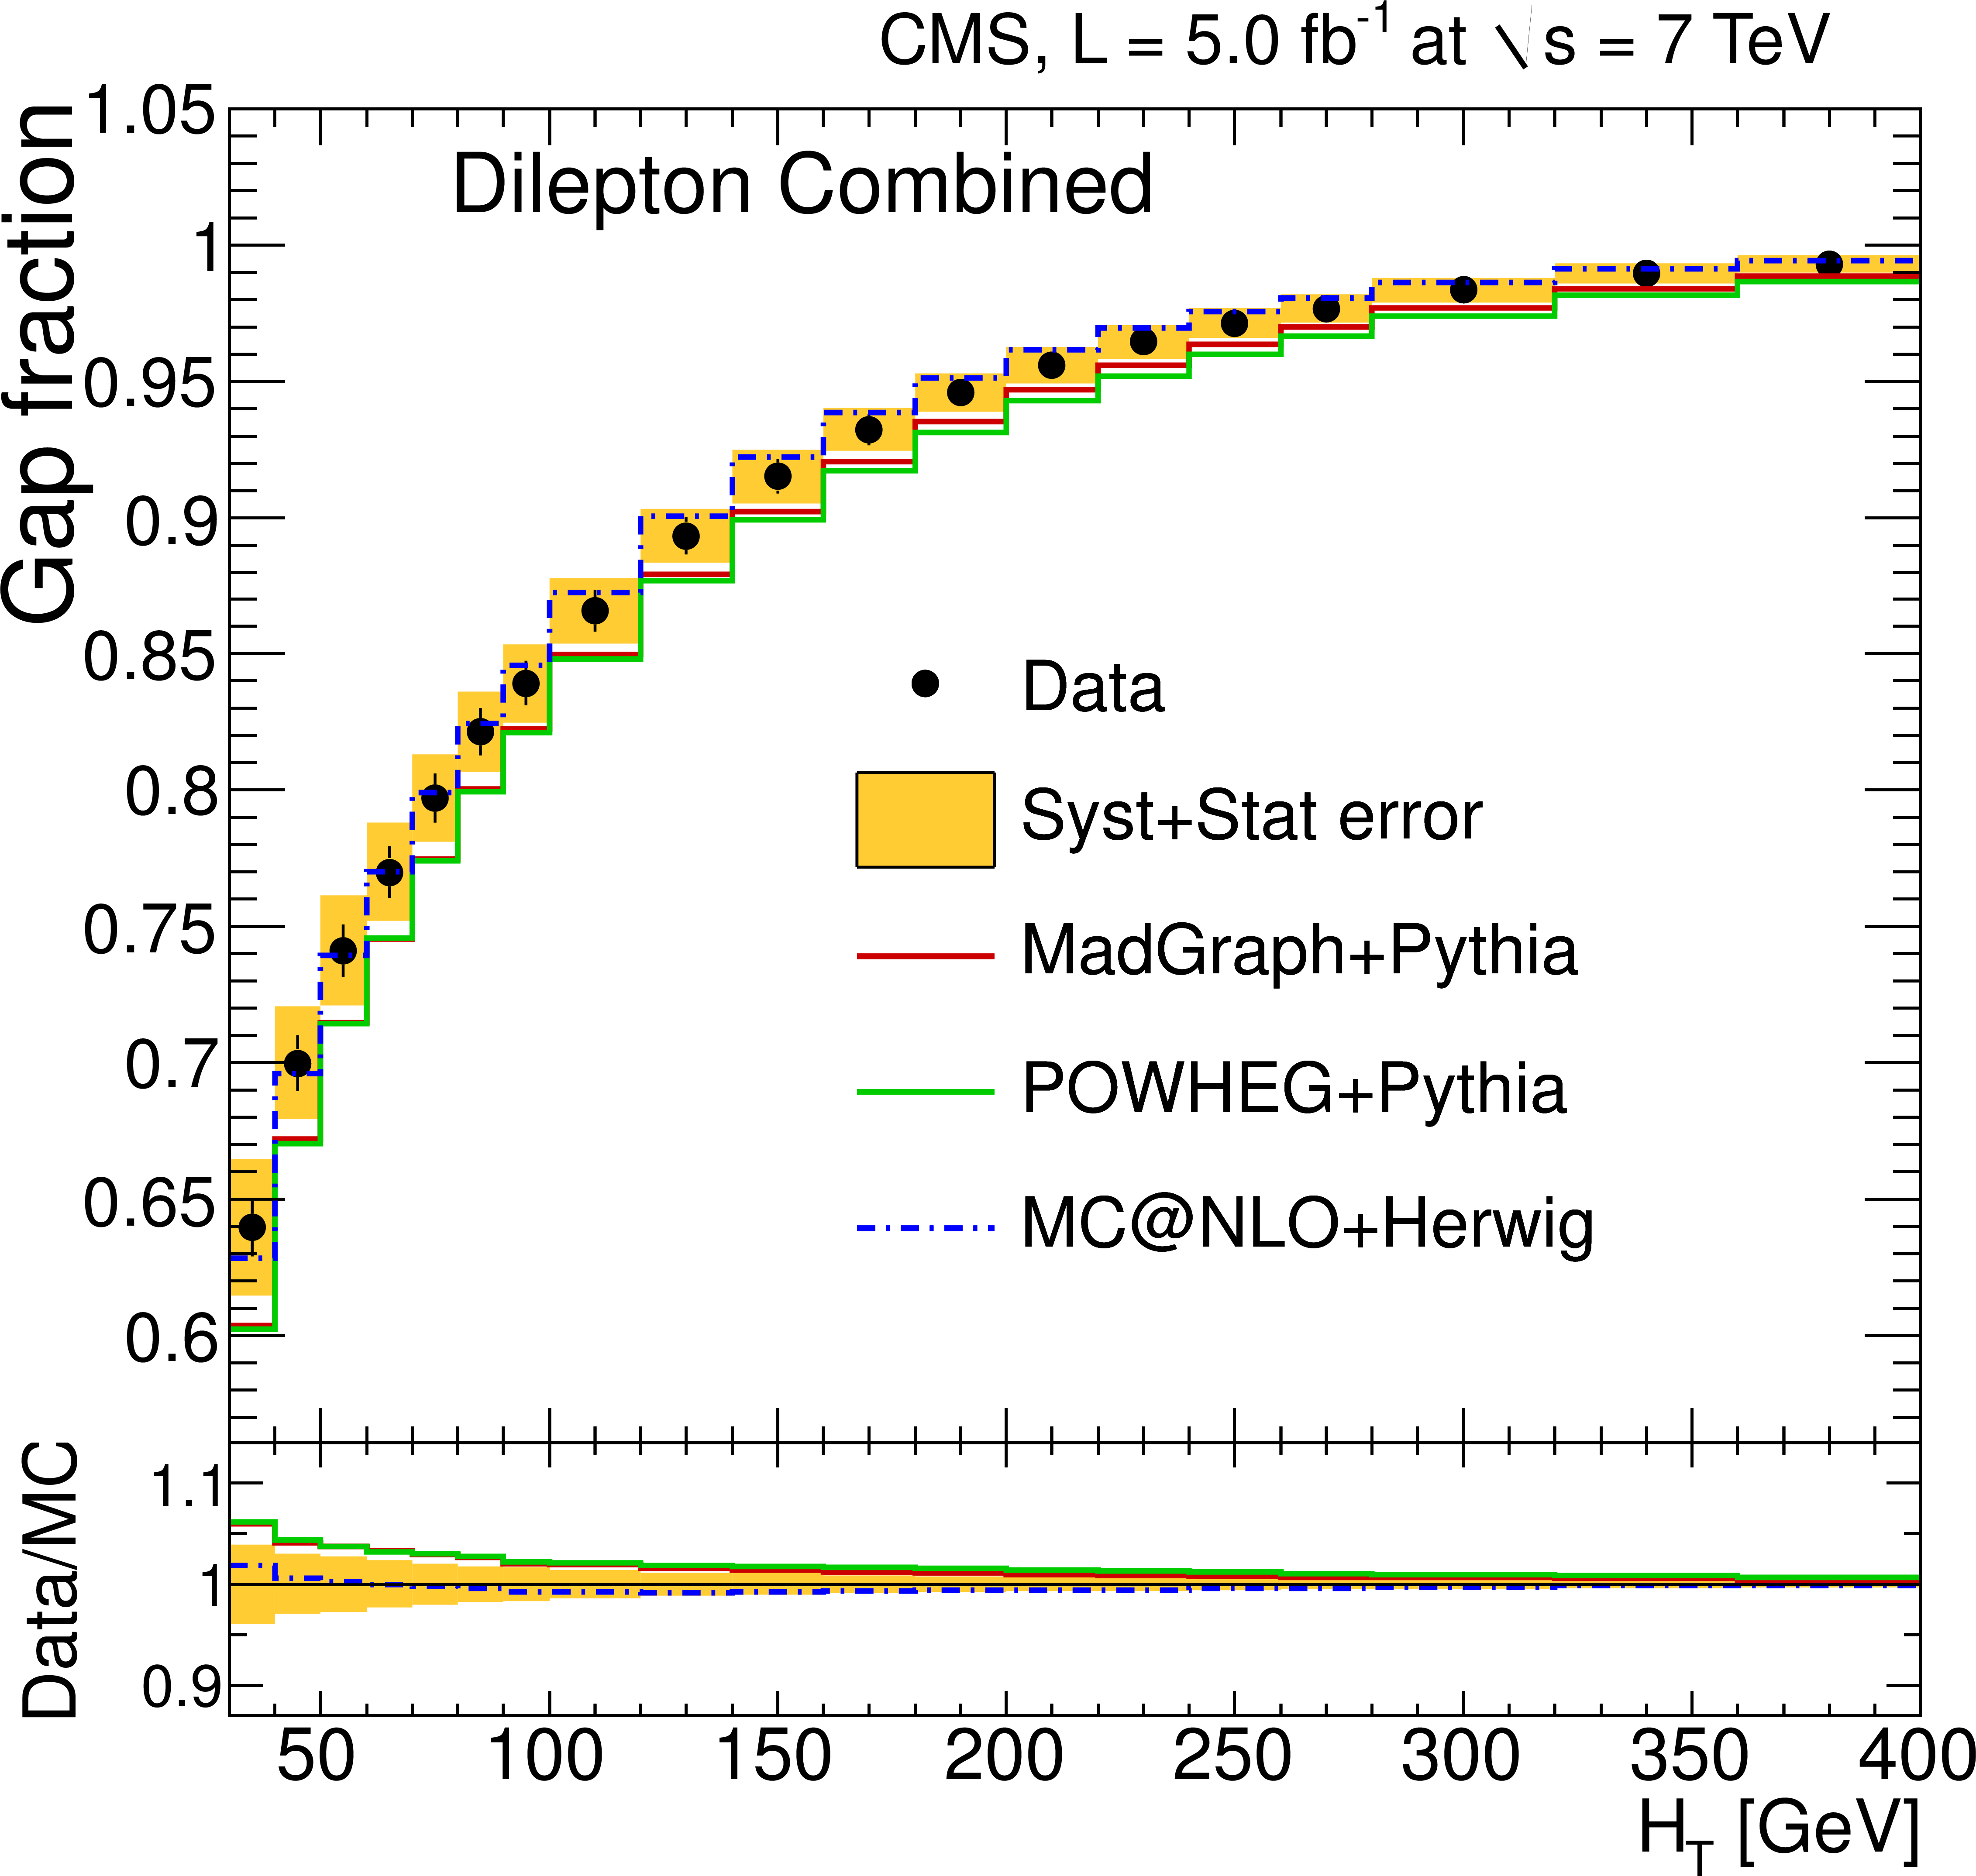
Figure 8-b:
Measured gap fraction as a function of the additional jet $ {p_{\mathrm {T}}} $ (a,c) and of $ {H_{\mathrm {T}}} = \sum { {p_{\mathrm {T}}} ^{\text {add. jets}}}$ (b,d) in the dilepton channels. Data are compared to predictions from MadGraph+PYTHIA, POWHEG+PYTHIA, and MCatNLO+HERWIG (a,b), as well as from MadGraph with varied renormalisation and factorisation scales, and jet-parton matching threshold (c,d). The error bars on the data points indicate the statistical uncertainty. The shaded band corresponds to the combined statistical and total systematic uncertainty (added in quadrature). |

png pdf |
Figure 8-c:
Measured gap fraction as a function of the additional jet $ {p_{\mathrm {T}}} $ (a,c) and of $ {H_{\mathrm {T}}} = \sum { {p_{\mathrm {T}}} ^{\text {add. jets}}}$ (b,d) in the dilepton channels. Data are compared to predictions from MadGraph+PYTHIA, POWHEG+PYTHIA, and MCatNLO+HERWIG (a,b), as well as from MadGraph with varied renormalisation and factorisation scales, and jet-parton matching threshold (c,d). The error bars on the data points indicate the statistical uncertainty. The shaded band corresponds to the combined statistical and total systematic uncertainty (added in quadrature). |

png pdf |
Figure 8-d:
Measured gap fraction as a function of the additional jet $ {p_{\mathrm {T}}} $ (a,c) and of $ {H_{\mathrm {T}}} = \sum { {p_{\mathrm {T}}} ^{\text {add. jets}}}$ (b,d) in the dilepton channels. Data are compared to predictions from MadGraph+PYTHIA, POWHEG+PYTHIA, and MCatNLO+HERWIG (a,b), as well as from MadGraph with varied renormalisation and factorisation scales, and jet-parton matching threshold (c,d). The error bars on the data points indicate the statistical uncertainty. The shaded band corresponds to the combined statistical and total systematic uncertainty (added in quadrature). |
|
|
Compact Muon Solenoid LHC, CERN |
|

|

|

|

|

|