

Compact Muon Solenoid
LHC, CERN
| CMS-TOP-12-020 ; CERN-PH-EP-2014-242 | ||
| Measurement of the W boson helicity in events with a single reconstructed top quark in pp collisions at $\sqrt{s}$ = 8 TeV | ||
| CMS Collaboration | ||
| 5 October 2014 | ||
| J. High Energy Phys. 01 (2015) 053 | ||
| Abstract: A measurement of the W boson helicity is presented, where the W boson originates from the decay of a top quark produced in pp collisions. The event selection, optimized for reconstructing a single top quark in the final state, requires exactly one isolated lepton (muon or electron) and exactly two jets, one of which is likely to originate from the hadronization of a bottom quark. The analysis is performed using data recorded at a center-of-mass energy of 8 TeV with the CMS detector at the CERN LHC in 2012. The data sample corresponds to an integrated luminosity of 19.7 fb$^{-1}$. The measured helicity fractions are $F_L = 0.298 \pm 0.028 \mathrm{(stat)} \pm 0.032 \mathrm{(syst)}$, $F_0 = 0.720 \pm 0.039 \mathrm{(stat)} \pm 0.037 \mathrm{(syst)}$, and $F_R = - 0.018 \pm 0.019 \mathrm{(stat)} \pm 0.011 \mathrm{(syst)}$. These results are used to set limits on the real part of the tWb anomalous couplings, $g_L$ and $g_R$. | ||
| Links: e-print arXiv:1410.1154 [hep-ex] (PDF) ; CDS record ; inSPIRE record ; Public twiki page ; HepData record ; CADI line (restricted) ; | ||
| Figures | |
png pdf |
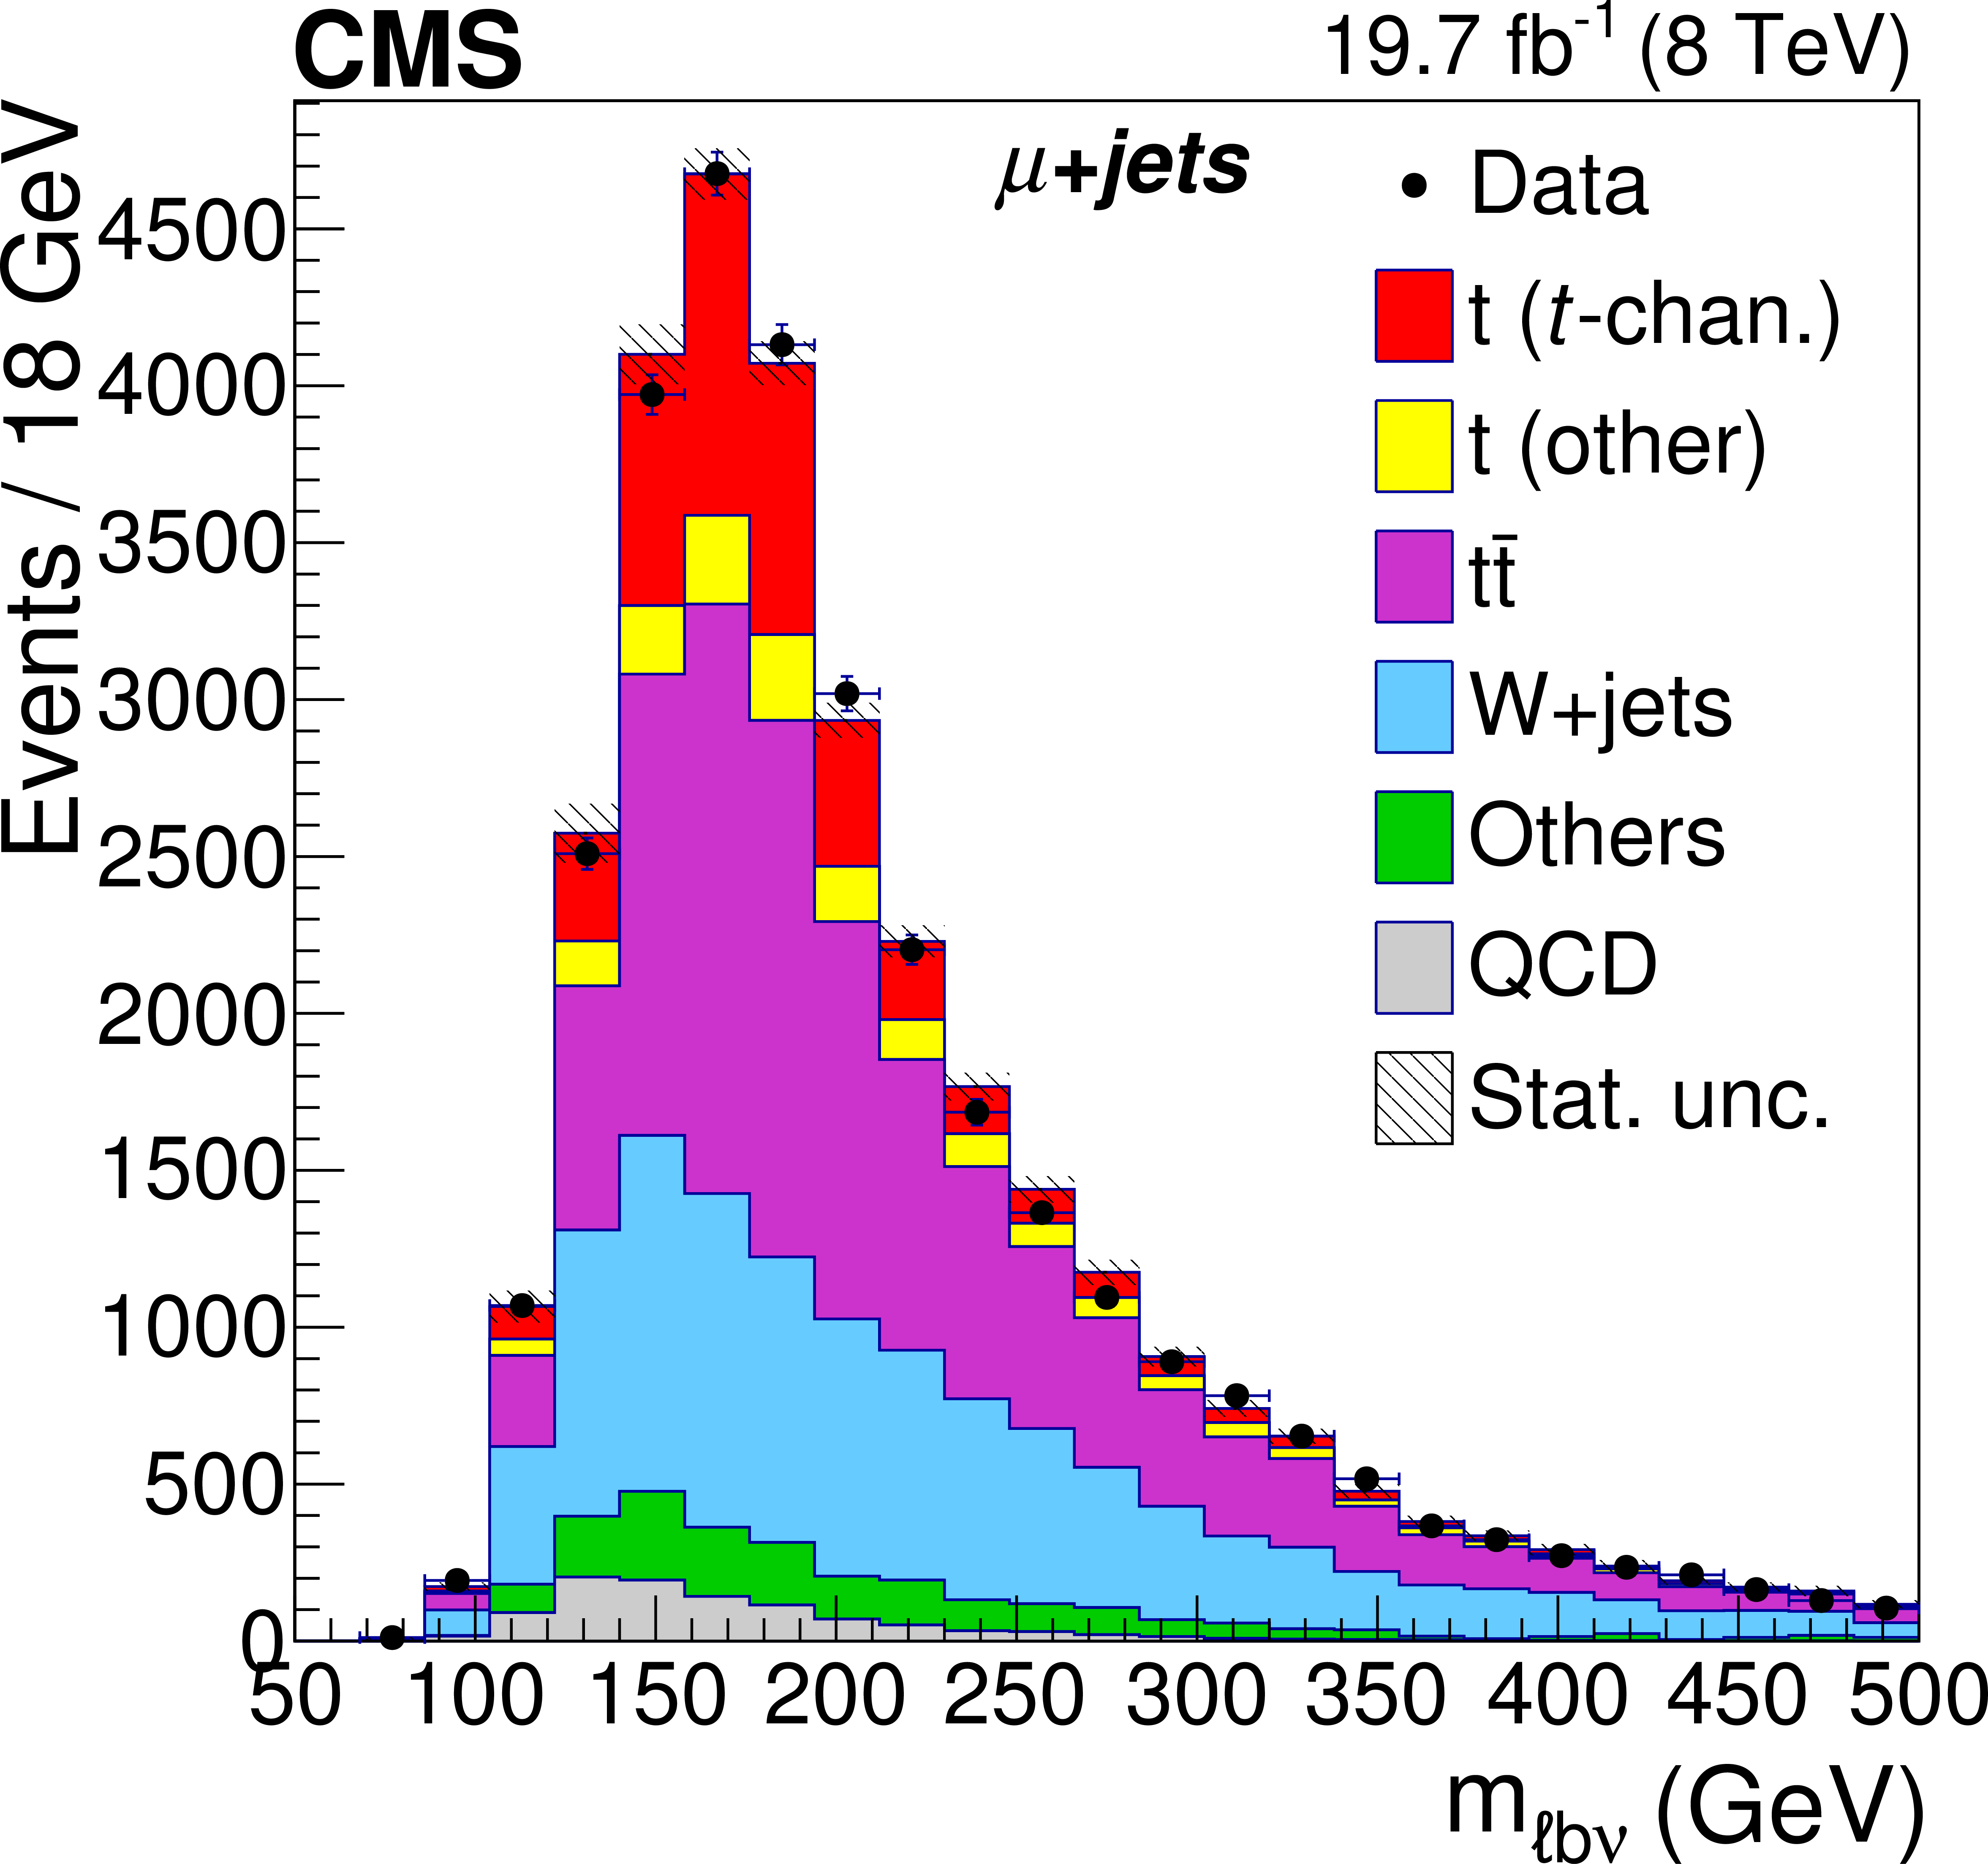
Figure 1-a:
The reconstructed top quark mass (upper left, upper right) and the reconstructed $ {\cos{\theta ^*_\ell }} $ distributions (lower left, lower right) for data and simulation in the muon (left) and the electron (right) decay channels. The normalization for simulated samples are corrected according to the single top quark cross section measurement in which the shape for QCD multijet events is obtained from data. |

png pdf |
Figure 1-b:
The reconstructed top quark mass (upper left, upper right) and the reconstructed $ {\cos{\theta ^*_\ell }} $ distributions (lower left, lower right) for data and simulation in the muon (left) and the electron (right) decay channels. The normalization for simulated samples are corrected according to the single top quark cross section measurement in which the shape for QCD multijet events is obtained from data. |
png pdf |
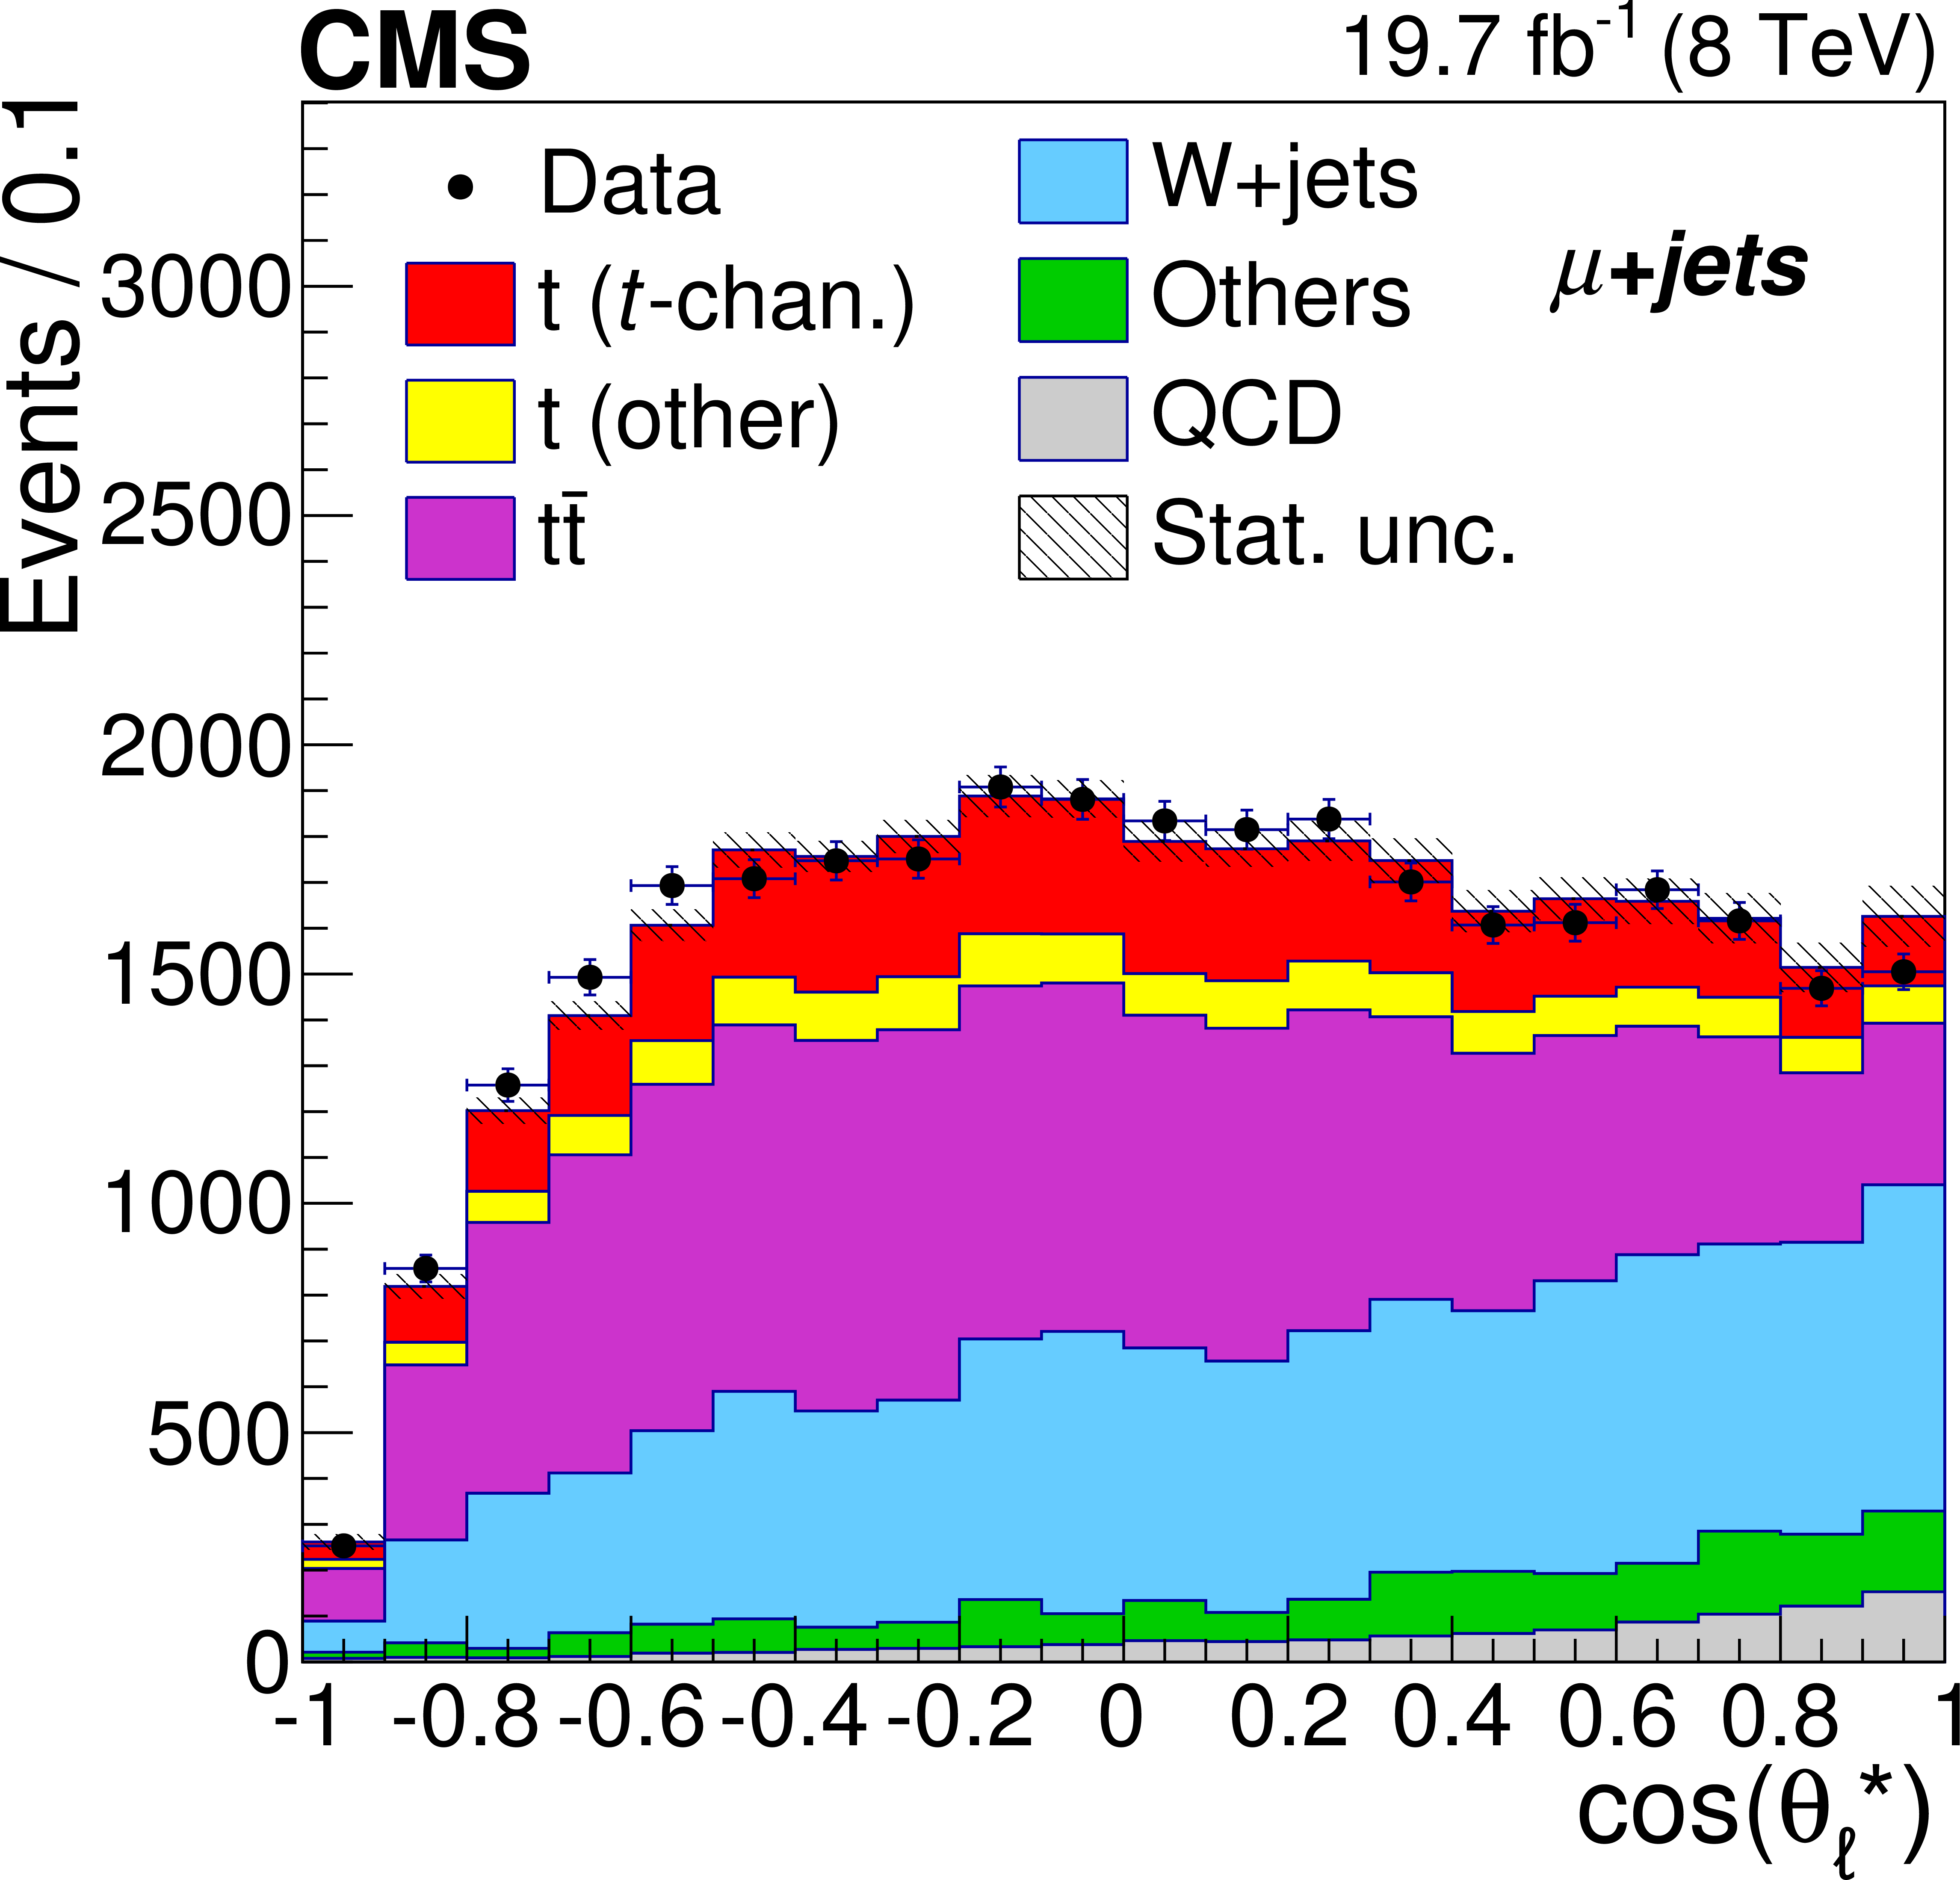
Figure 1-c:
The reconstructed top quark mass (upper left, upper right) and the reconstructed $ {\cos{\theta ^*_\ell }} $ distributions (lower left, lower right) for data and simulation in the muon (left) and the electron (right) decay channels. The normalization for simulated samples are corrected according to the single top quark cross section measurement in which the shape for QCD multijet events is obtained from data. |
png pdf |
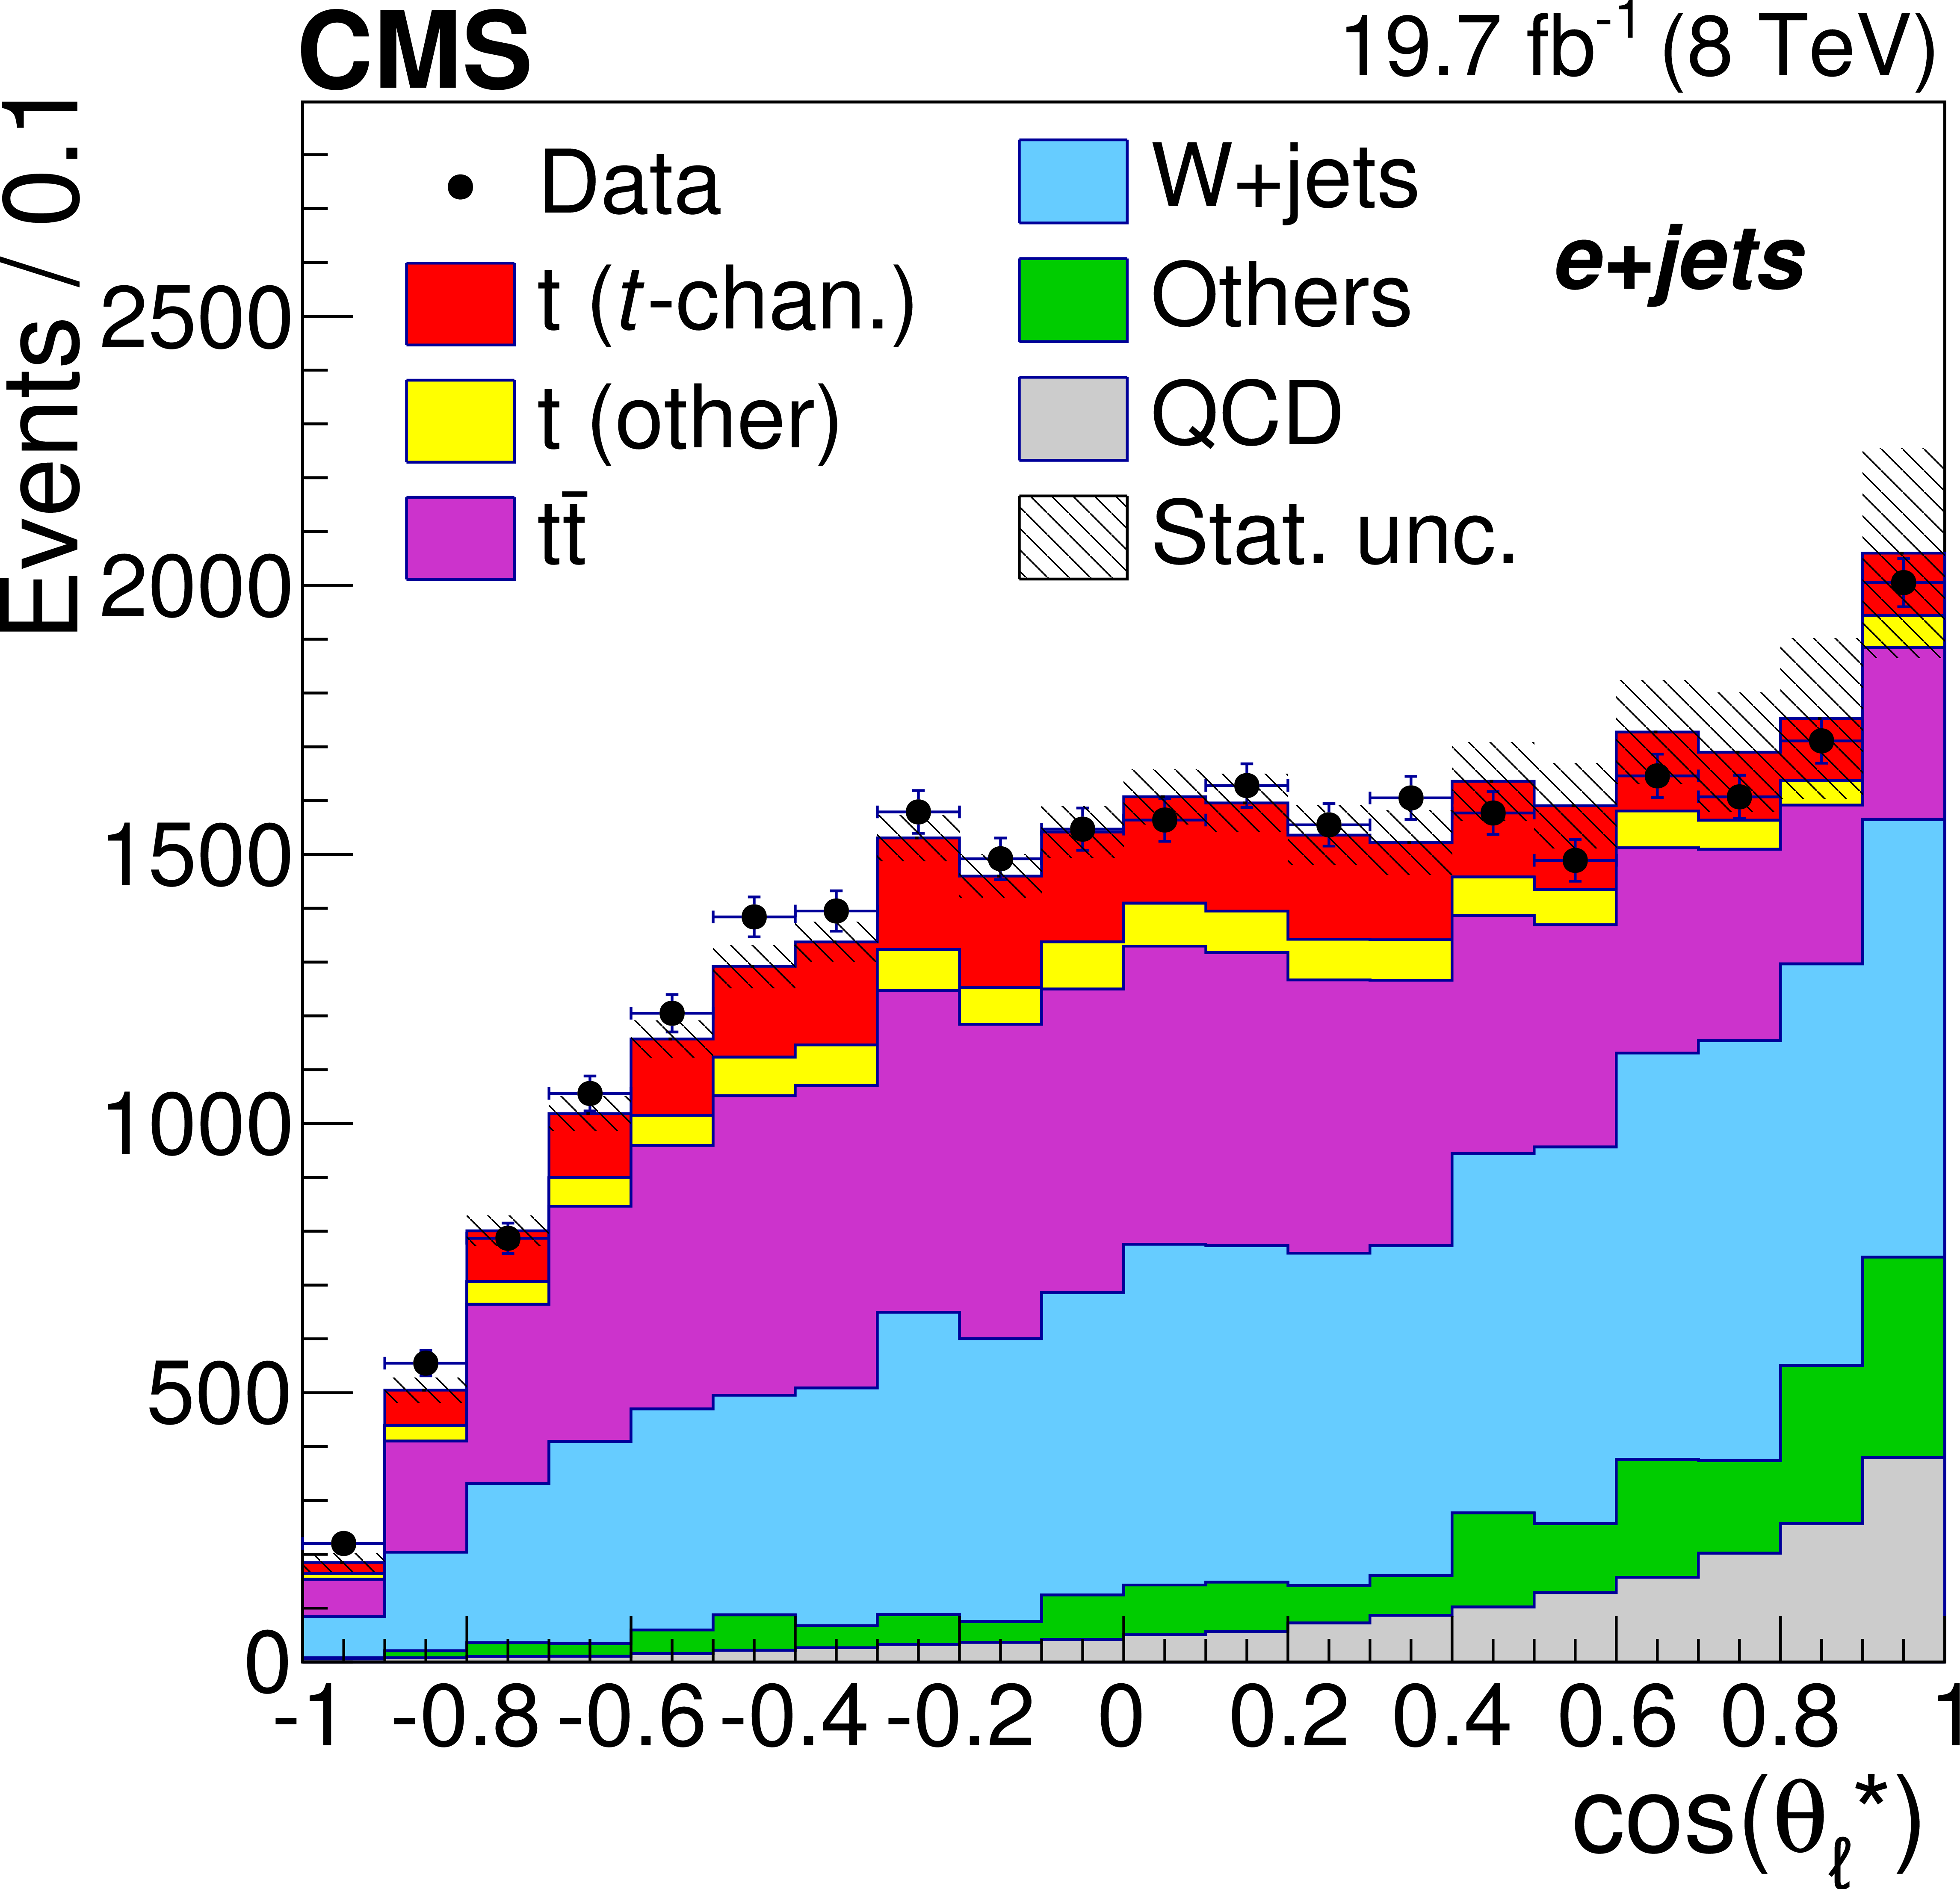
Figure 1-d:
The reconstructed top quark mass (upper left, upper right) and the reconstructed $ {\cos{\theta ^*_\ell }} $ distributions (lower left, lower right) for data and simulation in the muon (left) and the electron (right) decay channels. The normalization for simulated samples are corrected according to the single top quark cross section measurement in which the shape for QCD multijet events is obtained from data. |
png pdf |
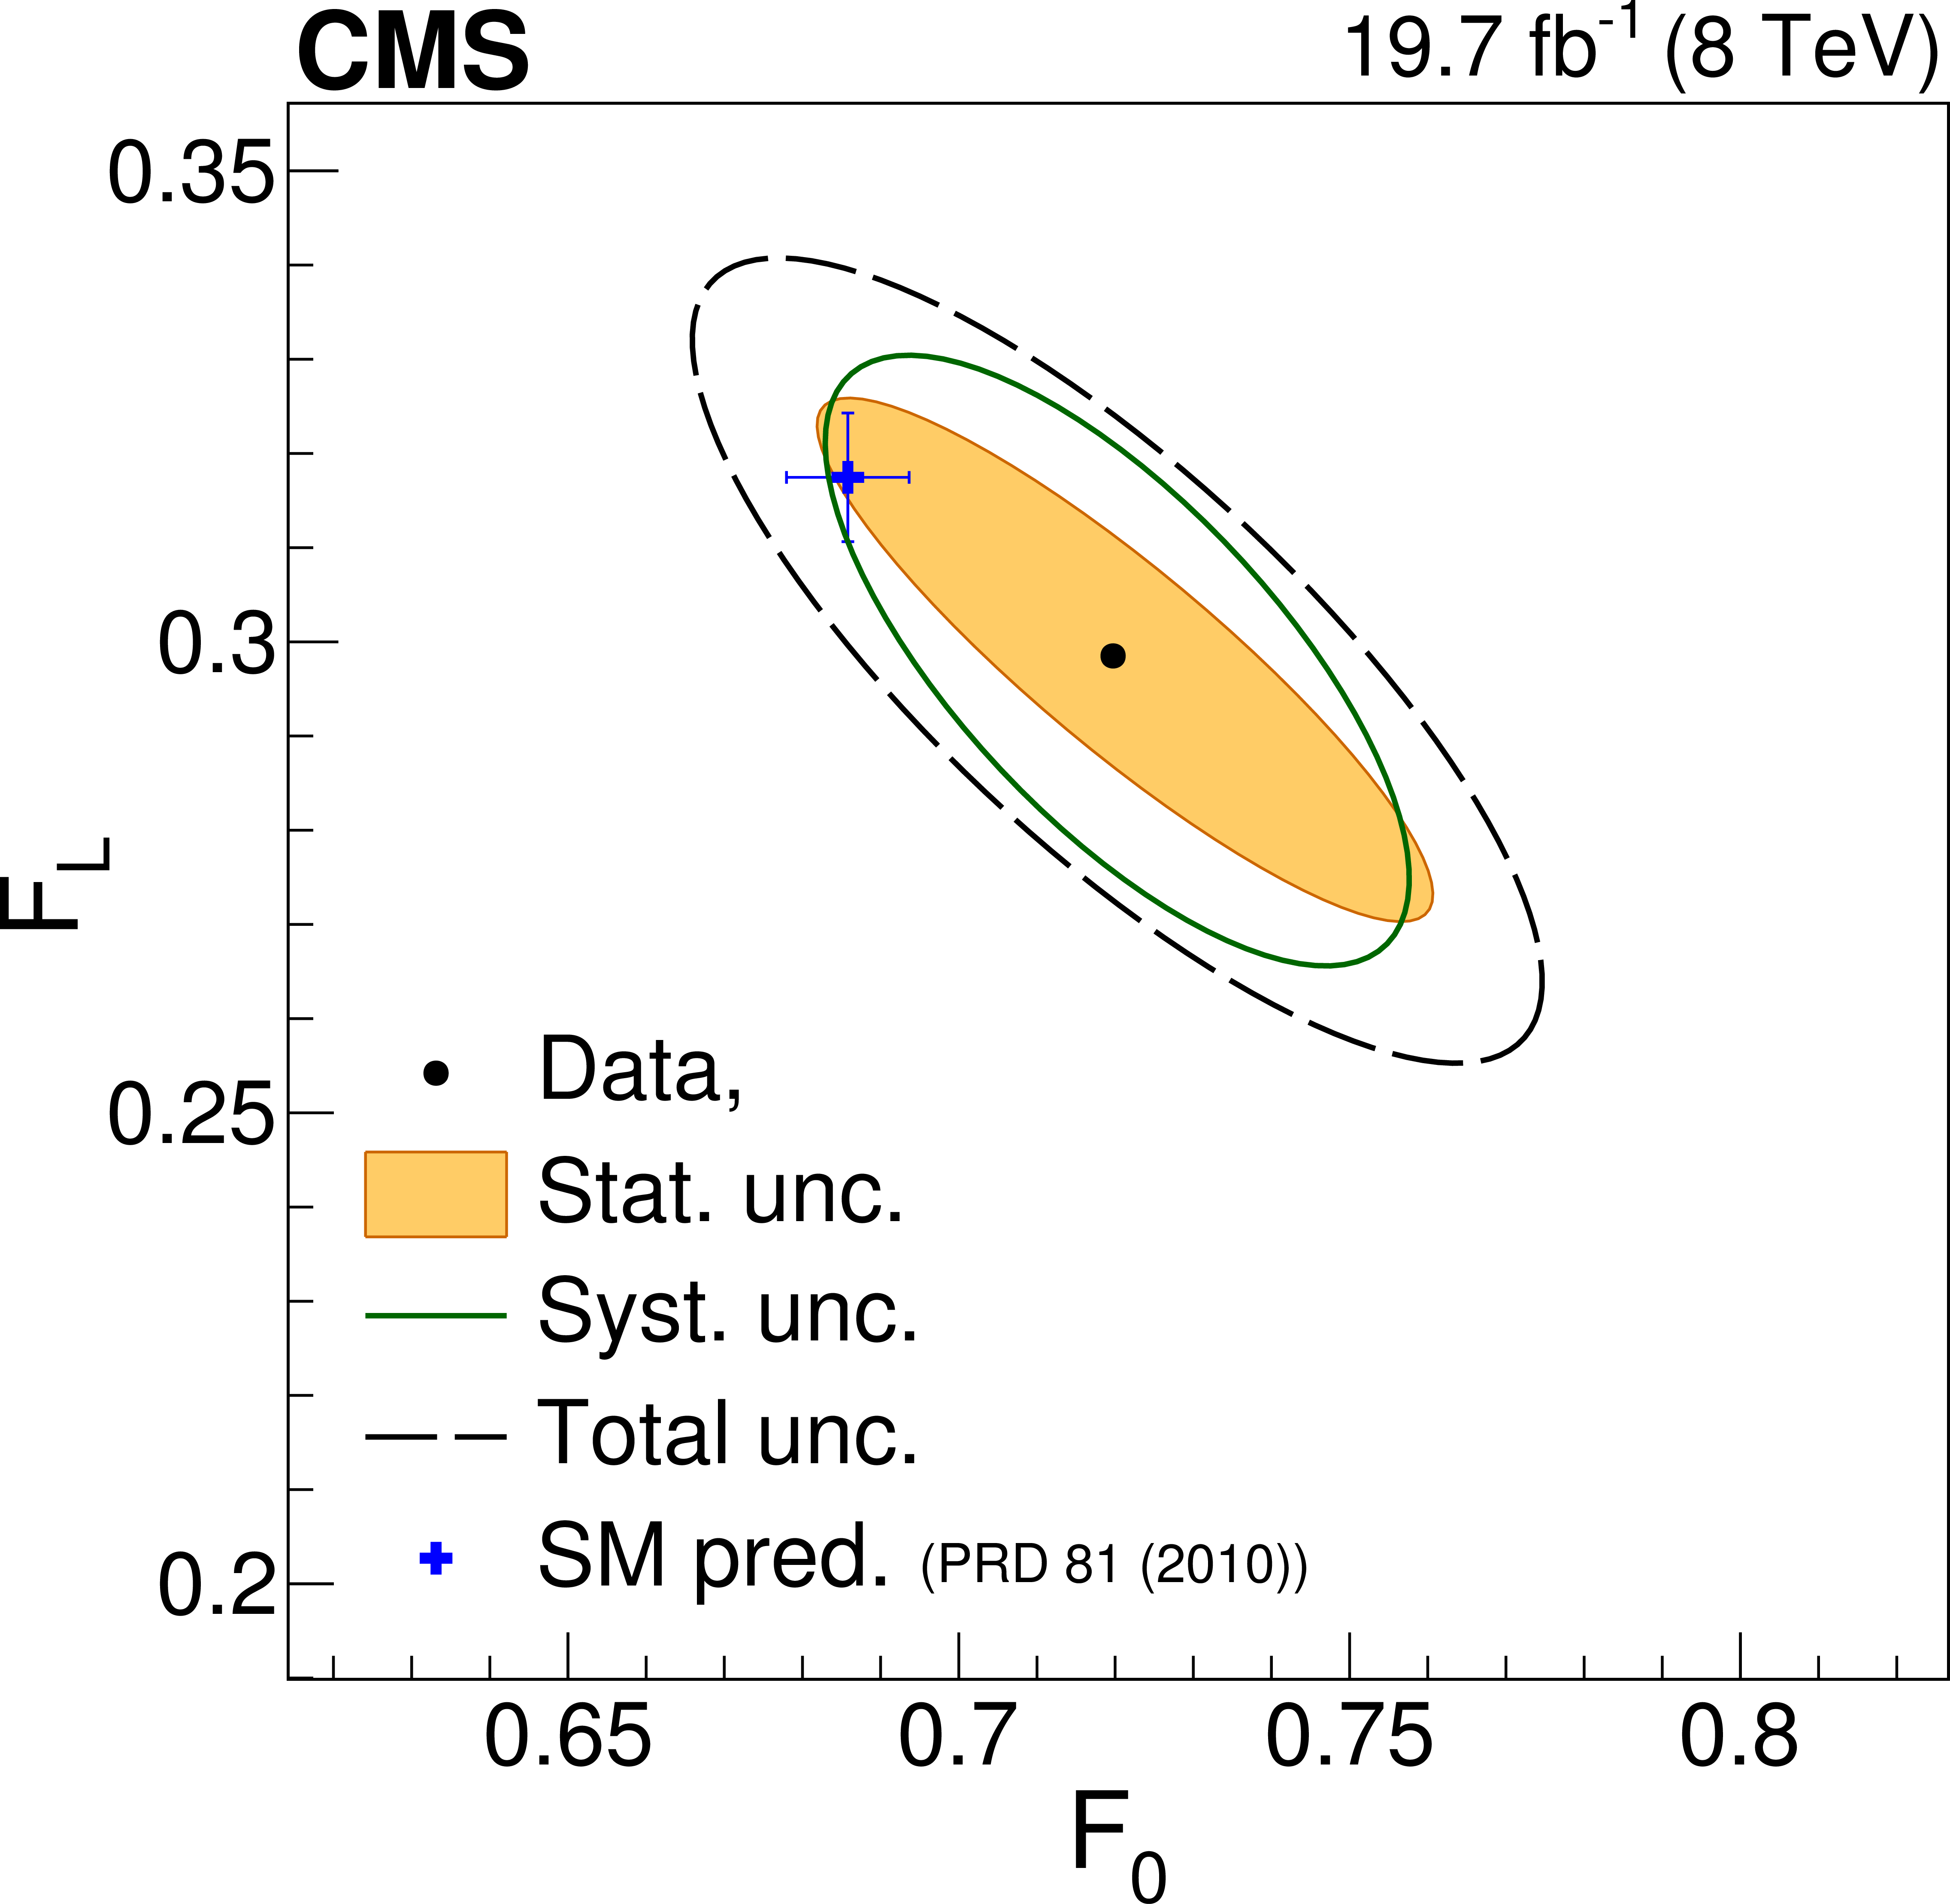
Figure 2:
Combined results from the muon+jets and electron+jets events for the left-handed and longitudinal W boson helicity fractions, shown as 68% contours for statistical, systematic, and total uncertainties, compared with the SM predictions. |
png pdf |
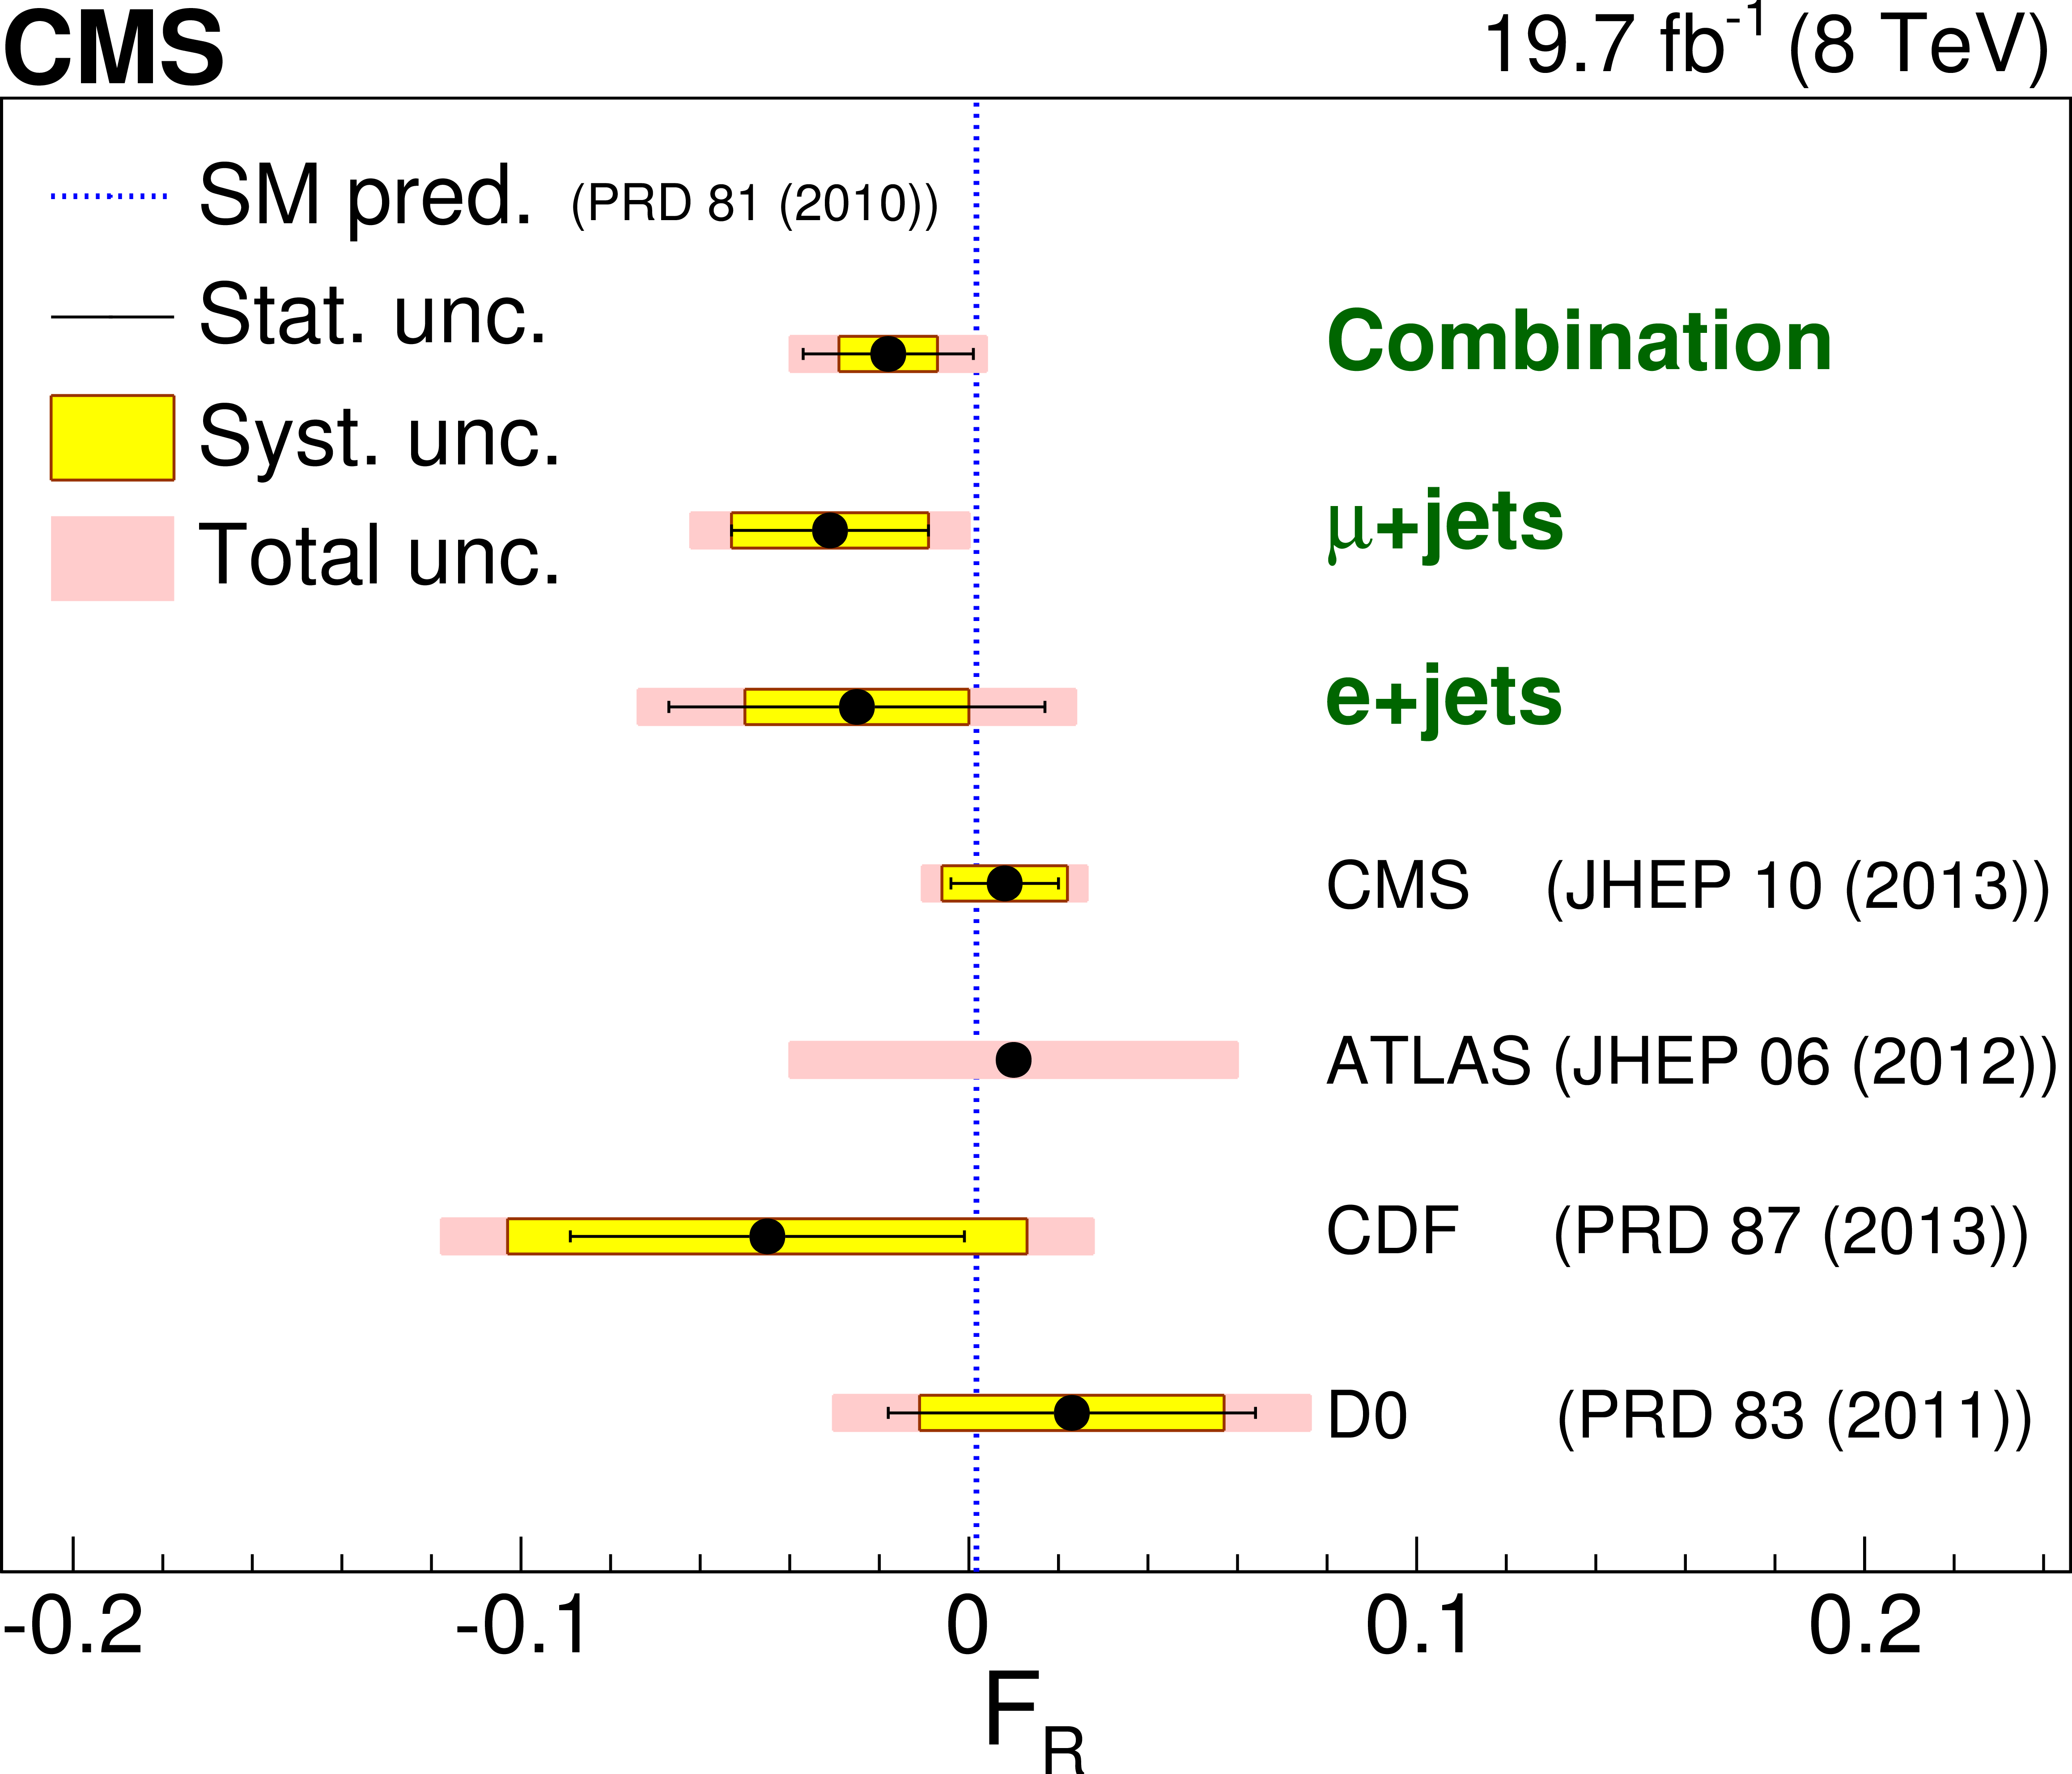
Figure 3:
The right-handed helicity fraction of the $ {\mathrm {W}}$ boson from the top quark decay. The results from this analysis (top three entries) are compared with the SM prediction and with the previous measurements, which are based on $ {\mathrm {t}\overline {\mathrm {t}}} $ events. |

png pdf |
Figure 4:
Exclusion limits on the real part of $ {g_{\mathrm{L}}} $ and $ {g_{\mathrm {R}}} $ anomalous couplings, with $ {V_{\mathrm {L}}} =$ 1 and $ {V_{\mathrm {R}} } = $ 0, using the combined W boson helicity measurement in the single top quark event topology. Dashed blue lines show $ {g_{\mathrm {L}}} =$ 0 and $ {g_{\mathrm {R}}} =$ 0 as predicted by the SM at tree level. |
|
|
Compact Muon Solenoid LHC, CERN |
|

|

|

|

|

|