

Compact Muon Solenoid
LHC, CERN
| CMS-TOP-12-033 ; CERN-PH-EP-2015-141 | ||
| Inclusive and differential measurements of the $\mathrm{ t \bar{t} }$ charge asymmetry in pp collisions at $ \sqrt{s} = $ 8 TeV | ||
| CMS Collaboration | ||
| 11 July 2015 | ||
| Phys. Lett. B 757 (2016) 154 | ||
| Abstract: The $\mathrm{ t \bar{t} }$ charge asymmetry is measured in proton-proton collisions at a centre-of-mass energy of 8 TeV. The data, collected with the CMS experiment at the LHC, correspond to an integrated luminosity of 19.7 fb$^{-1}$. Selected events contain an electron or a muon and four or more jets, where at least one jet is identified as originating from b-quark hadronization. The inclusive charge asymmetry is found to be 0.0010 $\pm$ 0.0068 (stat) $\pm$ 0.0037 (syst). In addition, differential charge asymmetries as a function of rapidity, transverse momentum, and invariant mass of the $\mathrm{ t \bar{t} }$ system are studied. For the first time at the LHC, the measurements are also performed in a reduced fiducial phase space of top quark pair production, with an integrated result of --0.0035 $\pm$ 0.0072 (stat) $\pm$ 0.0031(syst). All measurements are consistent within two standard deviations with zero asymmetry as well as with the predictions of the standard model. | ||
| Links: e-print arXiv:1507.03119 [hep-ex] (PDF) ; CDS record ; inSPIRE record ; HepData record ; CADI line (restricted) ; | ||
| Figures | |
png pdf |
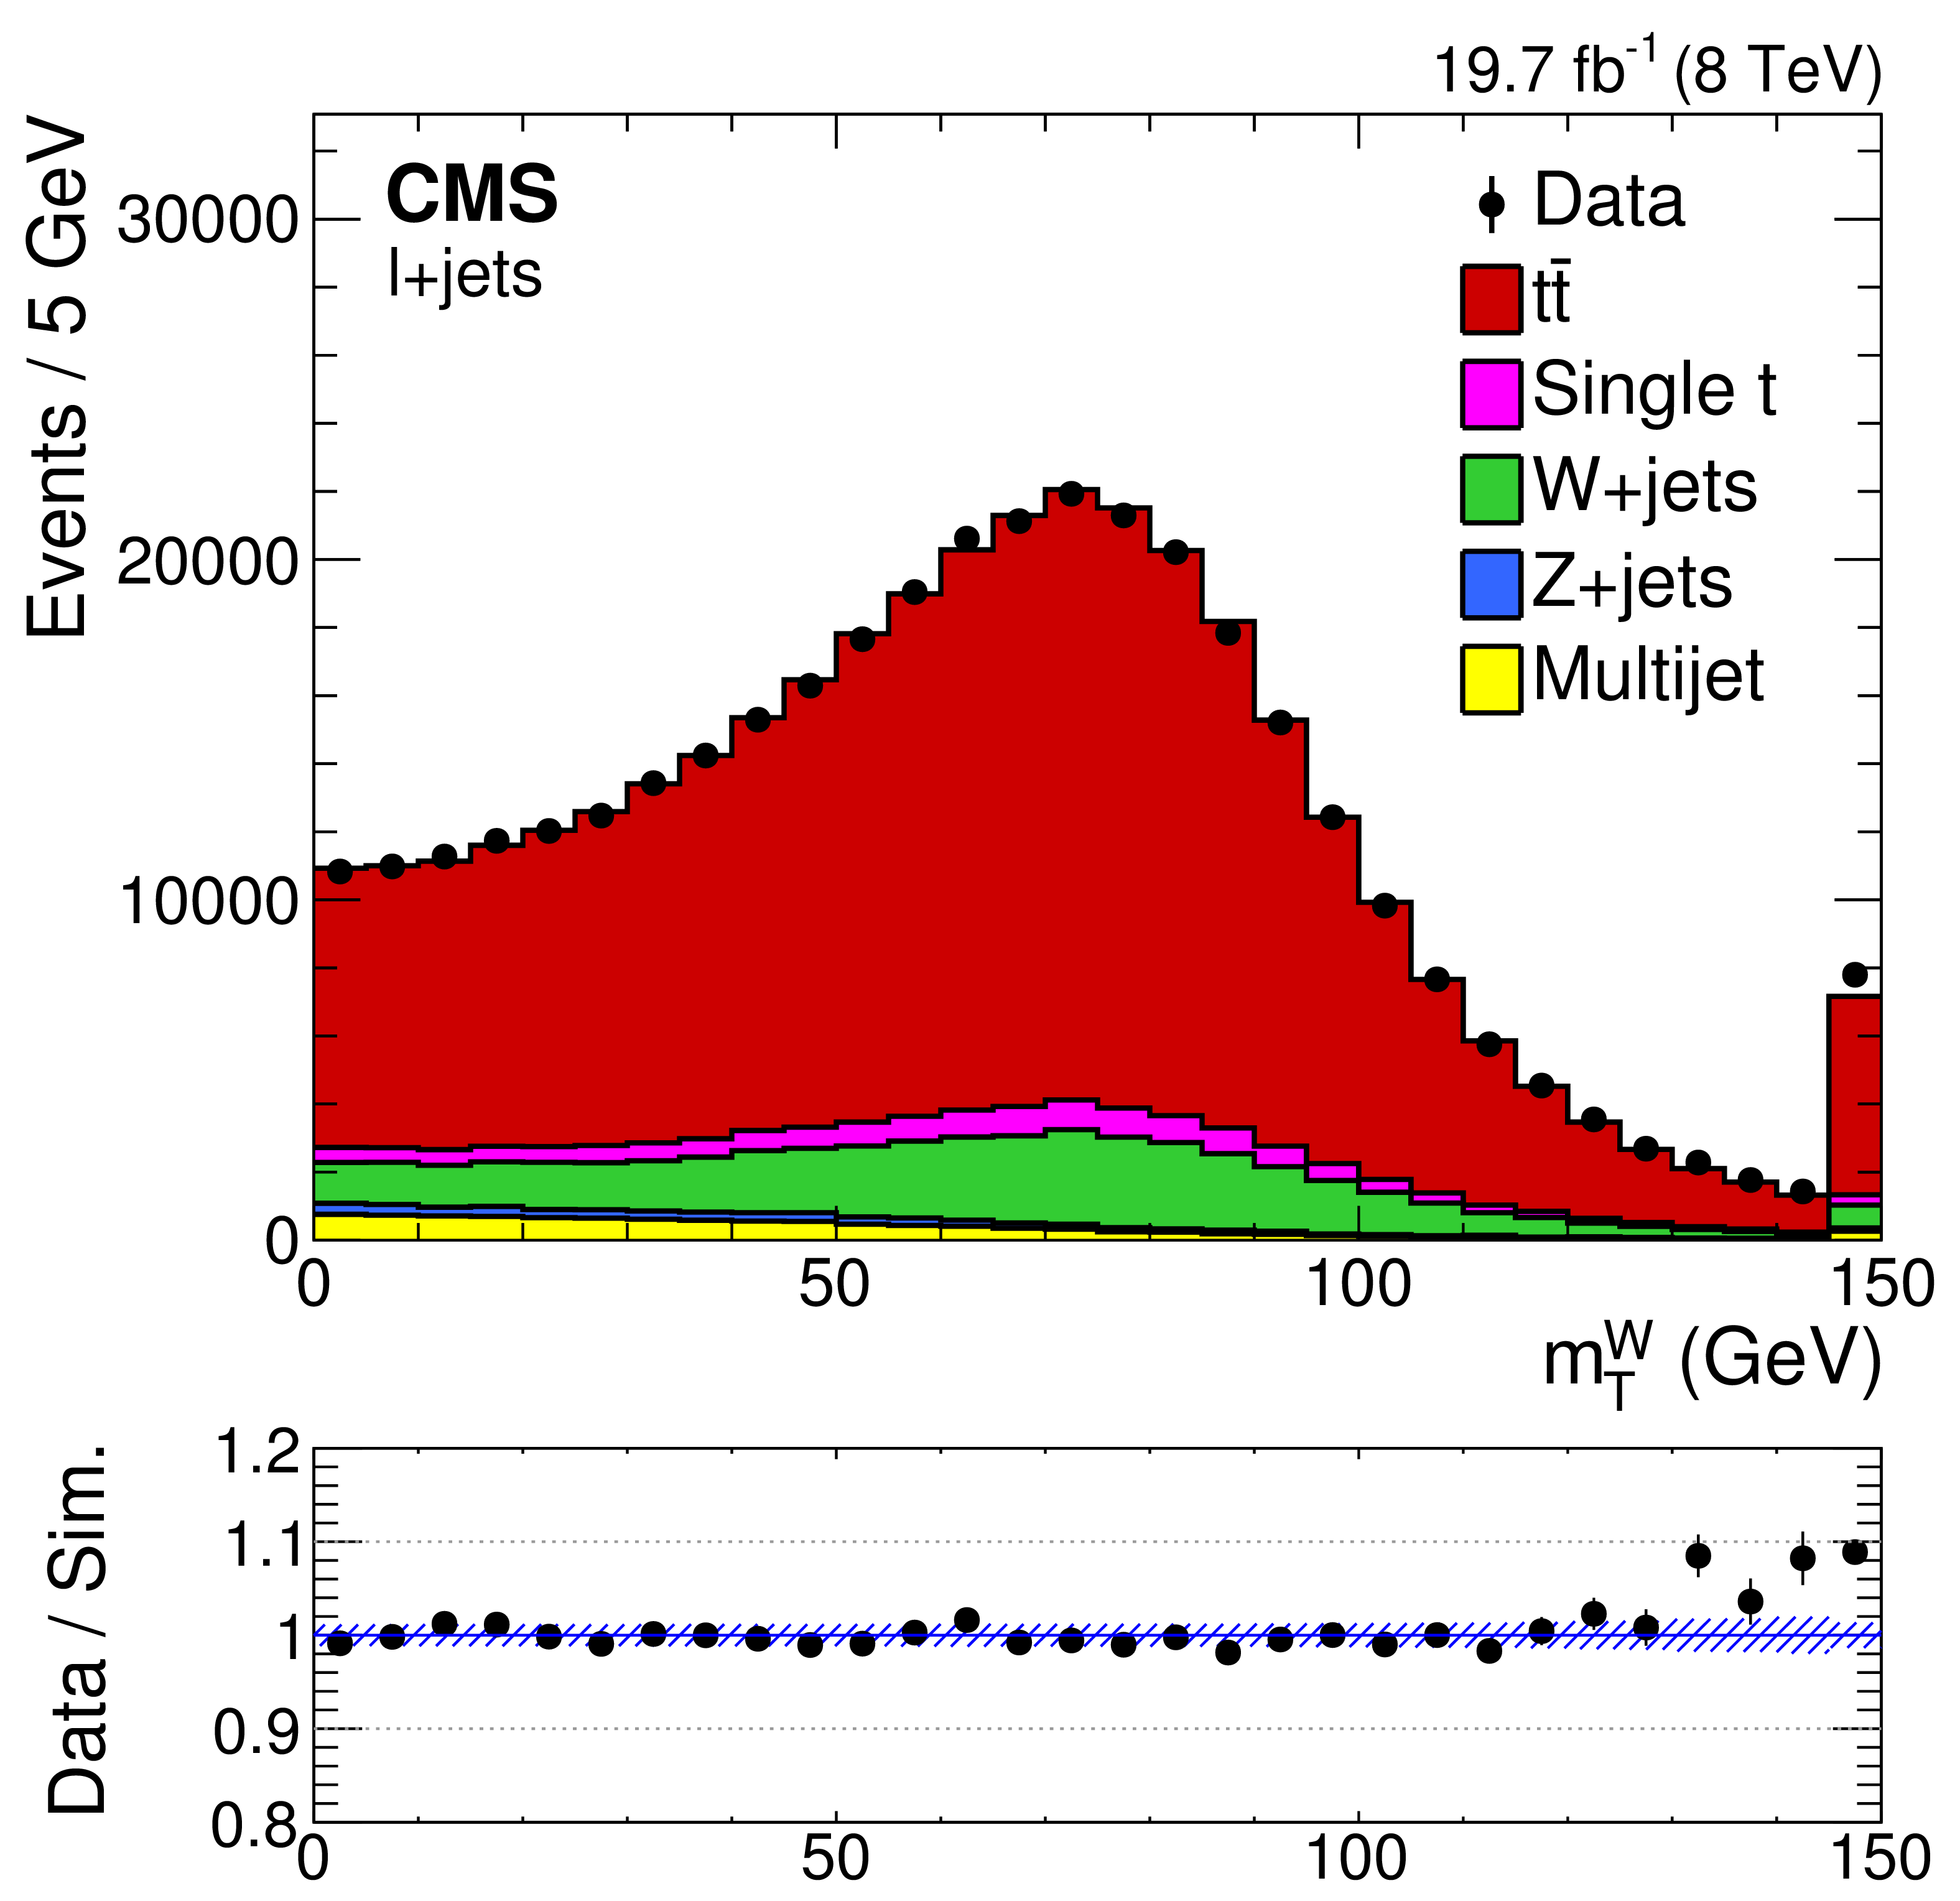
Figure 1-a:
Comparison of the combined lepton+jets data with simulated contributions for the distributions in $m_\mathrm {T}^\mathrm{ W } $ and $M_3$. The simulated signal and background contributions are normalized to the results of the fits in Table 1. The last bin in each histogram includes the overflow values. Additionally, the ratio of the data to the sum of the simulated contributions is shown, with the statistical uncertainties of the simulated contributions (including the uncertainties in the fit) indicated by the blue hatched region. |
png pdf |
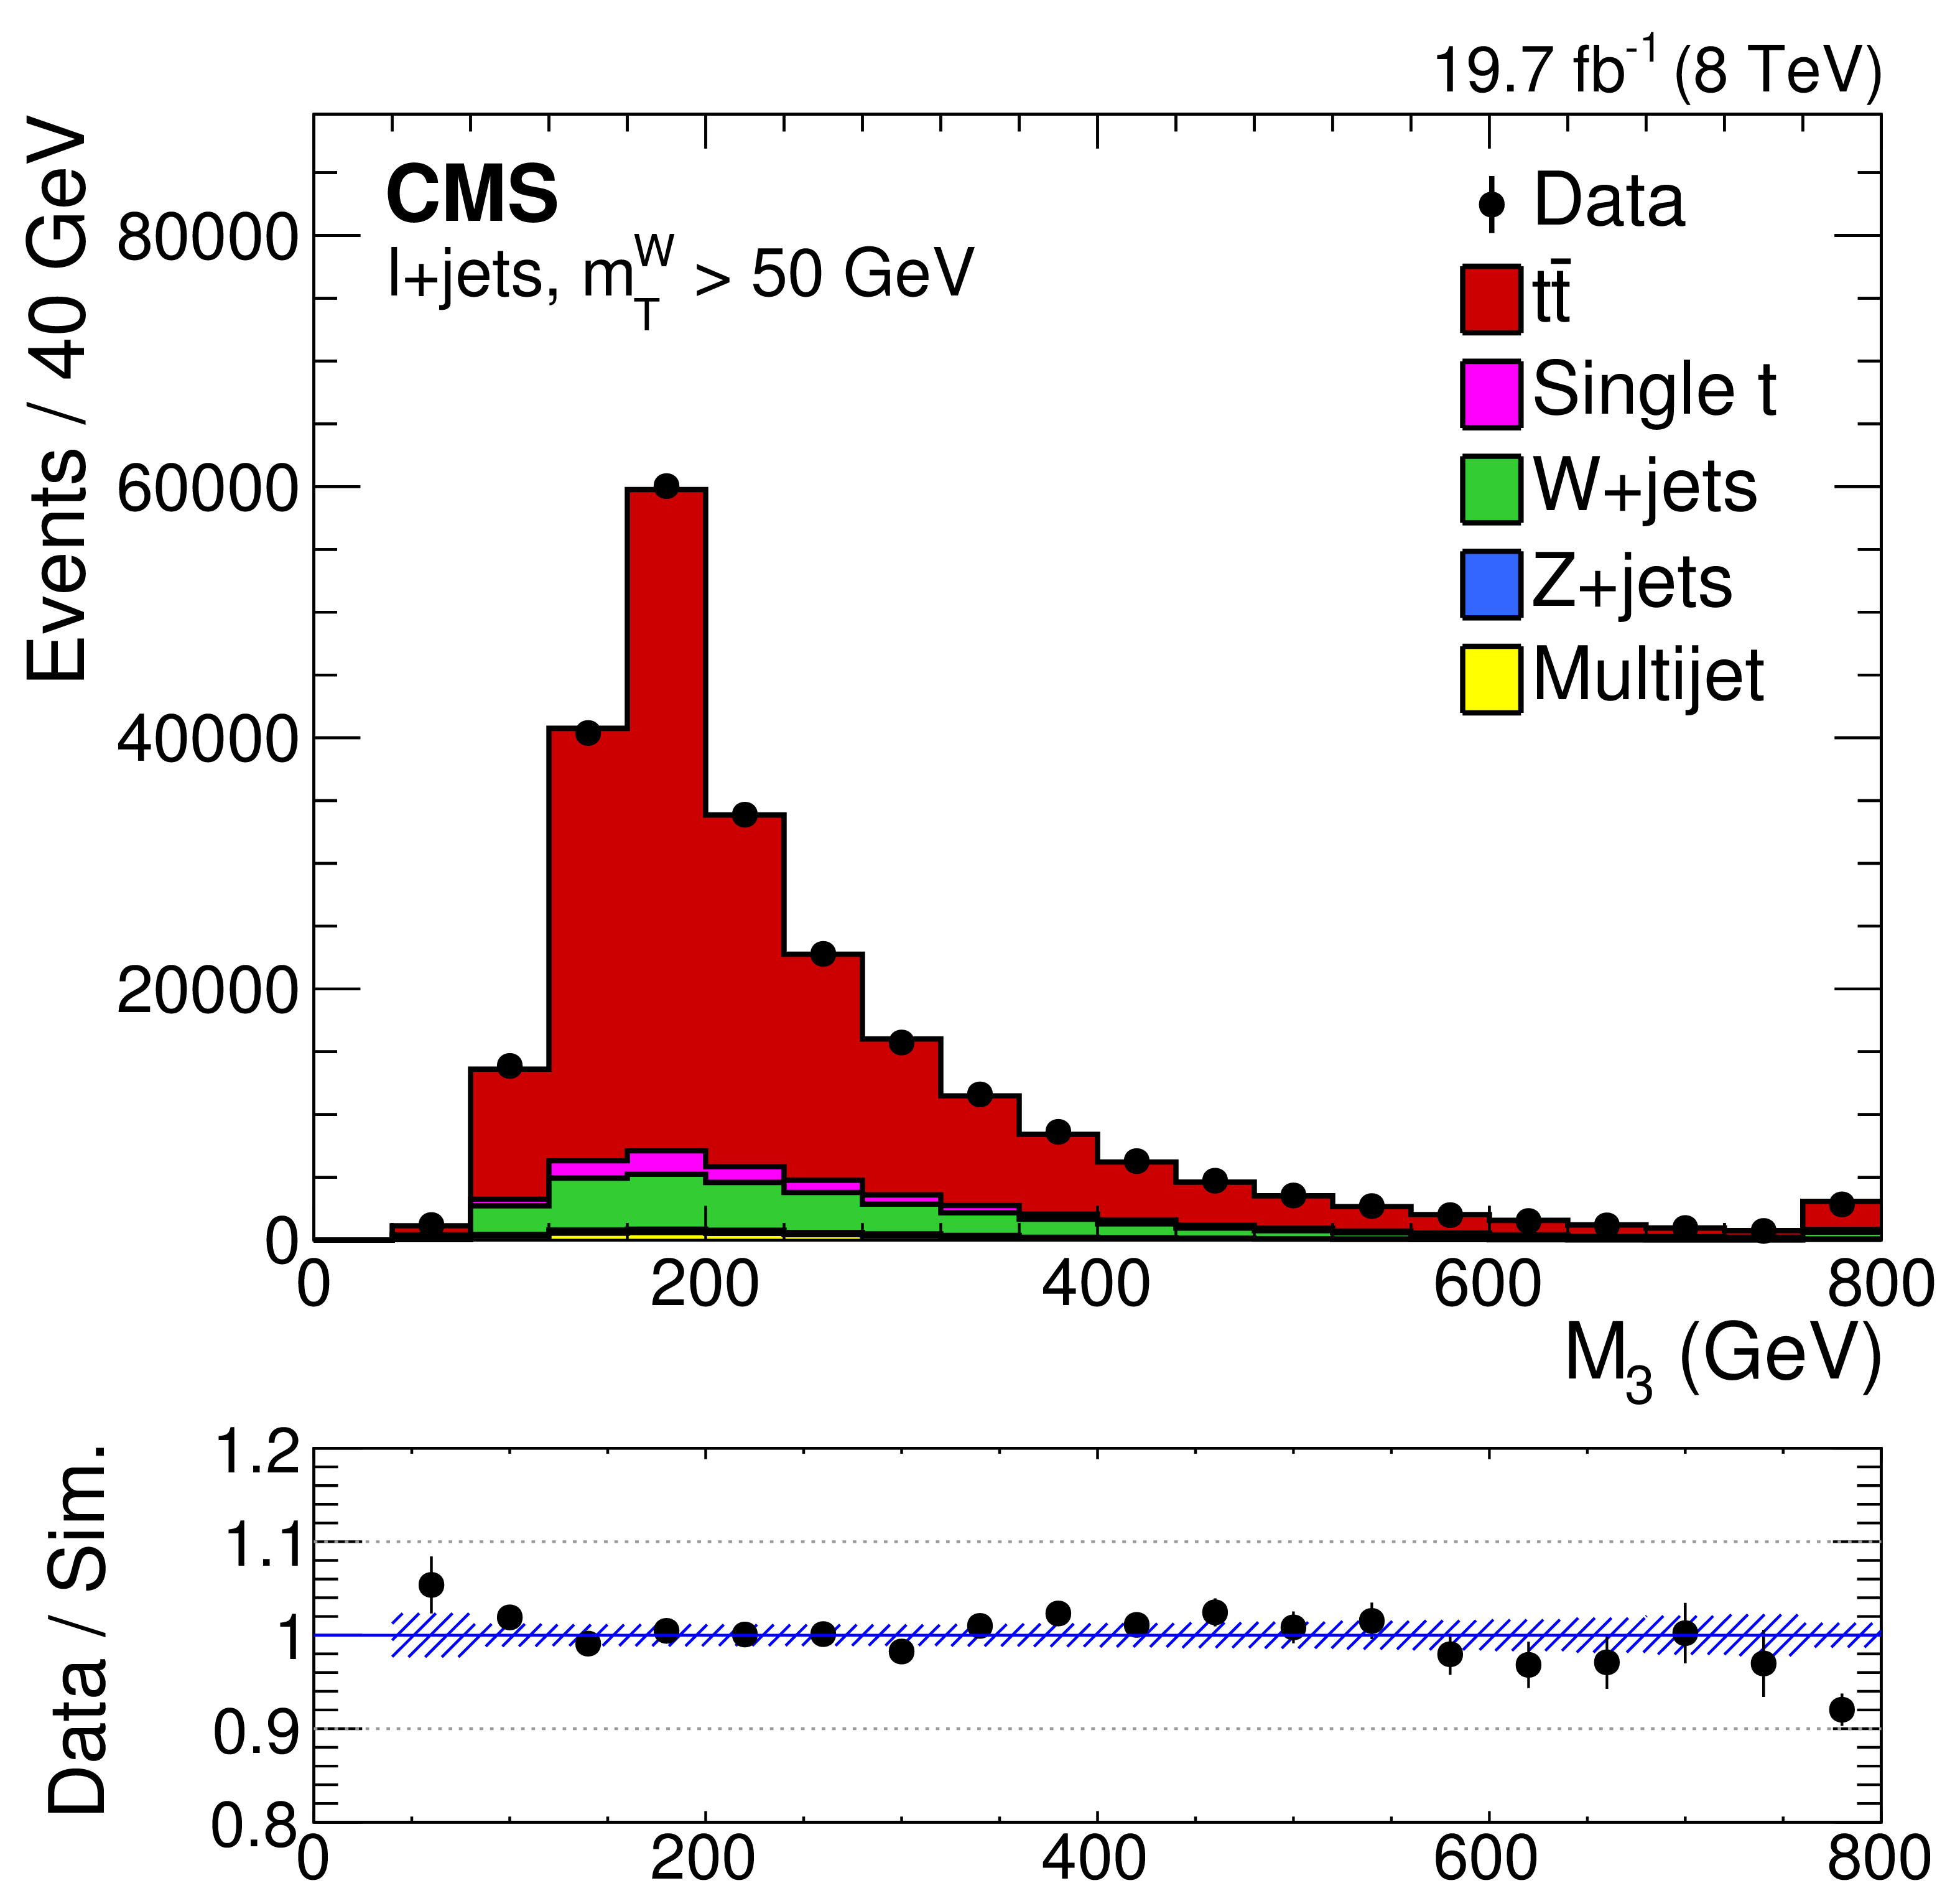
Figure 1-b:
Comparison of the combined lepton+jets data with simulated contributions for the distributions in $m_\mathrm {T}^\mathrm{ W } $ and $M_3$. The simulated signal and background contributions are normalized to the results of the fits in Table 1. The last bin in each histogram includes the overflow values. Additionally, the ratio of the data to the sum of the simulated contributions is shown, with the statistical uncertainties of the simulated contributions (including the uncertainties in the fit) indicated by the blue hatched region. |
png pdf |
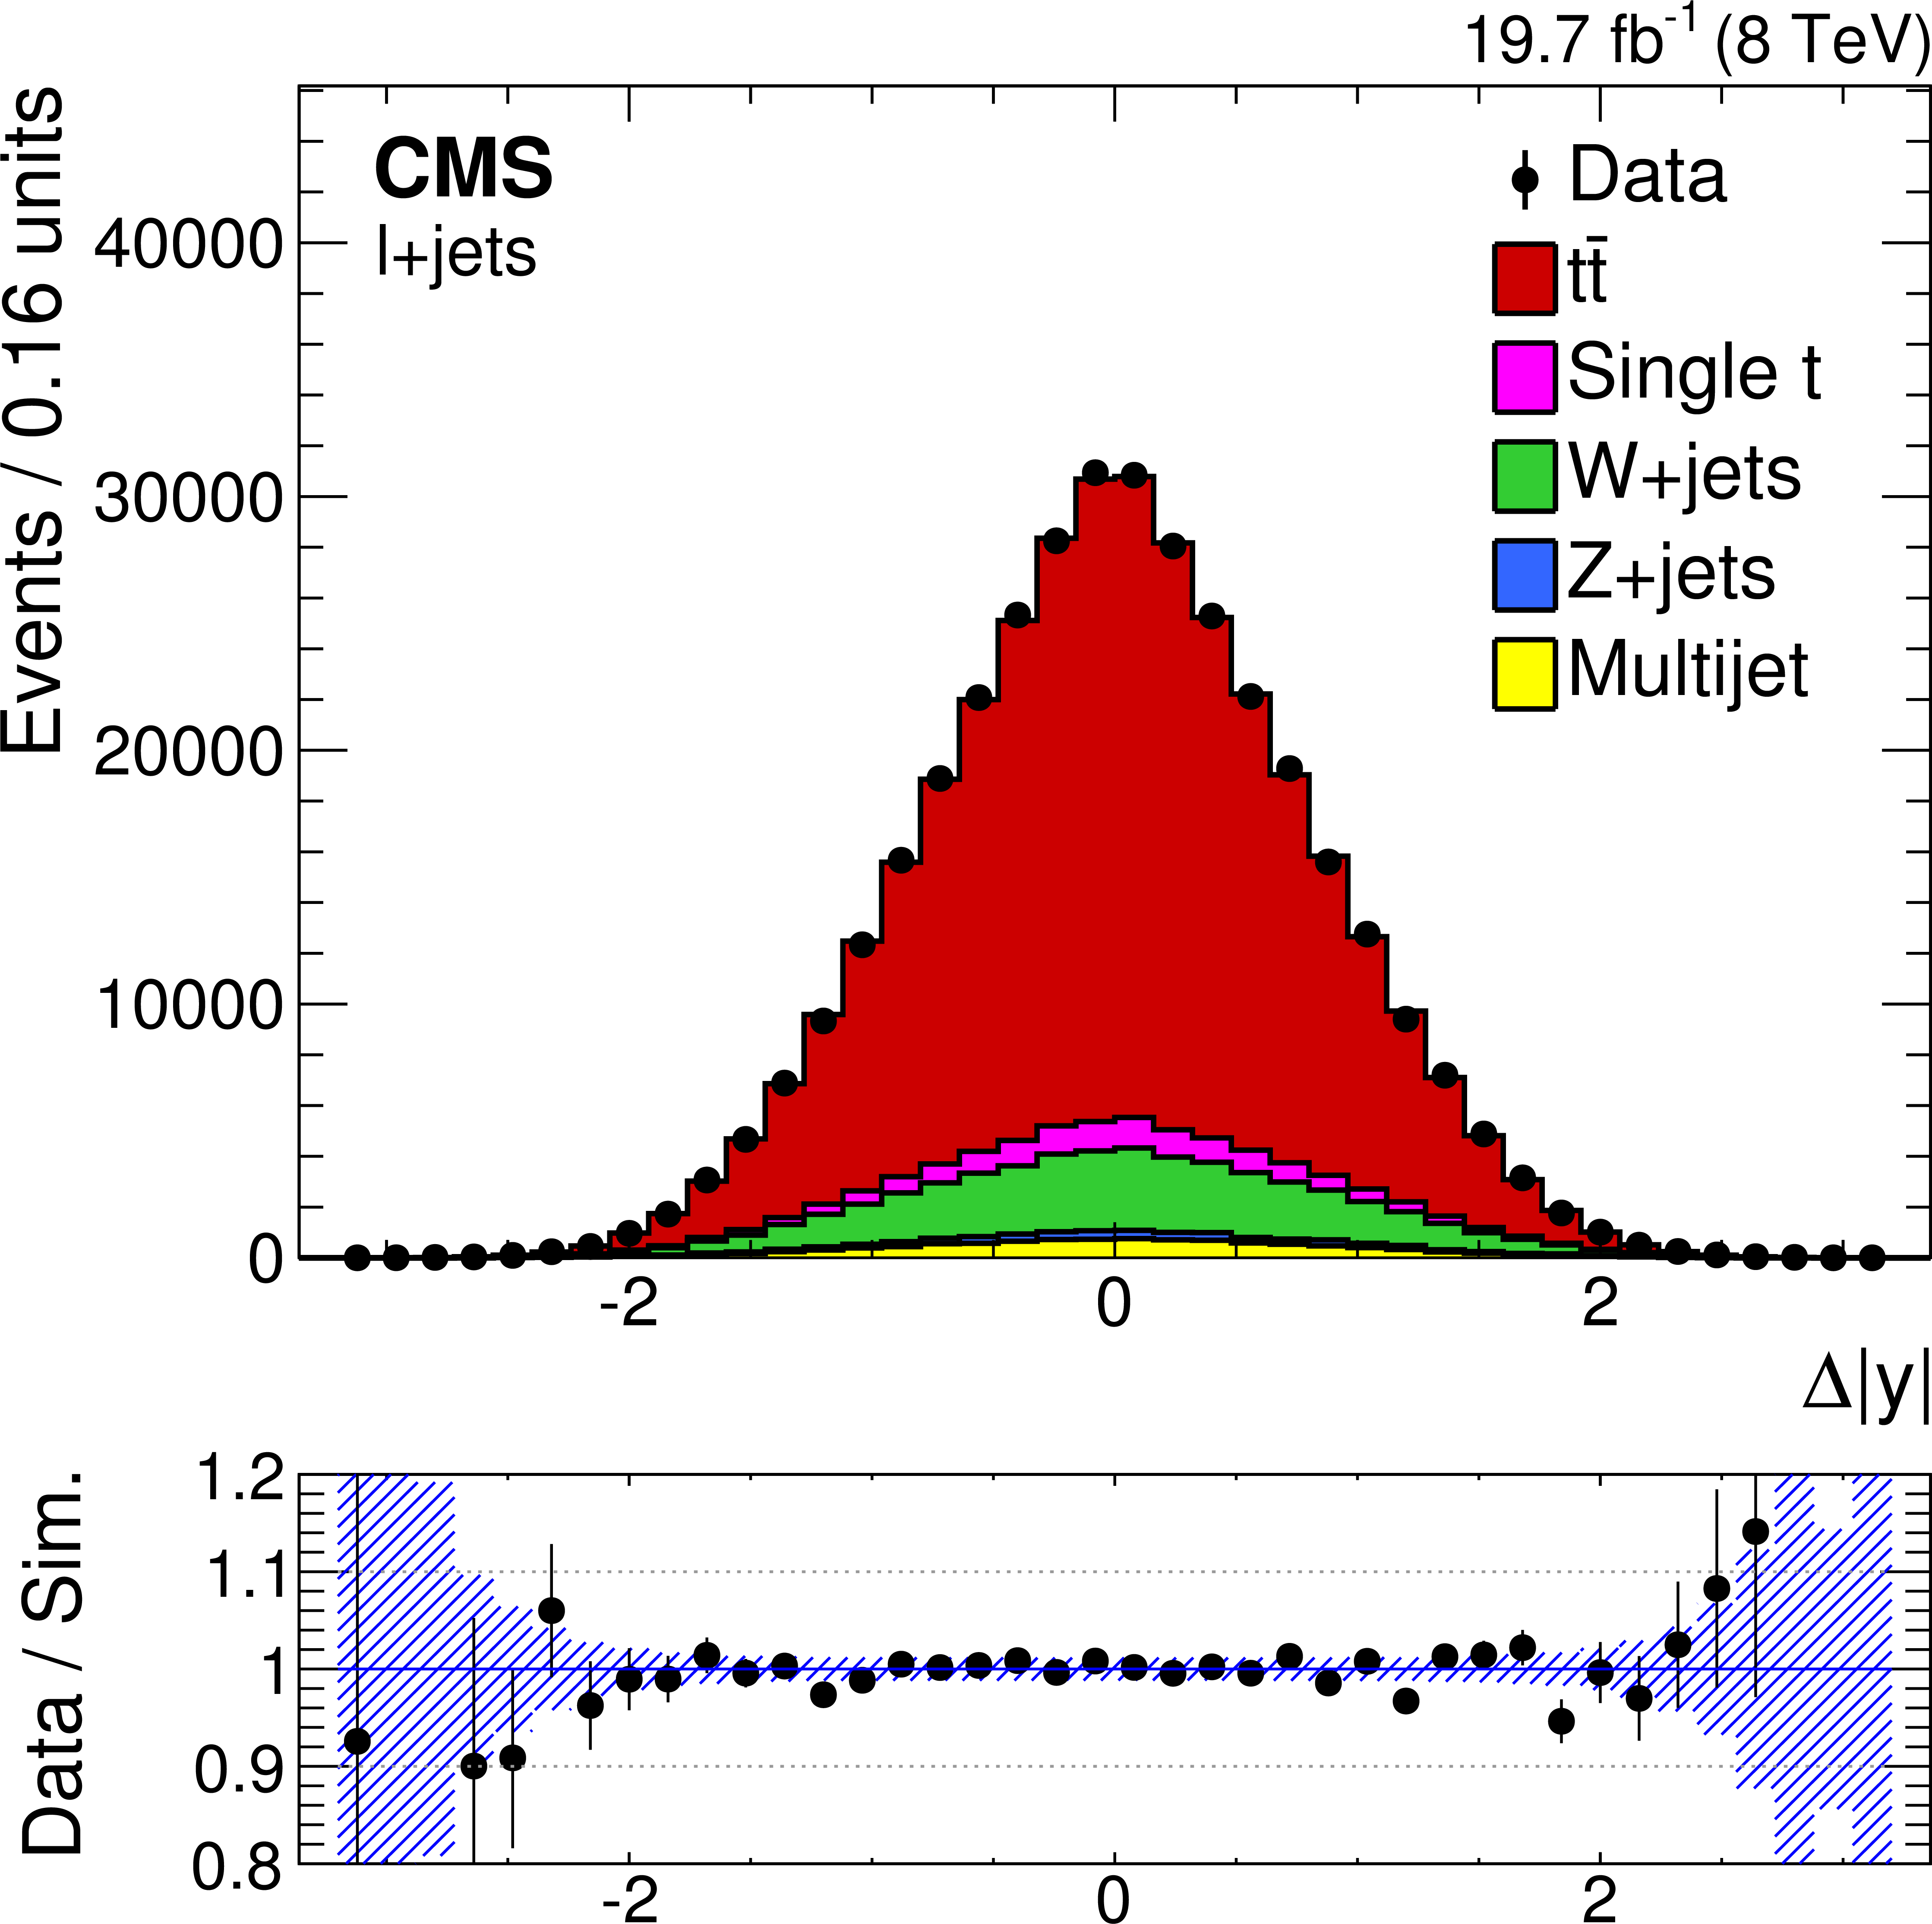
Figure 1-c:
Comparison of the combined lepton+jets data with simulated contributions for the distributions in $m_\mathrm {T}^\mathrm{ W } $ and $M_3$. The simulated signal and background contributions are normalized to the results of the fits in Table 1. The last bin in each histogram includes the overflow values. Additionally, the ratio of the data to the sum of the simulated contributions is shown, with the statistical uncertainties of the simulated contributions (including the uncertainties in the fit) indicated by the blue hatched region. |
png pdf |
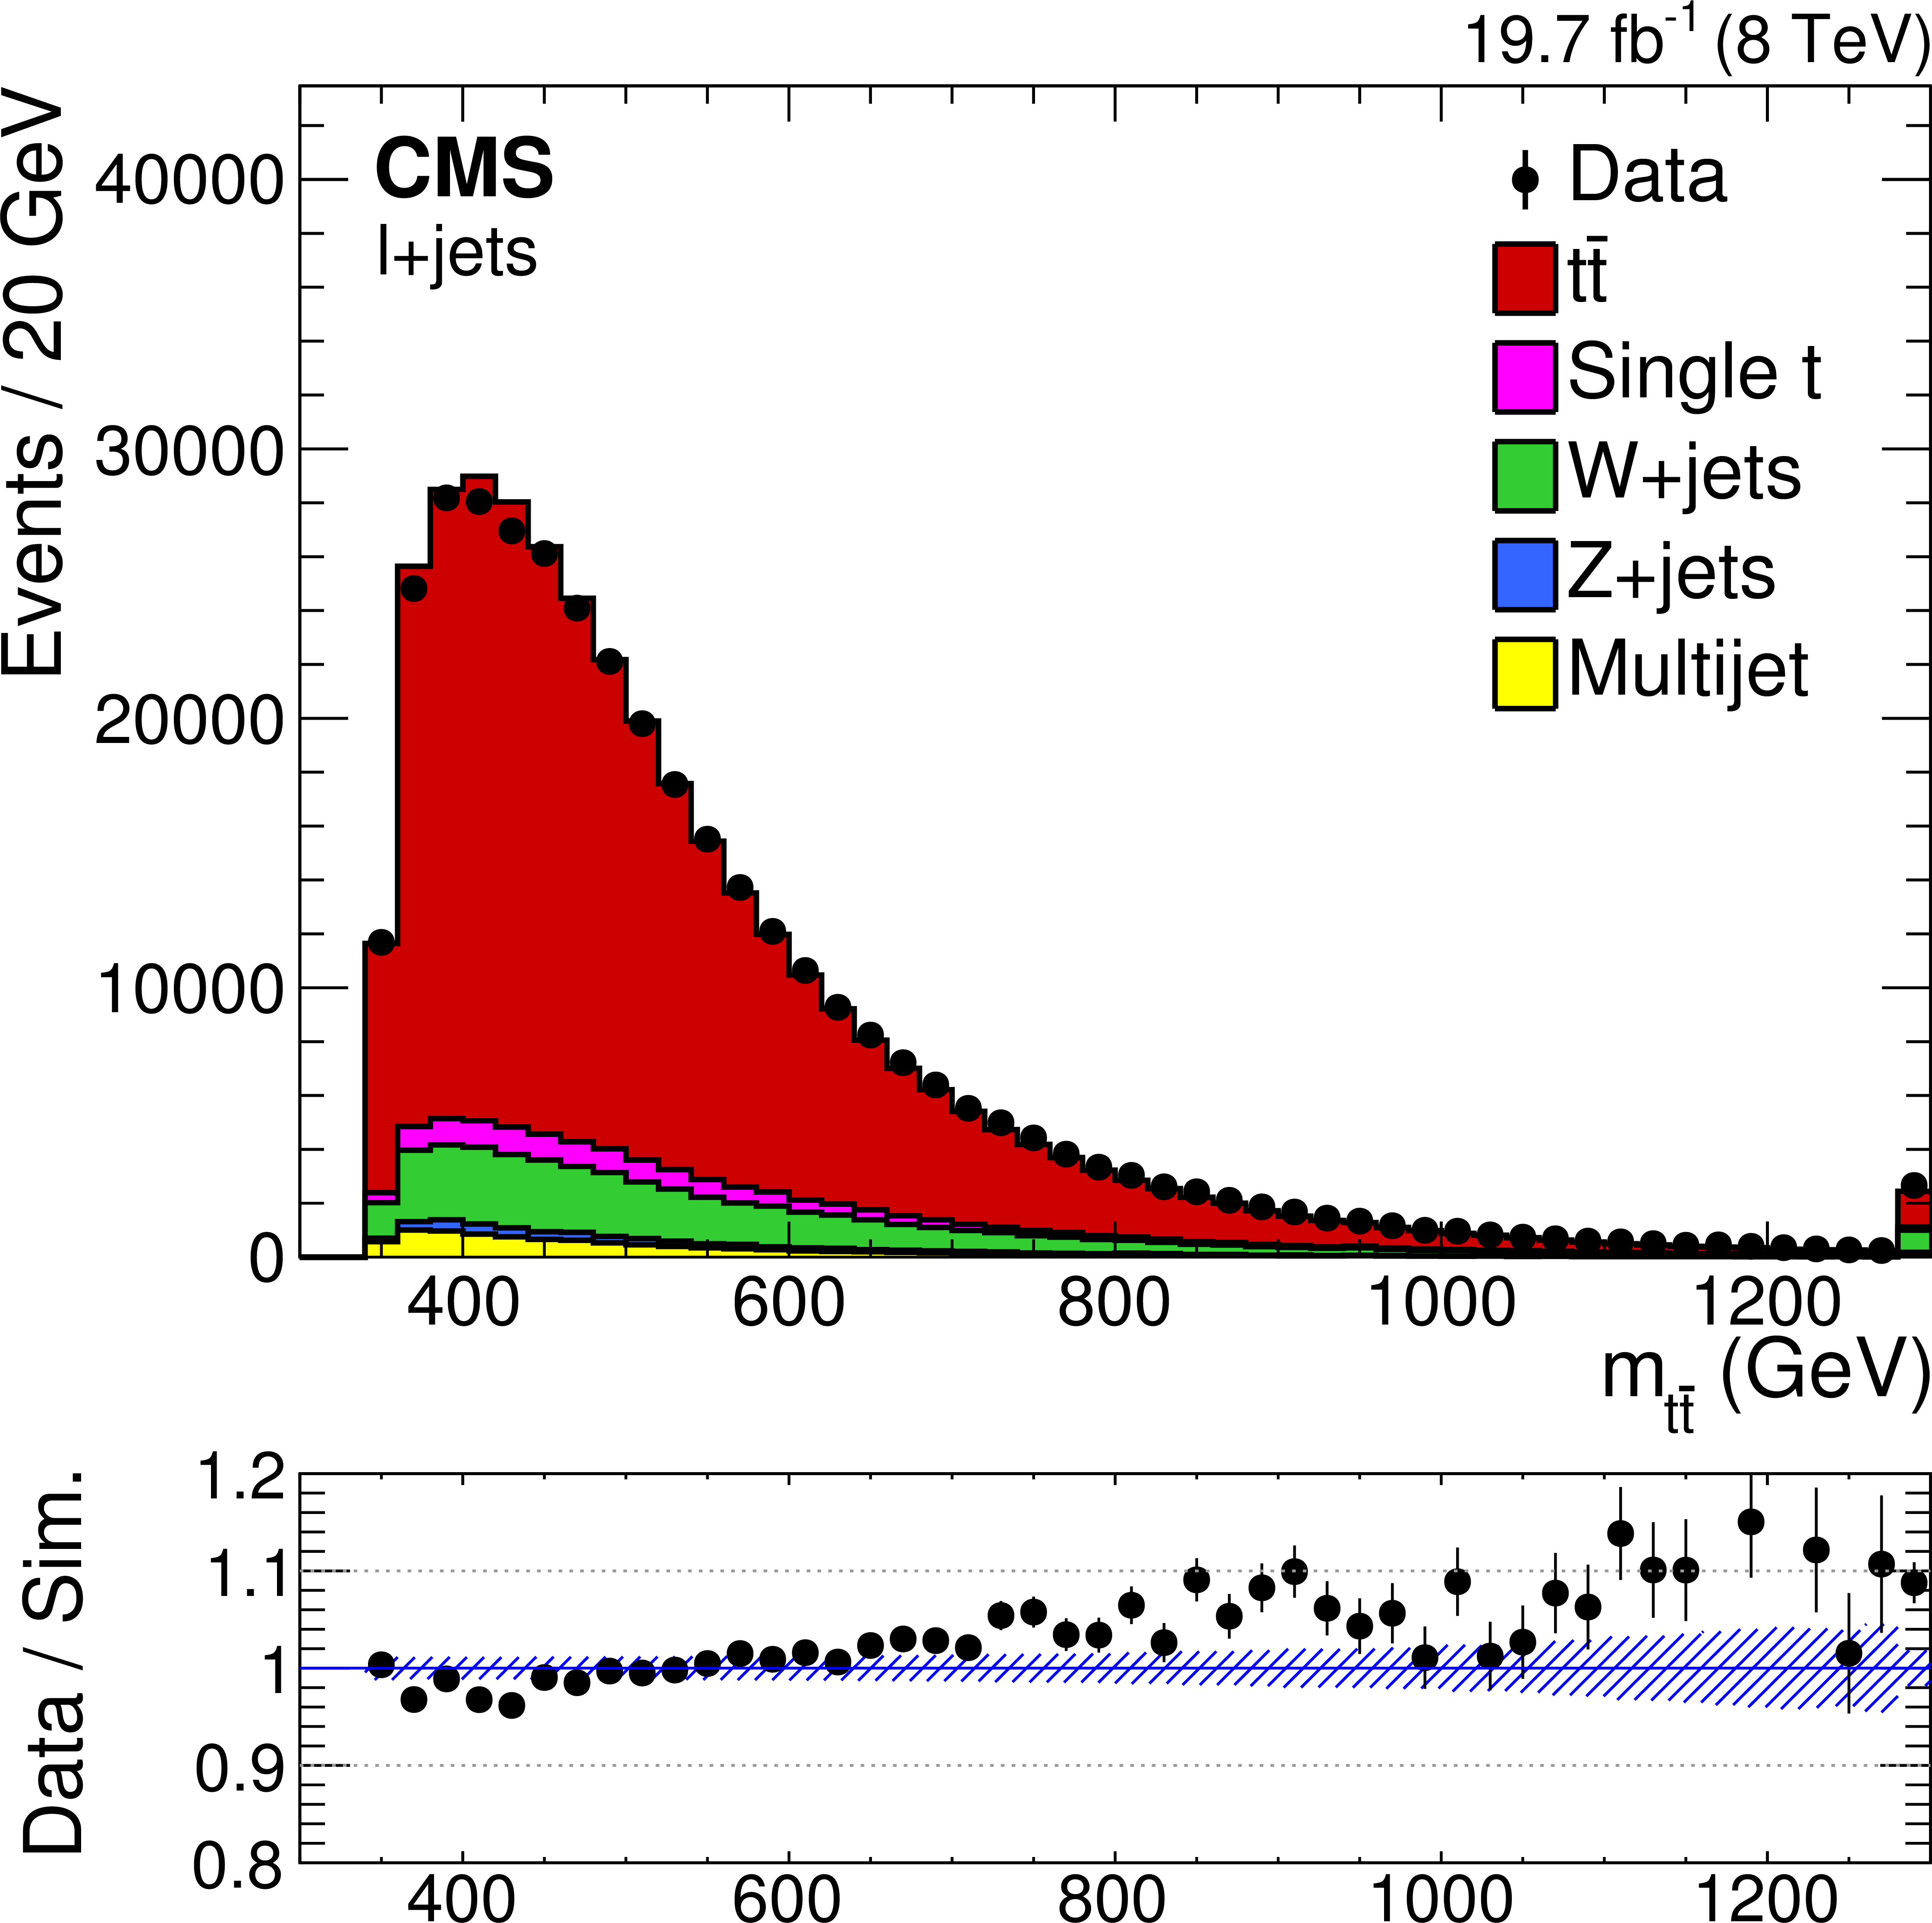
Figure 1-d:
Comparison of the combined lepton+jets data with simulated contributions for the distributions in $m_\mathrm {T}^\mathrm{ W } $ and $M_3$. The simulated signal and background contributions are normalized to the results of the fits in Table 1. The last bin in each histogram includes the overflow values. Additionally, the ratio of the data to the sum of the simulated contributions is shown, with the statistical uncertainties of the simulated contributions (including the uncertainties in the fit) indicated by the blue hatched region. |
png pdf |
Figure 1-e:
Comparison of the combined lepton+jets data with simulated contributions for the distributions in $m_\mathrm {T}^\mathrm{ W } $ and $M_3$. The simulated signal and background contributions are normalized to the results of the fits in Table 1. The last bin in each histogram includes the overflow values. Additionally, the ratio of the data to the sum of the simulated contributions is shown, with the statistical uncertainties of the simulated contributions (including the uncertainties in the fit) indicated by the blue hatched region. |

png pdf |
Figure 1-f:
Comparison of the combined lepton+jets data with simulated contributions for the distributions in $m_\mathrm {T}^\mathrm{ W } $ and $M_3$. The simulated signal and background contributions are normalized to the results of the fits in Table 1. The last bin in each histogram includes the overflow values. Additionally, the ratio of the data to the sum of the simulated contributions is shown, with the statistical uncertainties of the simulated contributions (including the uncertainties in the fit) indicated by the blue hatched region. |

png pdf |
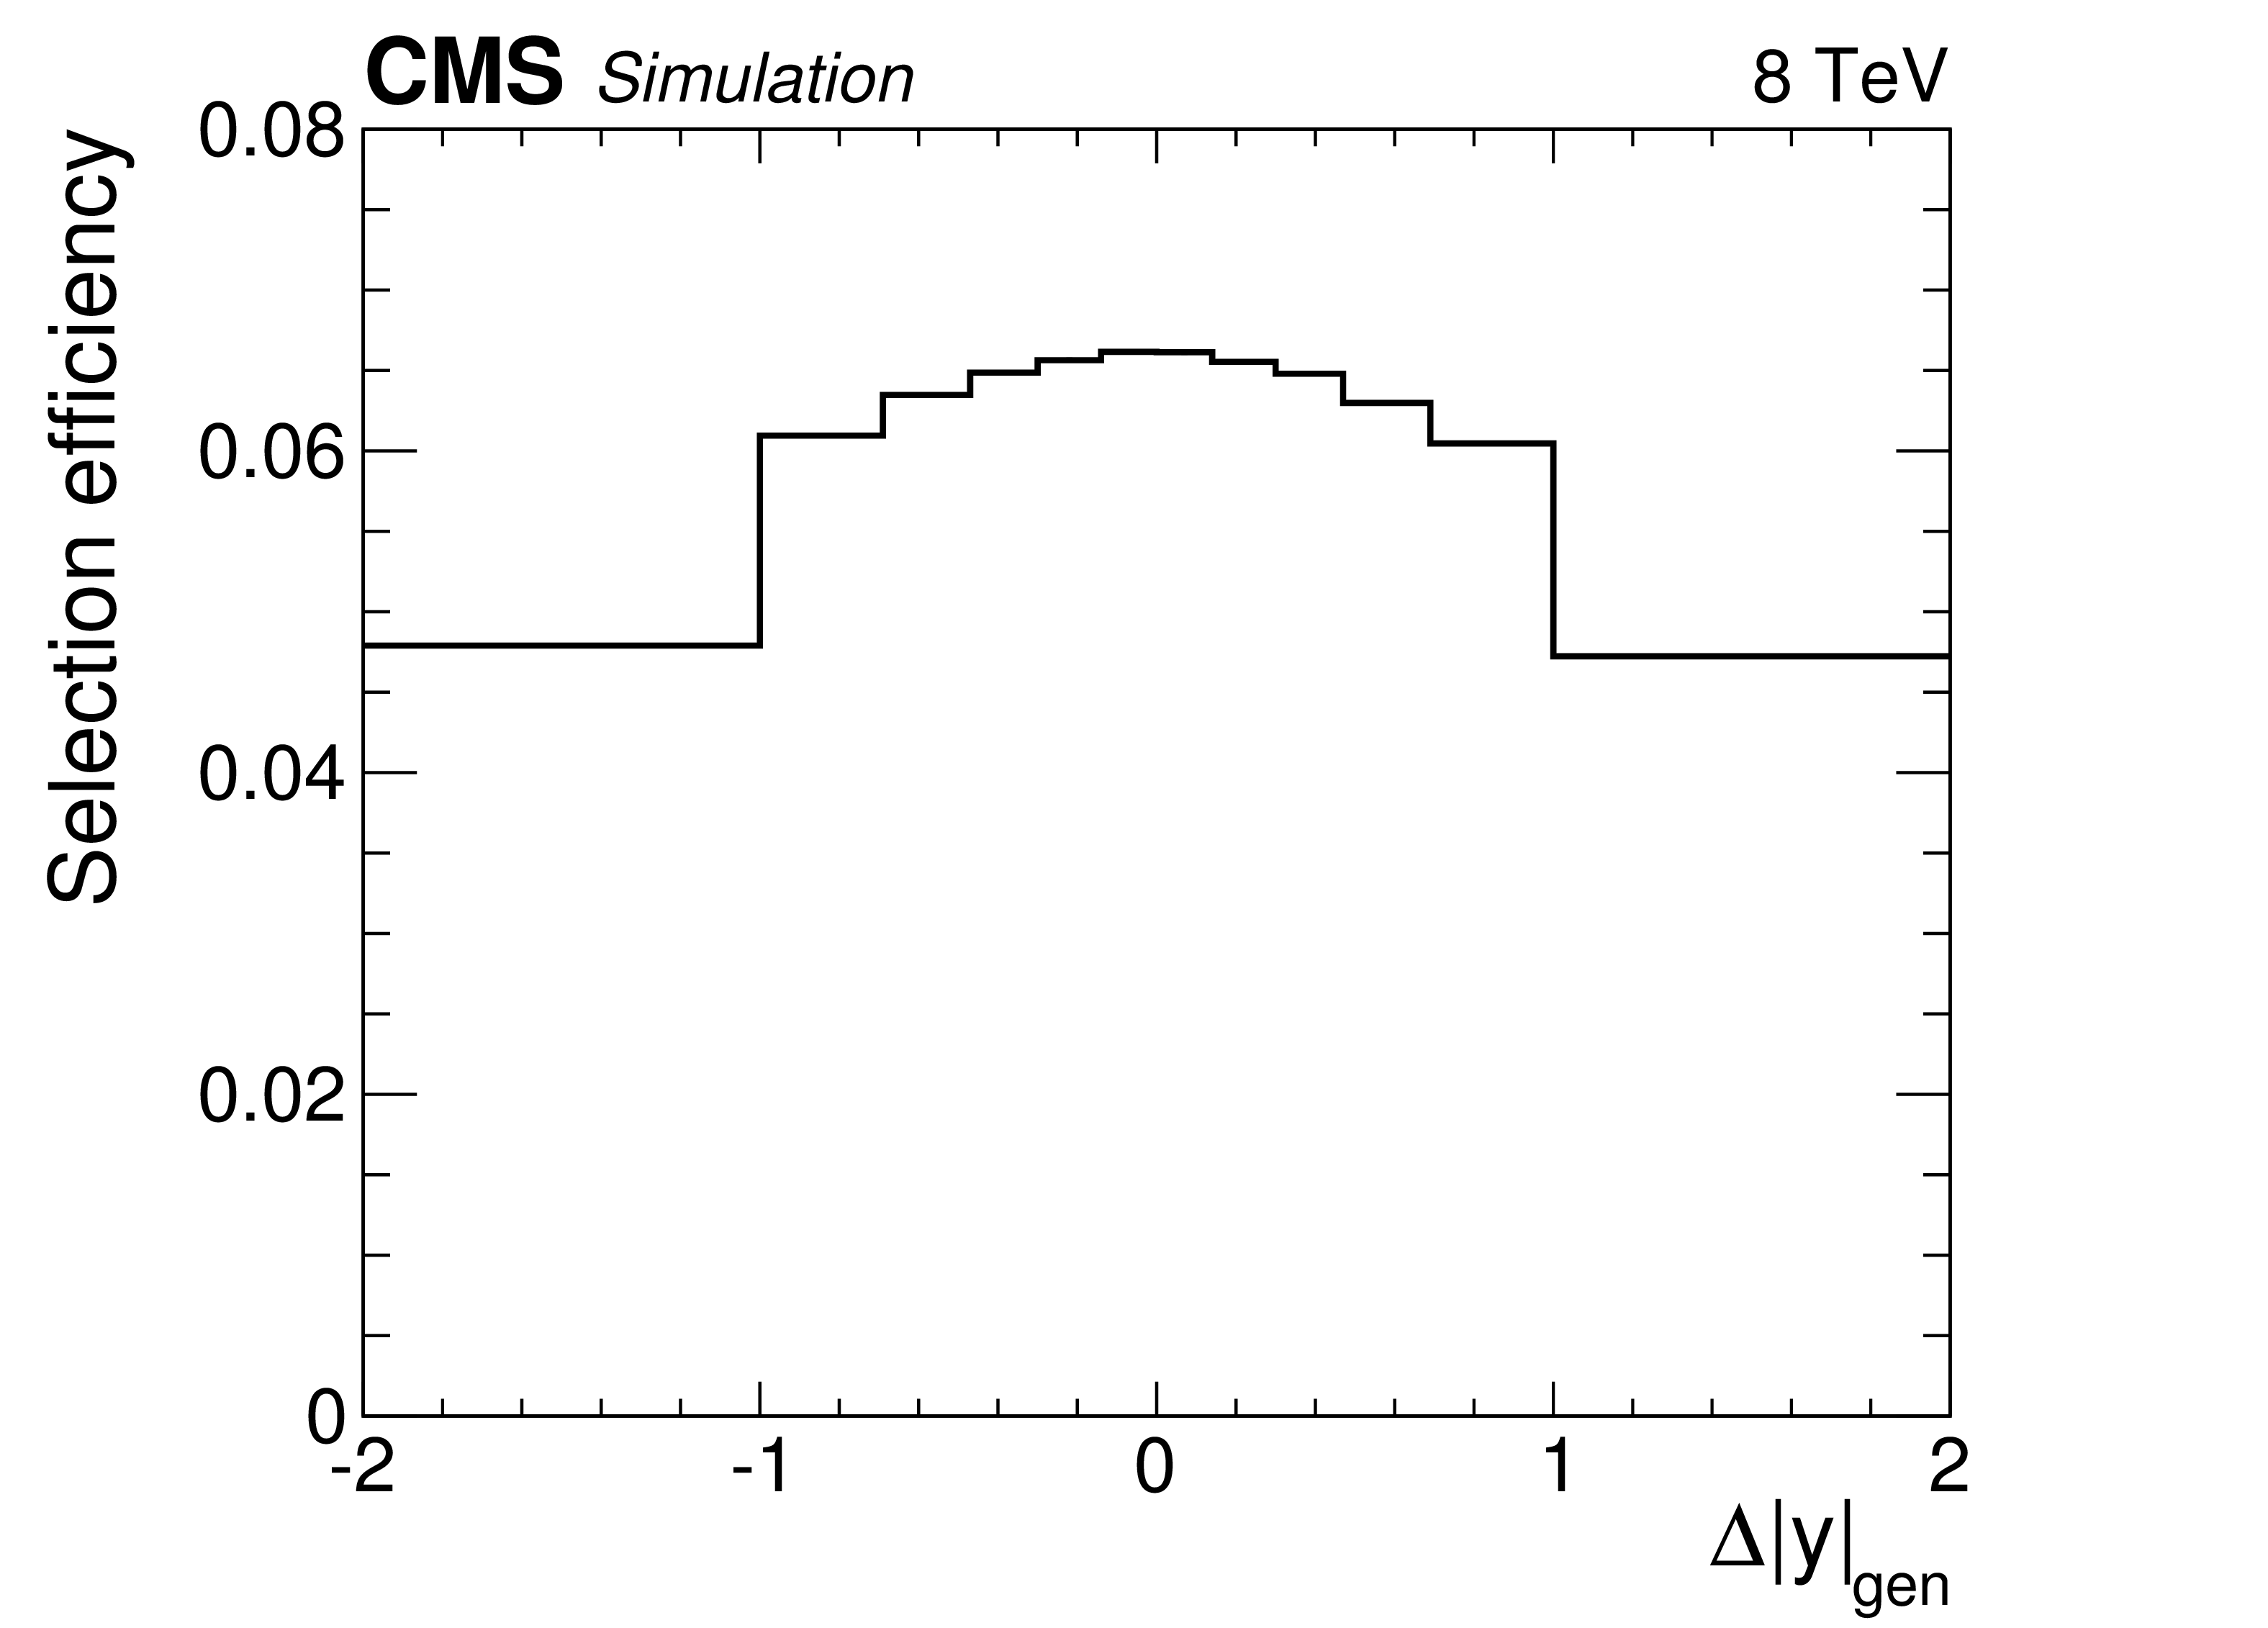
Figure 2-a:
Migration matrix between generated ($\Delta {| y | }_{\text {gen}}$) and reconstructed ($\Delta {| y | }_{\text {rec}}$) rapidity differences (a) and selection efficiency with respect to the full phase space as a function of $\Delta {| y | }_{\text {gen}}$ (b) of the inclusive measurement. Migration matrix (c) and selection efficiency (d) for the measurement differential in $m_{ {\mathrm{ t \bar{t} } } }$. |
png pdf |
Figure 2-b:
Migration matrix between generated ($\Delta {| y | }_{\text {gen}}$) and reconstructed ($\Delta {| y | }_{\text {rec}}$) rapidity differences (a) and selection efficiency with respect to the full phase space as a function of $\Delta {| y | }_{\text {gen}}$ (b) of the inclusive measurement. Migration matrix (c) and selection efficiency (d) for the measurement differential in $m_{ {\mathrm{ t \bar{t} } } }$. |
png pdf |
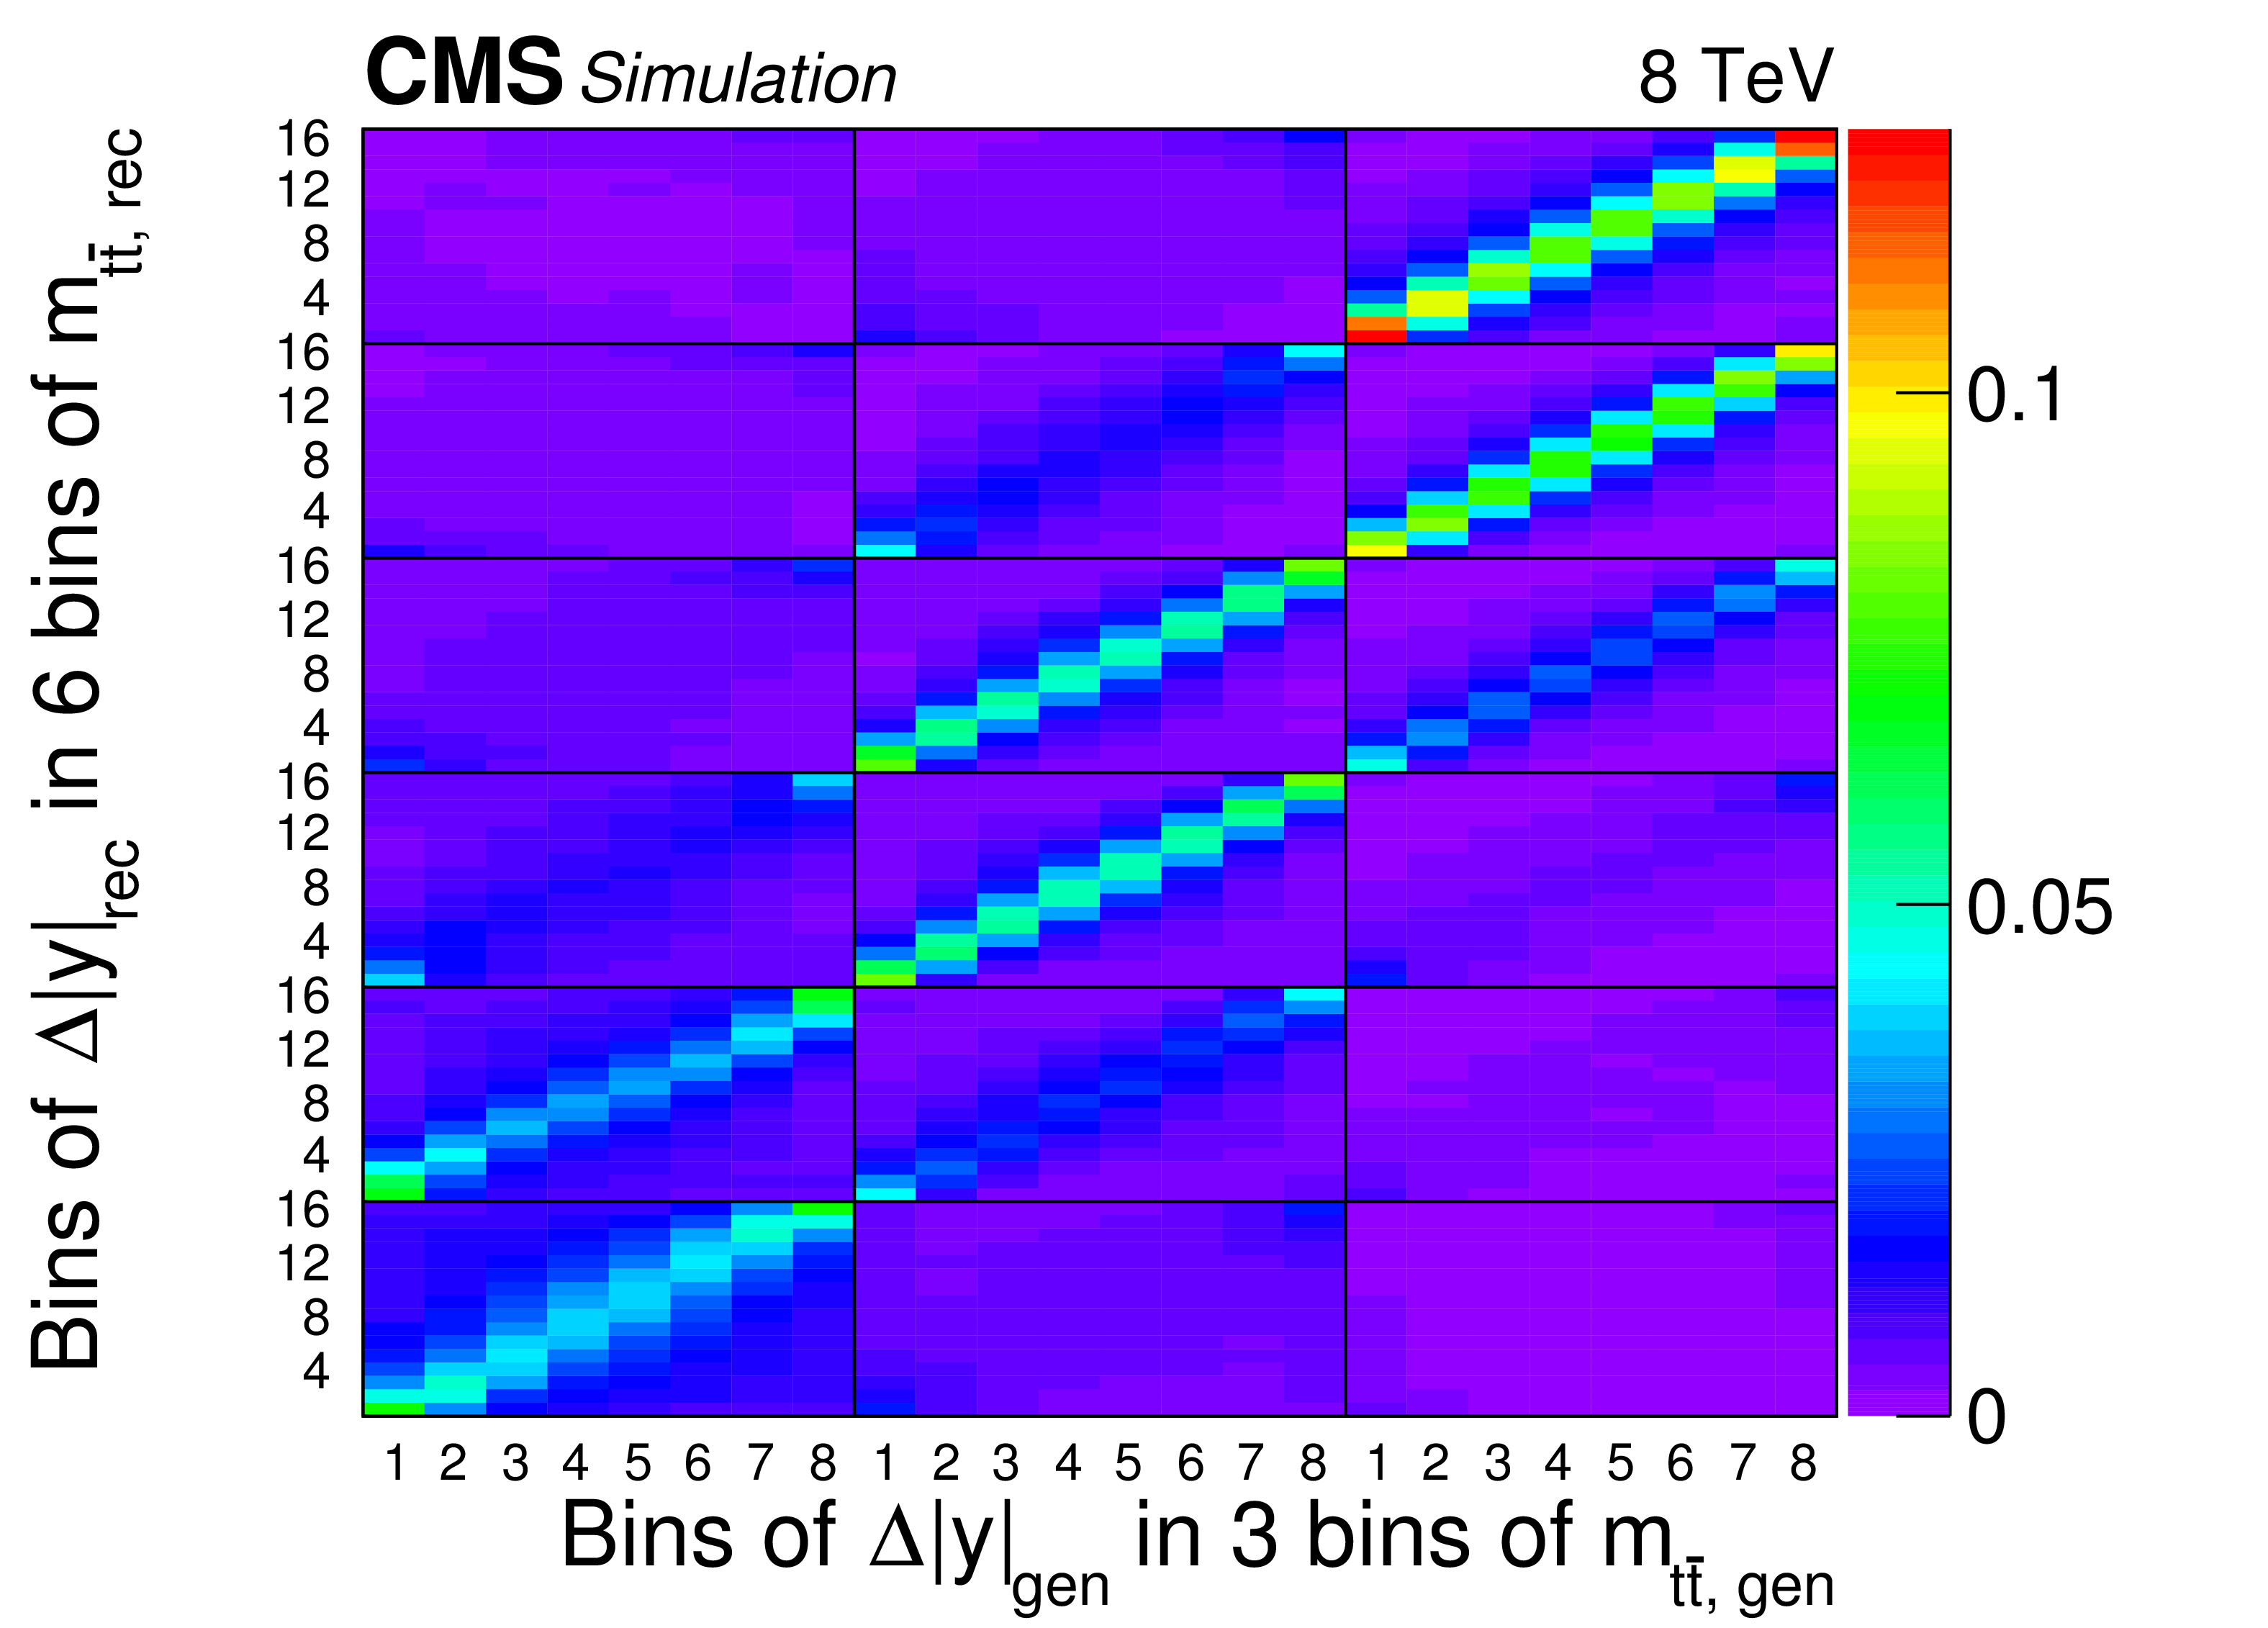
Figure 2-c:
Migration matrix between generated ($\Delta {| y | }_{\text {gen}}$) and reconstructed ($\Delta {| y | }_{\text {rec}}$) rapidity differences (a) and selection efficiency with respect to the full phase space as a function of $\Delta {| y | }_{\text {gen}}$ (b) of the inclusive measurement. Migration matrix (c) and selection efficiency (d) for the measurement differential in $m_{ {\mathrm{ t \bar{t} } } }$. |
png pdf |
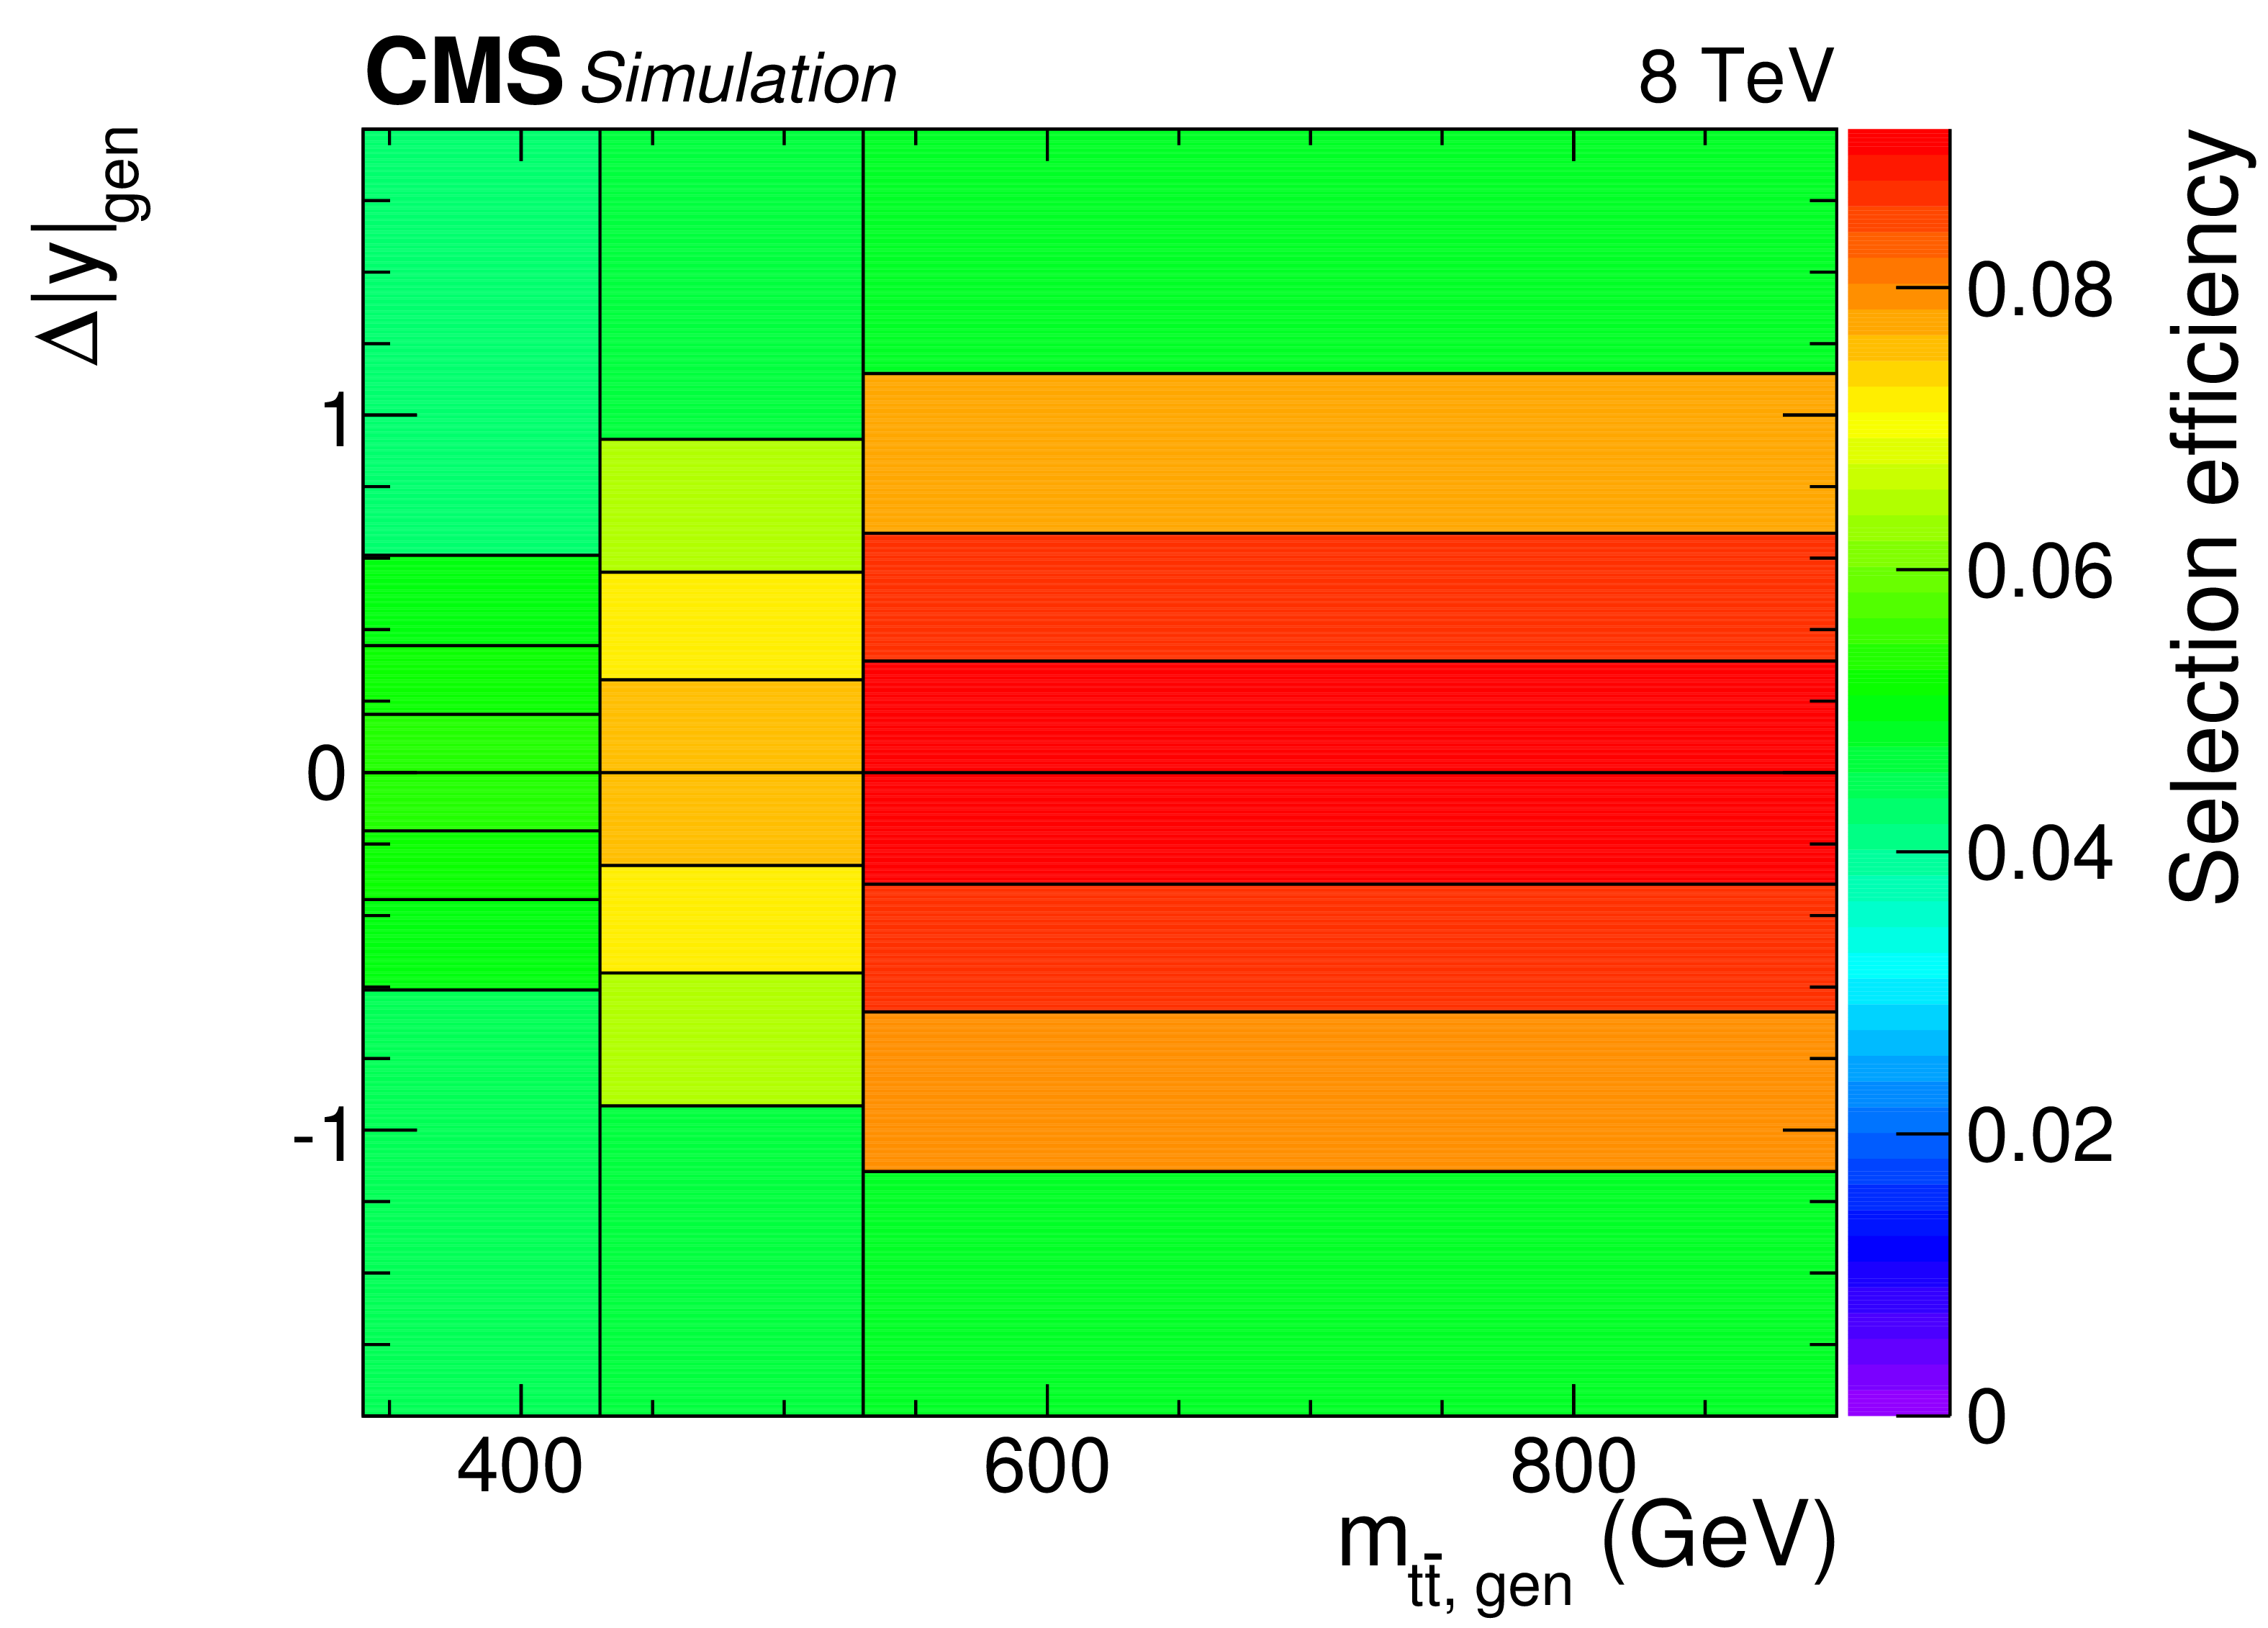
Figure 2-d:
Migration matrix between generated ($\Delta {| y | }_{\text {gen}}$) and reconstructed ($\Delta {| y | }_{\text {rec}}$) rapidity differences (a) and selection efficiency with respect to the full phase space as a function of $\Delta {| y | }_{\text {gen}}$ (b) of the inclusive measurement. Migration matrix (c) and selection efficiency (d) for the measurement differential in $m_{ {\mathrm{ t \bar{t} } } }$. |

png pdf |
Figure 3-a:
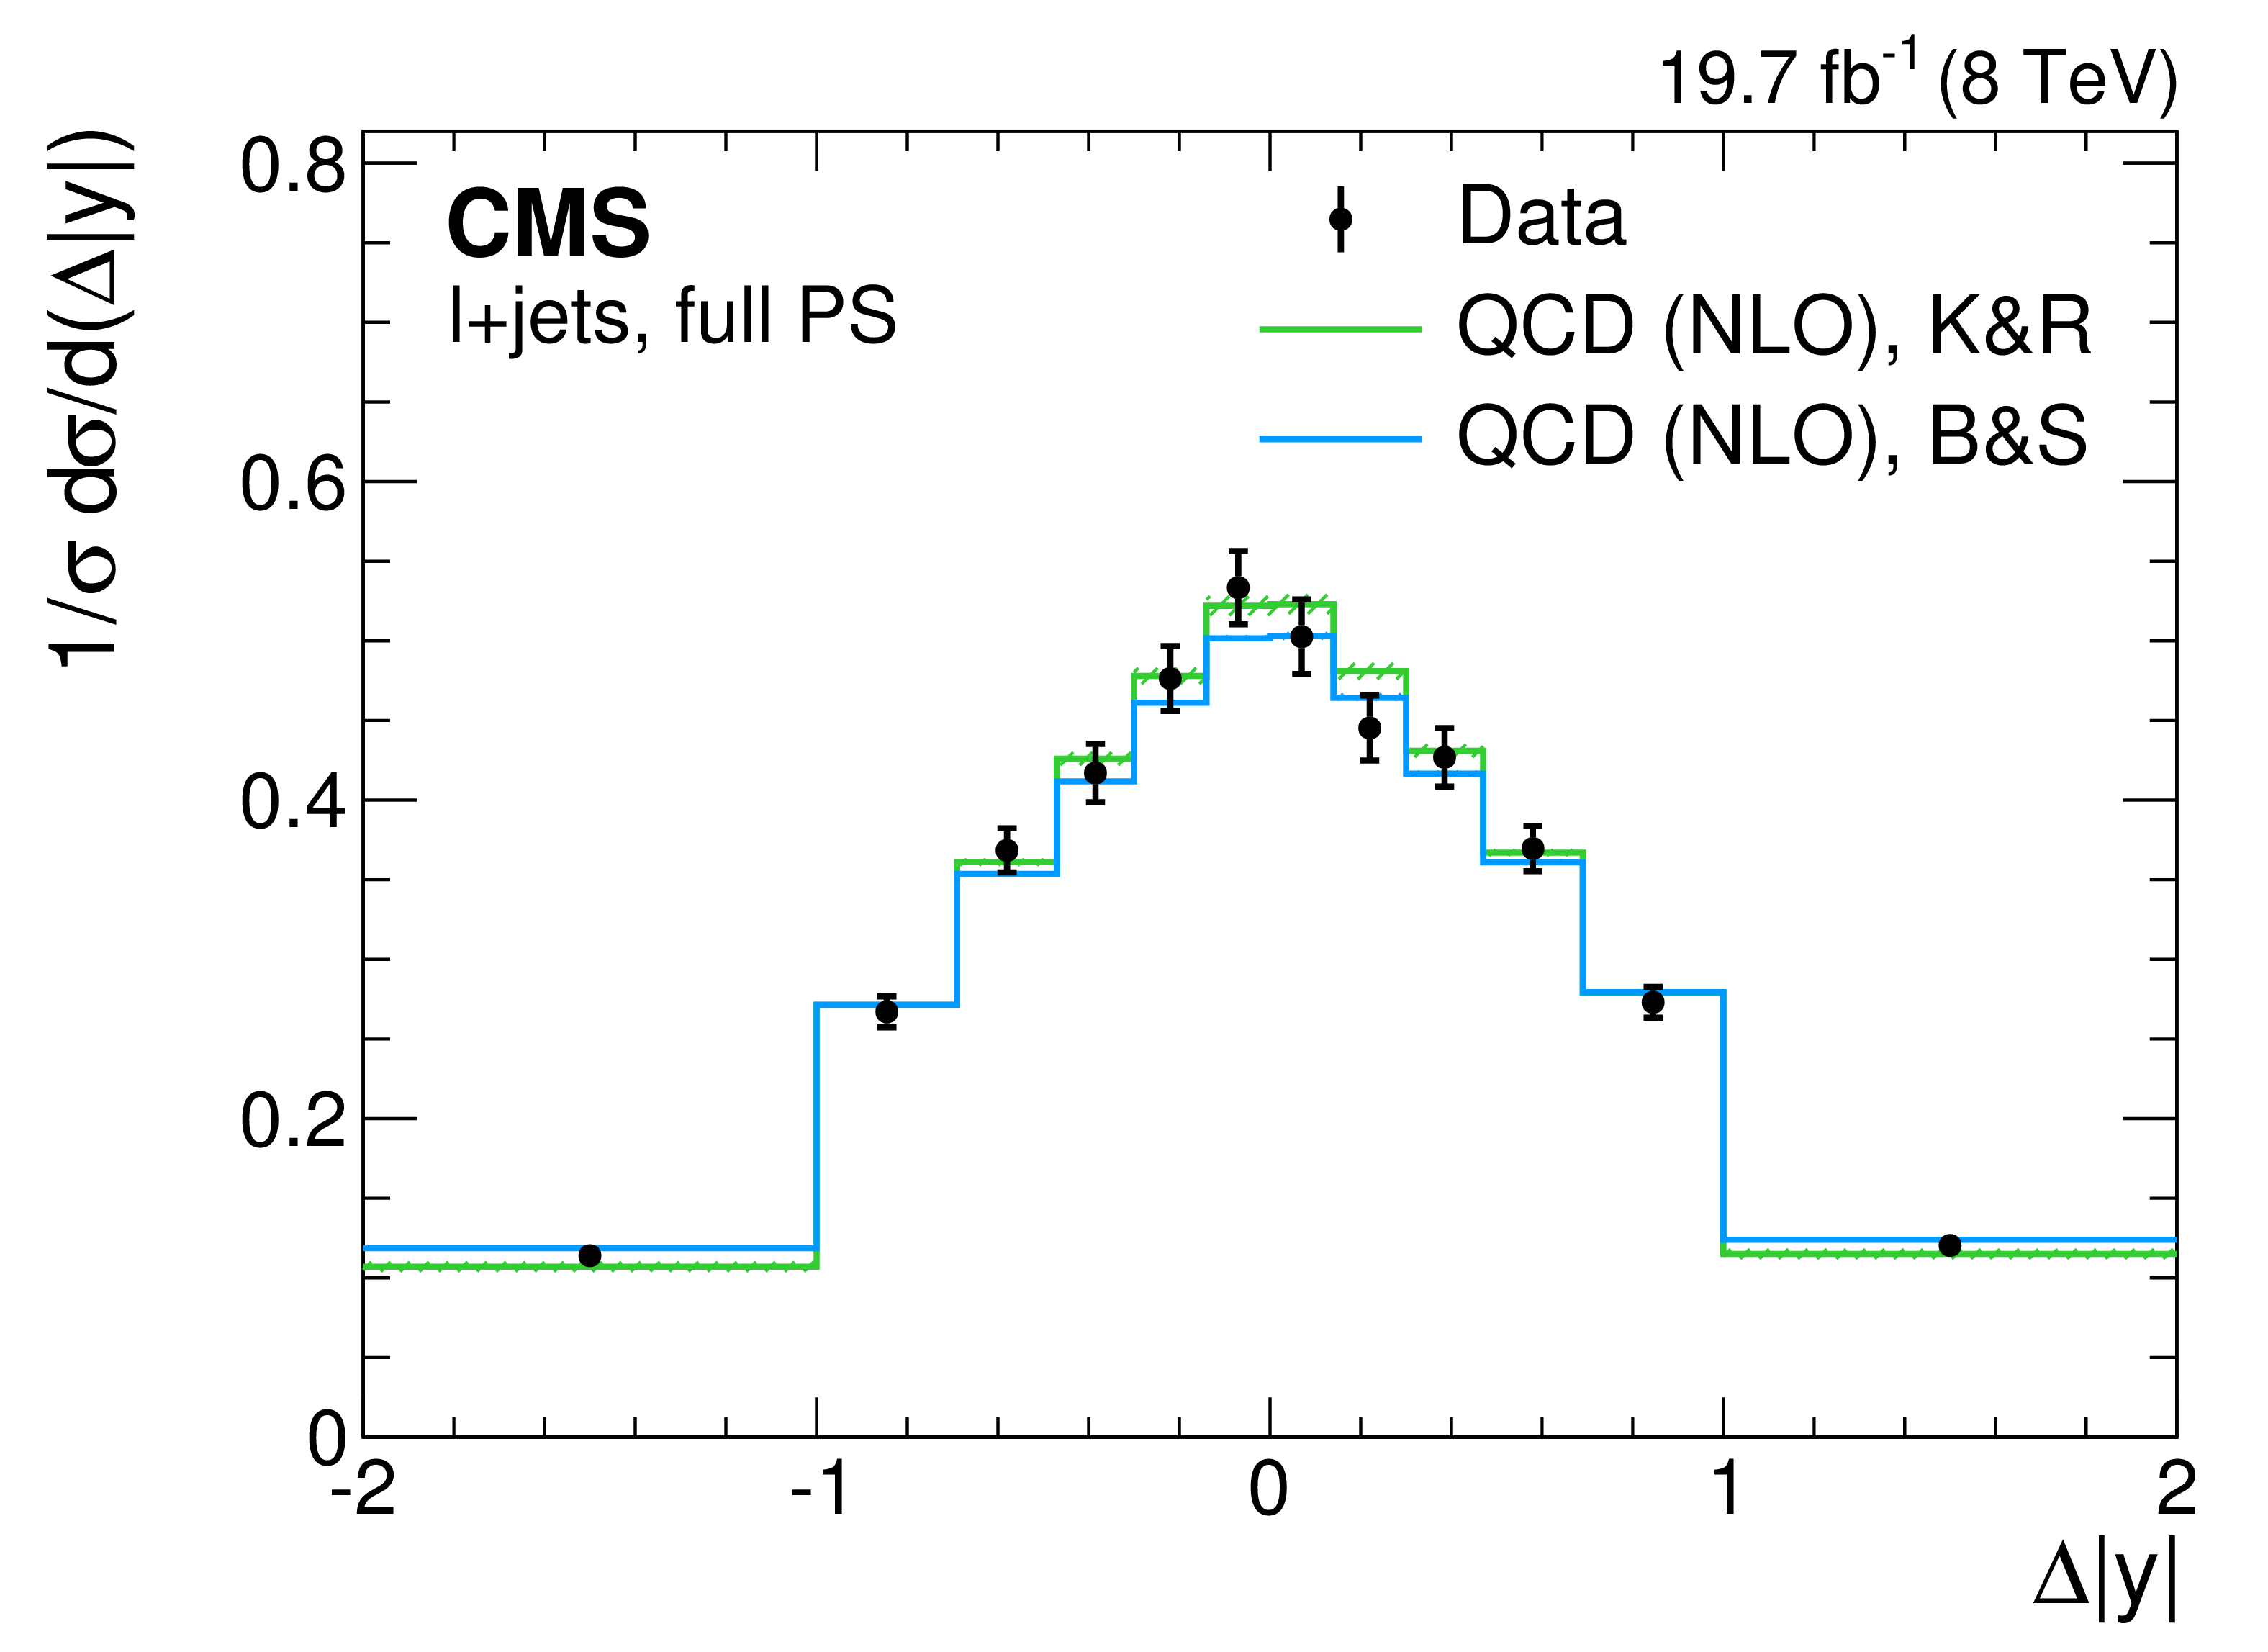
Unfolded inclusive $\Delta {| y | }$ distribution in the fiducial phase space (a) and in the full phase space (b). The uncertainties on the data points represent the statistical uncertainties due to the limited amounts of data and simulated events. The measured values are compared to NLO predictions for the SM based on calculations by Kuhn and Rodrigo (K&R) [10] and Bernreuther and Si (B&S) [11,49]. |
png pdf |
Figure 3-b:
Unfolded inclusive $\Delta {| y | }$ distribution in the fiducial phase space (a) and in the full phase space (b). The uncertainties on the data points represent the statistical uncertainties due to the limited amounts of data and simulated events. The measured values are compared to NLO predictions for the SM based on calculations by Kuhn and Rodrigo (K&R) [10] and Bernreuther and Si (B&S) [11,49]. |

png pdf |
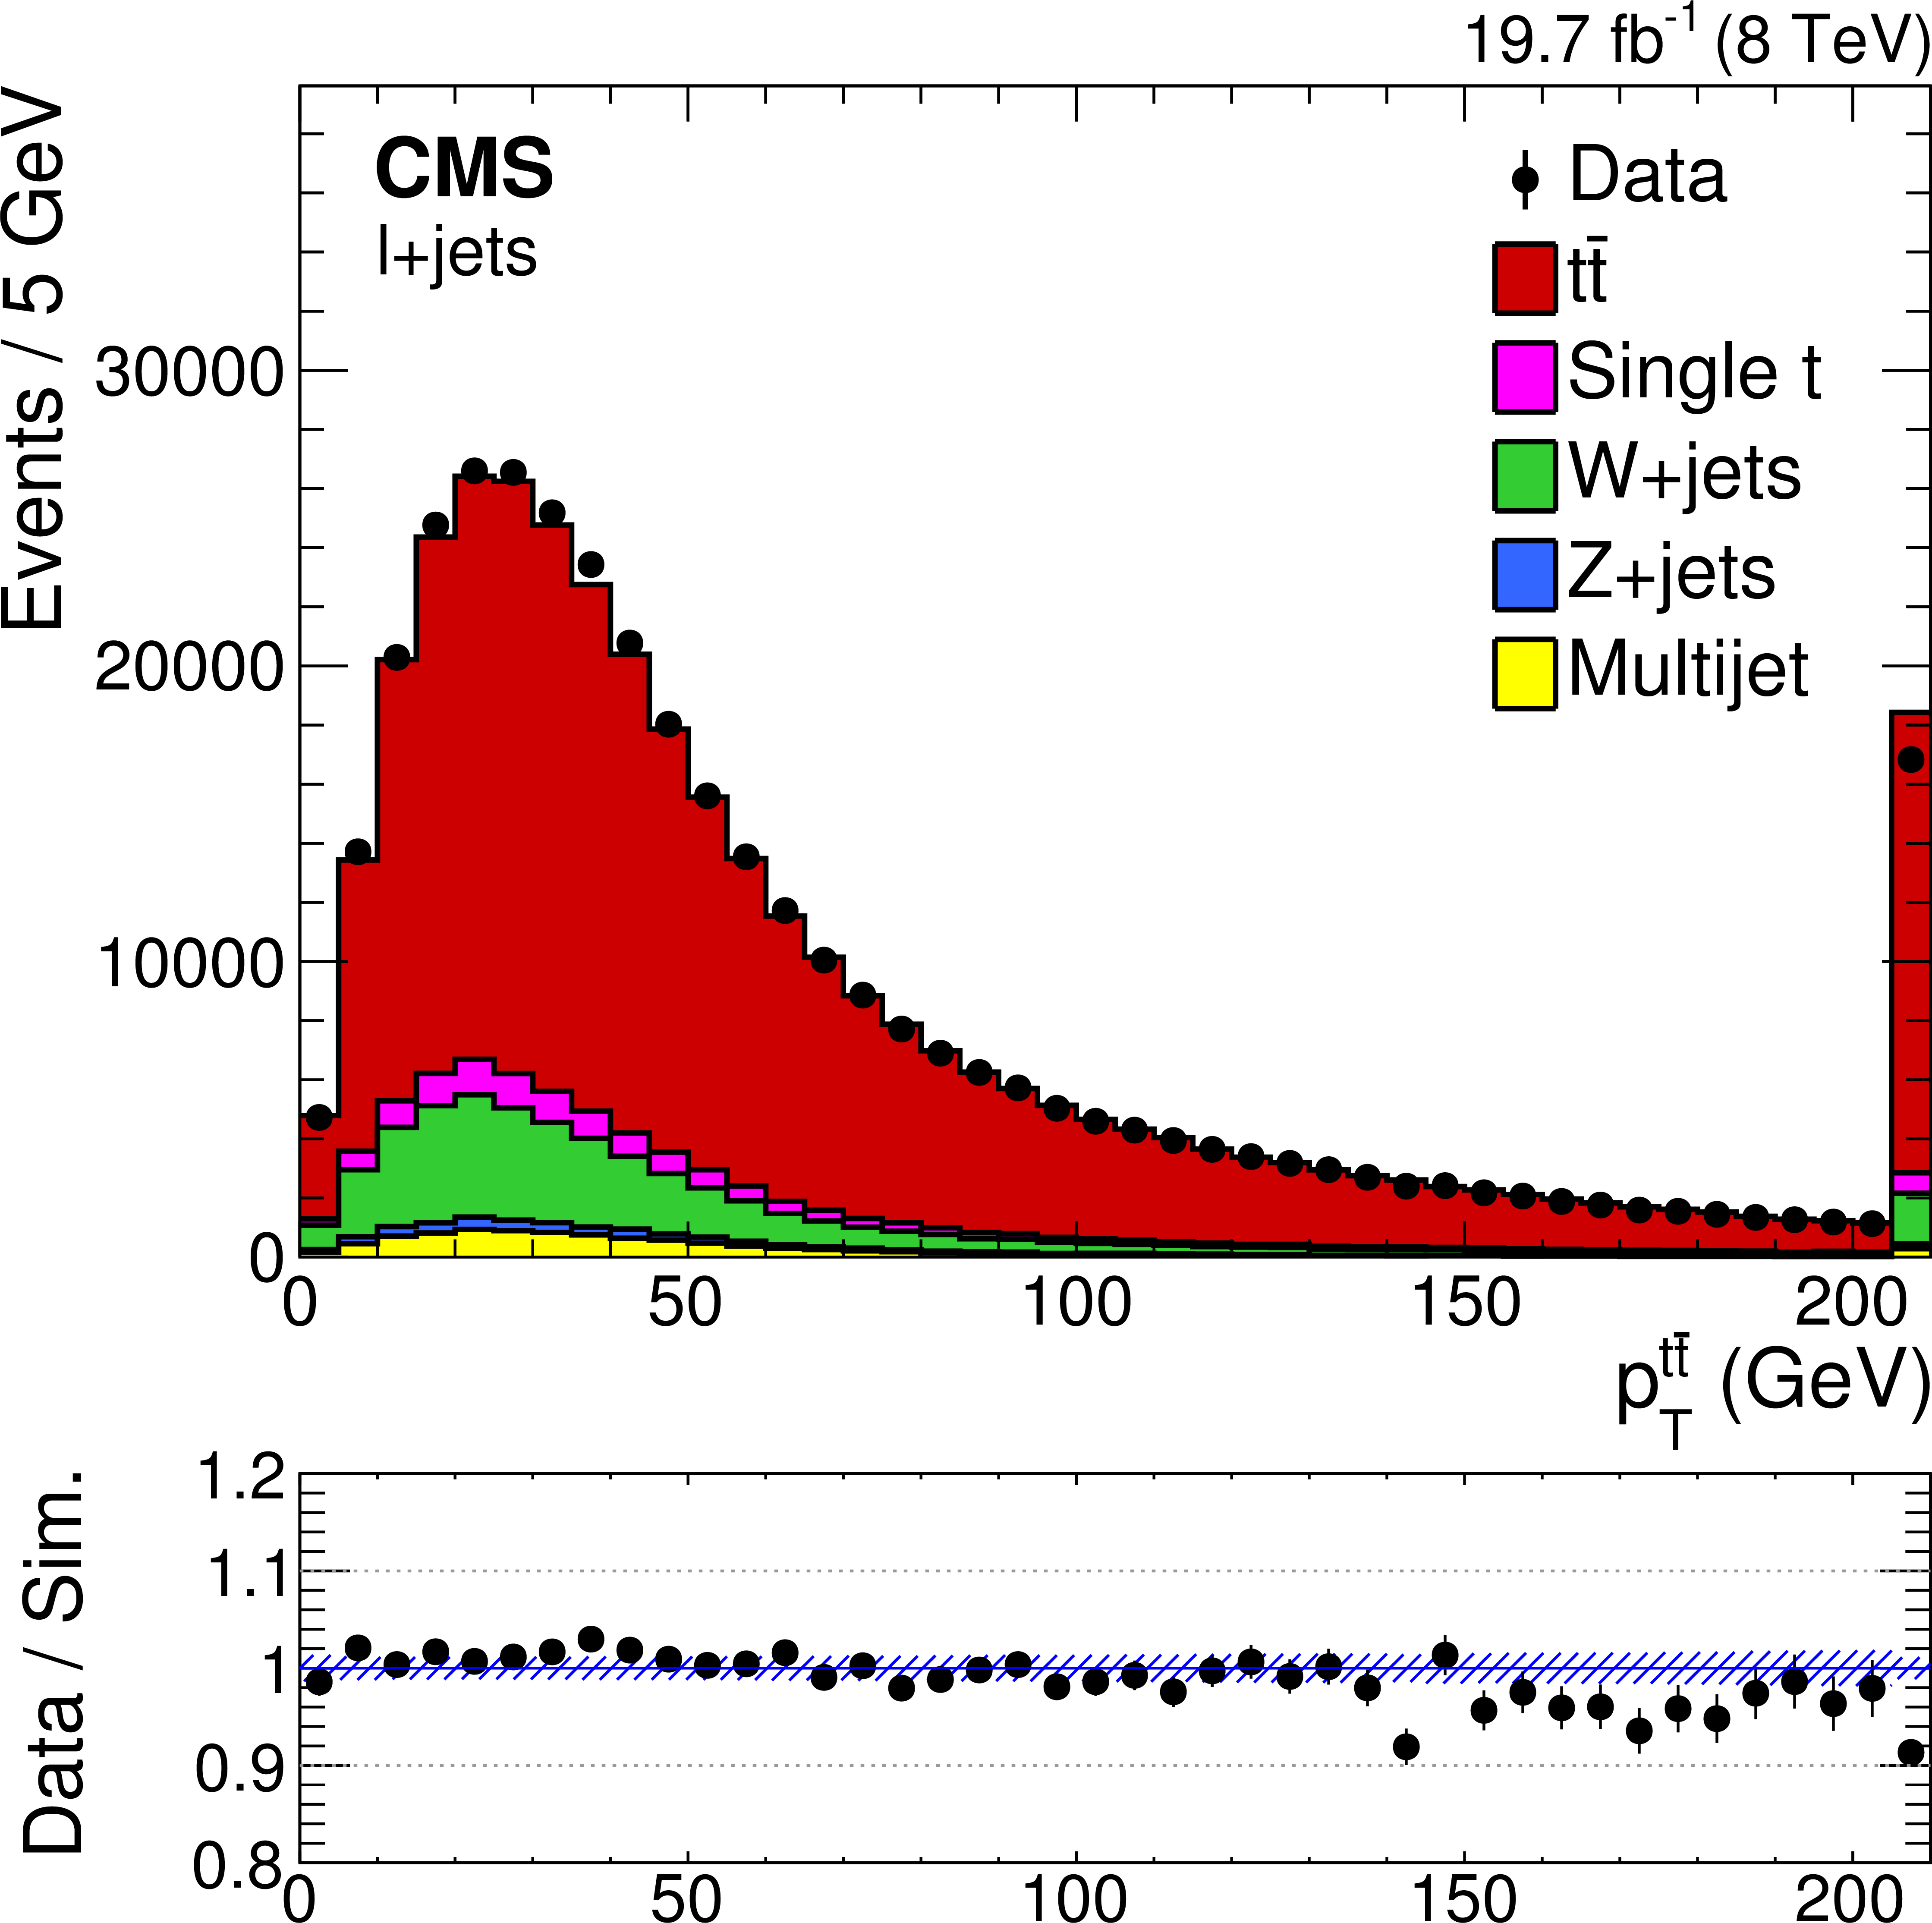
Figure 4-a:
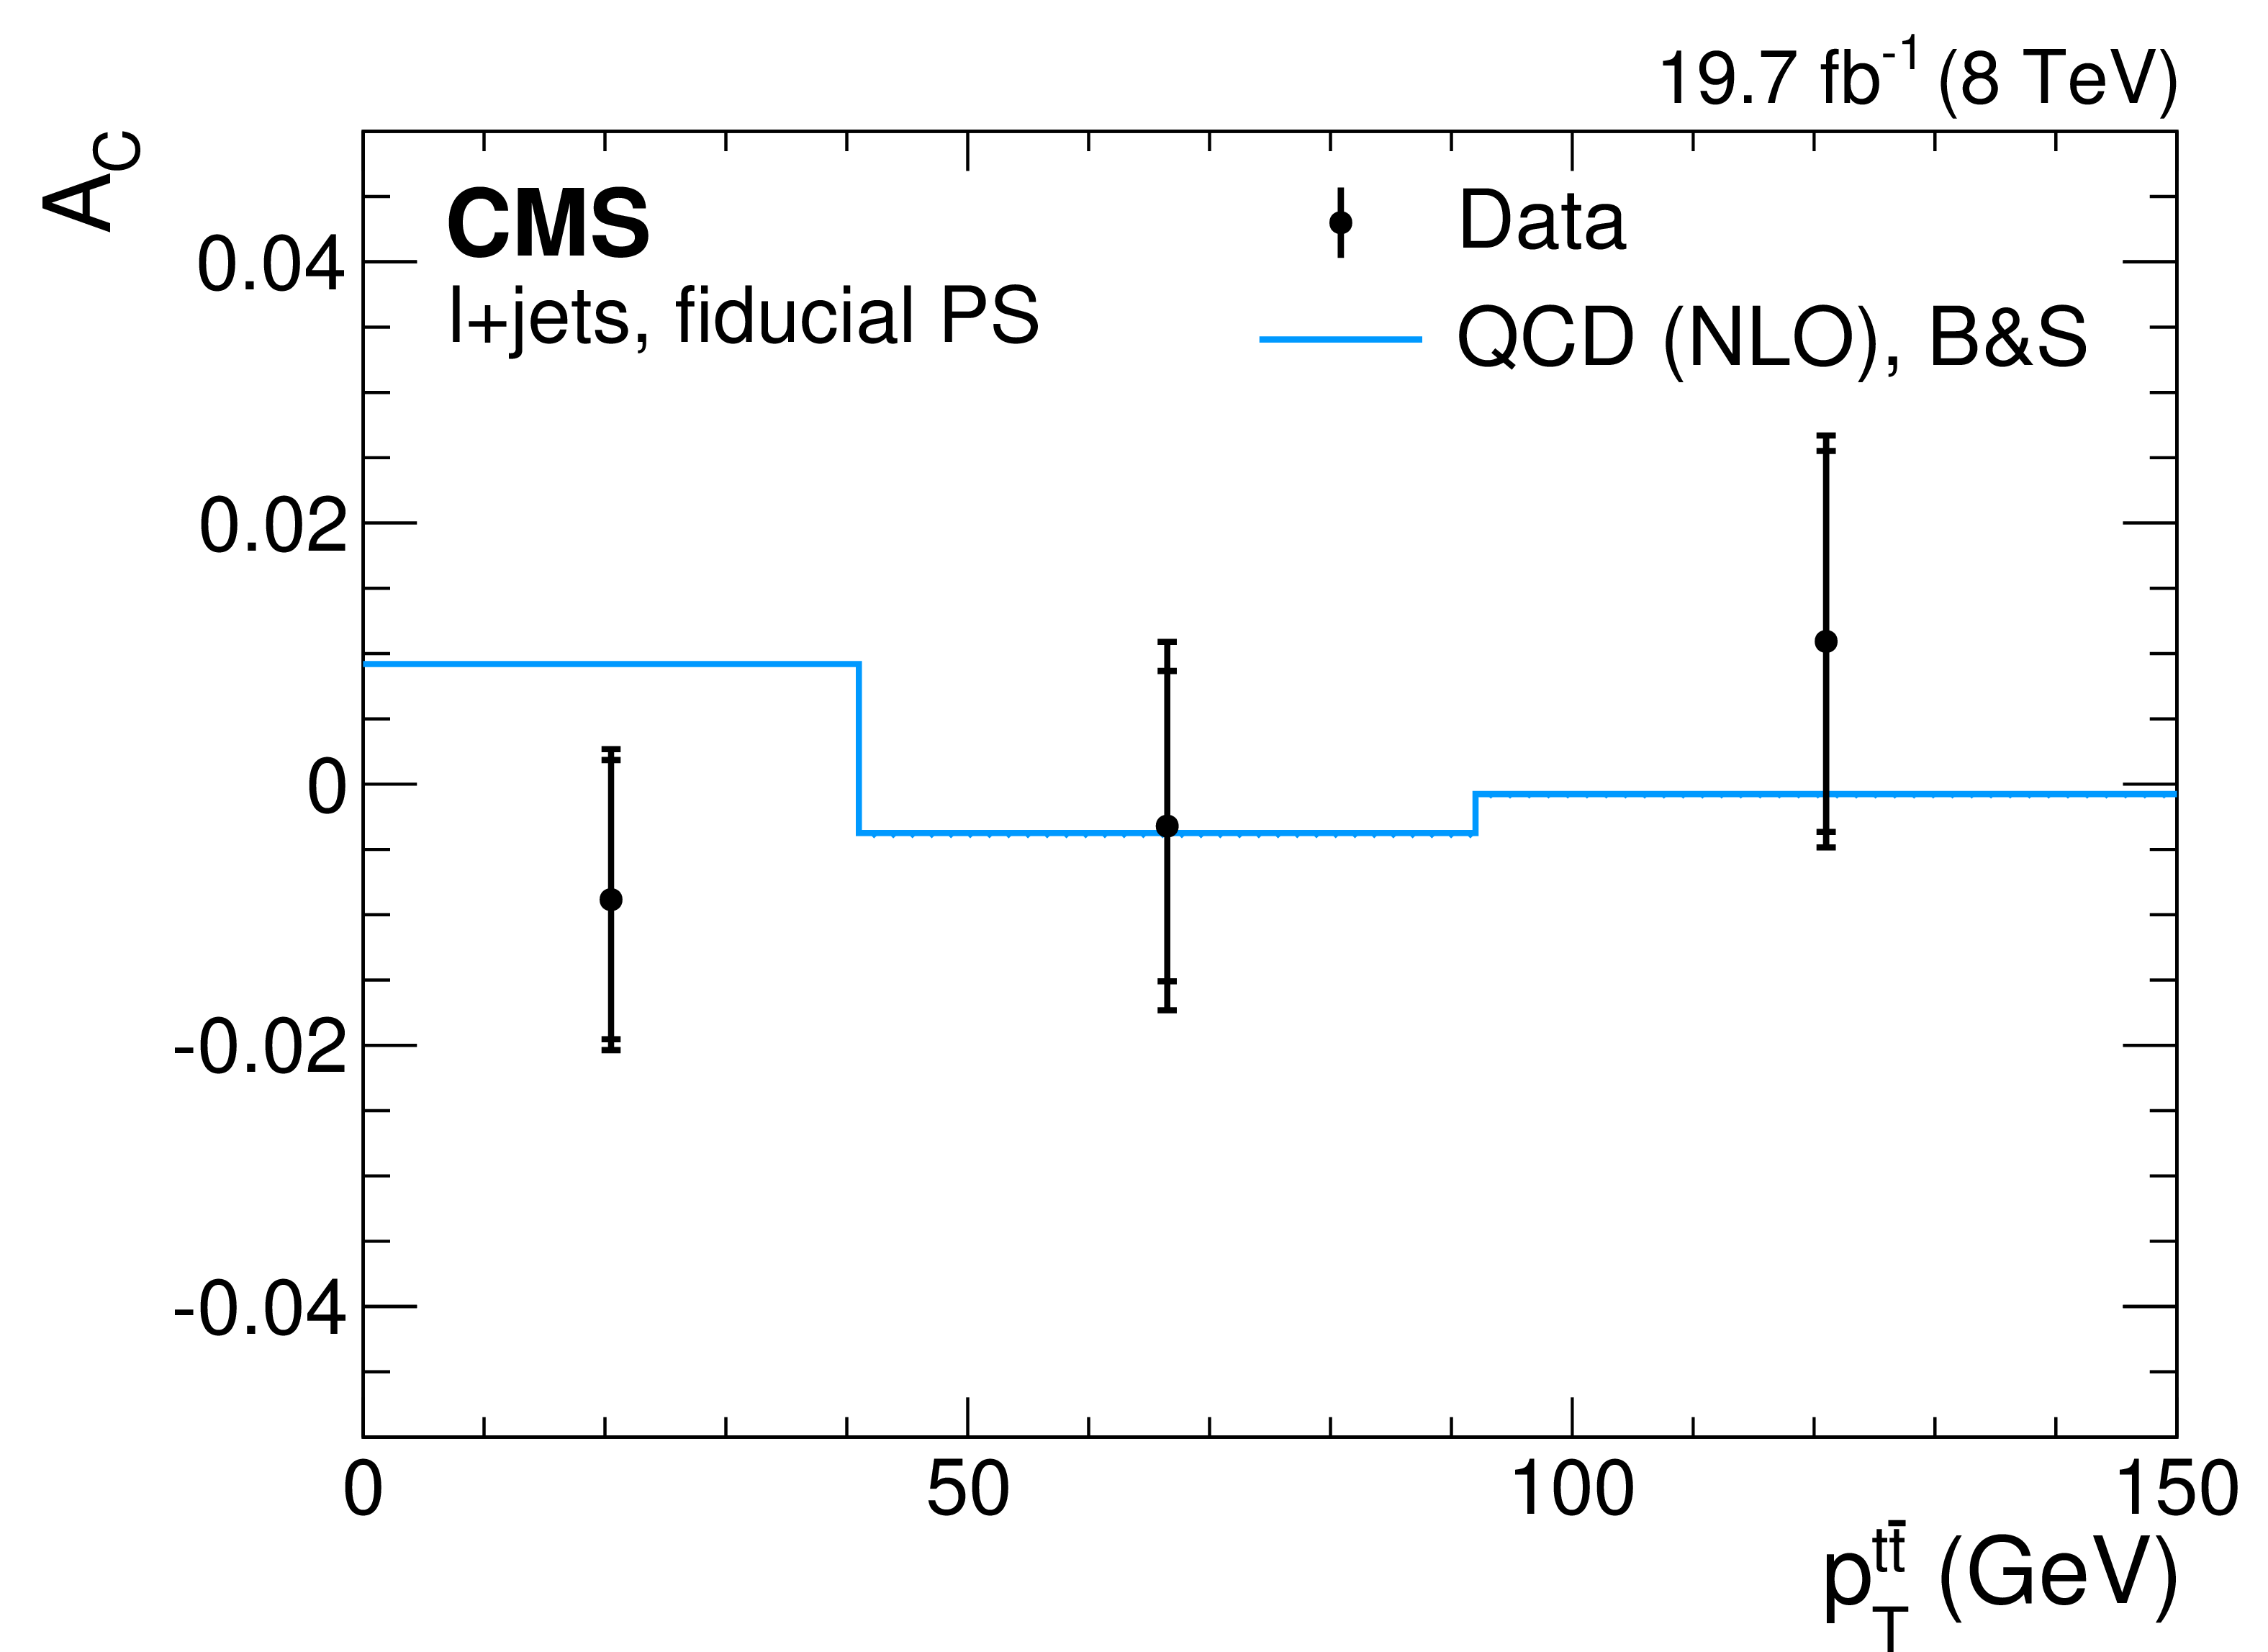
Corrected asymmetry as a function of $ {| y_{ {\mathrm{ t \bar{t} } } } | }$ (a), $p_\mathrm {T}^{ {\mathrm{ t \bar{t} } } }$ (b), and $m_{ {\mathrm{ t \bar{t} } } }$ (c and d). The latter is shown in two different binnings. All results correspond to the fiducial phase space. The measured values are compared to an NLO prediction for the SM based on calculations by Bernreuther and Si (B&S) [11,49]. The inner bars indicate the statistical uncertainties, while the outer bars represent the statistical and systematic uncertainties added in quadrature. |
png pdf |
Figure 4-b:
Corrected asymmetry as a function of $ {| y_{ {\mathrm{ t \bar{t} } } } | }$ (a), $p_\mathrm {T}^{ {\mathrm{ t \bar{t} } } }$ (b), and $m_{ {\mathrm{ t \bar{t} } } }$ (c and d). The latter is shown in two different binnings. All results correspond to the fiducial phase space. The measured values are compared to an NLO prediction for the SM based on calculations by Bernreuther and Si (B&S) [11,49]. The inner bars indicate the statistical uncertainties, while the outer bars represent the statistical and systematic uncertainties added in quadrature. |
png pdf |
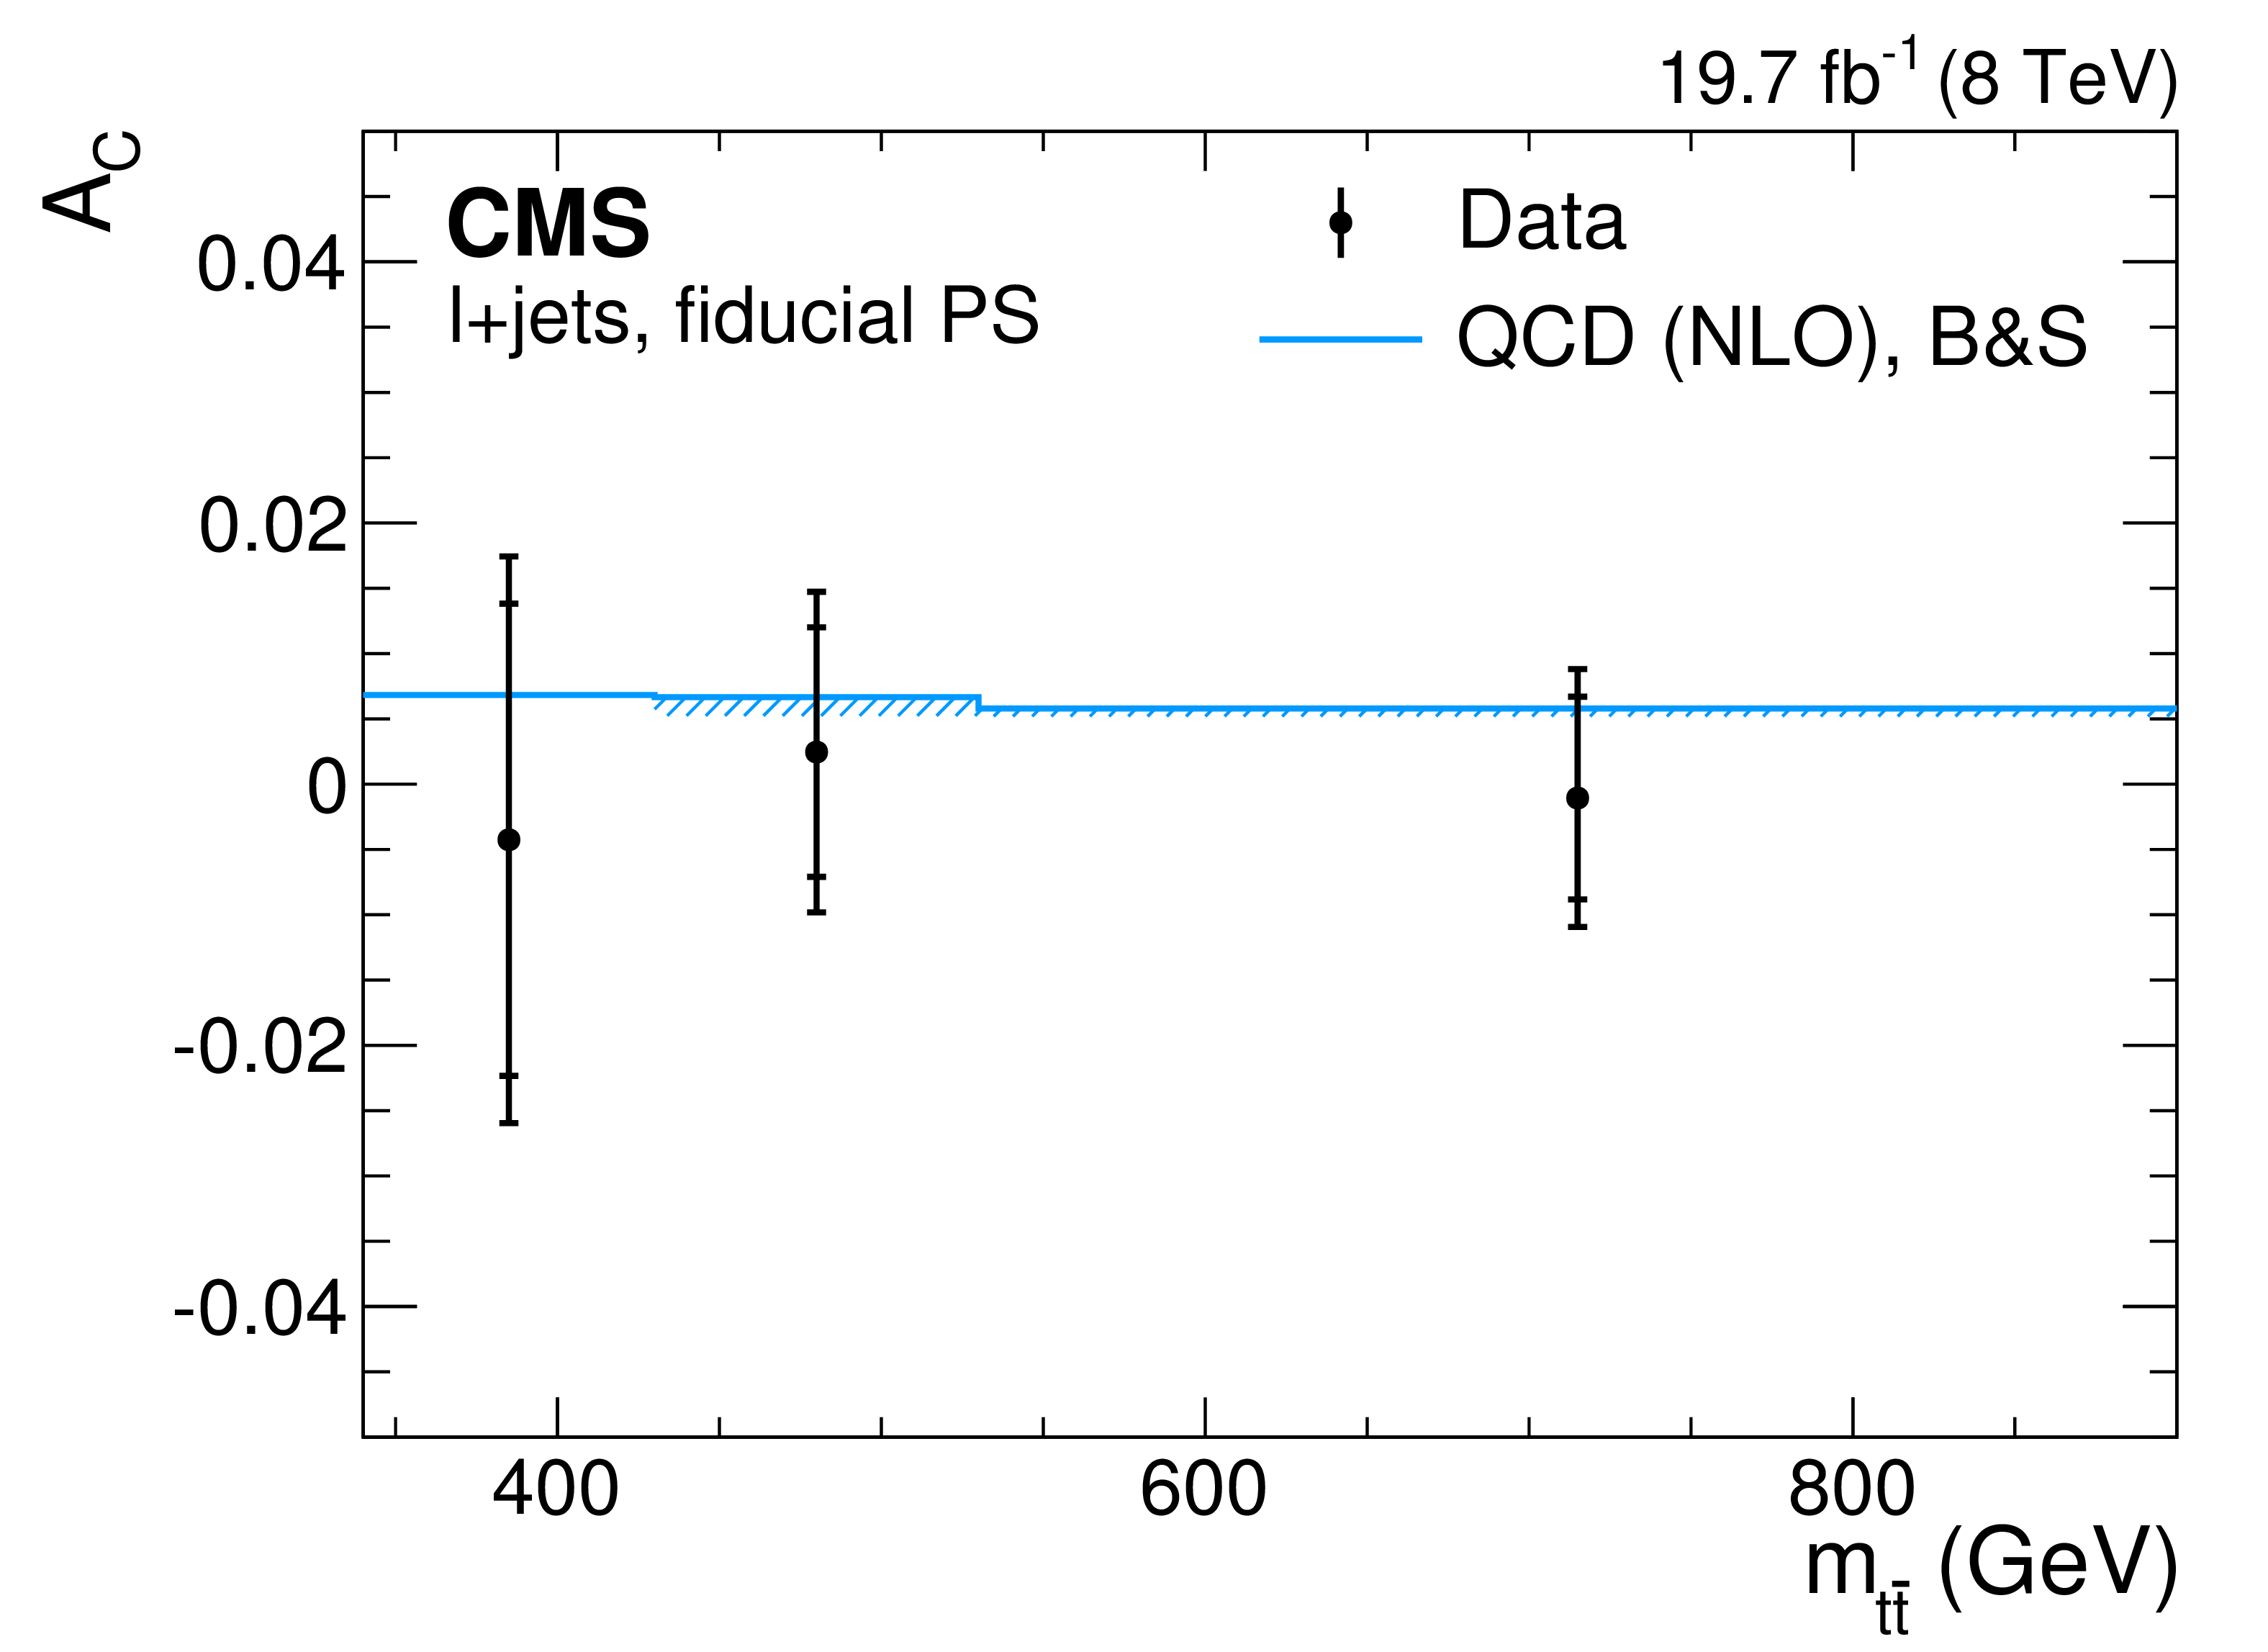
Figure 4-c:
Corrected asymmetry as a function of $ {| y_{ {\mathrm{ t \bar{t} } } } | }$ (a), $p_\mathrm {T}^{ {\mathrm{ t \bar{t} } } }$ (b), and $m_{ {\mathrm{ t \bar{t} } } }$ (c and d). The latter is shown in two different binnings. All results correspond to the fiducial phase space. The measured values are compared to an NLO prediction for the SM based on calculations by Bernreuther and Si (B&S) [11,49]. The inner bars indicate the statistical uncertainties, while the outer bars represent the statistical and systematic uncertainties added in quadrature. |
png pdf |
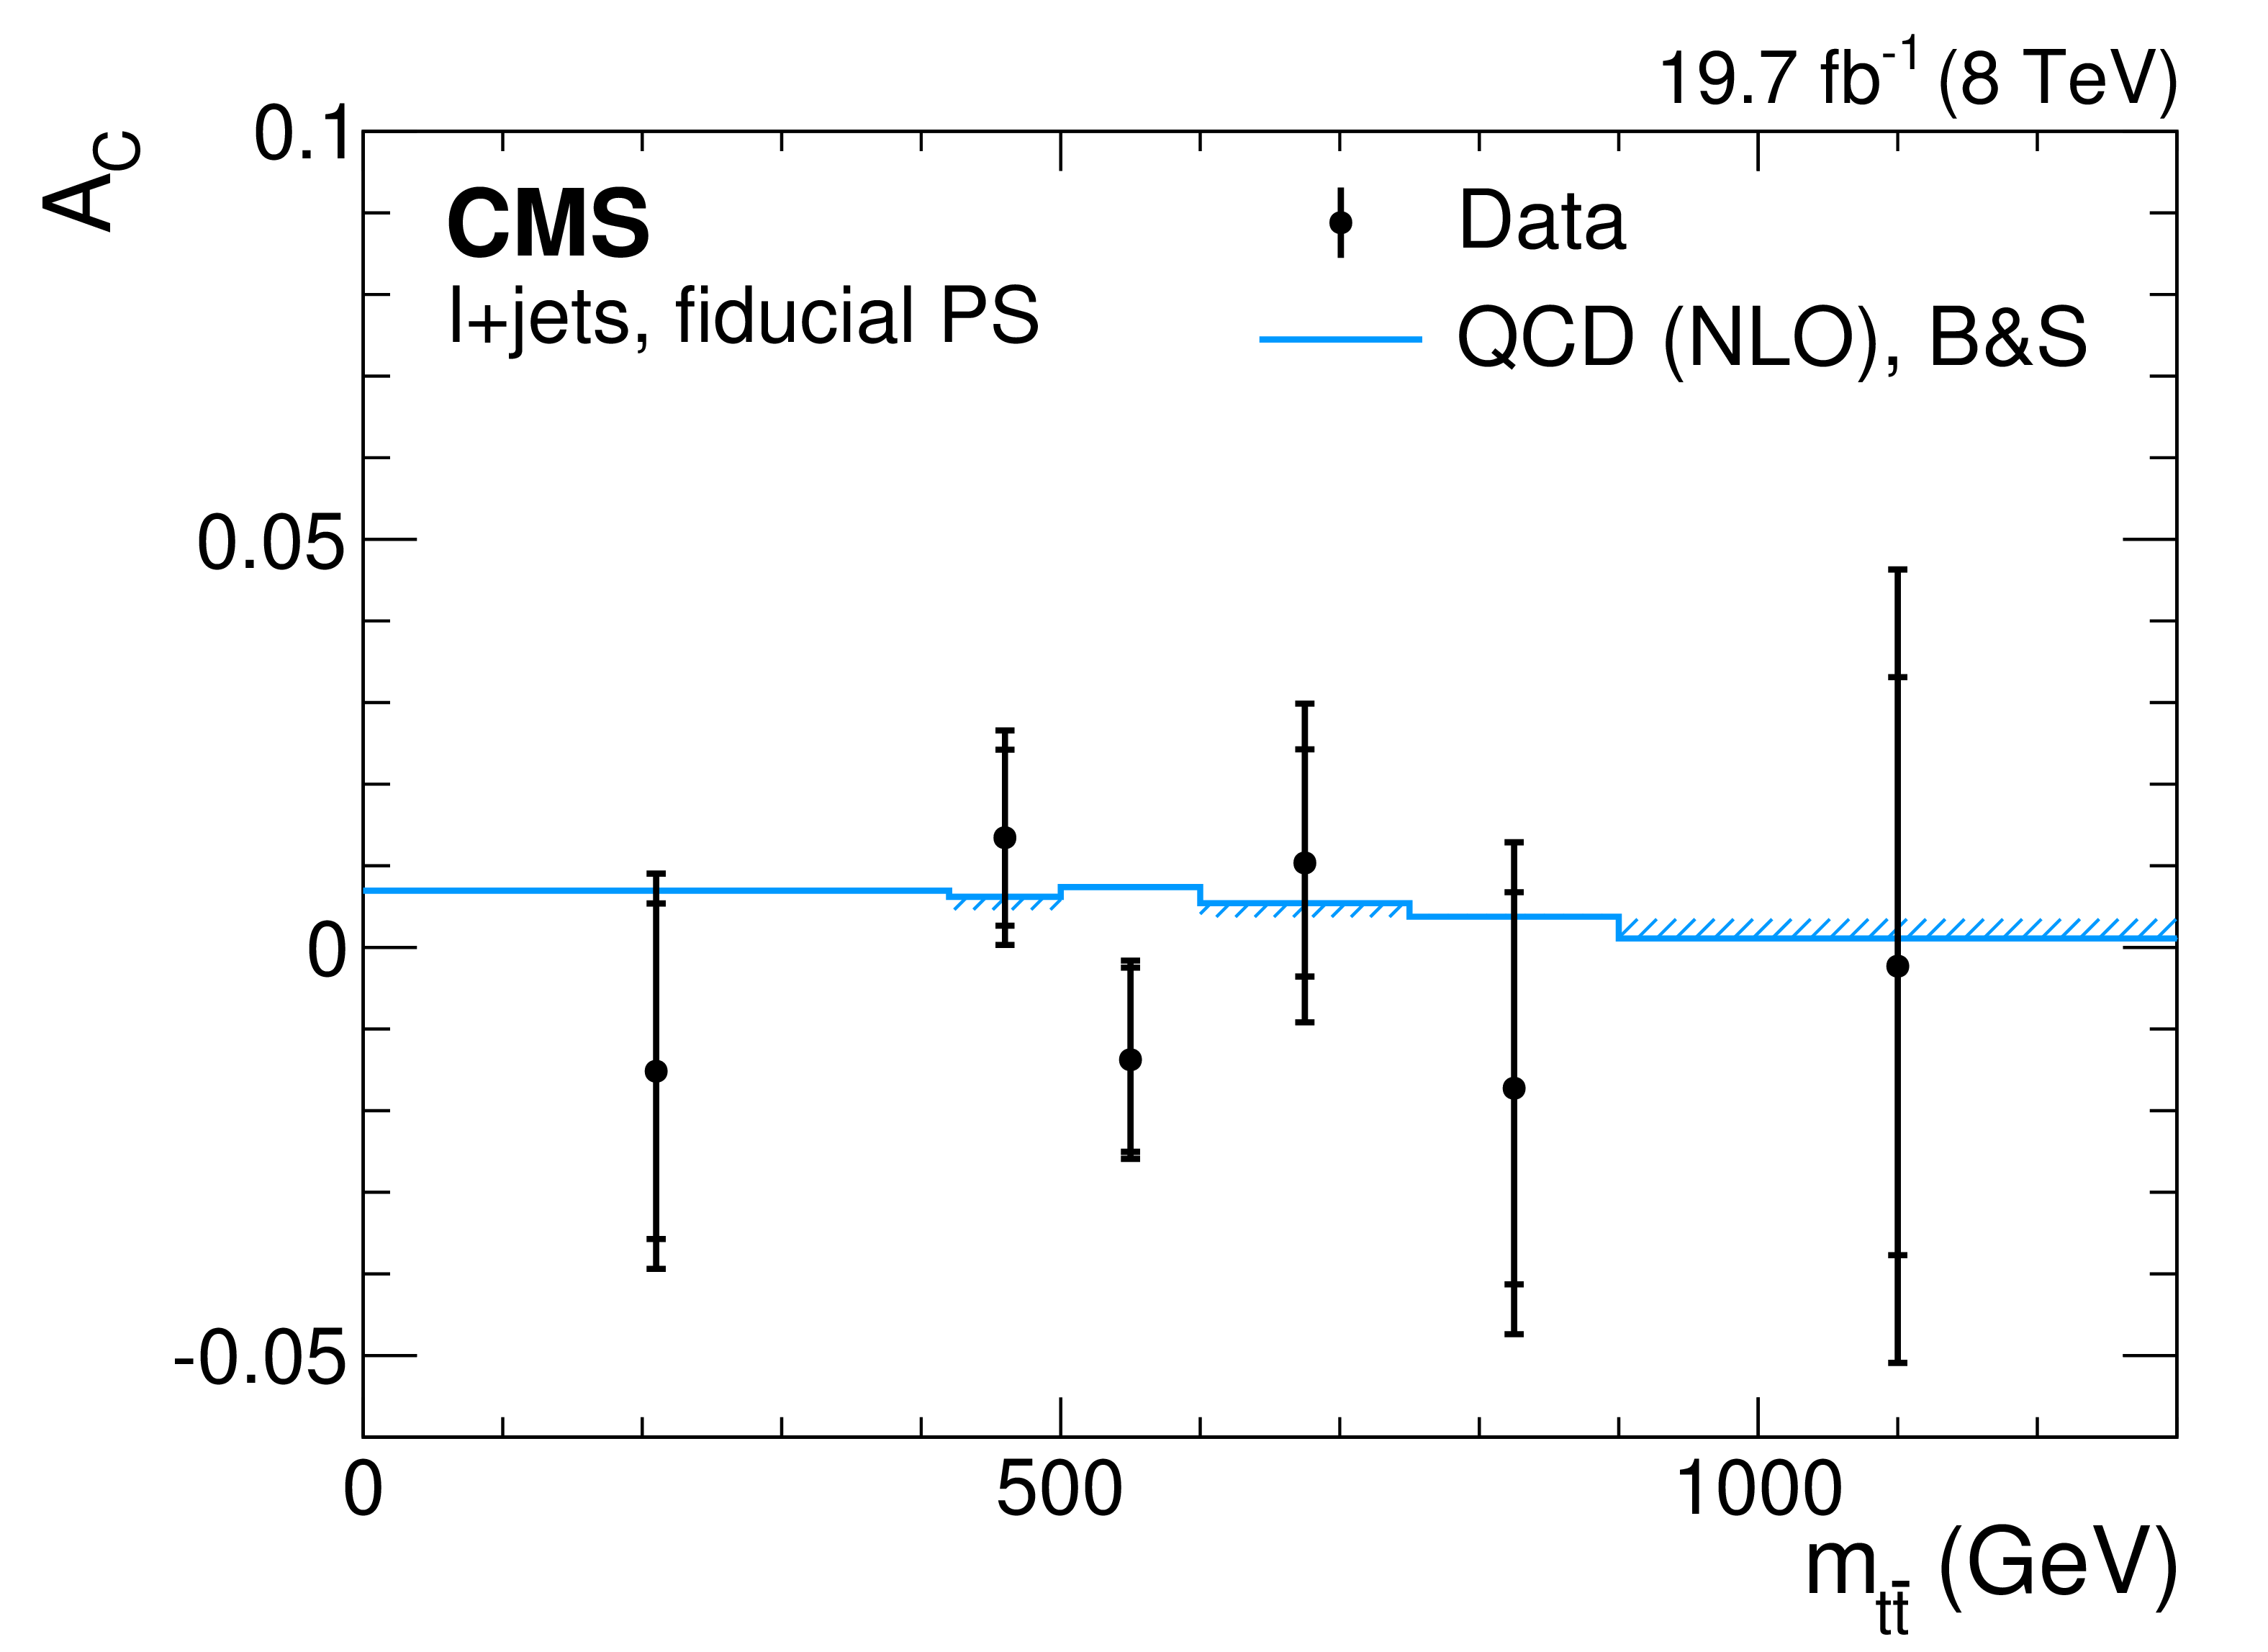
Figure 4-d:
Corrected asymmetry as a function of $ {| y_{ {\mathrm{ t \bar{t} } } } | }$ (a), $p_\mathrm {T}^{ {\mathrm{ t \bar{t} } } }$ (b), and $m_{ {\mathrm{ t \bar{t} } } }$ (c and d). The latter is shown in two different binnings. All results correspond to the fiducial phase space. The measured values are compared to an NLO prediction for the SM based on calculations by Bernreuther and Si (B&S) [11,49]. The inner bars indicate the statistical uncertainties, while the outer bars represent the statistical and systematic uncertainties added in quadrature. |
png pdf |
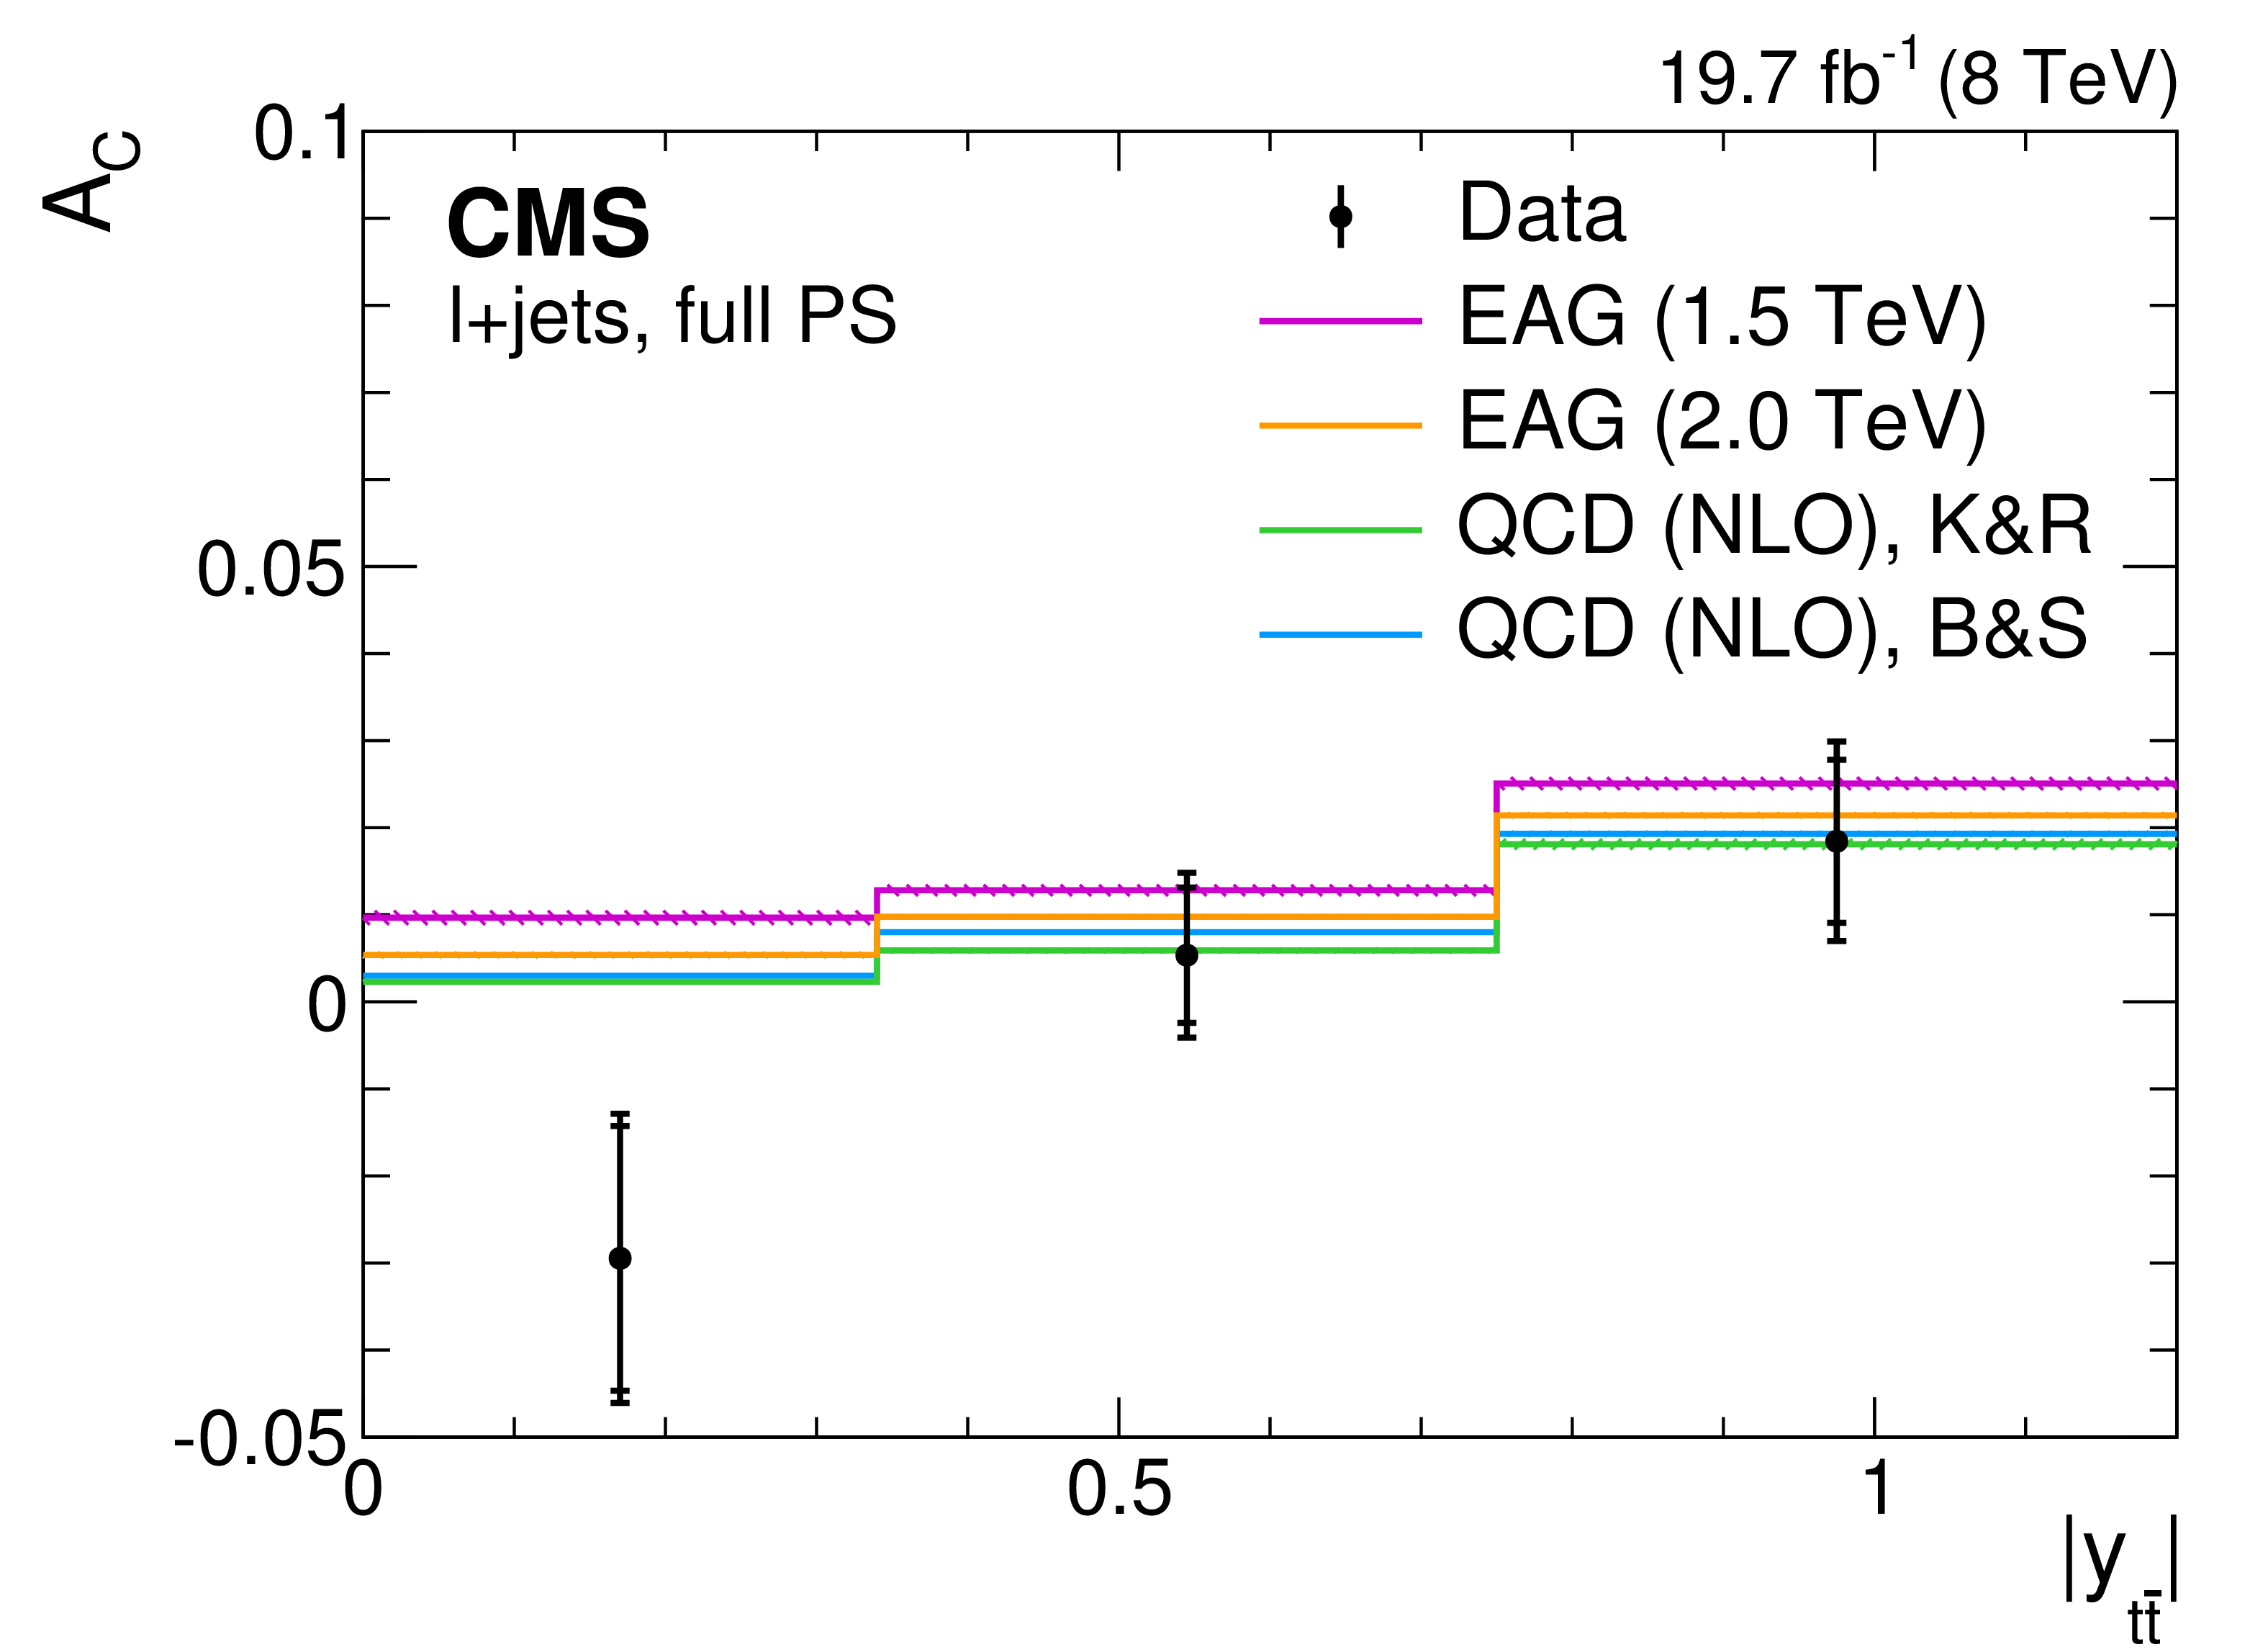
Figure 5-a:
Corrected asymmetry as a function of $ {| y_{ {\mathrm{ t \bar{t} } } } | }$ (a), $p_\mathrm {T}^{ {\mathrm{ t \bar{t} } } }$ (b), and $m_{ {\mathrm{ t \bar{t} } } }$ (c and d). The latter is shown in two different binnings. All results correspond to the full phase space. The measured values are compared to NLO predictions for the SM based on calculations by Kuhn and Rodrigo (K&R) [10] and Bernreuther and Si (B&S) [11,49], as well as to the predictions of a model featuring an effective axial-vector coupling of the gluon (EAG) [52,53]. The inner bars indicate the statistical uncertainties, while the outer bars represent the statistical and systematic uncertainties added in quadrature. |

png pdf |
Figure 5-b:
Corrected asymmetry as a function of $ {| y_{ {\mathrm{ t \bar{t} } } } | }$ (a), $p_\mathrm {T}^{ {\mathrm{ t \bar{t} } } }$ (b), and $m_{ {\mathrm{ t \bar{t} } } }$ (c and d). The latter is shown in two different binnings. All results correspond to the full phase space. The measured values are compared to NLO predictions for the SM based on calculations by Kuhn and Rodrigo (K&R) [10] and Bernreuther and Si (B&S) [11,49], as well as to the predictions of a model featuring an effective axial-vector coupling of the gluon (EAG) [52,53]. The inner bars indicate the statistical uncertainties, while the outer bars represent the statistical and systematic uncertainties added in quadrature. |
png pdf |
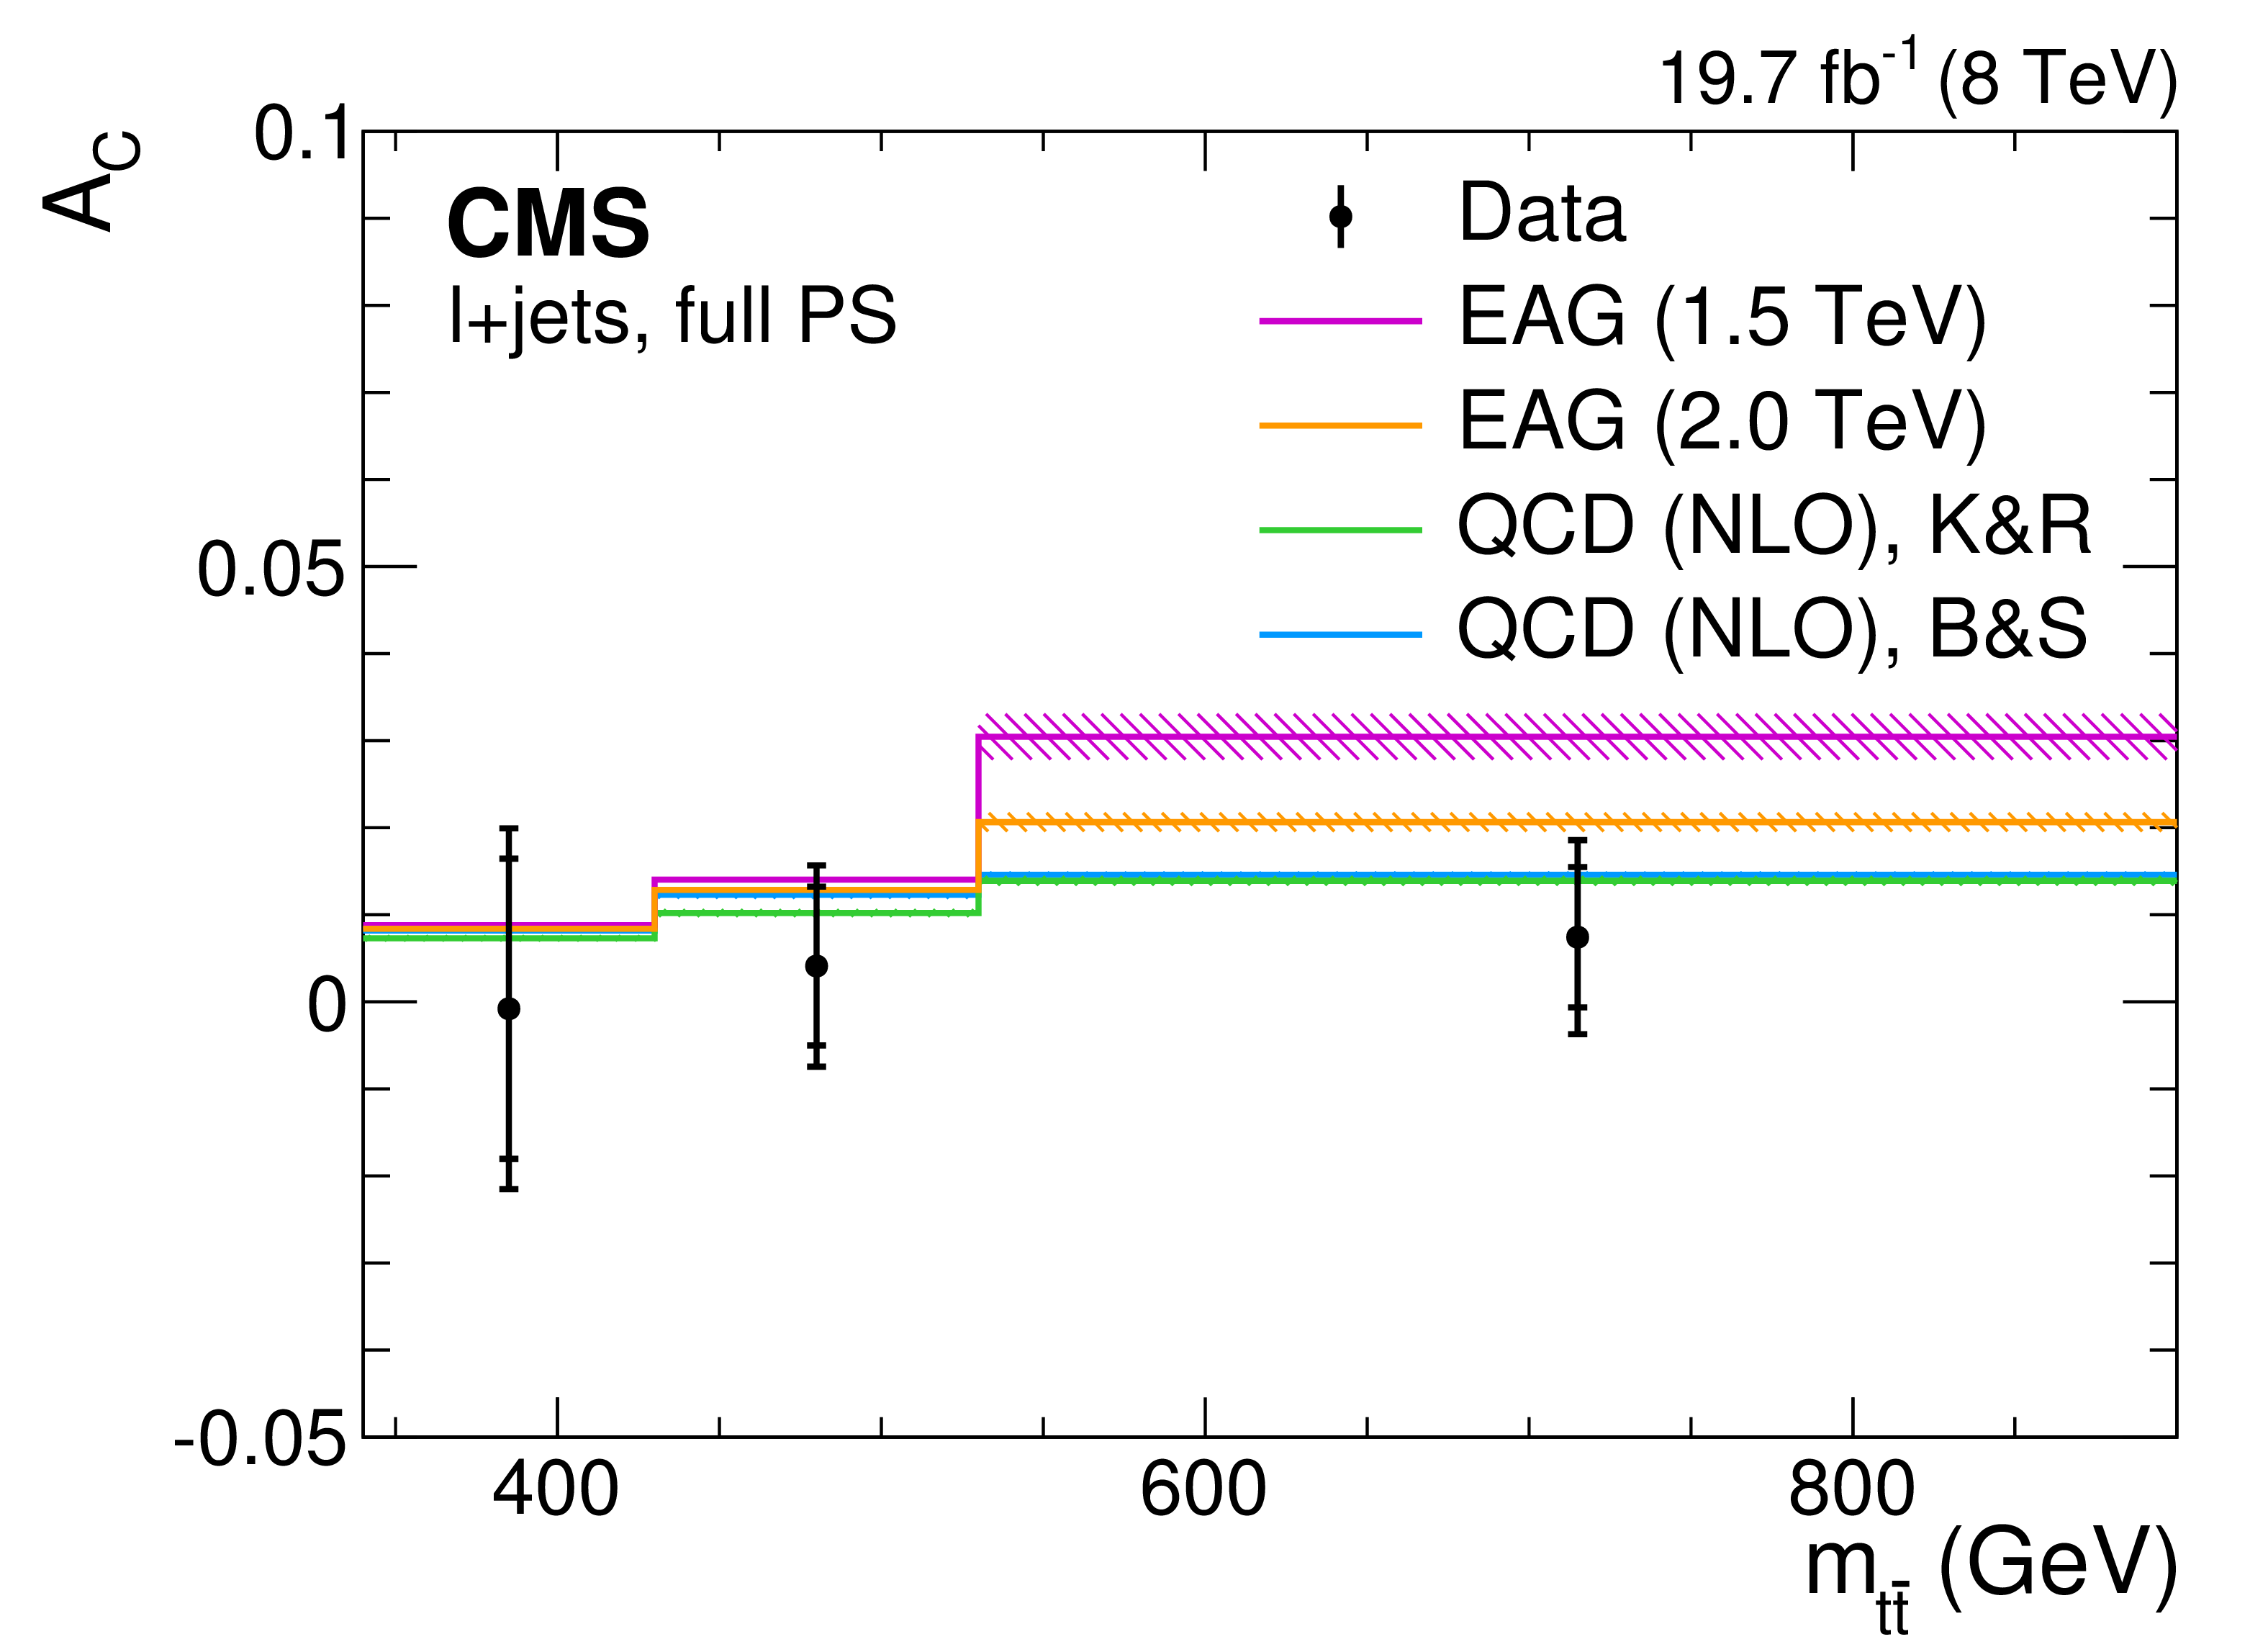
Figure 5-c:
Corrected asymmetry as a function of $ {| y_{ {\mathrm{ t \bar{t} } } } | }$ (a), $p_\mathrm {T}^{ {\mathrm{ t \bar{t} } } }$ (b), and $m_{ {\mathrm{ t \bar{t} } } }$ (c and d). The latter is shown in two different binnings. All results correspond to the full phase space. The measured values are compared to NLO predictions for the SM based on calculations by Kuhn and Rodrigo (K&R) [10] and Bernreuther and Si (B&S) [11,49], as well as to the predictions of a model featuring an effective axial-vector coupling of the gluon (EAG) [52,53]. The inner bars indicate the statistical uncertainties, while the outer bars represent the statistical and systematic uncertainties added in quadrature. |
png pdf |
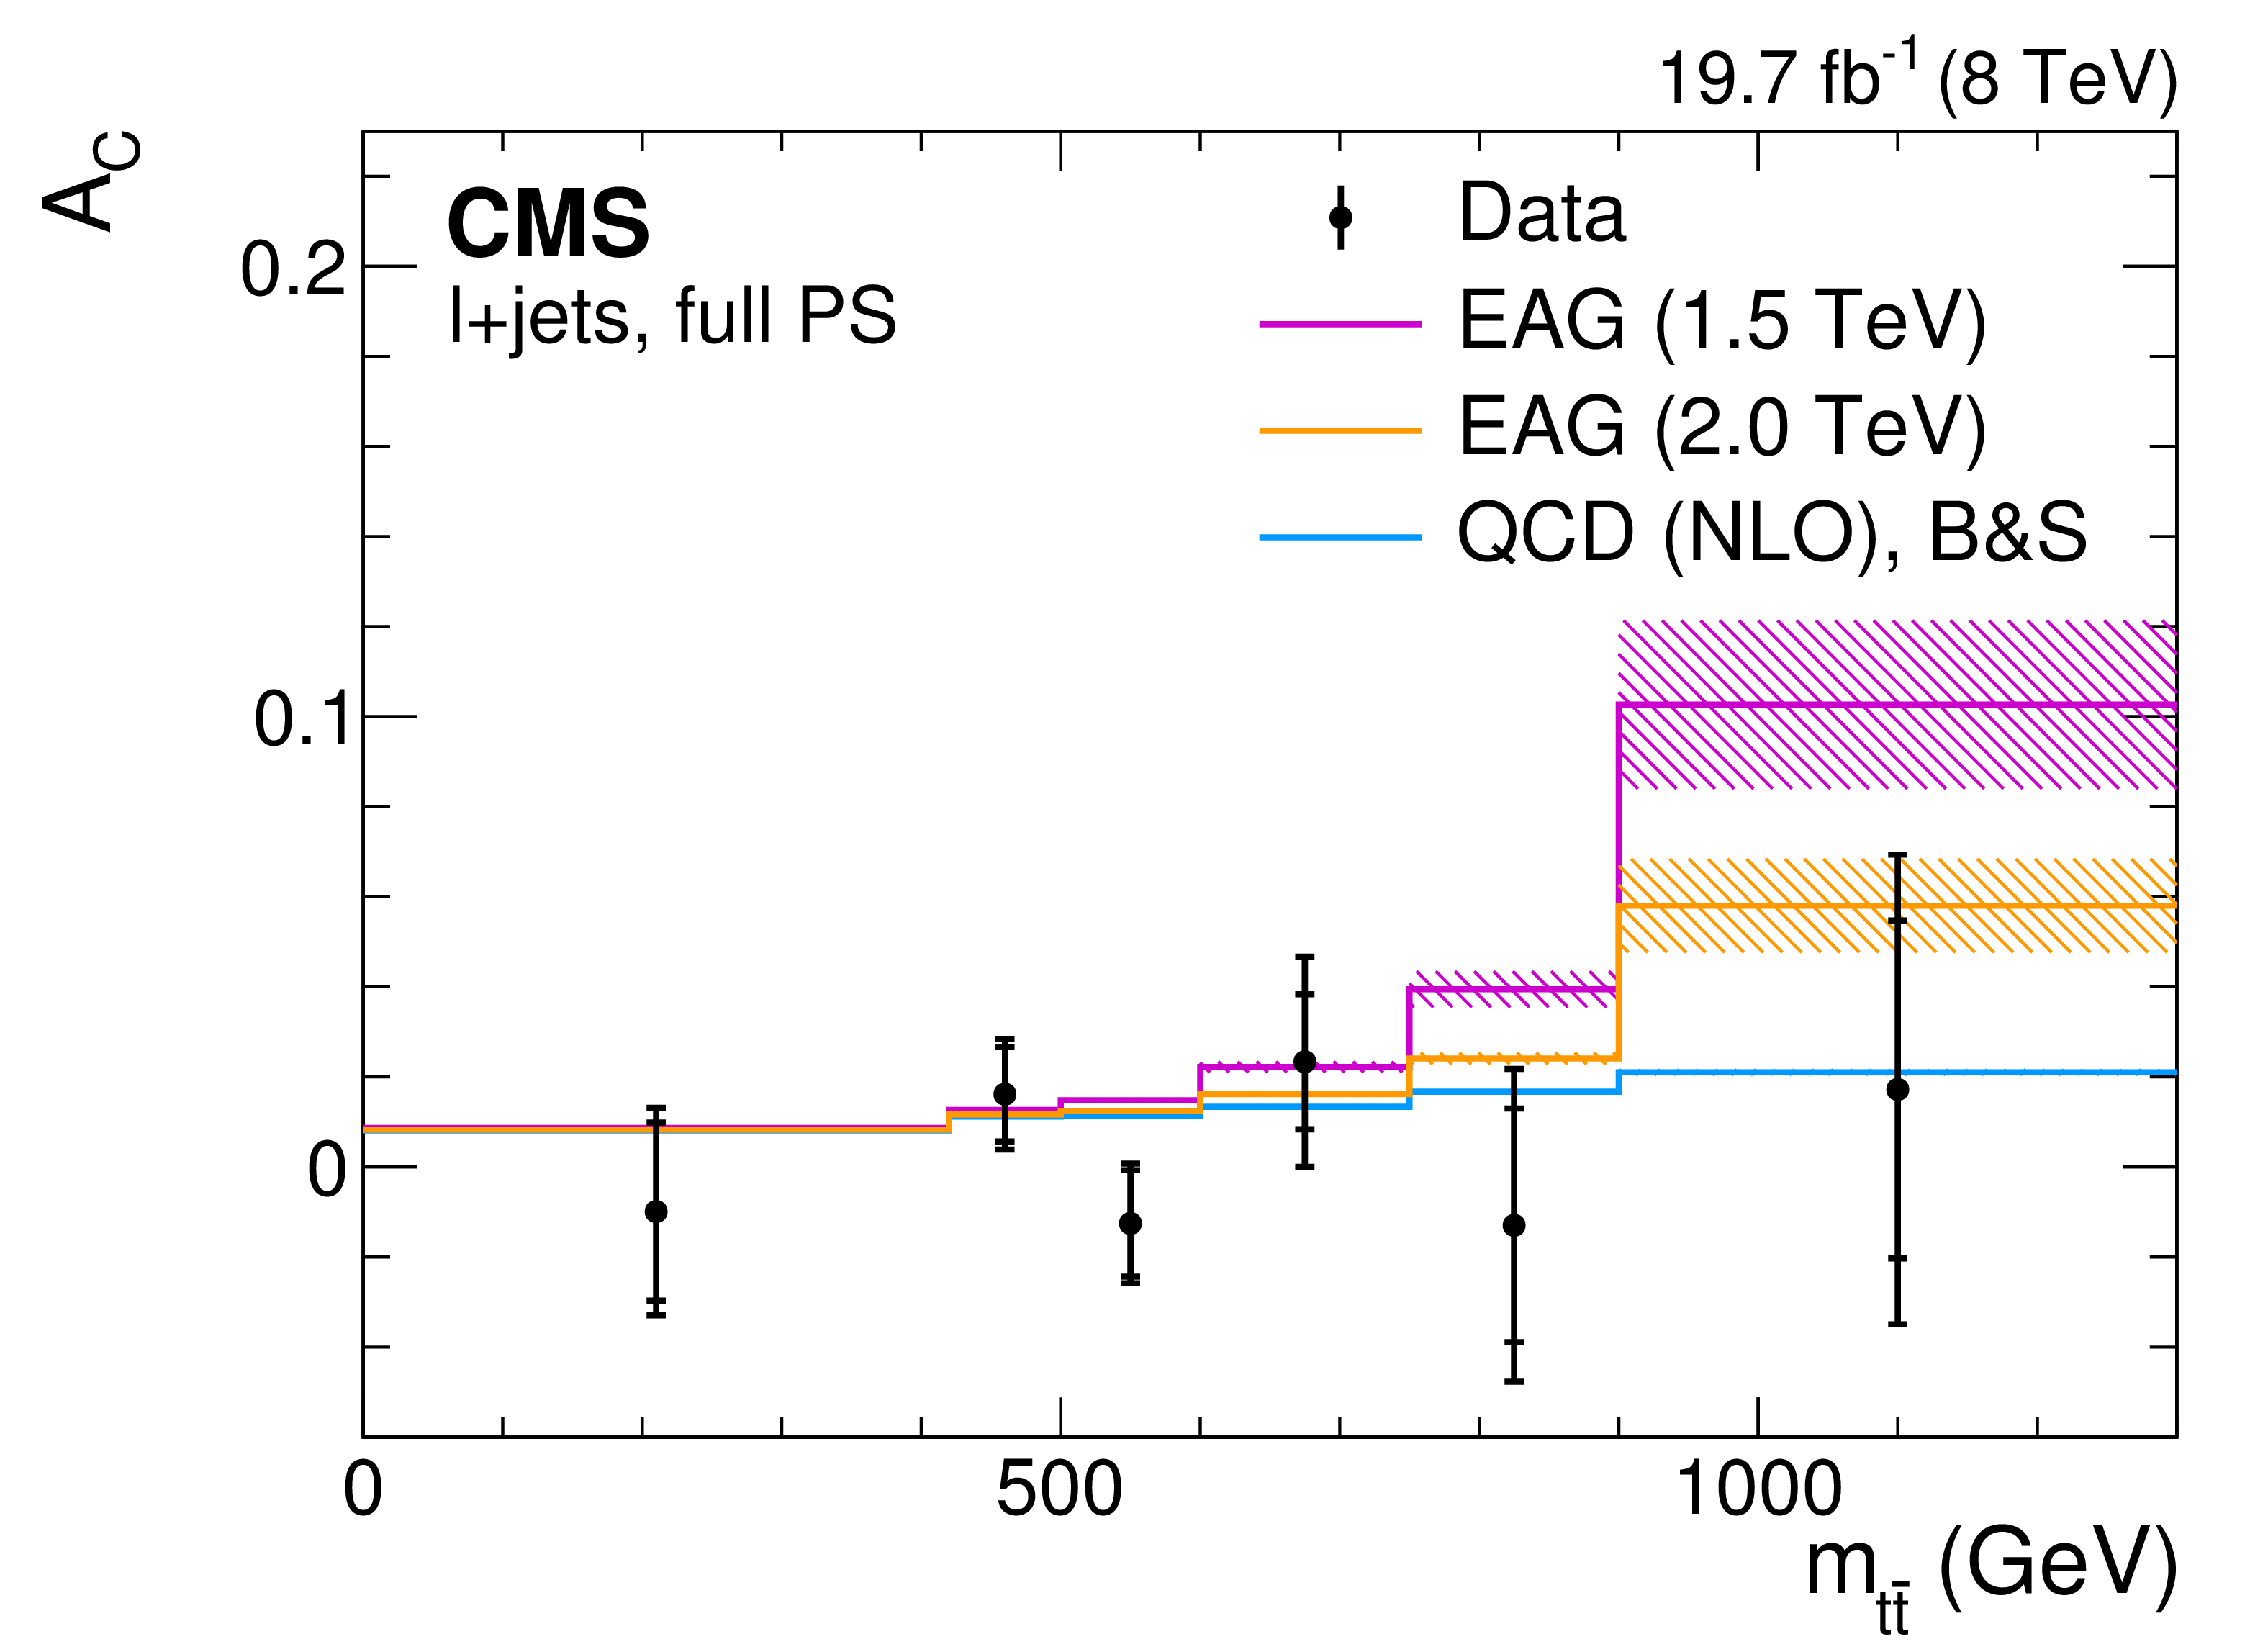
Figure 5-d:
Corrected asymmetry as a function of $ {| y_{ {\mathrm{ t \bar{t} } } } | }$ (a), $p_\mathrm {T}^{ {\mathrm{ t \bar{t} } } }$ (b), and $m_{ {\mathrm{ t \bar{t} } } }$ (c and d). The latter is shown in two different binnings. All results correspond to the full phase space. The measured values are compared to NLO predictions for the SM based on calculations by Kuhn and Rodrigo (K&R) [10] and Bernreuther and Si (B&S) [11,49], as well as to the predictions of a model featuring an effective axial-vector coupling of the gluon (EAG) [52,53]. The inner bars indicate the statistical uncertainties, while the outer bars represent the statistical and systematic uncertainties added in quadrature. |
| Tables | |
png pdf |
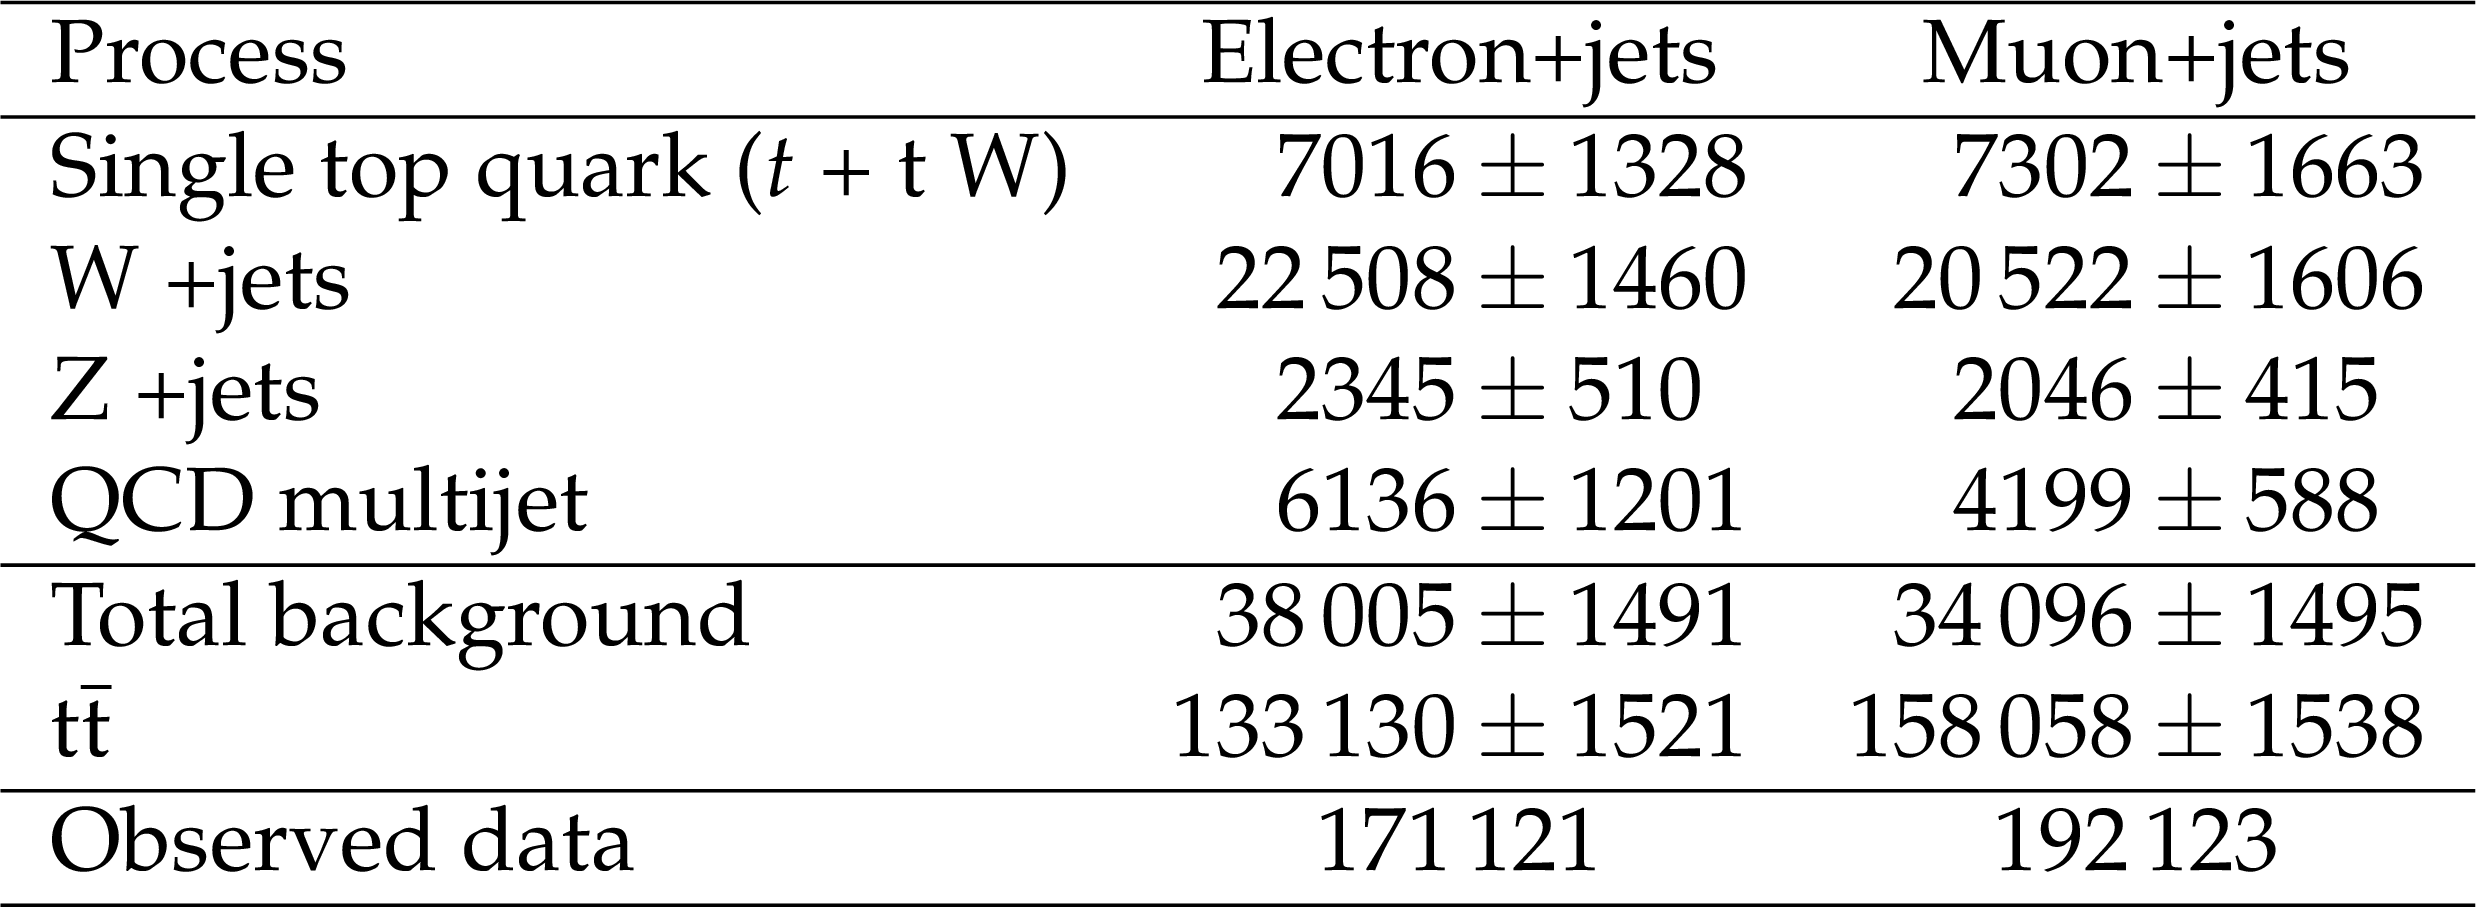
Table 1:
Number of events for background and $ {\mathrm{ t \bar{t} } } $ contributions from fits to data, along with their statistical uncertainties. The correlations between the individual values have been taken into account for the determination of the uncertainty on the total background yield. The uncertainties quoted for the single top quark and Z+jets backgrounds are driven by the constraints used as inputs for the likelihood fit. |
png pdf |
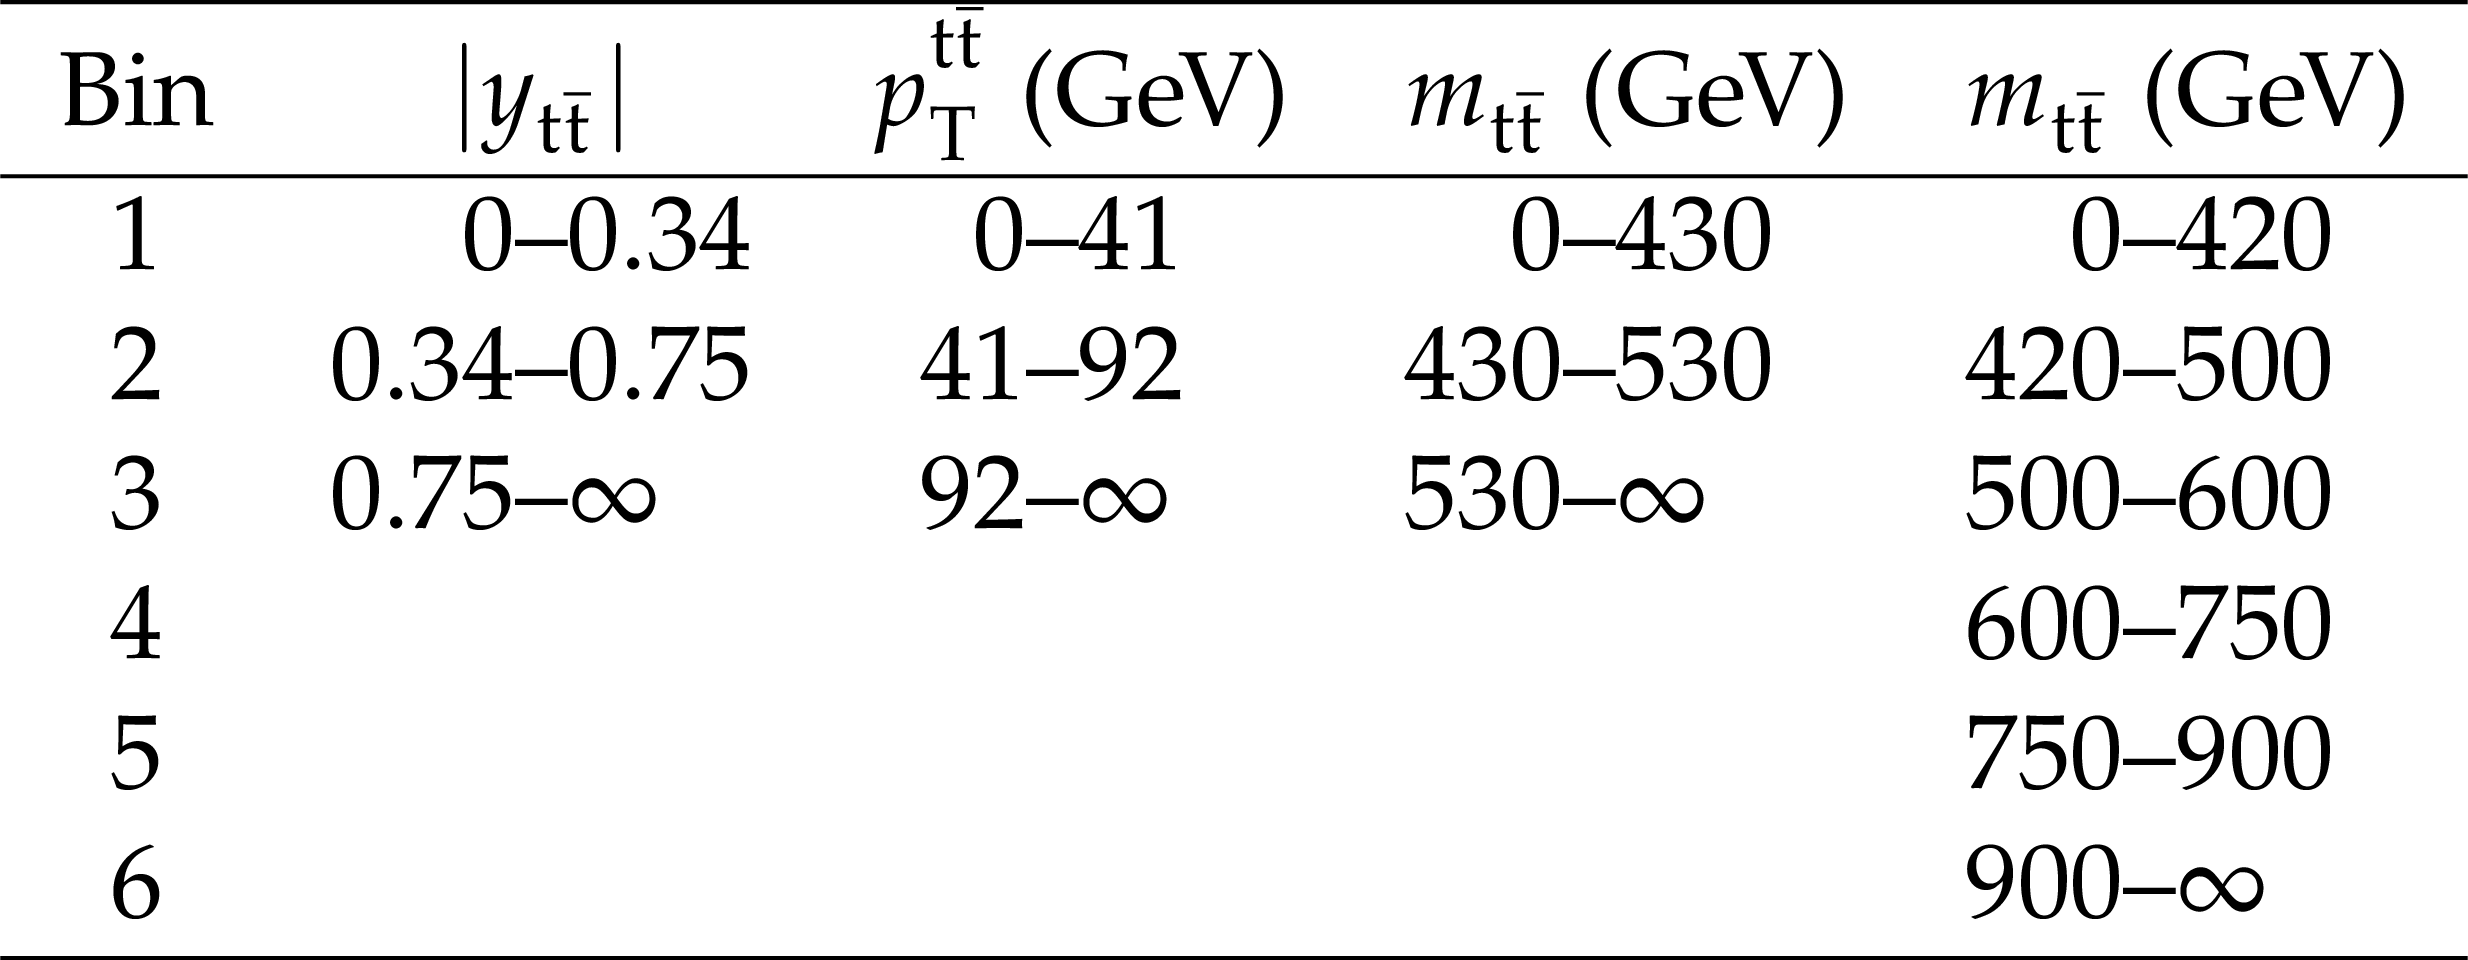
Table 2:
The bin ranges for the individual bins of the differential measurements. Two different choices of binning are used for the distribution of $m_{ {\mathrm{ t \bar{t} } } }$. |

png pdf |
Table 3:
Uncertainties for the inclusive measurement of $A_{\mathrm {C}}$ and ranges of uncertainties for the differential measurements using three bins for the kinematic variable. Numbers are given for measurements in the fiducial phase space (fid. PS) and in the full phase space (full PS). |
png pdf |
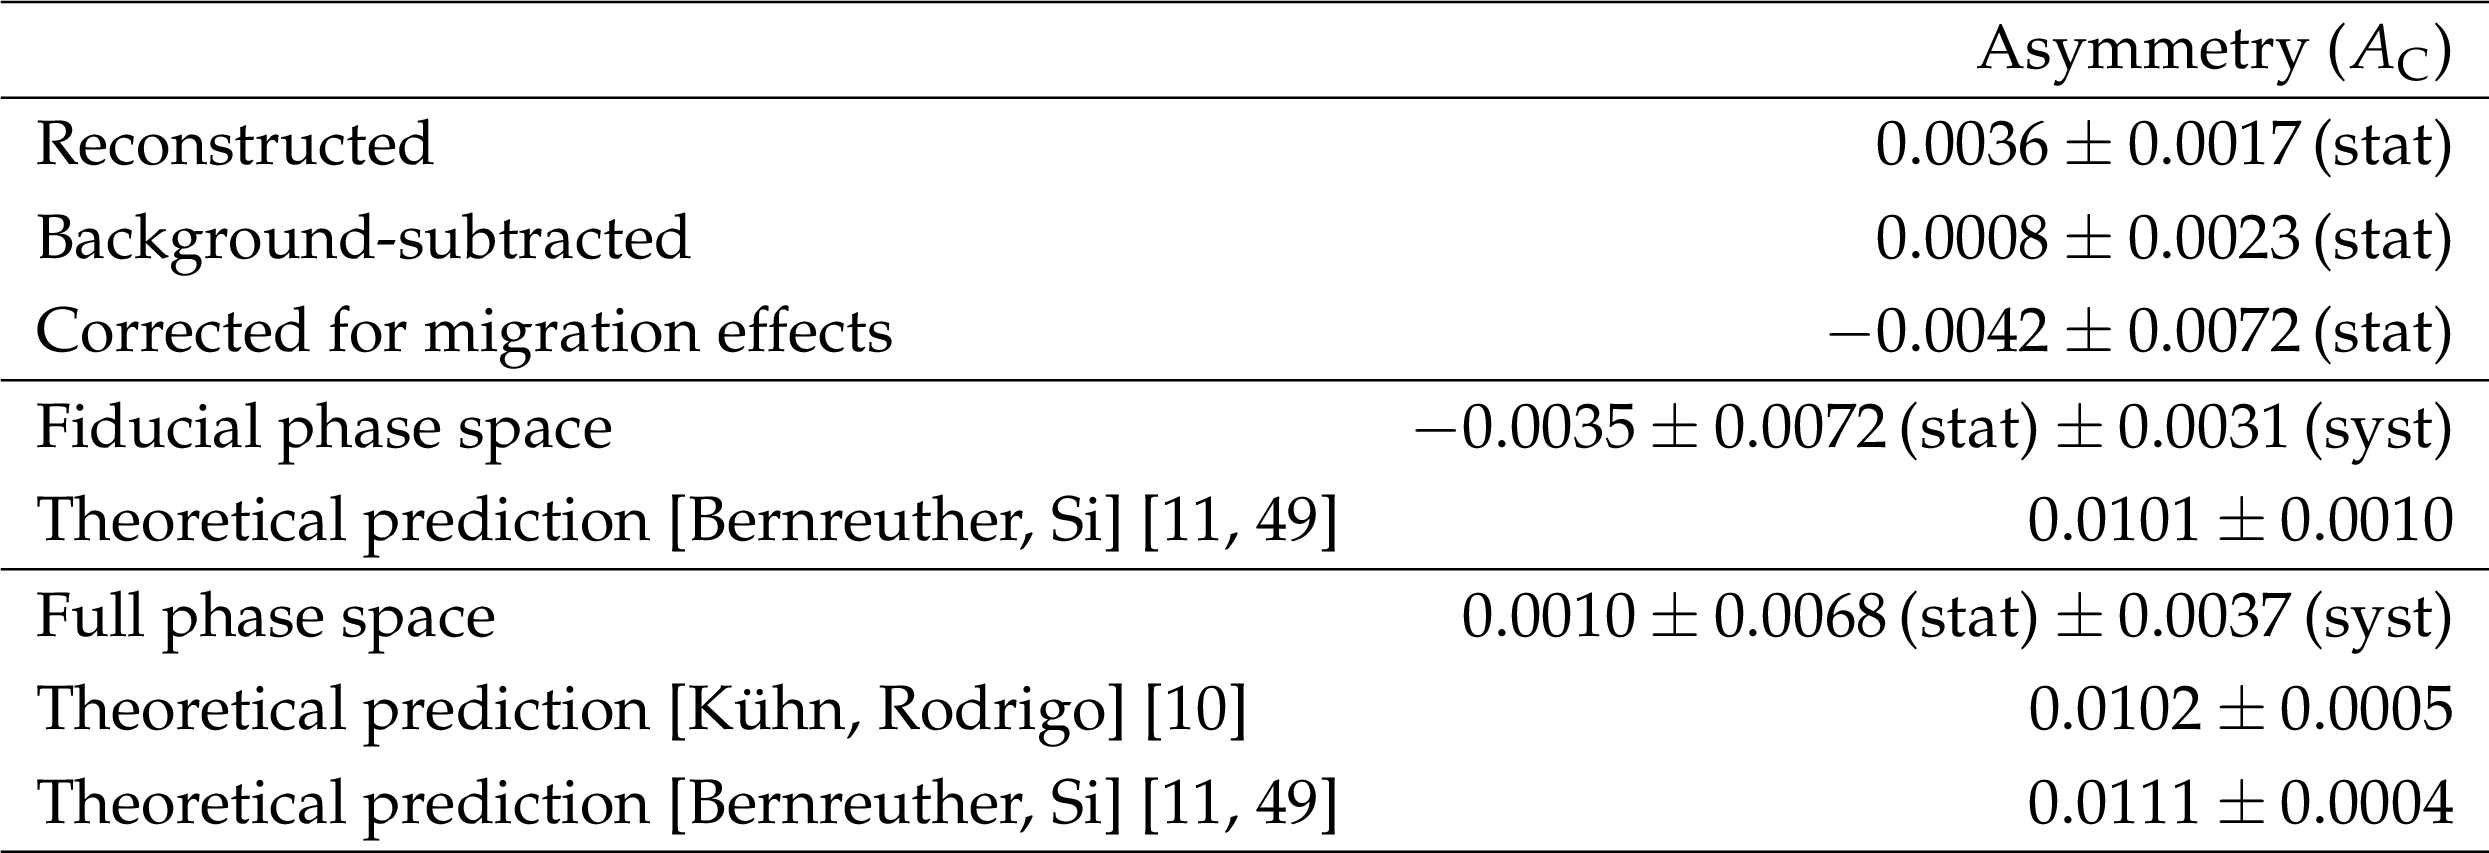
Table 4:
The measured inclusive asymmetry at the different stages of the analysis and the corresponding theoretical predictions from the SM. |
| Summary |
| Inclusive and differential measurements of the charge asymmetry in $\mathrm{ t \bar{t} }$ production at the LHC are presented. The data sample, collected in proton-proton collisions at $ \sqrt{s} = $ 8 TeV with the CMS detector, corresponds to an integrated luminosity of 19.7 fb$^{-1}$. Events with top quark pairs decaying into the electron+jets and muon+jets channels are selected and a full $\mathrm{ t \bar{t} } $ event reconstruction is performed to determine the four-momenta of the top quarks and antiquarks. The observed distributions are then corrected for acceptance and reconstruction effects. For the first time at the LHC, acceptance corrections to the $\mathrm{ t \bar{t} } $charge asymmetry are performed not only to the full phase space but also to a fiducial phase space. Within two standard deviations, all measured values are consistent with the predictions of the standard model and no hint of new physics contributions is observed. The charge asymmetry in the high-mass region is about two standard deviations below the predictions from an effective field theory with the scale for new physics at 1.5 TeV. |
|
|
Compact Muon Solenoid LHC, CERN |
|

|

|

|

|

|