

Compact Muon Solenoid
LHC, CERN
| CMS-TOP-12-038 ; CERN-PH-EP-2014-032 | ||
| Measurement of the $ t $-channel single-top-quark production cross section and of the $ | V_{ \mathrm{tb} } | $ CKM matrix element in pp collisions at $ \sqrt{s} $ = 8 TeV | ||
| CMS Collaboration | ||
| 24 March 2014 | ||
| J. High Energy Phys. 06 (2014) 090 | ||
| Abstract: Measurements are presented of the $t$-channel single-top-quark production cross section in proton-proton collisions at $ \sqrt{s} $ = 8 TeV. The results are based on a data sample corresponding to an integrated luminosity of 19.7 fb$ ^{-1} $ recorded with the CMS detector at the LHC. The cross section is measured inclusively, as well as separately for top ($ \mathrm{t} $) and antitop ($ \mathrm{ \bar{t} } $), in final states with a muon or an electron. The measured inclusive $t$-channel cross section is $ \sigma_{ t\text{-channel} } $ = 83.6 $\pm$ 2.3 (stat) $\pm$ 7.4 (syst) pb. The single $ \mathrm{t} $ and $ \mathrm{ \bar{t} } $ cross sections are measured to be $\sigma_{t\text{-channel} } ( \mathrm{t} ) $ = 53.8 $ \pm $ 1.5 (stat) $ \pm $ 4.4 (syst) pb and $\sigma_{t\text{-channel} } ( \mathrm{ \bar{t} } ) $ = 27.6 $\pm$ 1.3 (stat) $\pm$ 3.7 (syst) pb, respectively. The measured ratio of cross sections is $R_{ \text{ } } $ = $ \sigma_{t\text{-channel} } ( \mathrm{t} ) / \sigma_{t\text{-channel} } ( \mathrm{ \bar{t} } ) $ = 1.95 $\pm$ 0.10 (stat) $\pm$ 0.19 (syst), in agreement with the standard model prediction. The modulus of the Cabibbo-Kobayashi-Maskawa matrix element |$ V_{ \mathrm{tb} } $| is extracted and, in combination with a previous CMS result at $ \sqrt{s} $ = 7 TeV, a value |$ V_{ \mathrm{tb} } $| = 0.998 $\pm$ 0.038 (exp) $\pm$ 0.016 (theo) is obtained. | ||
| Links: e-print arXiv:1403.7366 [hep-ex] (PDF) ; CDS record ; inSPIRE record ; Public twiki page ; HepData record ; CADI line (restricted) ; | ||
| Figures | |
png pdf |
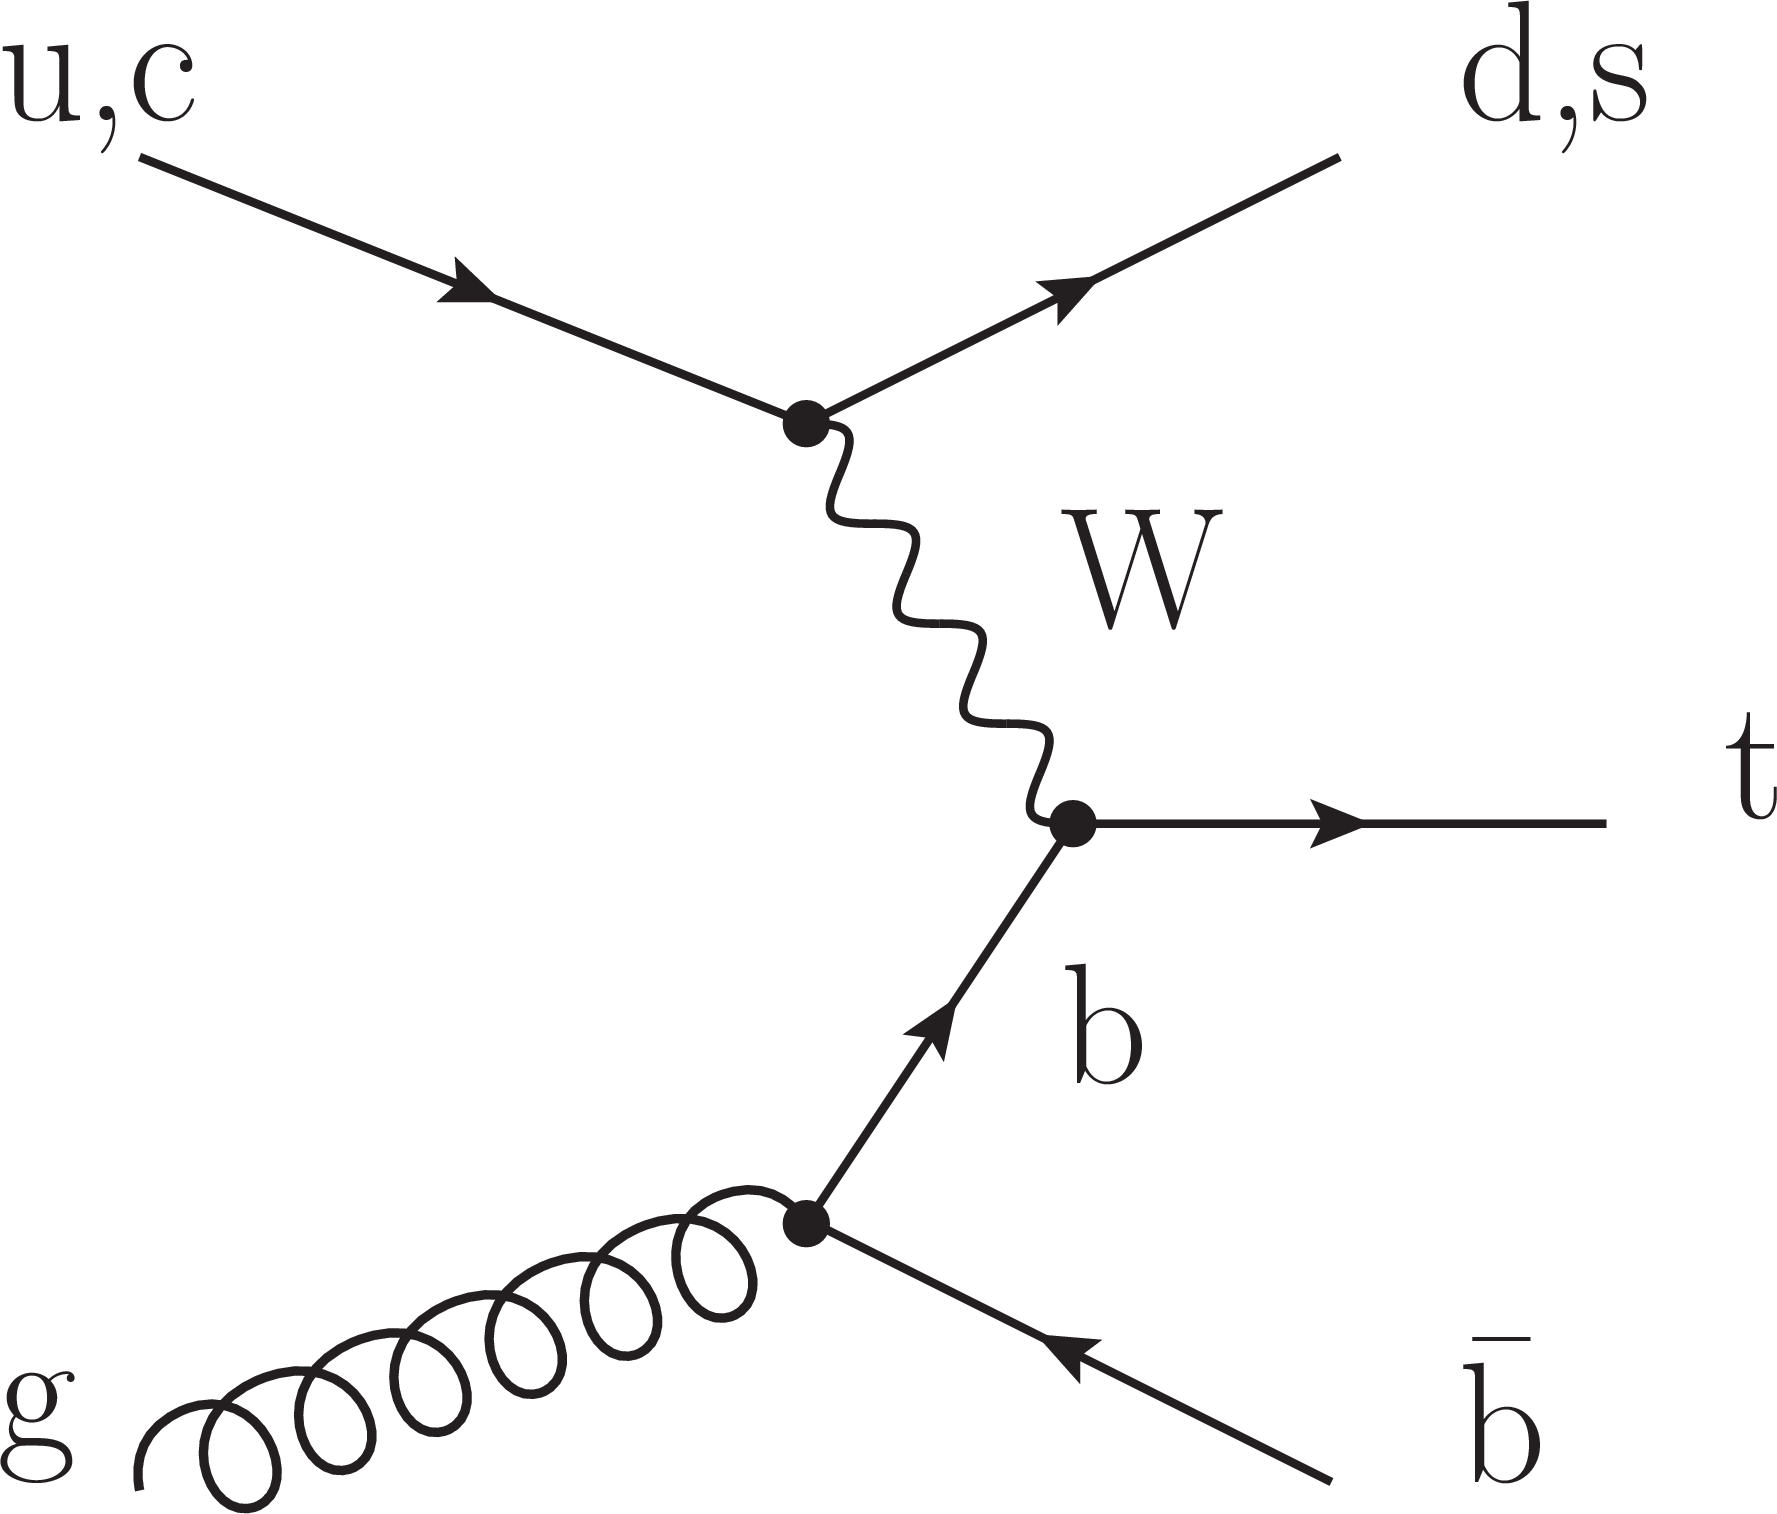
Figure 1-a:
Leading-order Feynman diagrams for (a) single $ {\mathrm {t}}$ and (b) $ {\overline {\mathrm {t}}} $ production in the $t$-channel. |
png pdf |
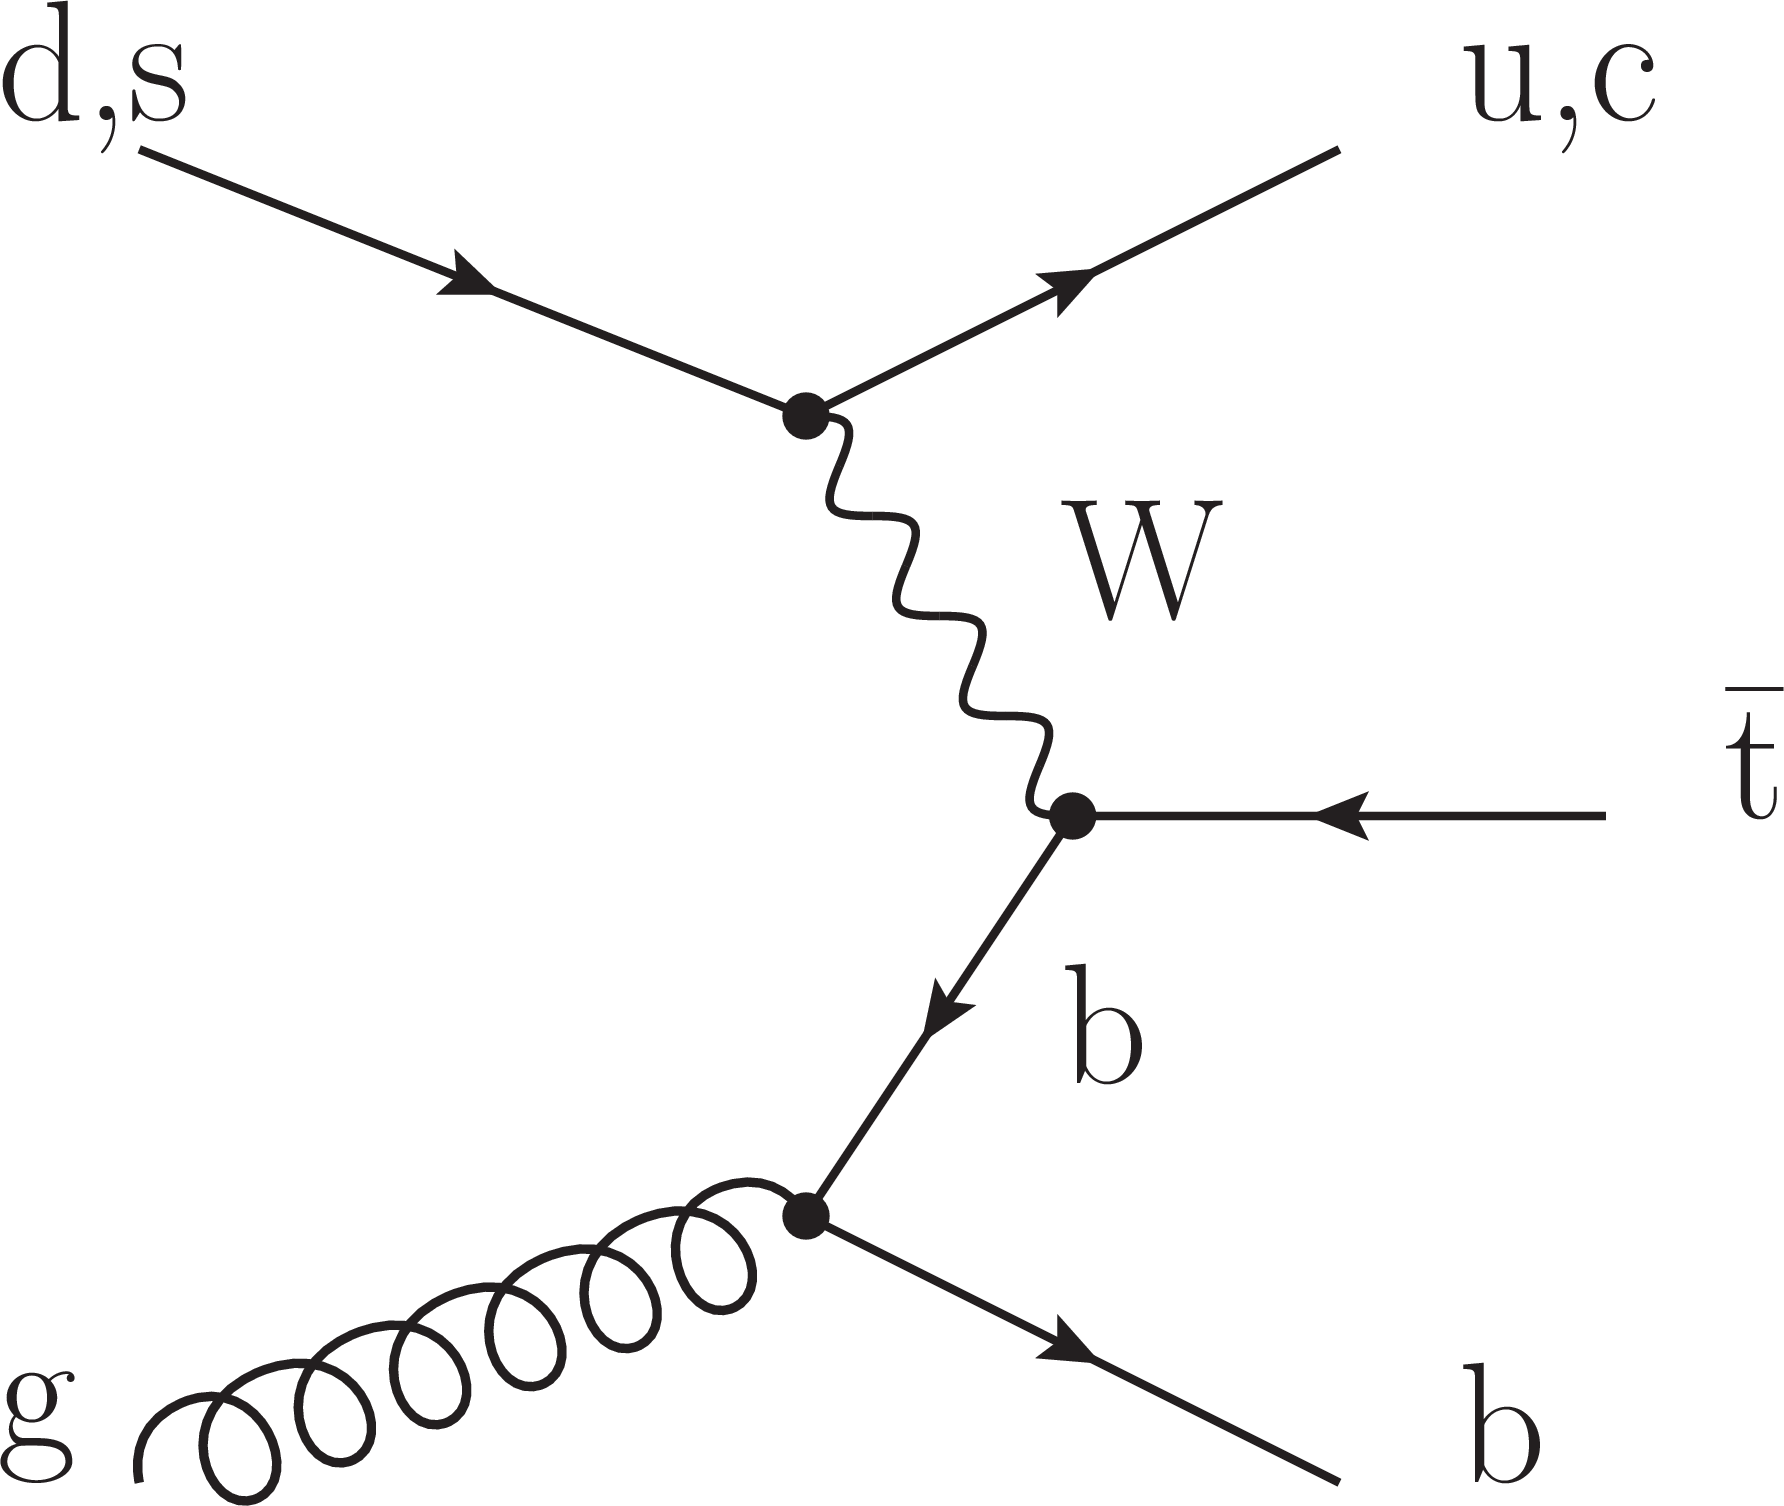
Figure 1-b:
Leading-order Feynman diagrams for (a) single $ {\mathrm {t}}$ and (b) $ {\overline {\mathrm {t}}} $ production in the $t$-channel. |
png pdf |
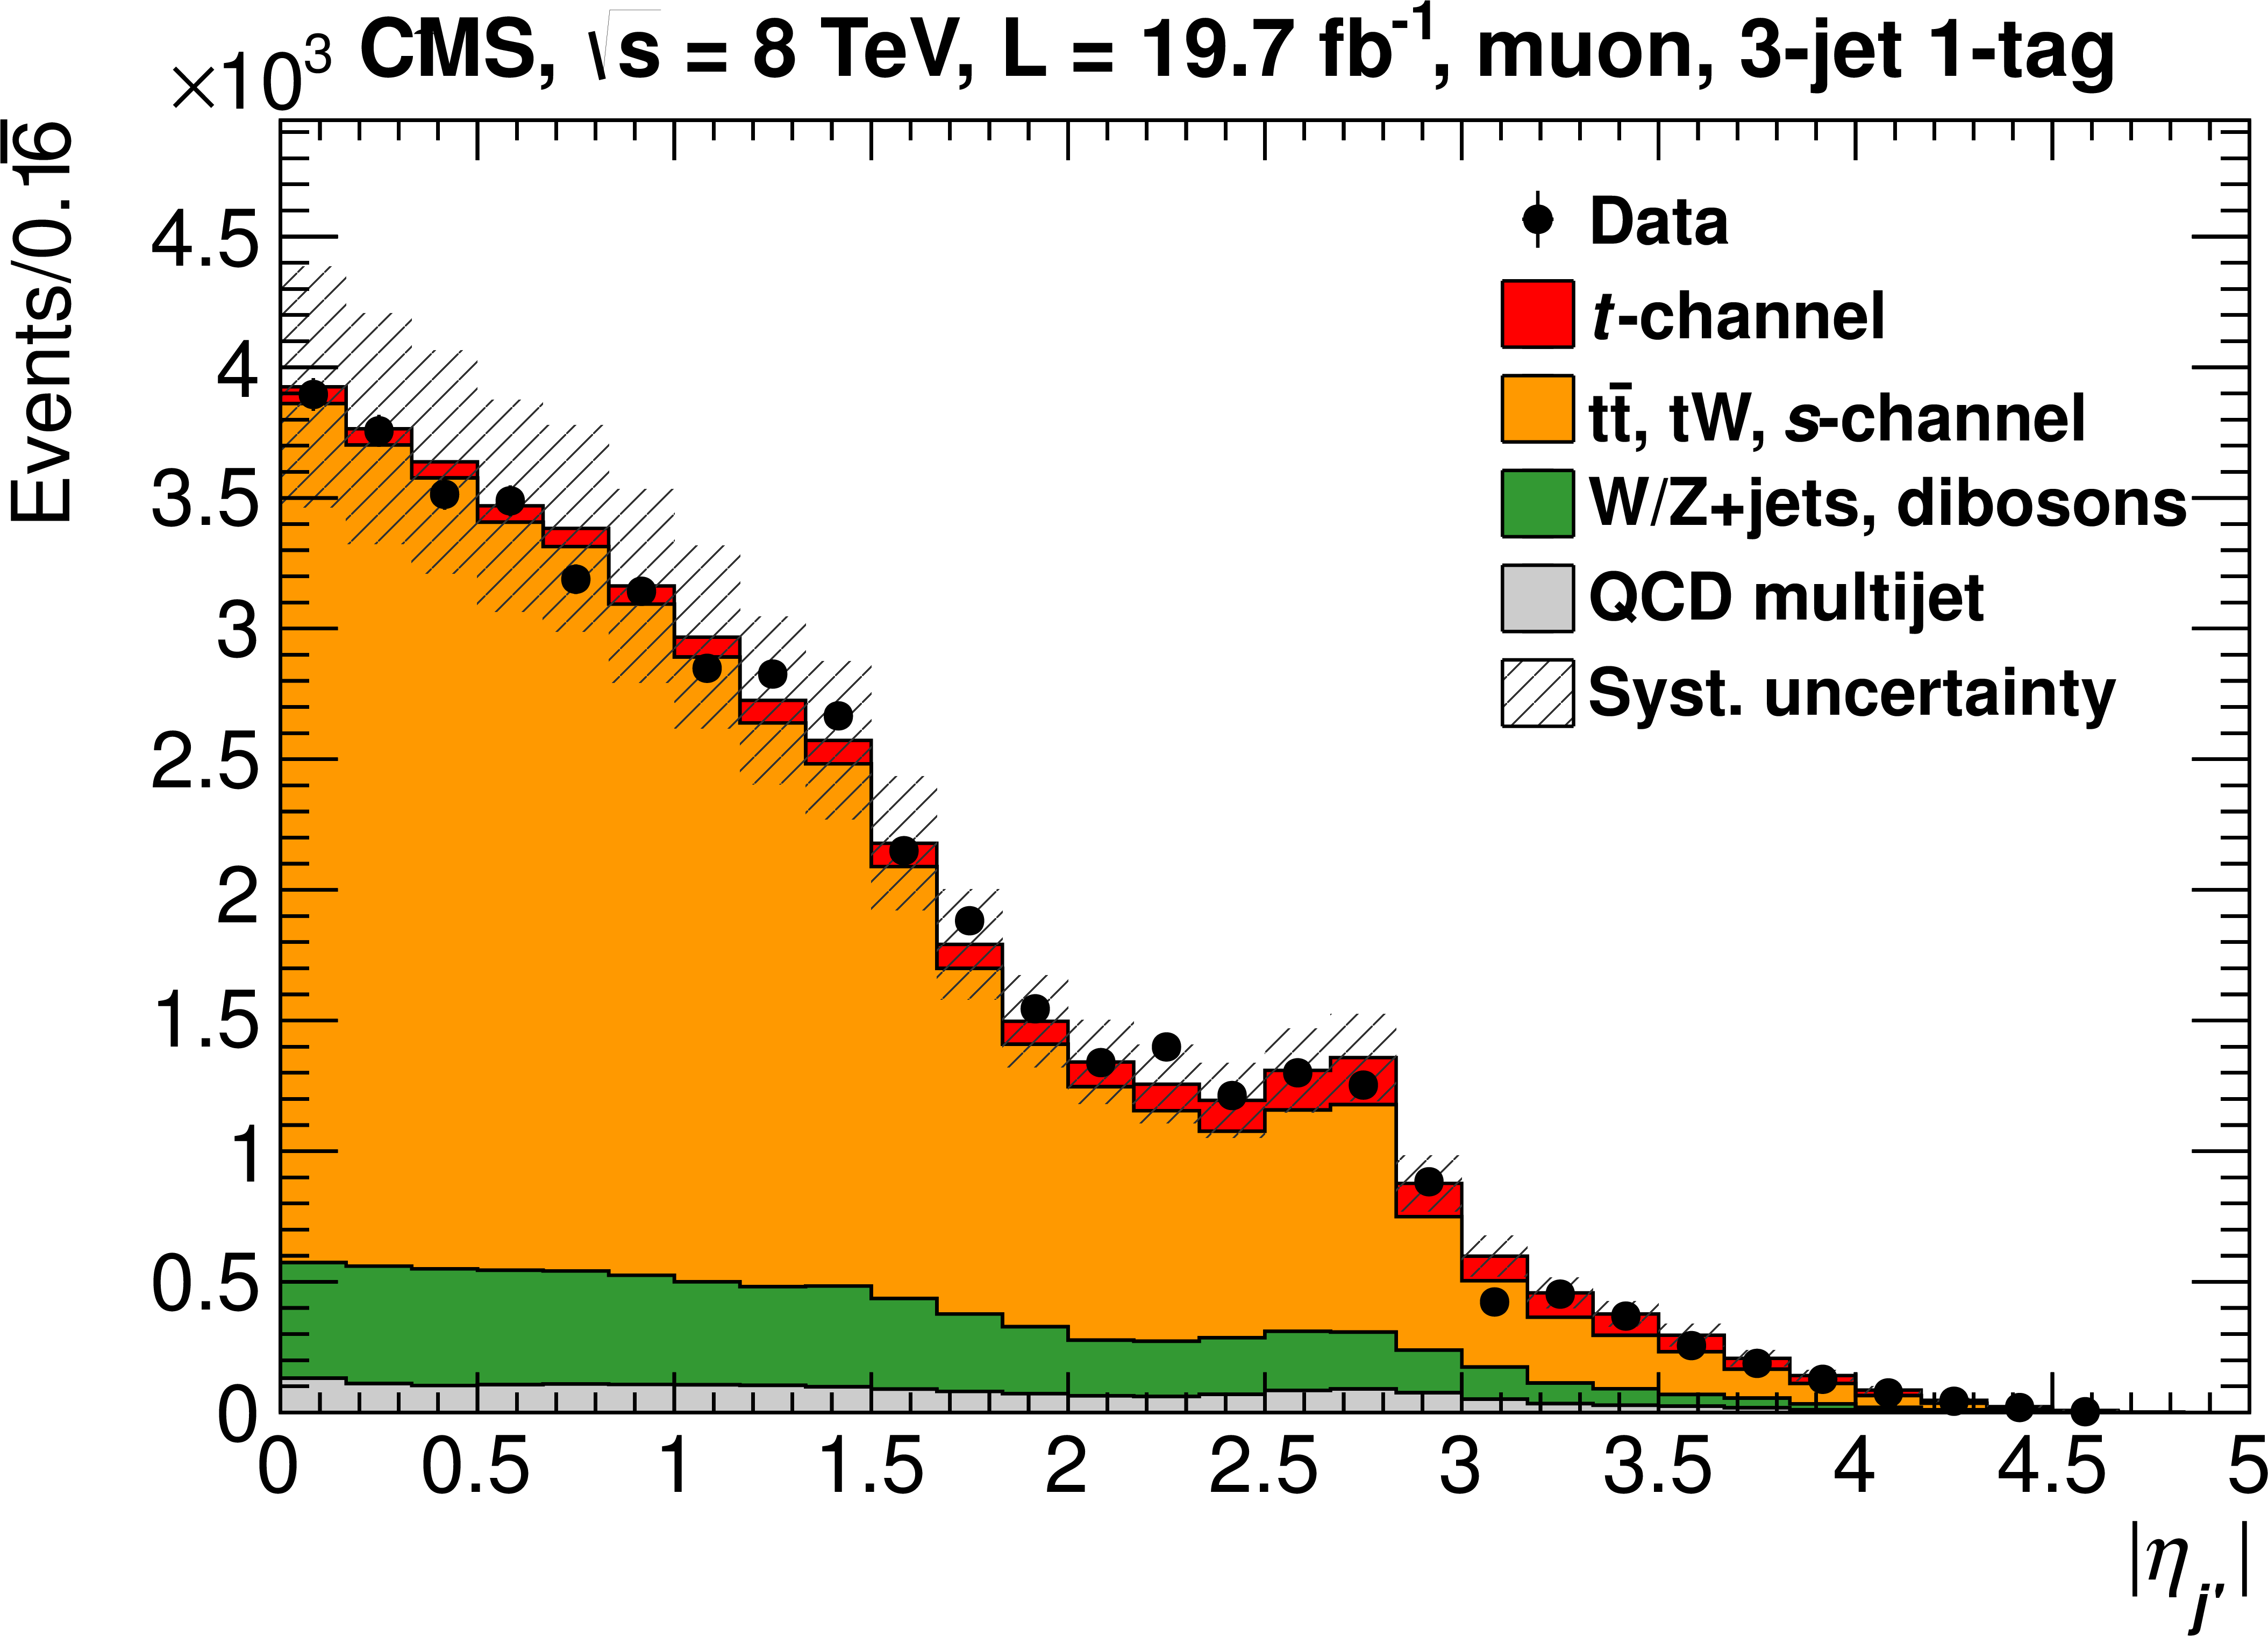
Figure 2-a:
Distribution of $ { {| \eta _{j'} | }} $ in the 3-jet 1-tag (a, b), and 3-jet 2-tag (c, d) samples for muon and electron decay channels. The yield of the simulated processes is normalised to the results of the fit described in section 6. Systematic uncertainty bands include all uncertainties. |
png pdf |
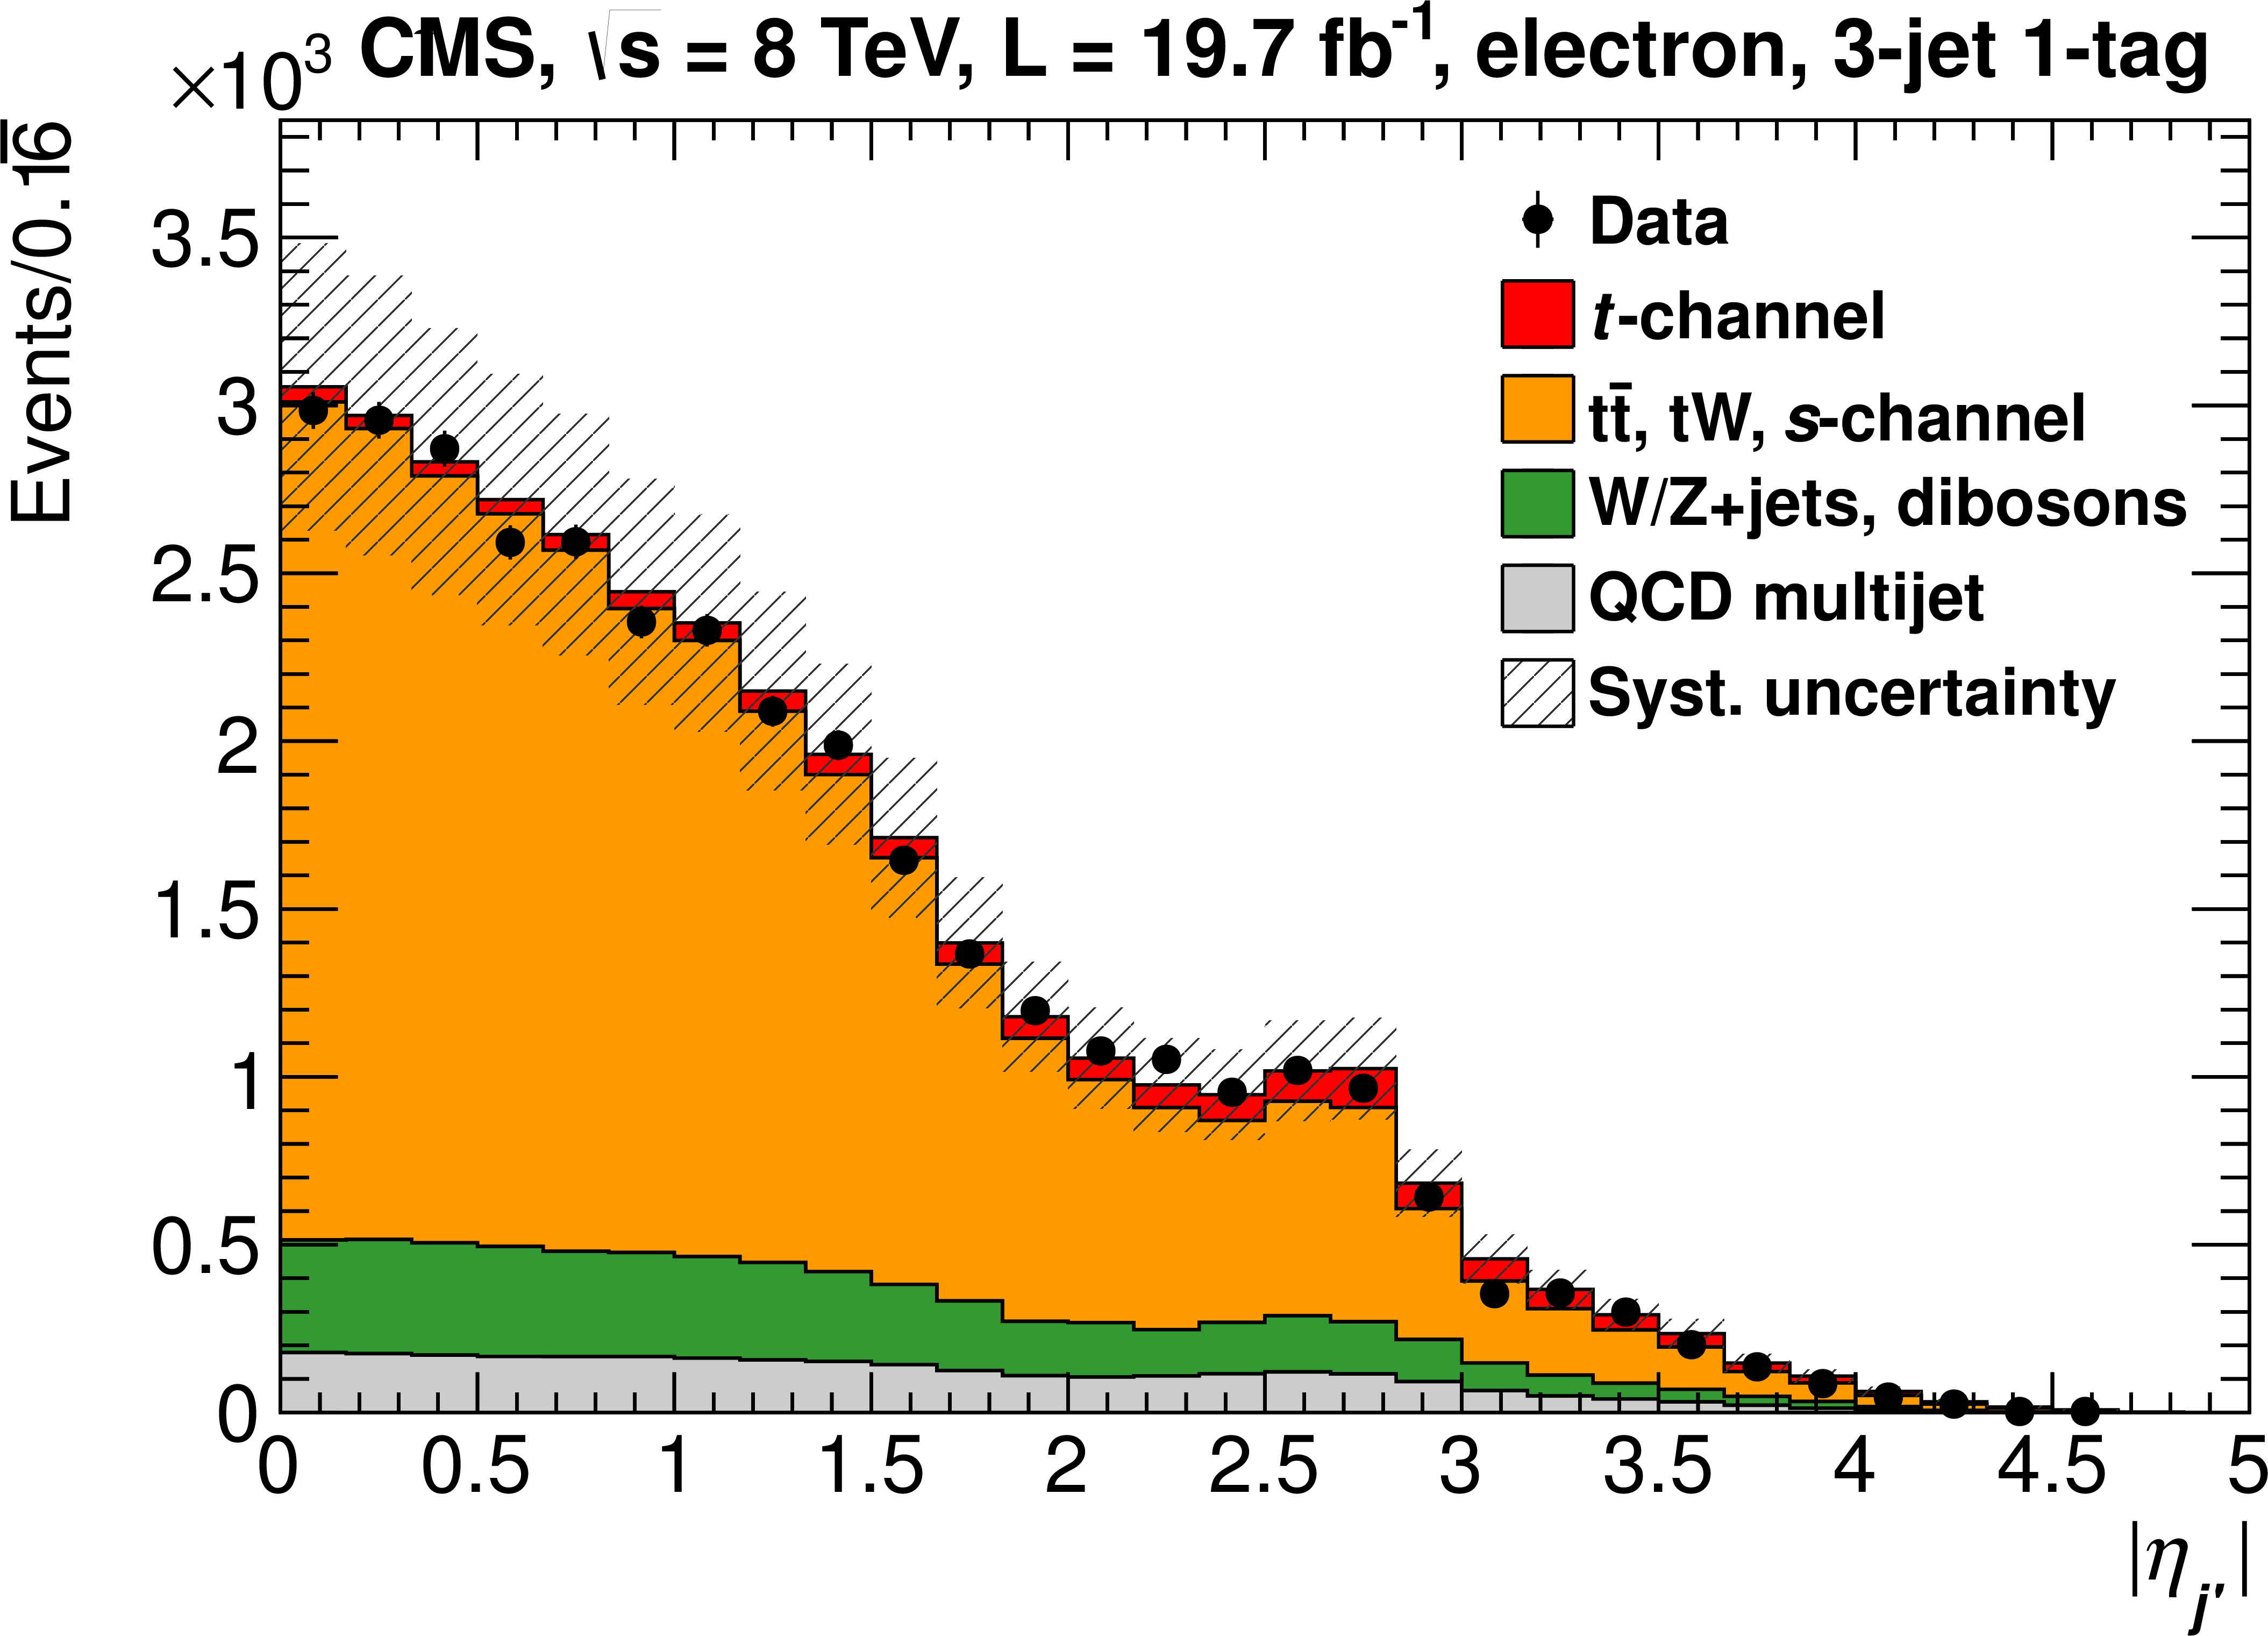
Figure 2-b:
Distribution of $ { {| \eta _{j'} | }} $ in the 3-jet 1-tag (a, b), and 3-jet 2-tag (c, d) samples for muon and electron decay channels. The yield of the simulated processes is normalised to the results of the fit described in section 6. Systematic uncertainty bands include all uncertainties. |
png pdf |
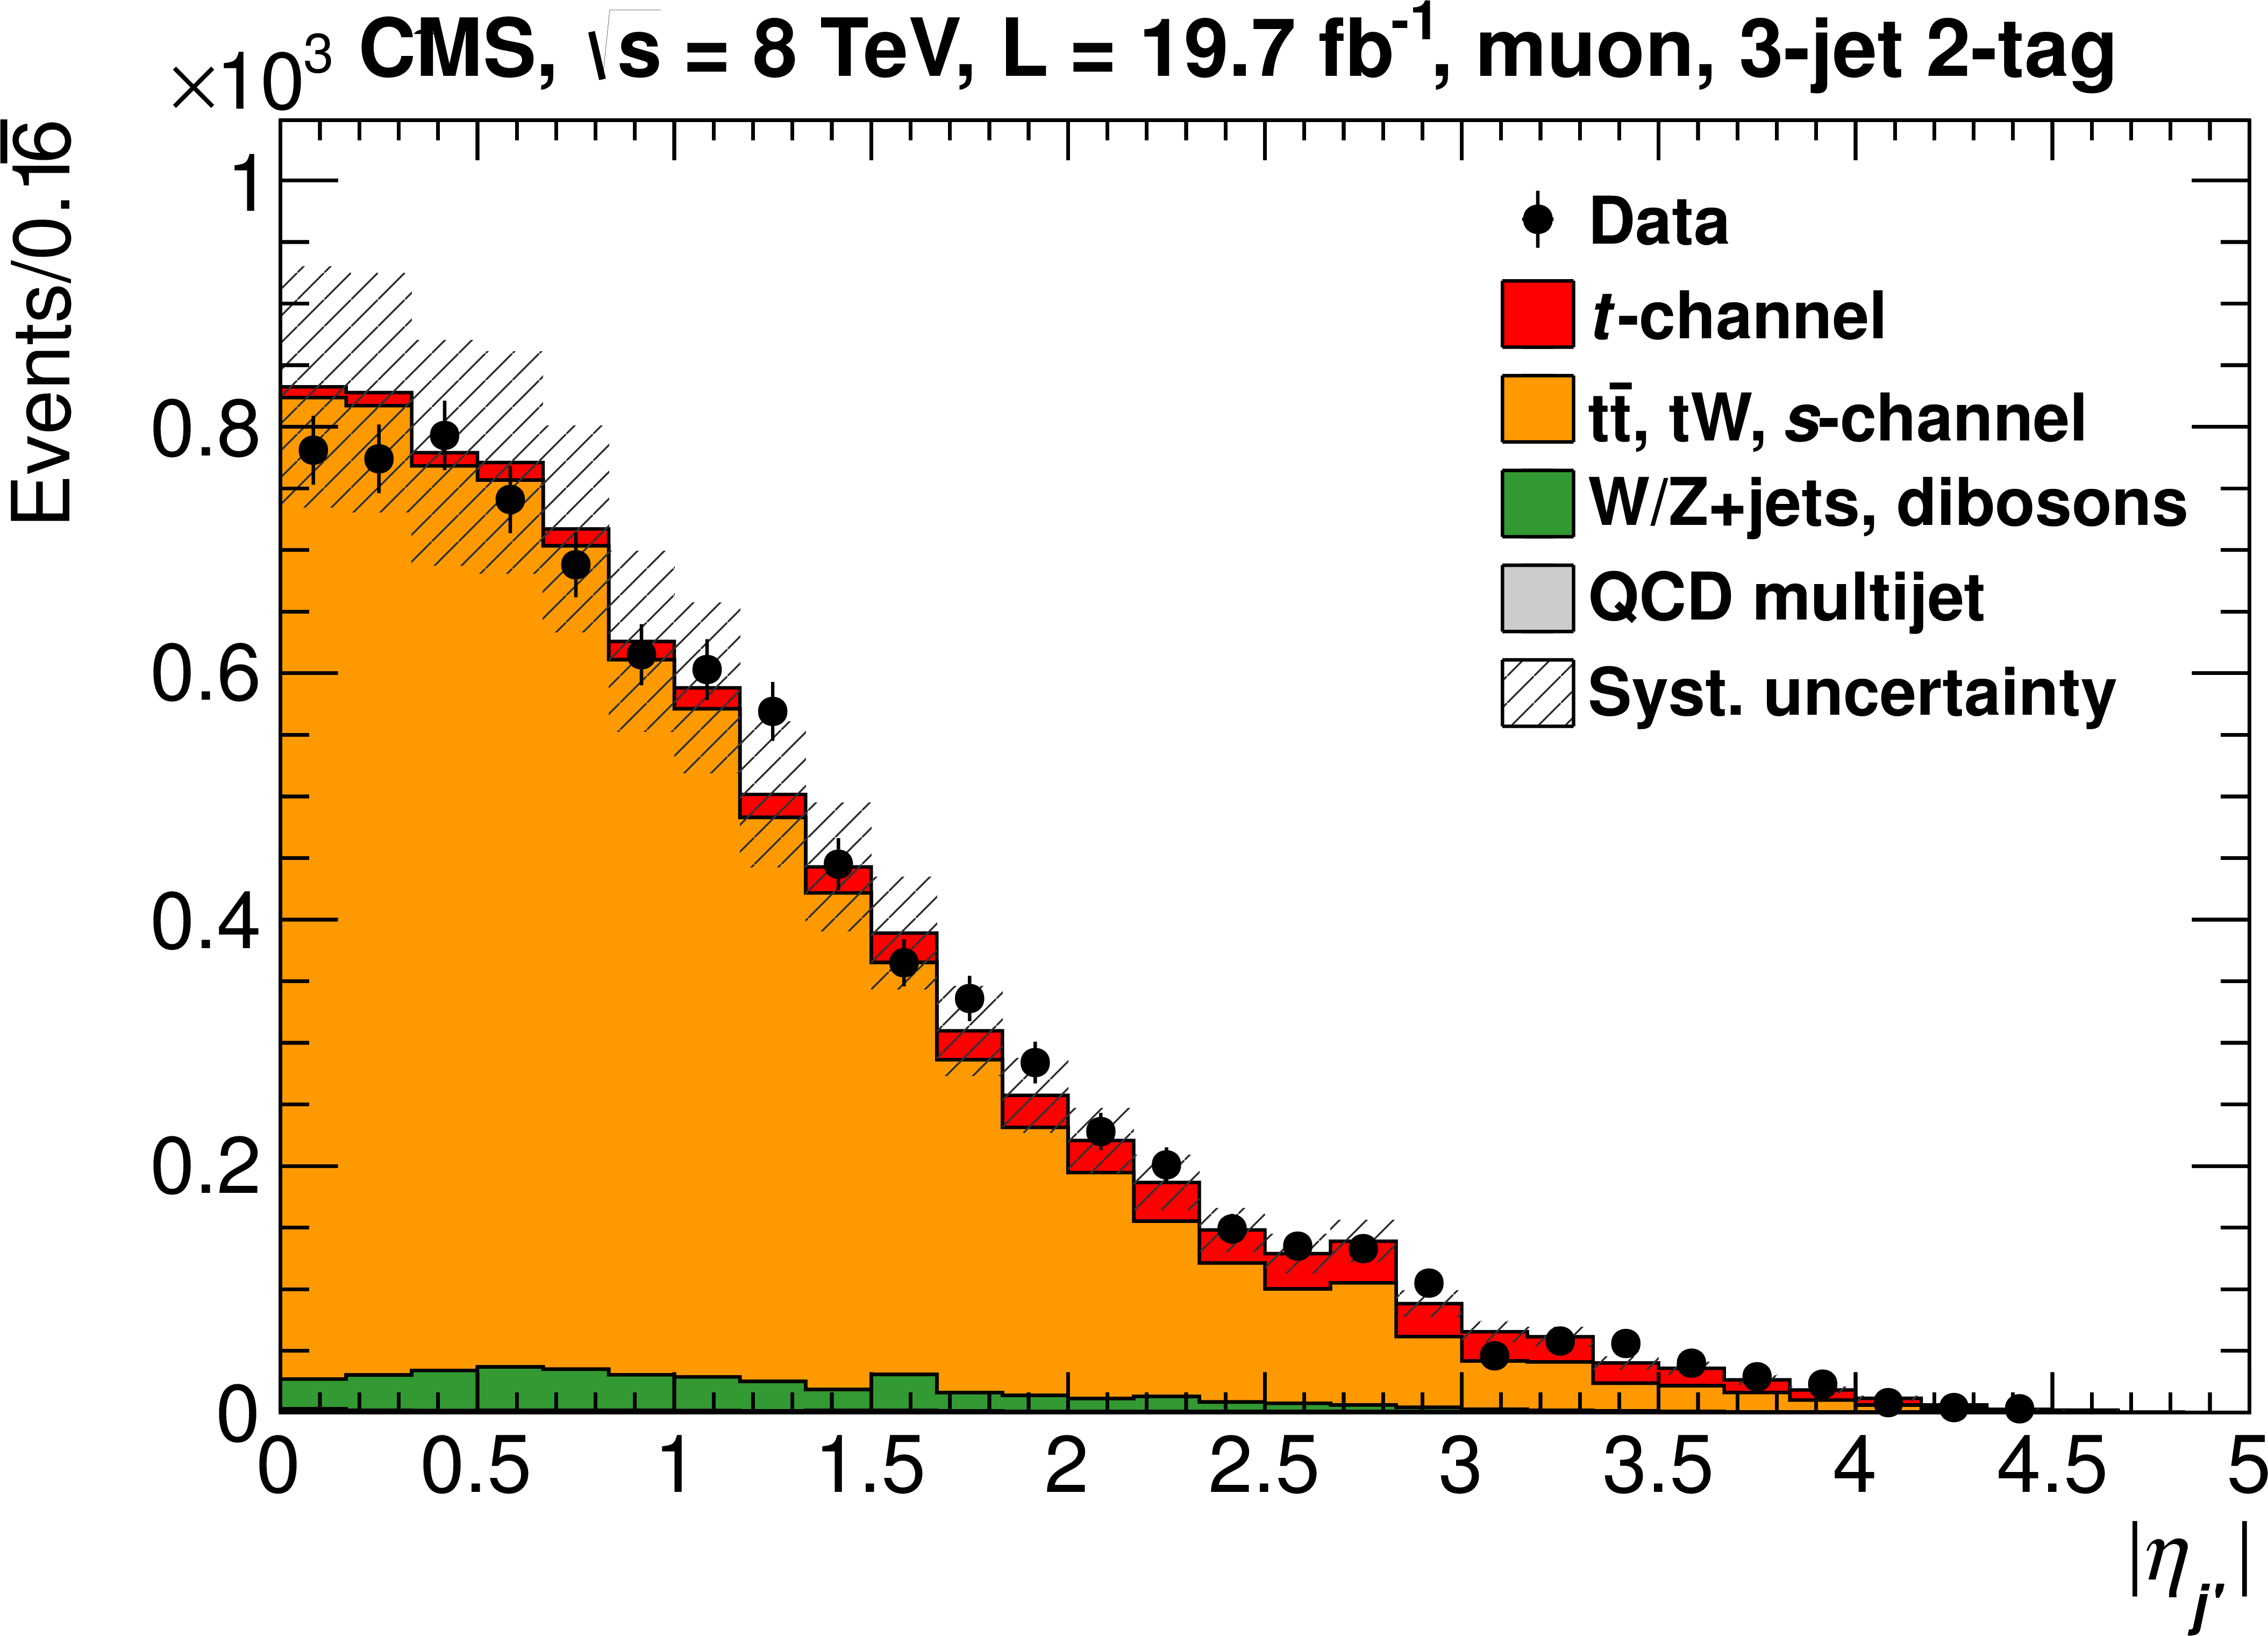
Figure 2-c:
Distribution of $ { {| \eta _{j'} | }} $ in the 3-jet 1-tag (a, b), and 3-jet 2-tag (c, d) samples for muon and electron decay channels. The yield of the simulated processes is normalised to the results of the fit described in section 6. Systematic uncertainty bands include all uncertainties. |
png pdf |
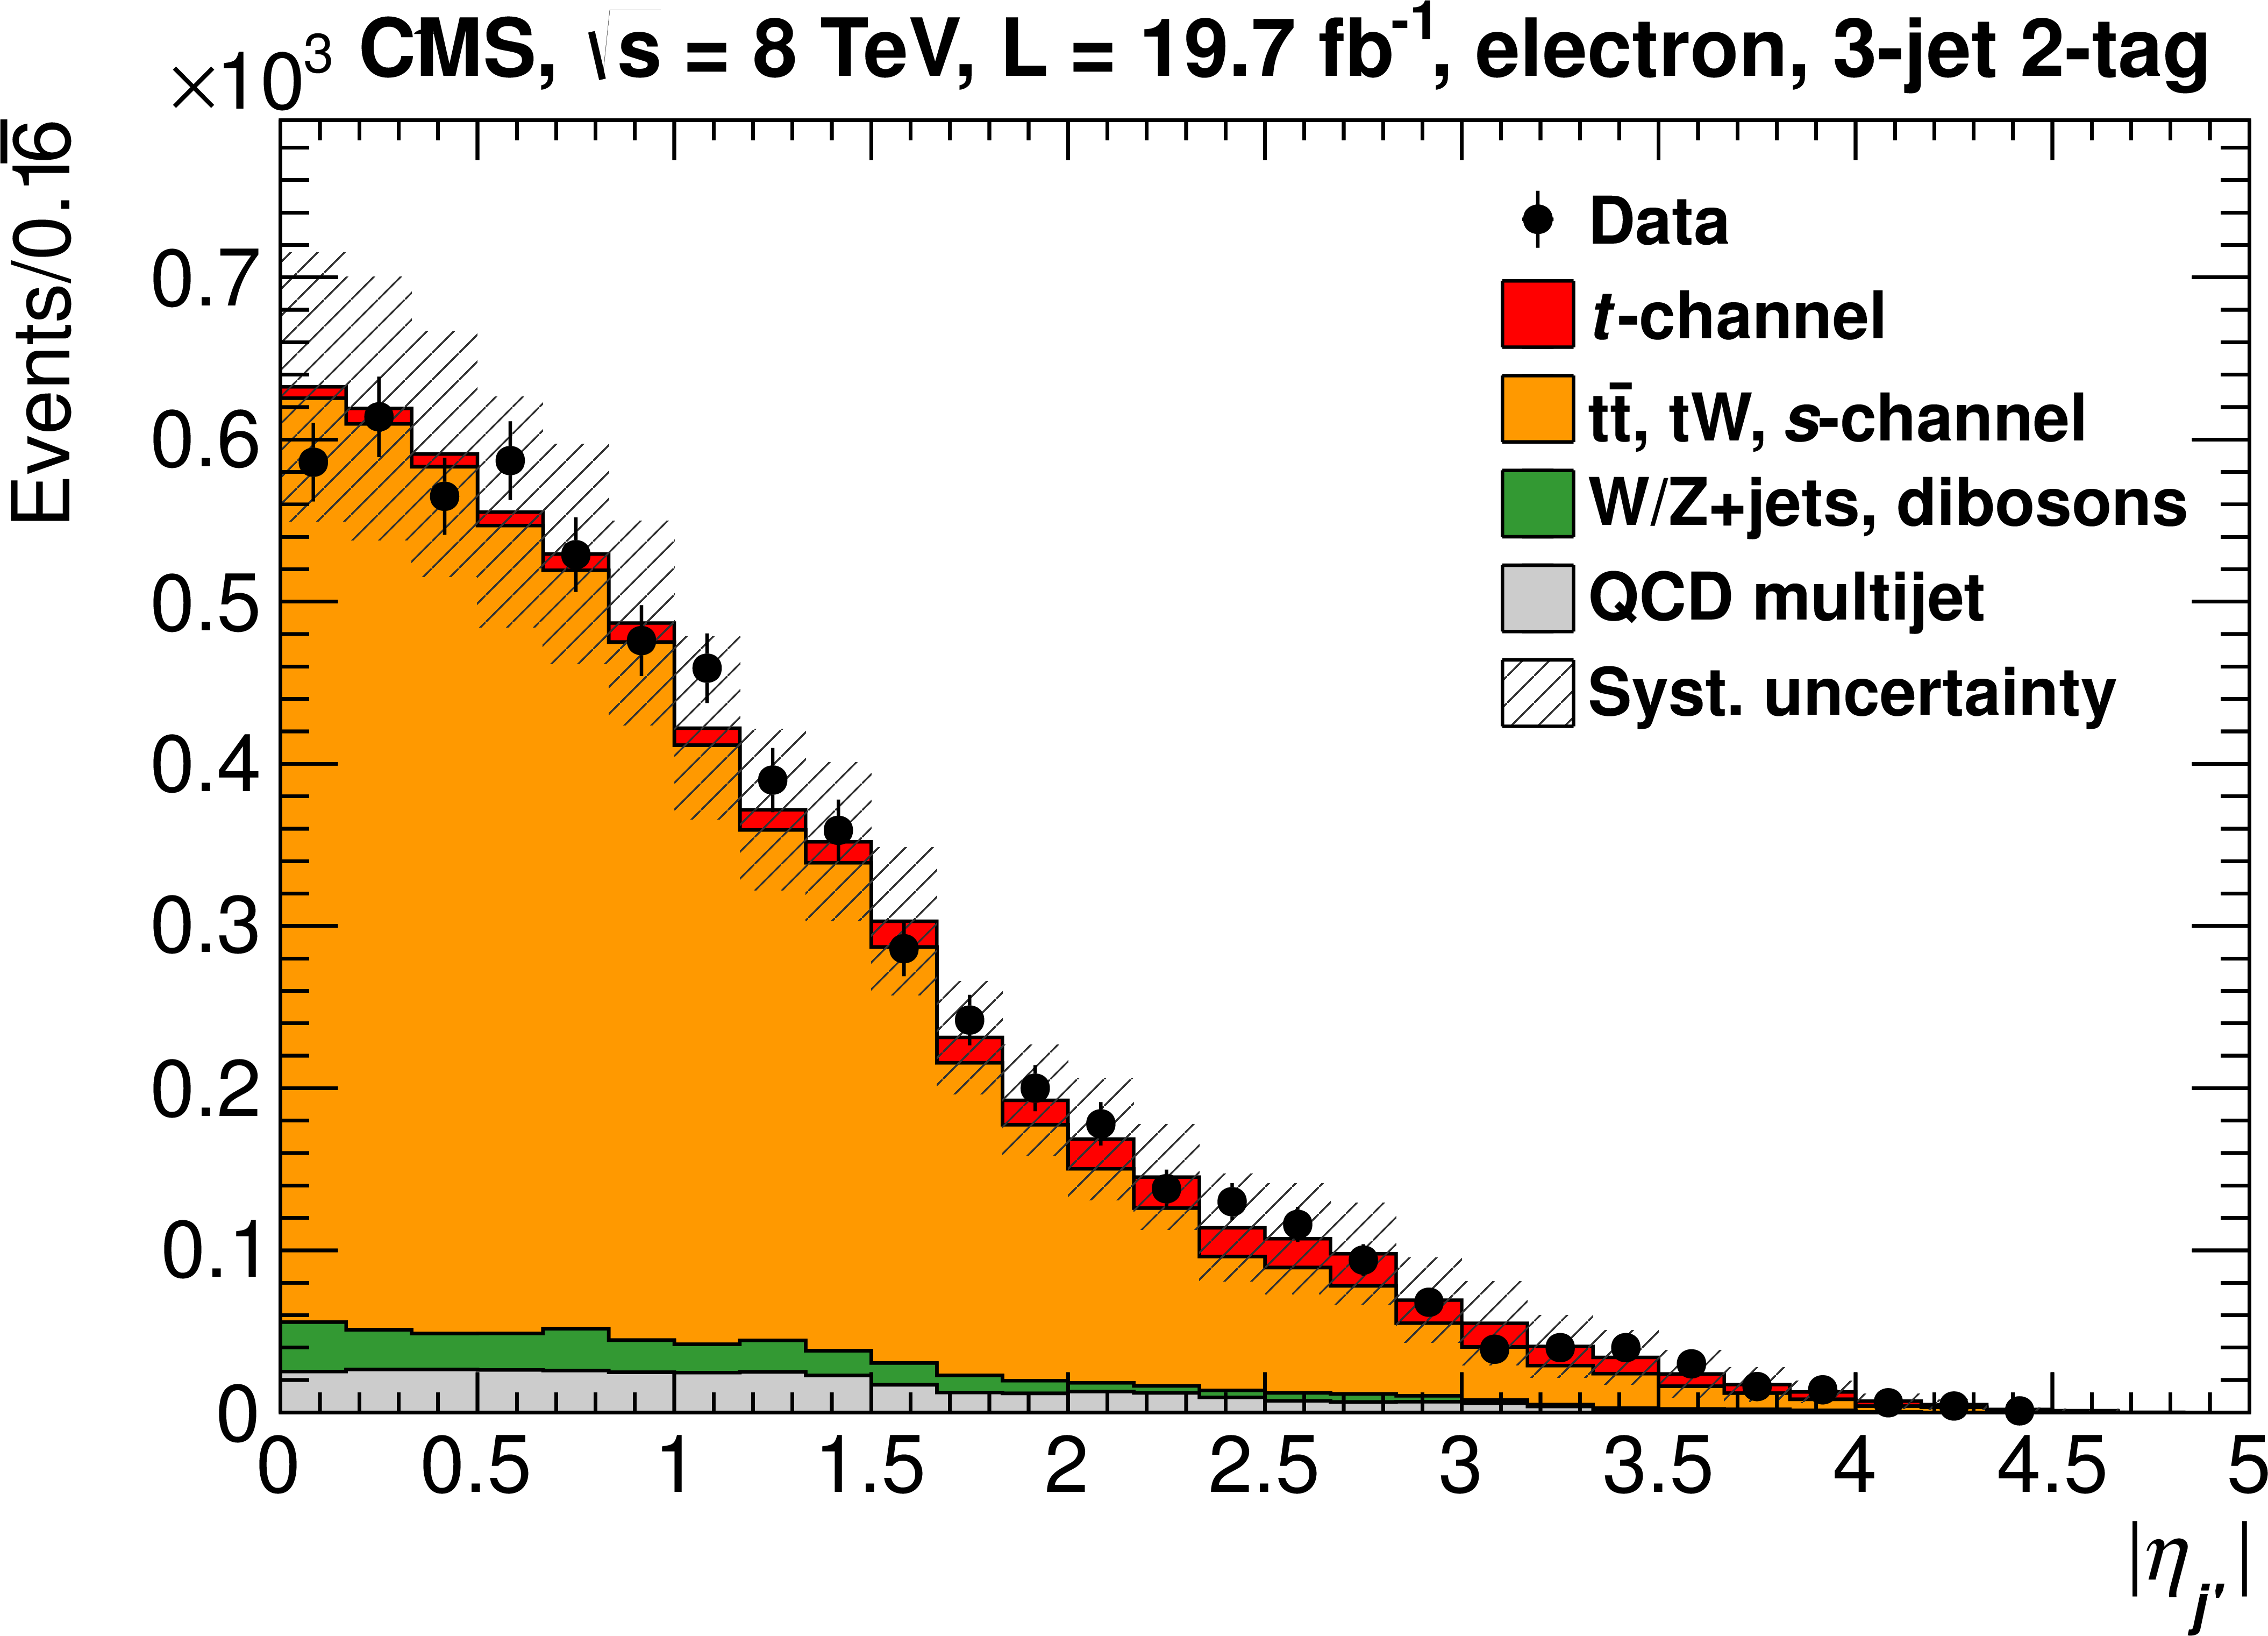
Figure 2-d:
Distribution of $ { {| \eta _{j'} | }} $ in the 3-jet 1-tag (a, b), and 3-jet 2-tag (c, d) samples for muon and electron decay channels. The yield of the simulated processes is normalised to the results of the fit described in section 6. Systematic uncertainty bands include all uncertainties. |
png pdf |
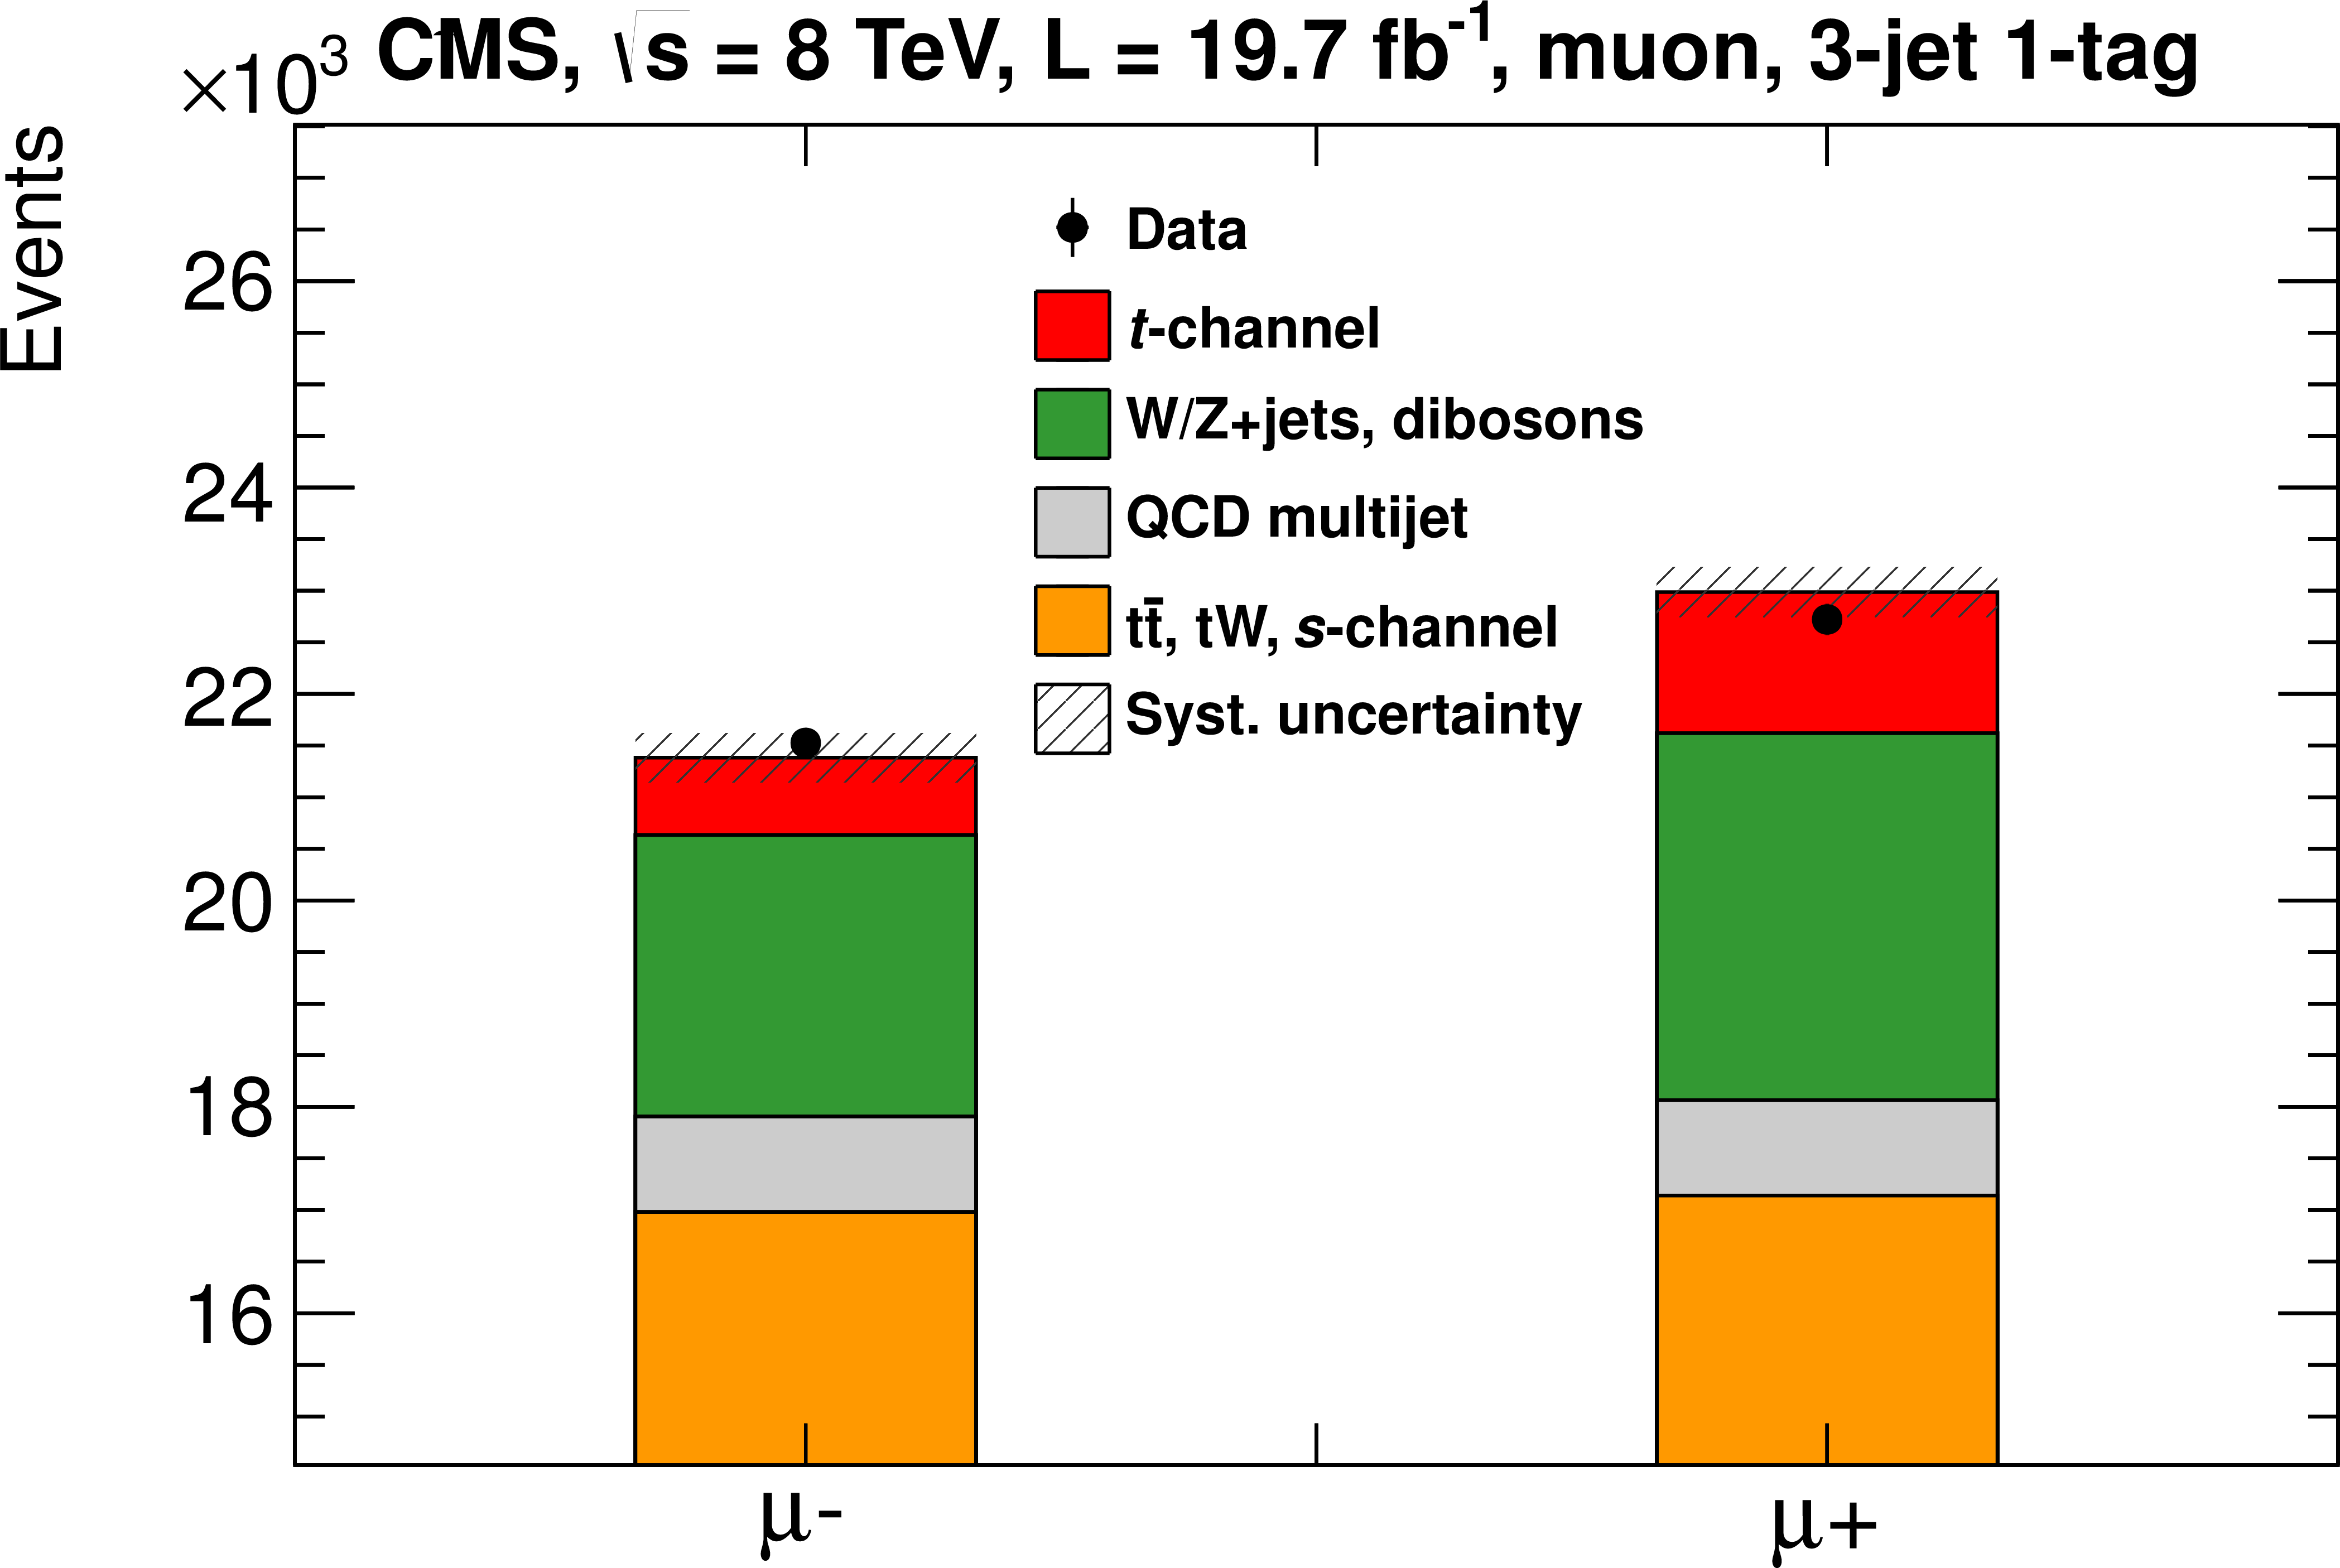
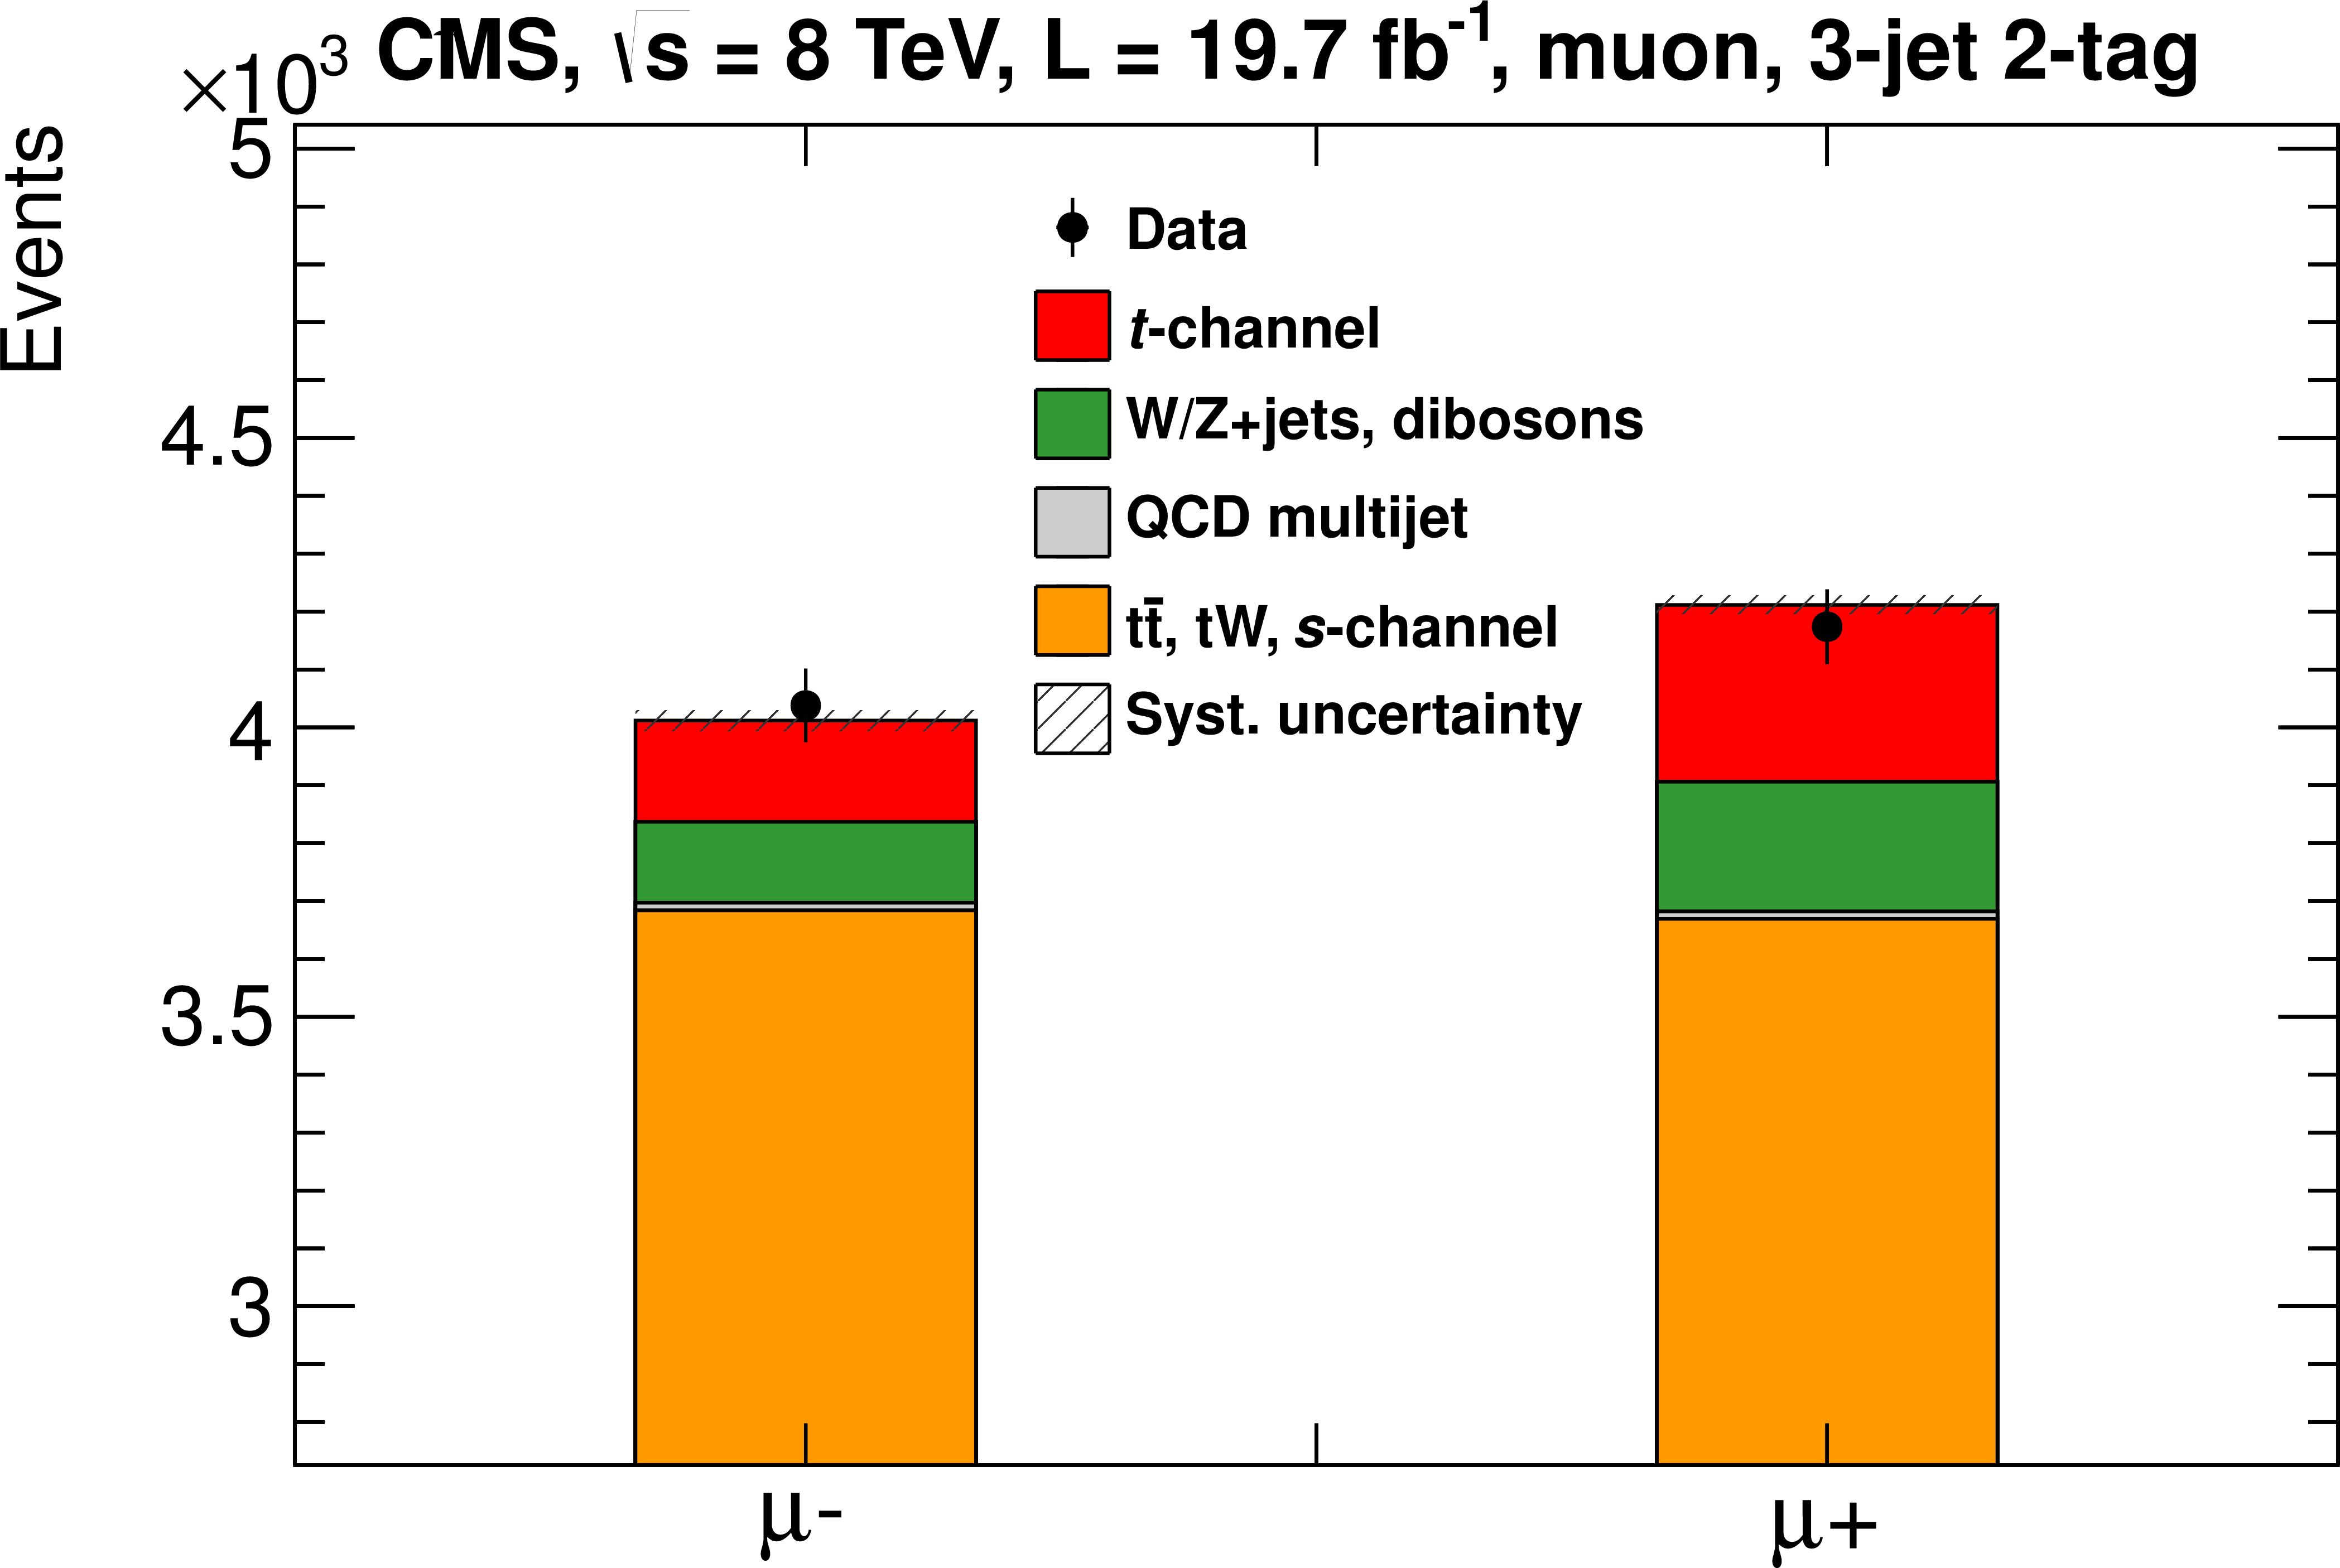
Figure 3-a:
Charge of the lepton in the 3-jet 1-tag (a, b), 3-jet 2-tag (c, d) samples for muon and electron decay channels. The sum of all predictions is normalised to the data yield. Systematic uncertainty bands include all uncertainties on the charge ratio. |
png pdf |
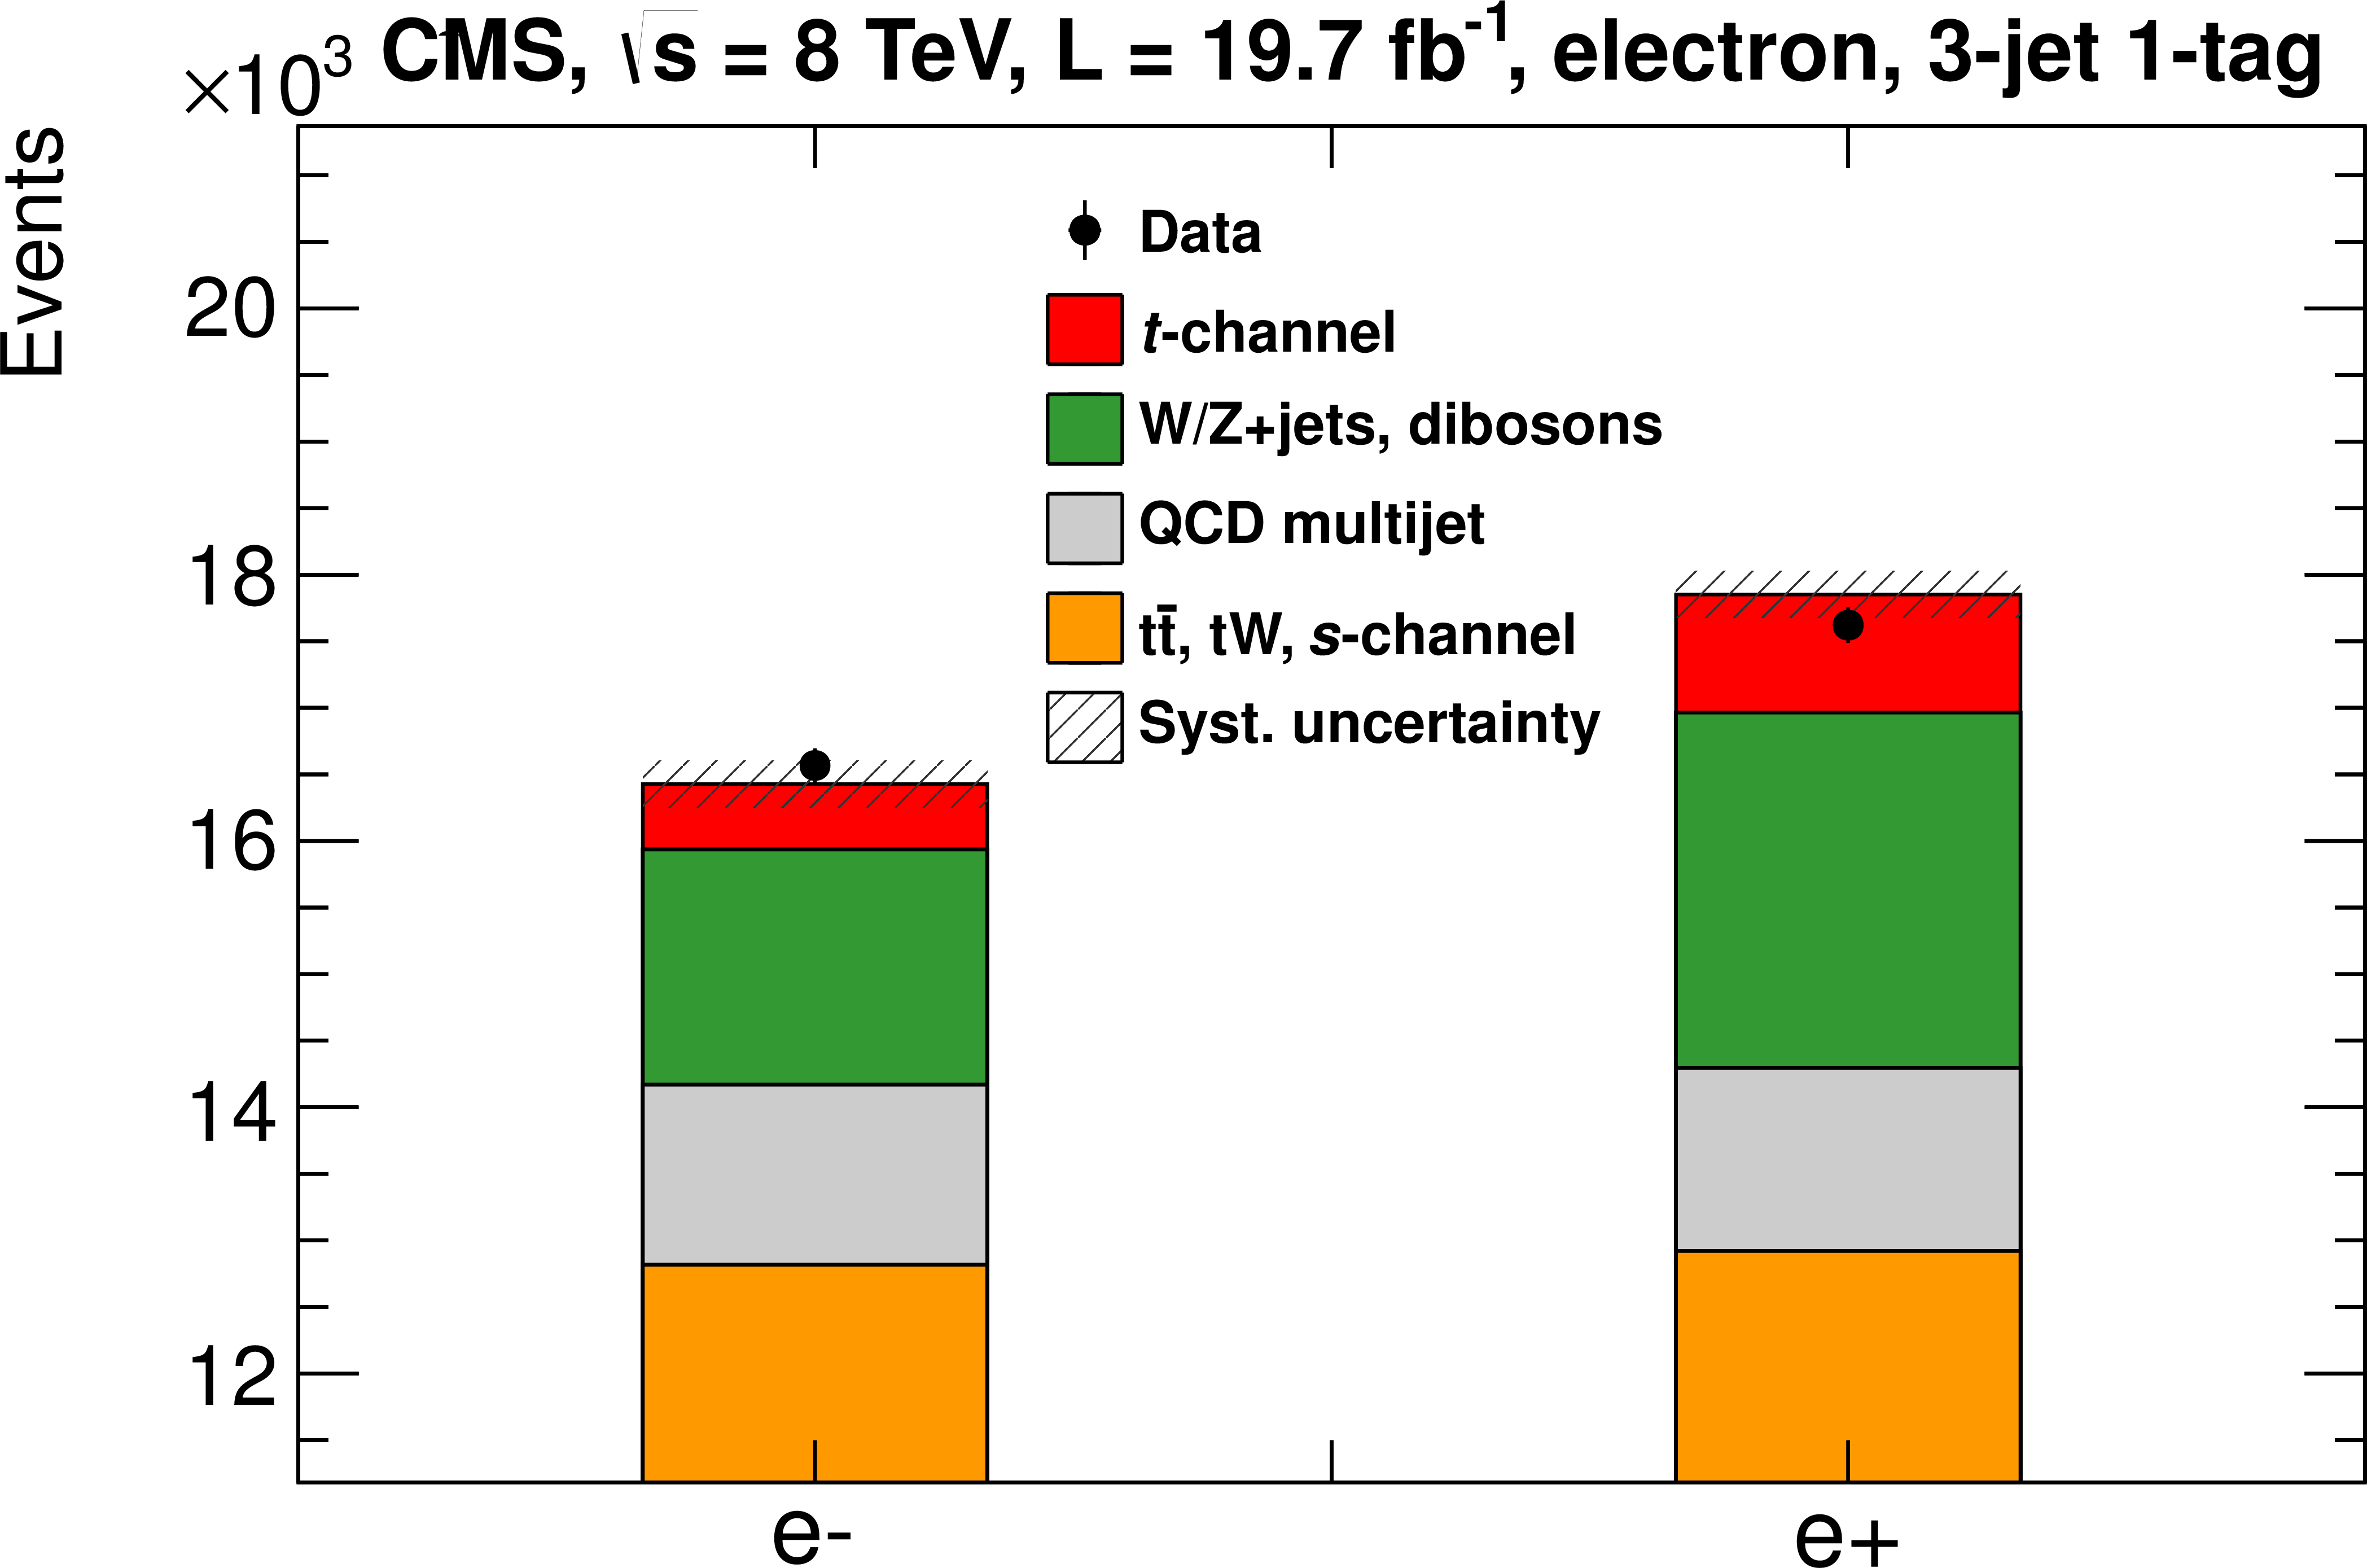
Figure 3-b:
Charge of the lepton in the 3-jet 1-tag (a, b), 3-jet 2-tag (c, d) samples for muon and electron decay channels. The sum of all predictions is normalised to the data yield. Systematic uncertainty bands include all uncertainties on the charge ratio. |
png pdf |
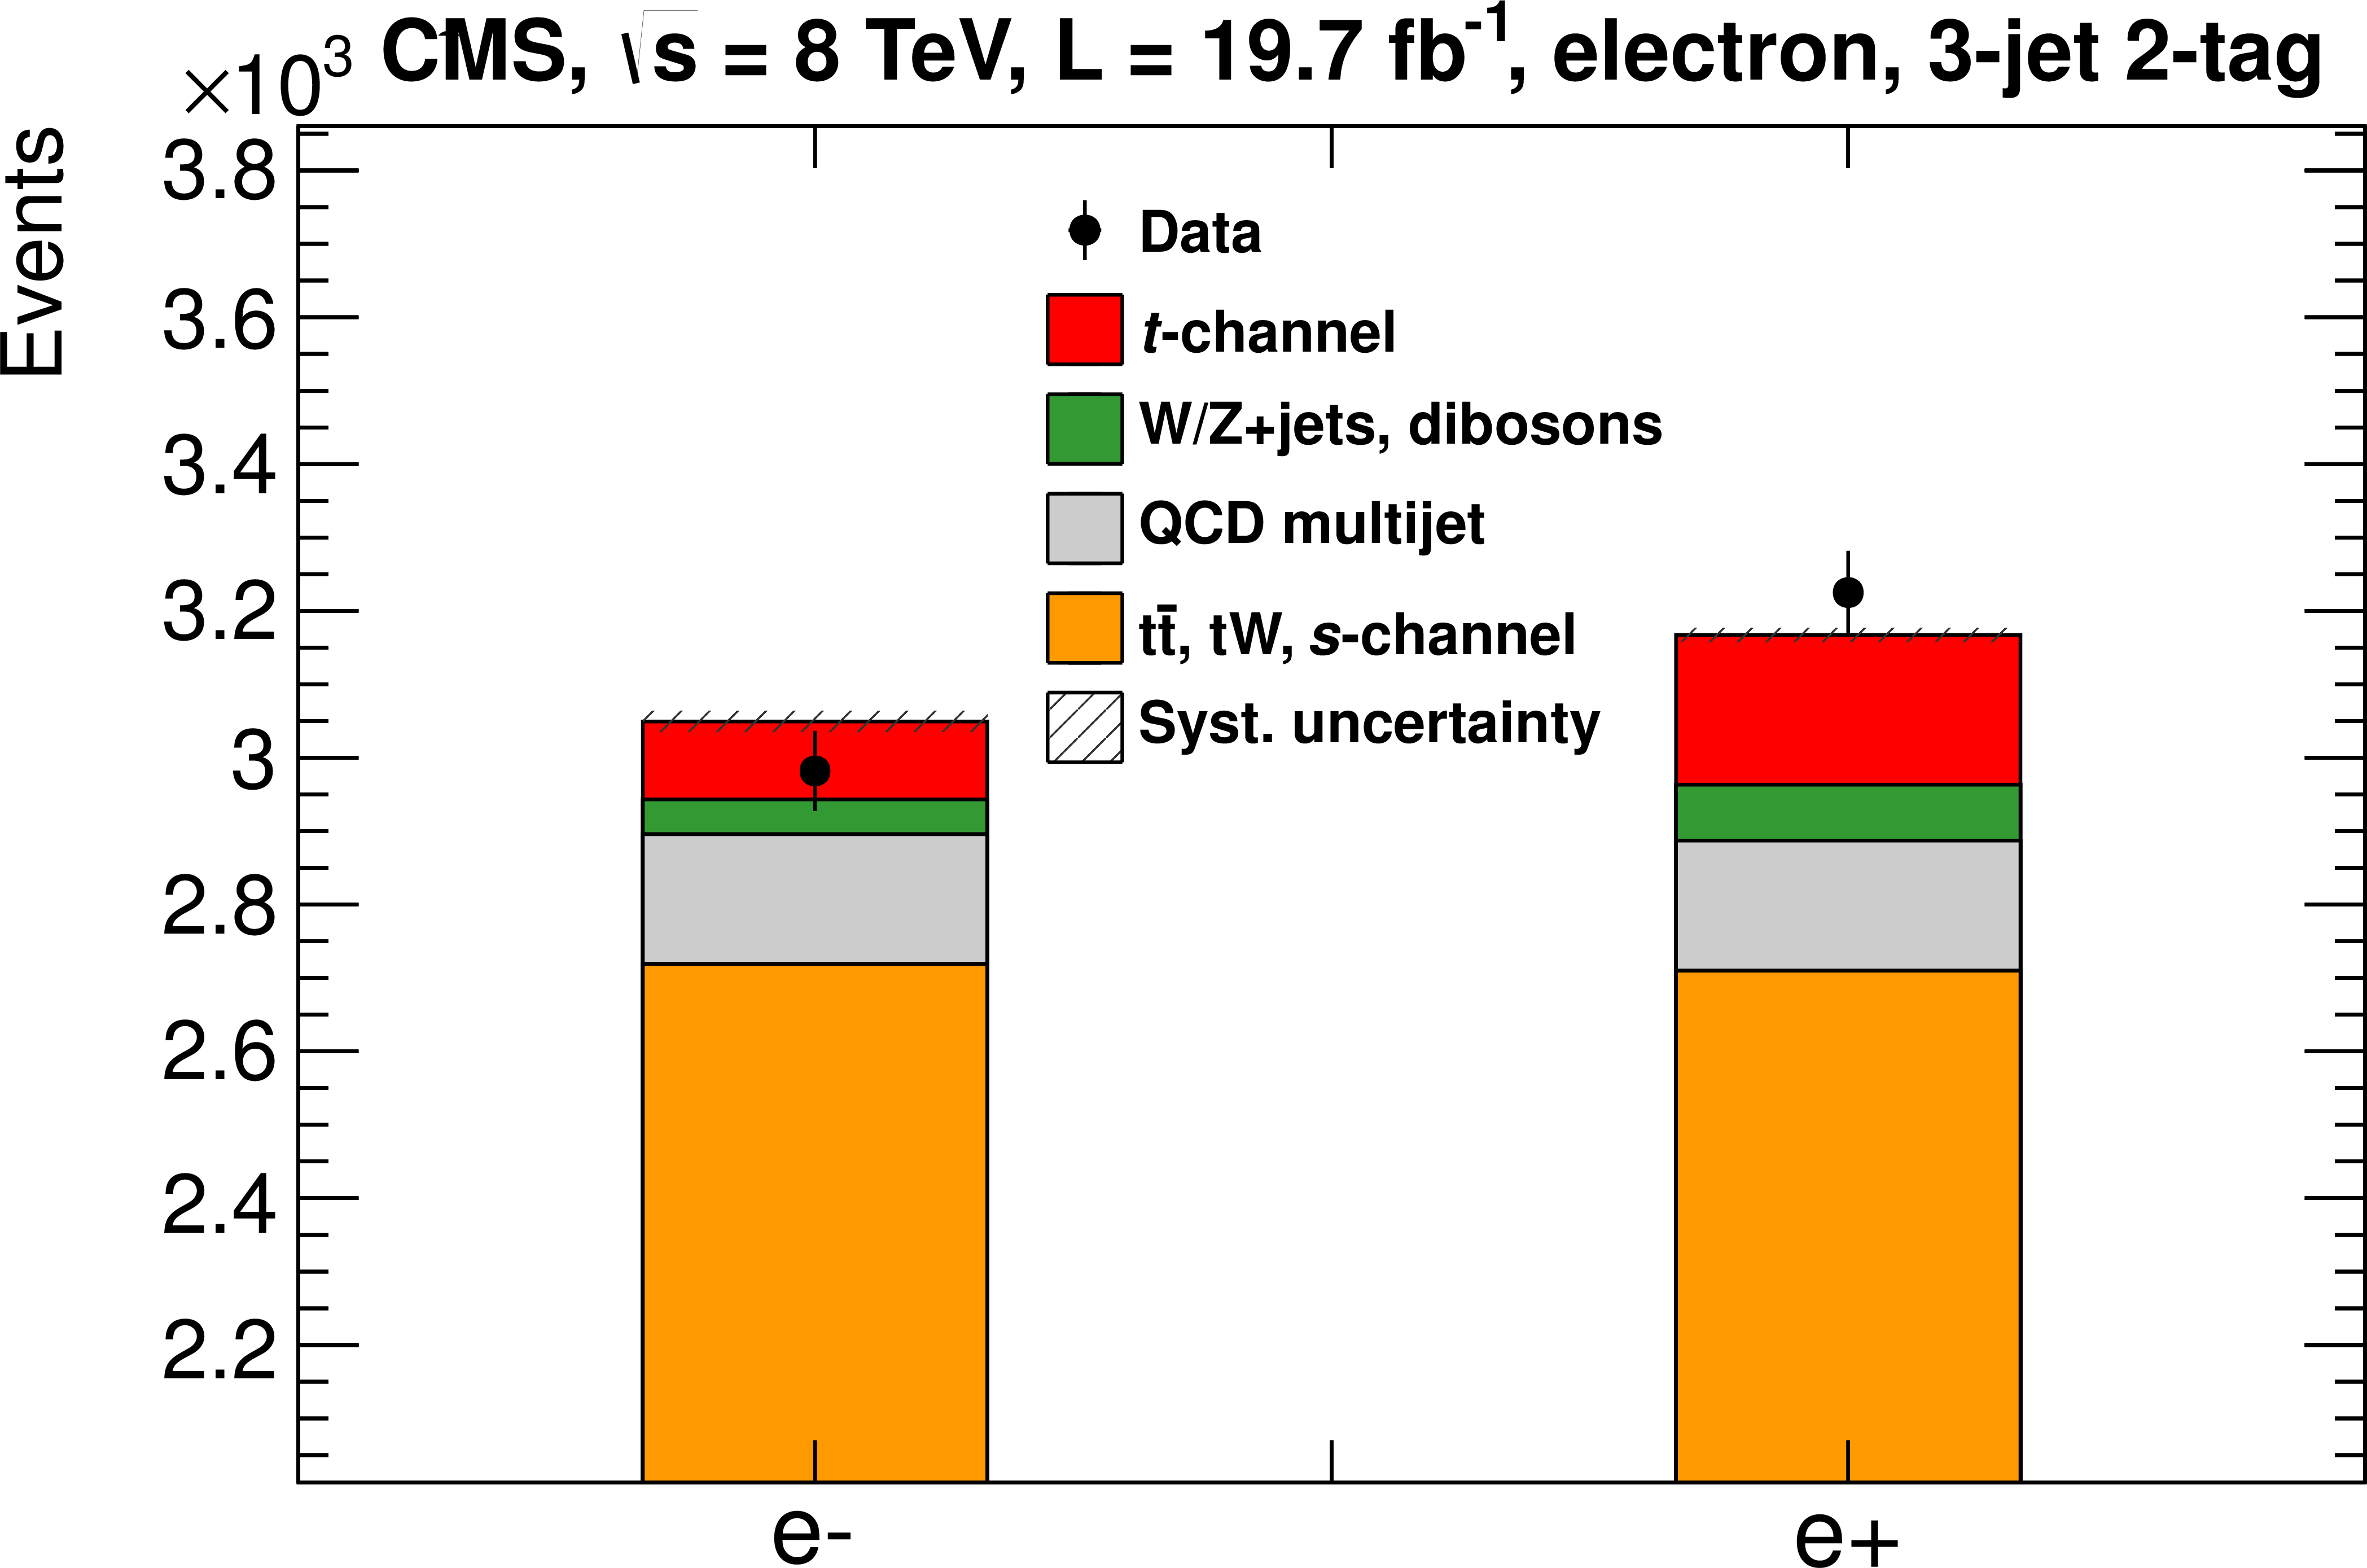
Figure 3-c:
Charge of the lepton in the 3-jet 1-tag (a, b), 3-jet 2-tag (c, d) samples for muon and electron decay channels. The sum of all predictions is normalised to the data yield. Systematic uncertainty bands include all uncertainties on the charge ratio. |
png pdf |
Figure 3-d:
Charge of the lepton in the 3-jet 1-tag (a, b), 3-jet 2-tag (c, d) samples for muon and electron decay channels. The sum of all predictions is normalised to the data yield. Systematic uncertainty bands include all uncertainties on the charge ratio. |
png pdf |
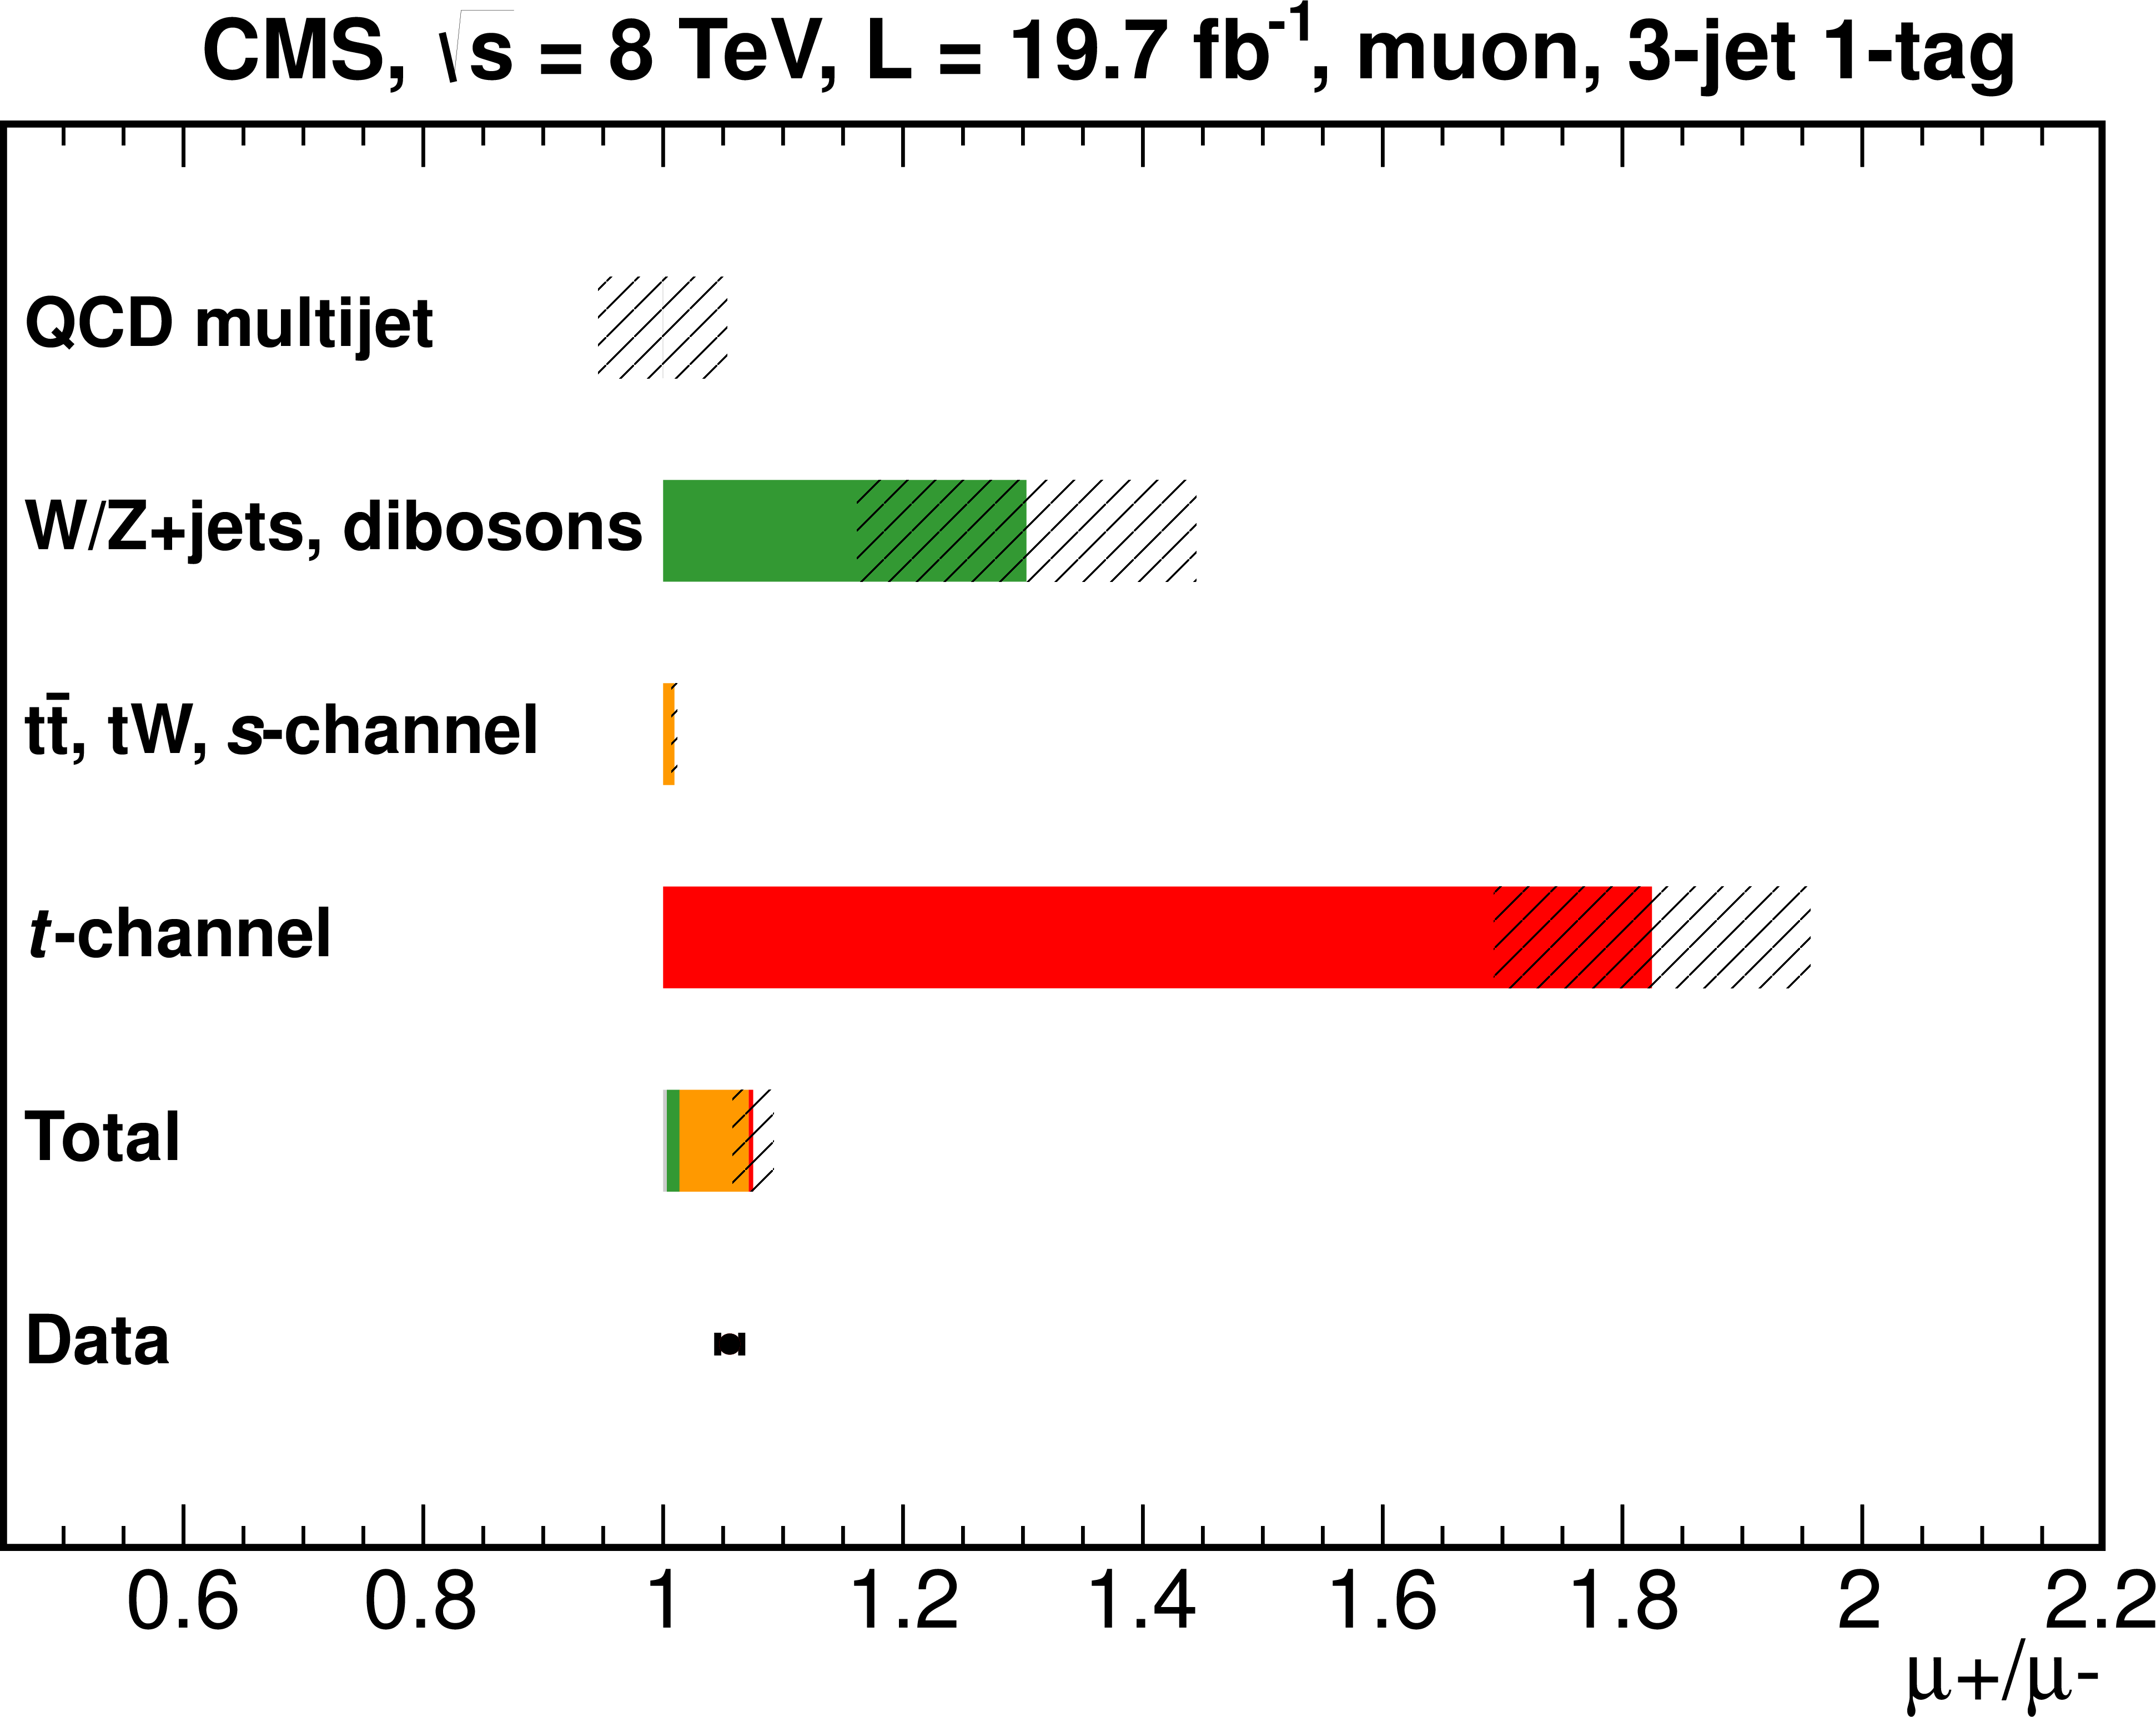
Figure 4-a:
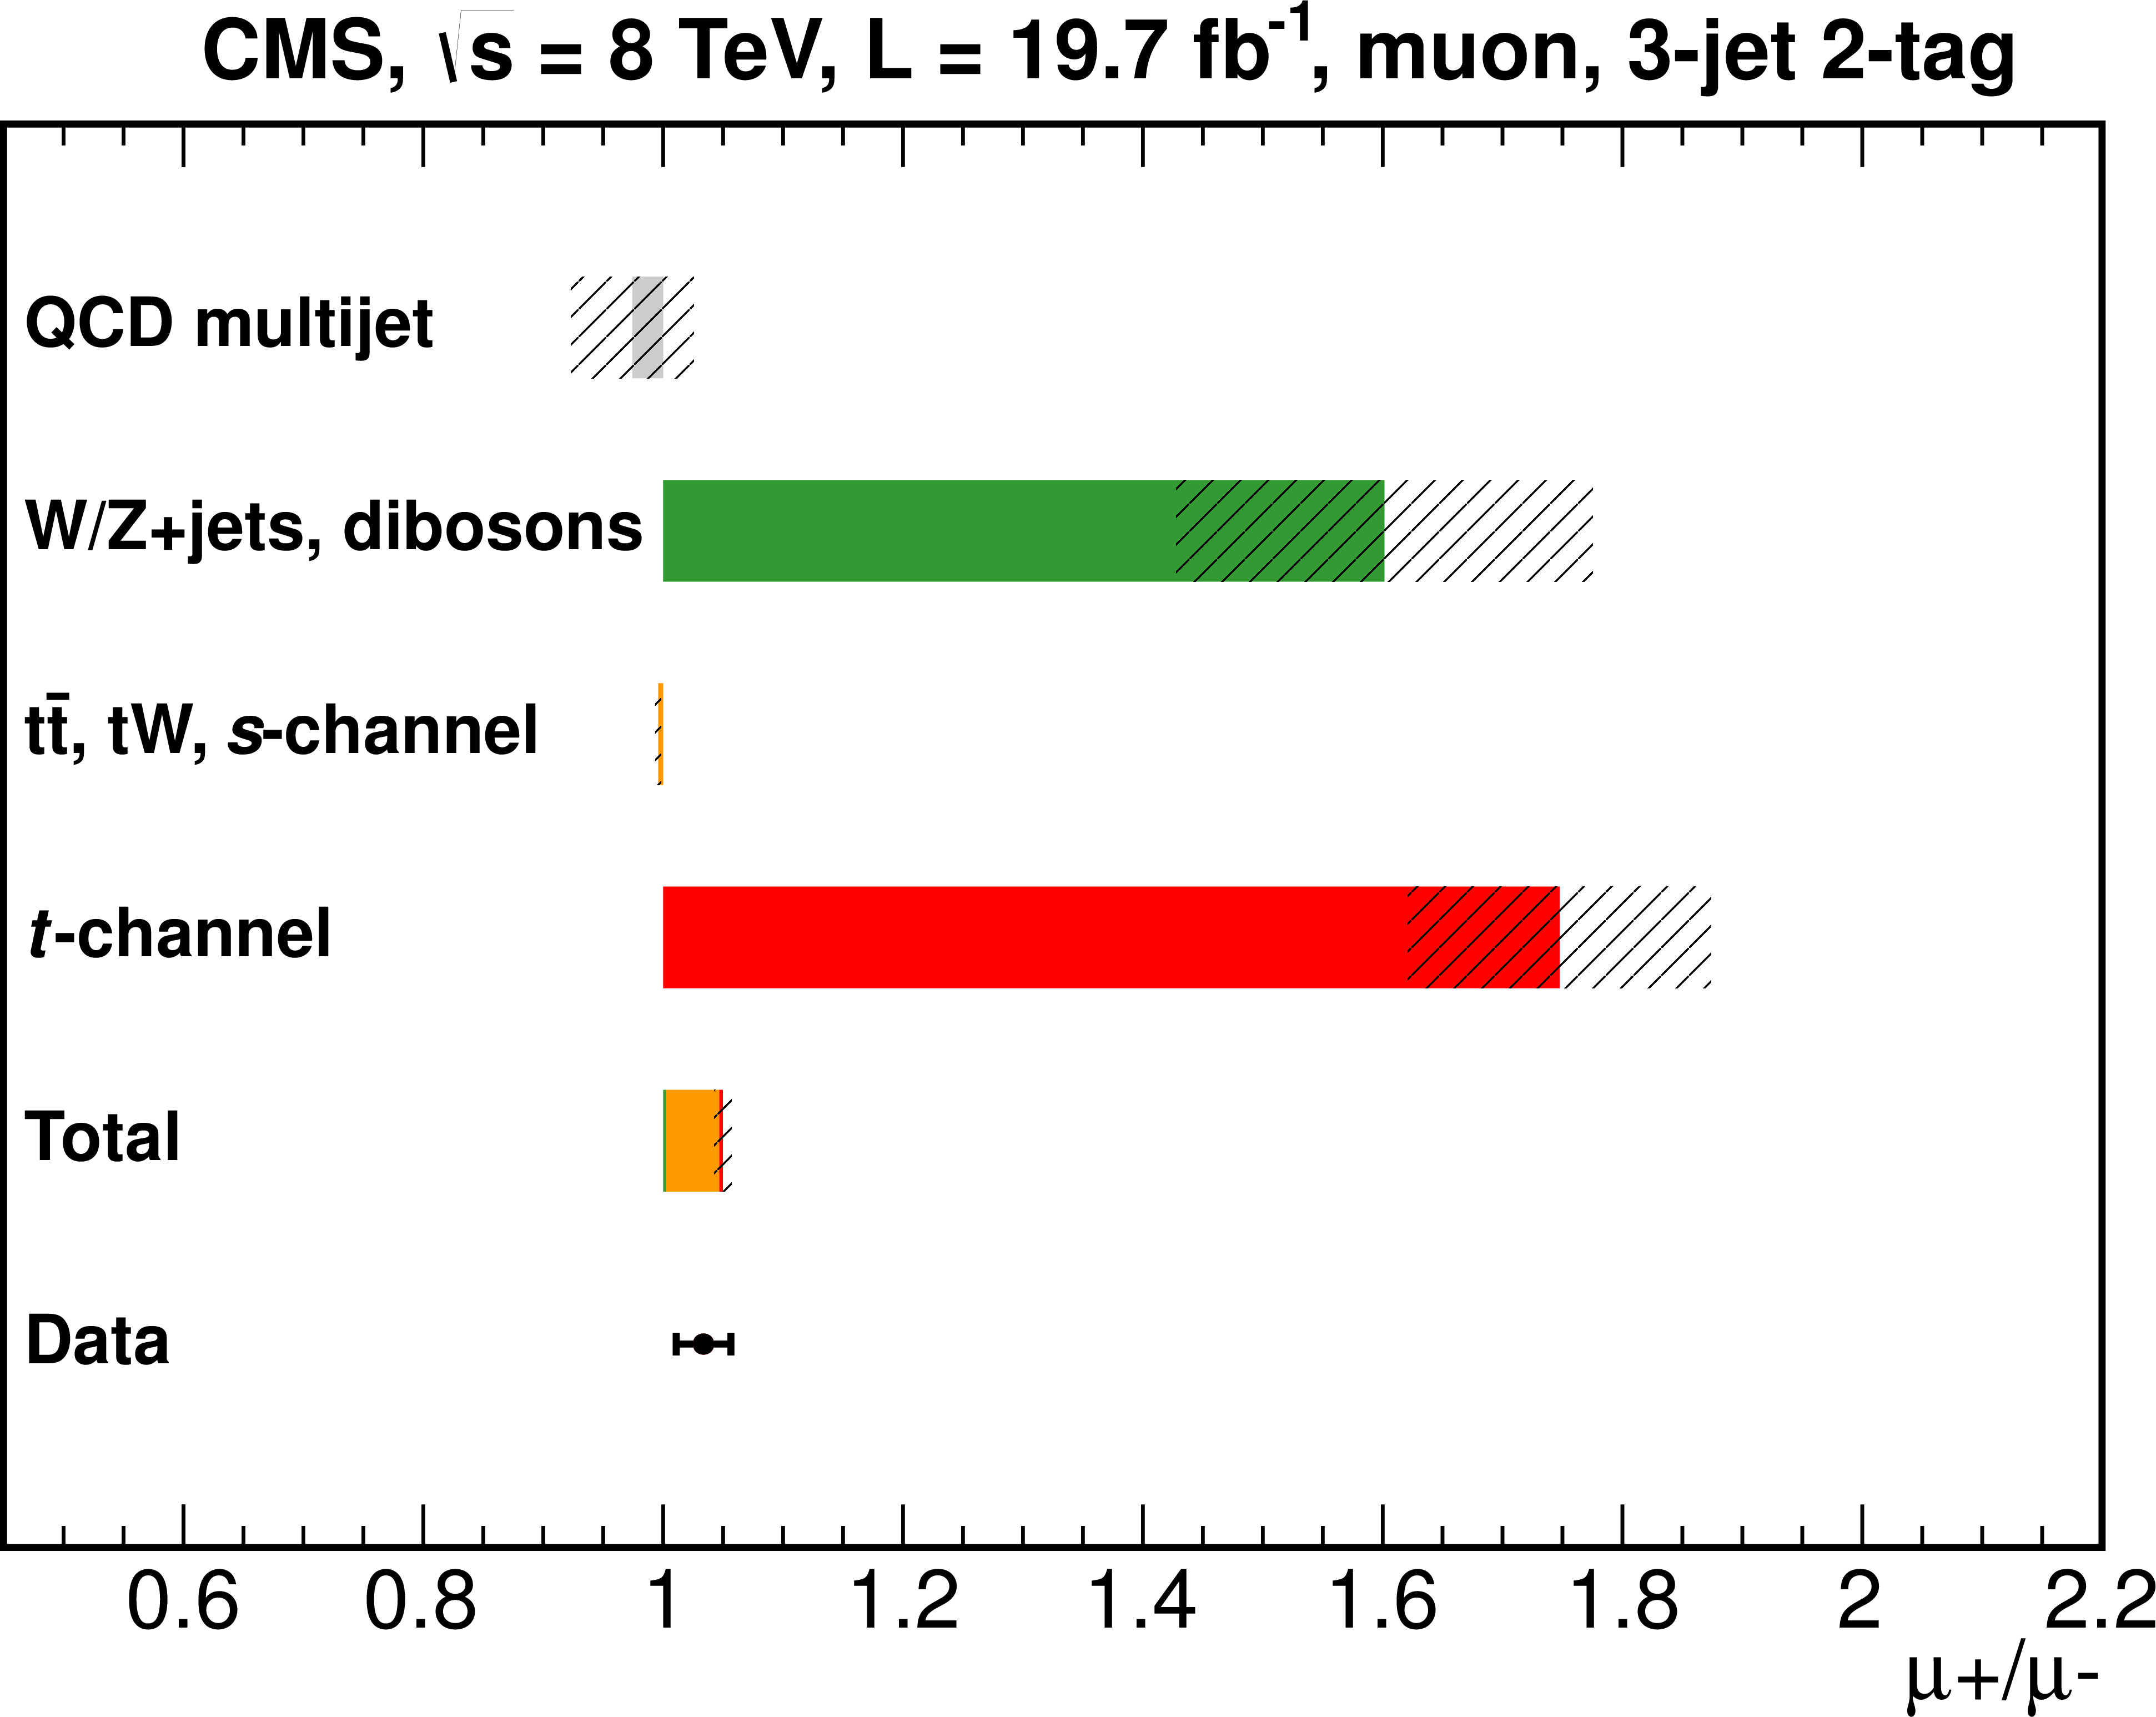
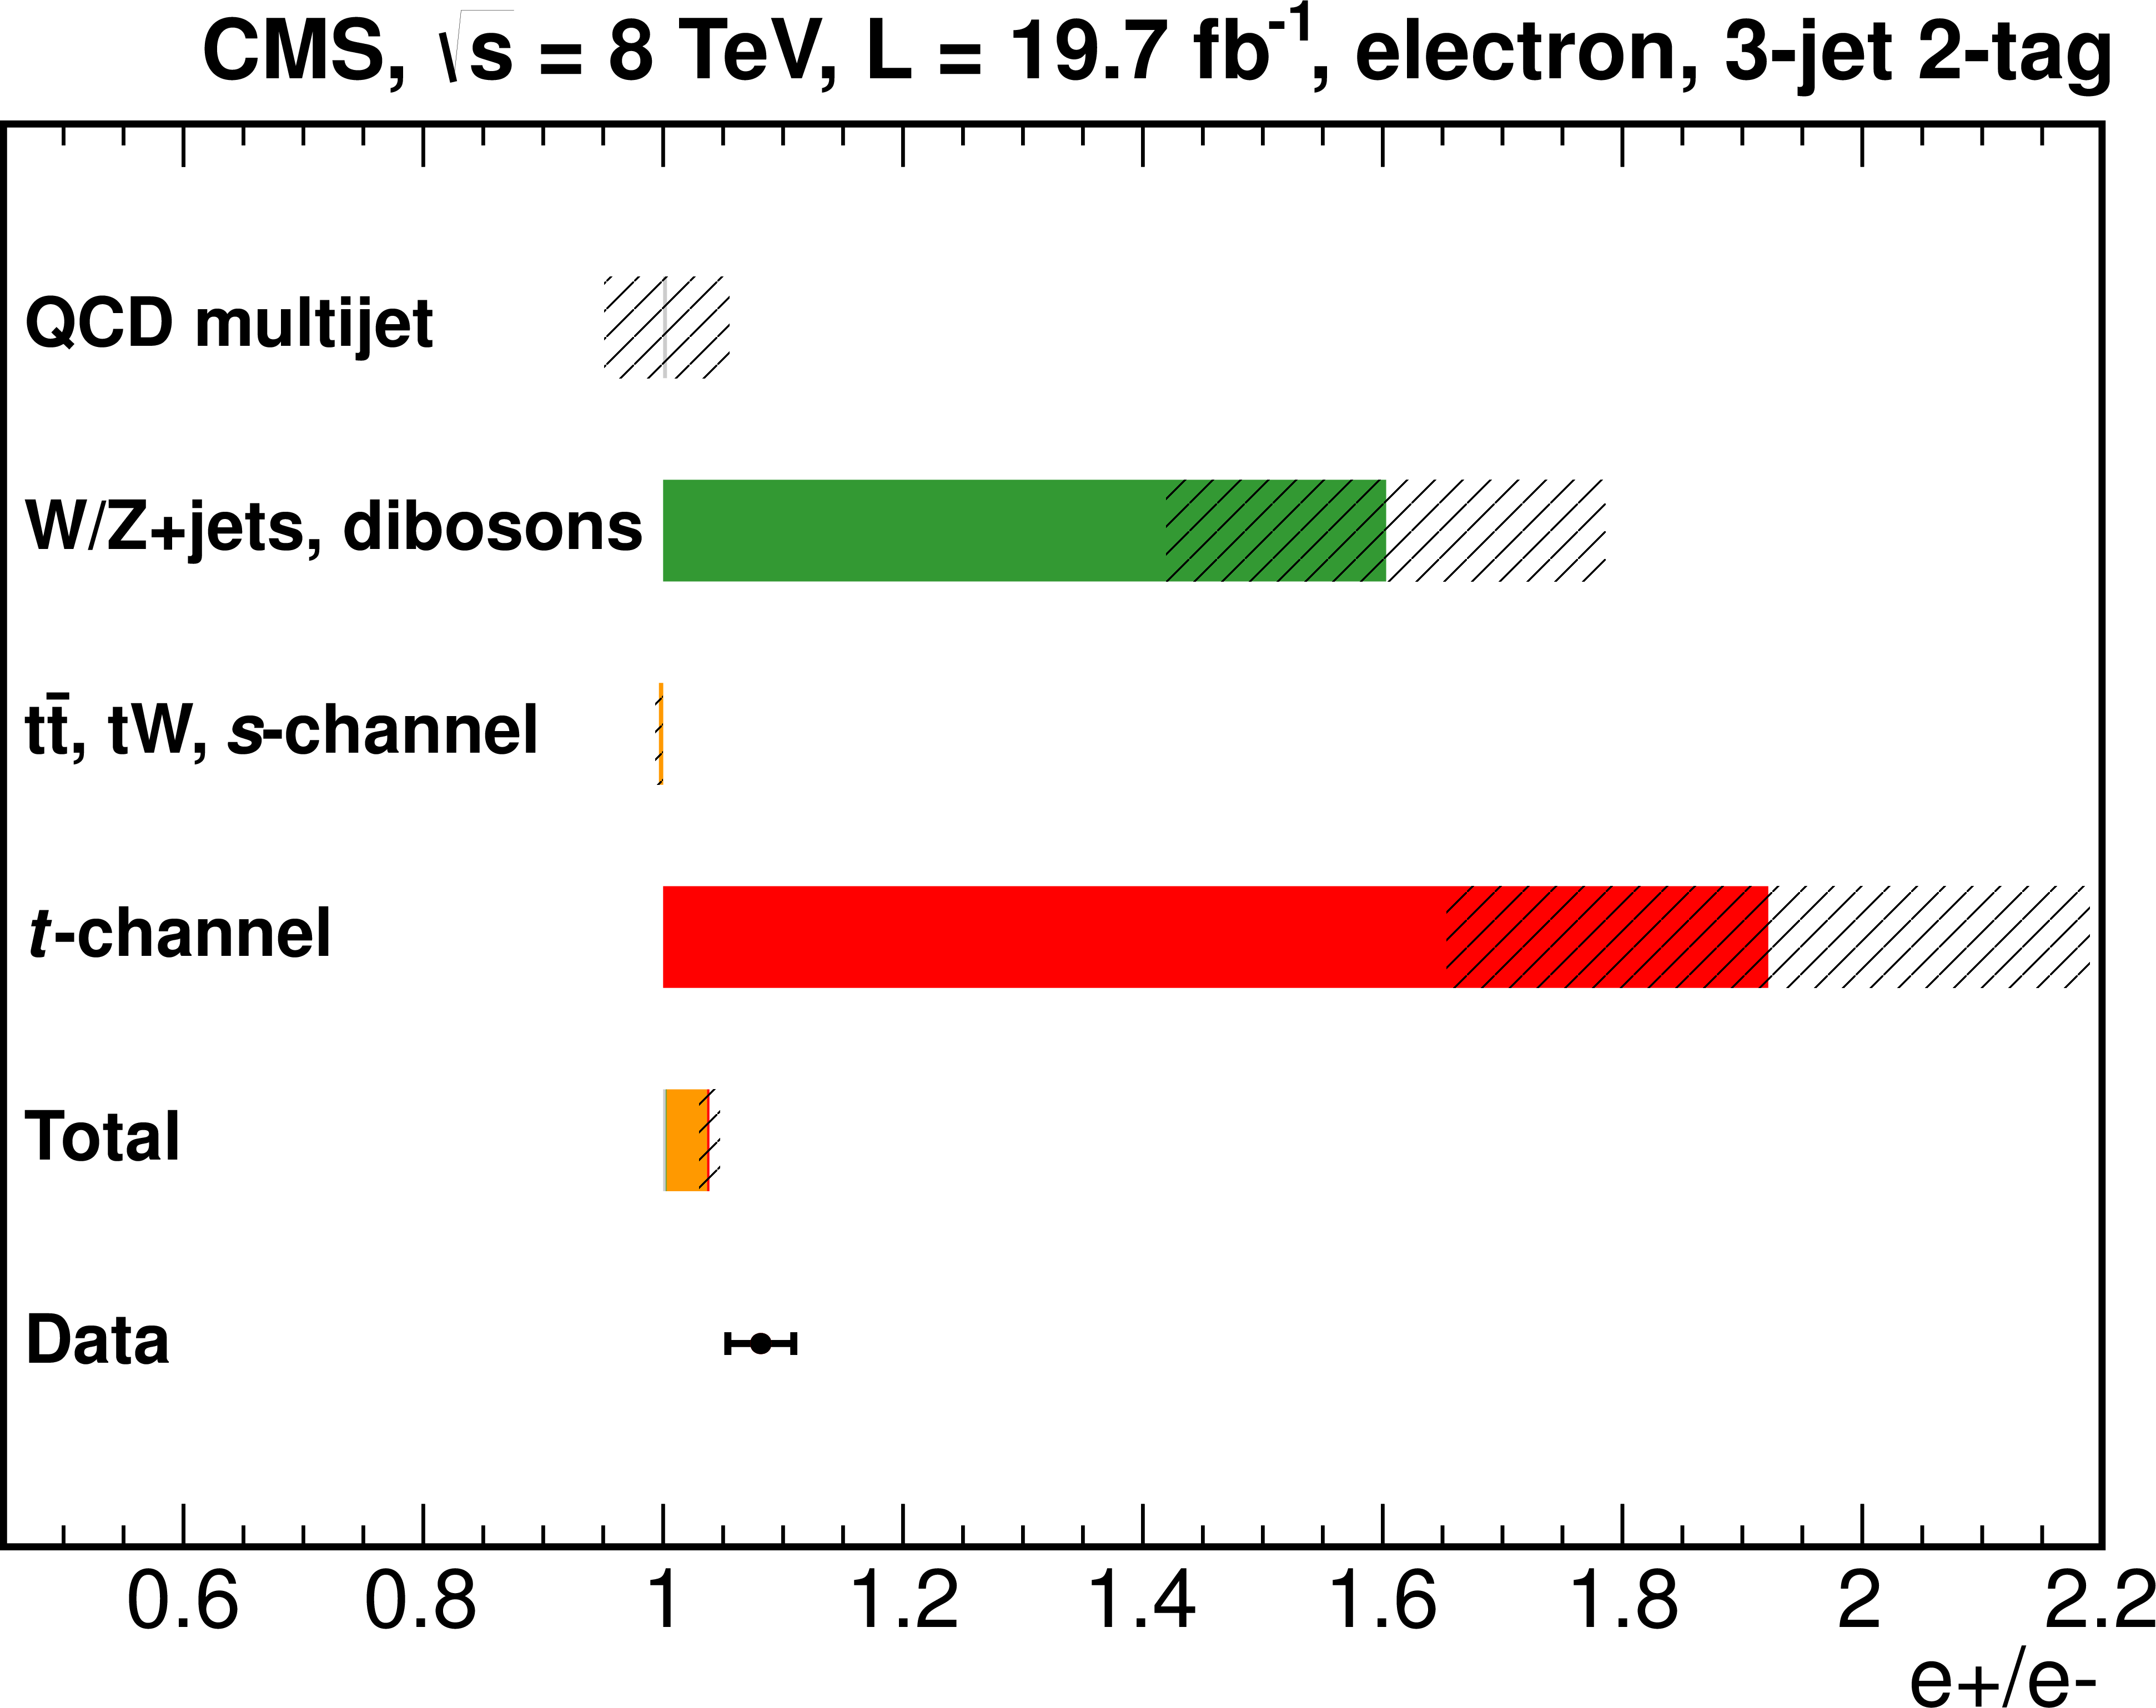
Charge ratio between positively and negatively charged leptons in the 3-jet 1-tag (a, b), 3-jet 2-tag (c, d) samples for muon and electron decay channels. The charge ratio is shown separately for each process, as well as after normalising the sum of all predictions to the data yield. Systematic uncertainty bands include all uncertainties. |
png pdf |
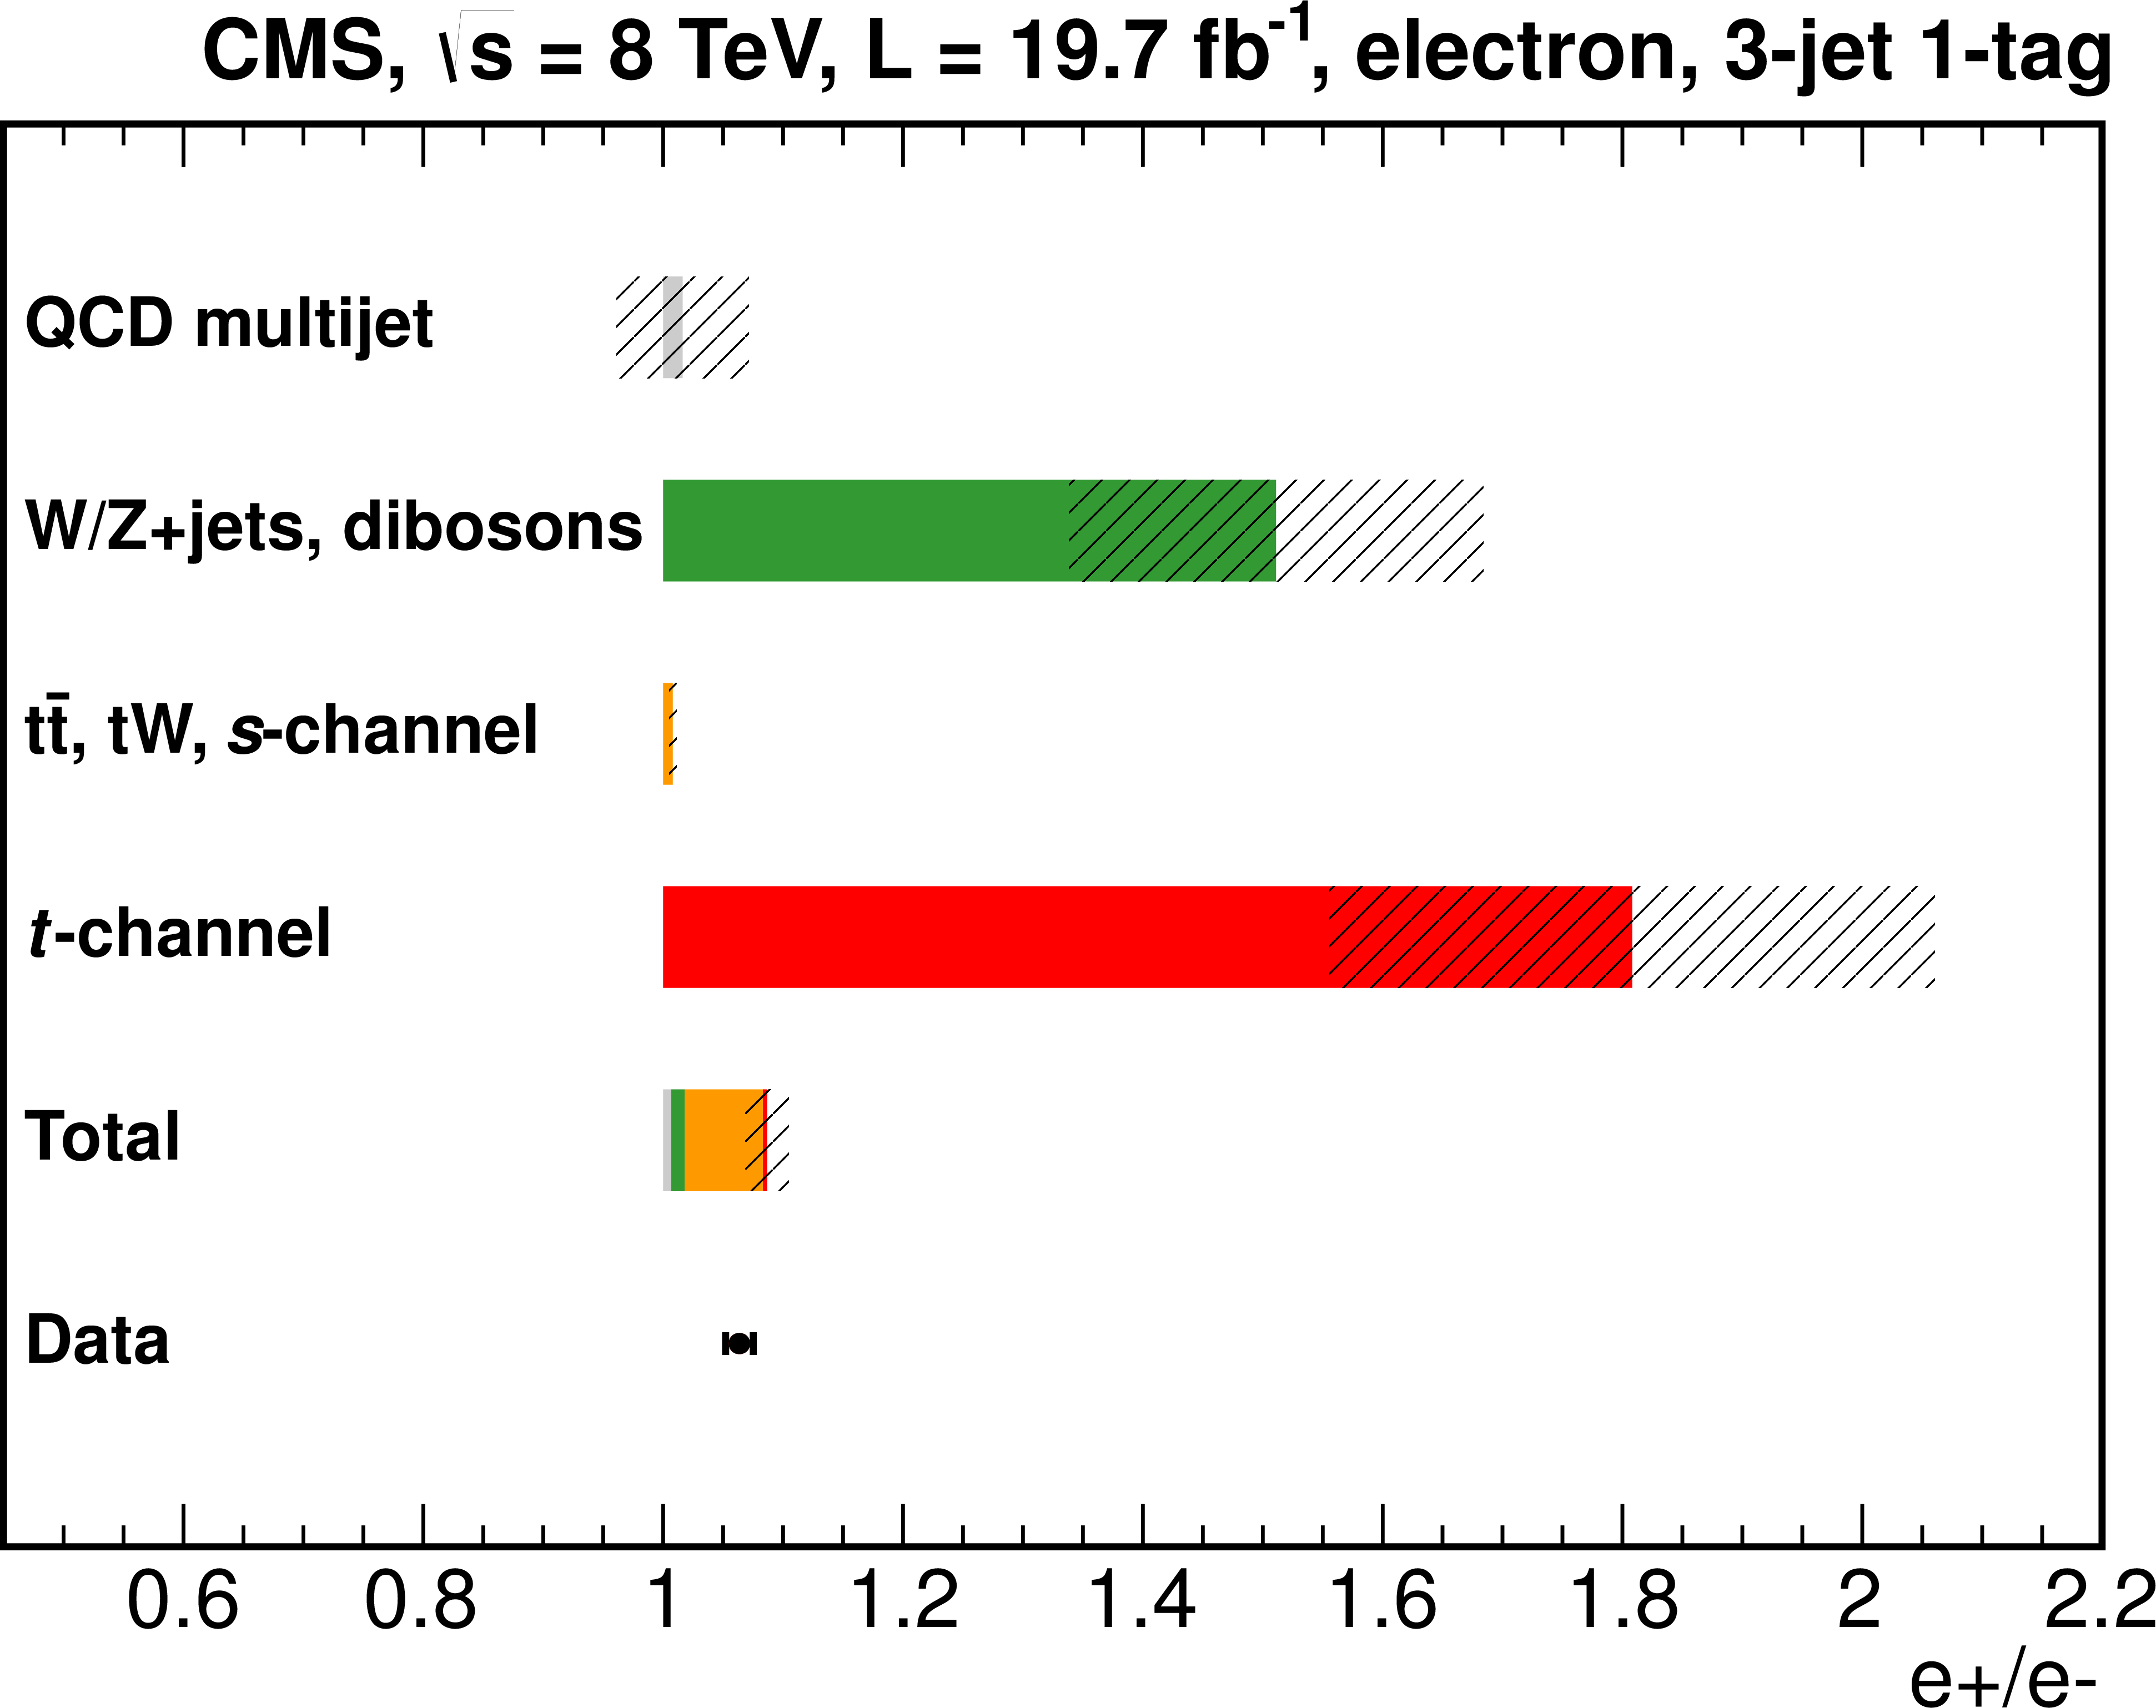
Figure 4-b:
Charge ratio between positively and negatively charged leptons in the 3-jet 1-tag (a, b), 3-jet 2-tag (c, d) samples for muon and electron decay channels. The charge ratio is shown separately for each process, as well as after normalising the sum of all predictions to the data yield. Systematic uncertainty bands include all uncertainties. |
png pdf |
Figure 4-c:
Charge ratio between positively and negatively charged leptons in the 3-jet 1-tag (a, b), 3-jet 2-tag (c, d) samples for muon and electron decay channels. The charge ratio is shown separately for each process, as well as after normalising the sum of all predictions to the data yield. Systematic uncertainty bands include all uncertainties. |
png pdf |
Figure 4-d:
Charge ratio between positively and negatively charged leptons in the 3-jet 1-tag (a, b), 3-jet 2-tag (c, d) samples for muon and electron decay channels. The charge ratio is shown separately for each process, as well as after normalising the sum of all predictions to the data yield. Systematic uncertainty bands include all uncertainties. |
png pdf |
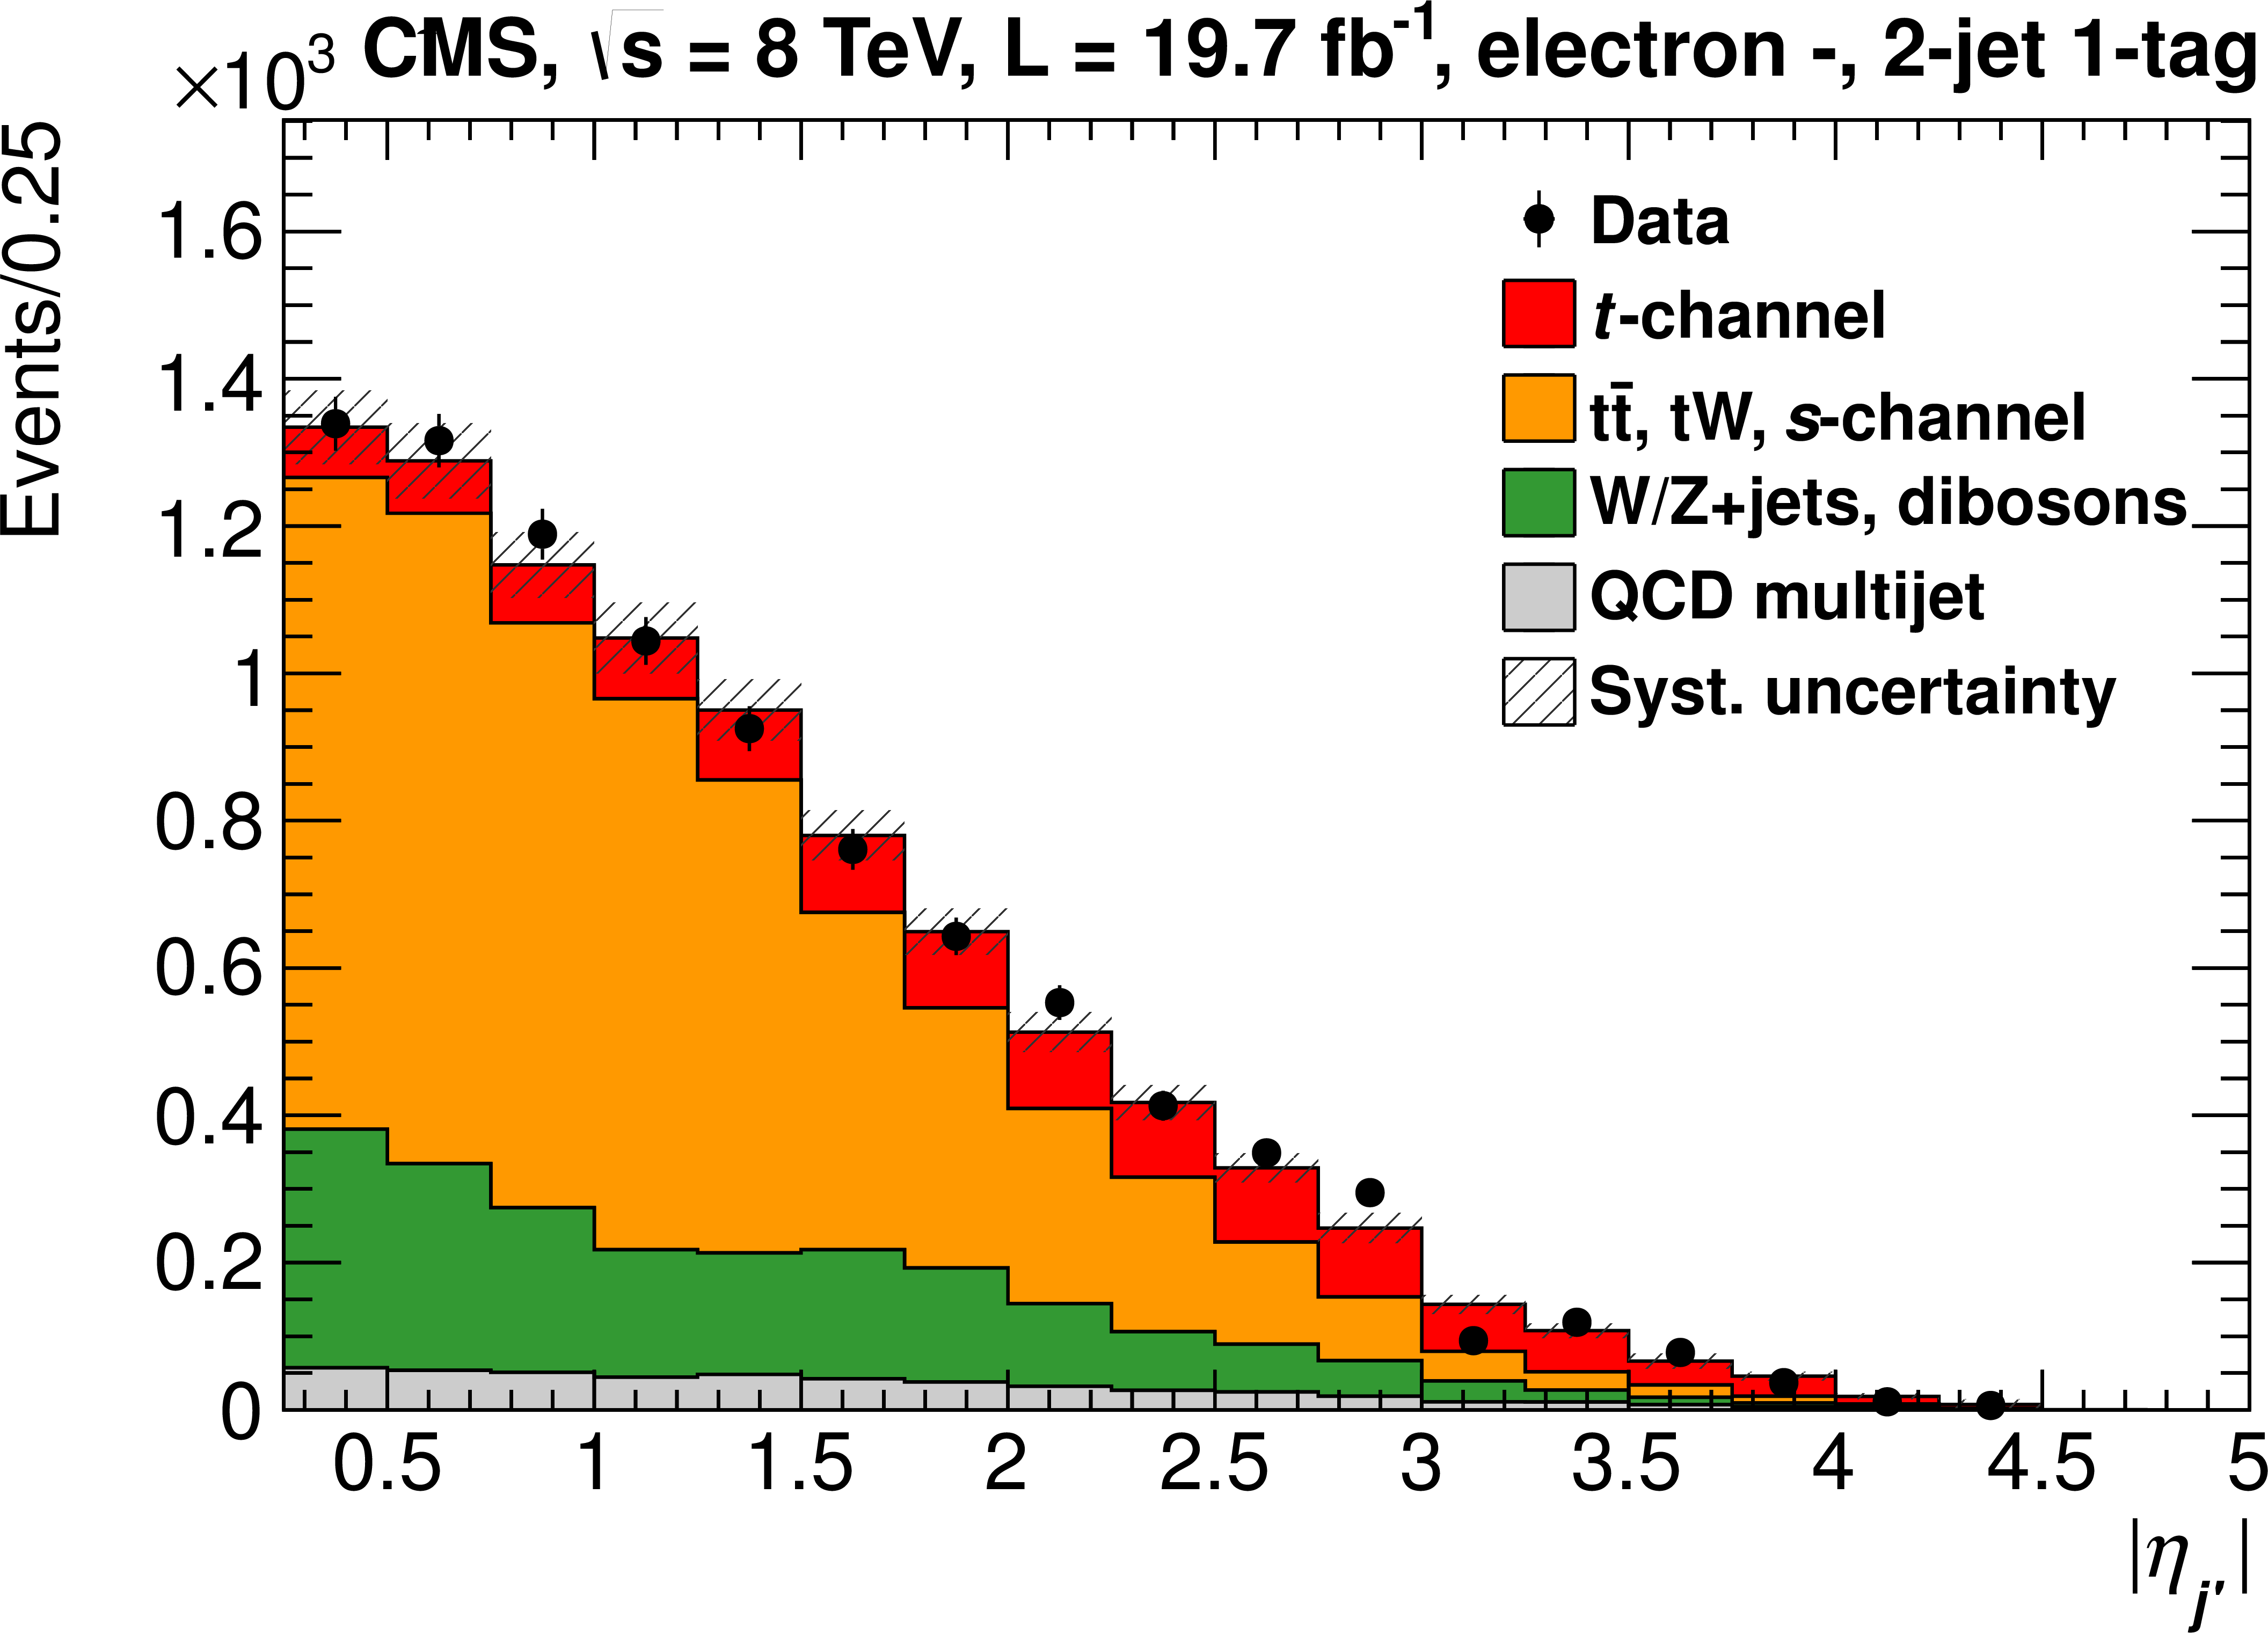
Figure 5-a:
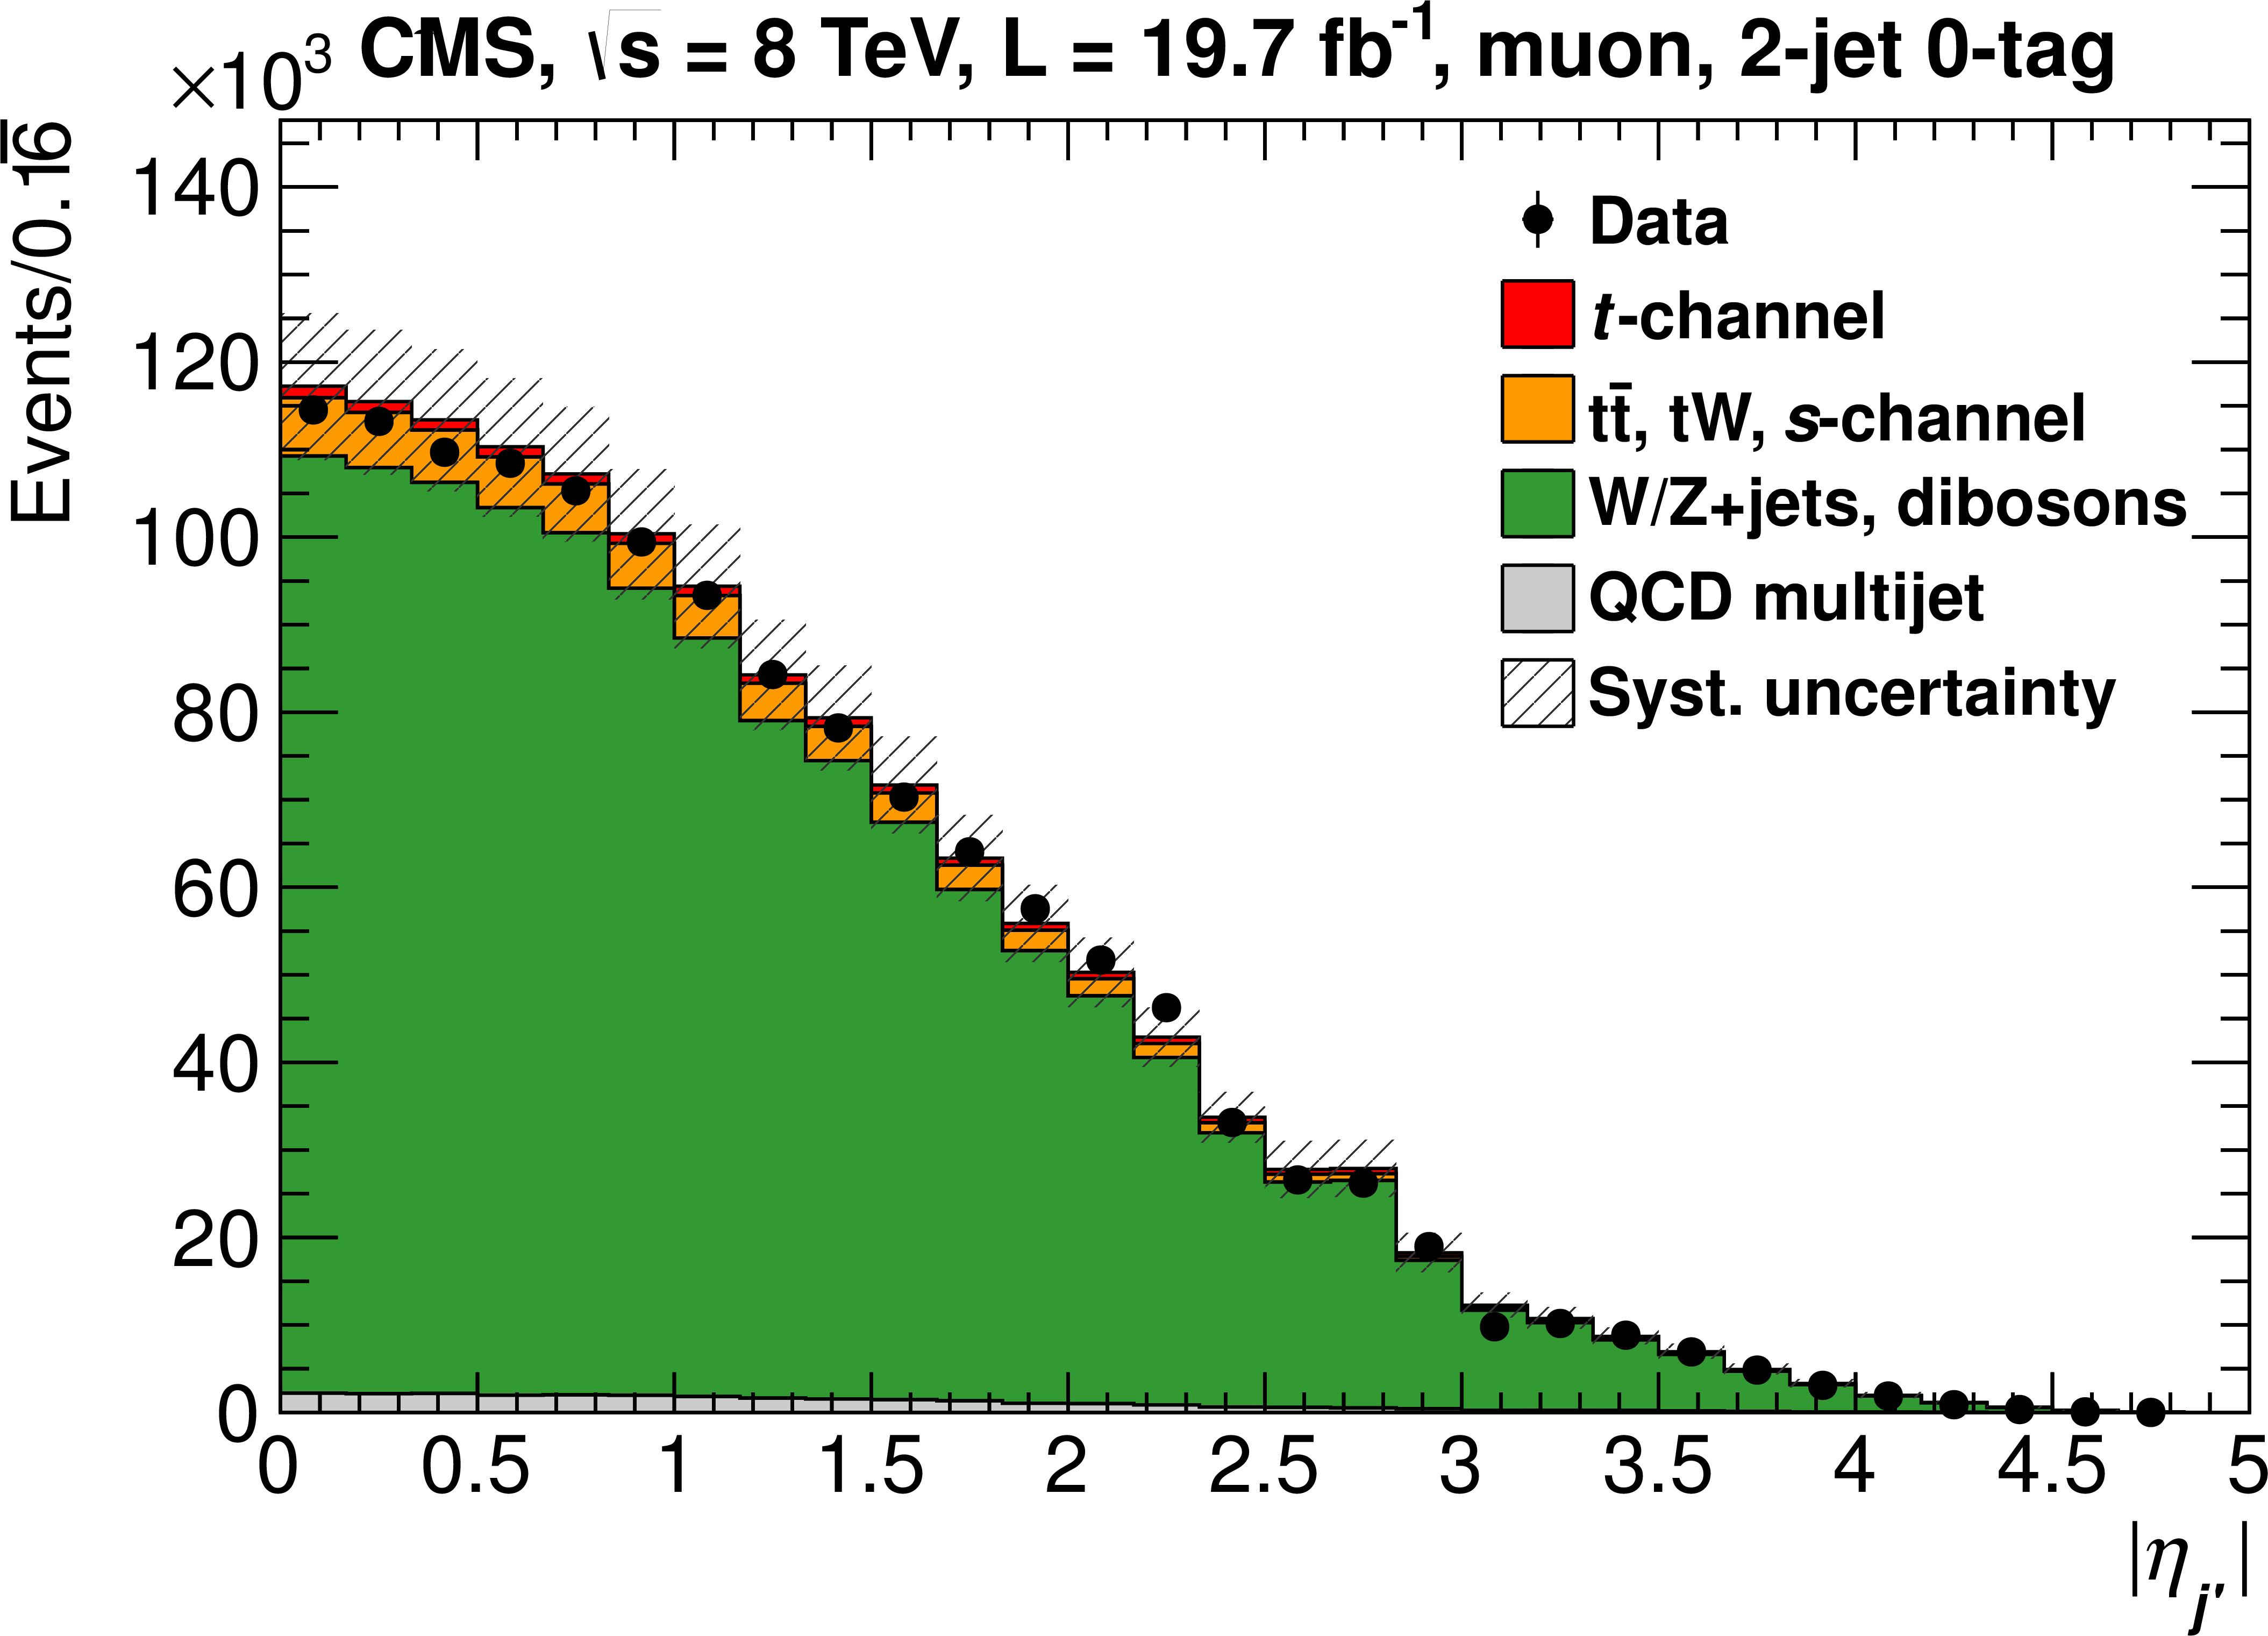
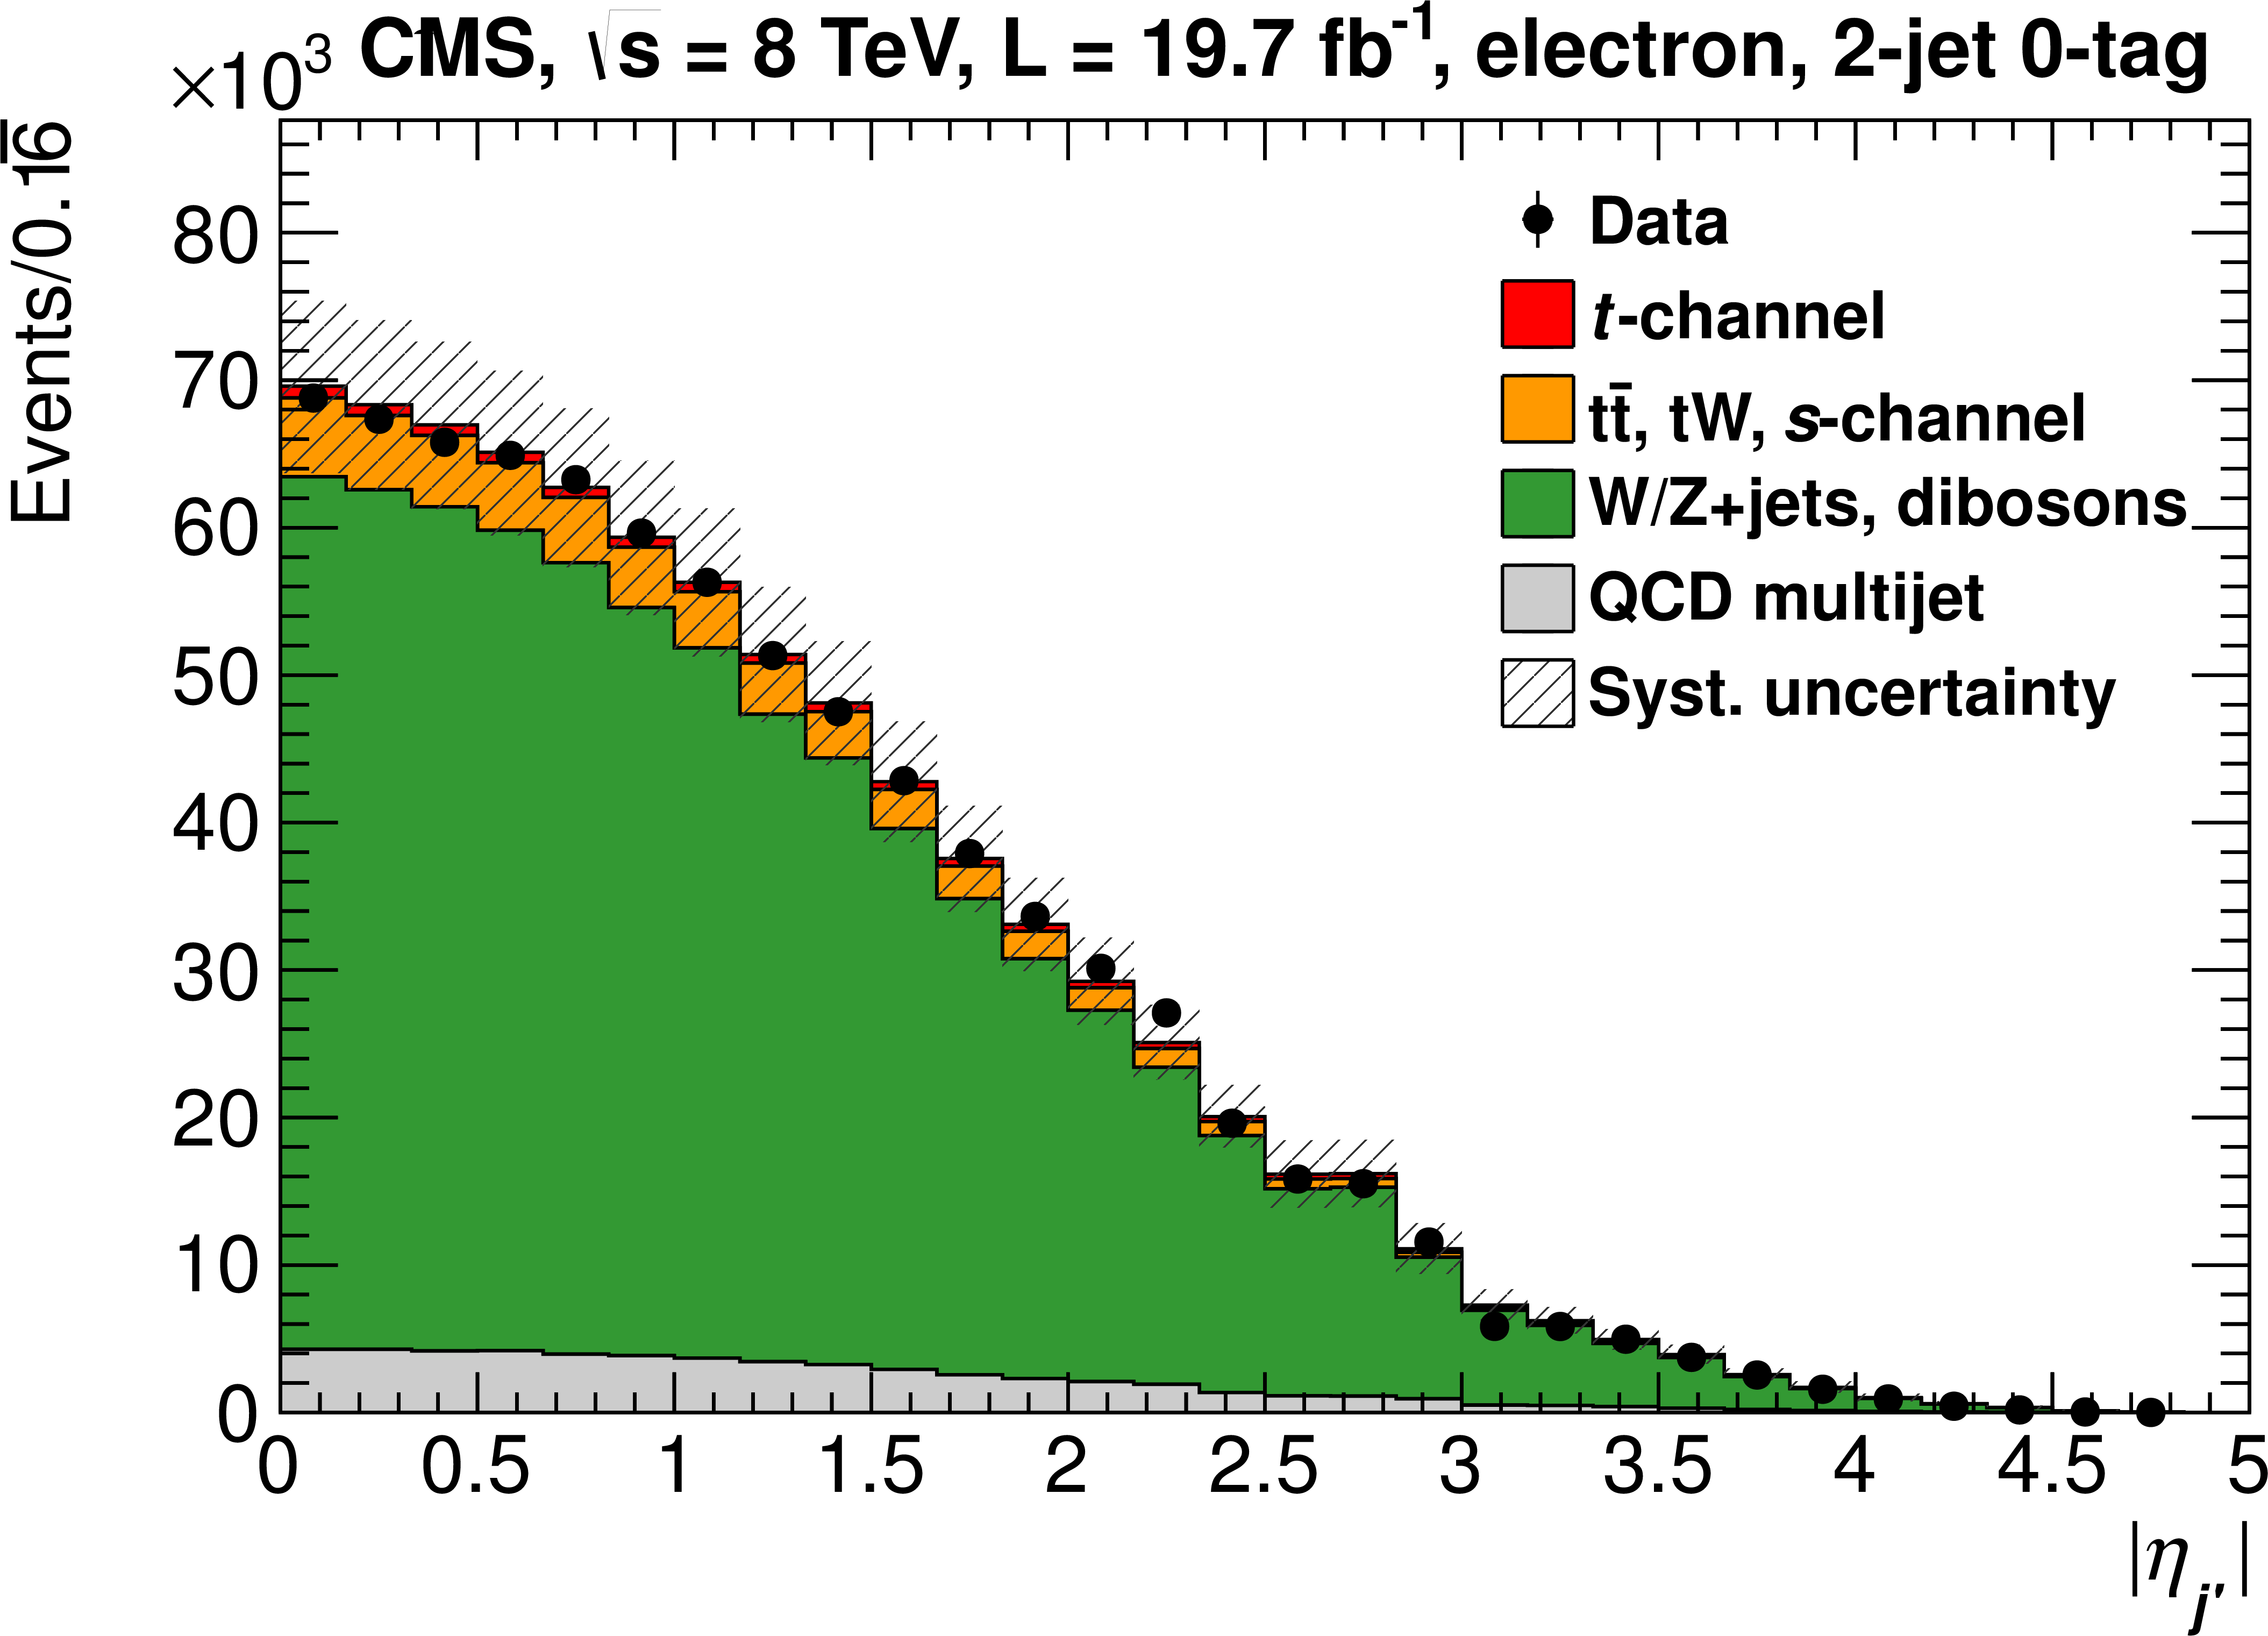
Distribution of $ { {| \eta _{j'} | }} $ in the 2-jet 0-tag sample for muon (a) and electron (b) decay channels. The $ {\mathrm {QCD}\text {multijet}} $ contribution is derived from the fit to $ {m_{\mathrm {T}}} $ and $ {E_{\mathrm {T}} } $. Systematic uncertainty bands include pre-fit uncertainties, both on the normalisation and on the shape of the distributions. |
png pdf |
Figure 5-b:
Distribution of $ { {| \eta _{j'} | }} $ in the 2-jet 0-tag sample for muon (a) and electron (b) decay channels. The $ {\mathrm {QCD}\text {multijet}} $ contribution is derived from the fit to $ {m_{\mathrm {T}}} $ and $ {E_{\mathrm {T}} } $. Systematic uncertainty bands include pre-fit uncertainties, both on the normalisation and on the shape of the distributions. |
png pdf |
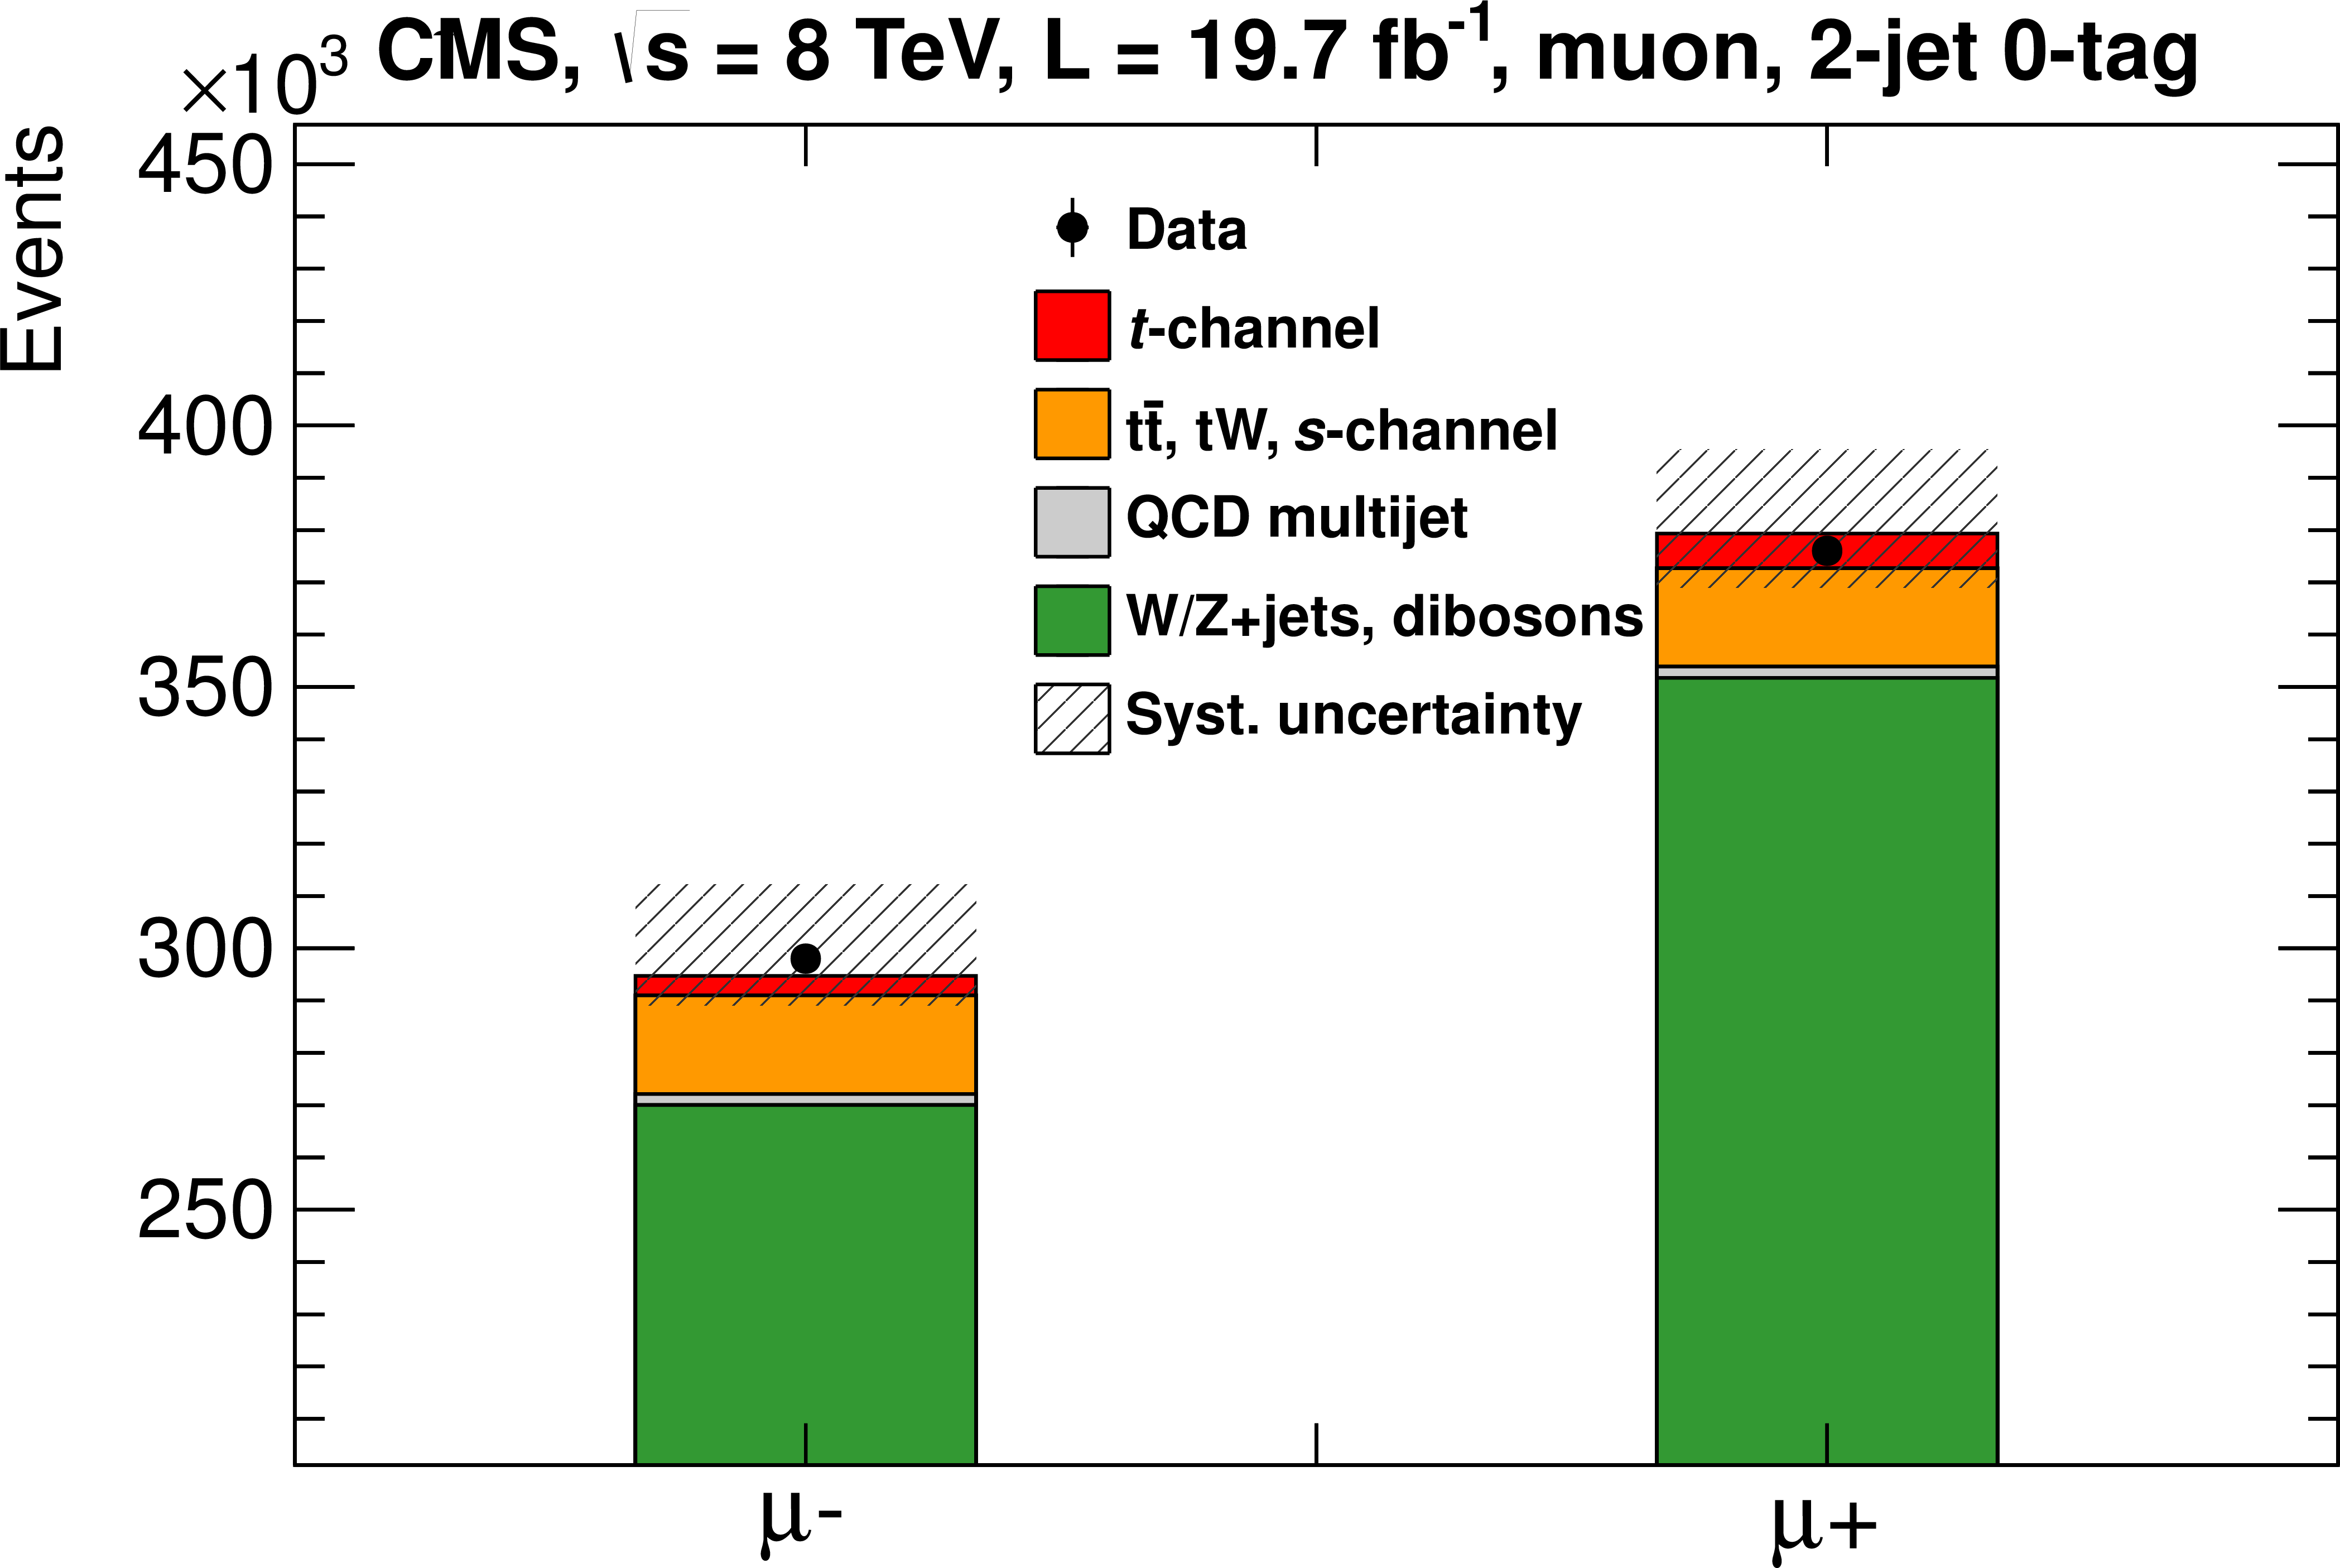
Figure 6-a:
Charge of the lepton in the 2-jet 0-tag sample for muon (a) and electron (b) decay channels. The sum of all predictions is normalised to the data yield. Systematic uncertainty bands include all uncertainties on the charge ratio. |
png pdf |
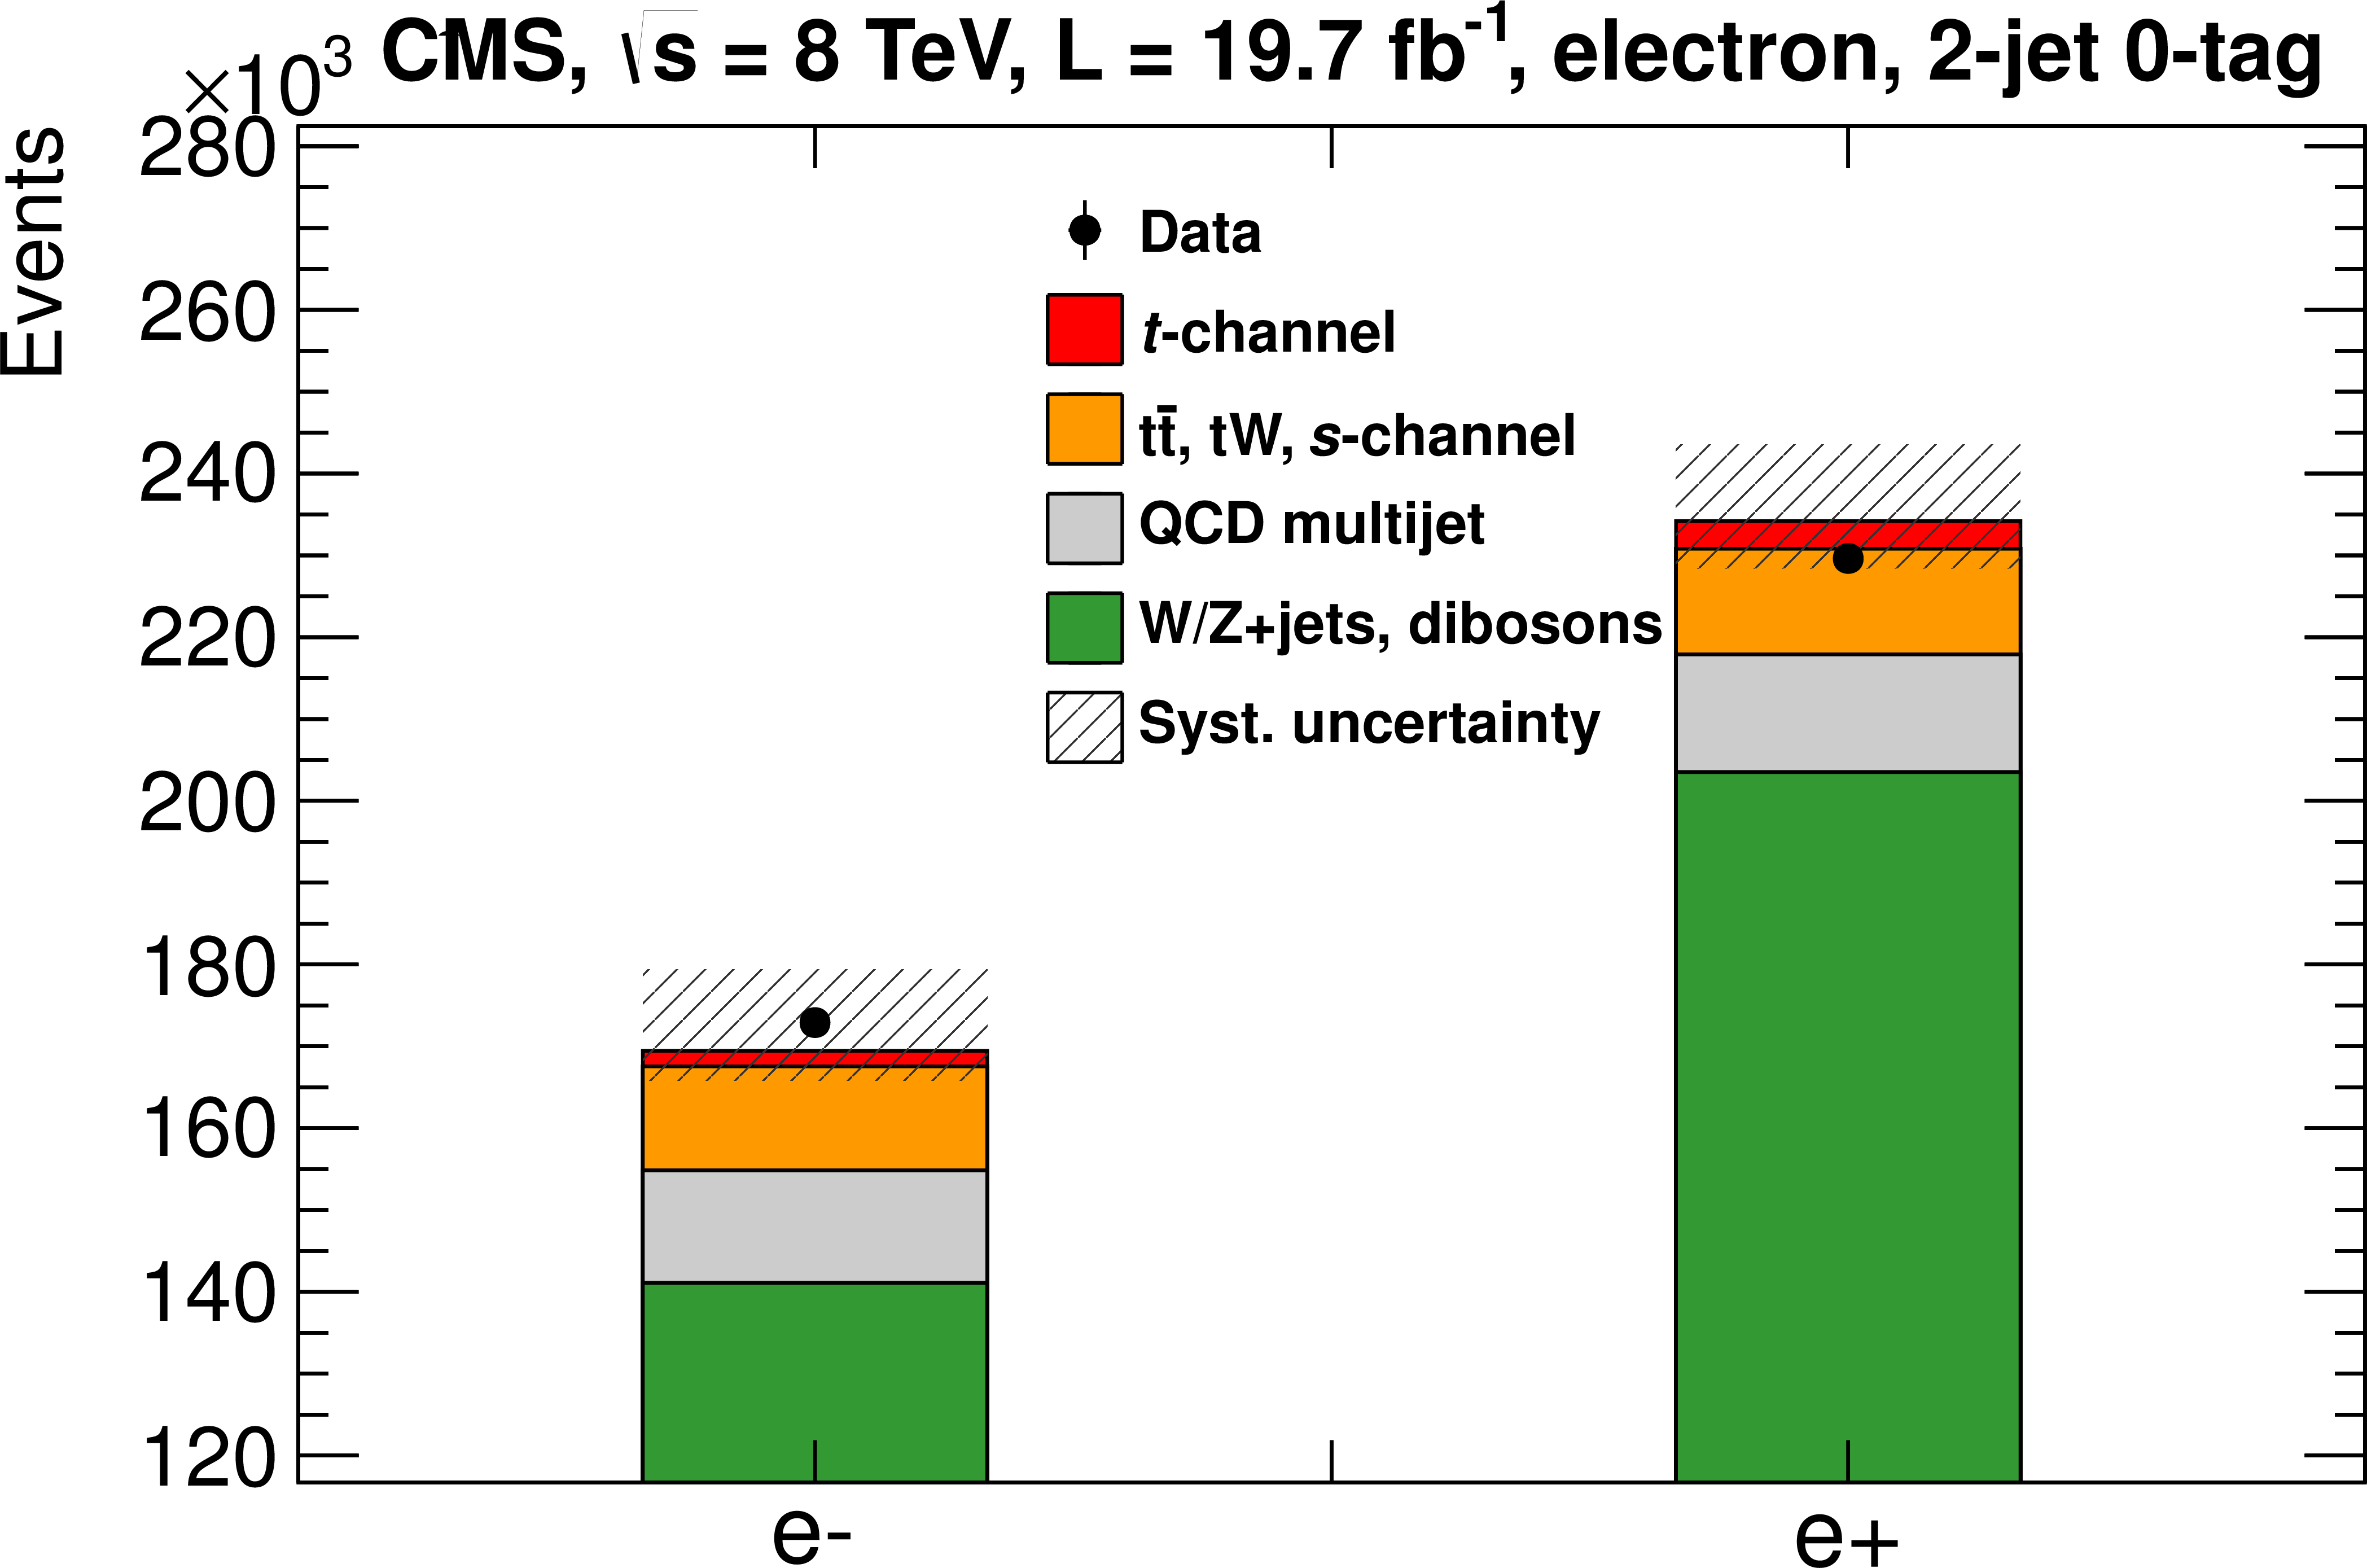
Figure 6-b:
Charge of the lepton in the 2-jet 0-tag sample for muon (a) and electron (b) decay channels. The sum of all predictions is normalised to the data yield. Systematic uncertainty bands include all uncertainties on the charge ratio. |
png pdf |
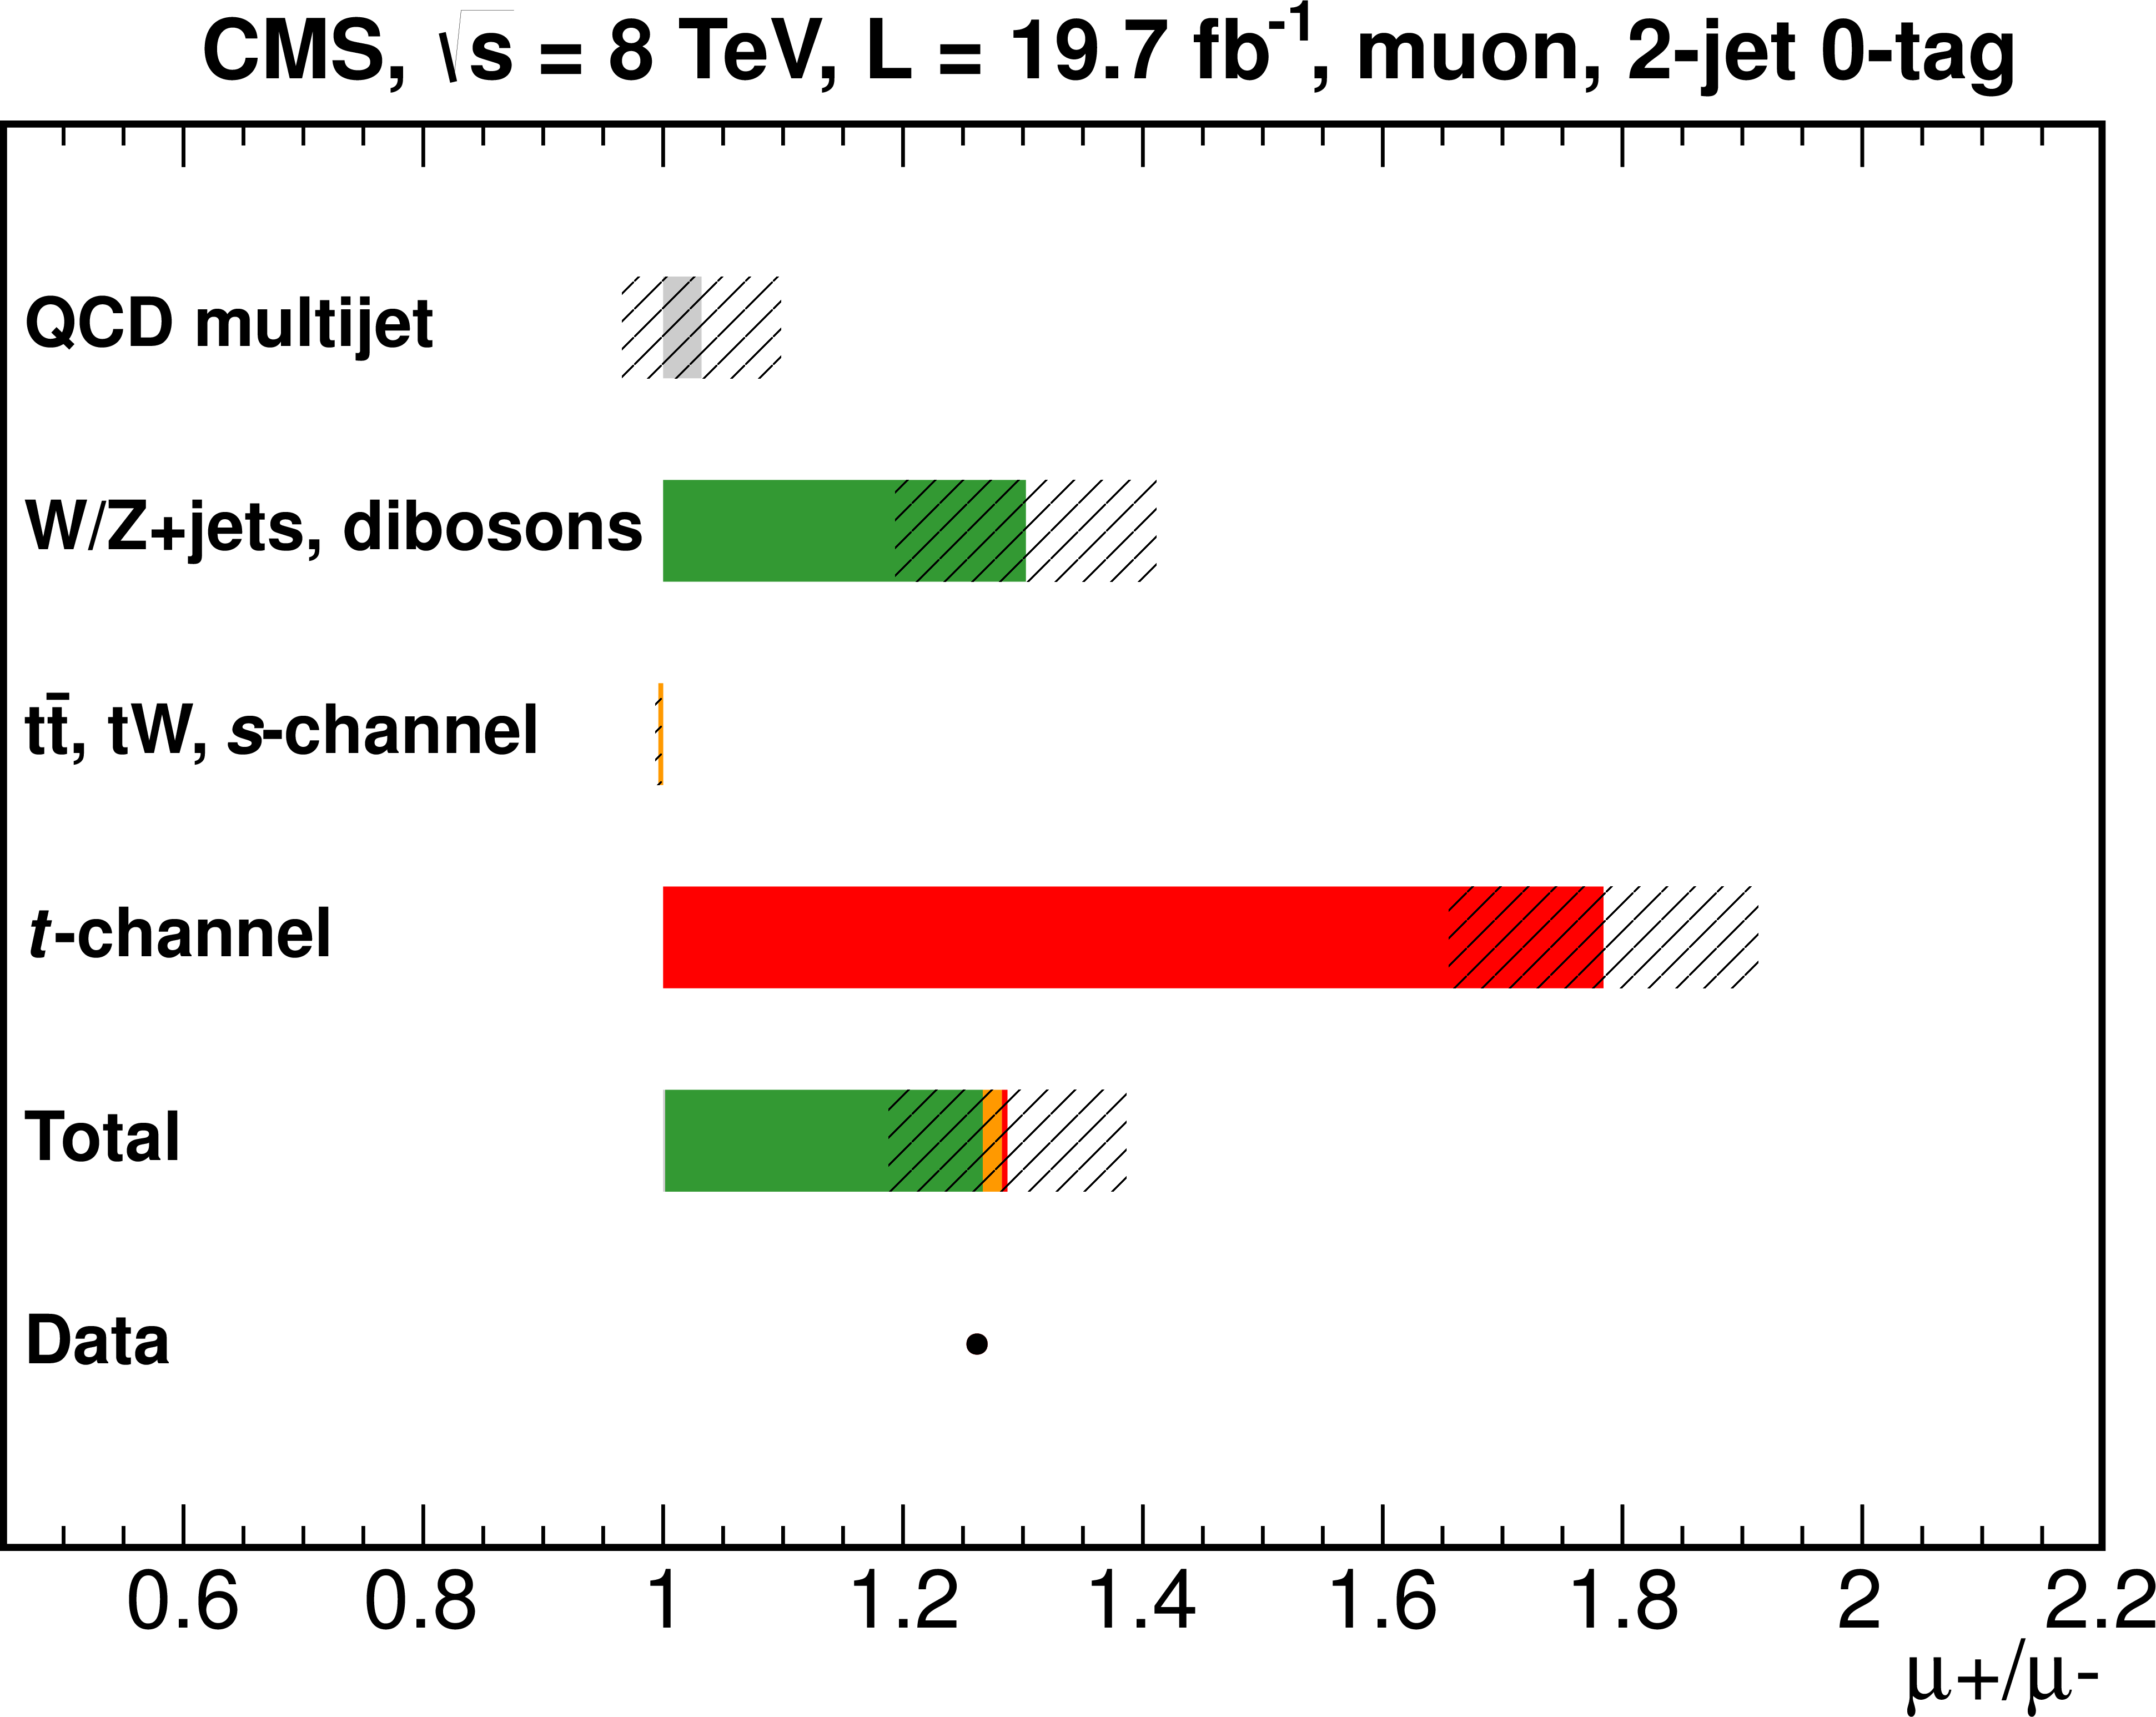
Figure 7-a:
Charge ratio between positively and negatively charged leptons in the 2-jet 0-tag sample for muon (a) and electron (b) decay channels. The charge ratio is shown separately for each process, as well as after normalising the sum of all predictions to the data yield. Systematic uncertainty bands include all uncertainties. |
png pdf |
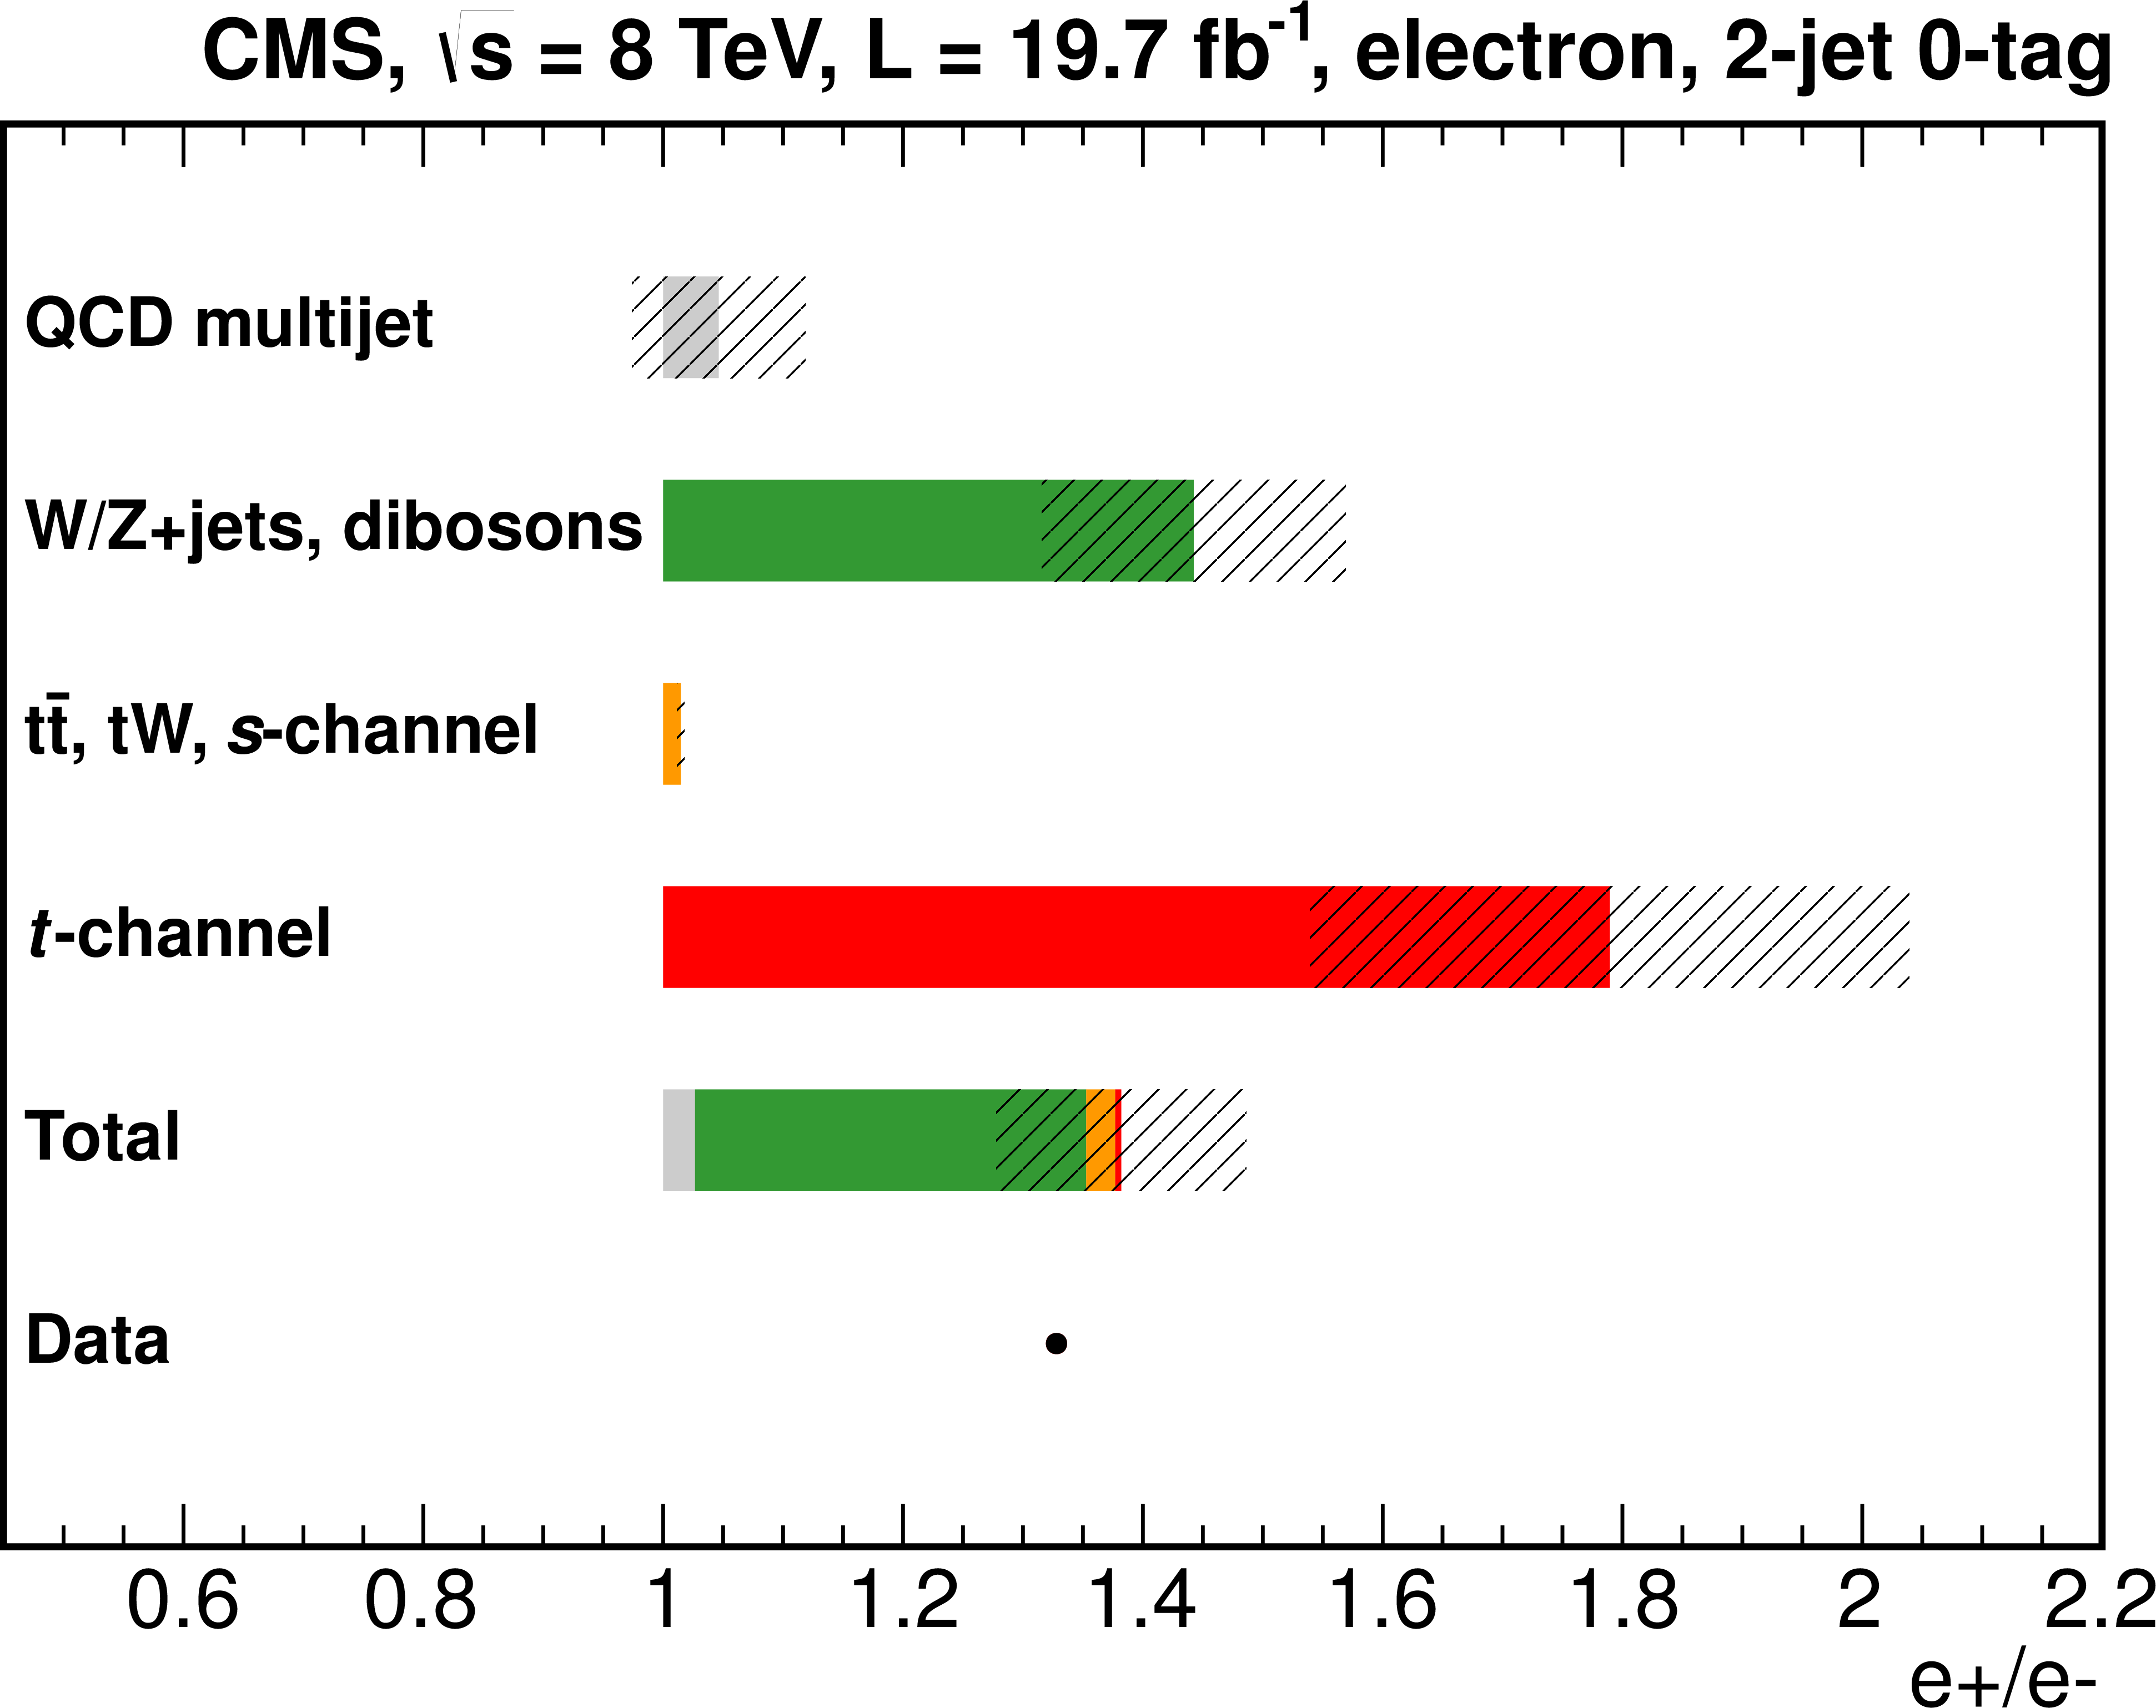
Figure 7-b:
Charge ratio between positively and negatively charged leptons in the 2-jet 0-tag sample for muon (a) and electron (b) decay channels. The charge ratio is shown separately for each process, as well as after normalising the sum of all predictions to the data yield. Systematic uncertainty bands include all uncertainties. |
png pdf |
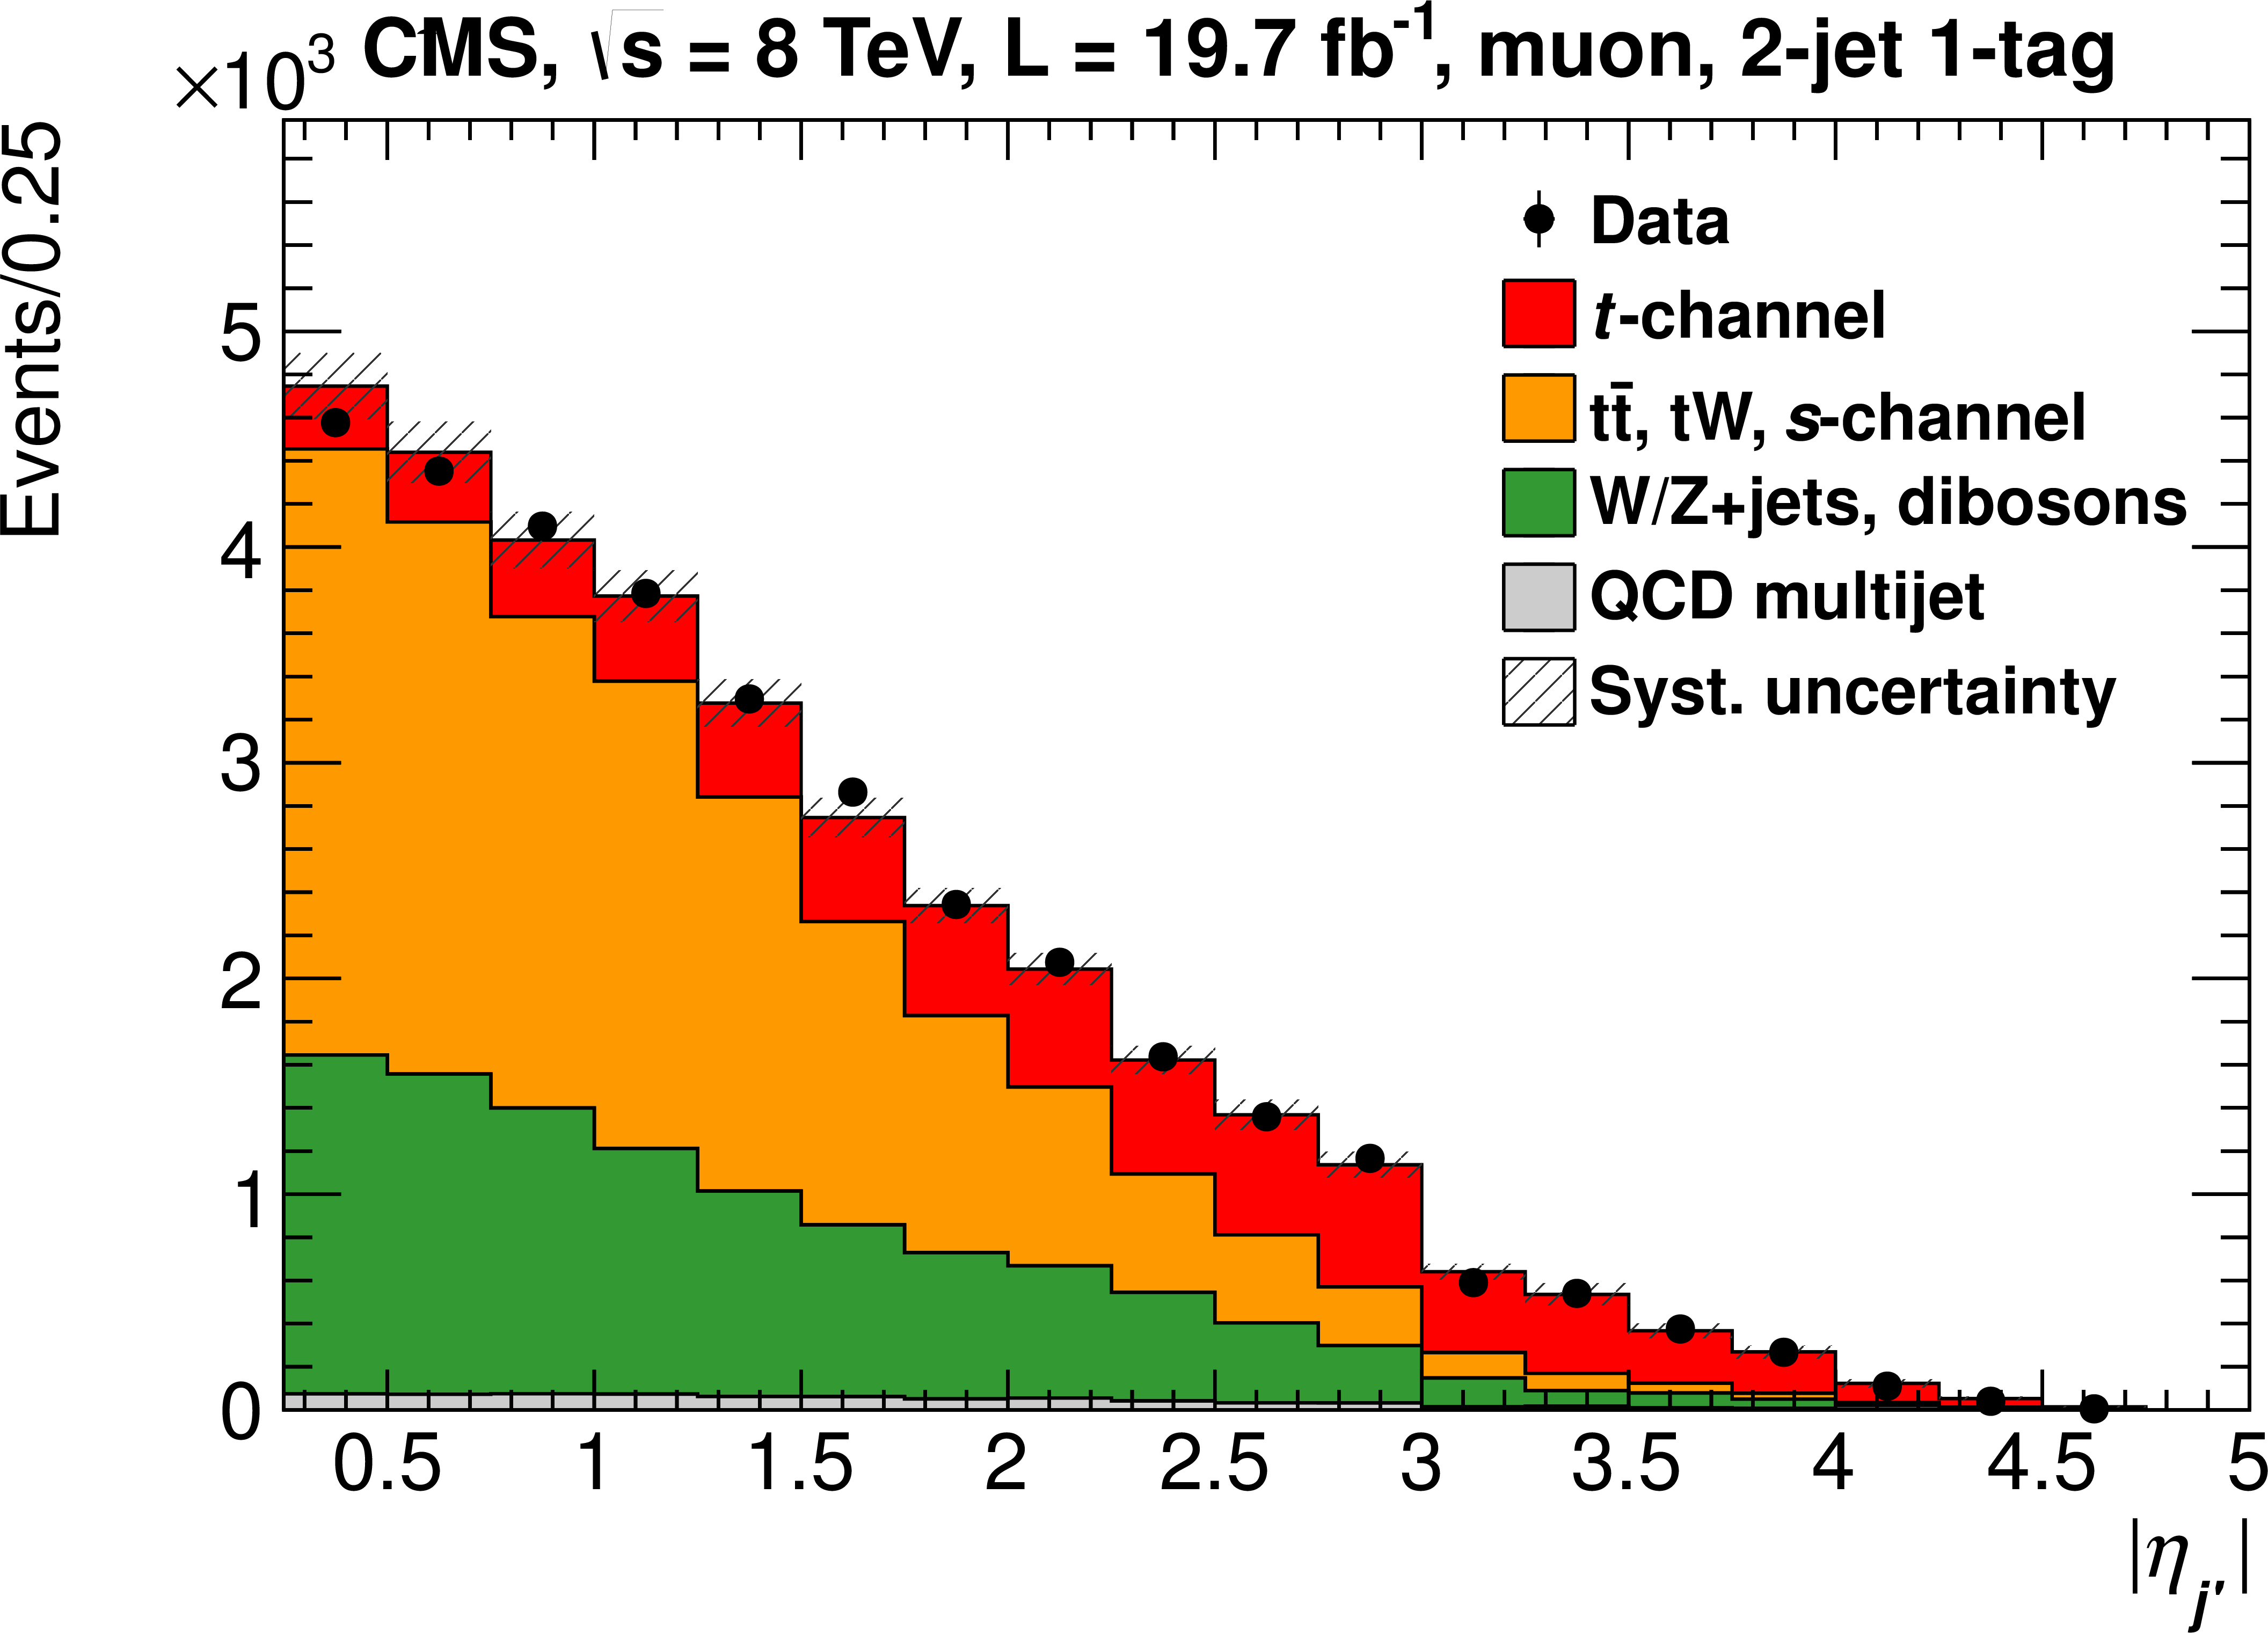
Figure 8-a:
Fitted $ { {| \eta _{j'} | }} $ distributions for muon (a) and electron (b) decay channels, normalised to the yields obtained from the combined total cross section fit. Systematic uncertainty bands include the shape uncertainties on the distributions. |
png pdf |
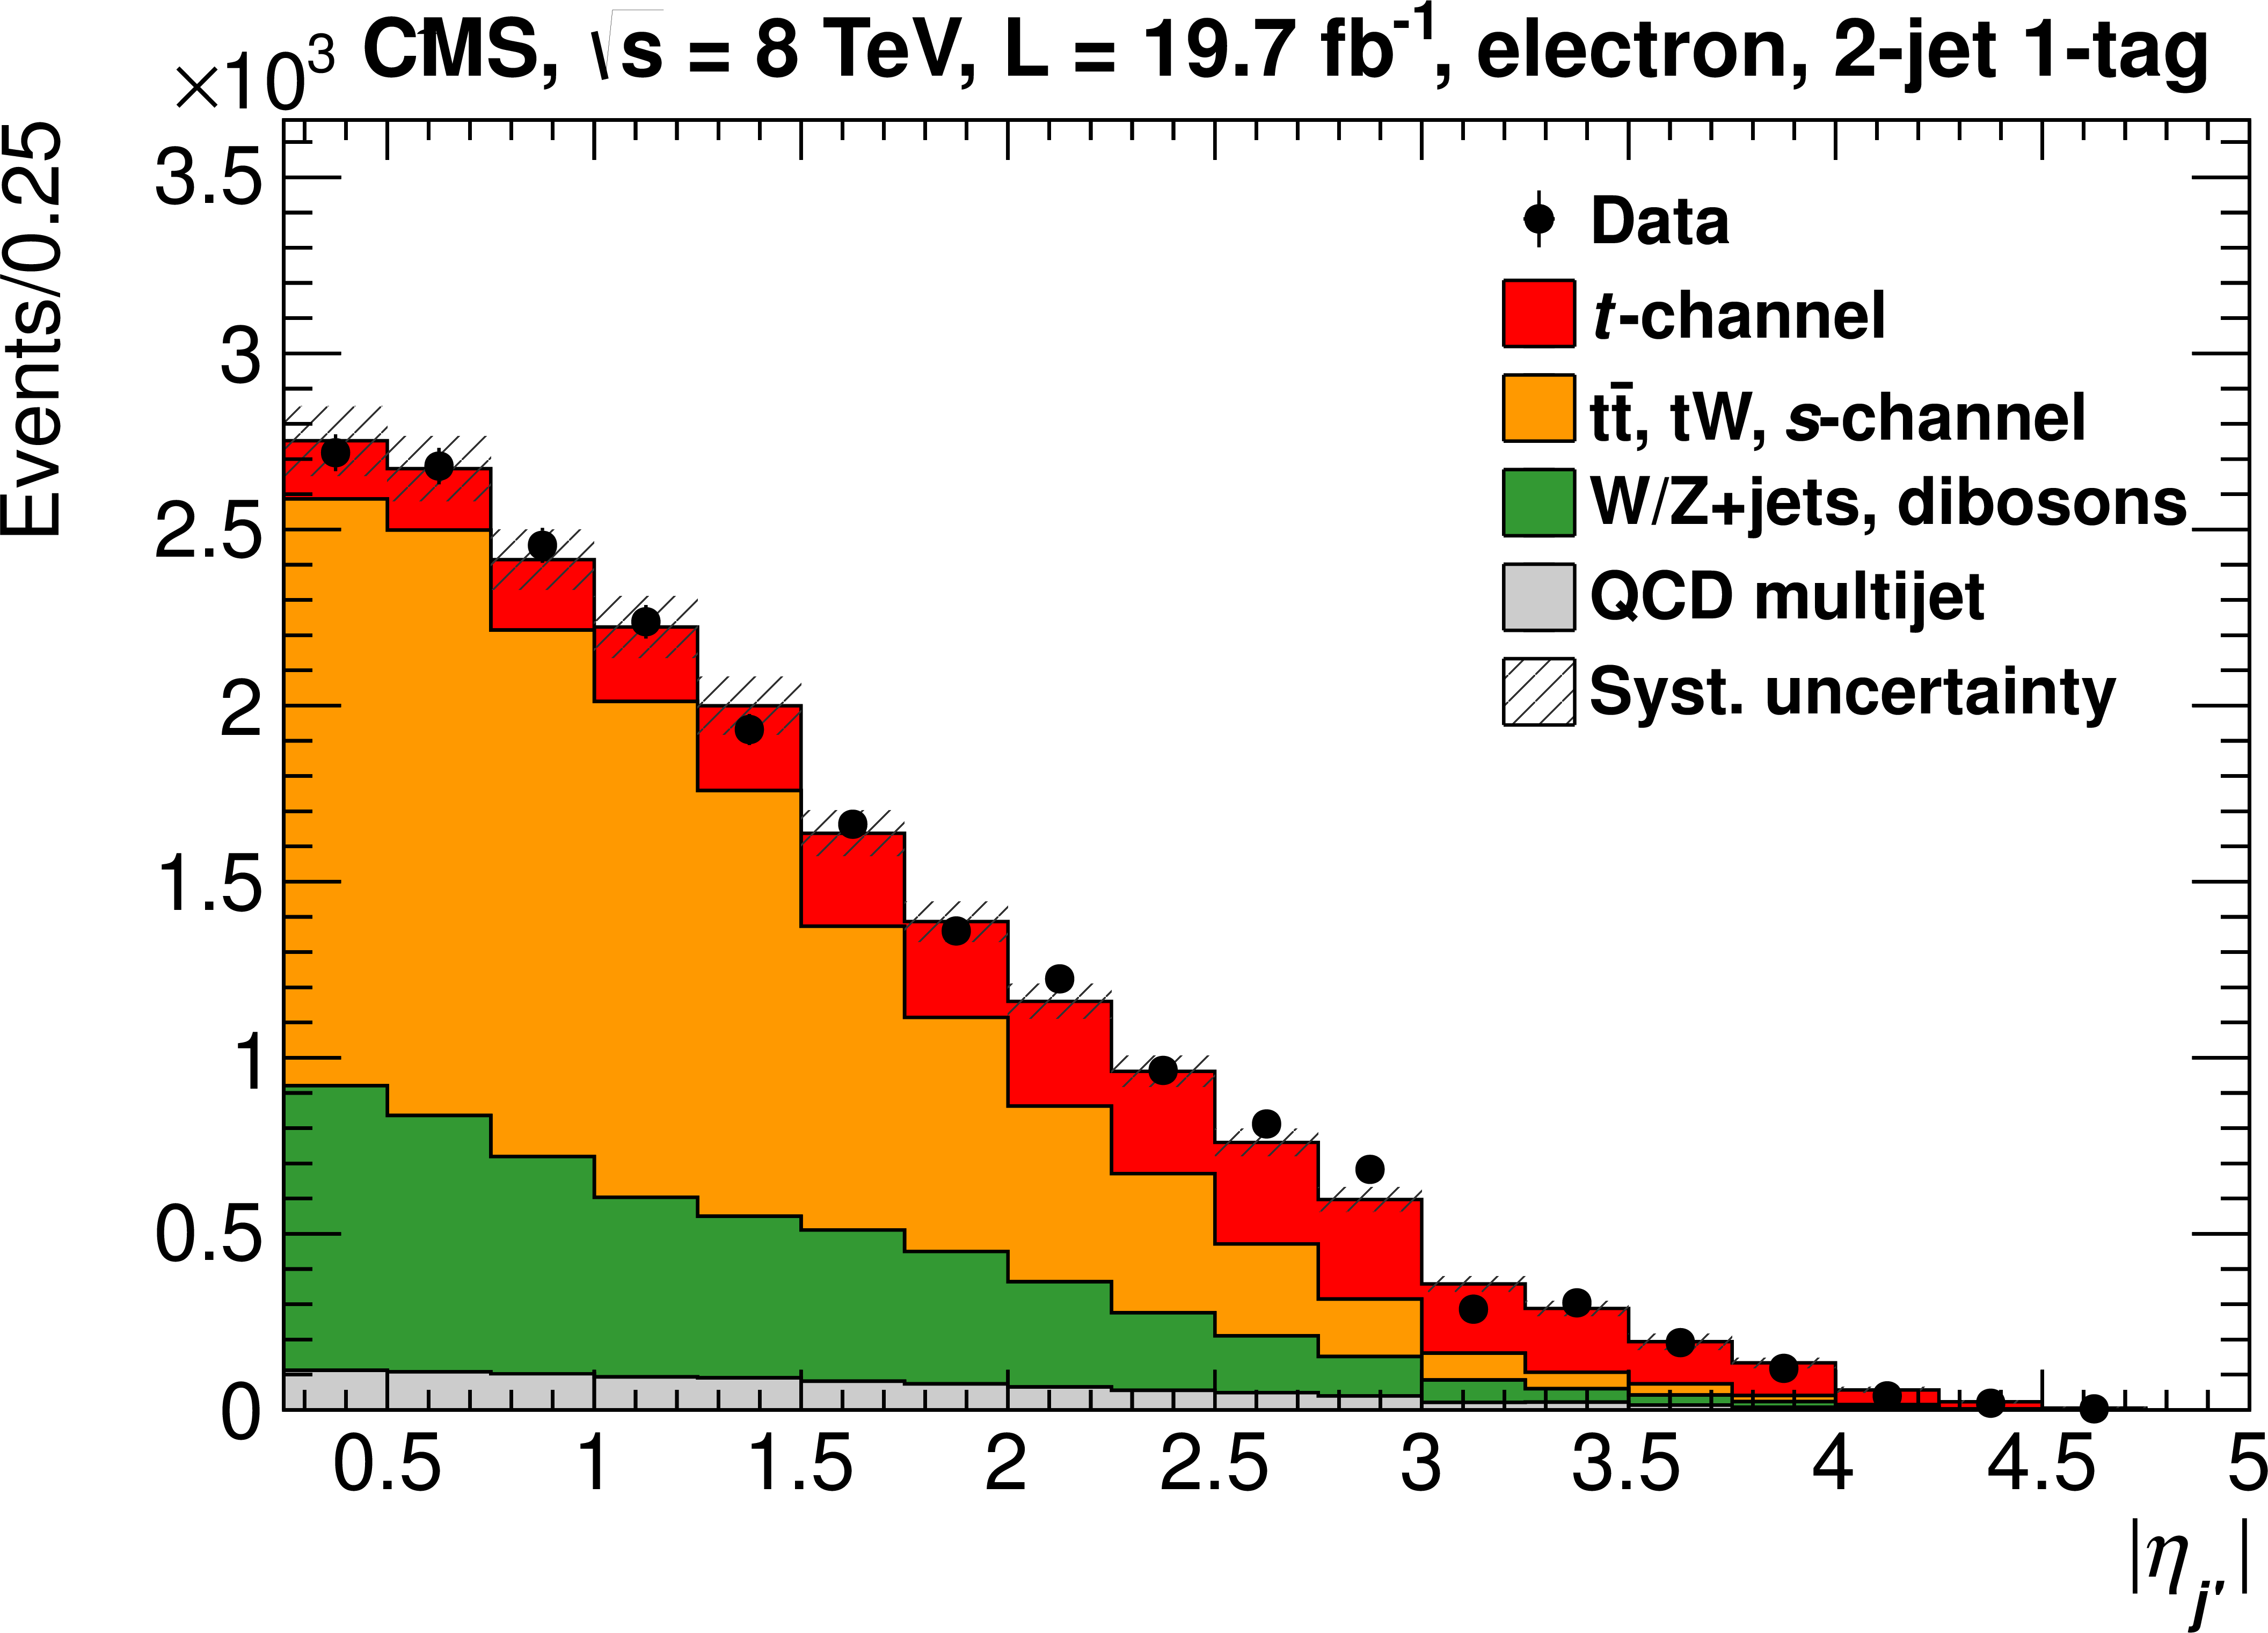
Figure 8-b:
Fitted $ { {| \eta _{j'} | }} $ distributions for muon (a) and electron (b) decay channels, normalised to the yields obtained from the combined total cross section fit. Systematic uncertainty bands include the shape uncertainties on the distributions. |

png pdf |
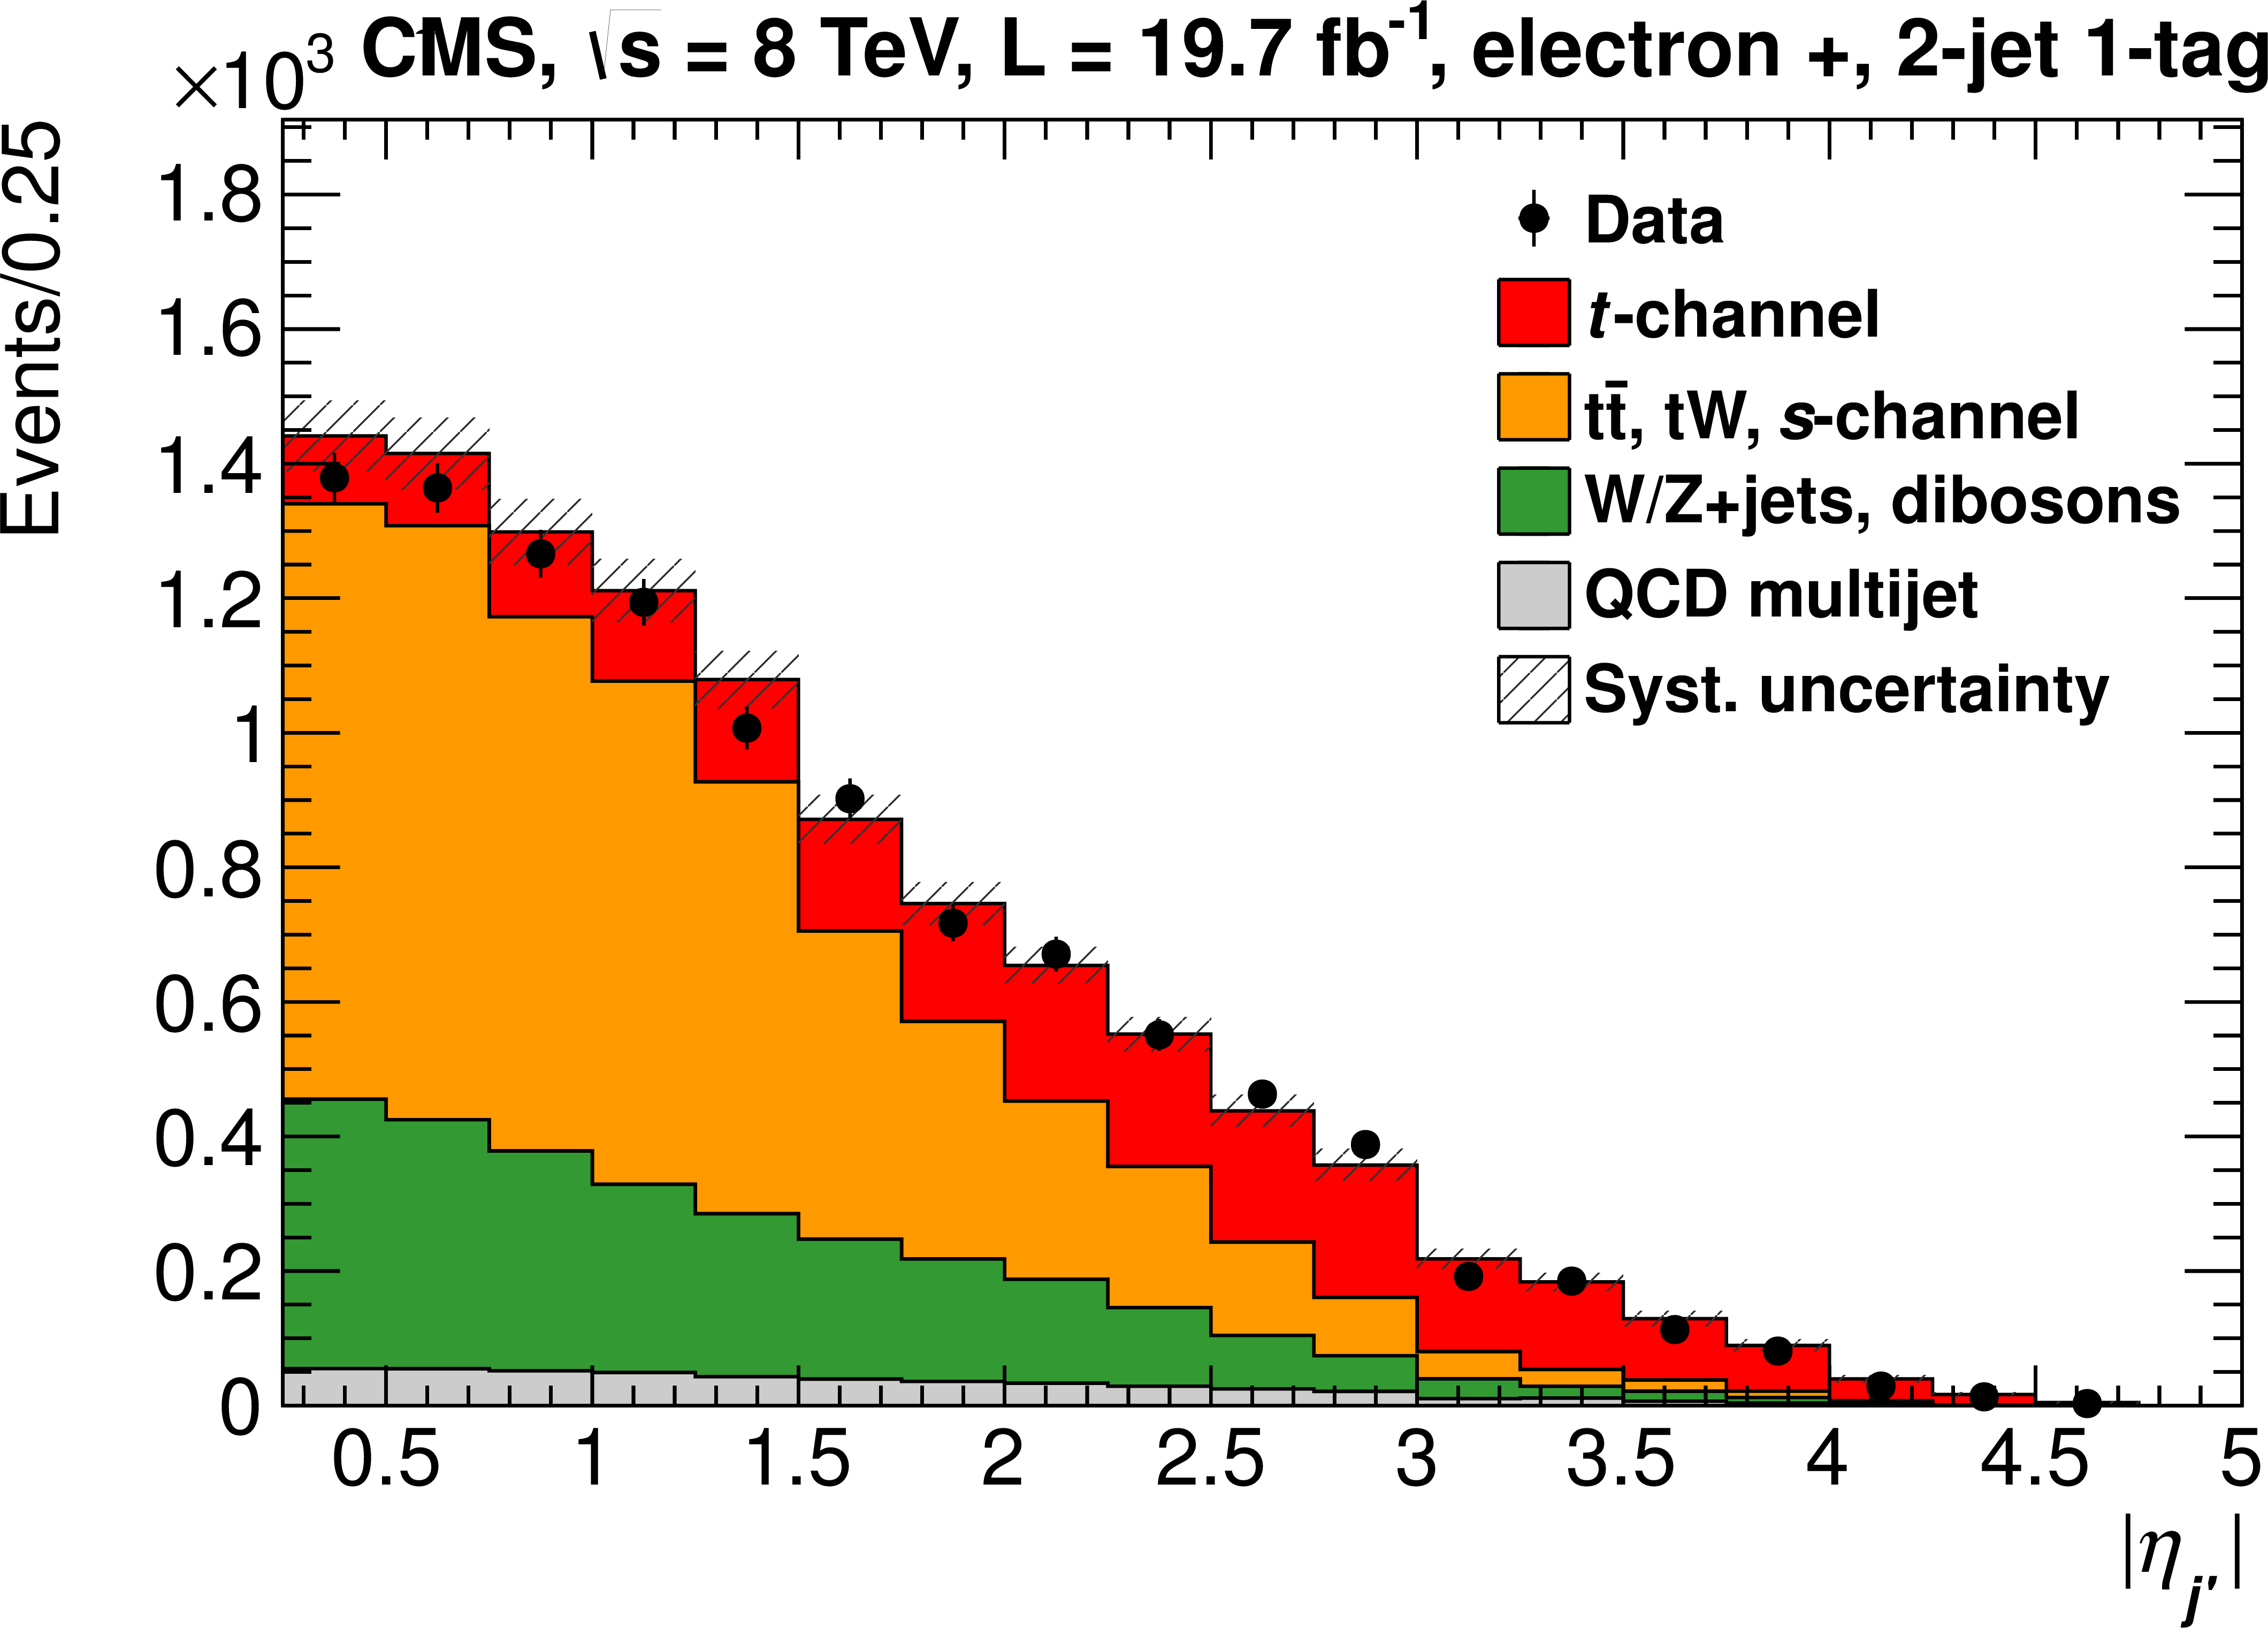
Figure 9-a:
Fitted $ { {| \eta _{j'} | }} $ distributions for muon (a, c) and electron (b, d) decay channels, normalised to the yields obtained from the combined single $ {\mathrm {t}} $ and ${\overline {\mathrm {t}}} $ cross section ratio fit. Systematic uncertainty bands include the shape uncertainties on the distributions. |
png pdf |
Figure 9-b:
Fitted $ { {| \eta _{j'} | }} $ distributions for muon (a, c) and electron (b, d) decay channels, normalised to the yields obtained from the combined single $ {\mathrm {t}} $ and ${\overline {\mathrm {t}}} $ cross section ratio fit. Systematic uncertainty bands include the shape uncertainties on the distributions. |
png pdf |
Figure 9-c:
Fitted $ { {| \eta _{j'} | }} $ distributions for muon (a, c) and electron (b, d) decay channels, normalised to the yields obtained from the combined single $ {\mathrm {t}} $ and ${\overline {\mathrm {t}}} $ cross section ratio fit. Systematic uncertainty bands include the shape uncertainties on the distributions. |
png pdf |
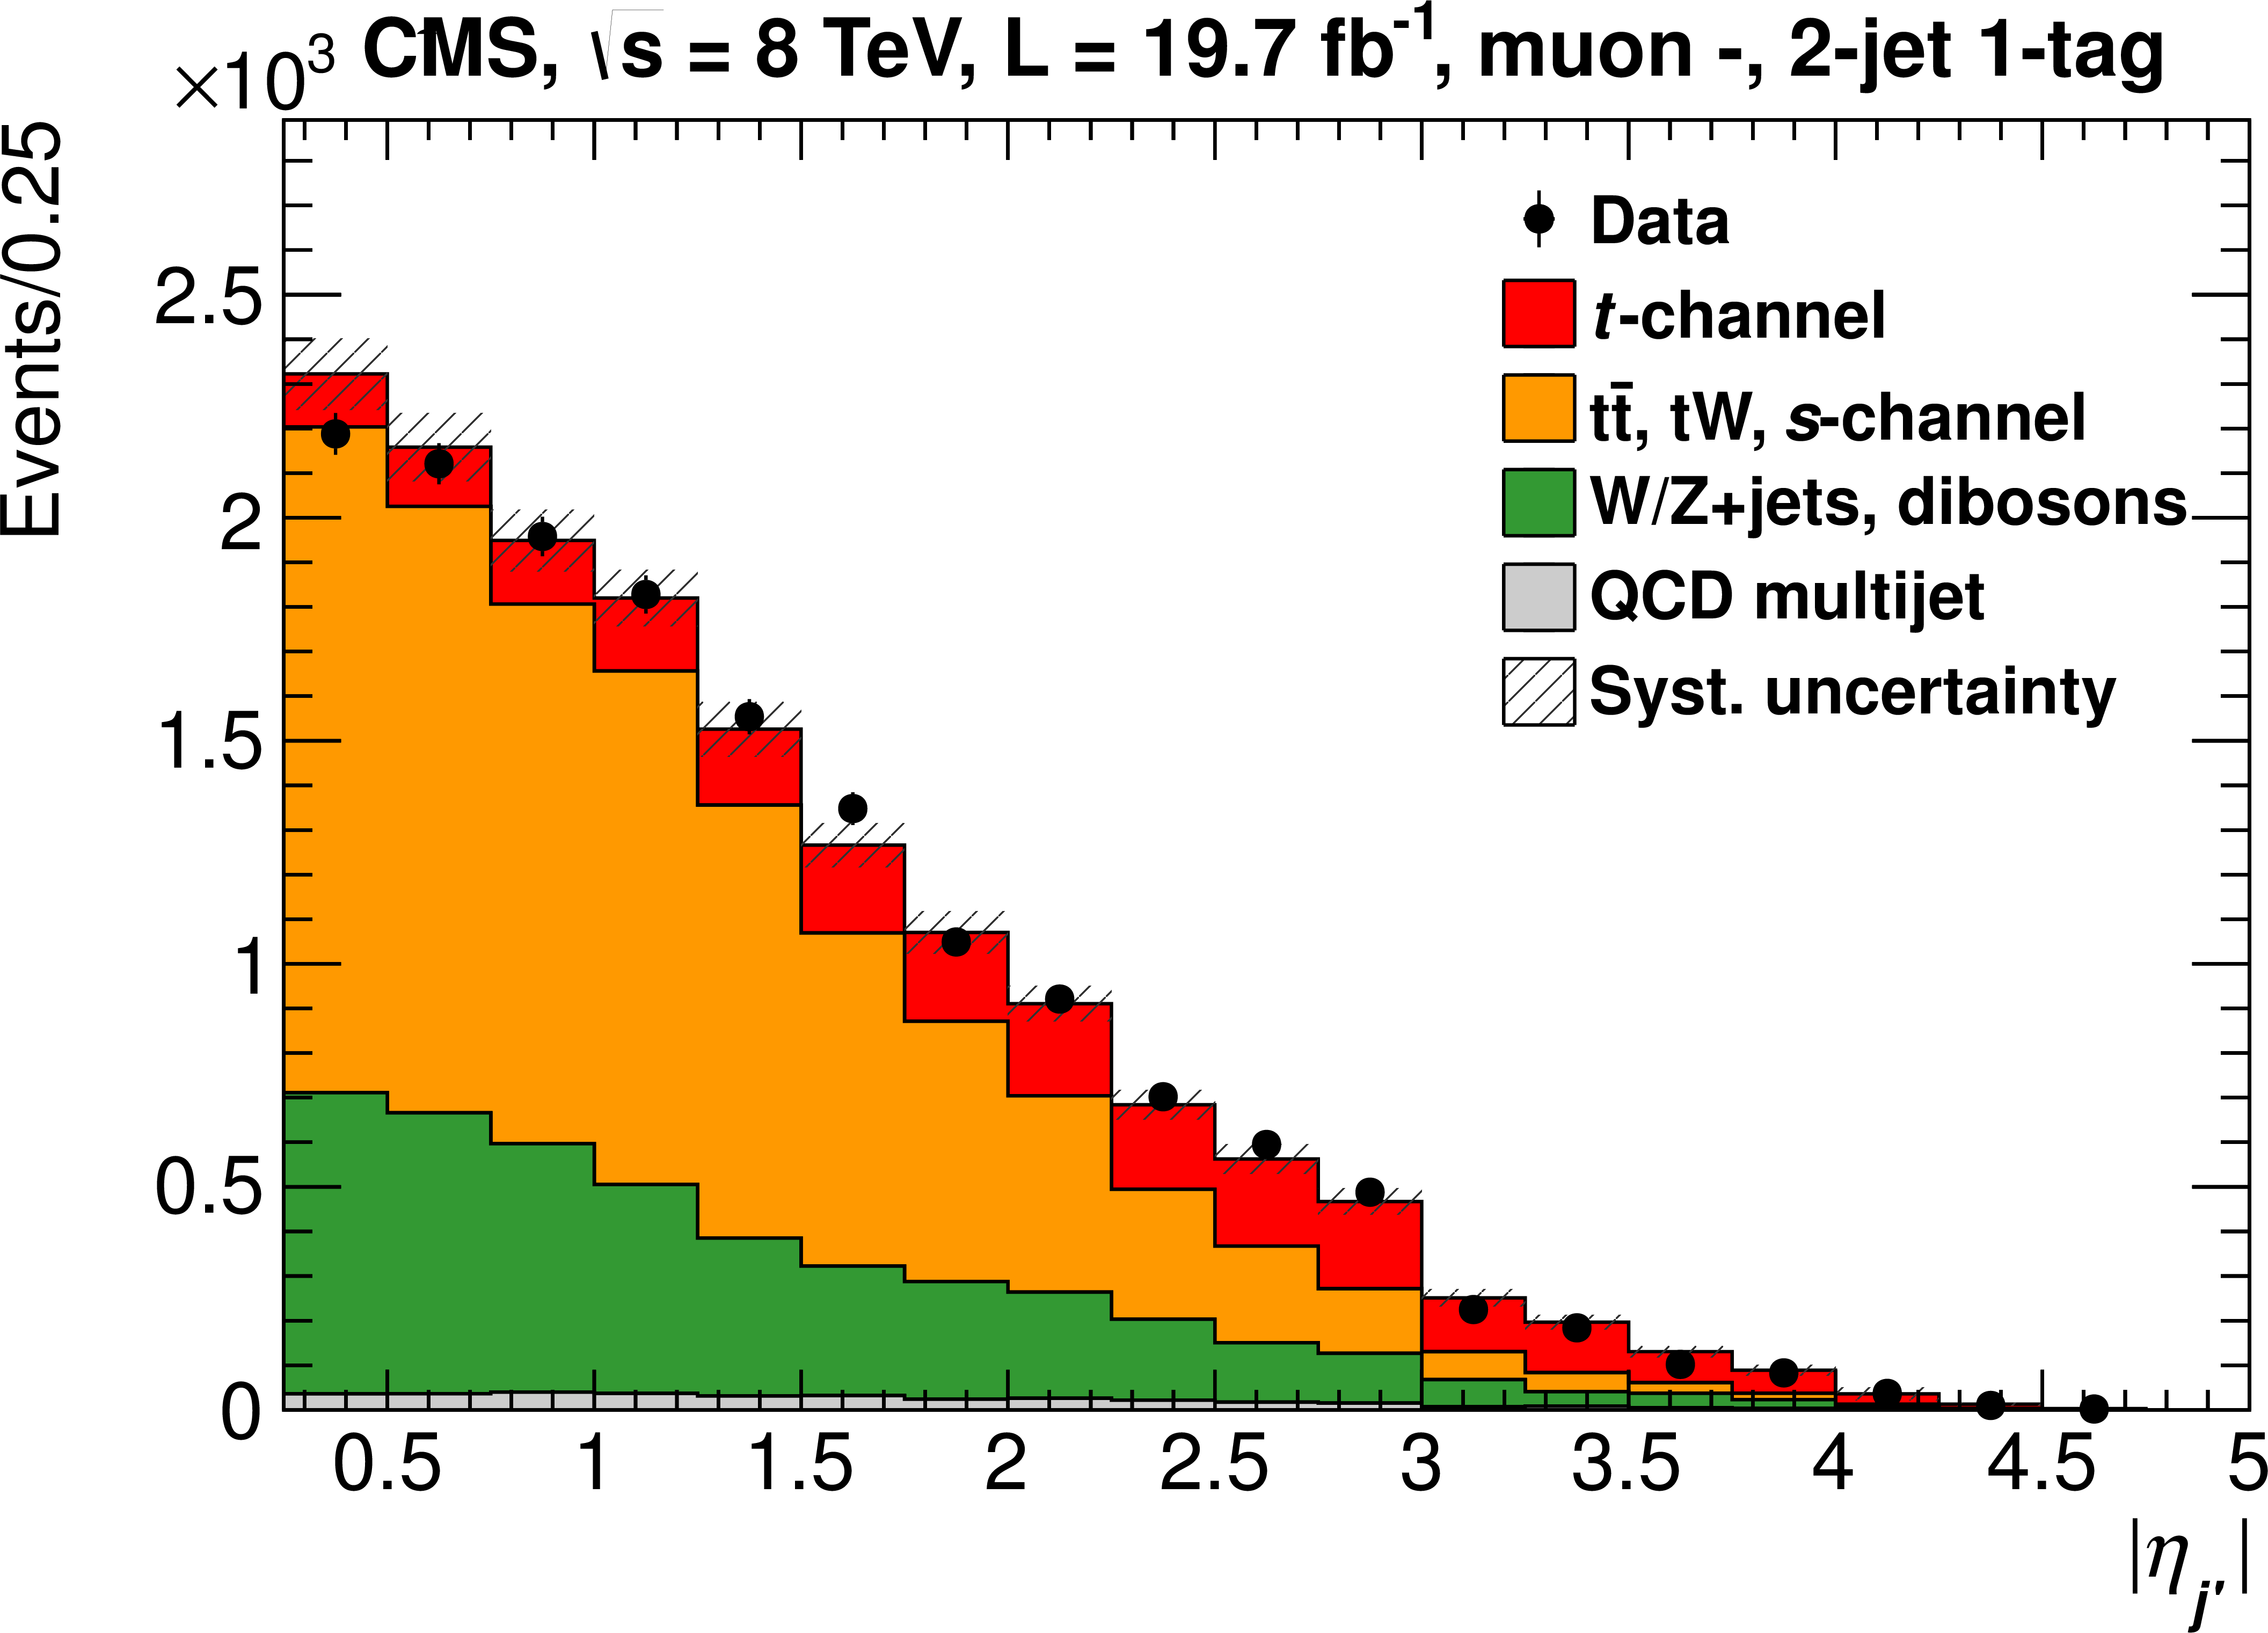
Figure 9-d:
Fitted $ { {| \eta _{j'} | }} $ distributions for muon (a, c) and electron (b, d) decay channels, normalised to the yields obtained from the combined single $ {\mathrm {t}} $ and ${\overline {\mathrm {t}}} $ cross section ratio fit. Systematic uncertainty bands include the shape uncertainties on the distributions. |
png pdf |
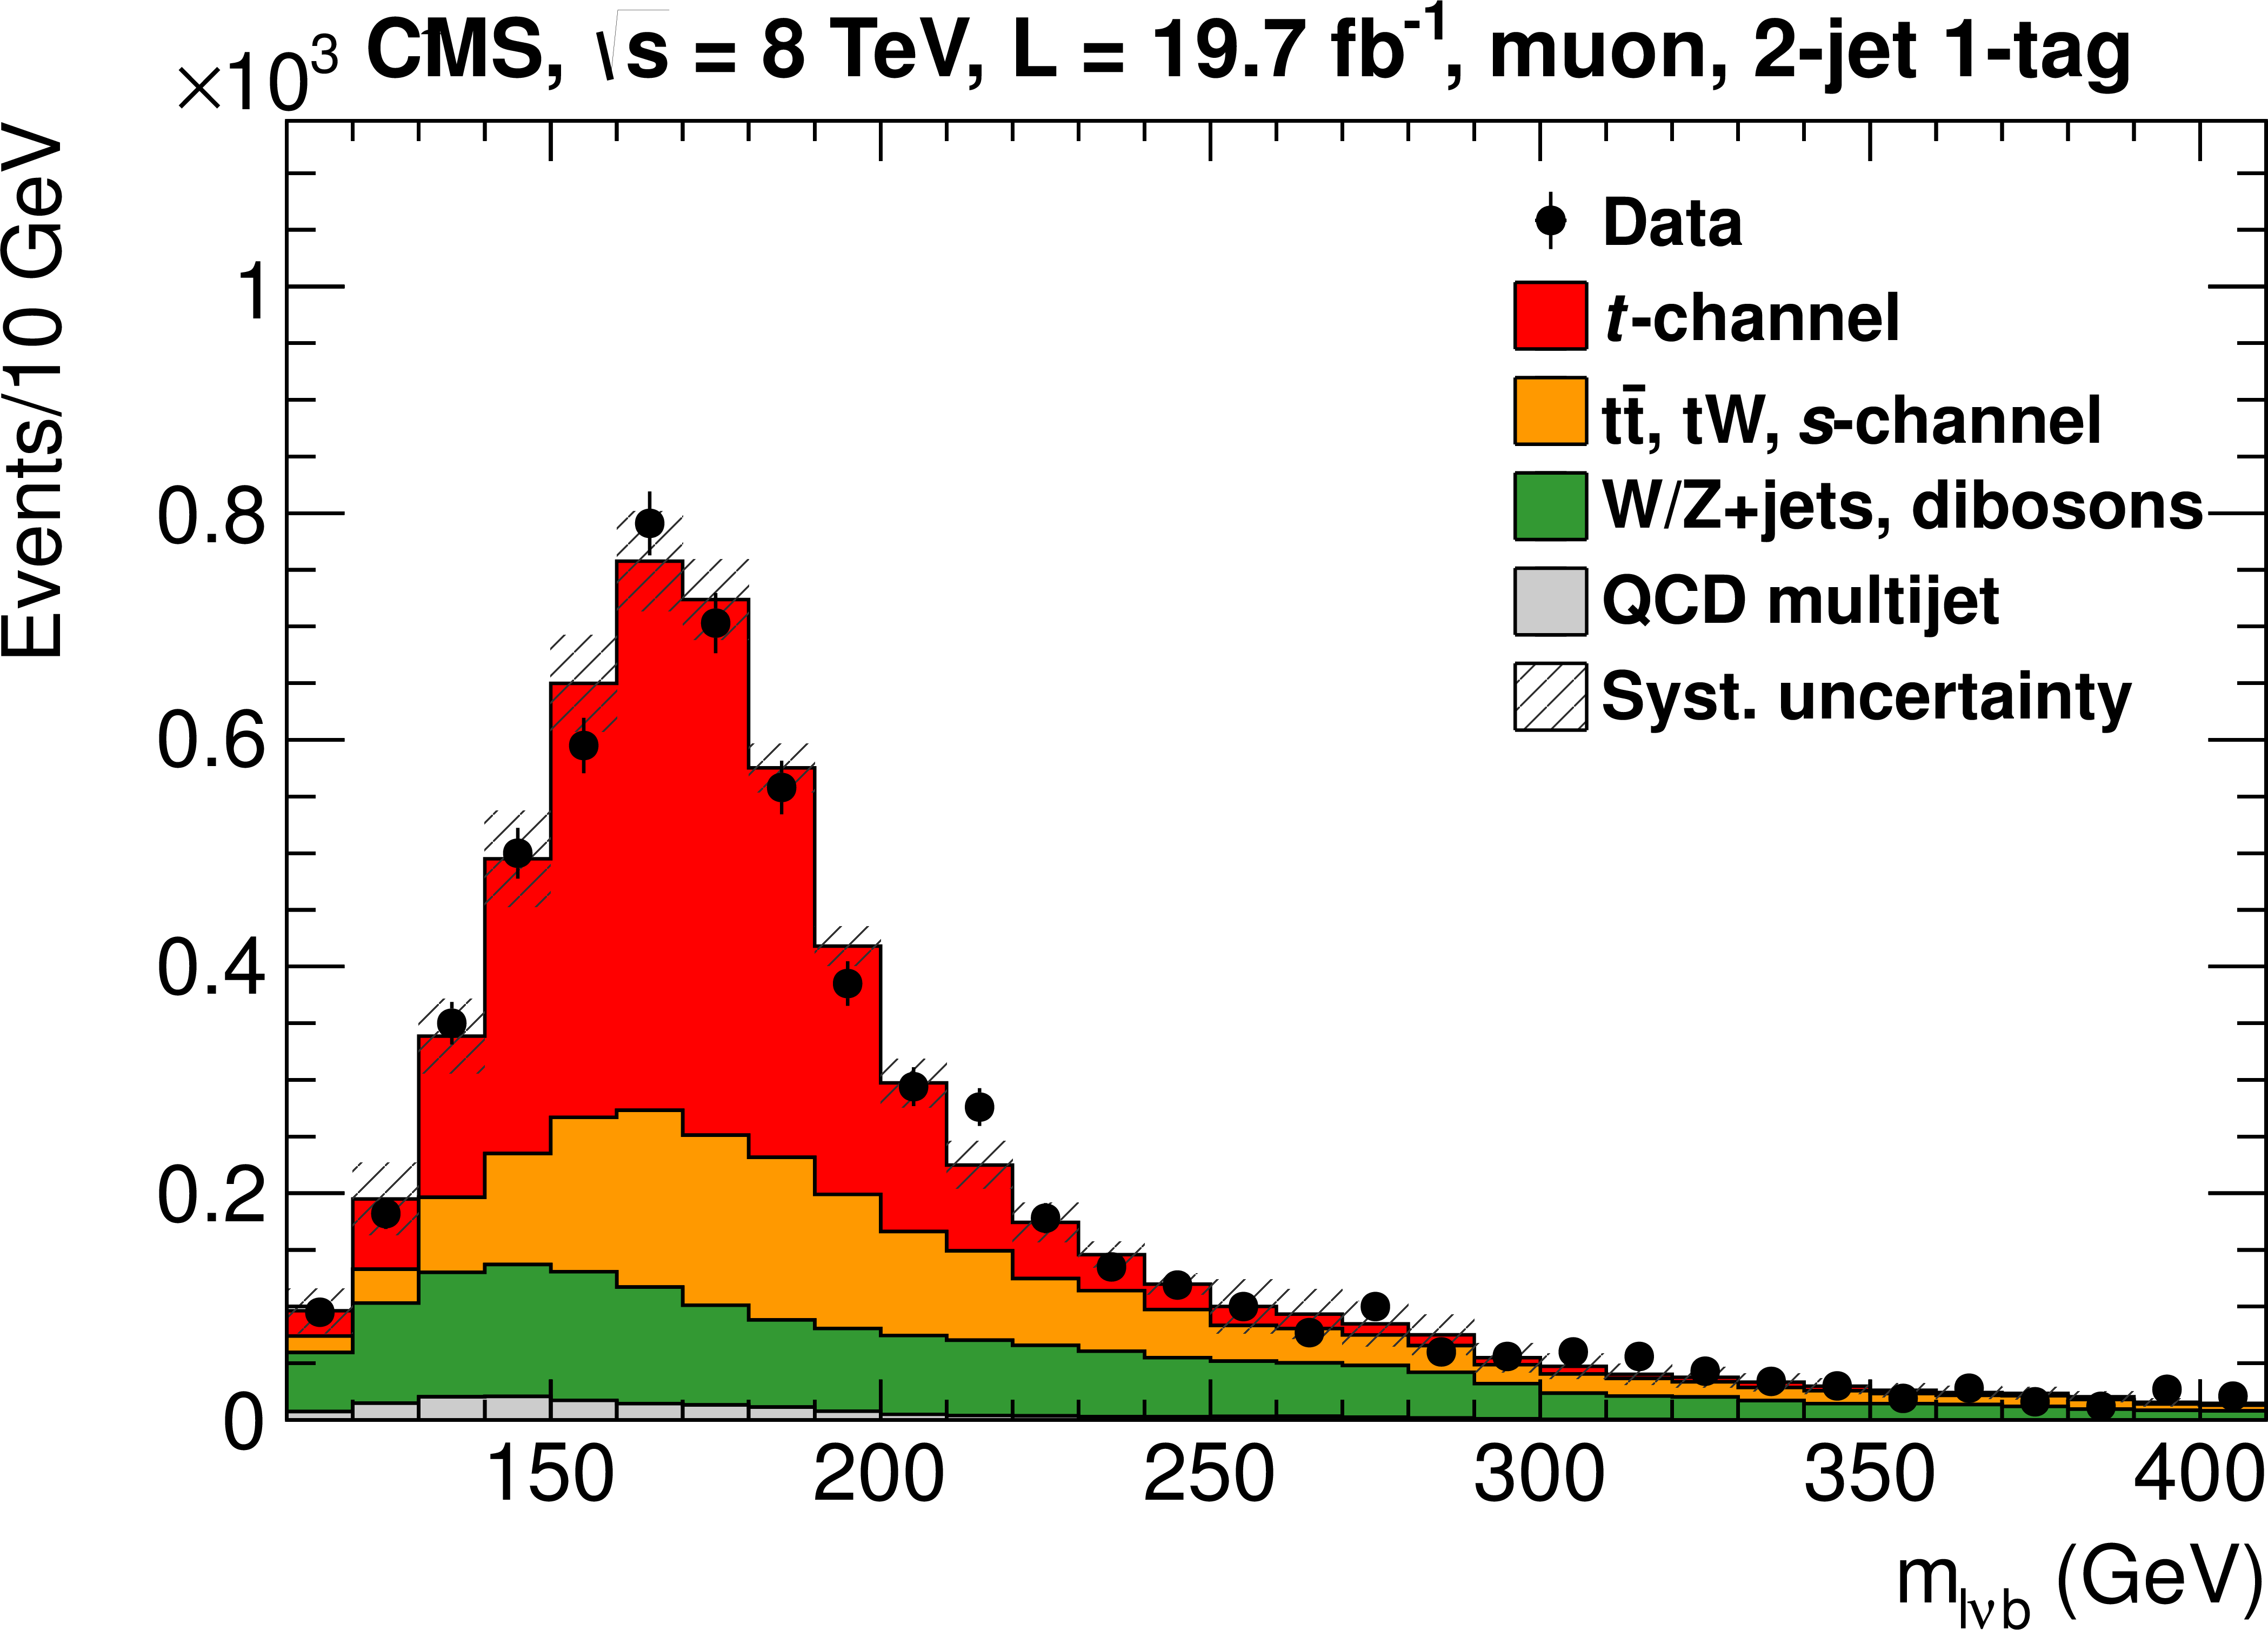
Figure 10-a:
Distribution of reconstructed top-quark mass $ {m_{\ell \nu {\mathrm {b}}}} $ for muon (a) and electron (b) decay channels, in the region with $ { {| \eta _{j'} | }} >$ 2.5, the contribution of each process is scaled to the cross section derived from the fit. Systematic uncertainty bands include the shape uncertainties on the distributions and uncertainties on the normalisation in the $ { {| \eta _{j'} | }} > $ 2.5 region. |
png pdf |
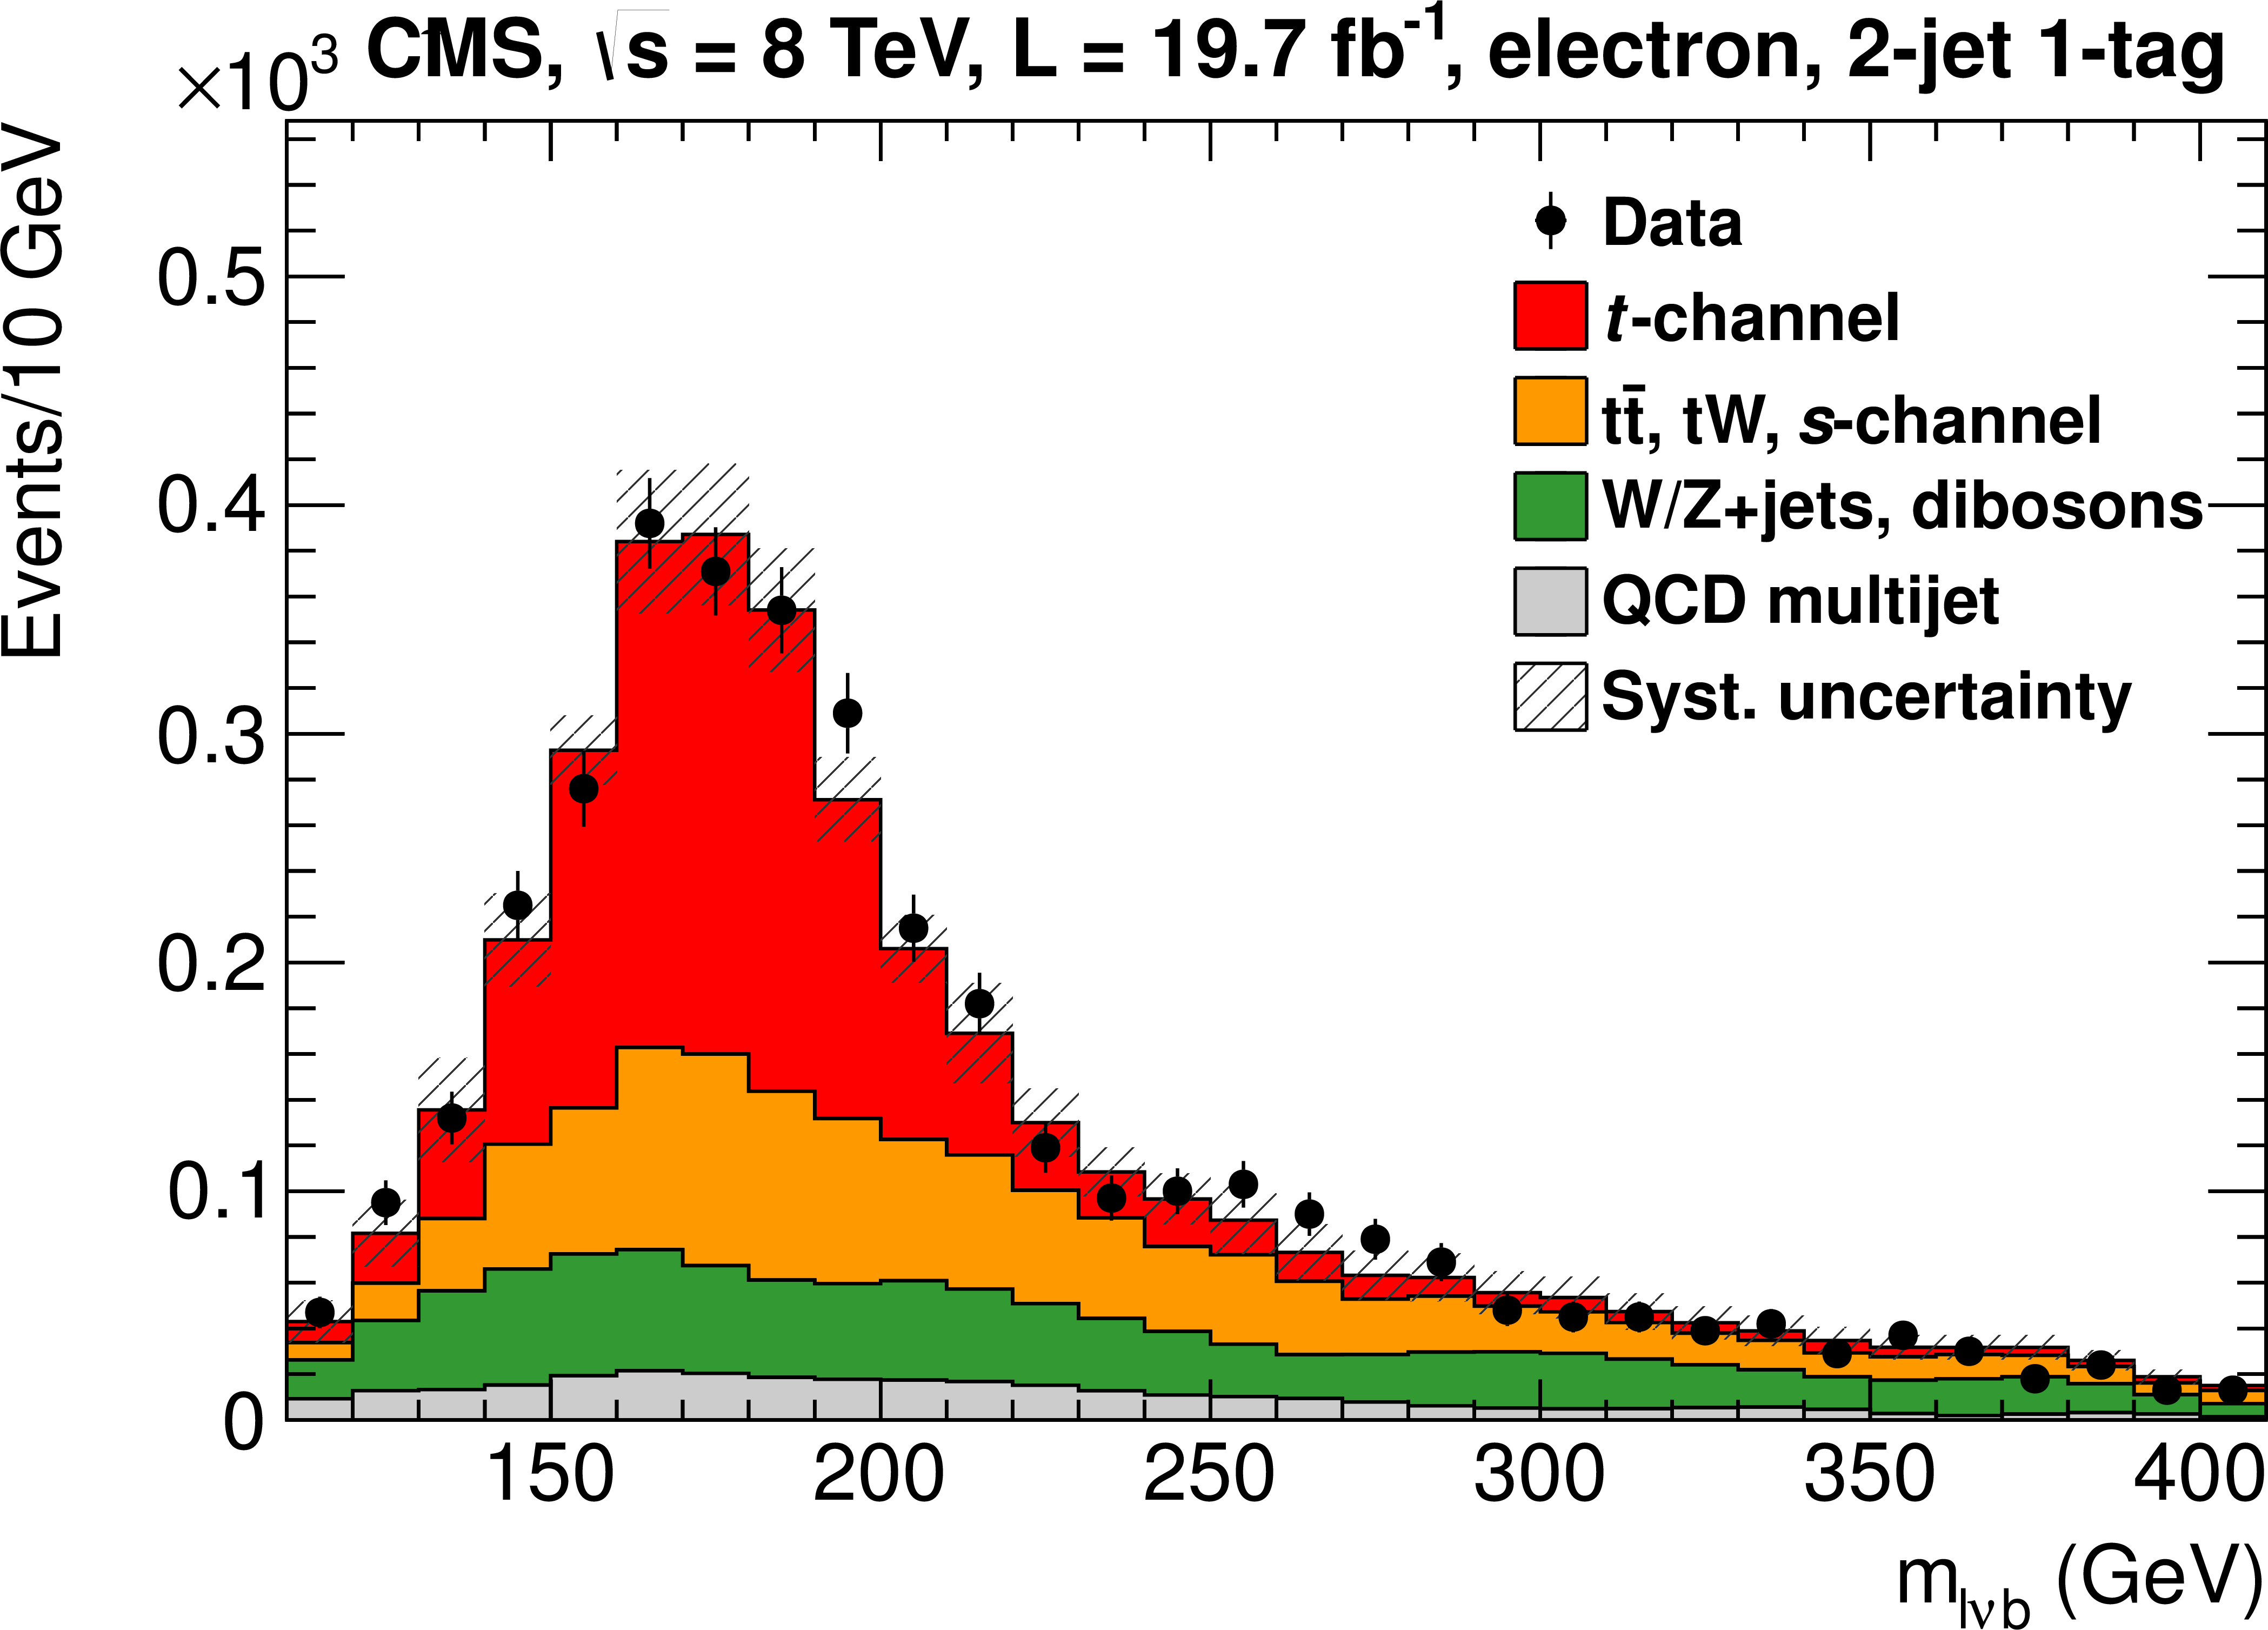
Figure 10-b:
Distribution of reconstructed top-quark mass $ {m_{\ell \nu {\mathrm {b}}}} $ for muon (a) and electron (b) decay channels, in the region with $ { {| \eta _{j'} | }} >$ 2.5, the contribution of each process is scaled to the cross section derived from the fit. Systematic uncertainty bands include the shape uncertainties on the distributions and uncertainties on the normalisation in the $ { {| \eta _{j'} | }} > $ 2.5 region. |
png pdf |
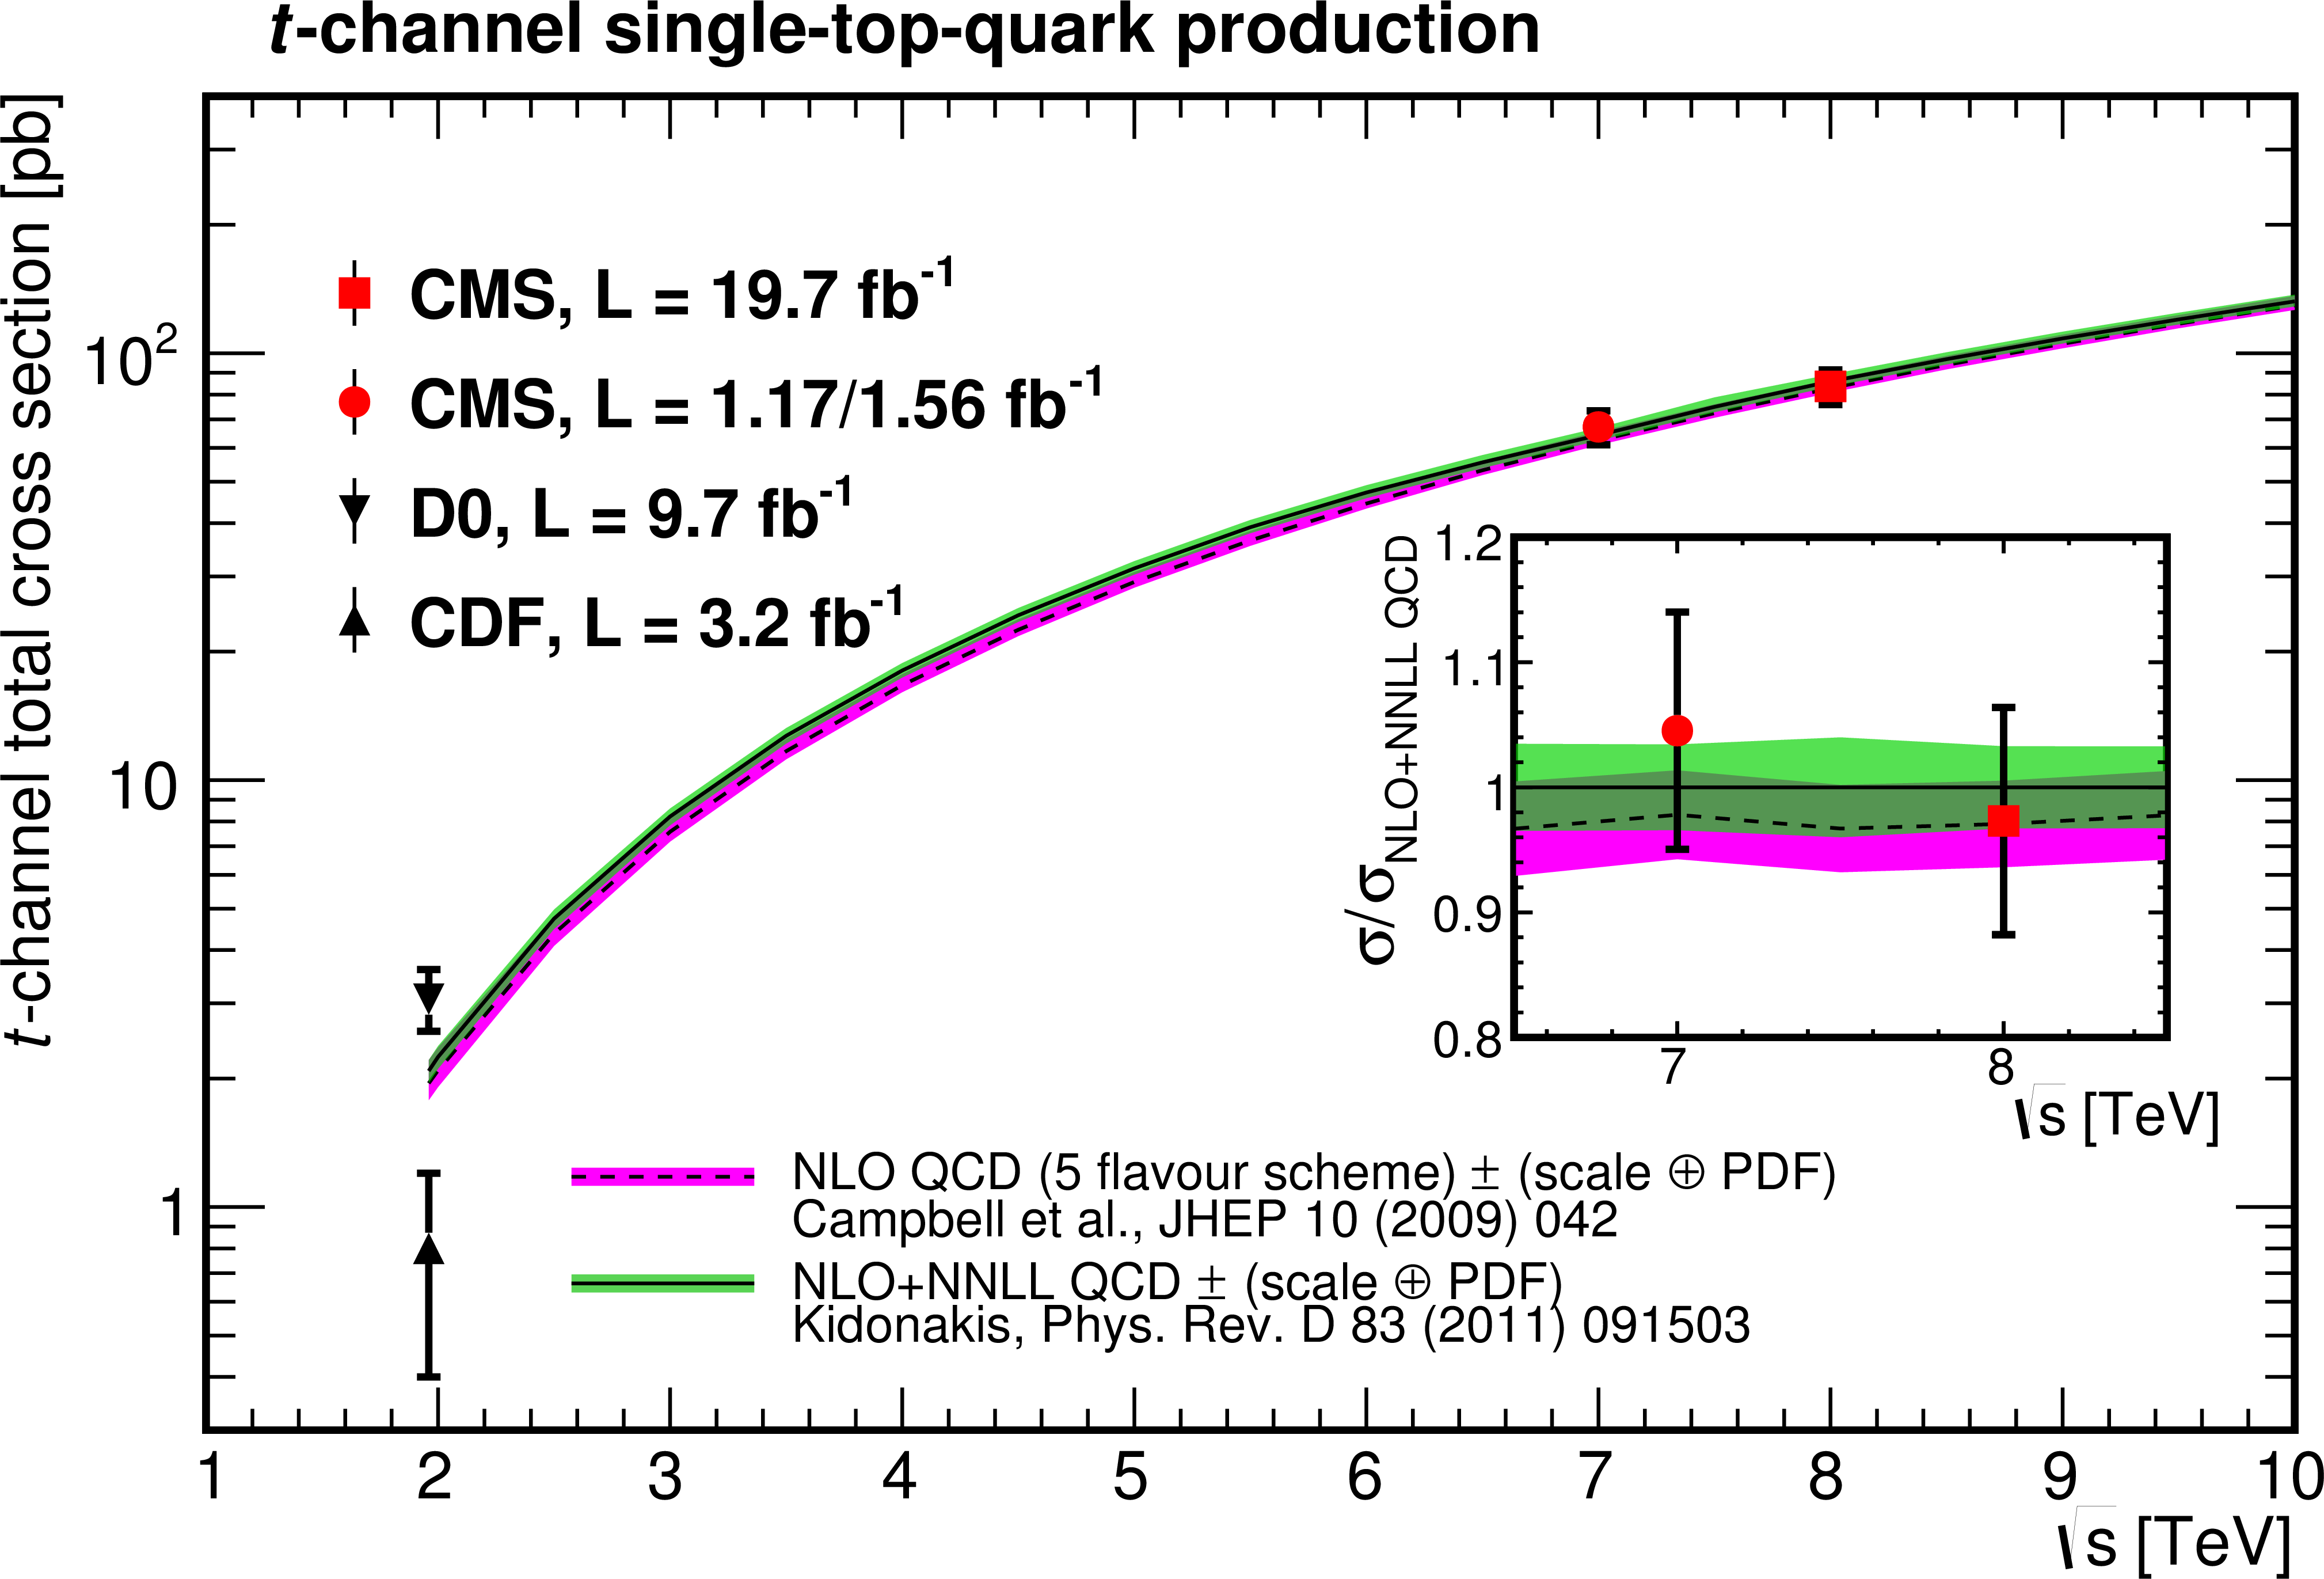
Figure 11:
Single-top-quark production cross section in the $t$-channel versus collider centre-of-mass energy. |

png pdf |
Figure 12:
Comparison of the measured $R_{ {t\text {-ch.}}}$ with the predictions obtained using different PDF sets. |
|
|
Compact Muon Solenoid LHC, CERN |
|

|

|

|

|

|