

Compact Muon Solenoid
LHC, CERN
| CMS-TOP-13-001 ; CERN-PH-EP-2015-282 | ||
| Measurement of top quark polarisation in $t$-channel single top quark production | ||
| CMS Collaboration | ||
| 6 November 2015 | ||
| J. High Energy Phys. 04 (2016) 073 | ||
| Abstract: A first measurement of the top quark spin asymmetry, sensitive to the top quark polarisation, in $t$-channel single top quark production is presented. It is based on a sample of pp collisions at a centre-of-mass energy of 8 TeV corresponding to an integrated luminosity of 19.7 fb$^{-1}$. A high-purity sample of $t$-channel single top quark events with an isolated muon is selected. Signal and background components are estimated using a fit to data. A differential cross section measurement, corrected for detector effects, of an angular observable sensitive to the top quark polarisation is performed. The differential distribution is used to extract a top quark spin asymmetry of 0.26 $\pm$ 0.03 (stat) $\pm$ 0.10 (syst), which is compatible with a $p$-value of 4.6% with the standard model prediction of 0.44. | ||
| Links: e-print arXiv:1511.02138 [hep-ex] (PDF) ; CDS record ; inSPIRE record ; HepData record ; CADI line (restricted) ; | ||
| Figures | |
png pdf |
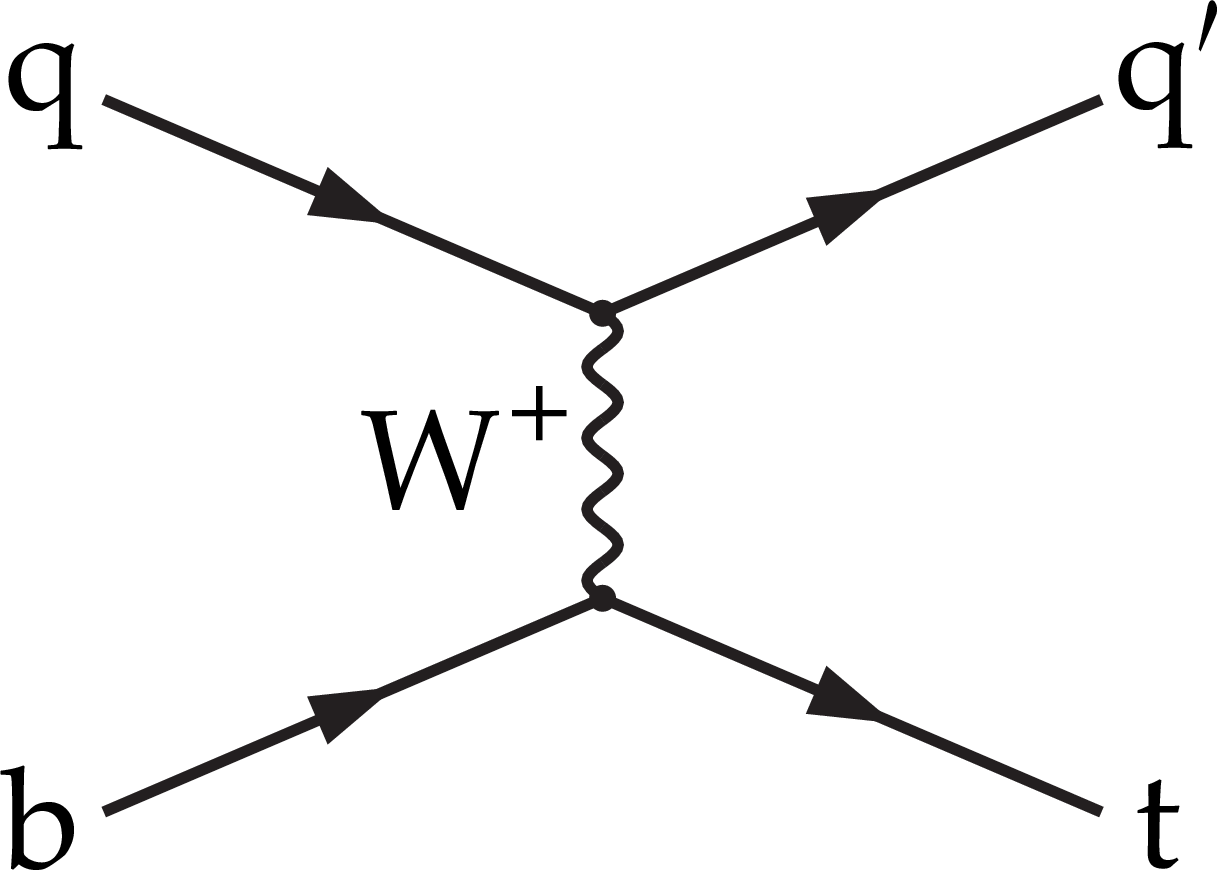
Figure 1-a:
Feynman diagram for single top quark production in the $t$-channel: (2)$\rightarrow $(2) process. Similar diagram is expected for top antiquark production. |
png pdf |
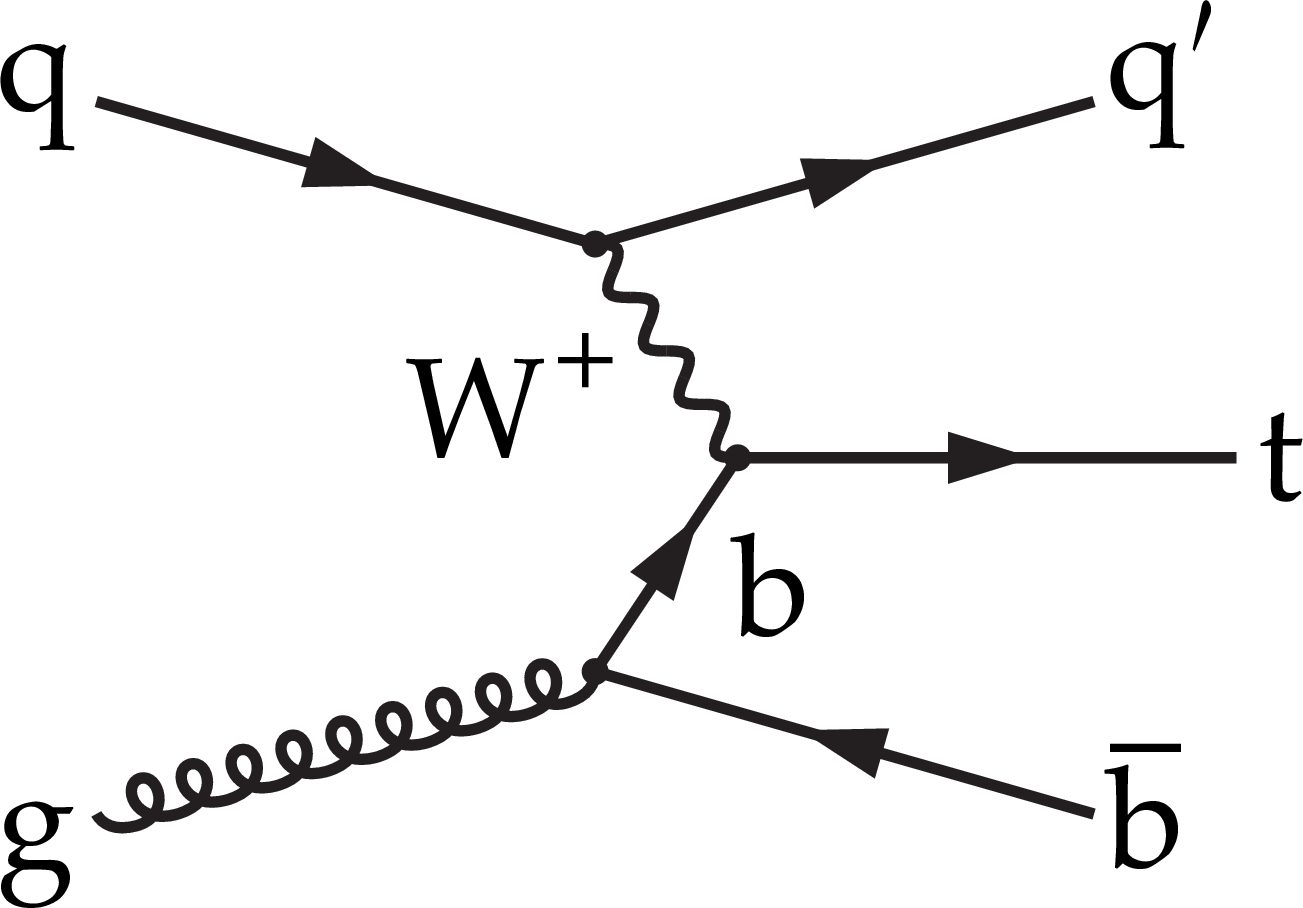
Figure 1-b:
Feynman diagrams for single top quark production in the $t$-channel: (2)$\rightarrow $(3) processe. Similar diagram is expected for top antiquark production. |

png pdf |
Figure 2-a:
Distributions of the ${\text {BDT}_{\mathrm {multijet}}}$ discriminant in the (a) ``2jets 1tag'' and (b) ``3jets 2tags'' categories. The predictions are normalised to the results of the fit described in Section 7. The bottom panels in both plots show the ratio between observed and predicted event counts, with a shaded area to indicate the systematic uncertainties affecting the background prediction and vertical bars indicating statistical uncertainties. |

png pdf |
Figure 2-b:
Distributions of the ${\text {BDT}_{\mathrm {multijet}}}$ discriminant in the (a) ``2jets 1tag'' and (b) ``3jets 2tags'' categories. The predictions are normalised to the results of the fit described in Section 7. The bottom panels in both plots show the ratio between observed and predicted event counts, with a shaded area to indicate the systematic uncertainties affecting the background prediction and vertical bars indicating statistical uncertainties. |

png pdf |
Figure 3-a:
Distributions of the ${\text {BDT}_{\mathrm{ W } / {\mathrm{ t \bar{t} } } }}$ discriminant in the (a) ``2jets 1tag'' and (b) ``3jets 2tags'' categories. The predictions are normalised to the results of the fit described in Section 7. The bottom panels in both plots show the ratio between observed and predicted event counts, with a shaded area to indicate the systematic uncertainties affecting the background prediction and vertical bars indicating statistical uncertainties. |
png pdf |
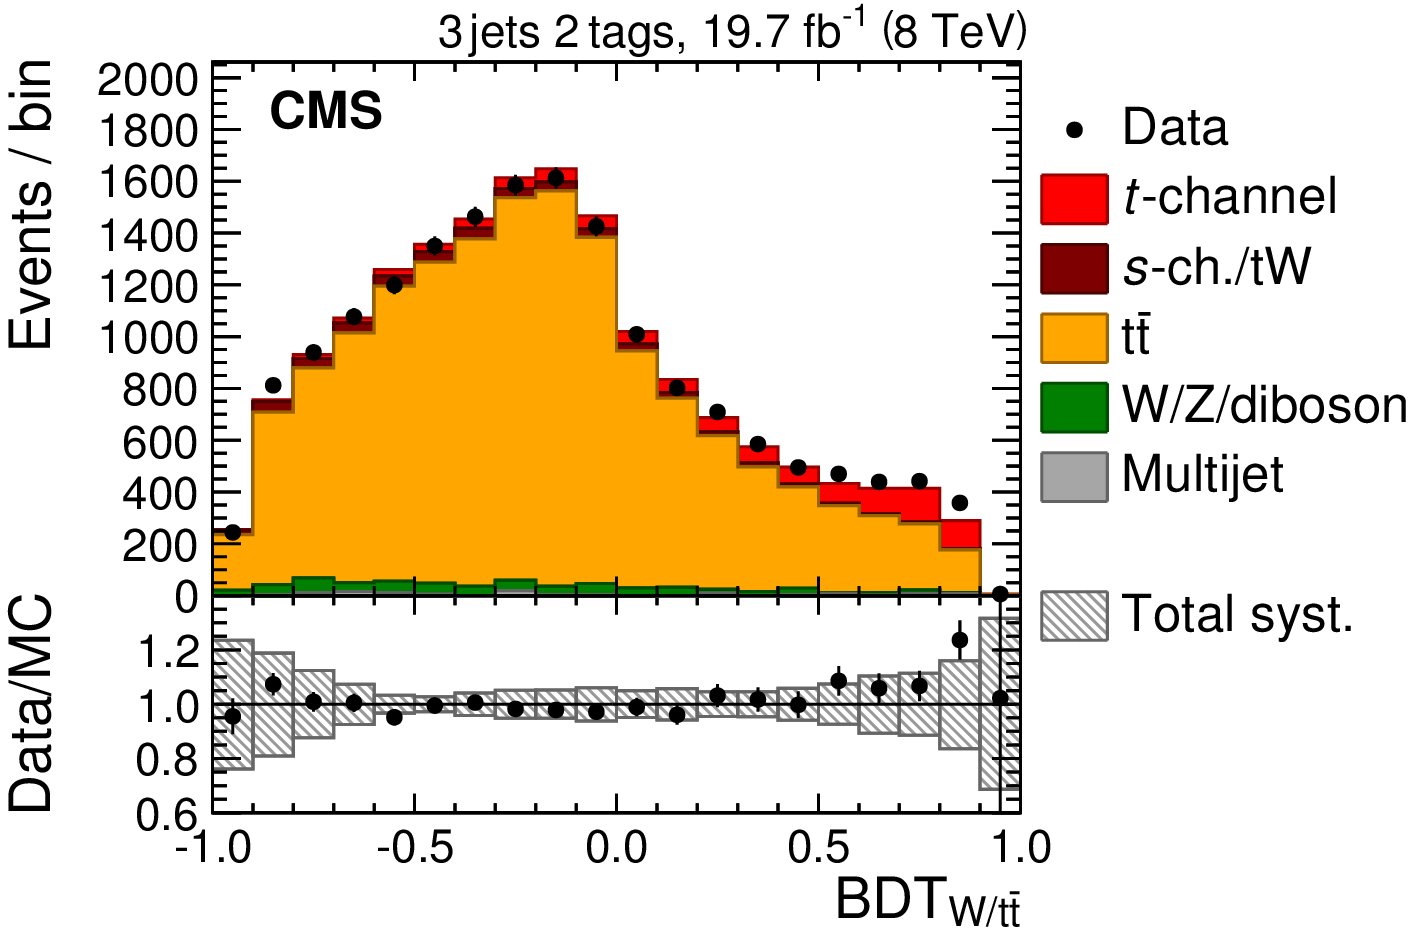
Figure 3-b:
Distributions of the ${\text {BDT}_{\mathrm{ W } / {\mathrm{ t \bar{t} } } }}$ discriminant in the (a) ``2jets 1tag'' and (b) ``3jets 2tags'' categories. The predictions are normalised to the results of the fit described in Section 7. The bottom panels in both plots show the ratio between observed and predicted event counts, with a shaded area to indicate the systematic uncertainties affecting the background prediction and vertical bars indicating statistical uncertainties. |

png pdf |
Figure 4-a:
Distributions of the ${|\eta _{\mathrm{j}^\prime }|}$ (a) and ${m_{\mathrm{ b } \mu \nu }}$ (b) variables in the ``2jets 1tag'' category. In both plots, the rejection of multijet events is performed by requiring $ {\text {BDT}_{\mathrm {multijet}}} > -0.15$. The predictions are normalised to the results of the fit described in Section 7. The bottom panels in both plots show the ratio between observed and predicted event counts, with a shaded area to indicate the systematic uncertainties affecting the background prediction and vertical bars indicating statistical uncertainties. |

png pdf |
Figure 4-b:
Distributions of the ${|\eta _{\mathrm{j}^\prime }|}$ (a) and ${m_{\mathrm{ b } \mu \nu }}$ (b) variables in the ``2jets 1tag'' category. In both plots, the rejection of multijet events is performed by requiring $ {\text {BDT}_{\mathrm {multijet}}} > -0.15$. The predictions are normalised to the results of the fit described in Section 7. The bottom panels in both plots show the ratio between observed and predicted event counts, with a shaded area to indicate the systematic uncertainties affecting the background prediction and vertical bars indicating statistical uncertainties. |
png pdf |
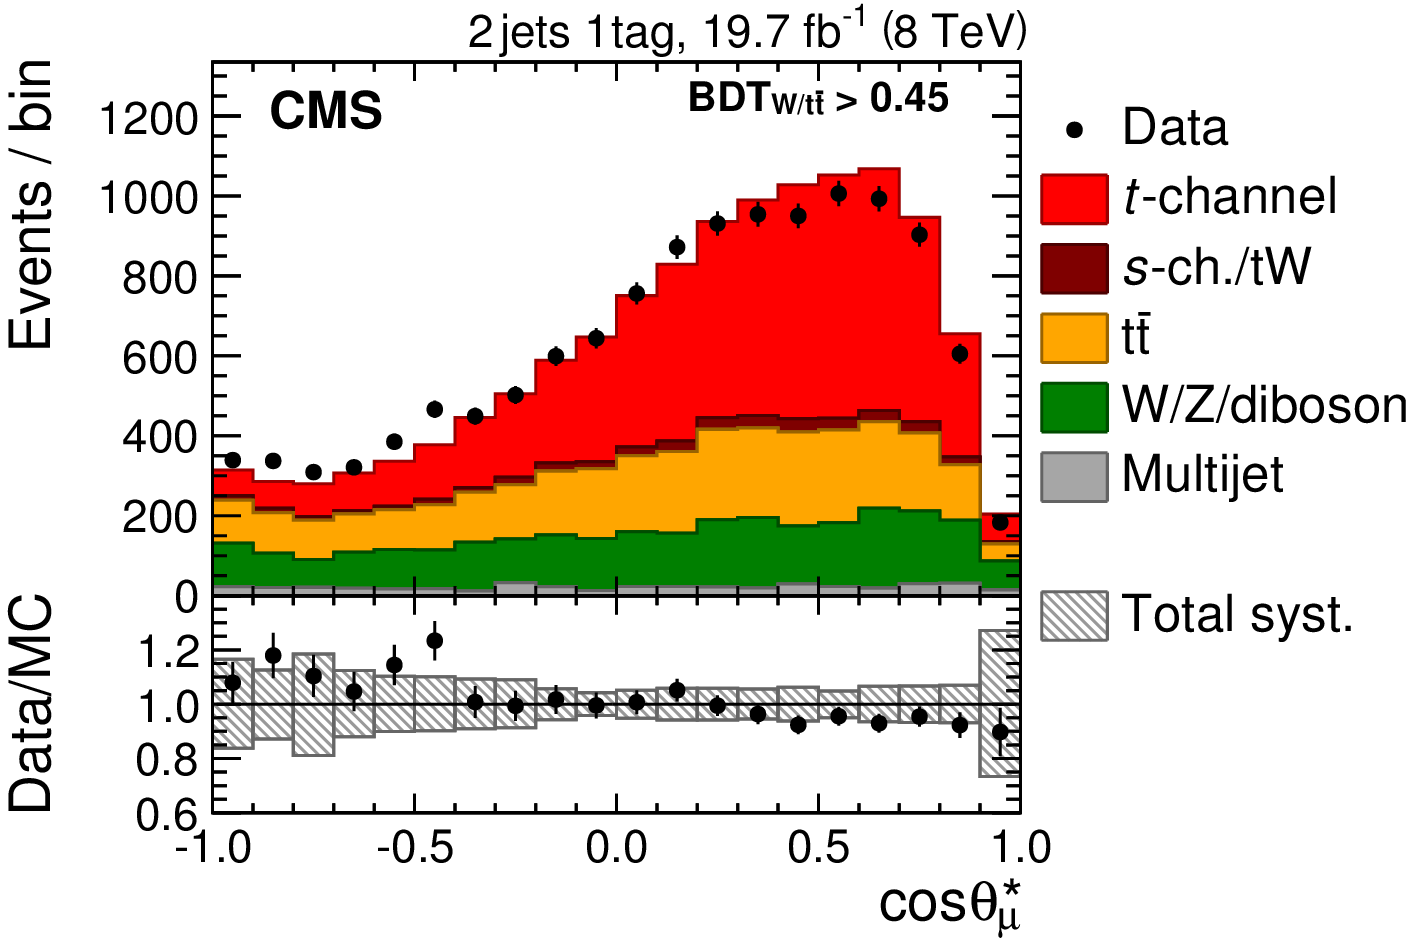
Figure 5-a:
Distributions of ${\cos{\theta ^*_{\mu }}} $ in the (a) signal region defined by $ {\text {BDT}_{\mathrm{ W } / {\mathrm{ t \bar{t} } } }} > $ 0.45 in the ``2jets 1tag'' category and (b) ``3jets 2tags'' control region. In both plots, the rejection of multijet events is performed by requiring $ {\text {BDT}_{\mathrm {multijet}}} > -0.15$. The predictions are normalised to the results of the fit described in Section 7. The bottom panels in both plots show the ratio between observed and predicted event counts, with a shaded area to indicate the systematic uncertainties affecting the background prediction, and vertical bars indicating statistical uncertainties. |
png pdf |
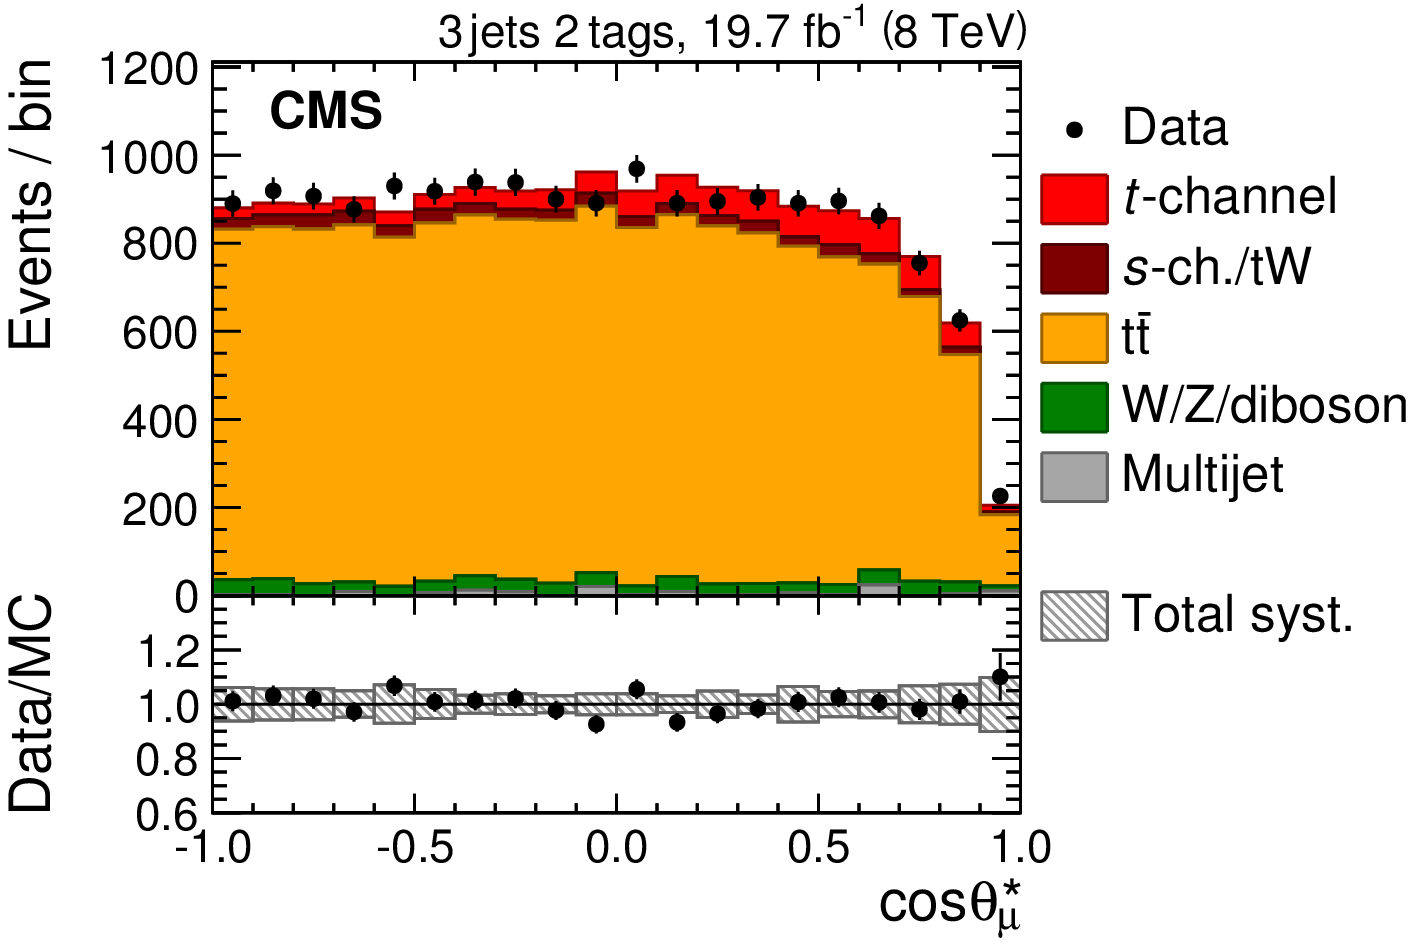
Figure 5-b:
Distributions of ${\cos{\theta ^*_{\mu }}} $ in the (a) signal region defined by $ {\text {BDT}_{\mathrm{ W } / {\mathrm{ t \bar{t} } } }} > $ 0.45 in the ``2jets 1tag'' category and (b) ``3jets 2tags'' control region. In both plots, the rejection of multijet events is performed by requiring $ {\text {BDT}_{\mathrm {multijet}}} > -0.15$. The predictions are normalised to the results of the fit described in Section 7. The bottom panels in both plots show the ratio between observed and predicted event counts, with a shaded area to indicate the systematic uncertainties affecting the background prediction, and vertical bars indicating statistical uncertainties. |

png pdf |
Figure 6:
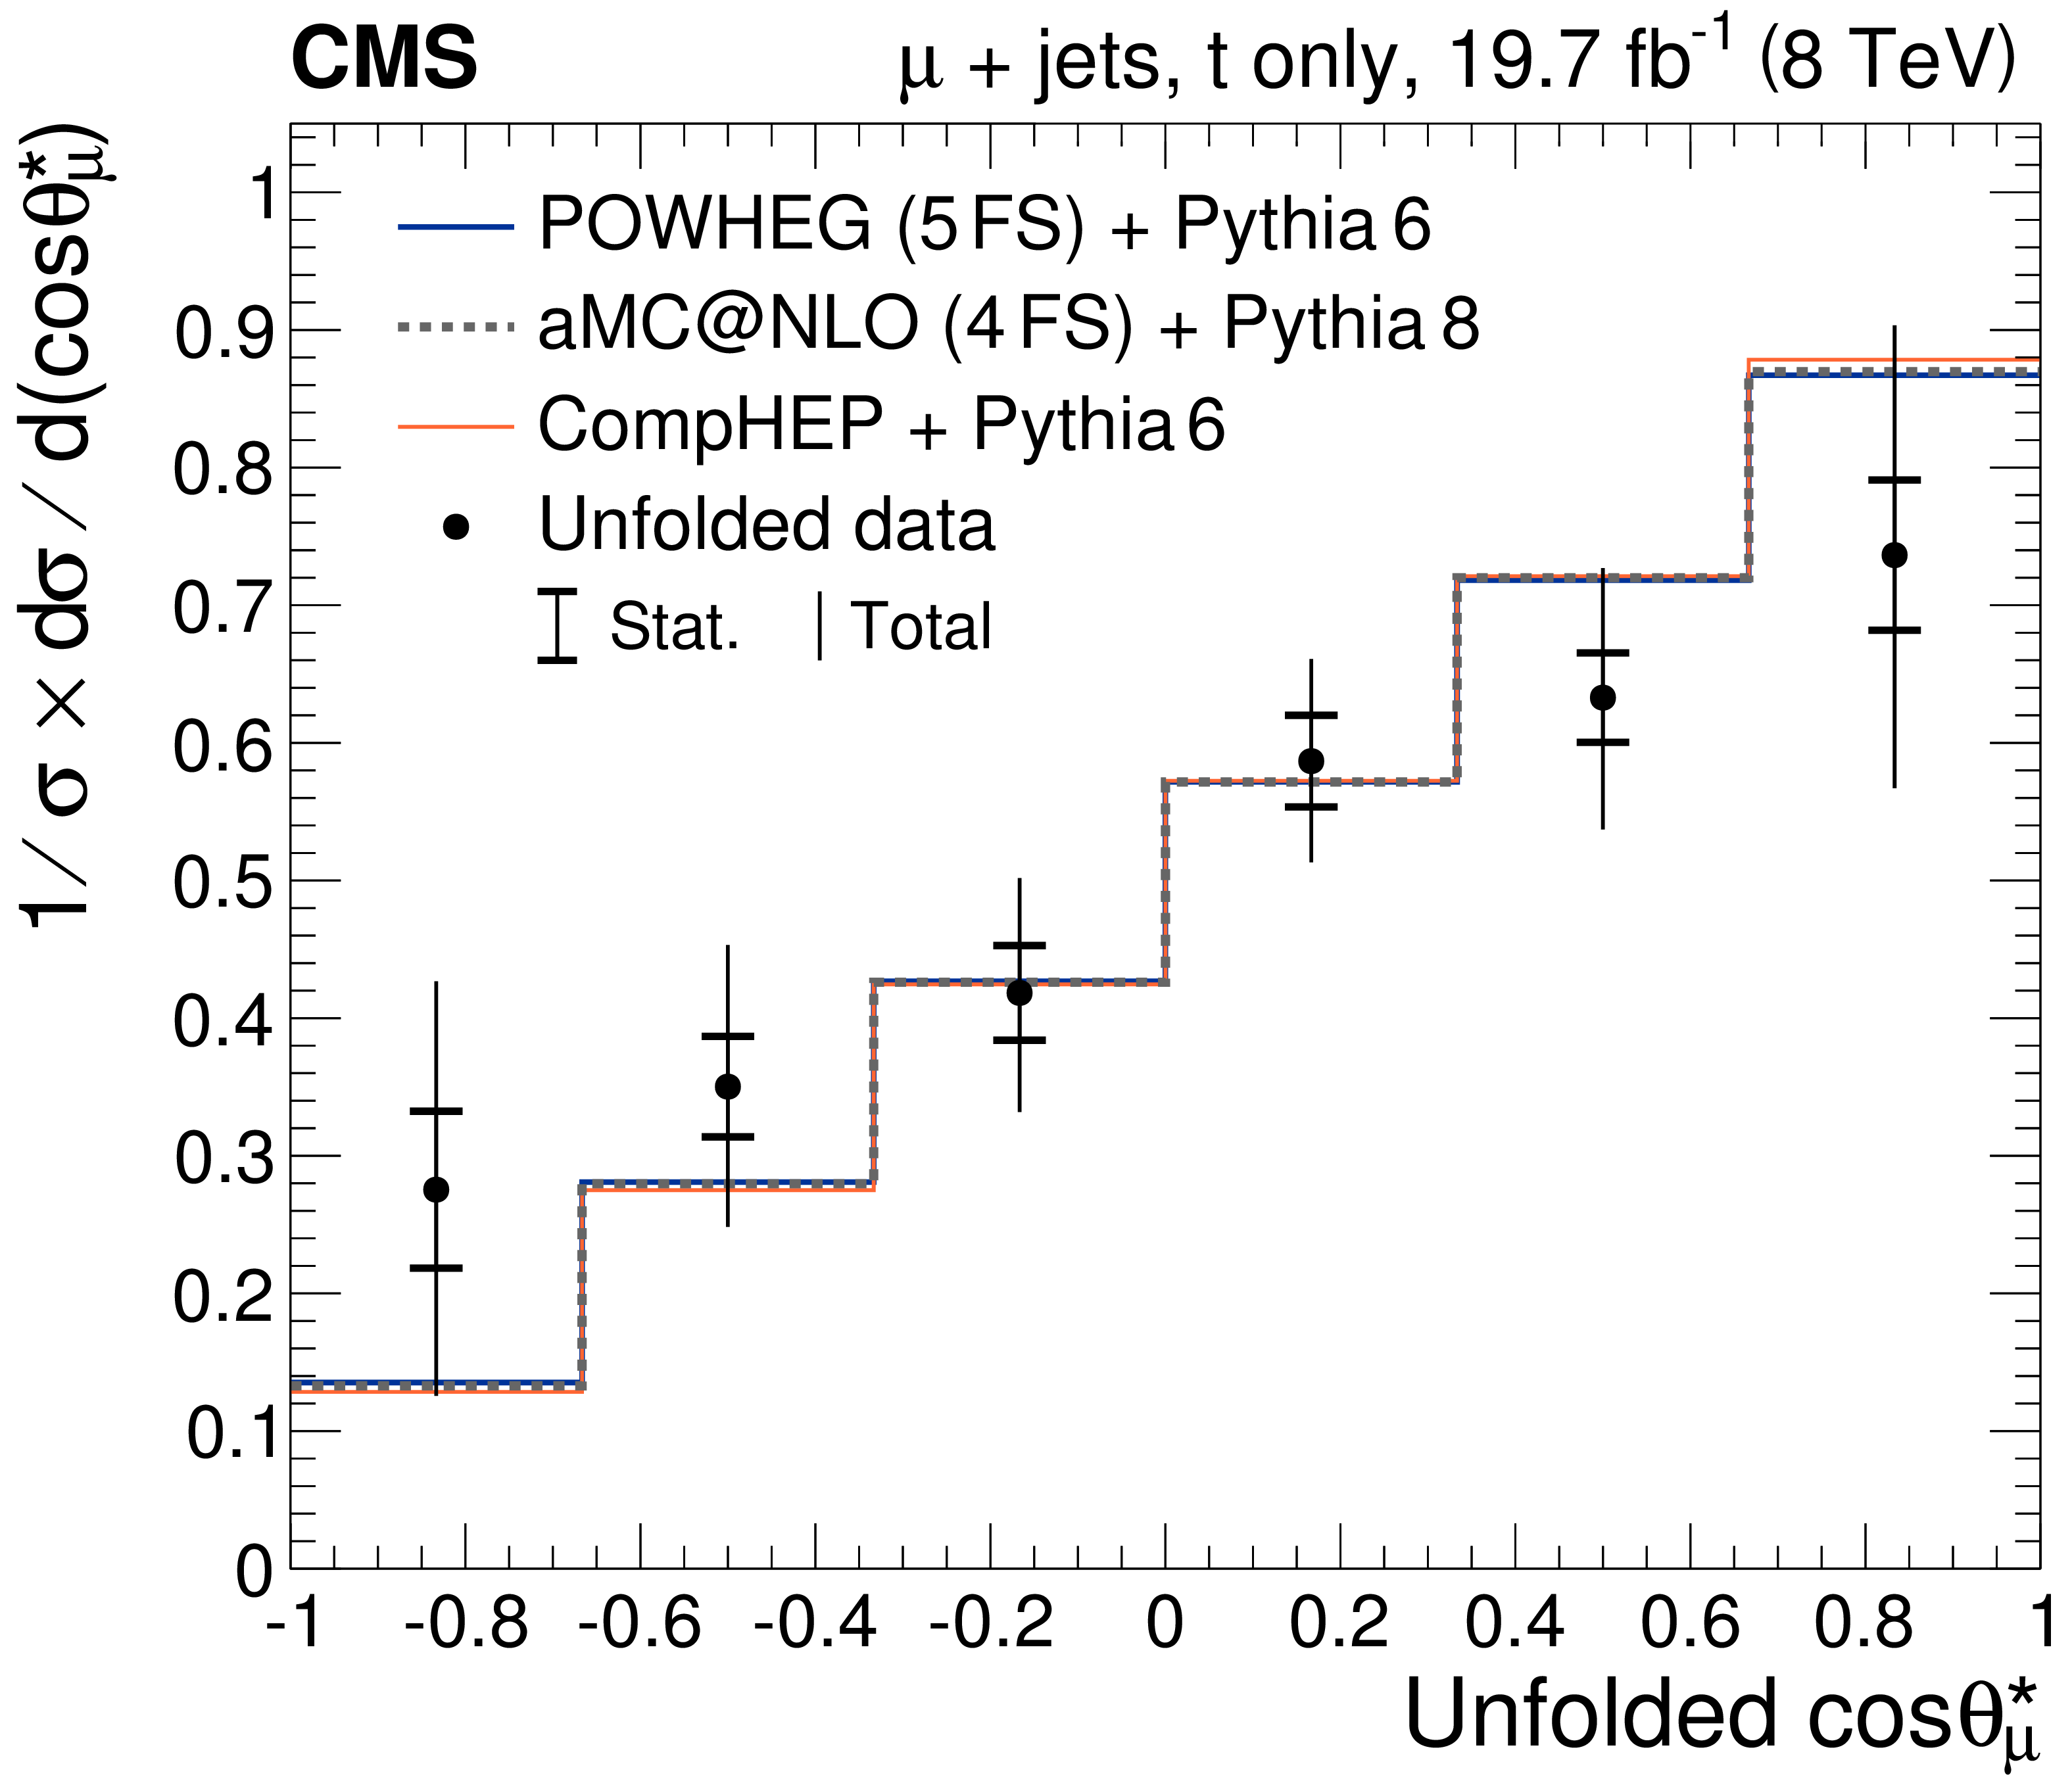
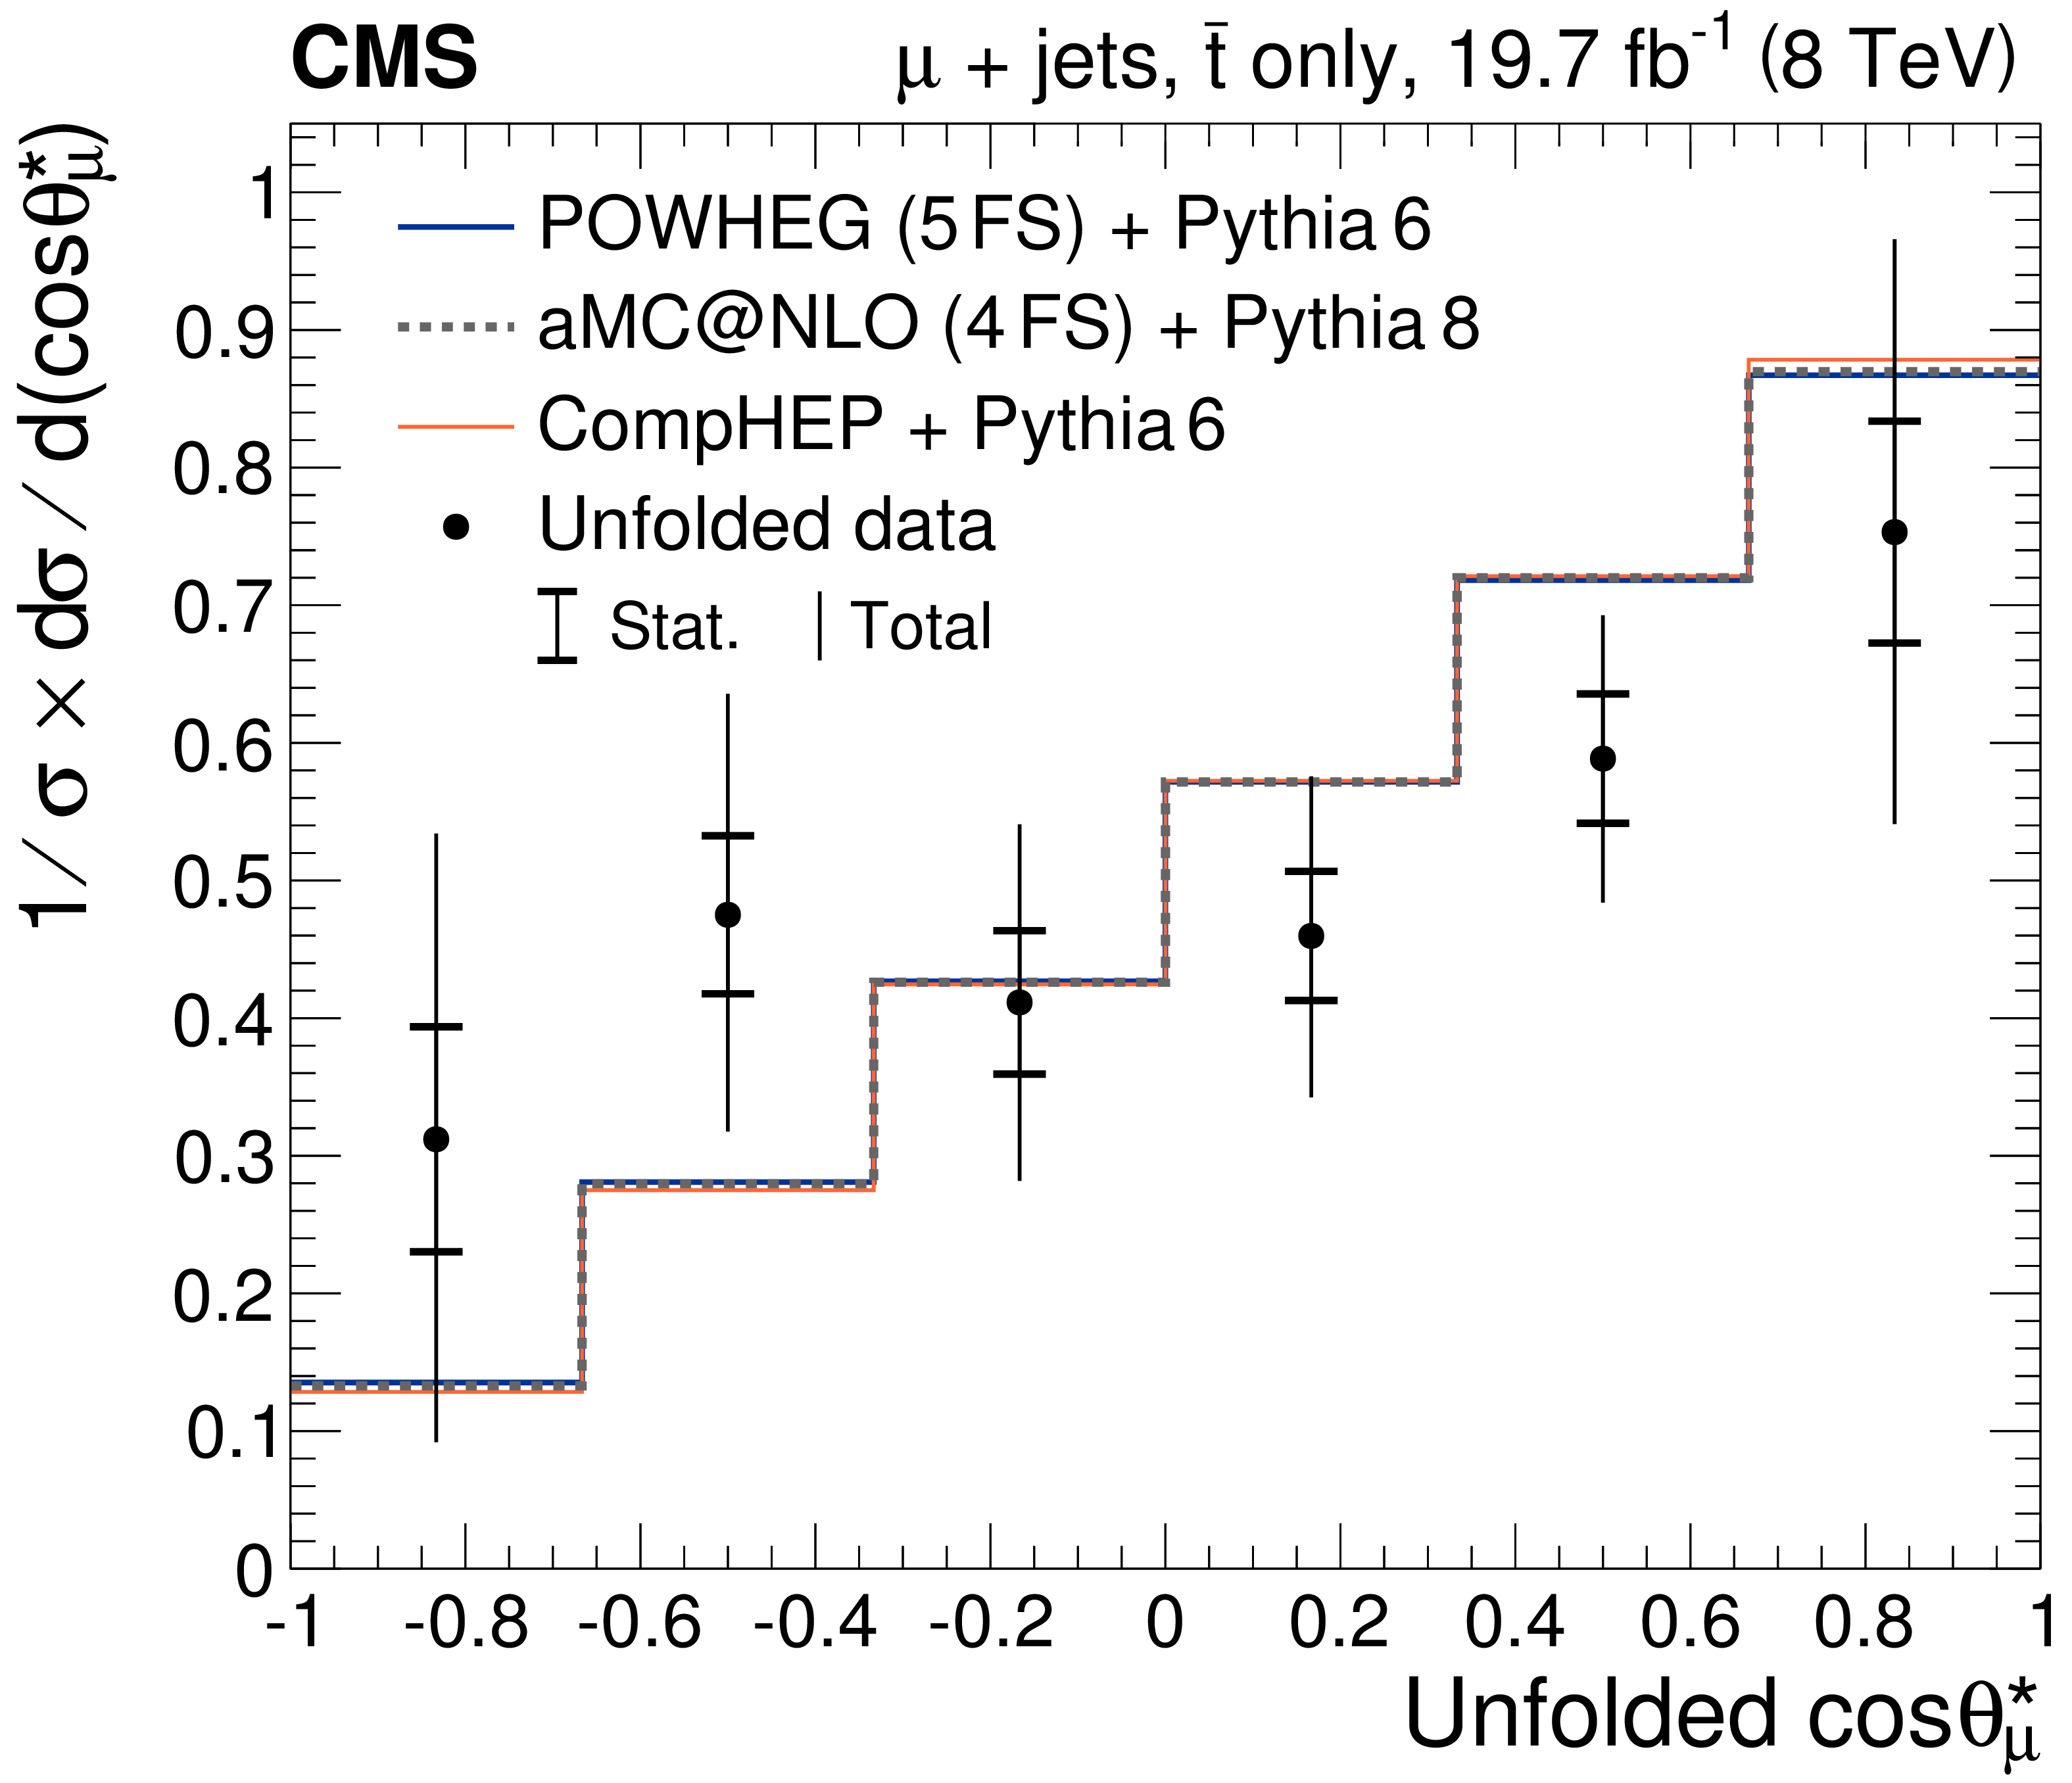
The normalised differential cross sections as a function of unfolded ${\cos{\theta ^*_{\mu }}}$ for (a) top quark and (b) antiquark compared to the predictions from POWHEG, aMC@NLO, and CompHEP. The inner (outer) bars represent the statistical (total) uncertainties. |
png pdf |
Figure 6-a:
The normalised differential cross sections as a function of unfolded ${\cos{\theta ^*_{\mu }}}$ for (a) top quark and (b) antiquark compared to the predictions from POWHEG, aMC@NLO, and CompHEP. The inner (outer) bars represent the statistical (total) uncertainties. |
png pdf |
Figure 6-b:
The normalised differential cross sections as a function of unfolded ${\cos{\theta ^*_{\mu }}}$ for (a) top quark and (b) antiquark compared to the predictions from POWHEG, aMC@NLO, and CompHEP. The inner (outer) bars represent the statistical (total) uncertainties. |
png pdf |
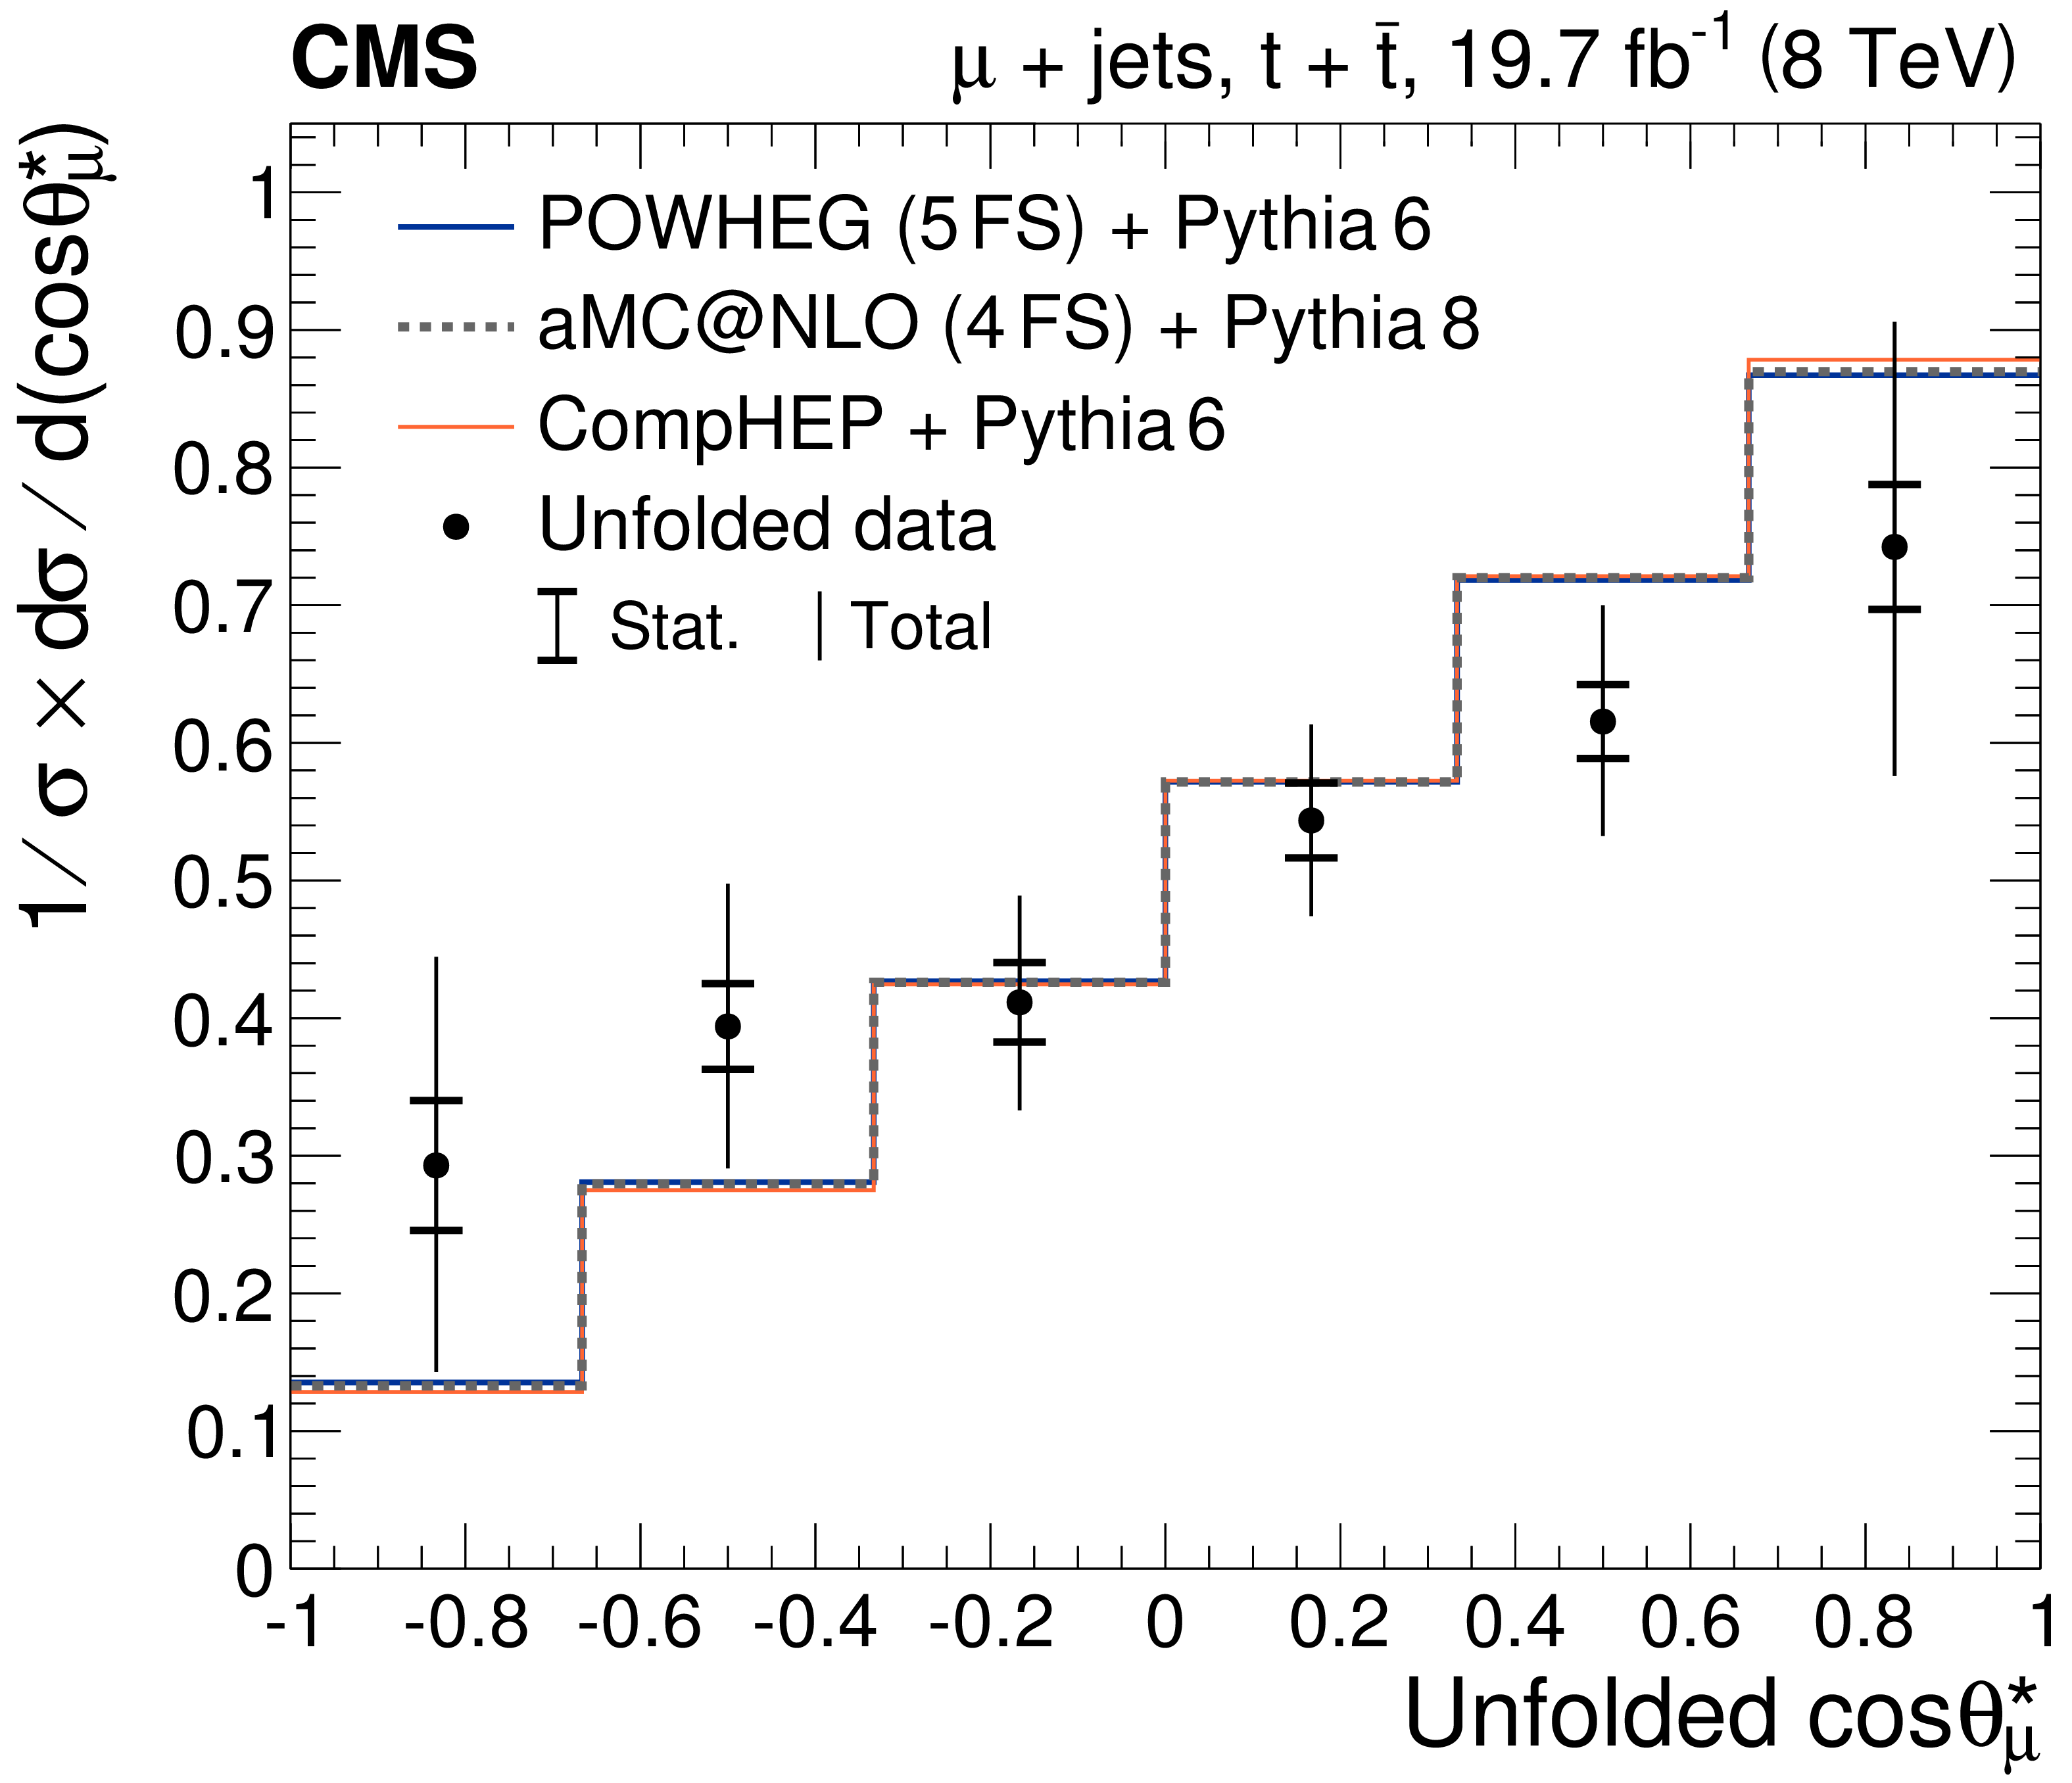
Figure 7:
The normalised differential cross section as a function of unfolded ${\cos{\theta ^*_{\mu }}}$ for top quark and antiquark combined, compared to the predictions from POWHEG, aMC@NLO, and CompHEP. The inner (outer) bars represent the statistical (total) uncertainties. |
| Tables | |

png pdf |
Table 1:
Estimated scale factors and uncertainties from the simultaneous maximum-likelihood fit to the distribution of the ${\text {BDT}_{\mathrm{ W } / {\mathrm{ t \bar{t} } } }}$ discriminant in the ``2jets 1tag`` and ``3jets 2tags`` categories. |

png pdf |
Table 2:
The expected number of signal and background events in the ``2jets 1tag'' signal region ($ {\text {BDT}_{\mathrm{ W } / {\mathrm{ t \bar{t} } } }} > $ 0.45 ) after scaling to the results of the maximum-likelihood fit. The uncertainties reflect the limited number of MC events and the estimated scale factor uncertainties, where appropriate. The multijet events background contribution is estimated using a data-based procedure. |

png pdf |
Table 3:
List of systematic uncertainties and their induced shifts from the nominal measured asymmetry for the top quark ($\delta A_{\mu }( \mathrm{ t } )$), antiquark ($\delta A_{\mu }( \mathrm{ \bar{t} })$), and their combination ($\delta A_{\mu }( \mathrm{ t } + \mathrm{ \bar{t} } )$). |
| Summary |
|
The first measurement of the top quark spin asymmetry, sensitive to the top quark polarisation, in $t$-channel single top quark production has been presented. This measurement is based on a sample of pp collisions at a centre-of-mass energy of 8 TeV, corresponding to an integrated luminosity of 19.7 fb$^{-1}$. The asymmetry, $A_{\mu}$, is obtained by performing a differential cross section measurement of ${\cos{\theta^*_{\mu}}}$, between forward- and backward-going muons with respect to the direction of the spectator quark in the top quark rest frame. The measurement yields $A_{\mu} =$ 0.26 $\pm$ 0.03 (stat) $\pm$ 0.10 (syst) $=$ 0.26 $\pm$ 0.11, which is compatible with a $p$-value of 4.6%, equivalent to 2.0 standard deviations, with the standard model expectation. The asymmetry observed in data is smaller than the prediction. Separate results from exclusive top quark or antiquark events are compatible within the uncertainties. This difference cannot be explained by any single source of systematic uncertainty considered in this analysis. |
|
|
Compact Muon Solenoid LHC, CERN |
|

|

|

|

|

|