

Compact Muon Solenoid
LHC, CERN
| CMS-TOP-13-009 ; CERN-EP-2016-045 | ||
| Search for $s$ channel single top quark production in pp collisions at $\sqrt{s} =$ 7 and 8 TeV | ||
| CMS Collaboration | ||
| 8 March 2016 | ||
| J. High Energy Phys. 09 (2016) 027 | ||
| Abstract: A search is presented for single top quark production in the $s$ channel in proton-proton collisions with the CMS detector at the CERN LHC in decay modes of the top quark containing a muon or an electron in the final state. The signal is extracted through a maximum-likelihood fit to the distribution of a multivariate discriminant defined using boosted decision trees to separate the expected signal contribution from background processes. Data collected at centre-of-mass energies of 7 and 8 TeV yield cross sections of 7.1 $\pm$ 8.1 pb and 13.4 $\pm$ 7.3 pb, respectively, and a best fit value of 2.0 $\pm$ 0.9 for the combined ratio of the measured and expected values. The signal significance is 2.5 standard deviations, and the upper limit on the rate relative to the standard model expectation is 4.7 at 95\% confidence level. | ||
| Links: e-print arXiv:1603.02555 [hep-ex] (PDF) ; CDS record ; inSPIRE record ; CADI line (restricted) ; | ||
| Figures | |
png pdf |
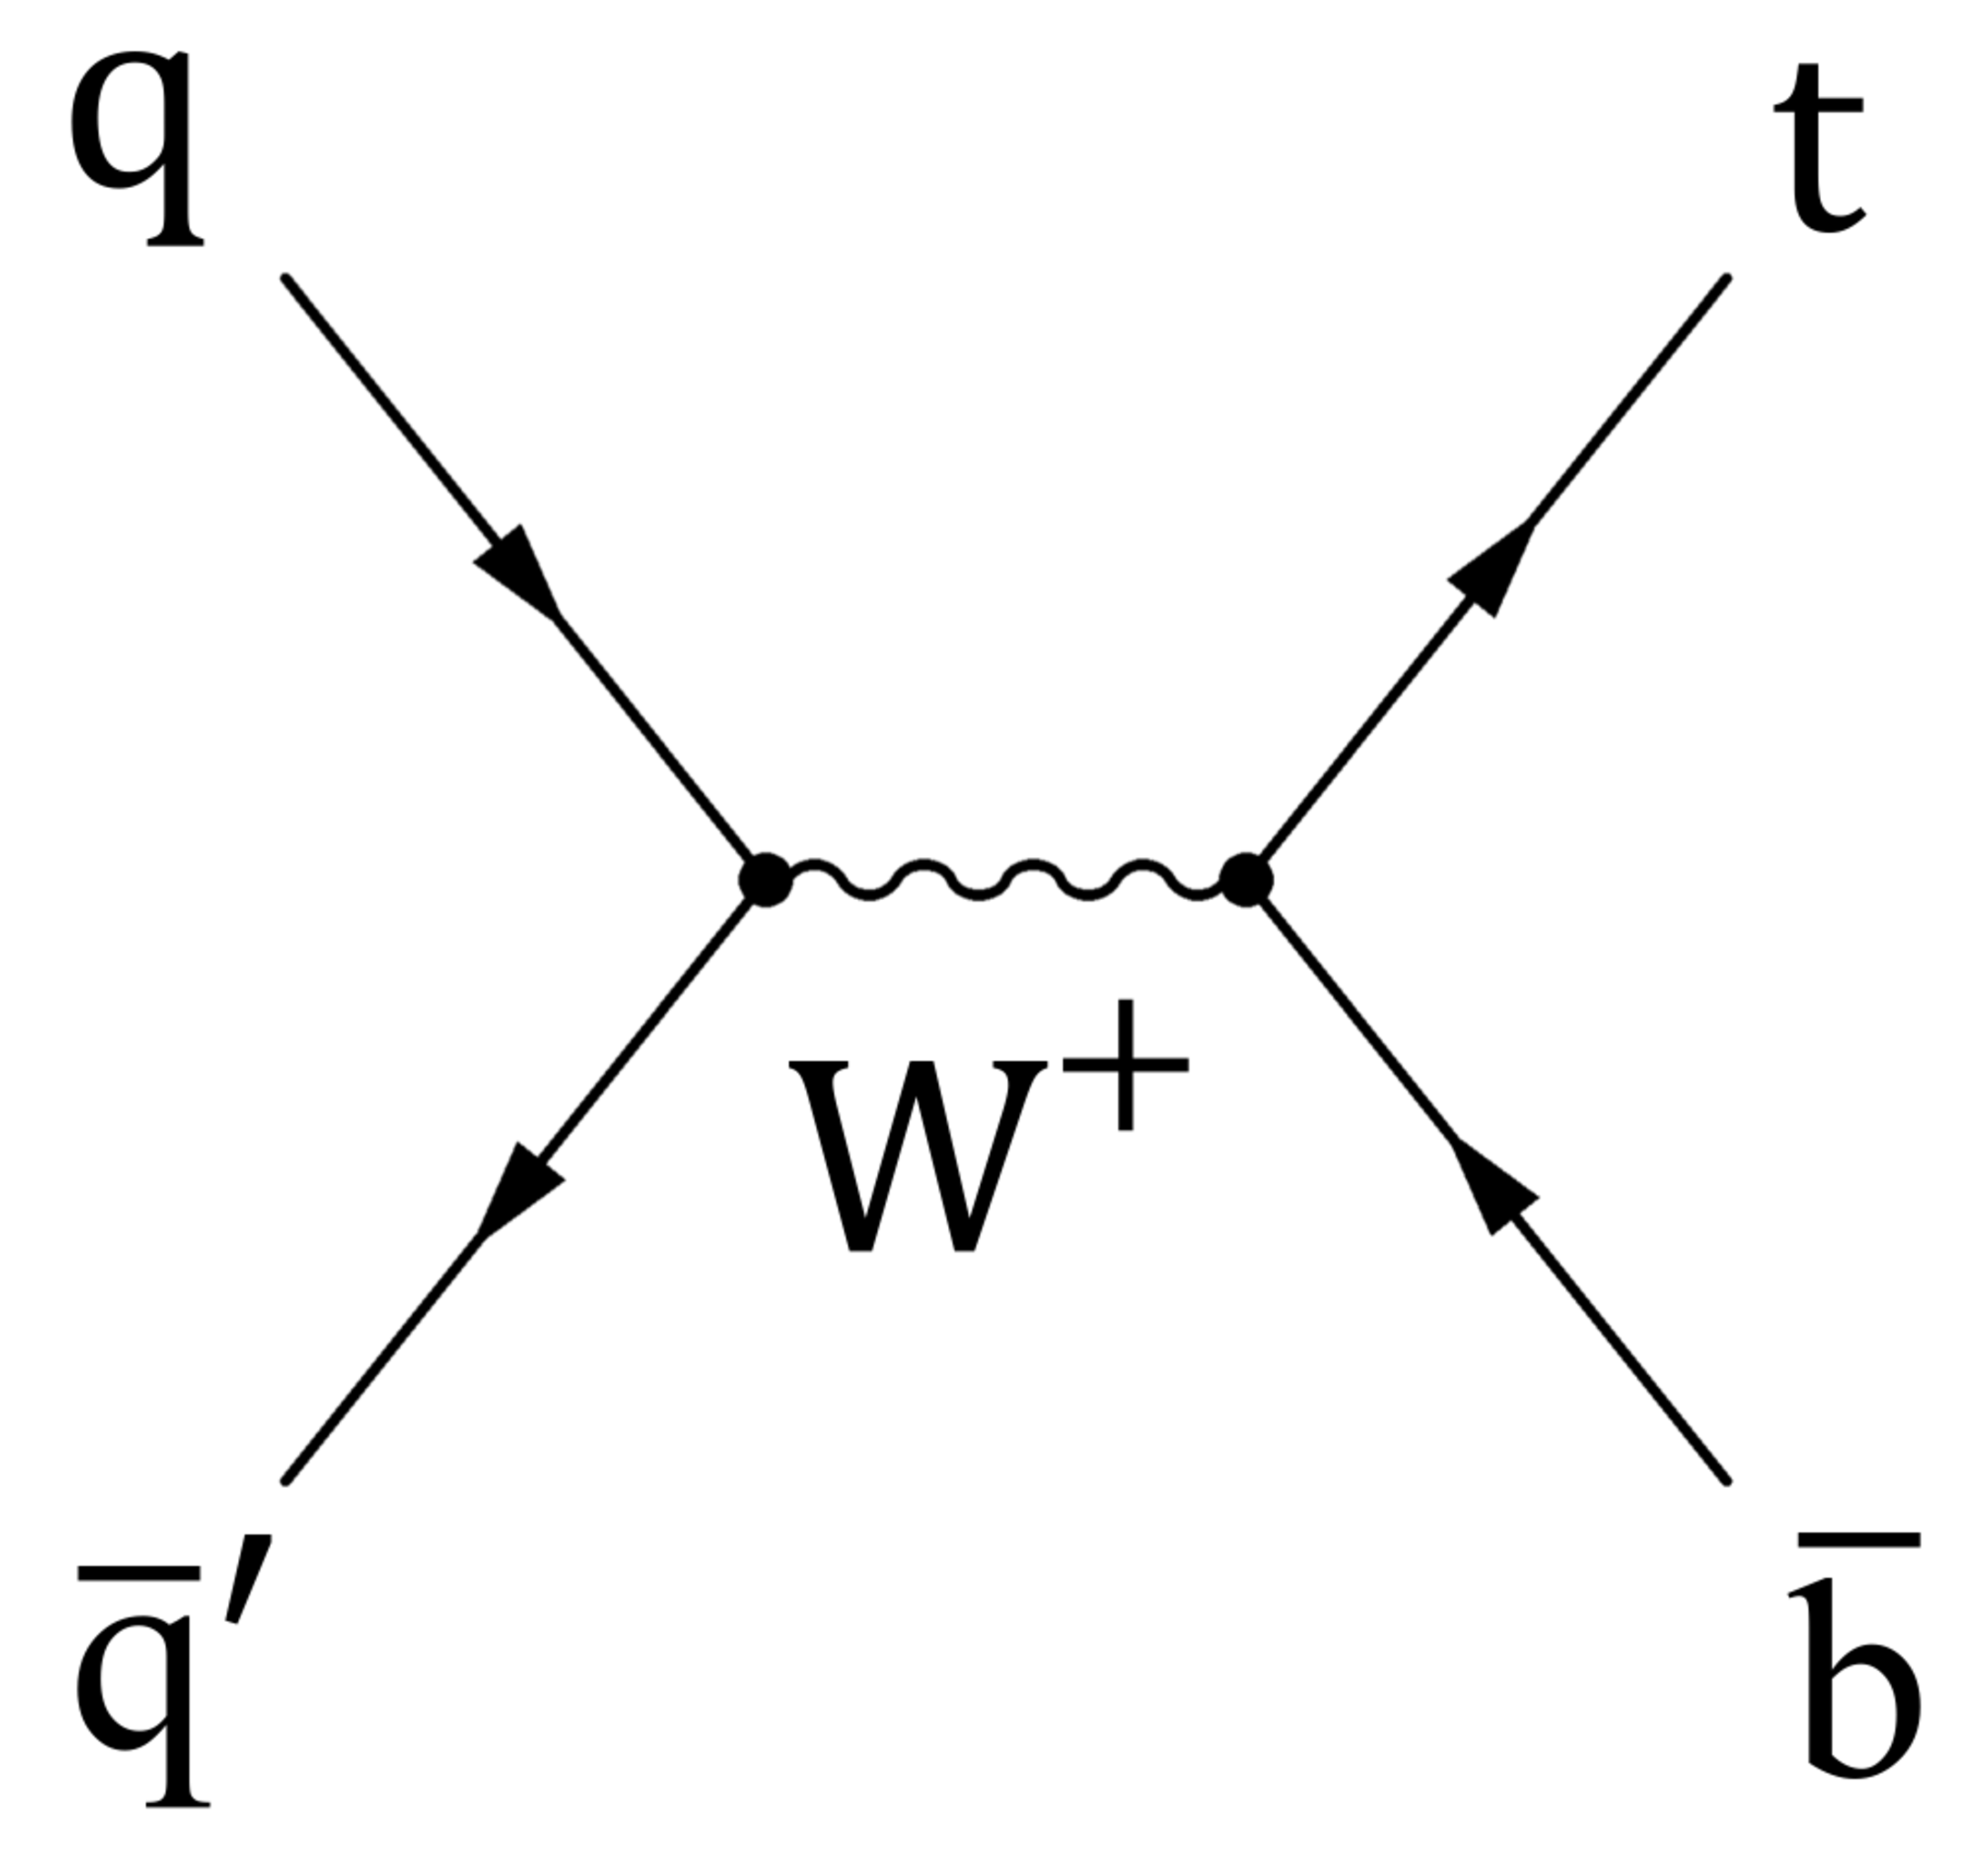
Figure 1-a:
Leading-order Feynman diagram for single top quark production in (a) the $s$ channel, whose production rate is studied in this paper, (b) the dominant next-to-leading-order diagram in the $t$ channel, and (c) the tW production channel. |
png pdf |
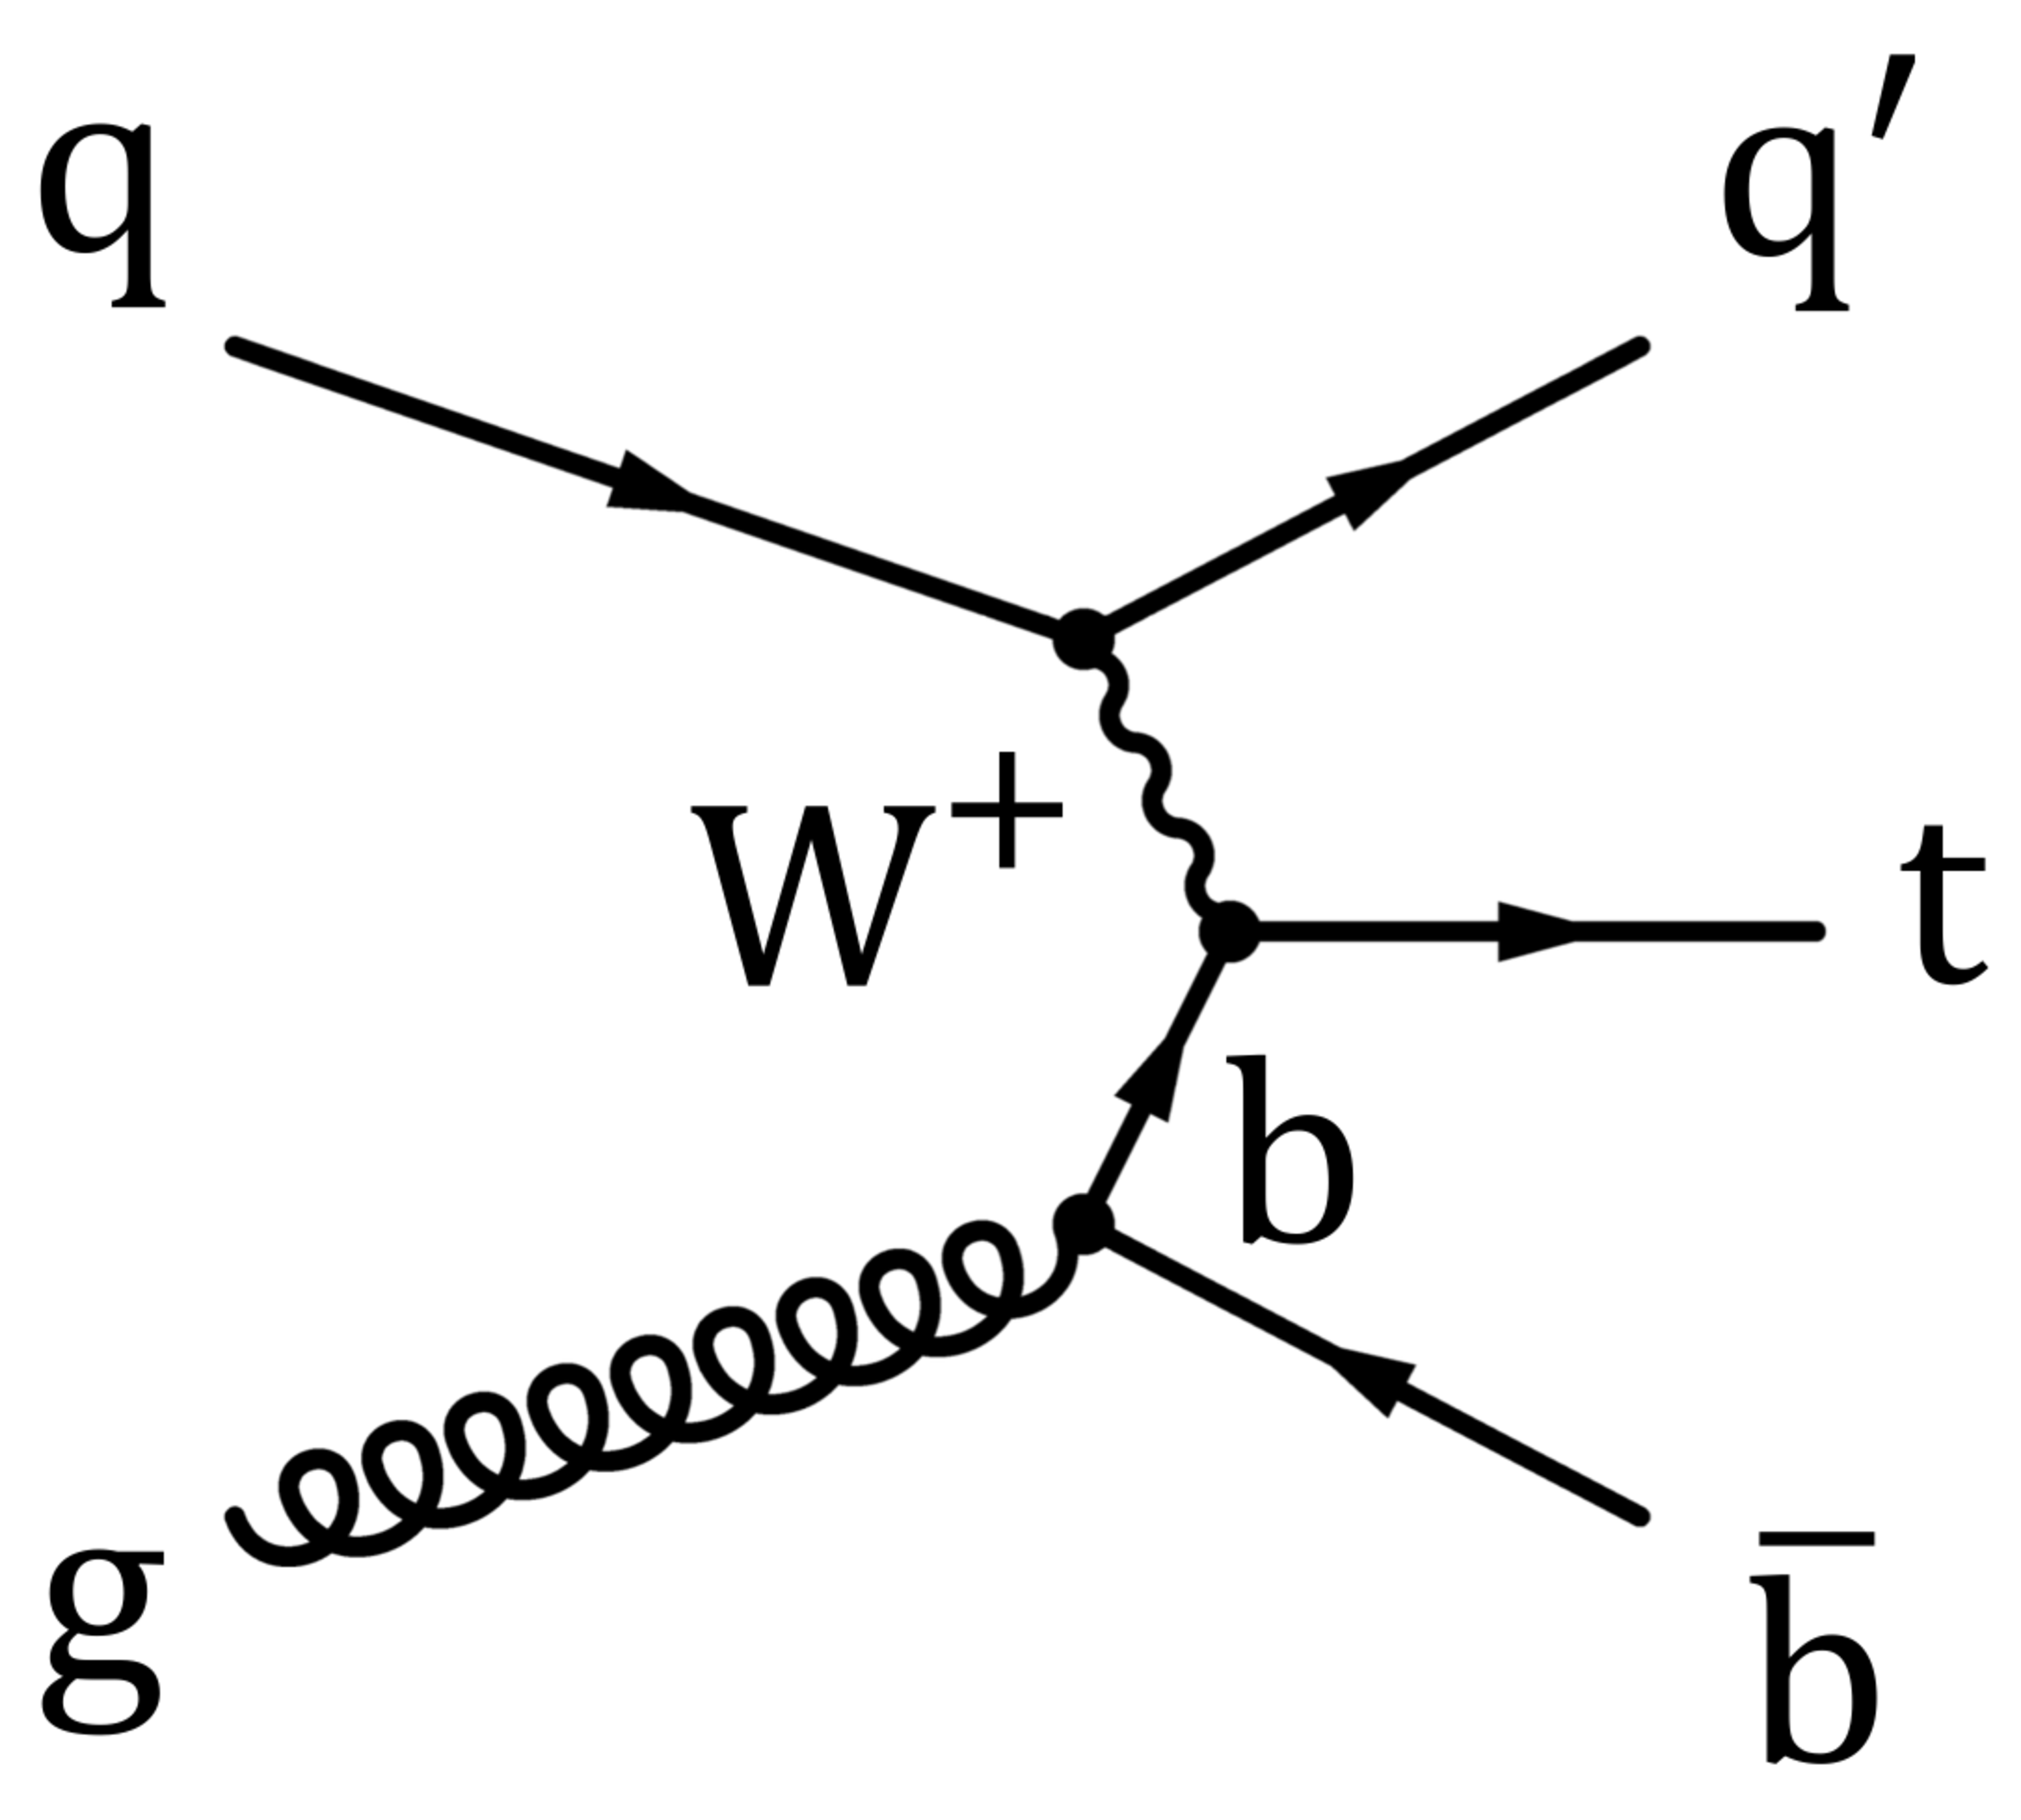
Figure 1-b:
Leading-order Feynman diagram for single top quark production in (a) the $s$ channel, whose production rate is studied in this paper, (b) the dominant next-to-leading-order diagram in the $t$ channel, and (c) the tW production channel. |
png pdf |
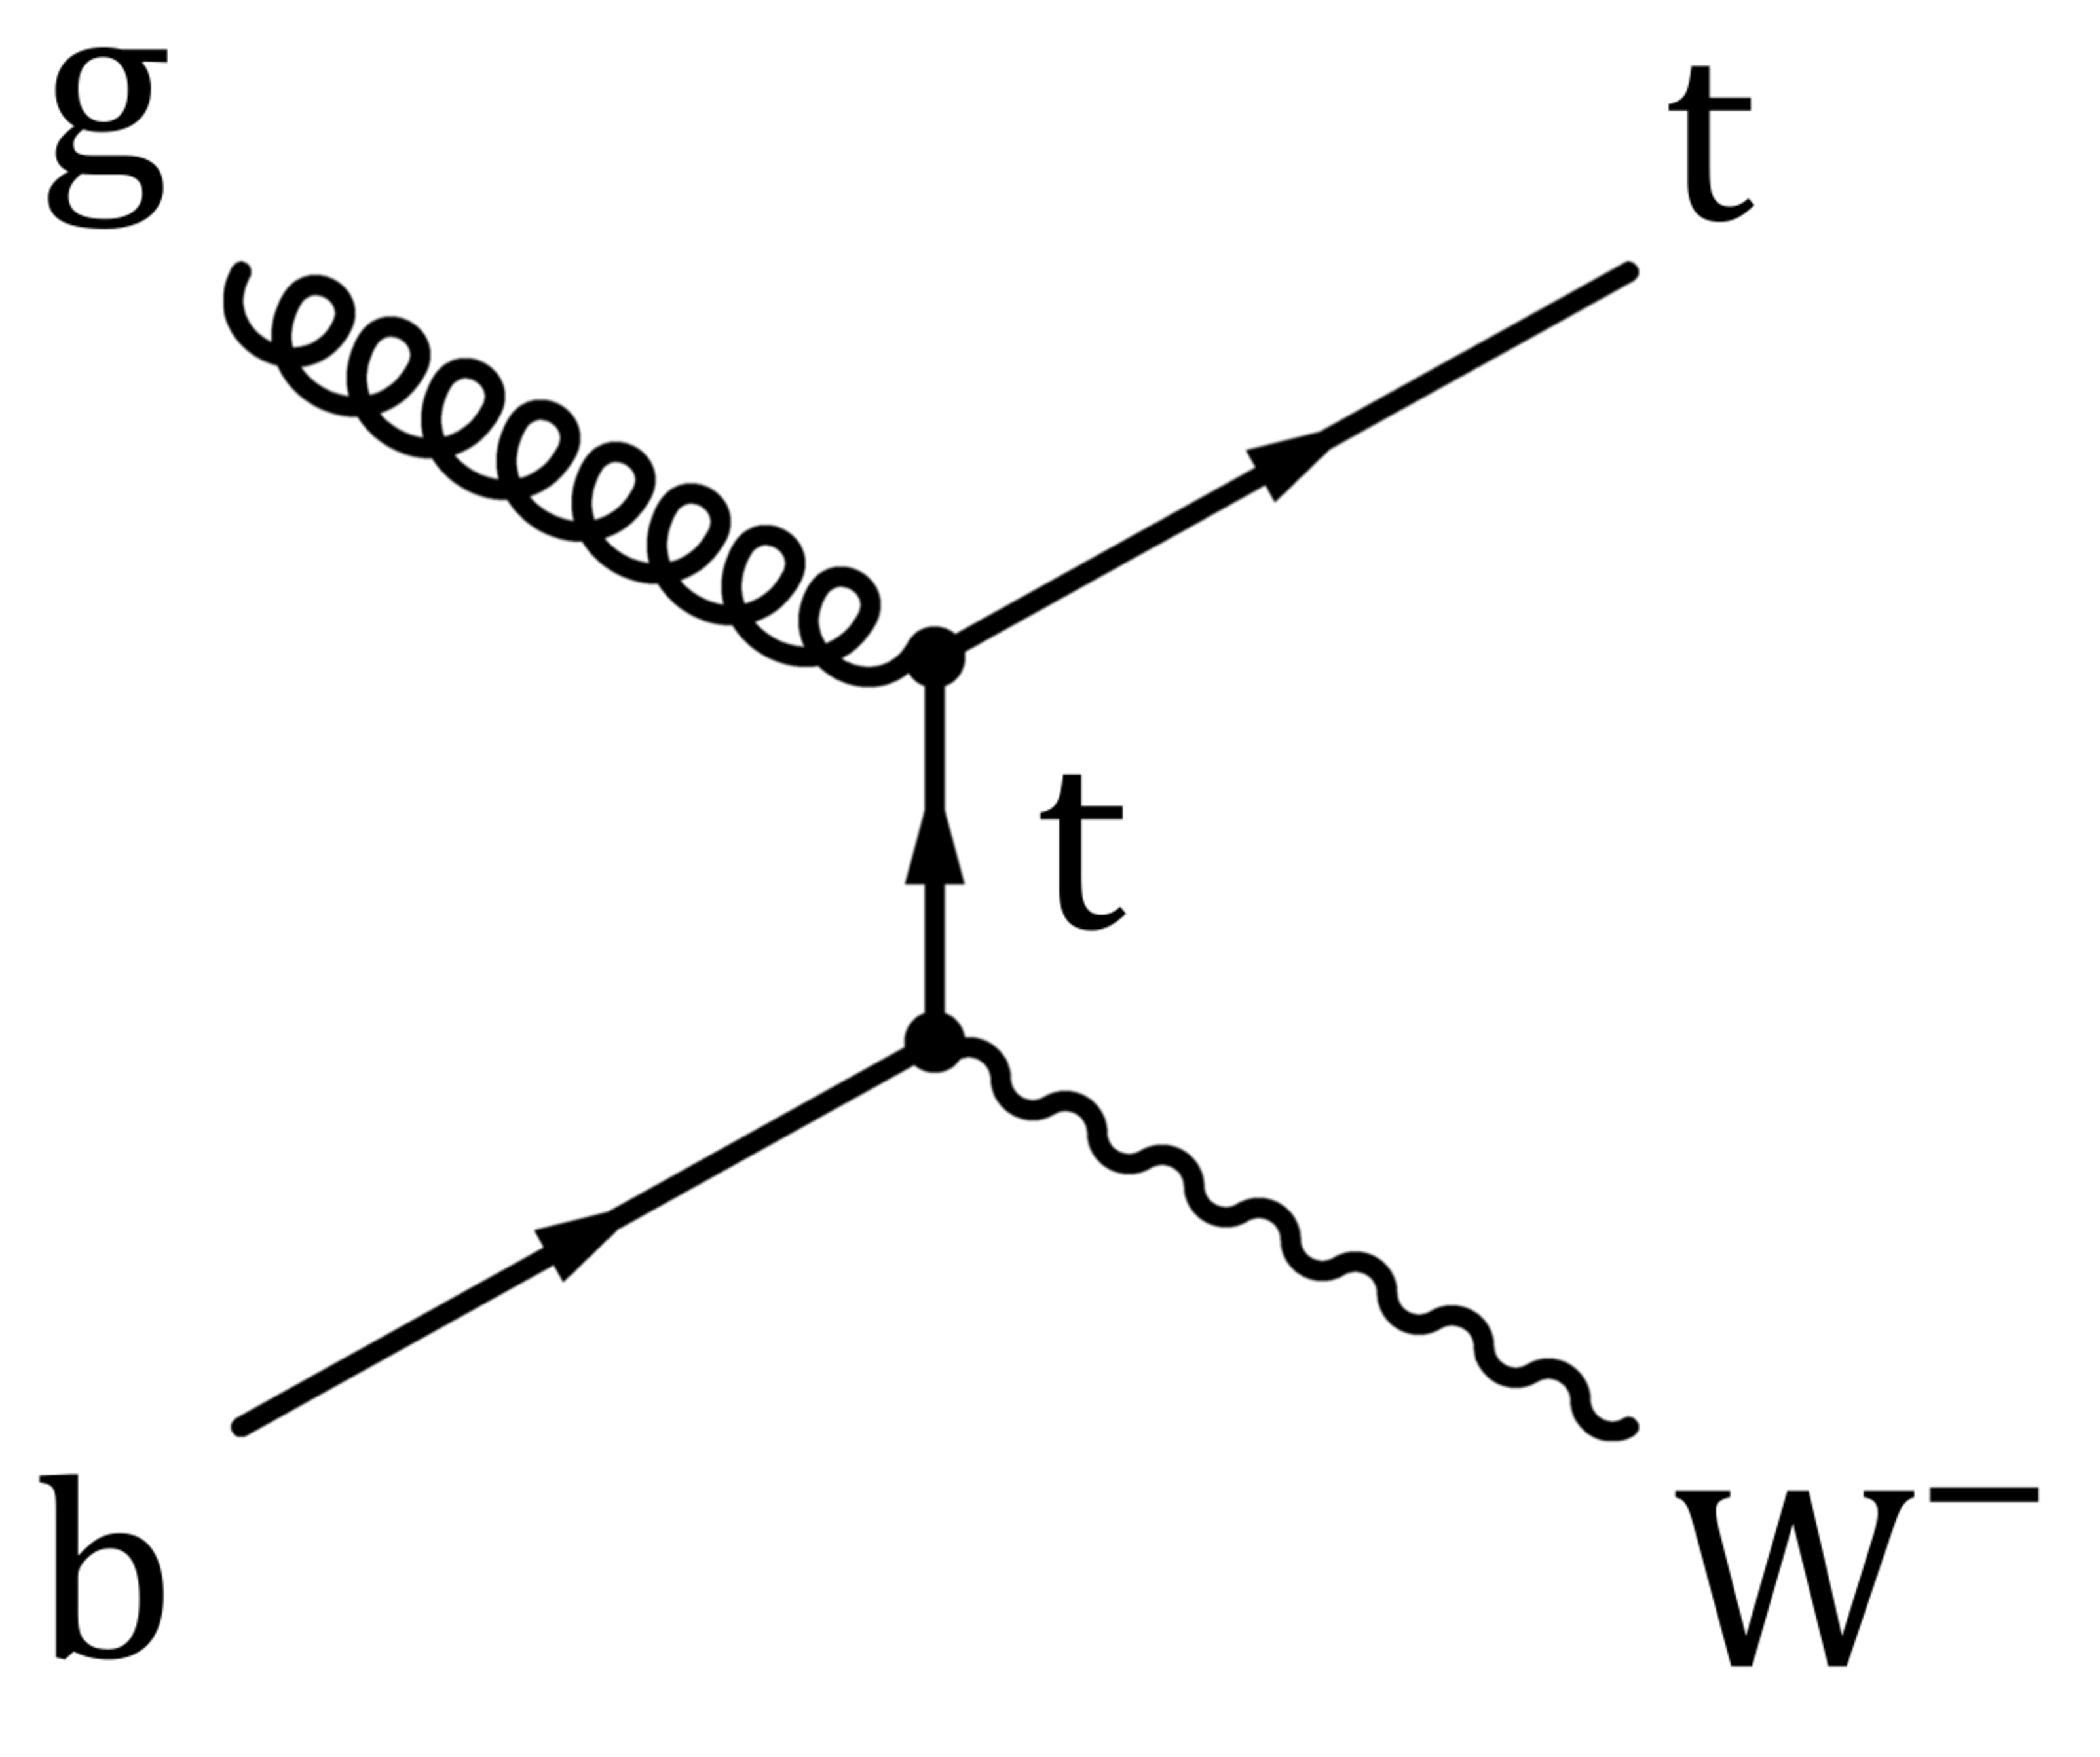
Figure 1-c:
Leading-order Feynman diagram for single top quark production in (a) the $s$ channel, whose production rate is studied in this paper, (b) the dominant next-to-leading-order diagram in the $t$ channel, and (c) the tW production channel. |
png pdf |
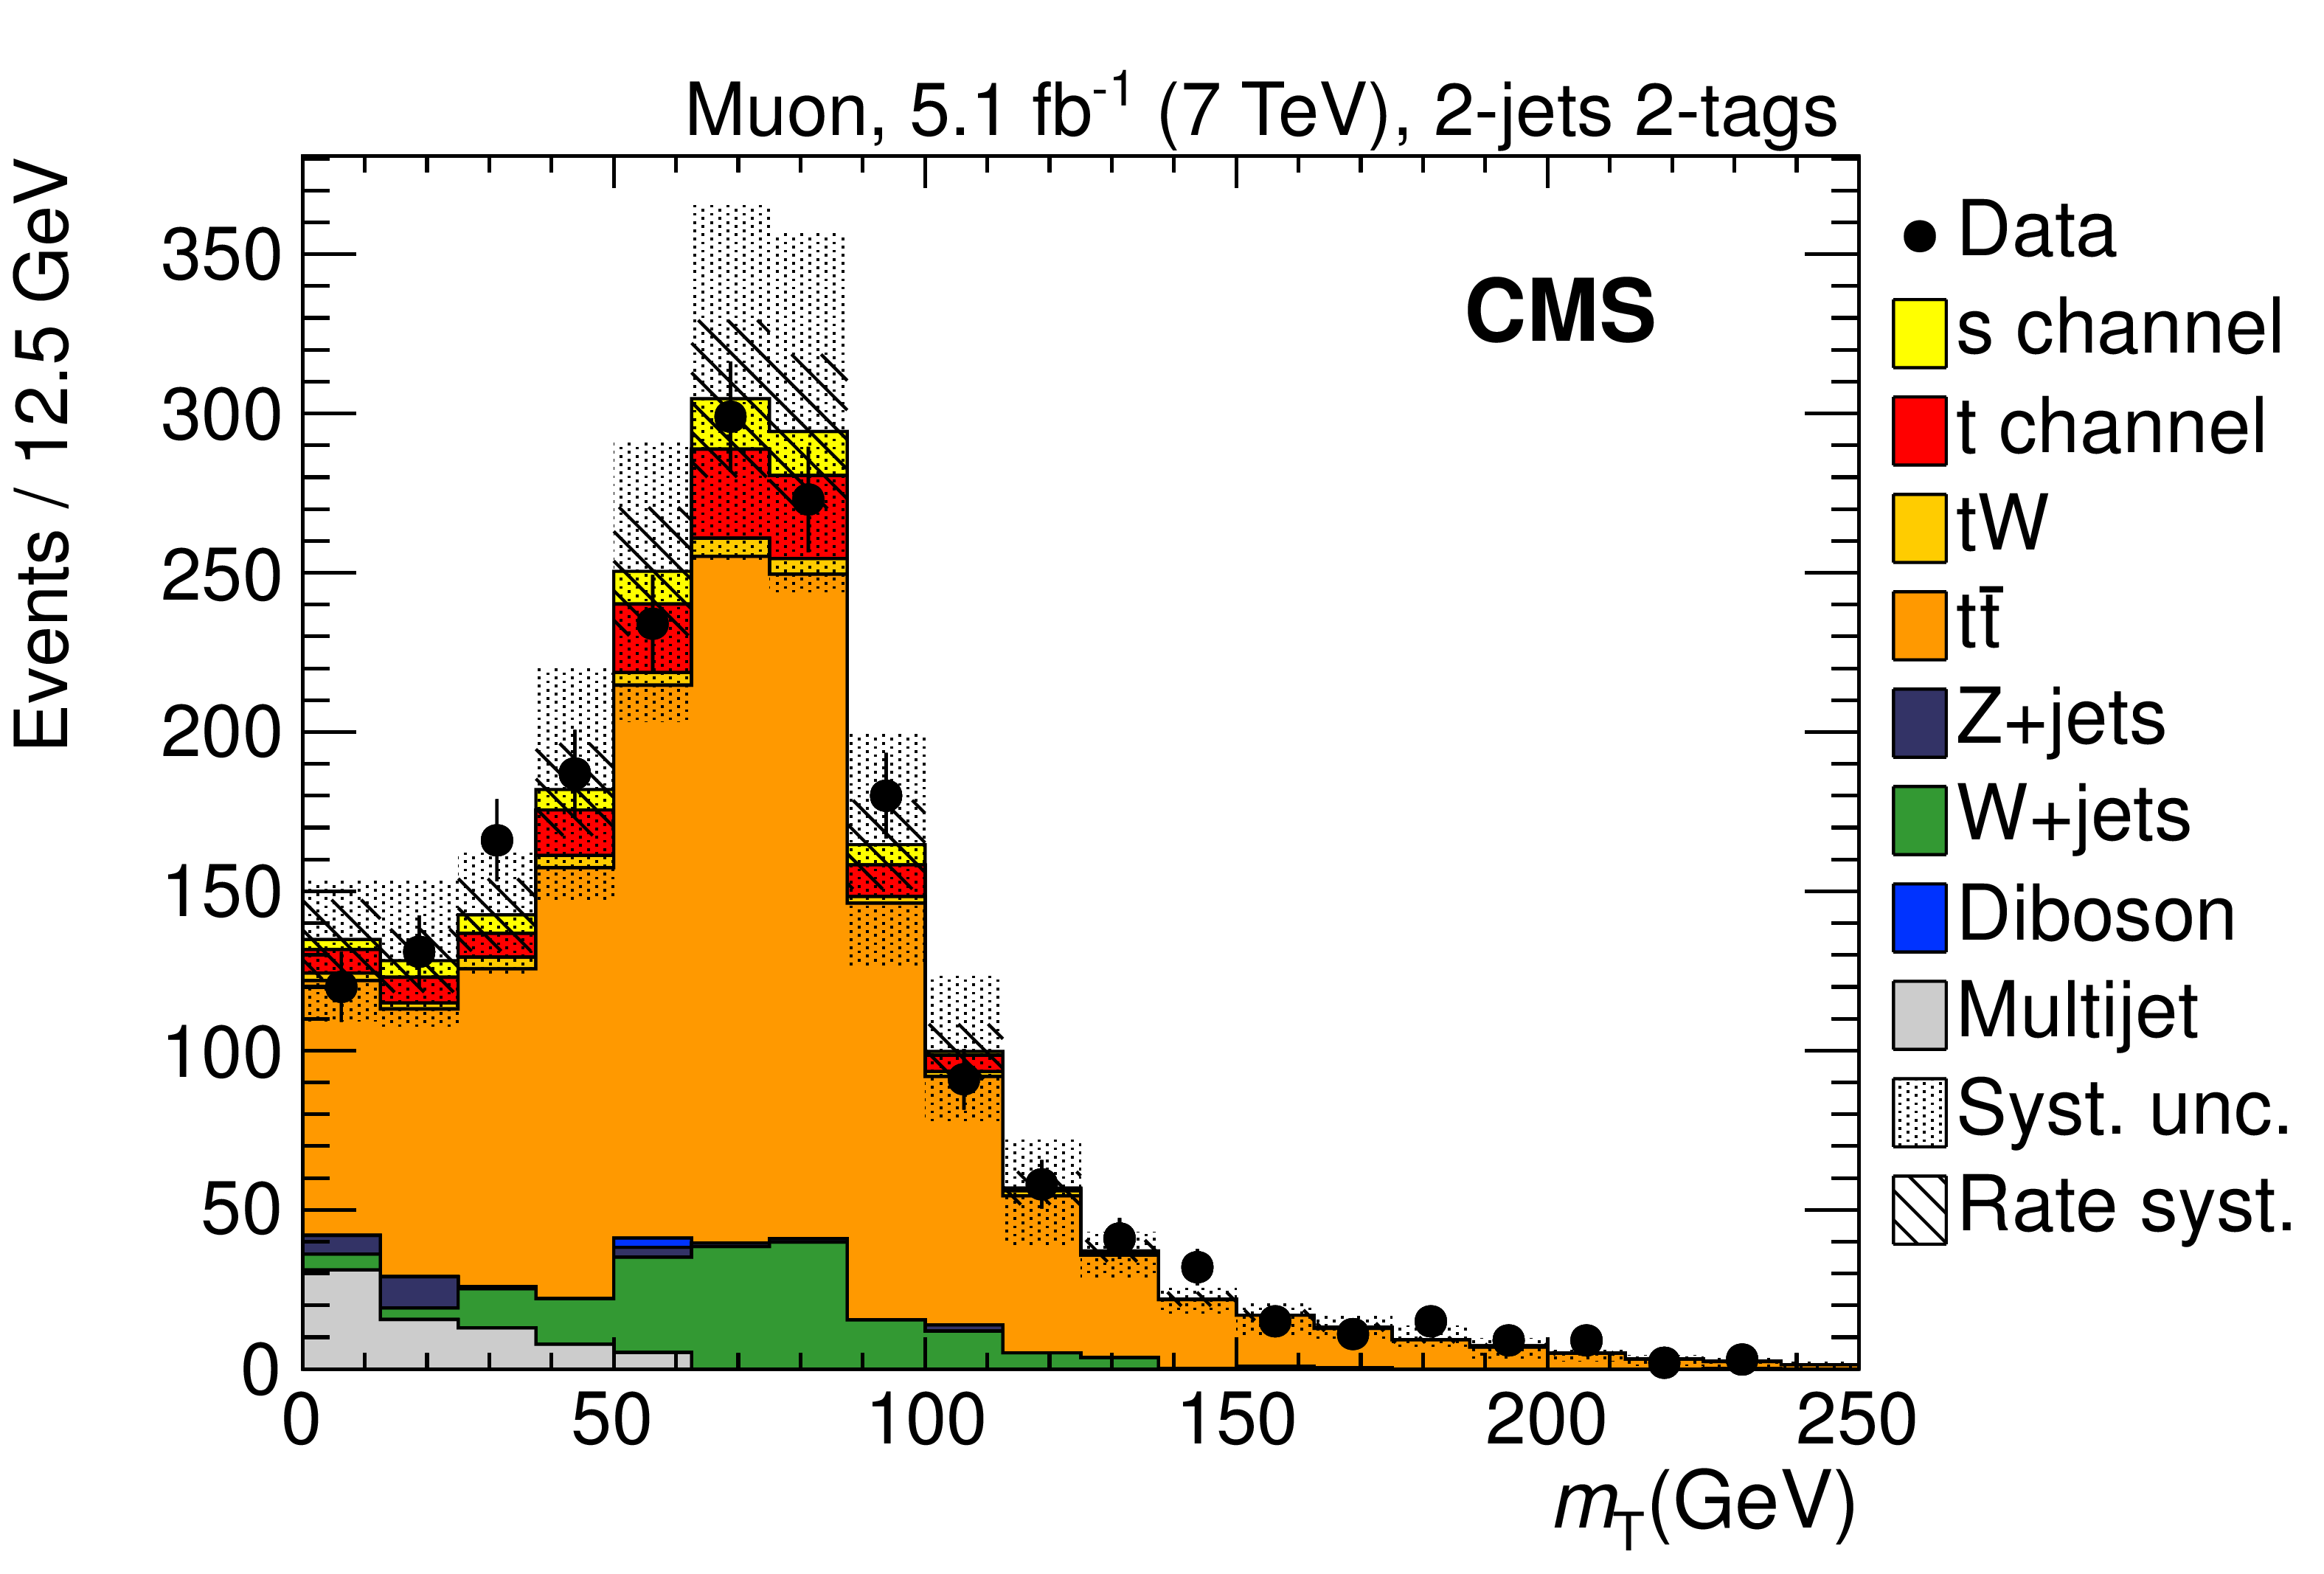
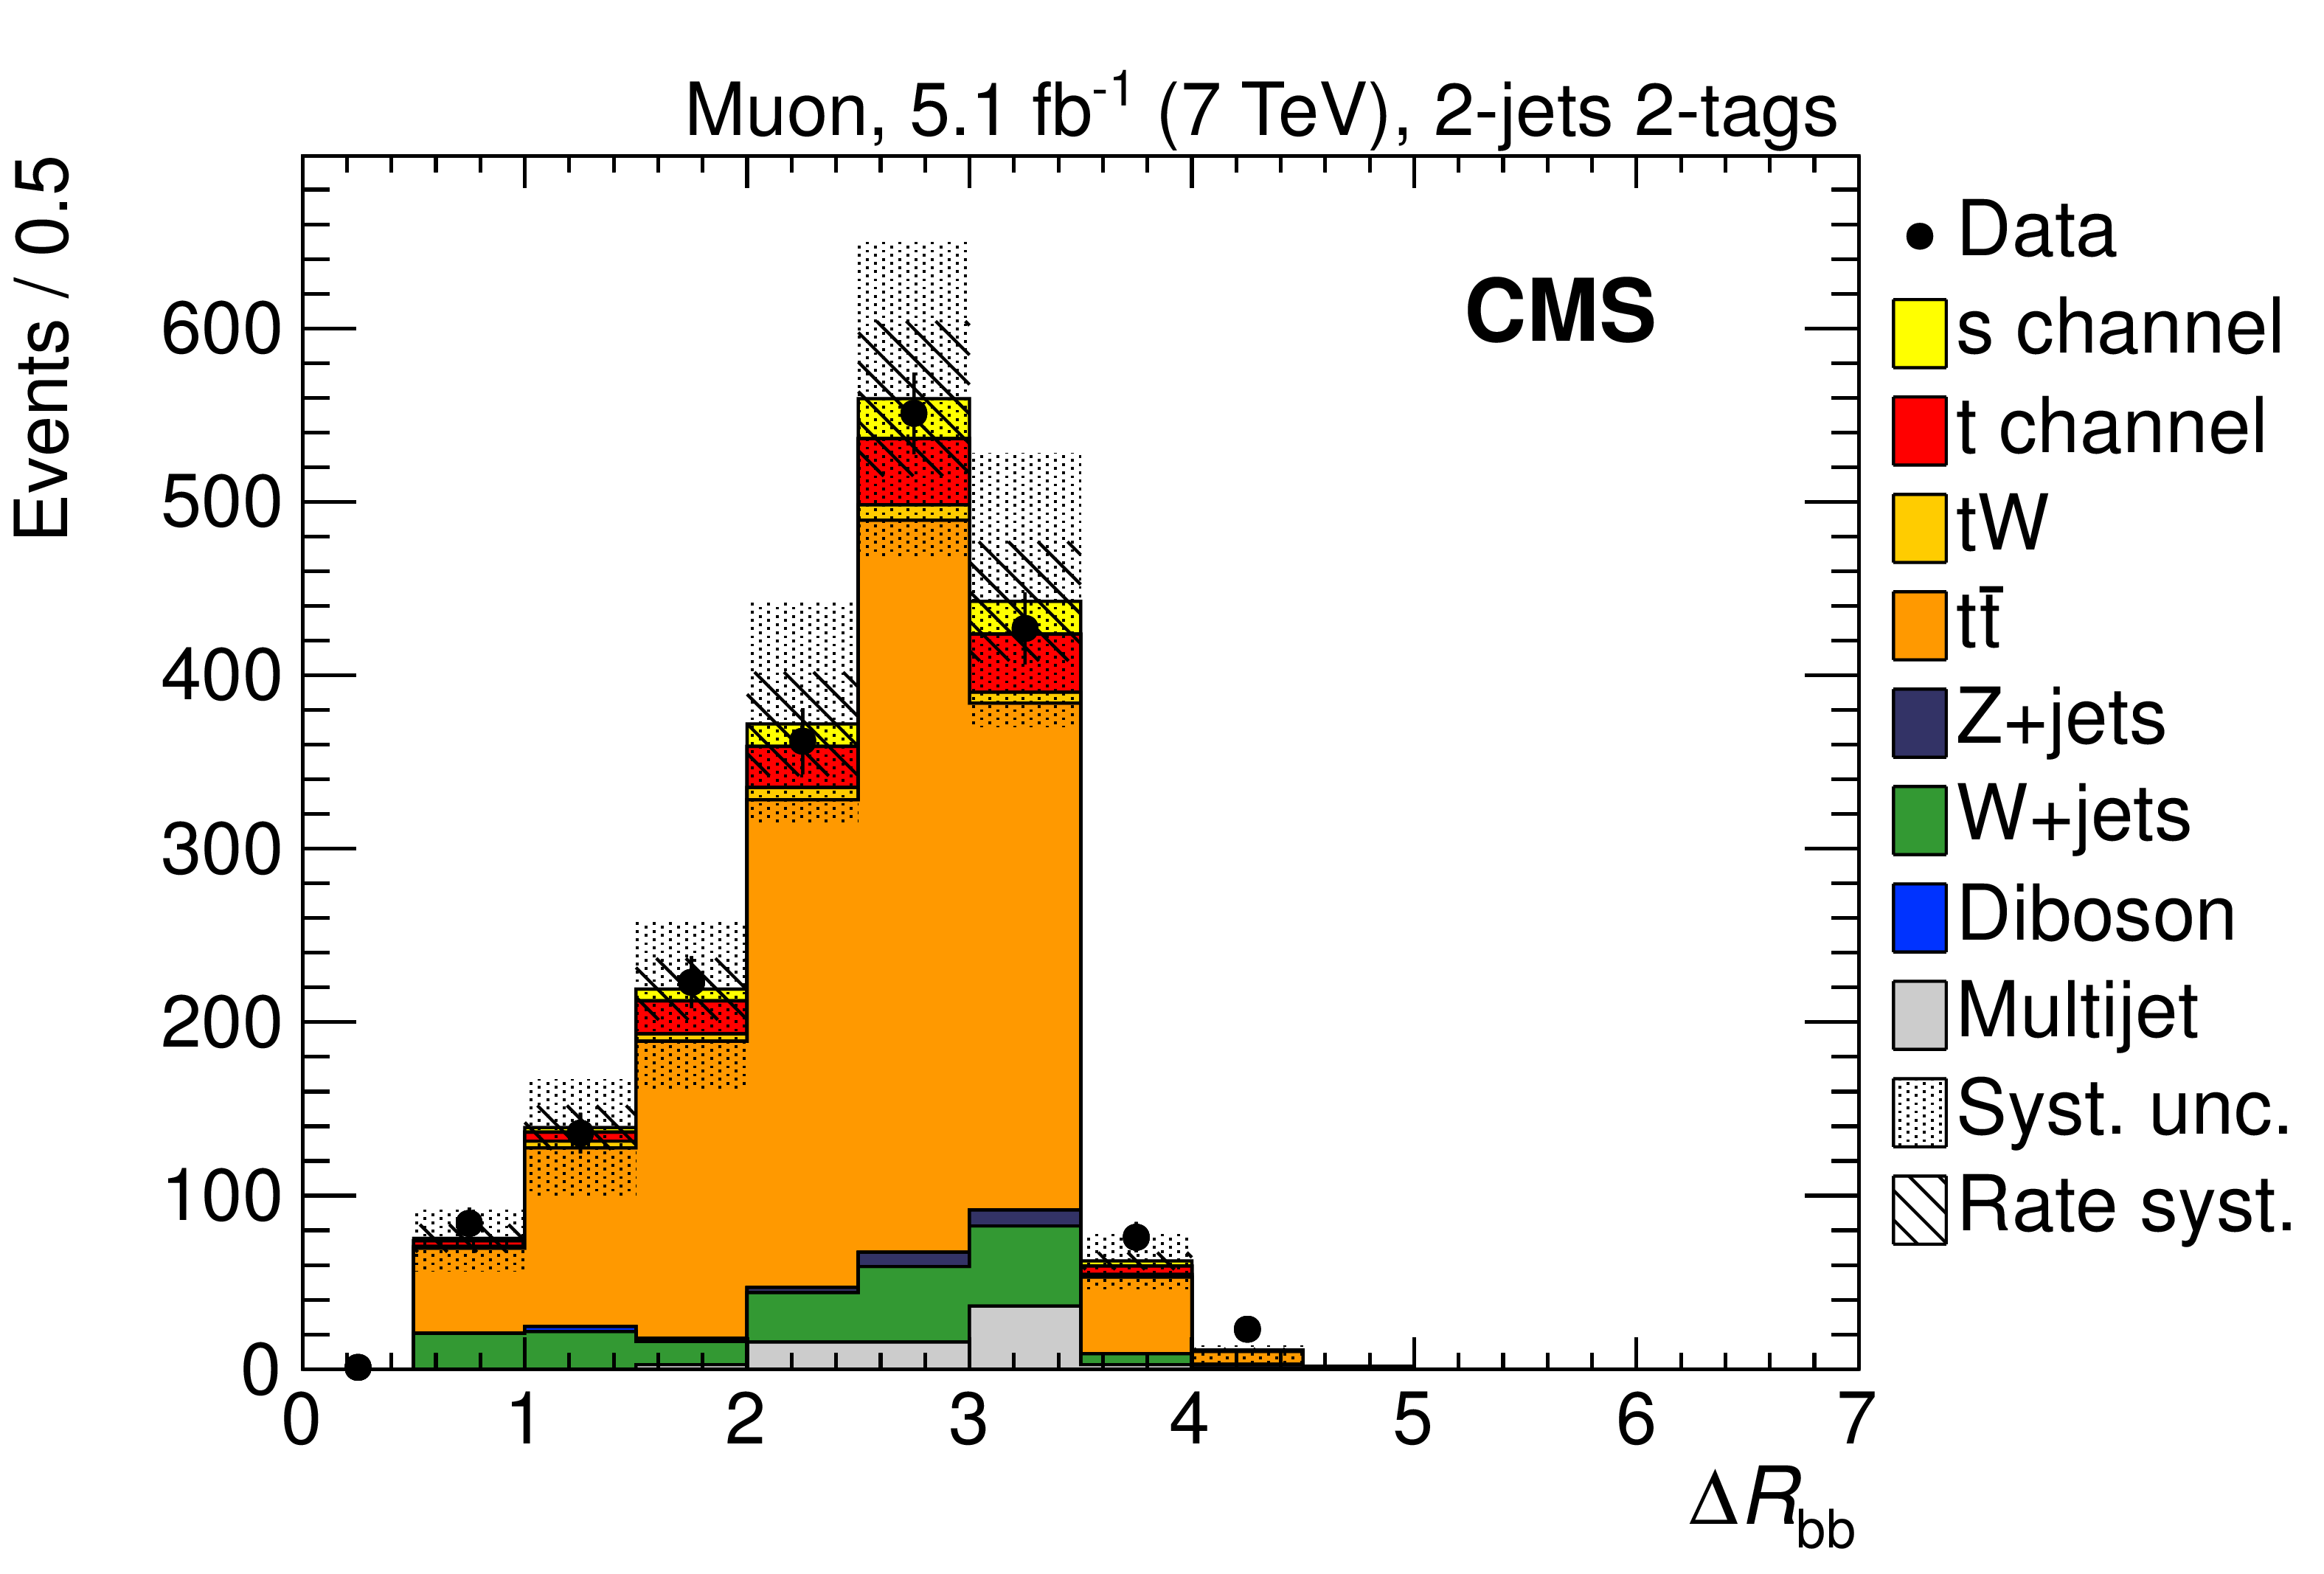
Figure 2-a:
Comparison between data and simulation in distributions of highest-ranked variables in the 2-jets 2-tags category: (a) $ {m_{\mathrm {T}}} $ and (b) $\Delta R_{\mathrm{ b } \mathrm{ b } }$ for the muon channel at 7 TeV, (c) $m_{\ell \mathrm {b2}}$ and (d) ${m_{\mathrm {T}}} $ for the muon channel at 8 TeV, and (e) $ {m_{\mathrm {T}}} $ and (f) $ {p_{\mathrm {T}}} ^{\mathrm{ b } \mathrm{ b } }$ for the electron channel at 8 TeV. The simulation is normalized to the data and the multijet background is normalized through the maximum-likelihood fit discussed in Section 6, prior to rejecting the multijet background. The smaller error bands represent only the uncertainties in the background rates, while the larger ones include the total systematic uncertainty obtained from the sum in quadrature of the individual contributions listed in Section 7. |
png pdf |
Figure 2-b:
Comparison between data and simulation in distributions of highest-ranked variables in the 2-jets 2-tags category: (a) $ {m_{\mathrm {T}}} $ and (b) $\Delta R_{\mathrm{ b } \mathrm{ b } }$ for the muon channel at 7 TeV, (c) $m_{\ell \mathrm {b2}}$ and (d) ${m_{\mathrm {T}}} $ for the muon channel at 8 TeV, and (e) $ {m_{\mathrm {T}}} $ and (f) $ {p_{\mathrm {T}}} ^{\mathrm{ b } \mathrm{ b } }$ for the electron channel at 8 TeV. The simulation is normalized to the data and the multijet background is normalized through the maximum-likelihood fit discussed in Section 6, prior to rejecting the multijet background. The smaller error bands represent only the uncertainties in the background rates, while the larger ones include the total systematic uncertainty obtained from the sum in quadrature of the individual contributions listed in Section 7. |
png pdf |
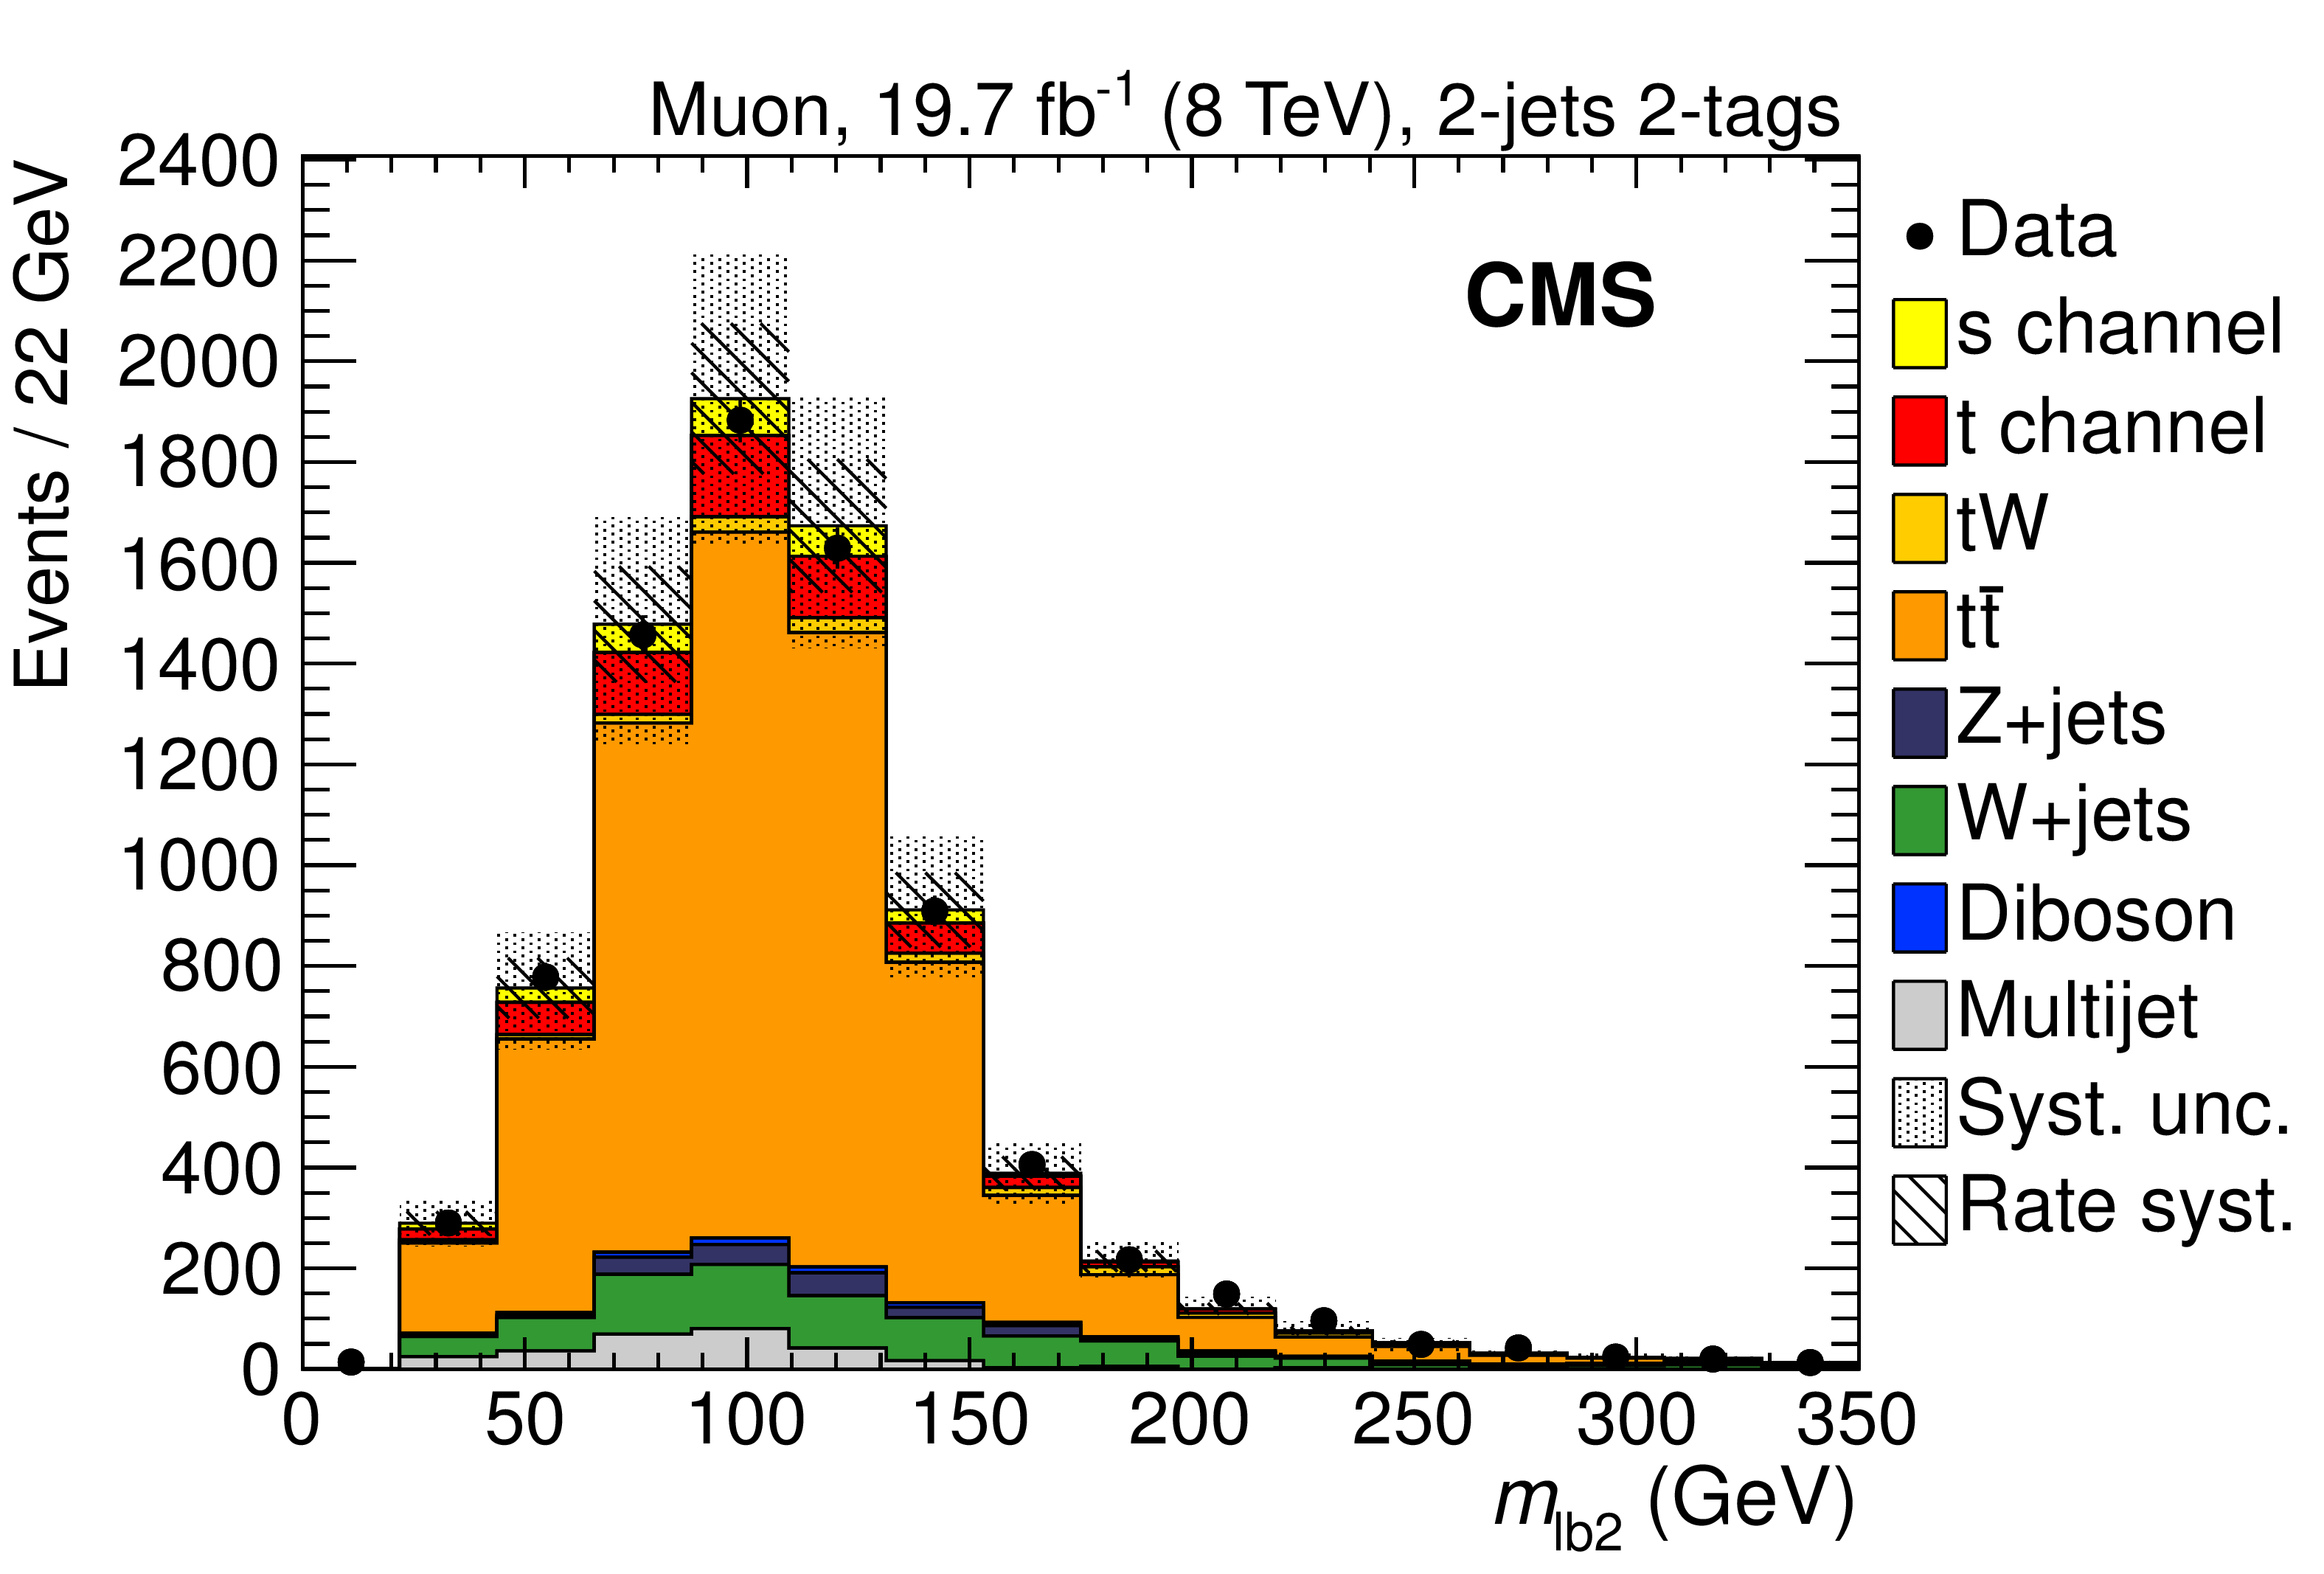
Figure 2-c:
Comparison between data and simulation in distributions of highest-ranked variables in the 2-jets 2-tags category: (a) $ {m_{\mathrm {T}}} $ and (b) $\Delta R_{\mathrm{ b } \mathrm{ b } }$ for the muon channel at 7 TeV, (c) $m_{\ell \mathrm {b2}}$ and (d) ${m_{\mathrm {T}}} $ for the muon channel at 8 TeV, and (e) $ {m_{\mathrm {T}}} $ and (f) $ {p_{\mathrm {T}}} ^{\mathrm{ b } \mathrm{ b } }$ for the electron channel at 8 TeV. The simulation is normalized to the data and the multijet background is normalized through the maximum-likelihood fit discussed in Section 6, prior to rejecting the multijet background. The smaller error bands represent only the uncertainties in the background rates, while the larger ones include the total systematic uncertainty obtained from the sum in quadrature of the individual contributions listed in Section 7. |
png pdf |
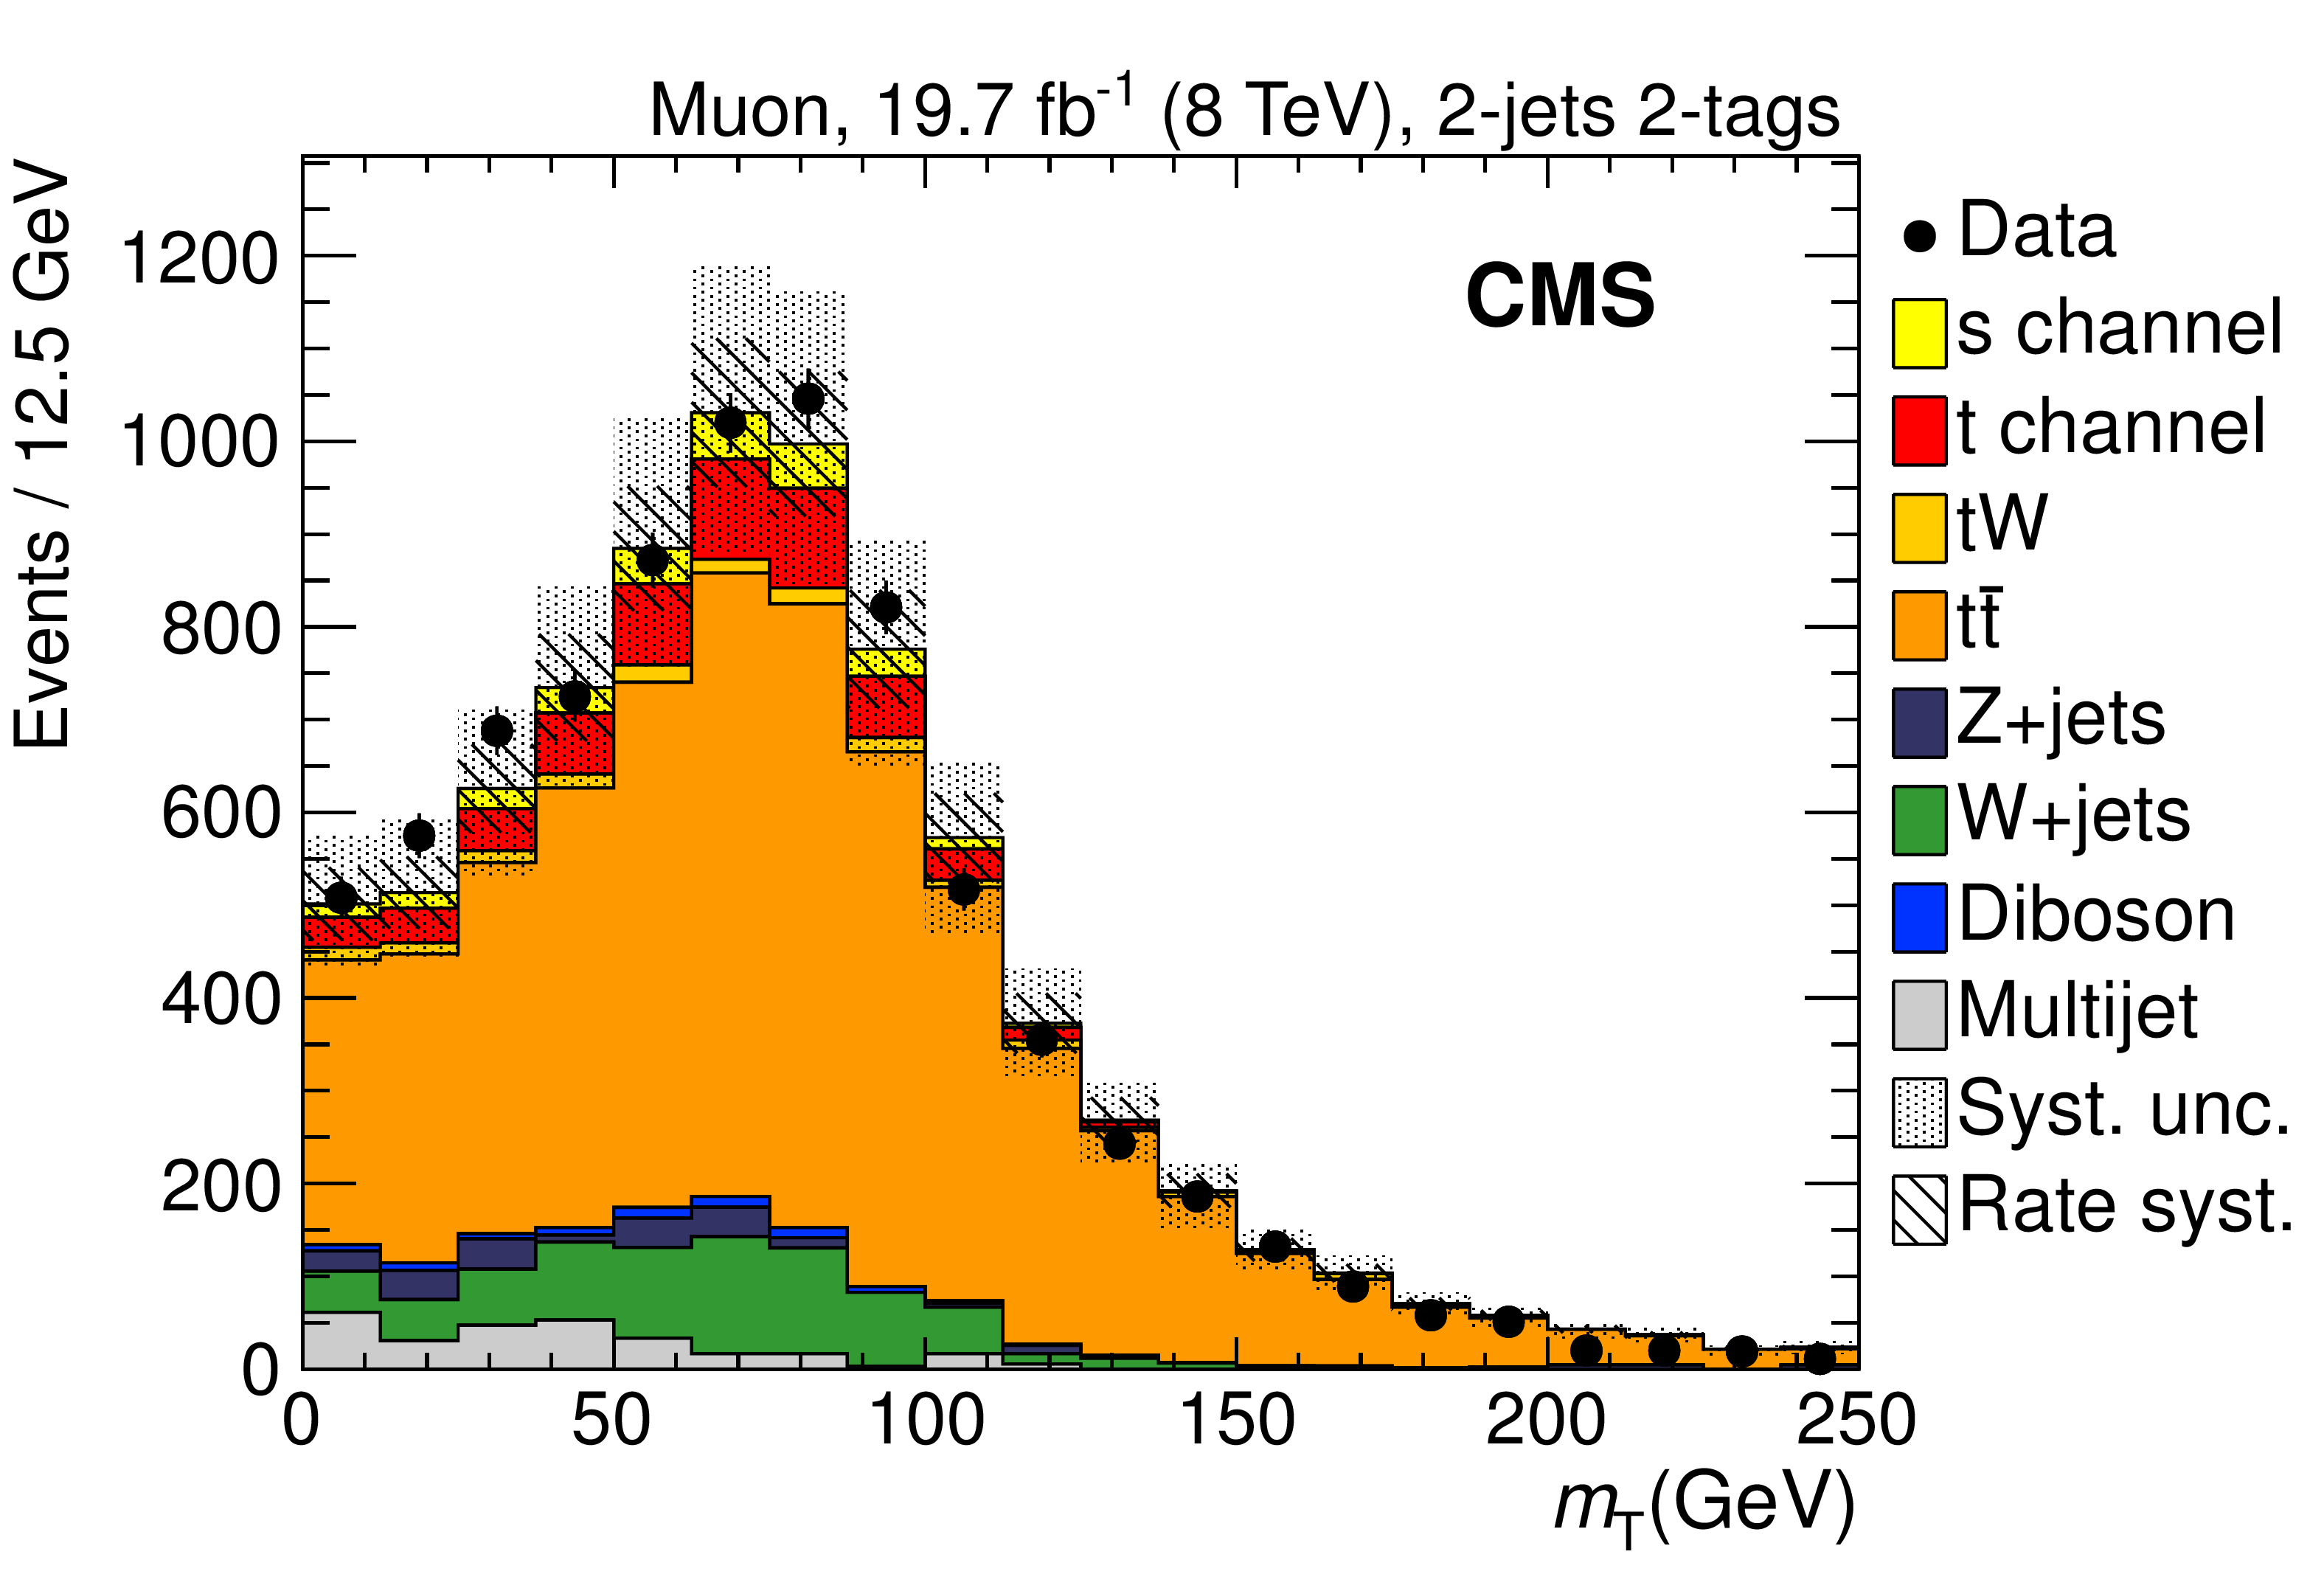
Figure 2-d:
Comparison between data and simulation in distributions of highest-ranked variables in the 2-jets 2-tags category: (a) $ {m_{\mathrm {T}}} $ and (b) $\Delta R_{\mathrm{ b } \mathrm{ b } }$ for the muon channel at 7 TeV, (c) $m_{\ell \mathrm {b2}}$ and (d) ${m_{\mathrm {T}}} $ for the muon channel at 8 TeV, and (e) $ {m_{\mathrm {T}}} $ and (f) $ {p_{\mathrm {T}}} ^{\mathrm{ b } \mathrm{ b } }$ for the electron channel at 8 TeV. The simulation is normalized to the data and the multijet background is normalized through the maximum-likelihood fit discussed in Section 6, prior to rejecting the multijet background. The smaller error bands represent only the uncertainties in the background rates, while the larger ones include the total systematic uncertainty obtained from the sum in quadrature of the individual contributions listed in Section 7. |
png pdf |
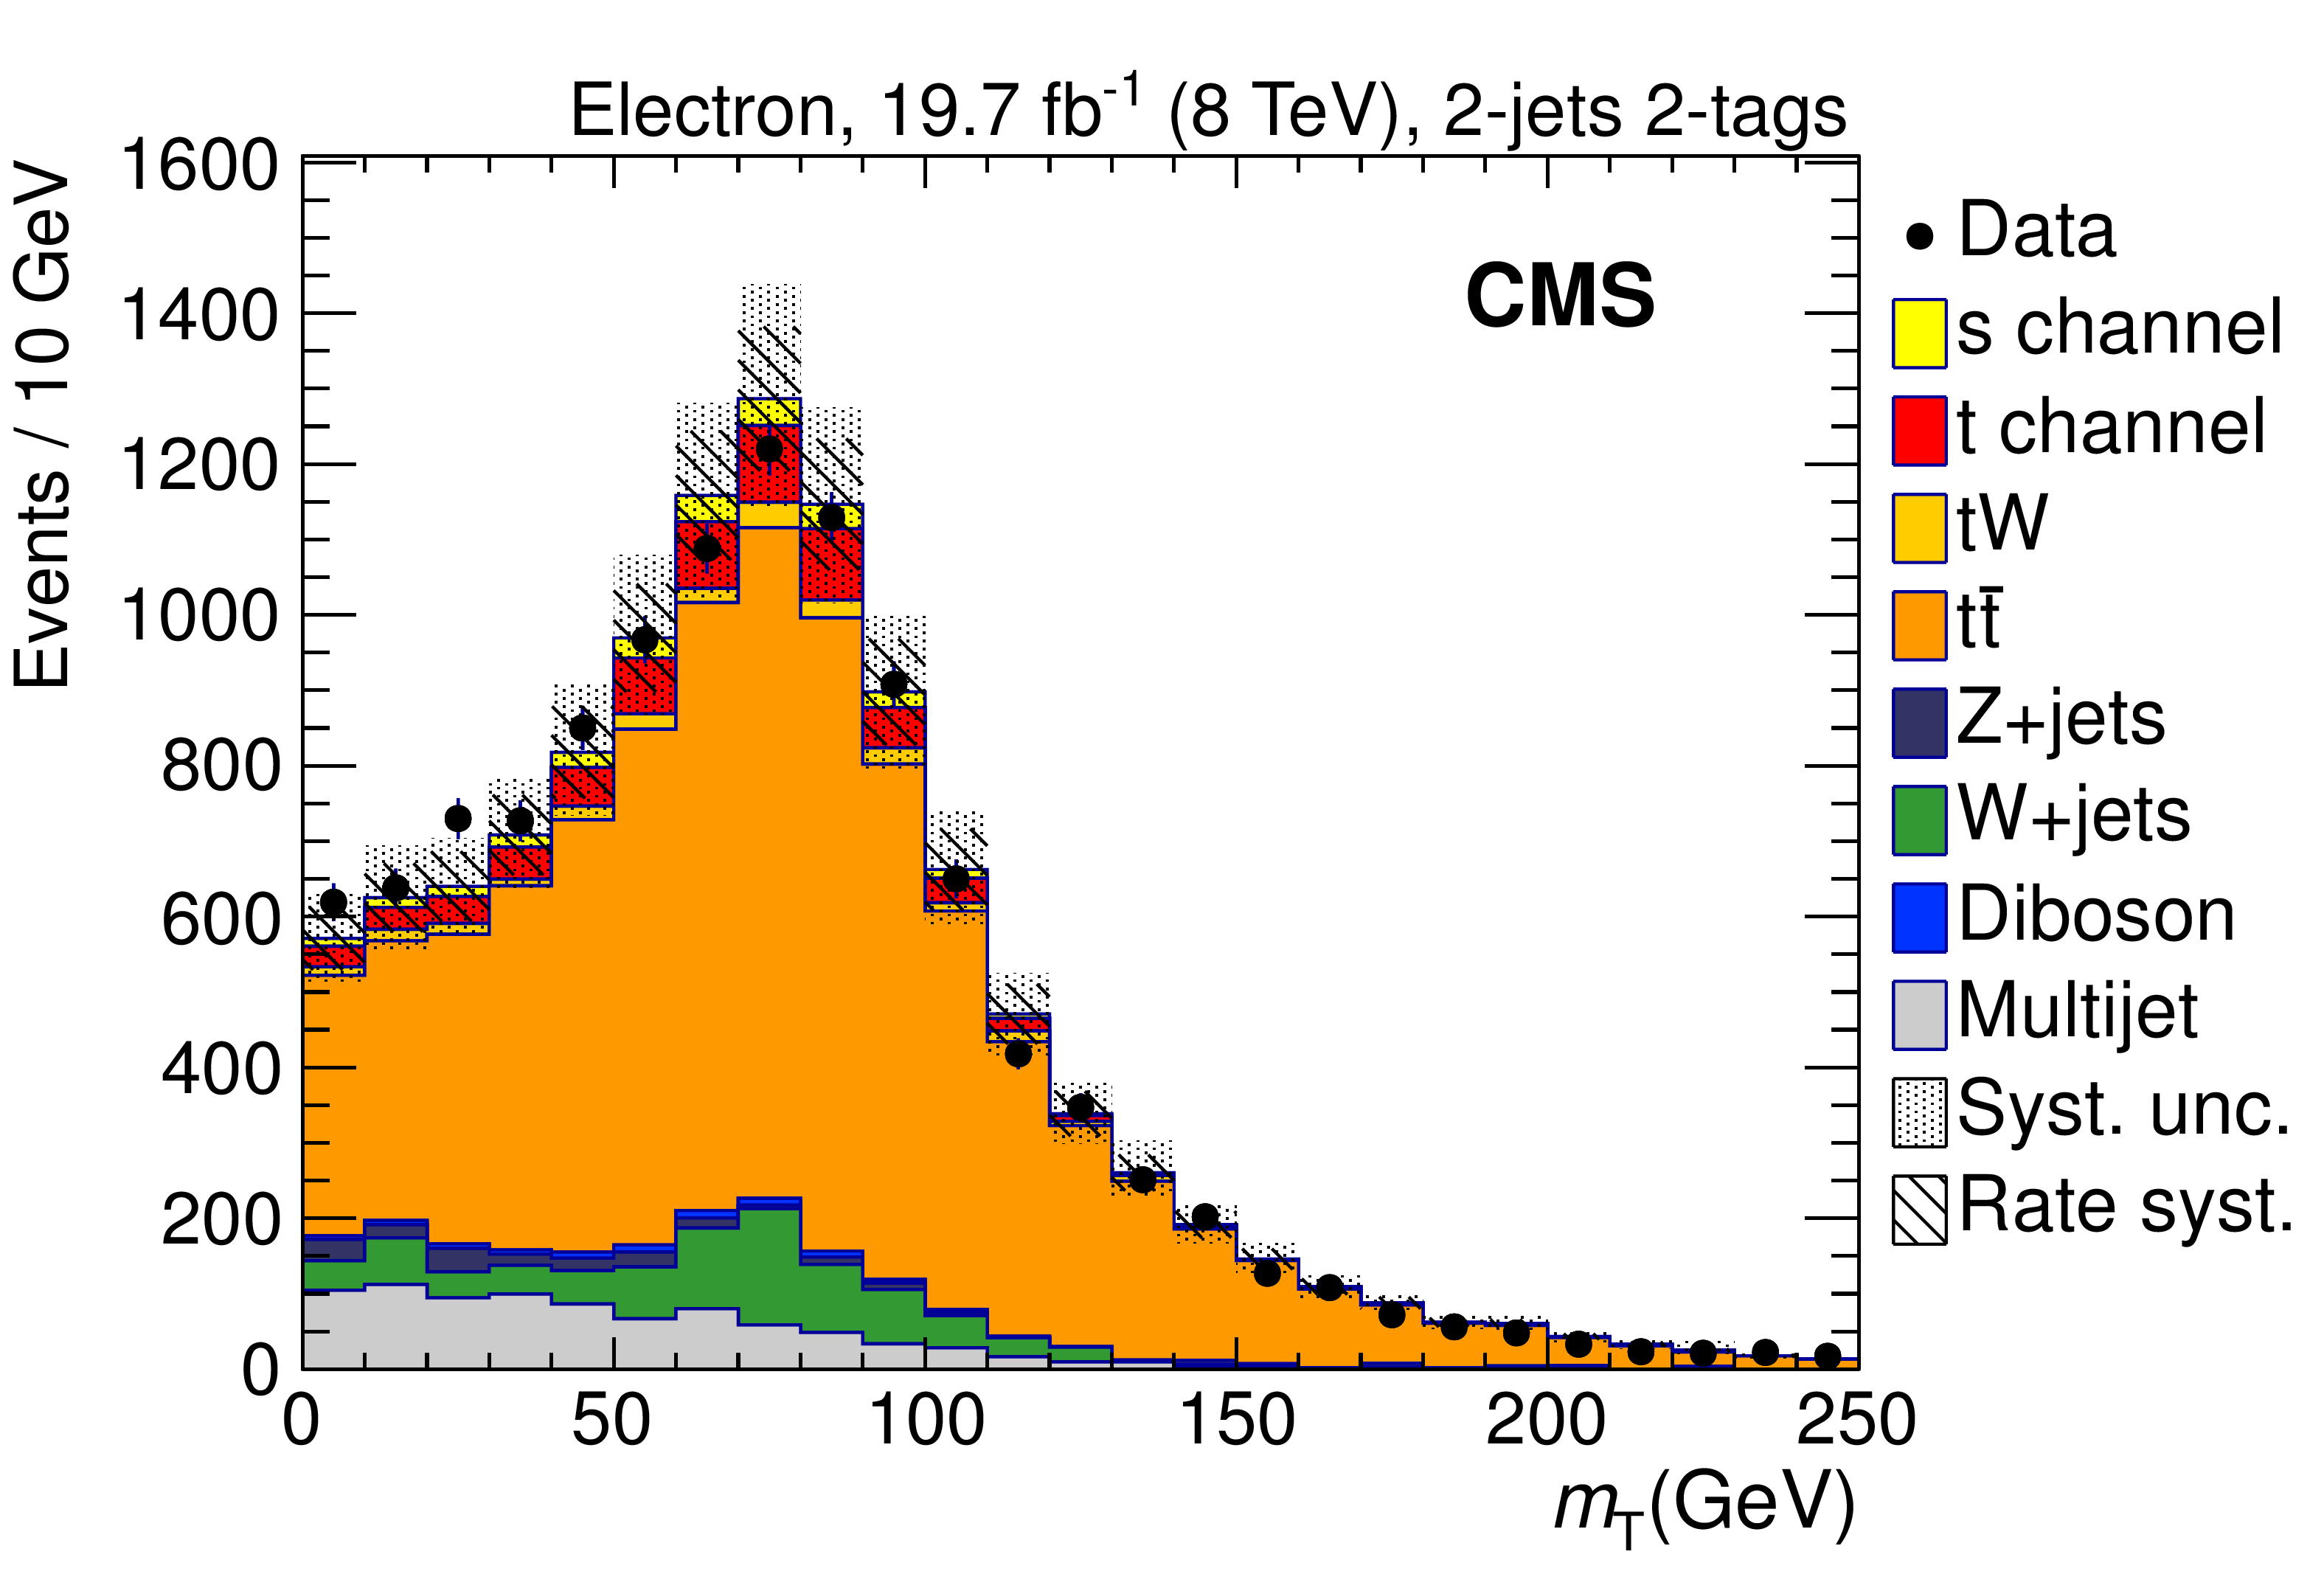
Figure 2-e:
Comparison between data and simulation in distributions of highest-ranked variables in the 2-jets 2-tags category: (a) $ {m_{\mathrm {T}}} $ and (b) $\Delta R_{\mathrm{ b } \mathrm{ b } }$ for the muon channel at 7 TeV, (c) $m_{\ell \mathrm {b2}}$ and (d) ${m_{\mathrm {T}}} $ for the muon channel at 8 TeV, and (e) $ {m_{\mathrm {T}}} $ and (f) $ {p_{\mathrm {T}}} ^{\mathrm{ b } \mathrm{ b } }$ for the electron channel at 8 TeV. The simulation is normalized to the data and the multijet background is normalized through the maximum-likelihood fit discussed in Section 6, prior to rejecting the multijet background. The smaller error bands represent only the uncertainties in the background rates, while the larger ones include the total systematic uncertainty obtained from the sum in quadrature of the individual contributions listed in Section 7. |
png pdf |
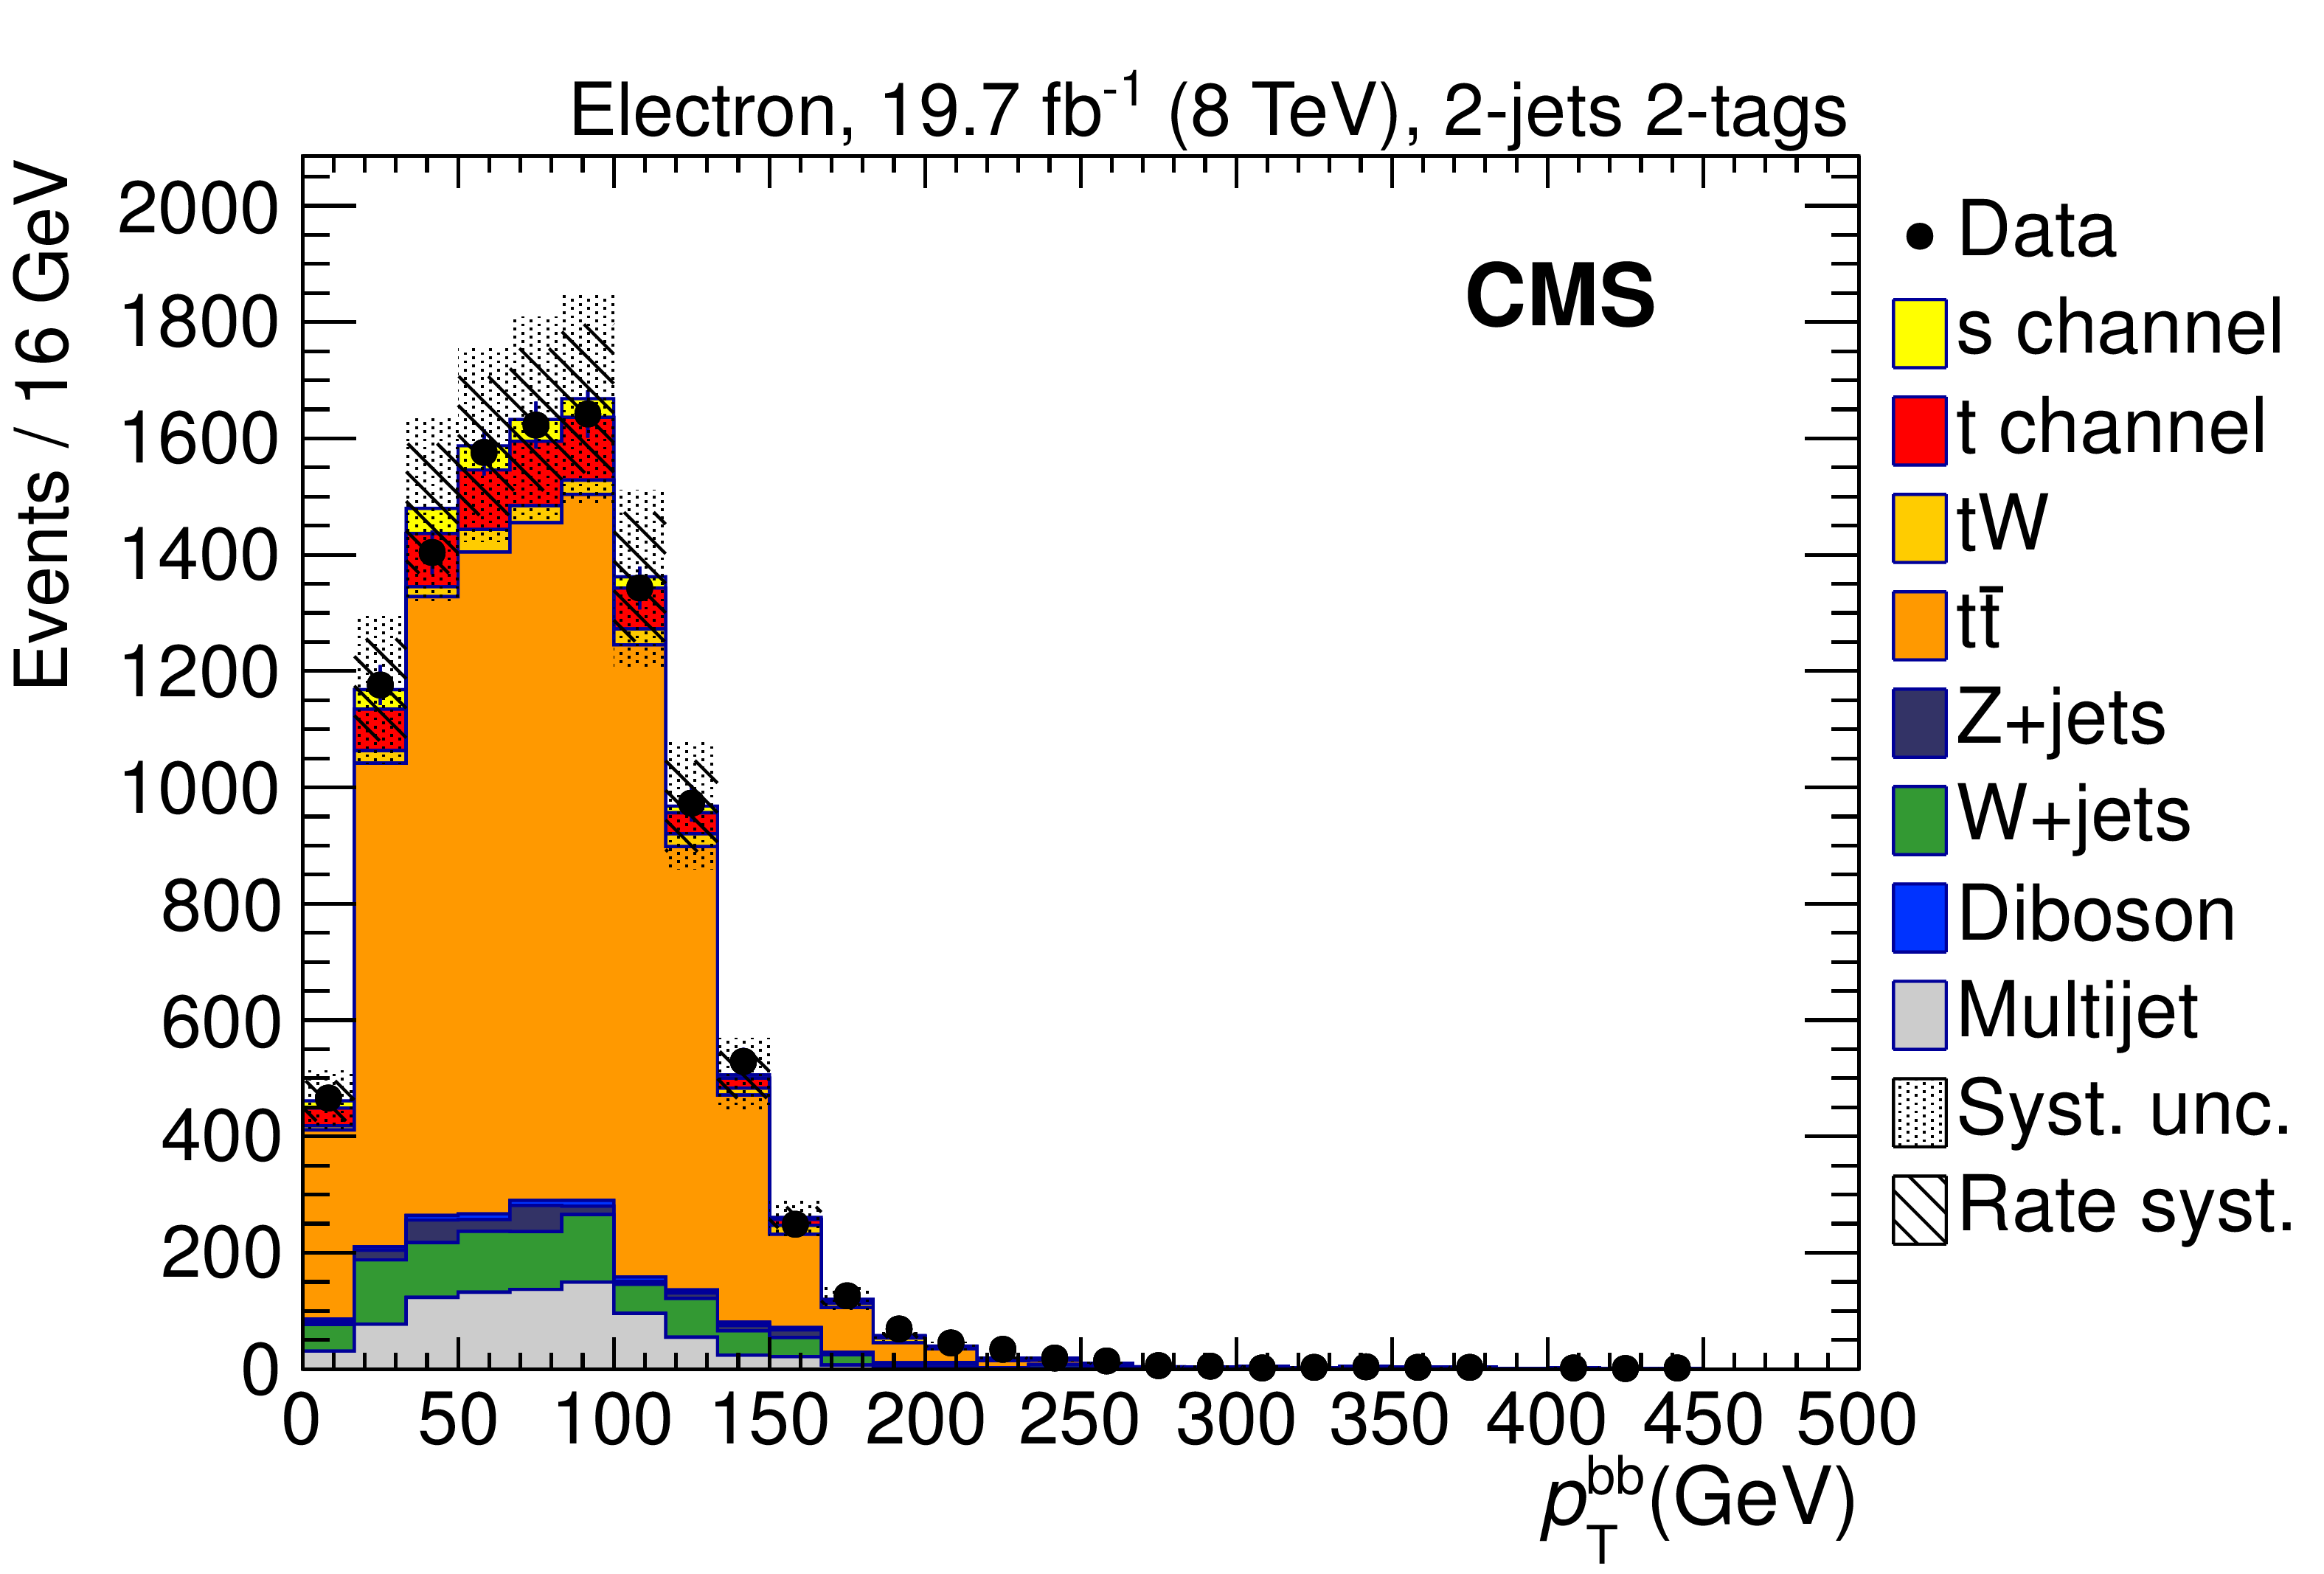
Figure 2-f:
Comparison between data and simulation in distributions of highest-ranked variables in the 2-jets 2-tags category: (a) $ {m_{\mathrm {T}}} $ and (b) $\Delta R_{\mathrm{ b } \mathrm{ b } }$ for the muon channel at 7 TeV, (c) $m_{\ell \mathrm {b2}}$ and (d) ${m_{\mathrm {T}}} $ for the muon channel at 8 TeV, and (e) $ {m_{\mathrm {T}}} $ and (f) $ {p_{\mathrm {T}}} ^{\mathrm{ b } \mathrm{ b } }$ for the electron channel at 8 TeV. The simulation is normalized to the data and the multijet background is normalized through the maximum-likelihood fit discussed in Section 6, prior to rejecting the multijet background. The smaller error bands represent only the uncertainties in the background rates, while the larger ones include the total systematic uncertainty obtained from the sum in quadrature of the individual contributions listed in Section 7. |
png pdf |
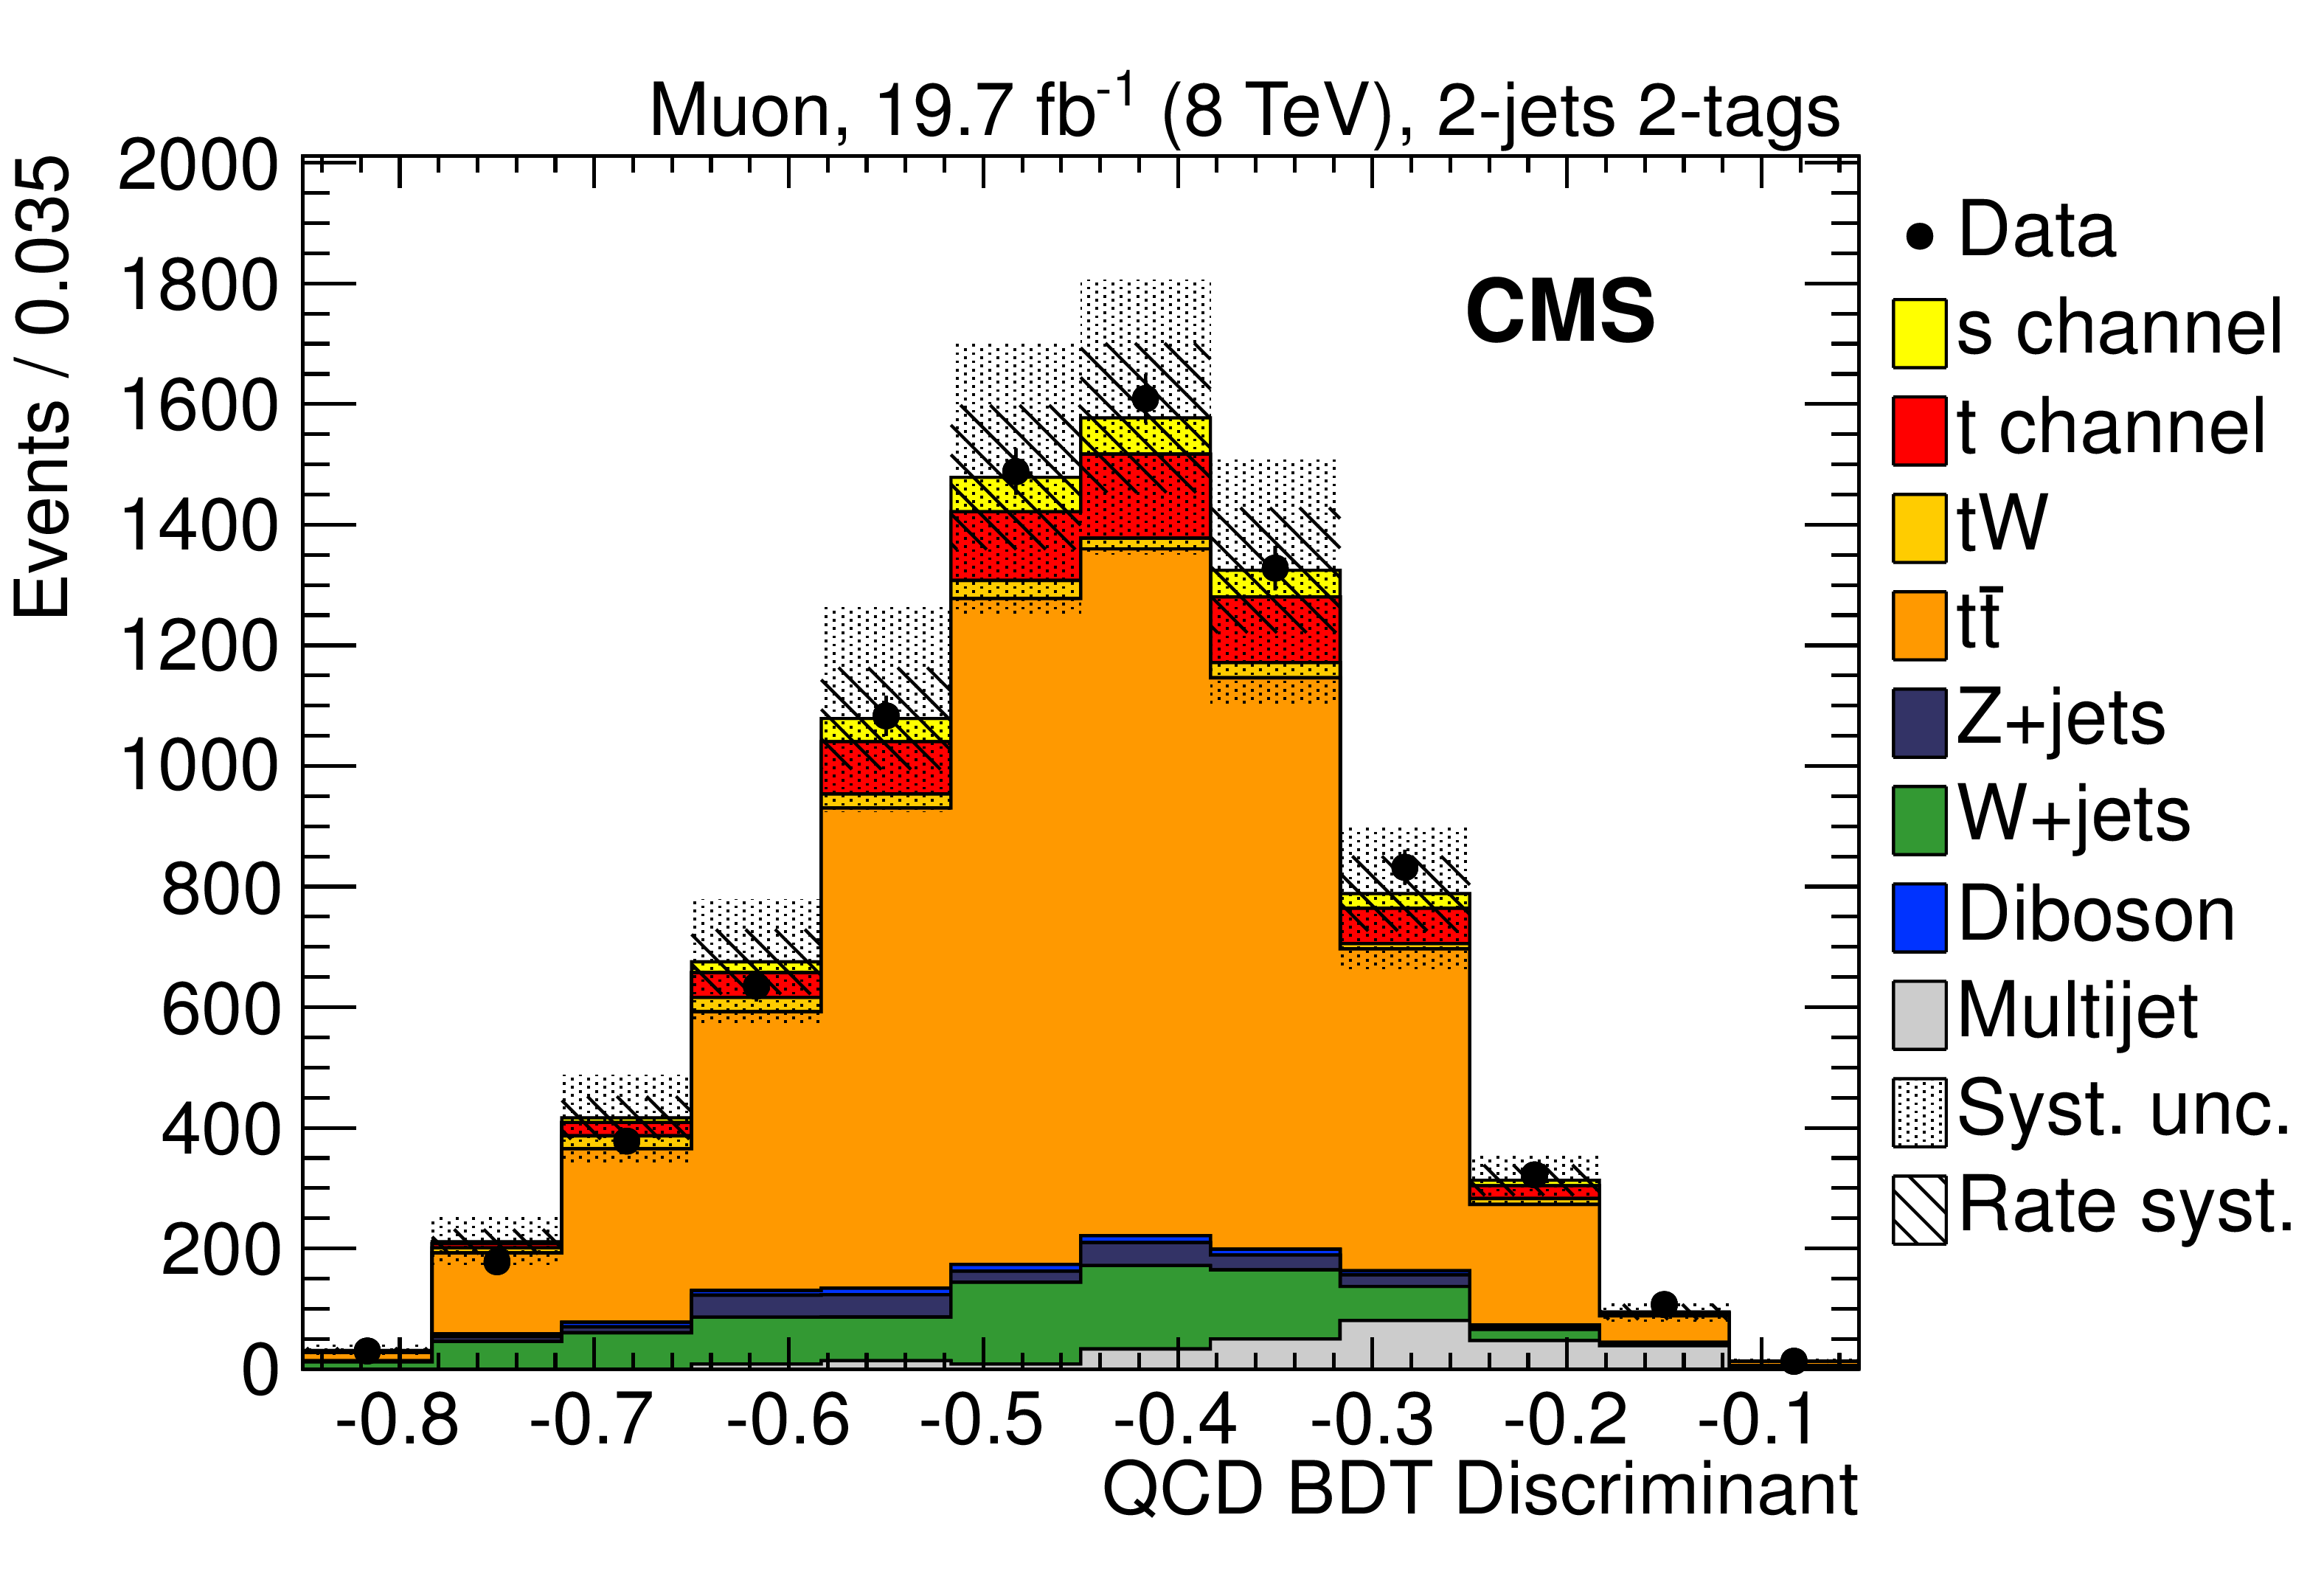
Figure 3-a:
Comparison of data with simulation for distributions in the QCD BDT discriminant in the 2-jets 2-tags event category, in (a) the muon and (b) electron channel at 8 TeV. The simulation is normalized to the data. While the smaller error bands include the uncertainties in background rates only, the larger ones include the total systematic uncertainty obtained summing in quadrature the individual contributions discussed in Section 7. |
png pdf |
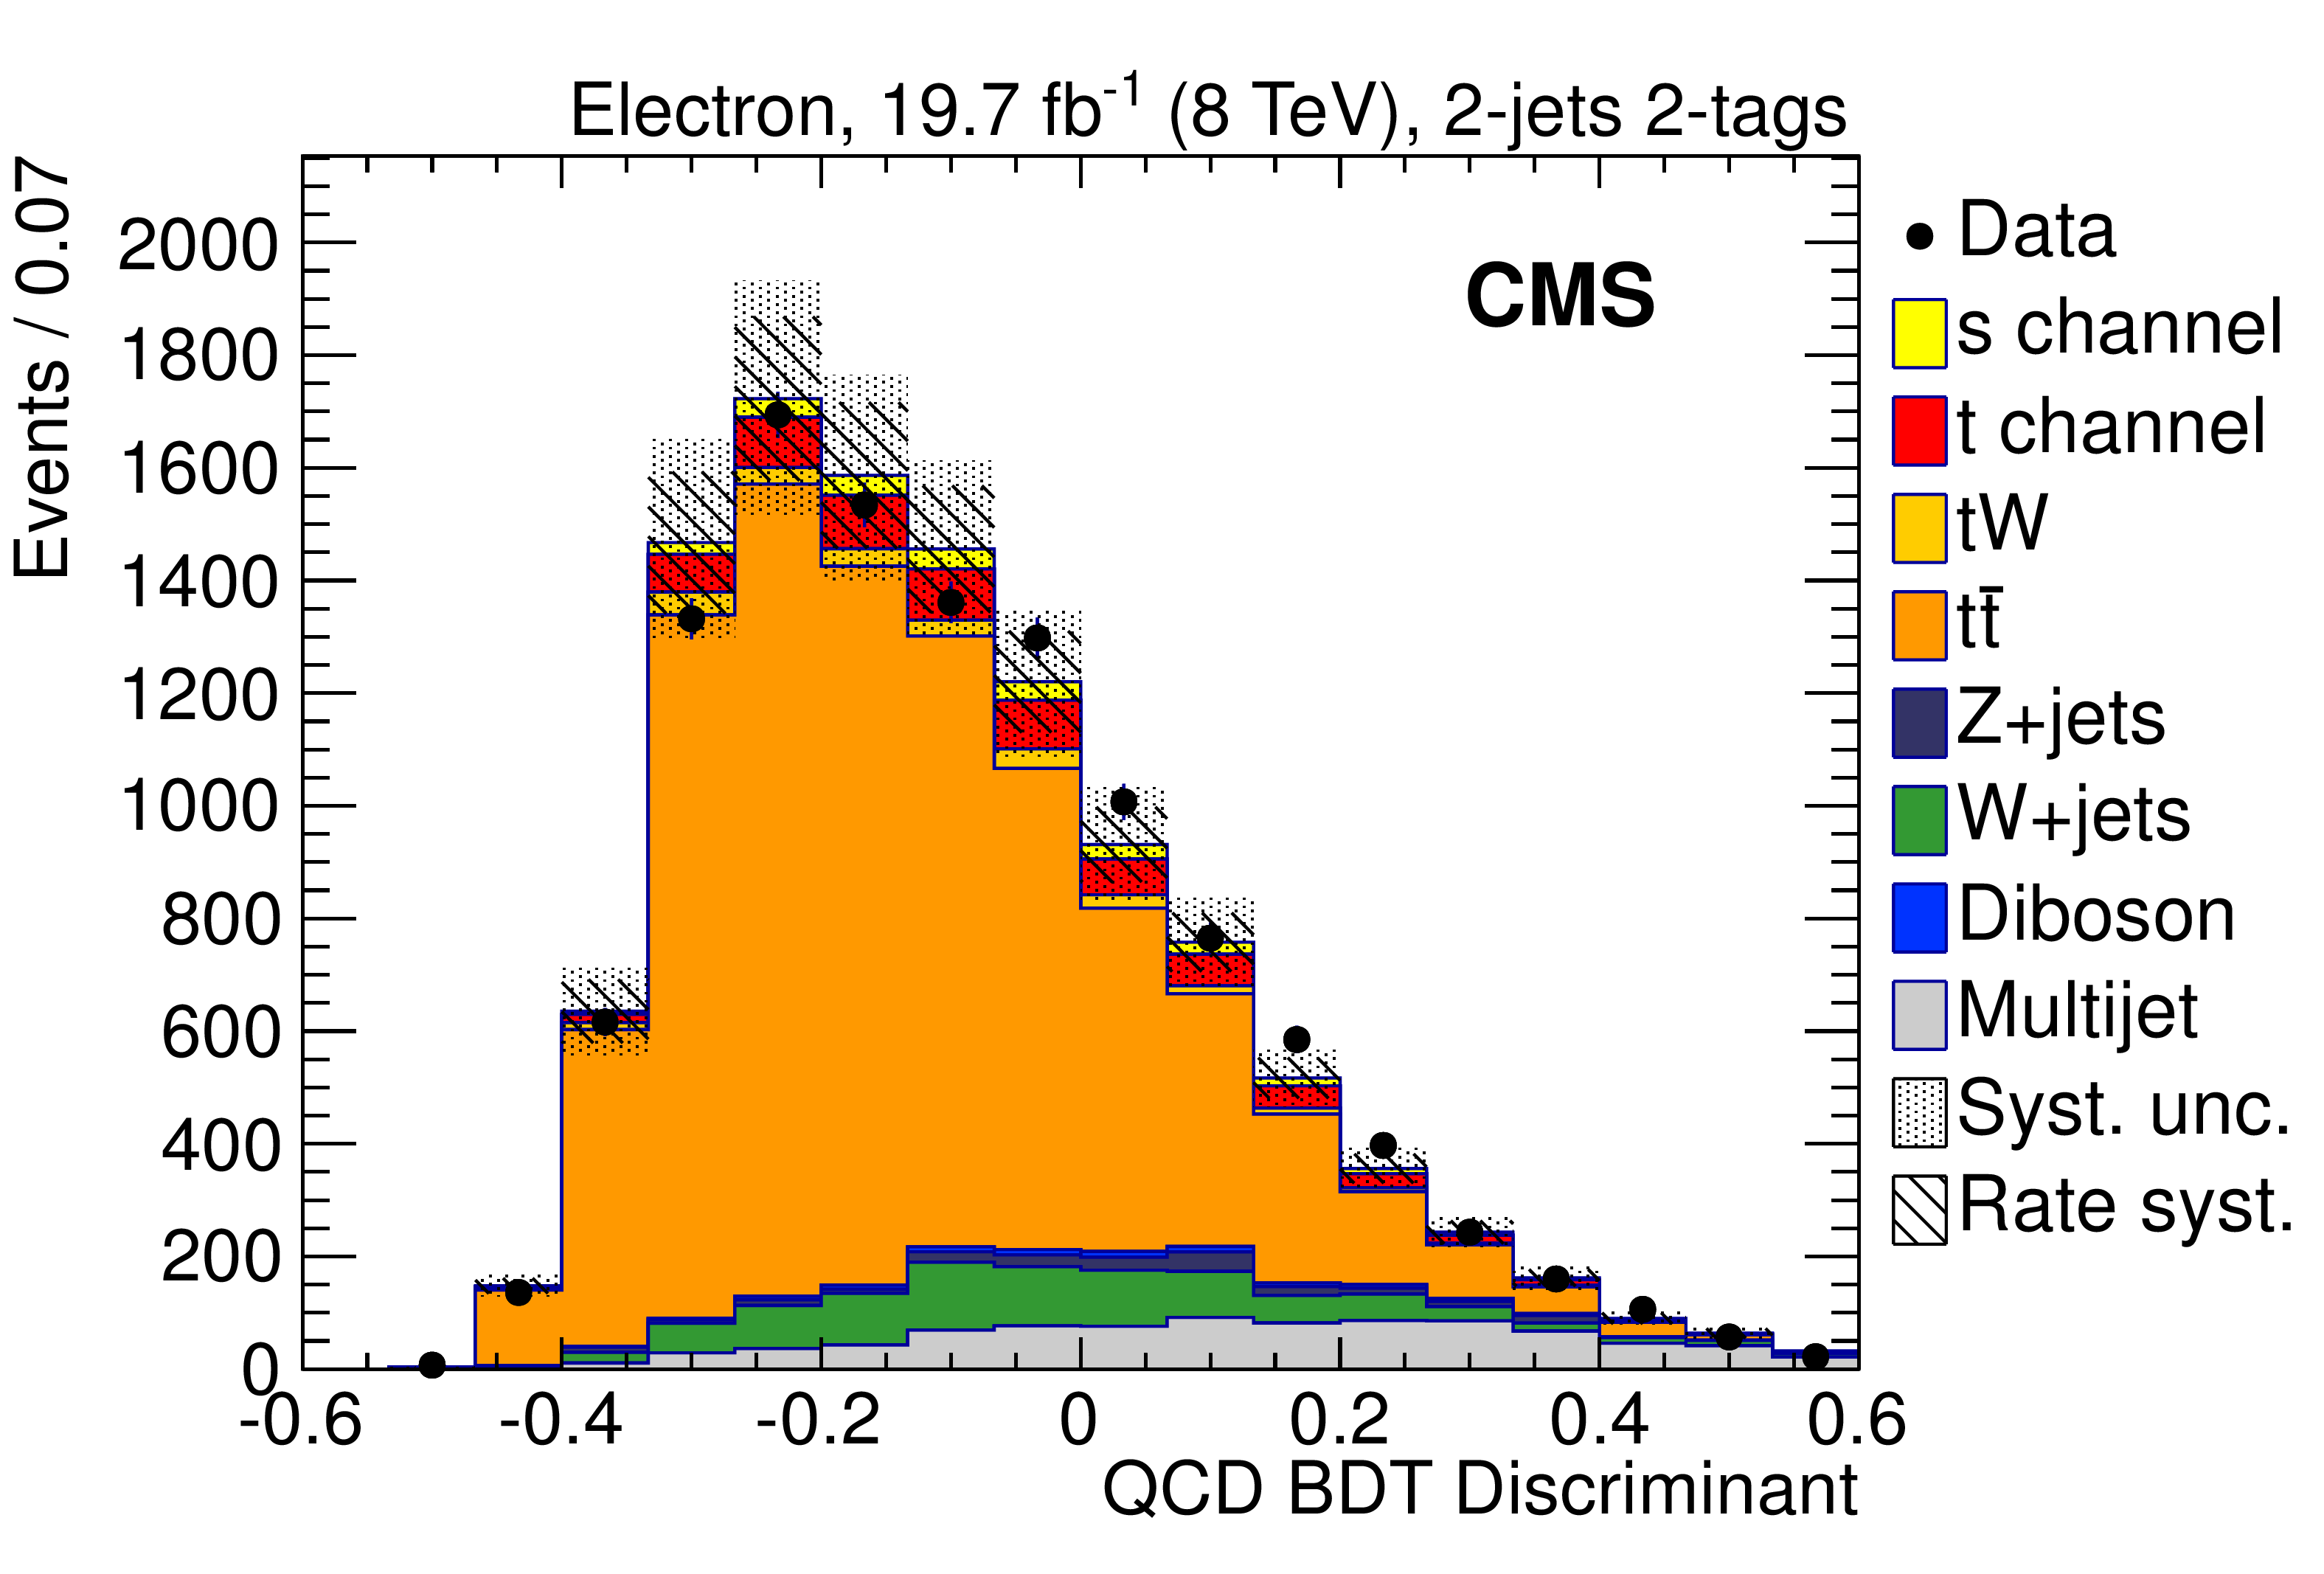
Figure 3-b:
Comparison of data with simulation for distributions in the QCD BDT discriminant in the 2-jets 2-tags event category, in (a) the muon and (b) electron channel at 8 TeV. The simulation is normalized to the data. While the smaller error bands include the uncertainties in background rates only, the larger ones include the total systematic uncertainty obtained summing in quadrature the individual contributions discussed in Section 7. |
png pdf |
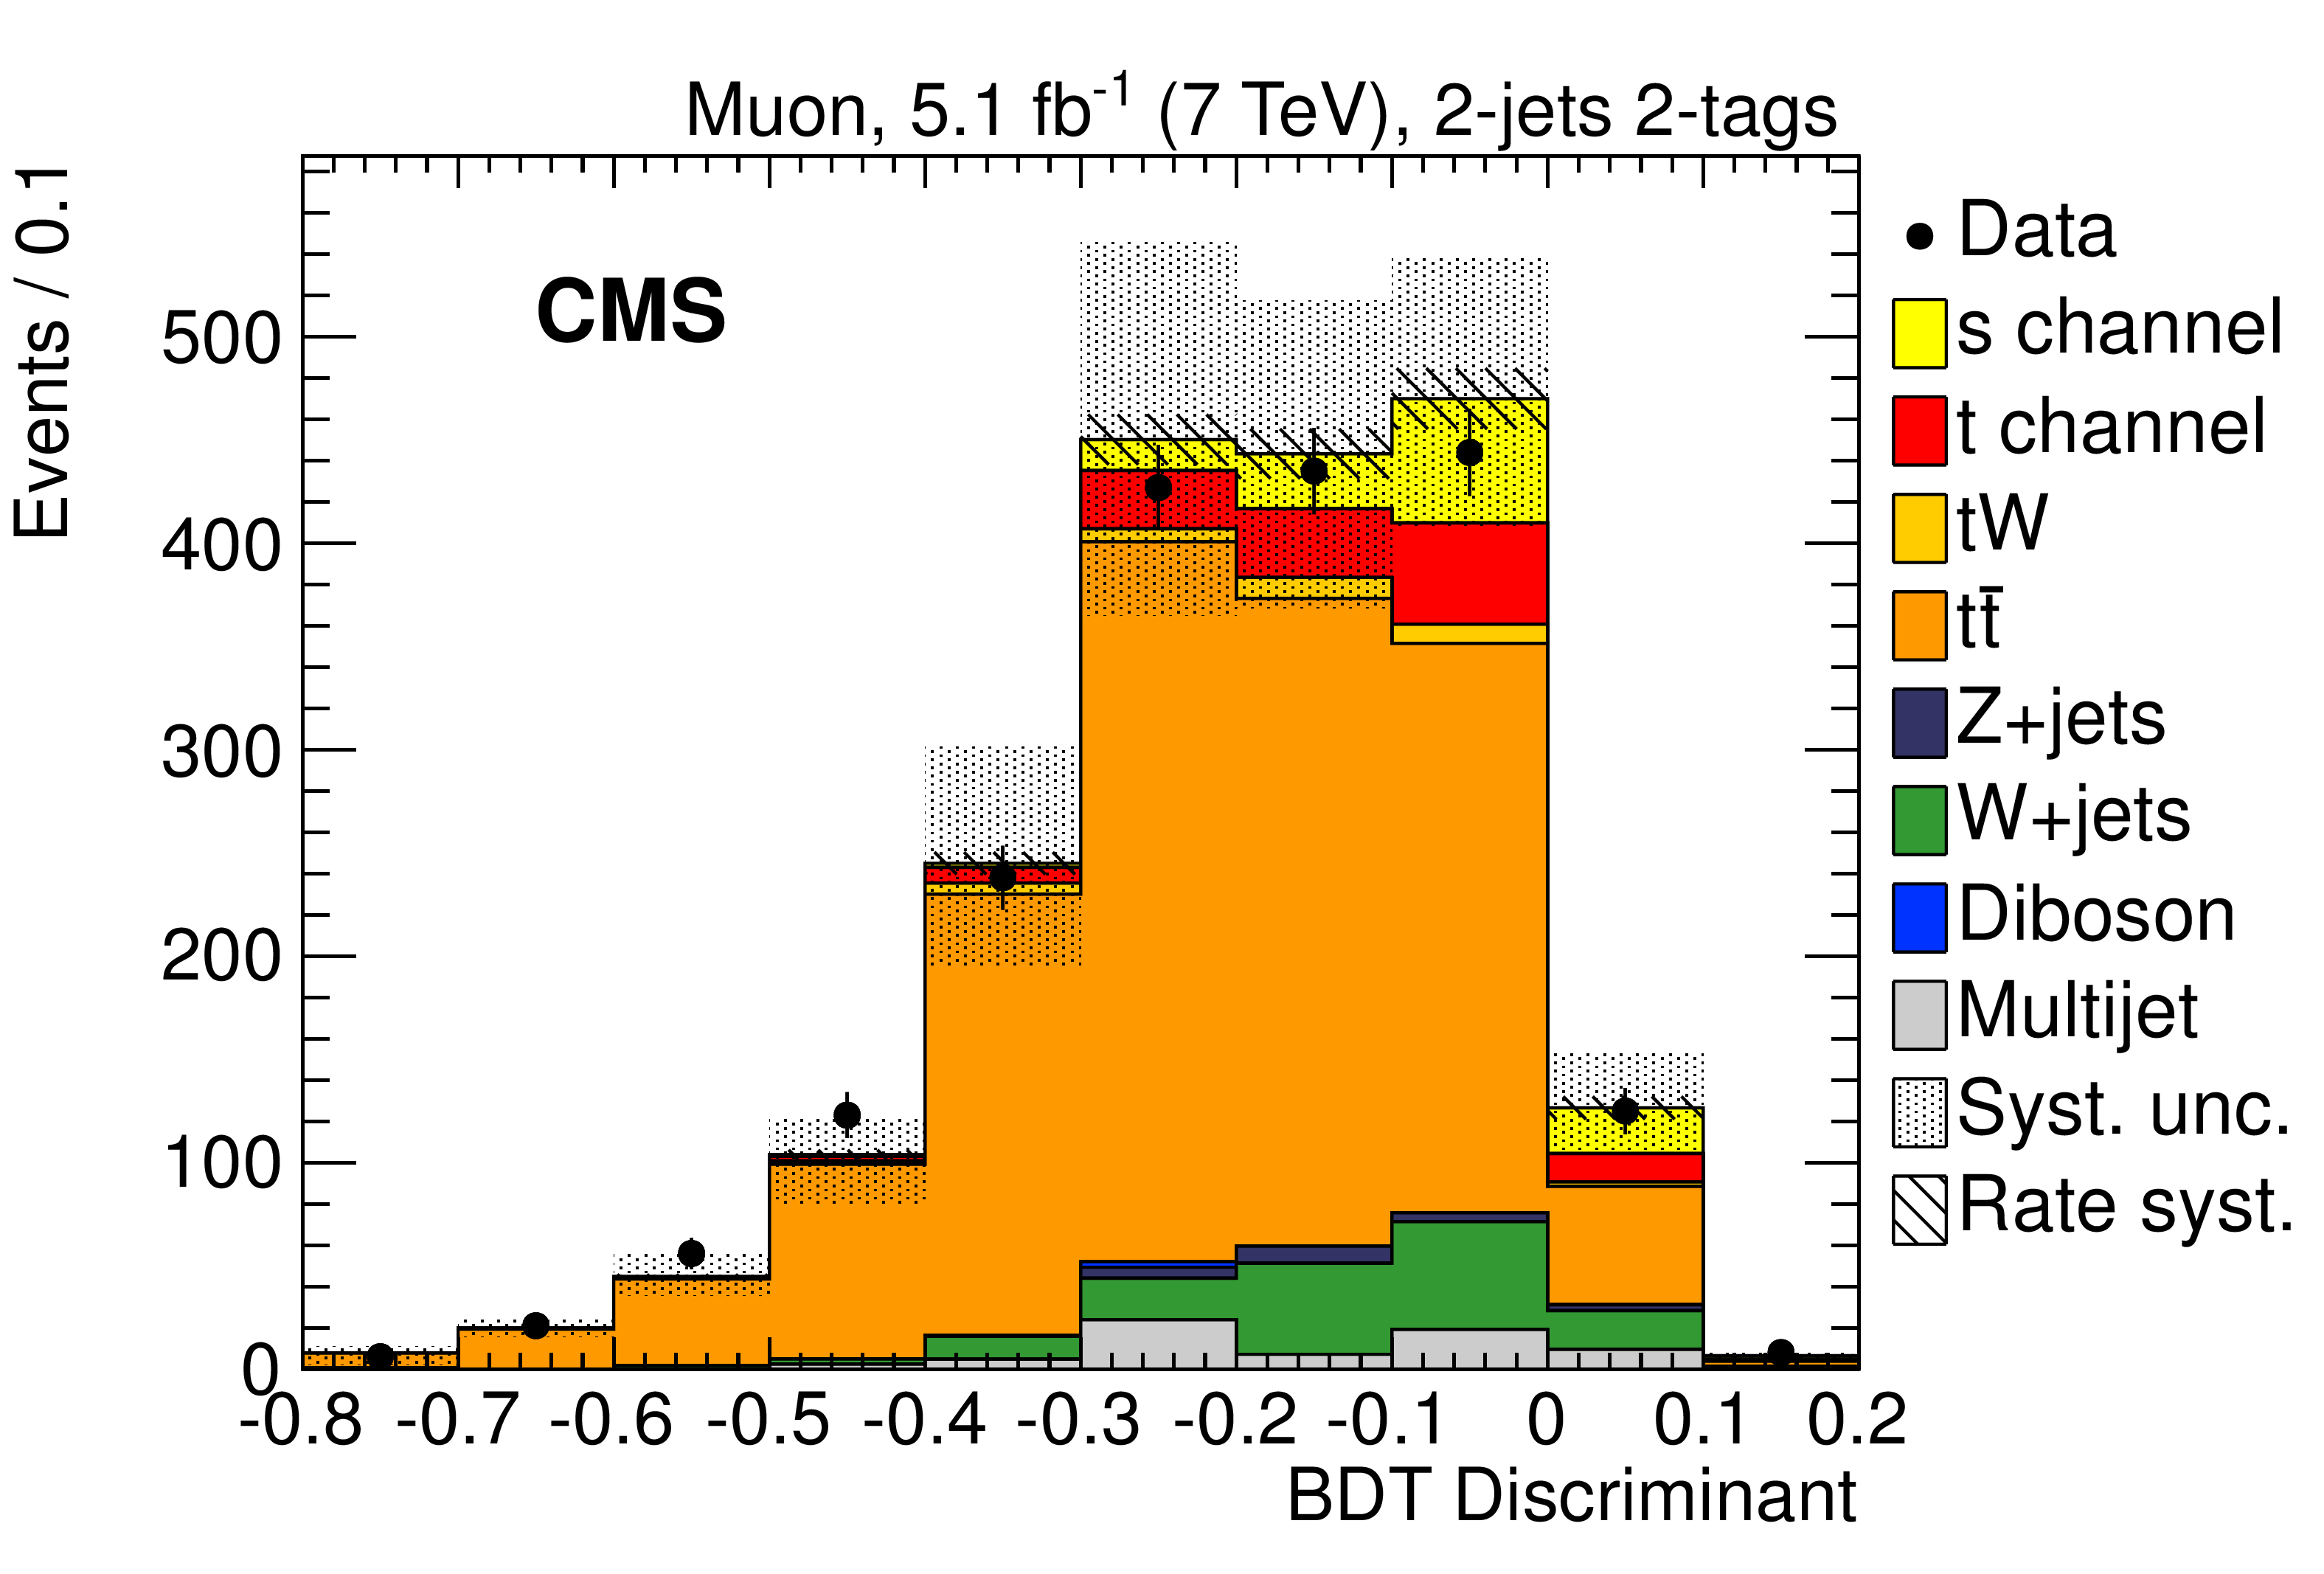
Figure 4-a:
Comparison of data with simulation for distributions of the BDT discriminants in the (a) 2-jets 2-tags, (b) 2-jets 1-tag, and (c) 3-jets 2-tags event category, for the muon channel at 7 TeV. The simulation is normalized to the combined (7+8 TeV) fit results. The inner uncertainty bands include the post-fit background rate uncertainties only, the outer ones include the total systematic uncertainty obtained summing in quadrature the individual contributions. |
png pdf |
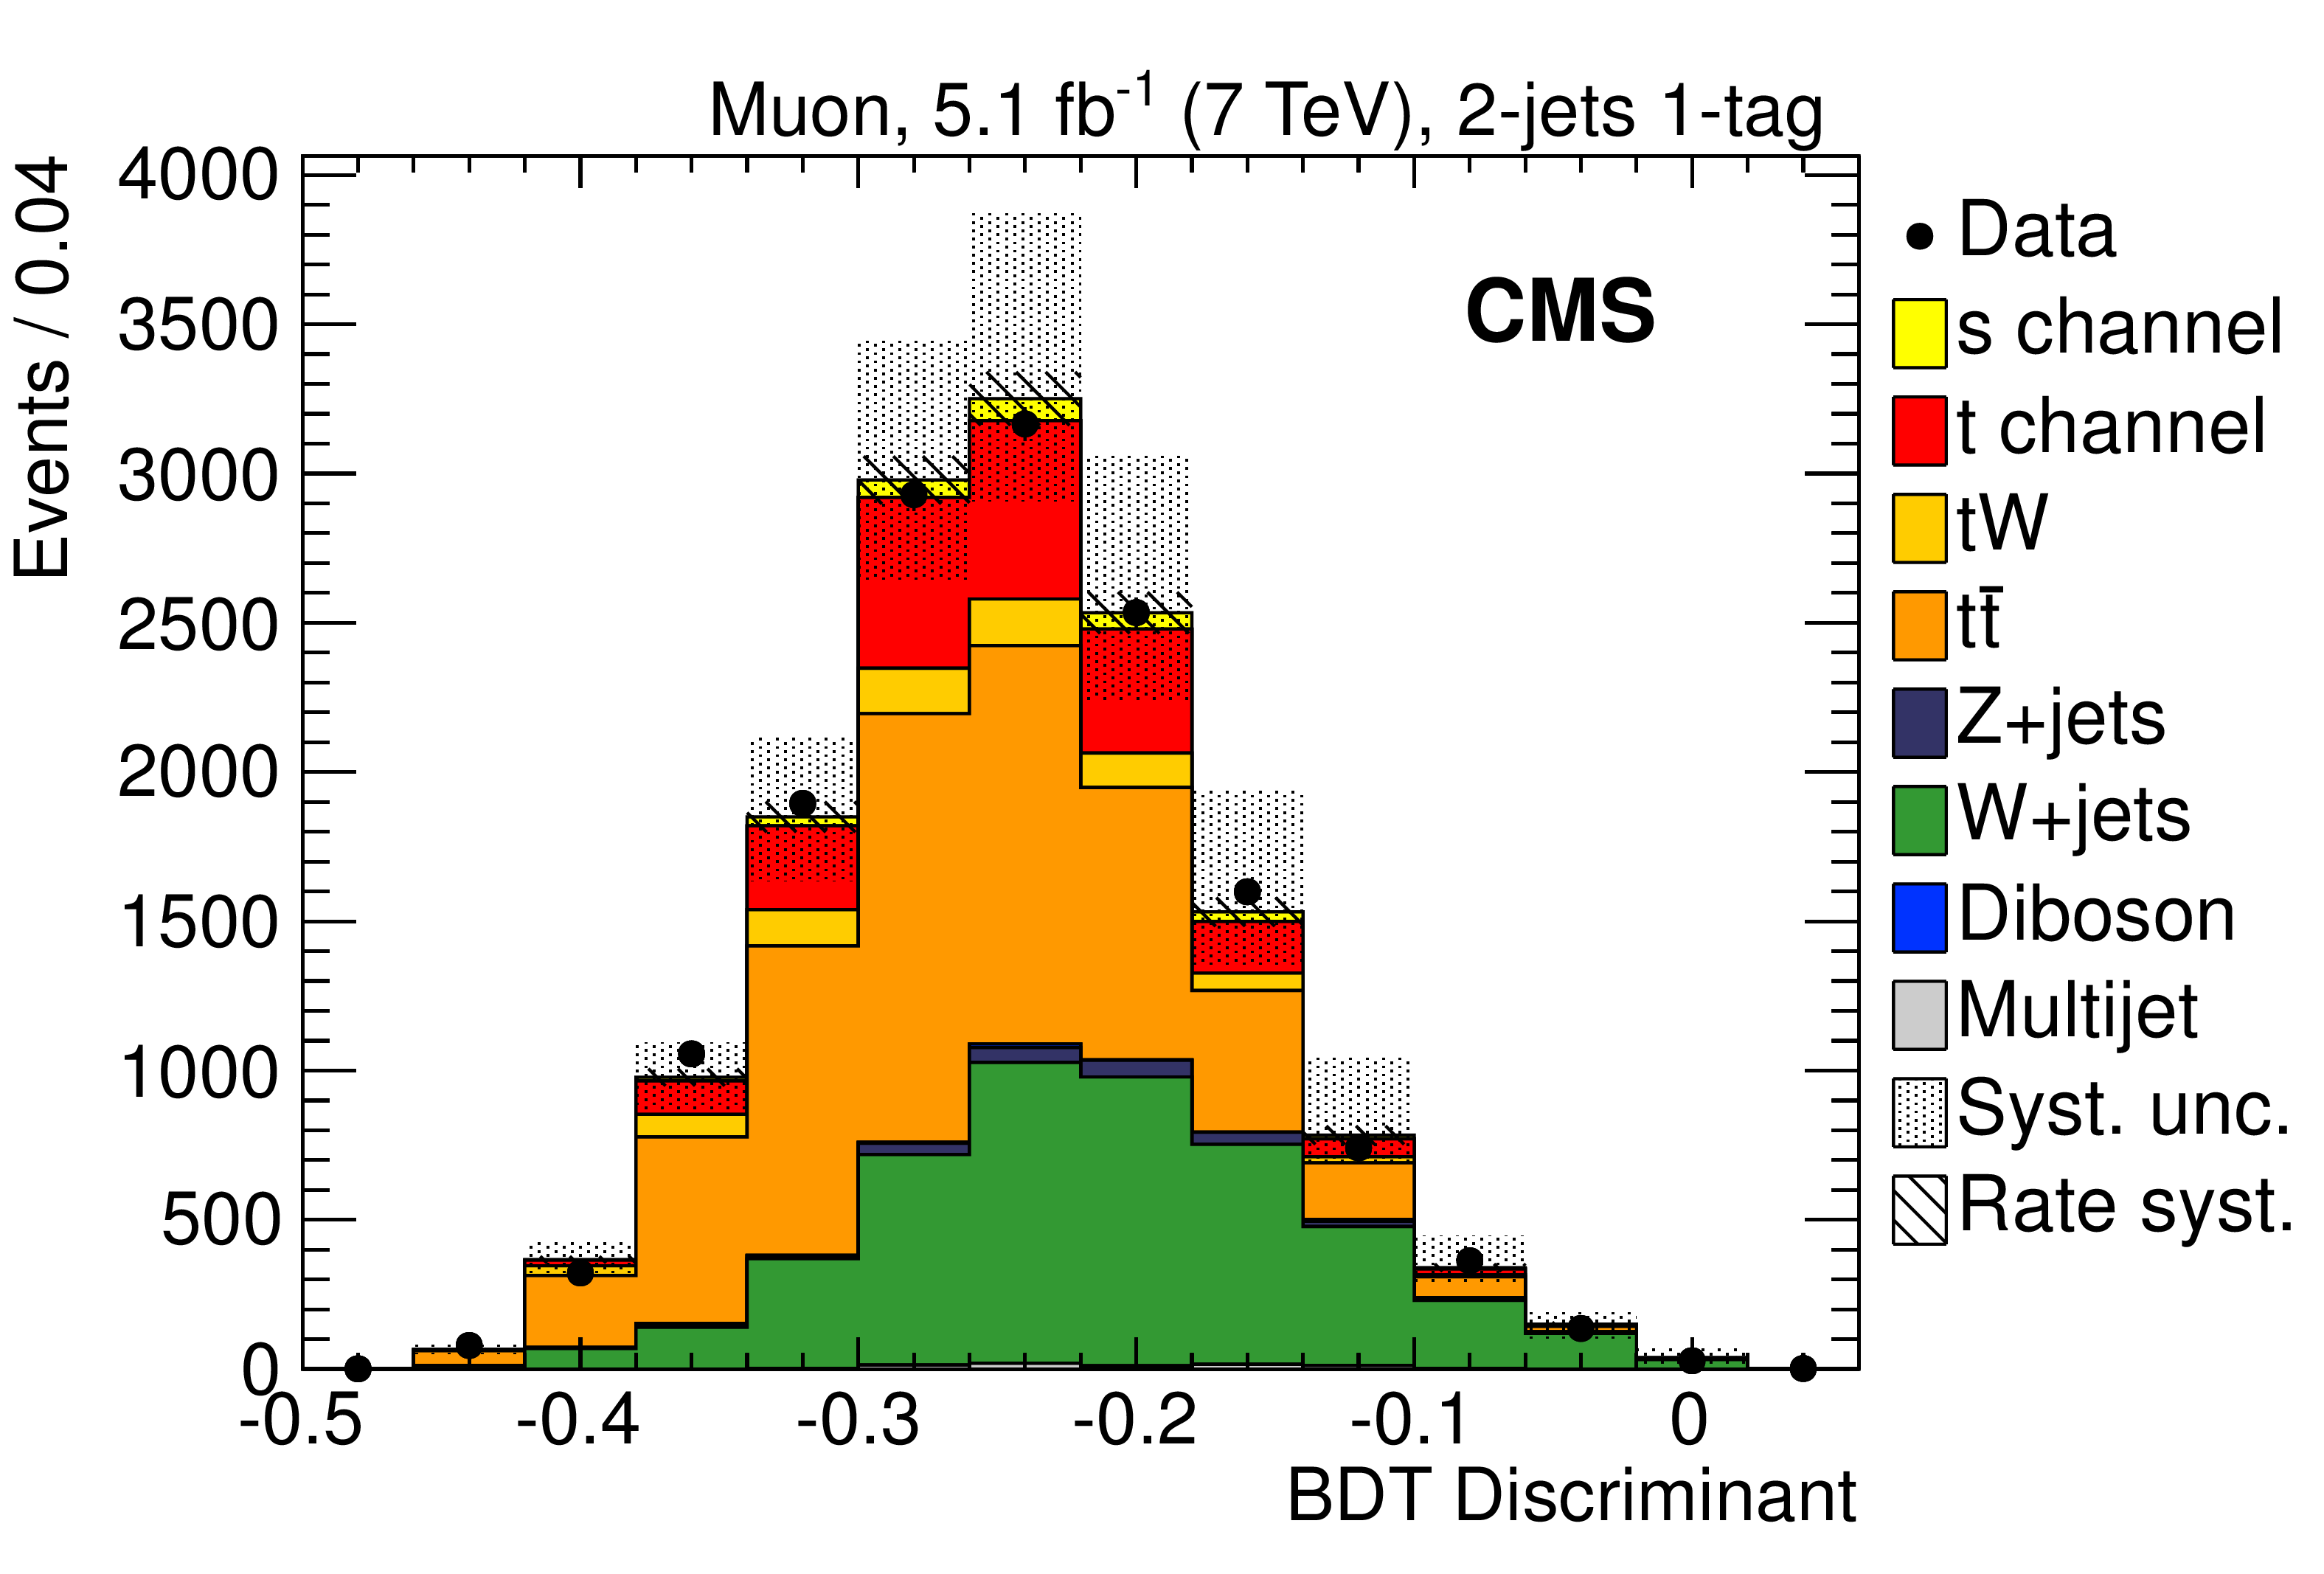
Figure 4-b:
Comparison of data with simulation for distributions of the BDT discriminants in the (a) 2-jets 2-tags, (b) 2-jets 1-tag, and (c) 3-jets 2-tags event category, for the muon channel at 7 TeV. The simulation is normalized to the combined (7+8 TeV) fit results. The inner uncertainty bands include the post-fit background rate uncertainties only, the outer ones include the total systematic uncertainty obtained summing in quadrature the individual contributions. |
png pdf |
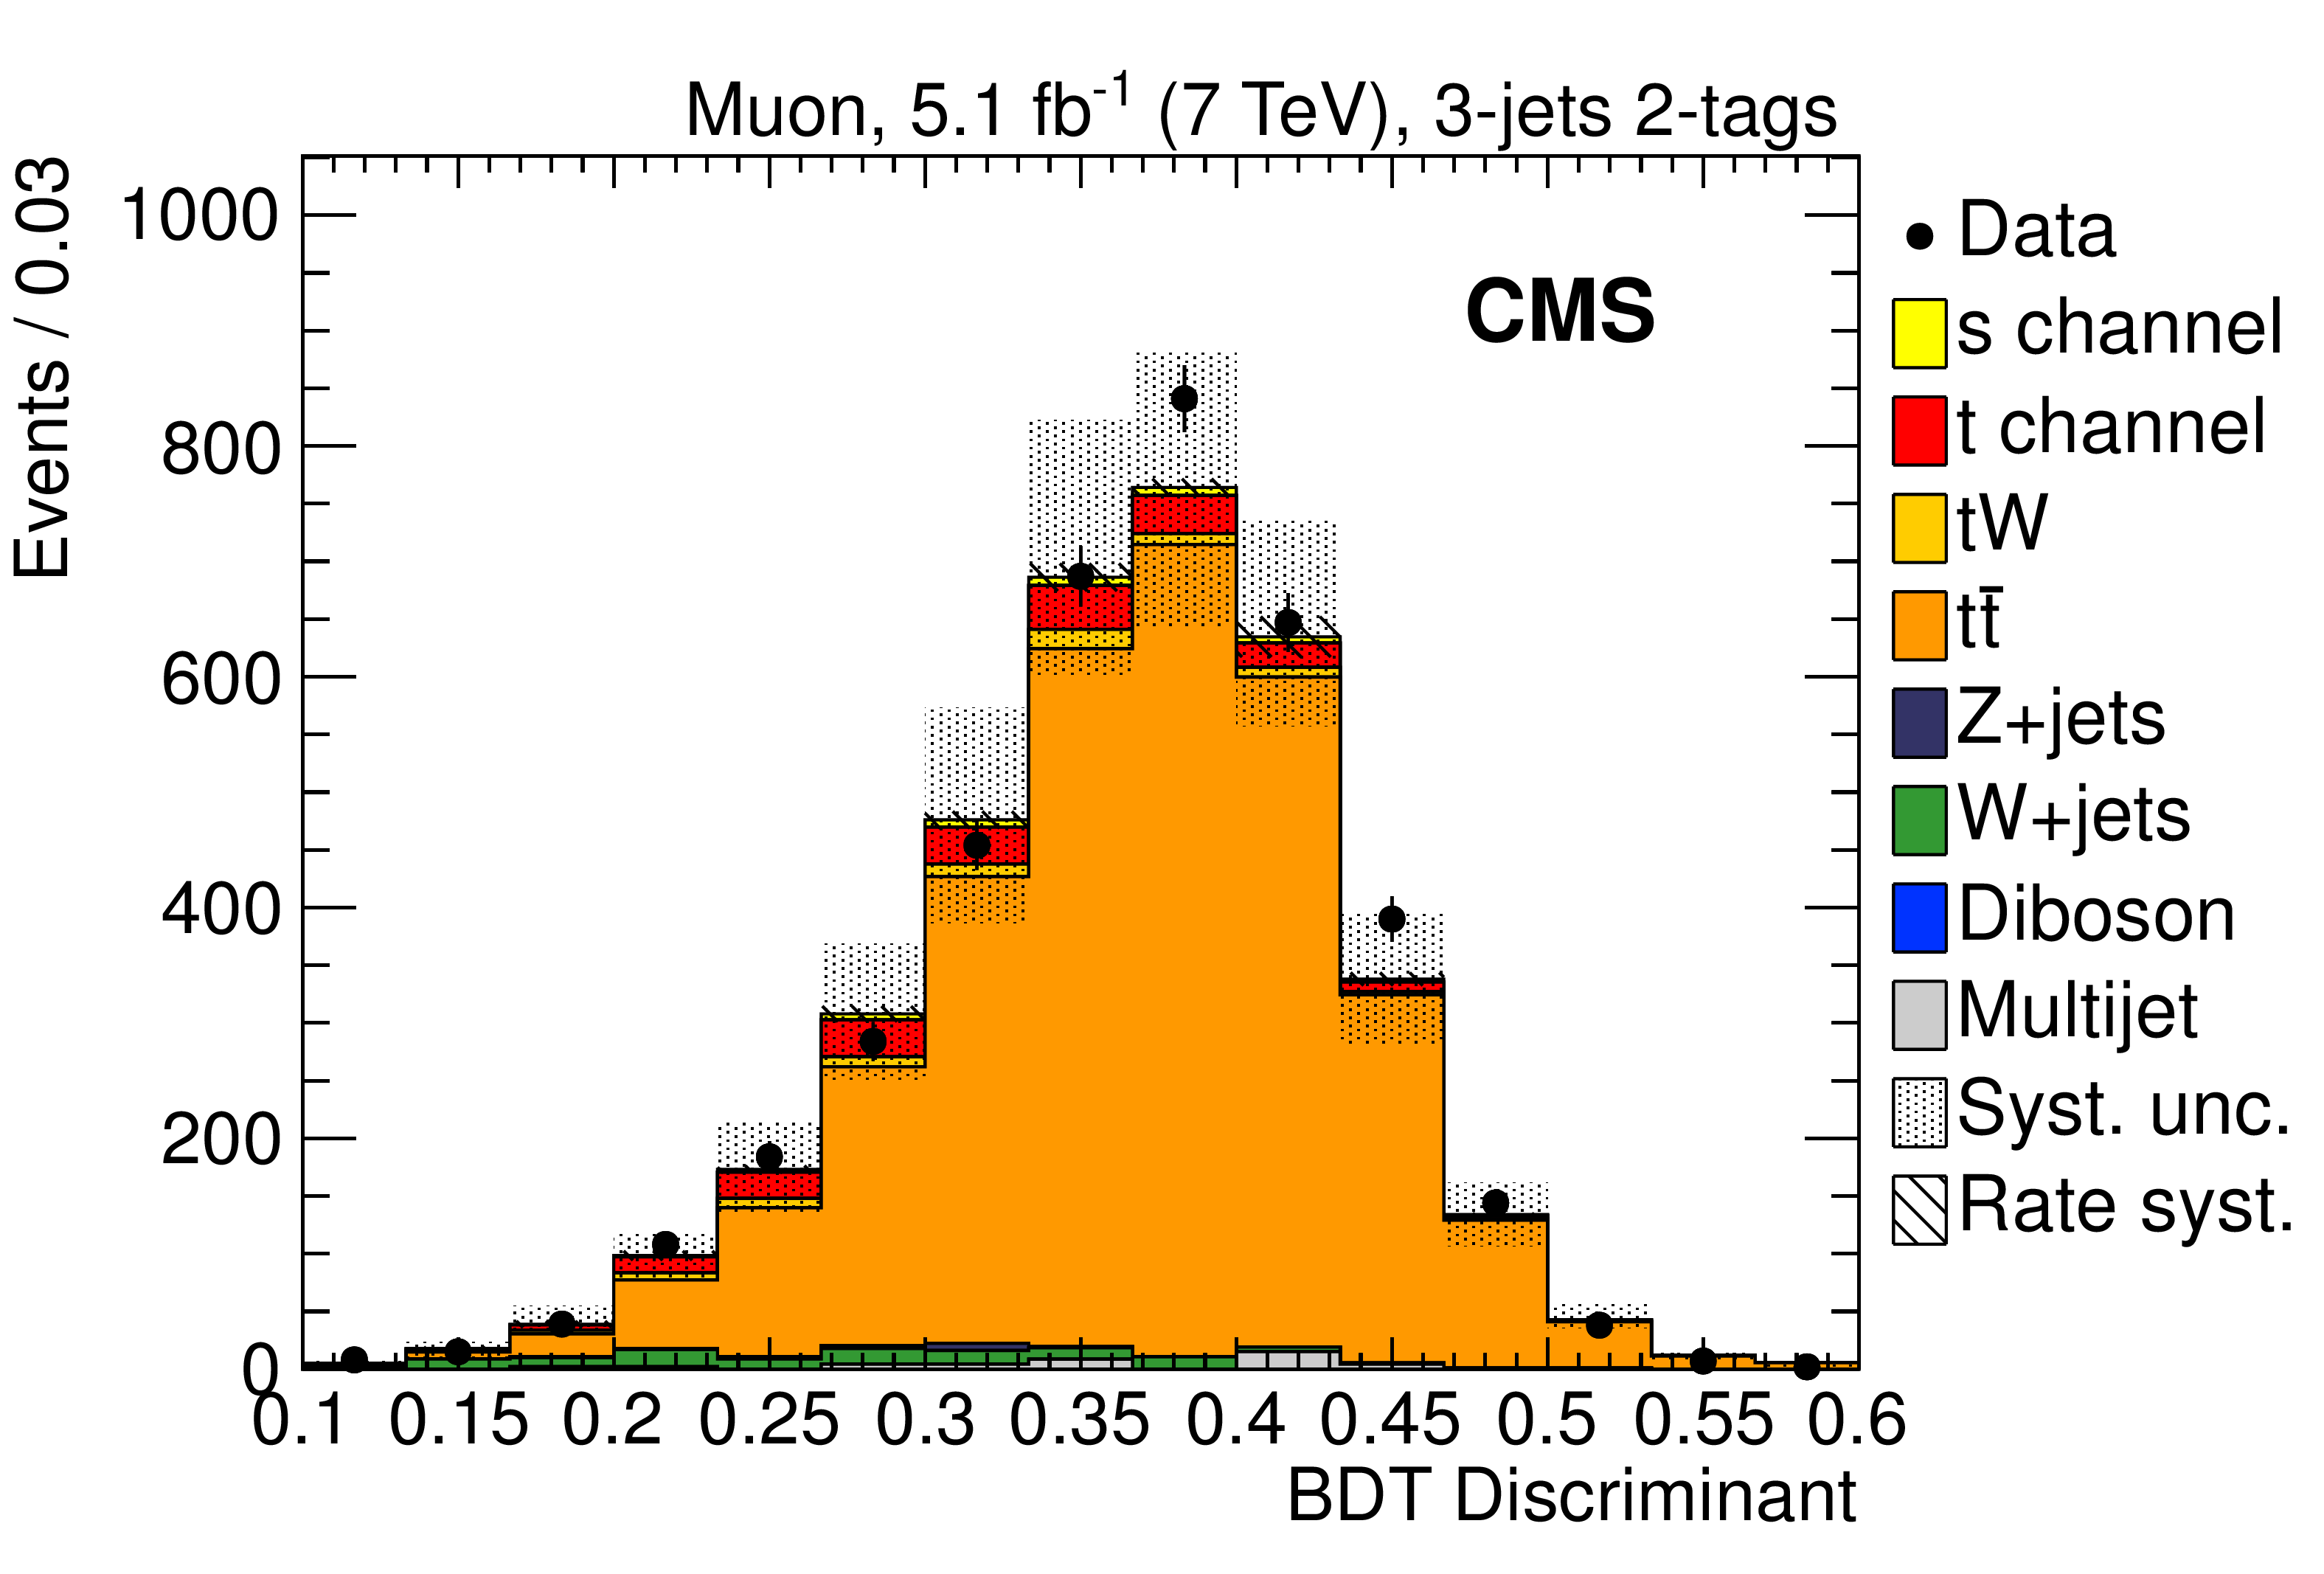
Figure 4-c:
Comparison of data with simulation for distributions of the BDT discriminants in the (a) 2-jets 2-tags, (b) 2-jets 1-tag, and (c) 3-jets 2-tags event category, for the muon channel at 7 TeV. The simulation is normalized to the combined (7+8 TeV) fit results. The inner uncertainty bands include the post-fit background rate uncertainties only, the outer ones include the total systematic uncertainty obtained summing in quadrature the individual contributions. |
png pdf |
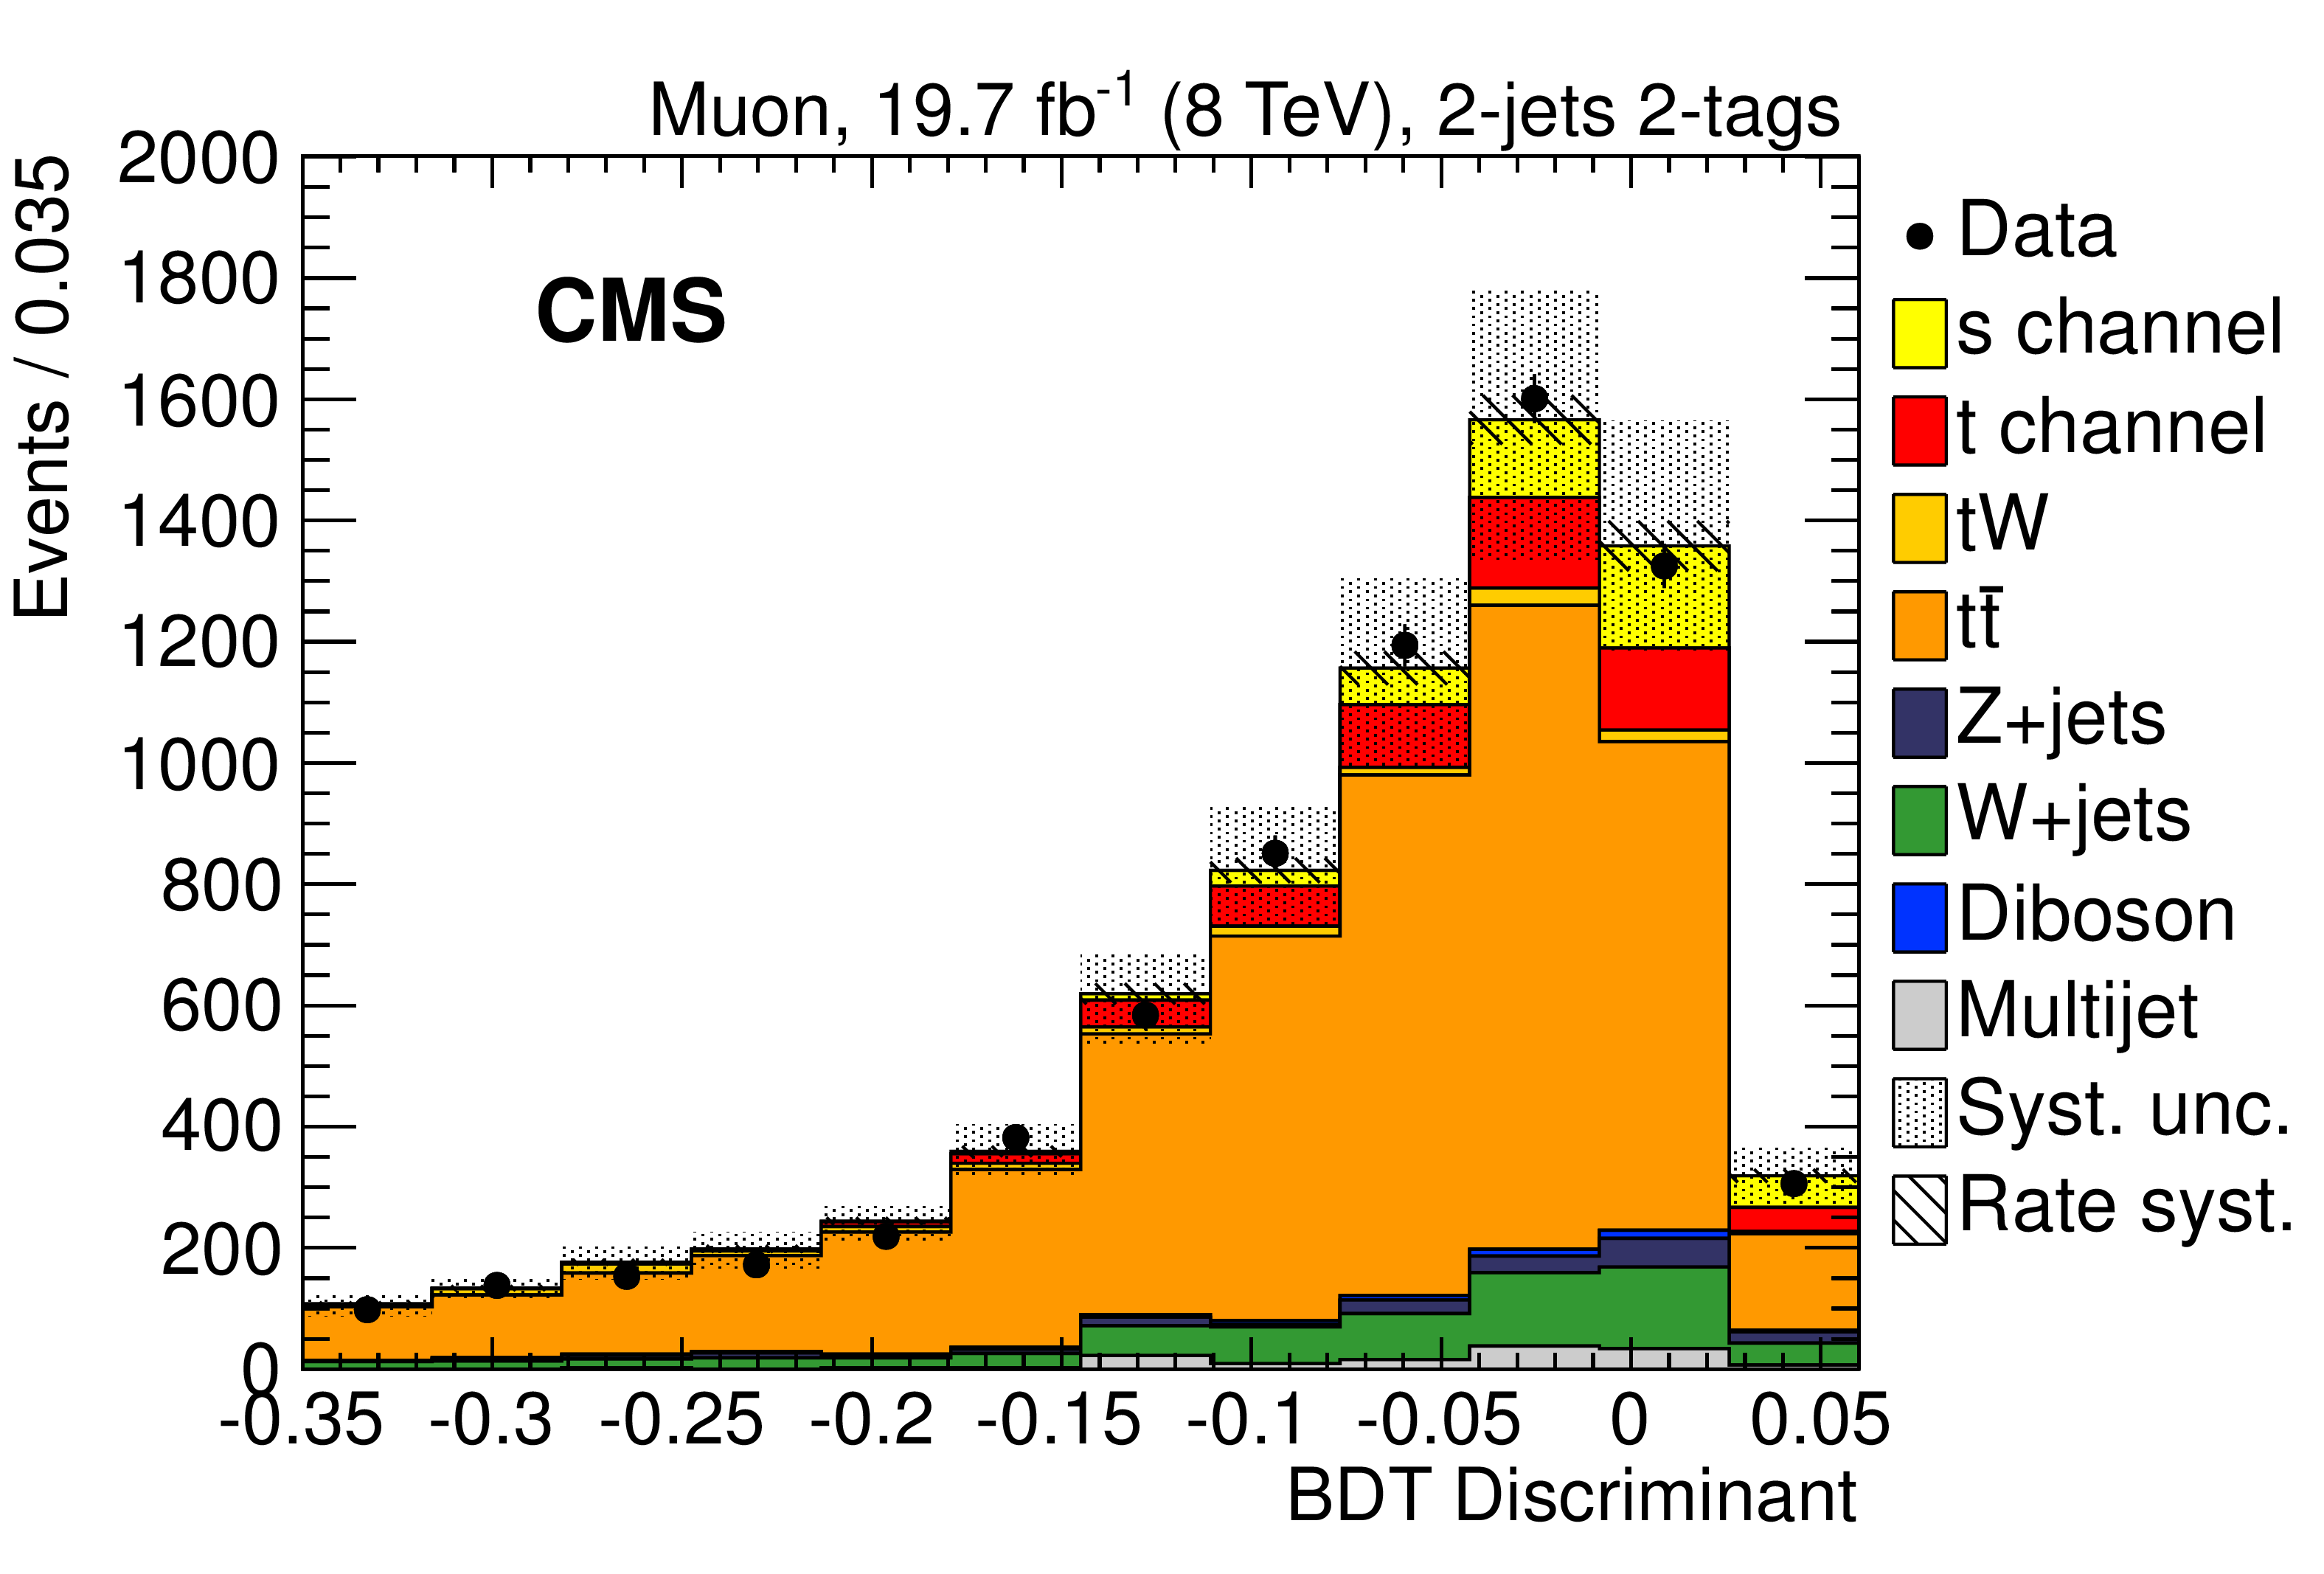
Figure 5-a:
Comparison of data with simulation for the distributions of the BDT discriminants in the (a) 2-jets 2-tags, (b) 2-jets 1-tag, and (c) 3-jets 2-tags event category, for the muon channel at 8 TeV. The simulation is normalized to the combined (7+8 TeV) fit results. The inner uncertainty bands include the post-fit background rate uncertainties only, the outer ones include the total systematic uncertainty, obtained summing in quadrature the individual contributions. |
png pdf |
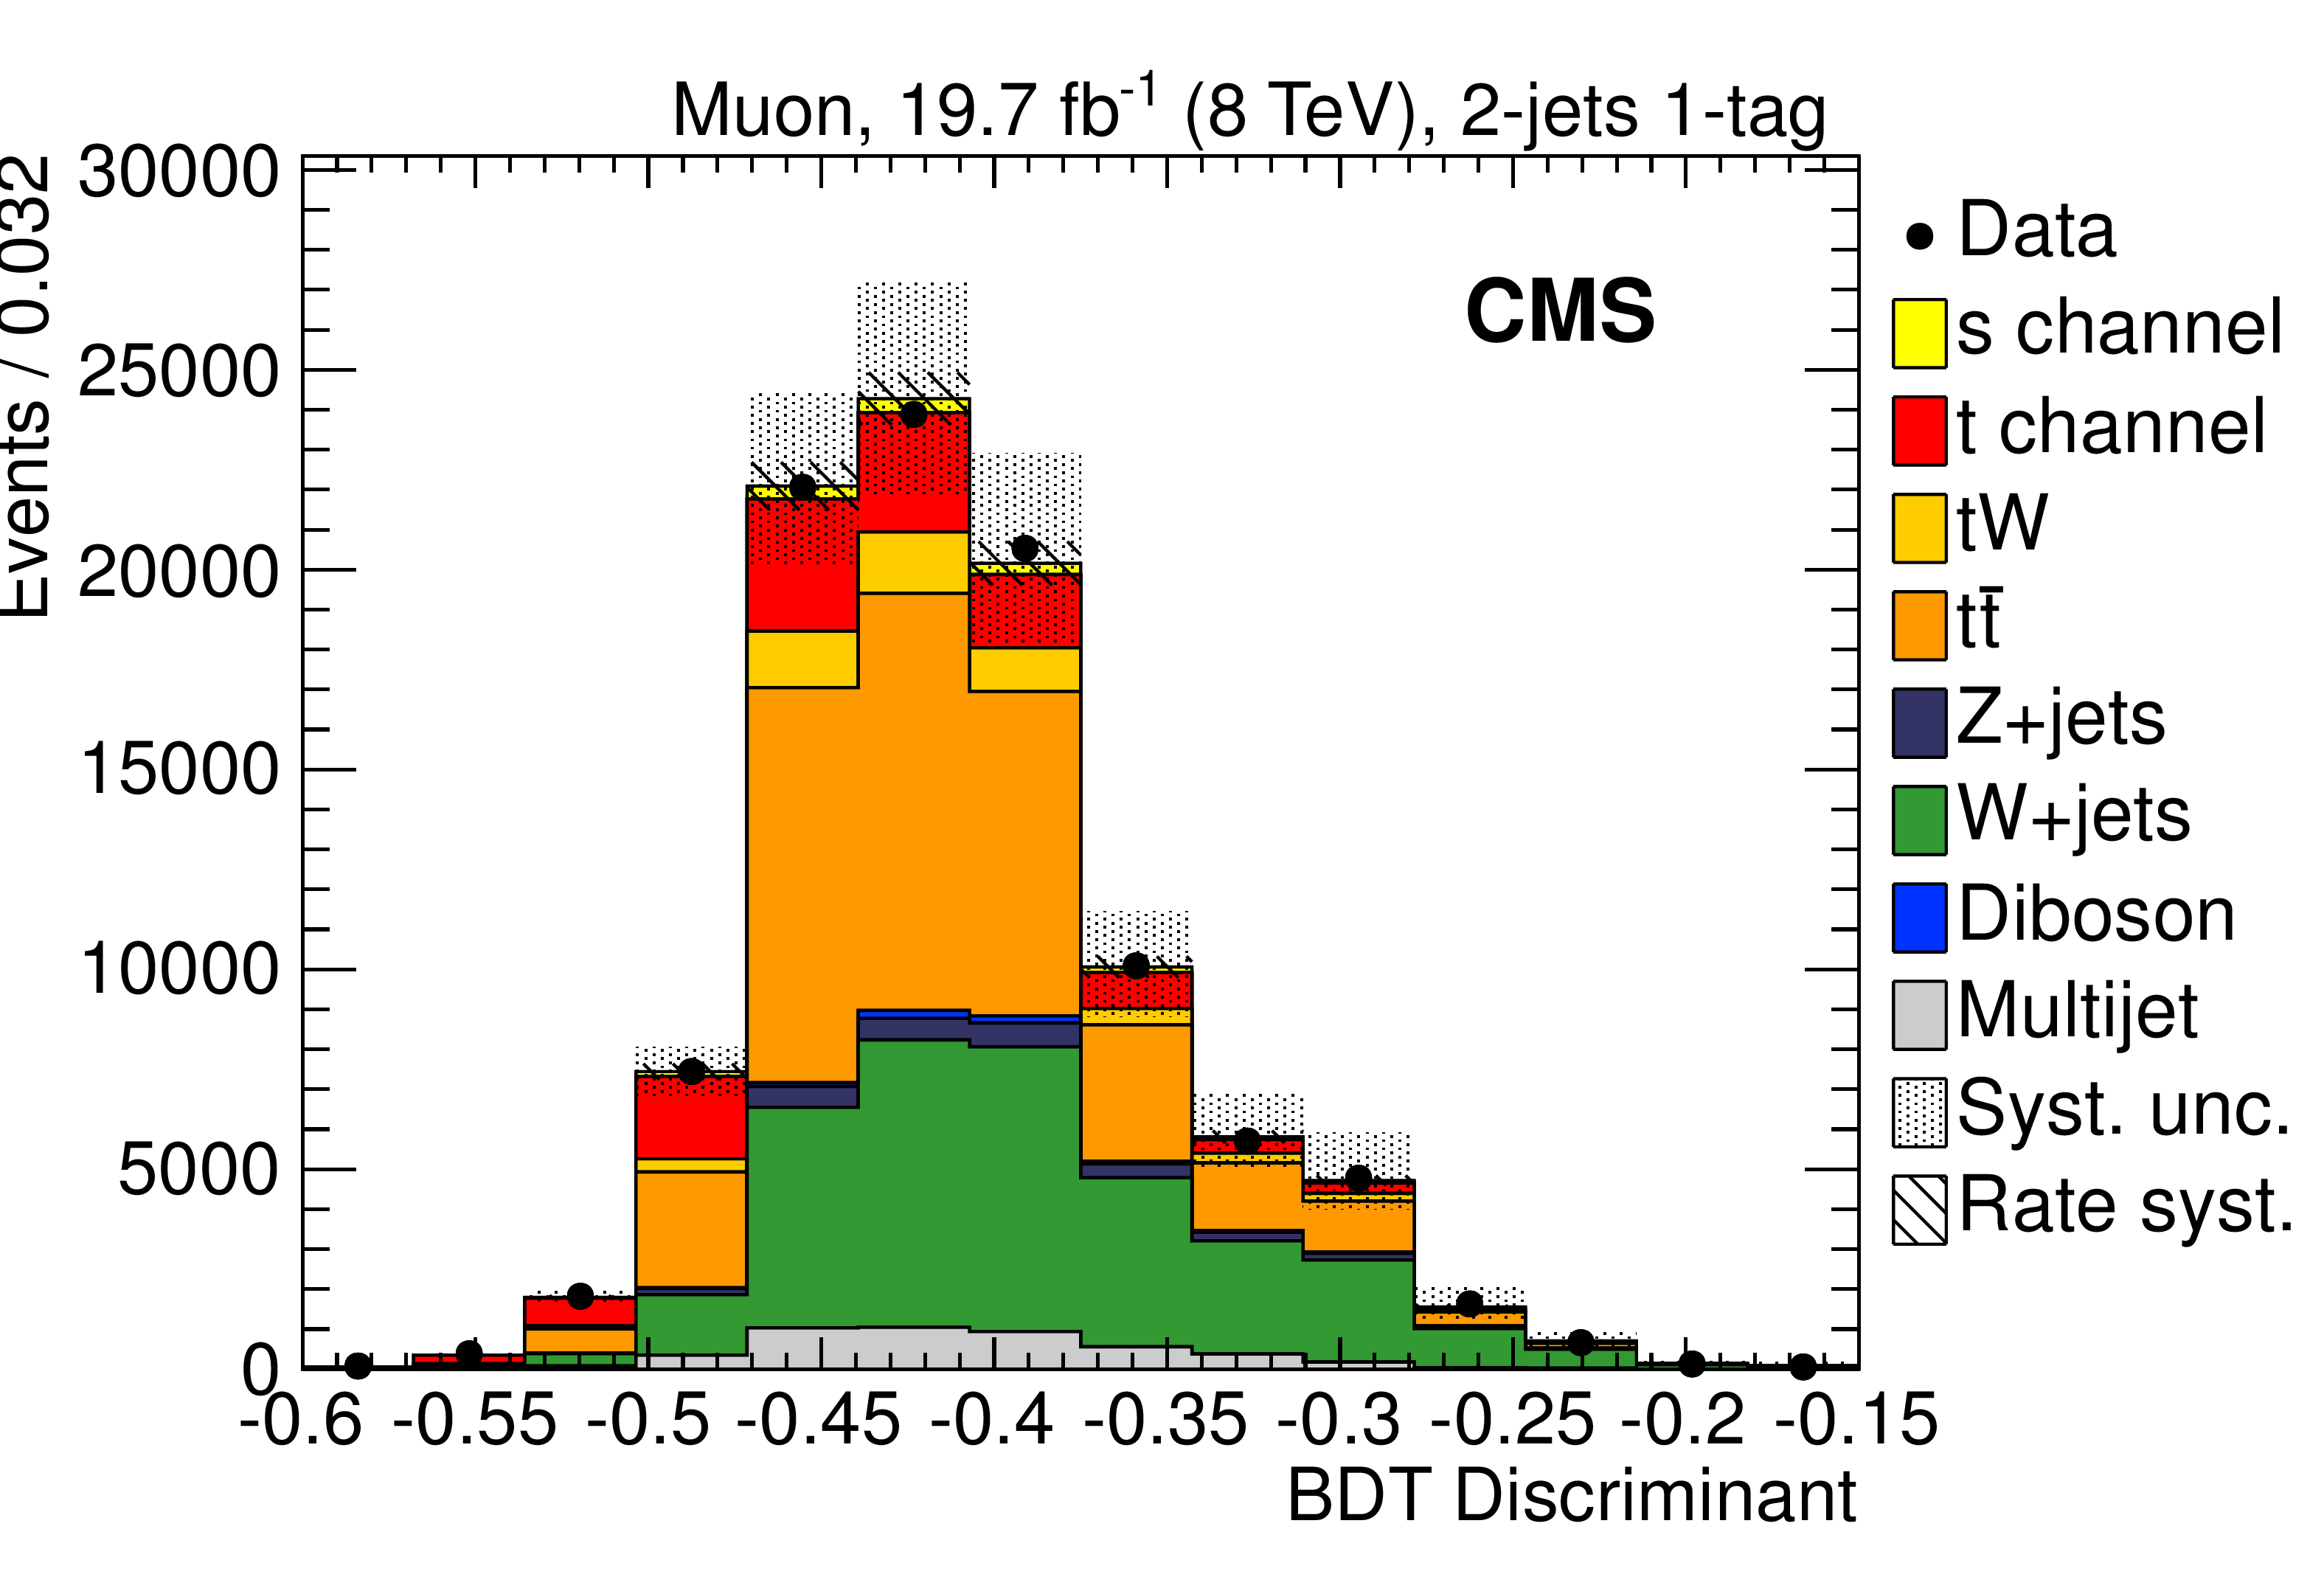
Figure 5-b:
Comparison of data with simulation for the distributions of the BDT discriminants in the (a) 2-jets 2-tags, (b) 2-jets 1-tag, and (c) 3-jets 2-tags event category, for the muon channel at 8 TeV. The simulation is normalized to the combined (7+8 TeV) fit results. The inner uncertainty bands include the post-fit background rate uncertainties only, the outer ones include the total systematic uncertainty, obtained summing in quadrature the individual contributions. |
png pdf |
Figure 5-c:
Comparison of data with simulation for the distributions of the BDT discriminants in the (a) 2-jets 2-tags, (b) 2-jets 1-tag, and (c) 3-jets 2-tags event category, for the muon channel at 8 TeV. The simulation is normalized to the combined (7+8 TeV) fit results. The inner uncertainty bands include the post-fit background rate uncertainties only, the outer ones include the total systematic uncertainty, obtained summing in quadrature the individual contributions. |
png pdf |
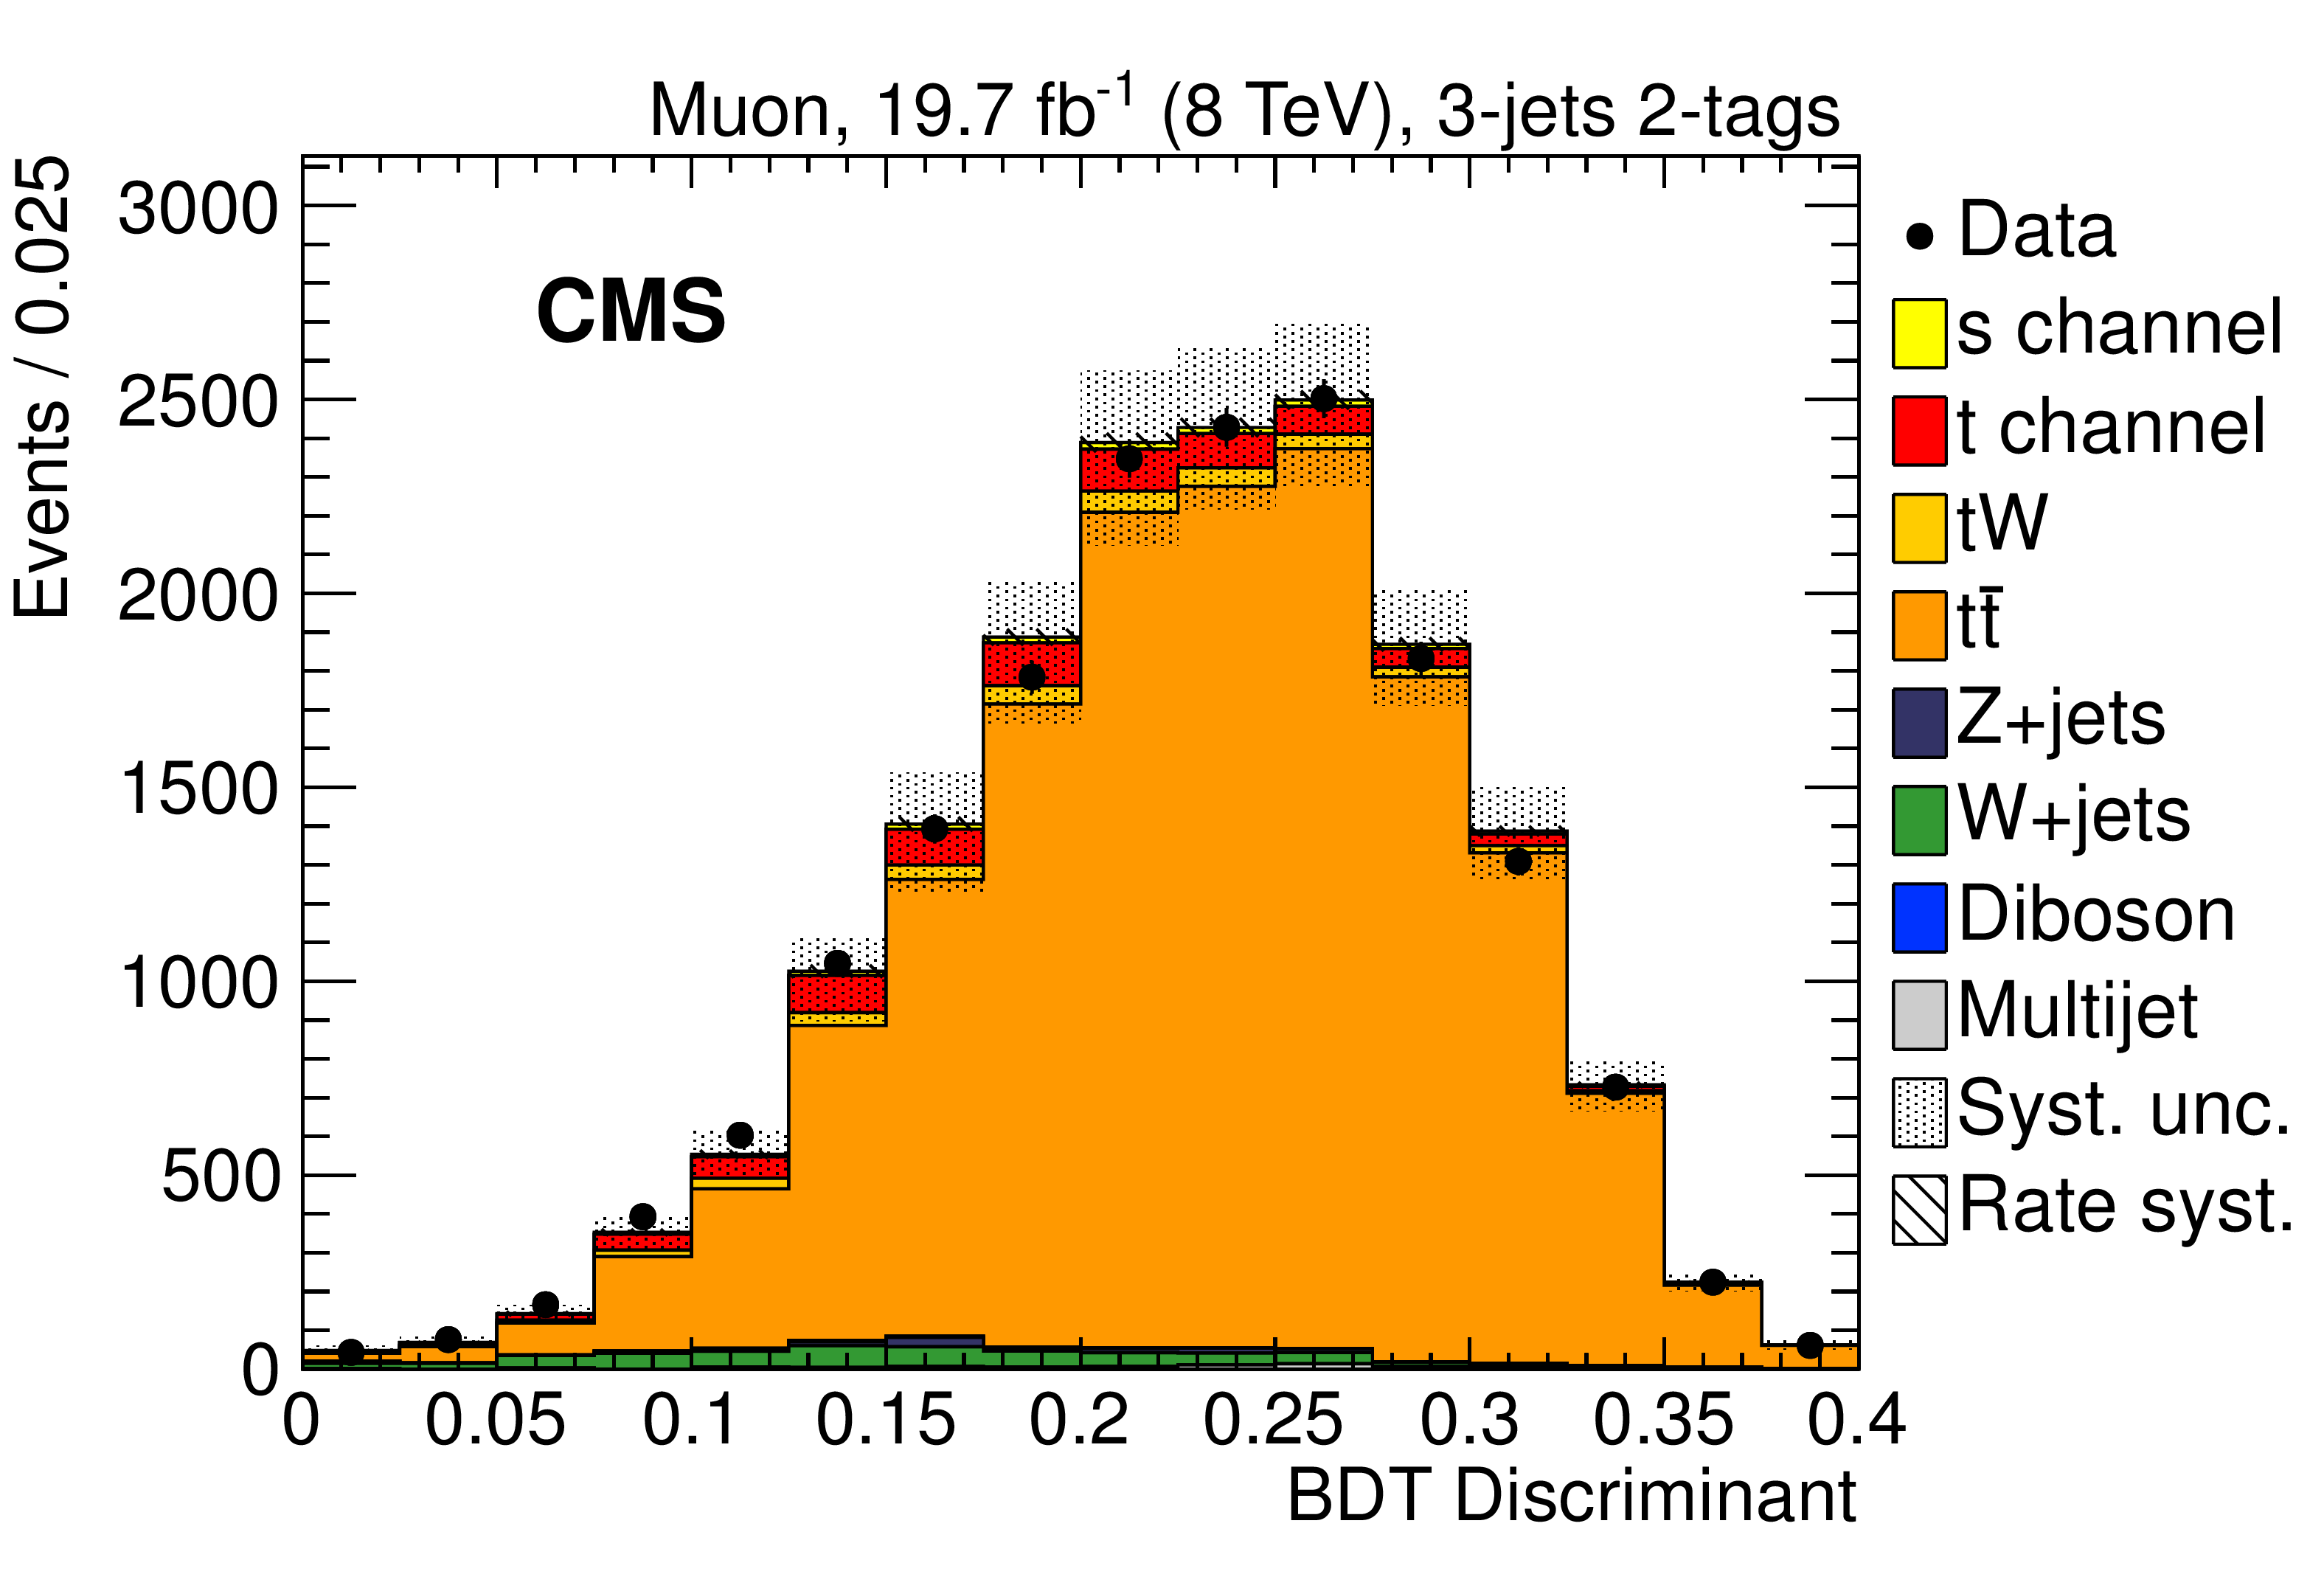
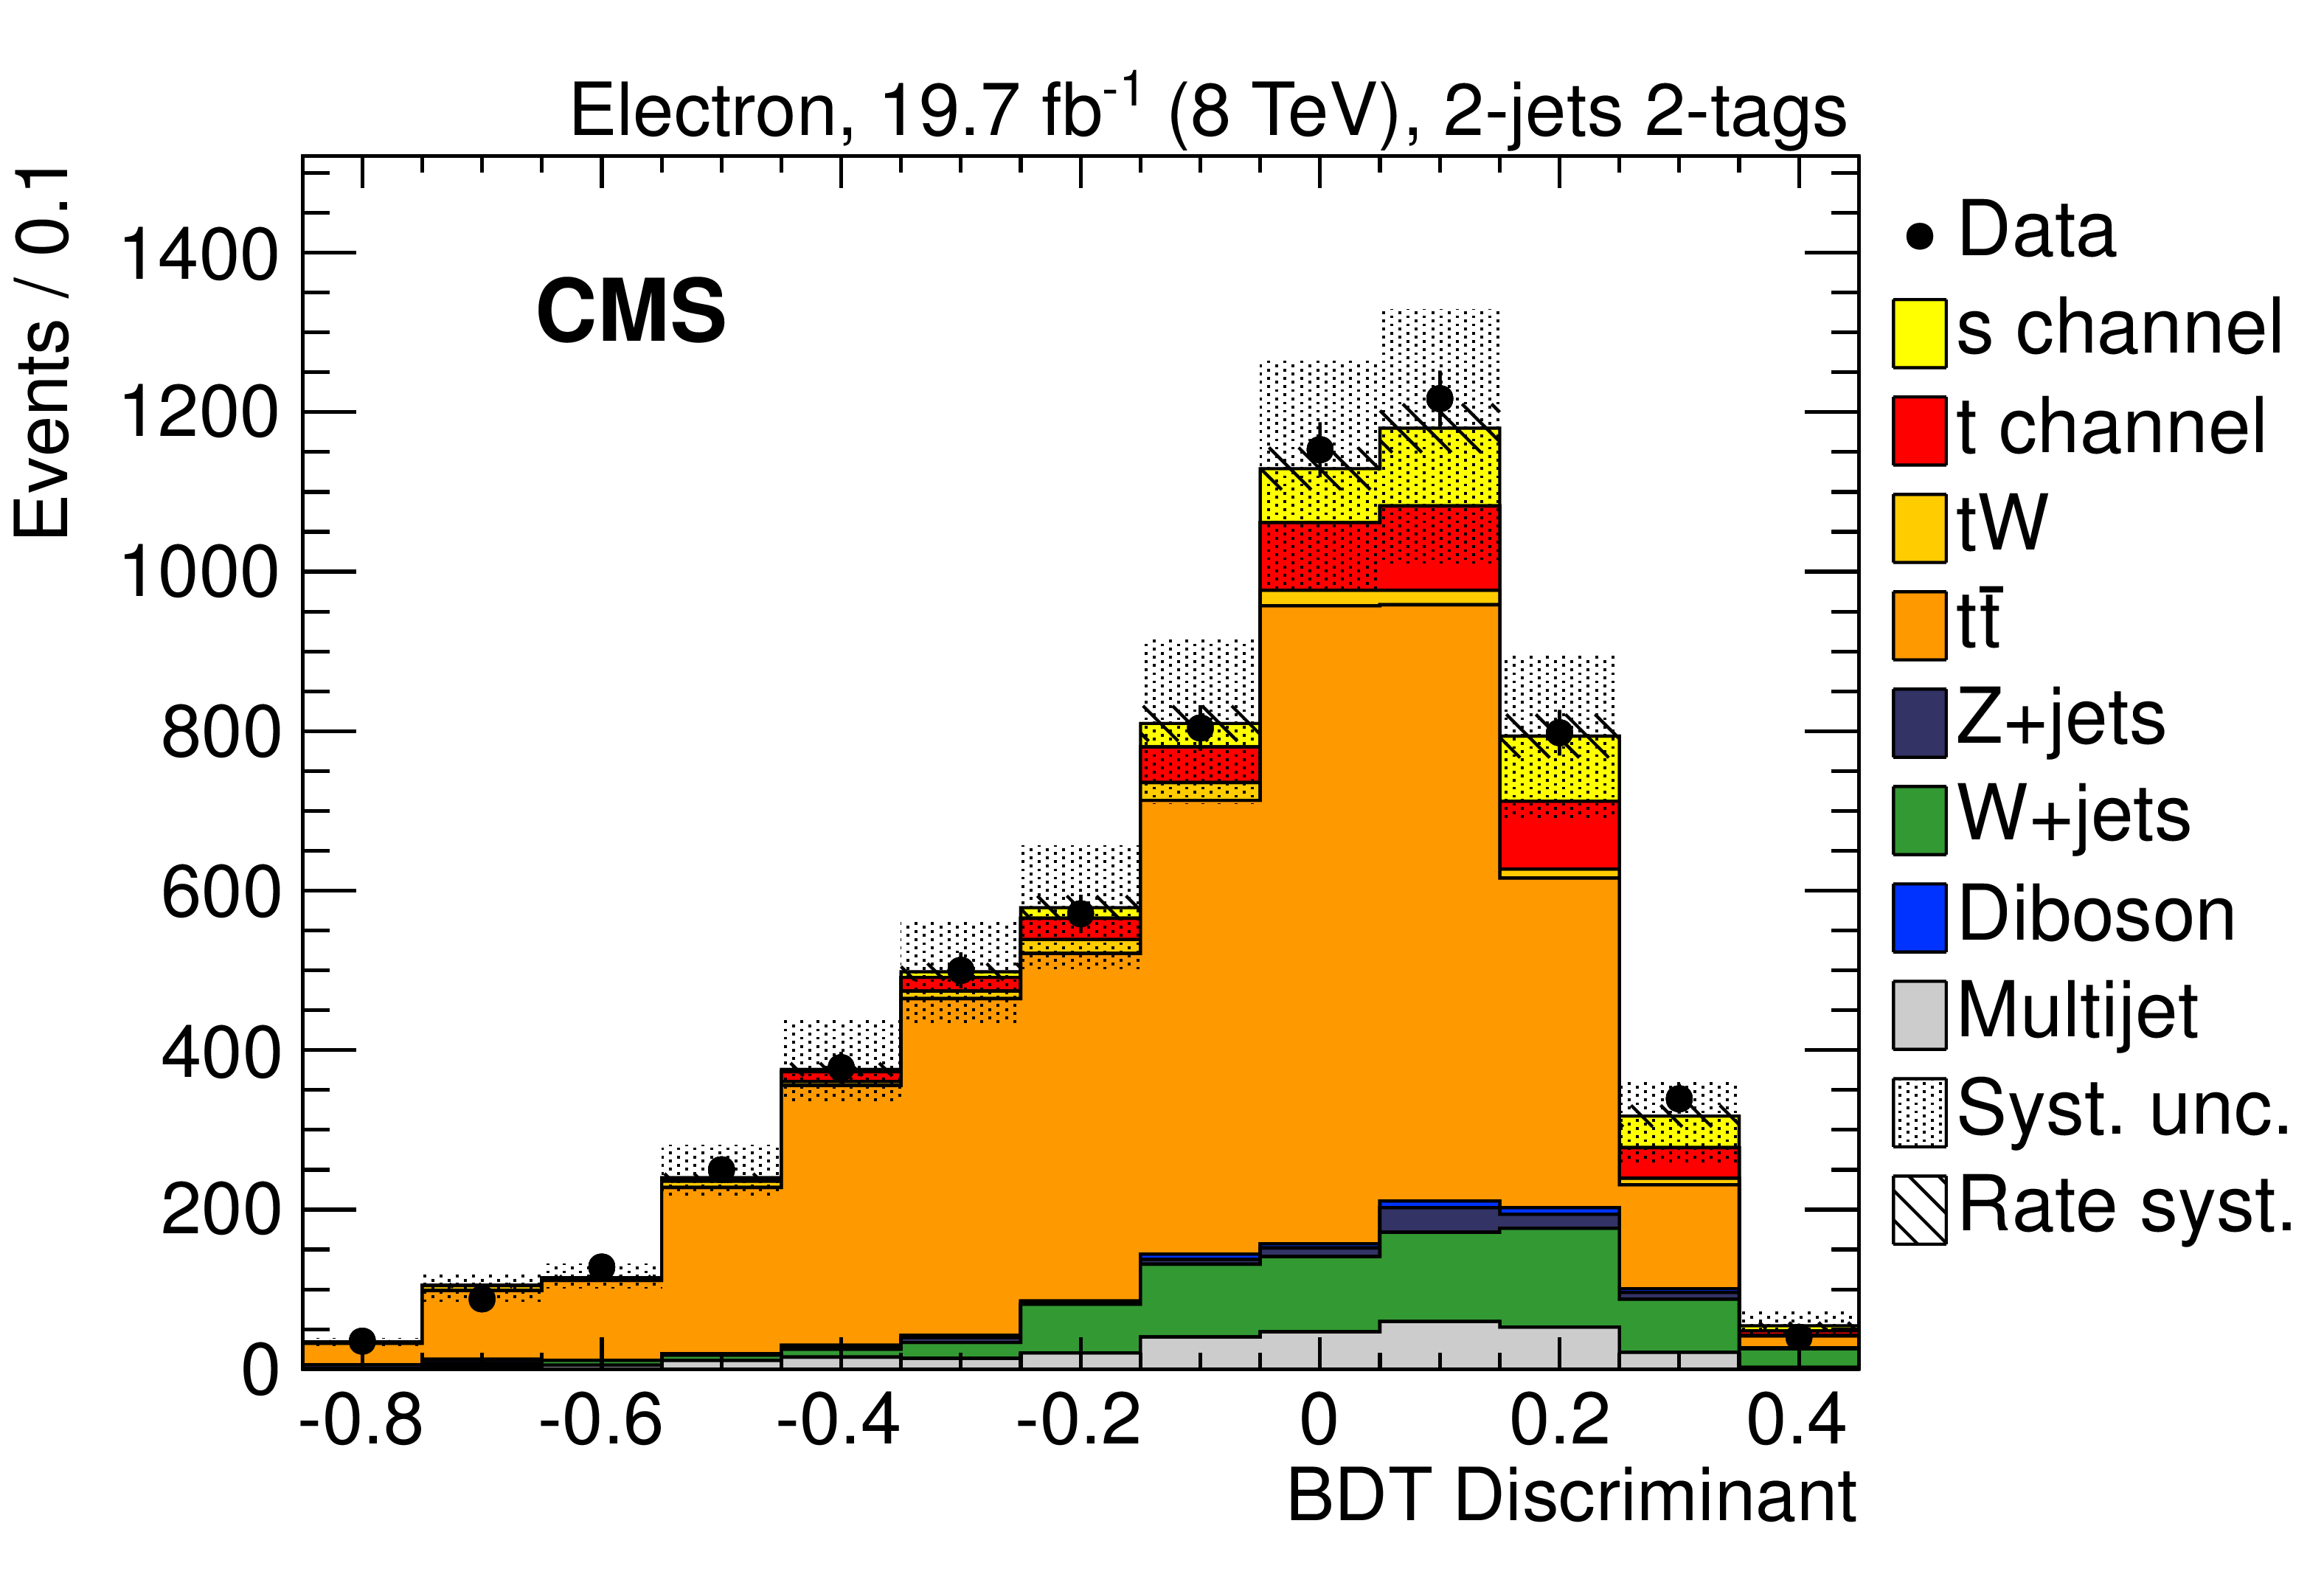
Figure 6-a:
Comparison of data with simulation for the distributions of the BDT discriminants in the (a) 2-jets 2-tags, (b) 2-jets 1-tag, and (c) 3-jets 2-tags event category, for the electron channel at 8 TeV. The simulation is normalized to the combined (7+8 TeV) fit results. The inner uncertainty bands include the post-fit background rate uncertainties only, the outer ones include the total systematic uncertainty, obtained summing in quadrature the individual contributions. |
png pdf |
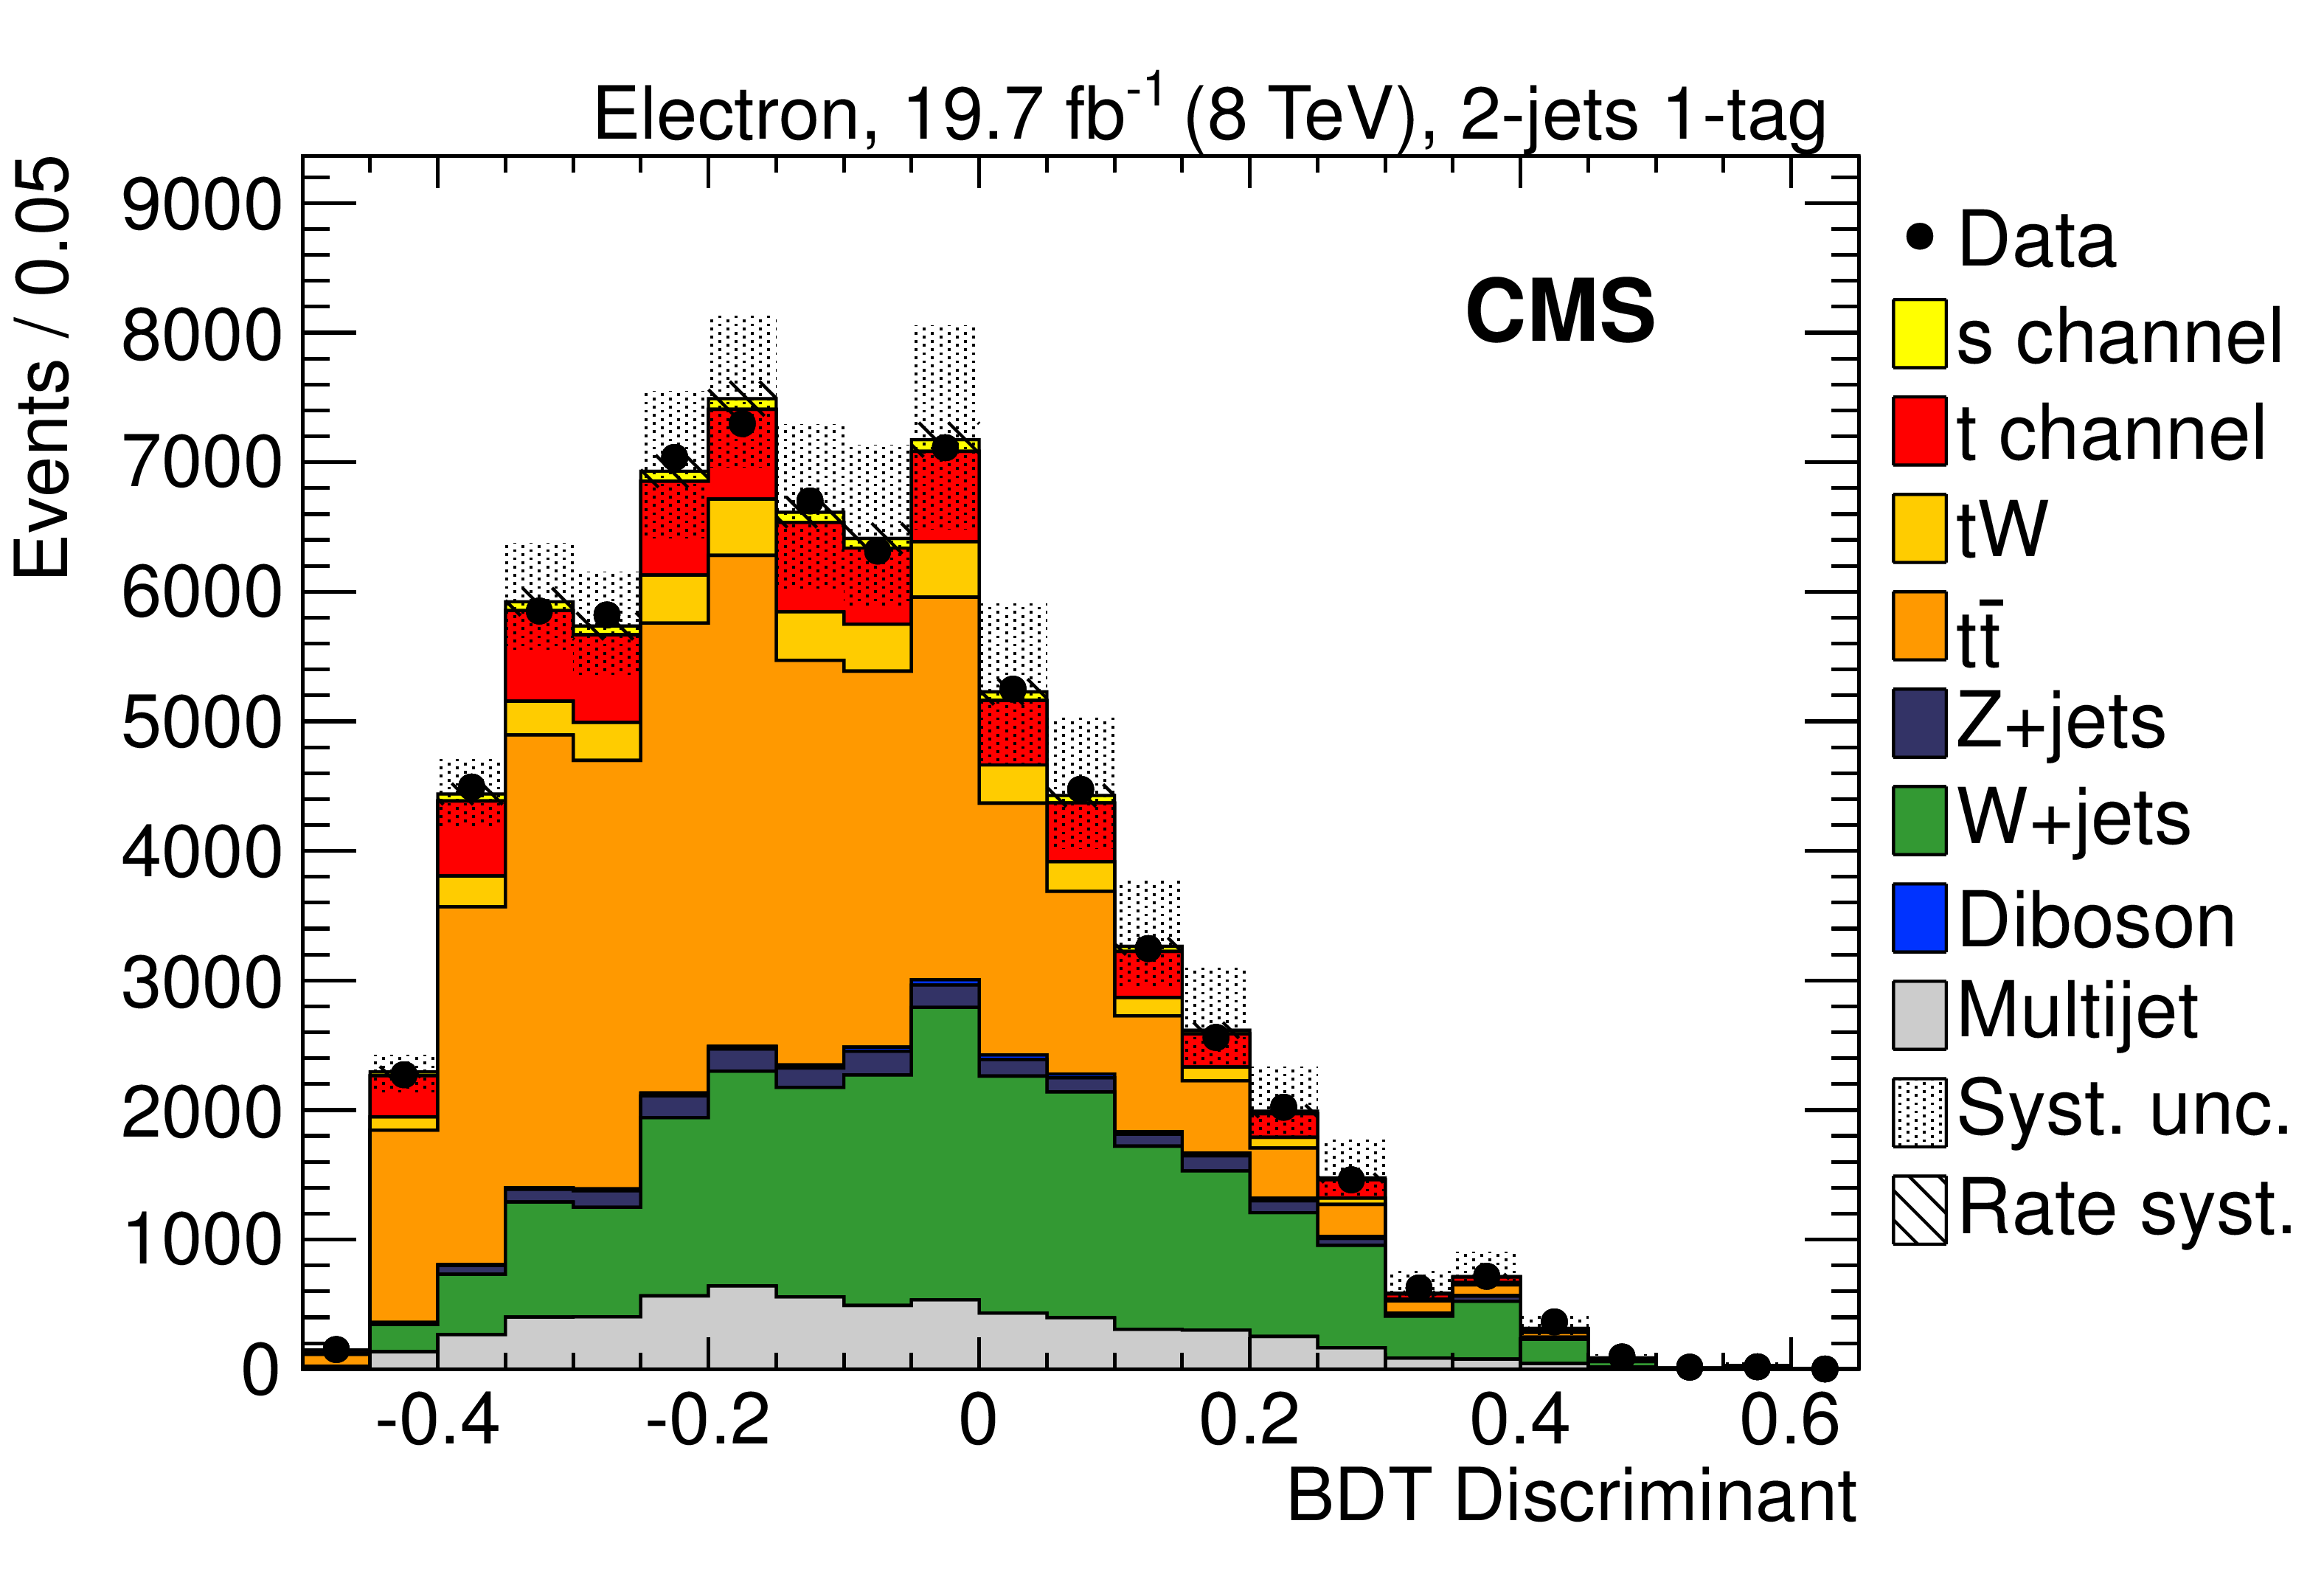
Figure 6-b:
Comparison of data with simulation for the distributions of the BDT discriminants in the (a) 2-jets 2-tags, (b) 2-jets 1-tag, and (c) 3-jets 2-tags event category, for the electron channel at 8 TeV. The simulation is normalized to the combined (7+8 TeV) fit results. The inner uncertainty bands include the post-fit background rate uncertainties only, the outer ones include the total systematic uncertainty, obtained summing in quadrature the individual contributions. |
png pdf |
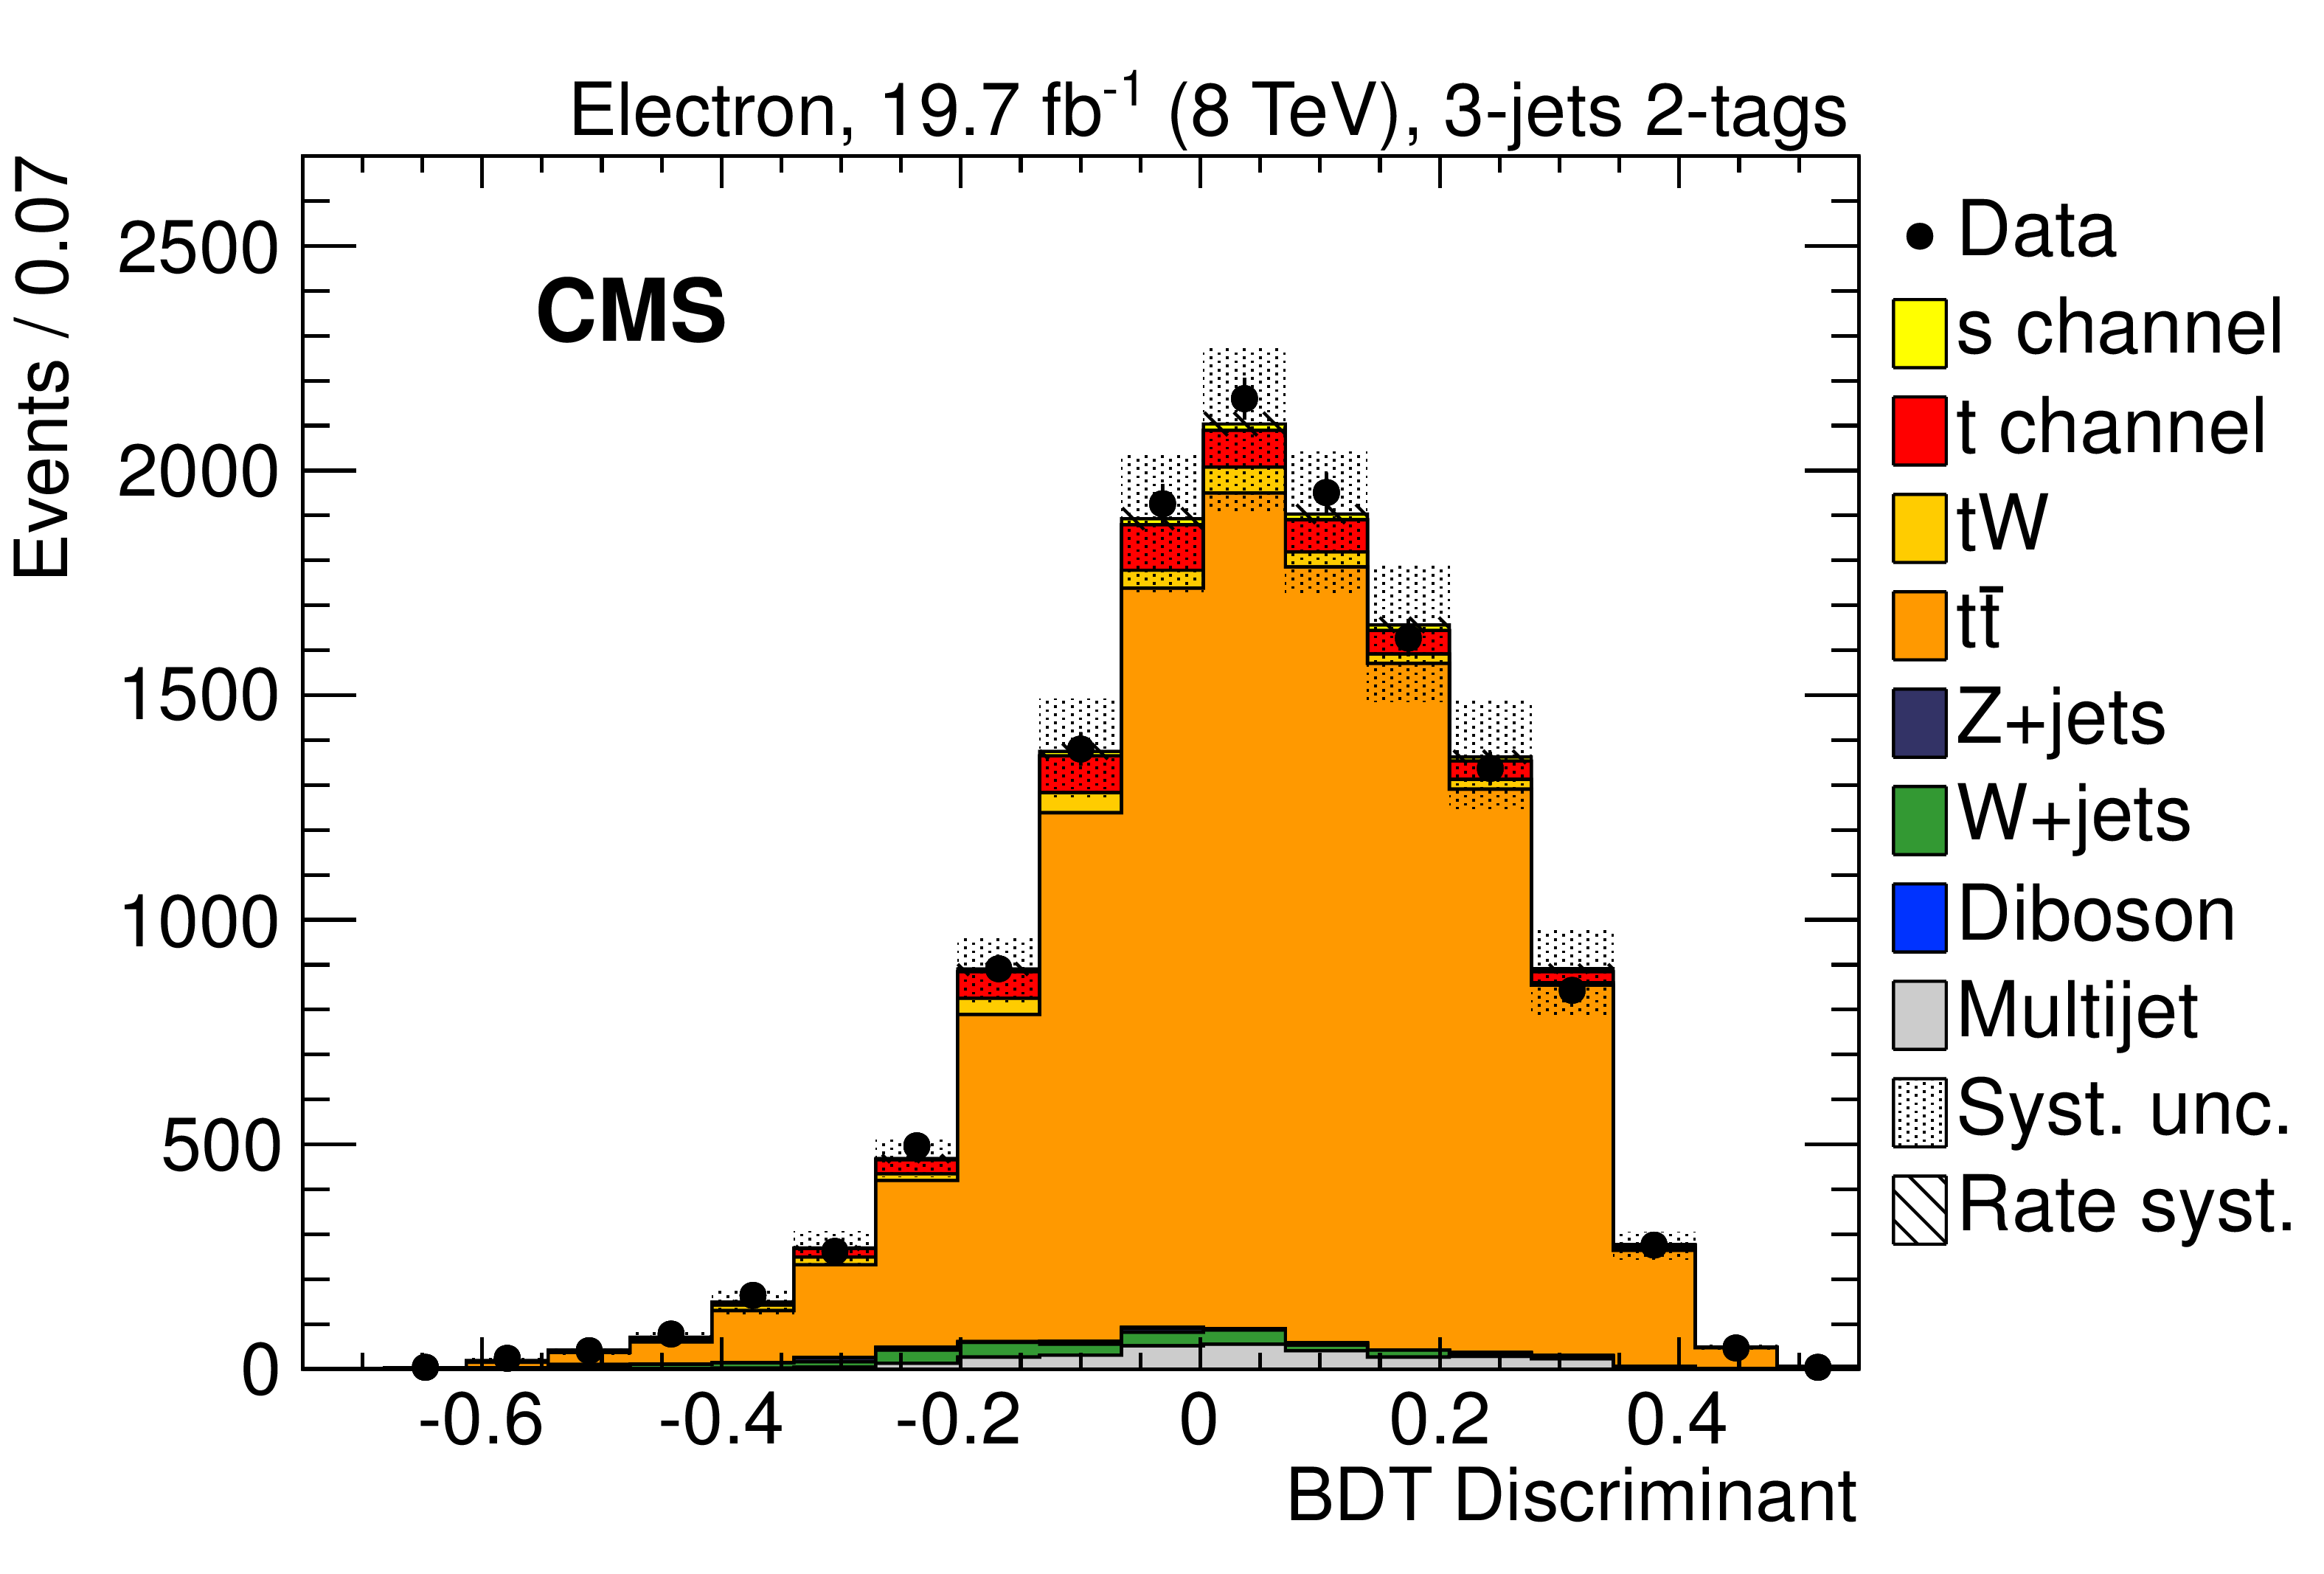
Figure 6-c:
Comparison of data with simulation for the distributions of the BDT discriminants in the (a) 2-jets 2-tags, (b) 2-jets 1-tag, and (c) 3-jets 2-tags event category, for the electron channel at 8 TeV. The simulation is normalized to the combined (7+8 TeV) fit results. The inner uncertainty bands include the post-fit background rate uncertainties only, the outer ones include the total systematic uncertainty, obtained summing in quadrature the individual contributions. |
| Tables | |

png pdf |
Table 1:
Monte Carlo cross sections calculated for background processes. |
png pdf |
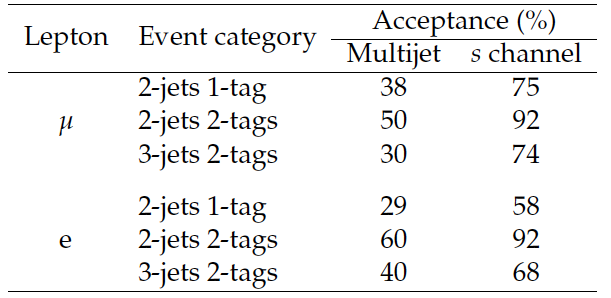
Table 2:
QCD BDT selection acceptance for multijet and $s$ channel events at 8 TeV. |
png pdf |
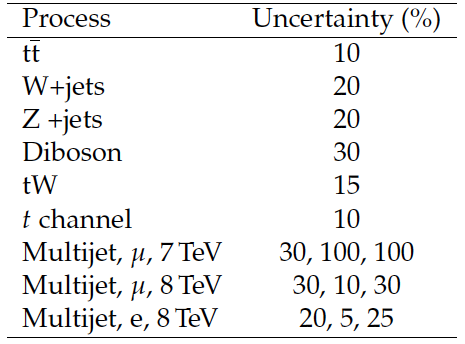
Table 3:
Summary of normalization uncertainties on the background processes. |
png pdf |
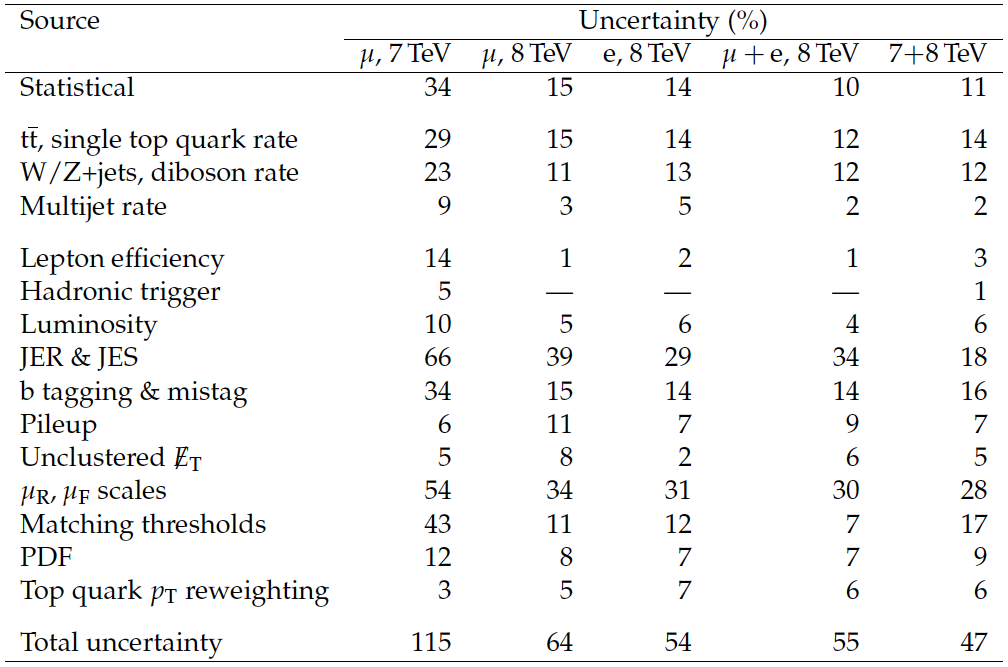
Table 4:
Summary of the relative impact of the statistical and systematic uncertainties on the cross section measurement. Different prior uncertainties have been assigned to $ \mathrm{ t \bar{t} } $, single top quark $t$ channel and tW production, W+jets, Z+jets and diboson rates, see Section 7. |
png pdf |
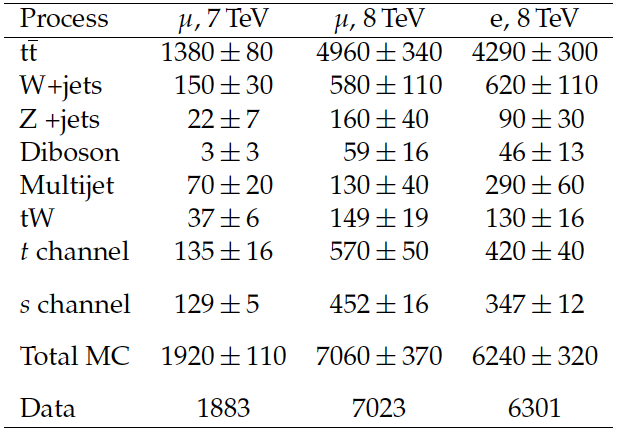
Table 5:
Event yields for the main processes in the 2-jets 2-tags region, at 7 and 8 TeV. The yields of the simulated samples are quoted after the likelihood-maximization procedure for the combined 7+8 TeV fit. The uncertainties include the statistical uncertainty on the simulation, the rate uncertainties and the b tagging uncertainty. |
png pdf |
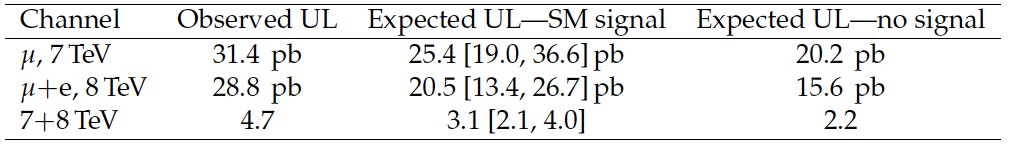
Table 6:
Observed and expected upper limits (UL) at 7 and 8 TeV and for the combination of the data. Both the expected limits assuming the presence of a SM signal or in the absence of a signal are reported. In the hypothesis of a SM signal, the 68% CL interval for the expected limit is also reported within square brackets. In the last row the upper limits are given in terms of the rate relative to the SM expectation. |
| Summary |
| A search is presented for single top quark production in the $s$ channel in pp collisions at centre-of-mass energies of 7 and 8 TeV with the CMS detector at the LHC. A multivariate approach based on boosted decision trees is adopted to discriminate the signal from background contributions. The cross section is measured to be 7.1 $\pm$ 8.1 (stat+syst) pb at 7 TeV and 13.4 $\pm$ 7.3 (stat+syst) pb at 8 TeV, corresponding to a combined signal rate relative to SM expectations of 2.0 $\pm$ 0.9 (stat+syst). The observed and expected upper limits on the combined signal strength are found to be 4.7 and 3.1 at 95% CL. The observed significance of the combined measurement is 2.5 standard deviations with 1.1 standard deviations expected. The measurements are in agreement with the prediction of the standard model. |
|
|
Compact Muon Solenoid LHC, CERN |
|

|

|

|

|

|