

Compact Muon Solenoid
LHC, CERN
| CMS-TOP-13-010 ; CERN-PH-EP-2014-249 | ||
| Measurement of the cross section ratio $\sigma_\mathrm{t \bar{t} b \bar{b}} / \sigma_\mathrm{t \bar{t} jj }$ in pp collisions at $\sqrt{s}$ = 8TeV | ||
| CMS Collaboration | ||
| 20 November 2014 | ||
| Phys. Lett. B 746 (2015) 132 | ||
| Abstract: The first measurement of the cross section ratio $\sigma_\mathrm{ t \bar{t} b \bar{b}} / \sigma_\mathrm{ t \bar{t} jj }$ is presented using a data sample corresponding to an integrated luminosity of 19.6 fb$^{-1}$ collected in pp collisions at $\sqrt{s}$ = 8 TeV with the CMS detector at the LHC. Events with two leptons ($\mathrm{e}$ or $\mu$) and four reconstructed jets, including two identified as b quark jets, in the final state are selected. The ratio is determined for a minimum jet transverse momentum $p_\mathrm{T}$ of both 20 and 40 GeV/$c$. The measured ratio is 0.022 $\pm$ 0.003 (stat) $\pm$ 0.005 (syst) for $p_\mathrm{T}$ greater than 20 GeV/$c$. The absolute cross sections $\sigma_\mathrm{ t \bar{t} b \bar{b}}$ and $\sigma_\mathrm{ t \bar{t} jj }$ are also measured. The measured ratio for $p_\mathrm{T}$ greater than 40 GeV/$c$ is compatible with a theoretical quantum chromodynamics calculation at next-to-leading order. | ||
| Links: e-print arXiv:1411.5621 [hep-ex] (PDF) ; CDS record ; inSPIRE record ; Public twiki page ; HepData record ; CADI line (restricted) ; | ||
| Figures | |
png pdf |
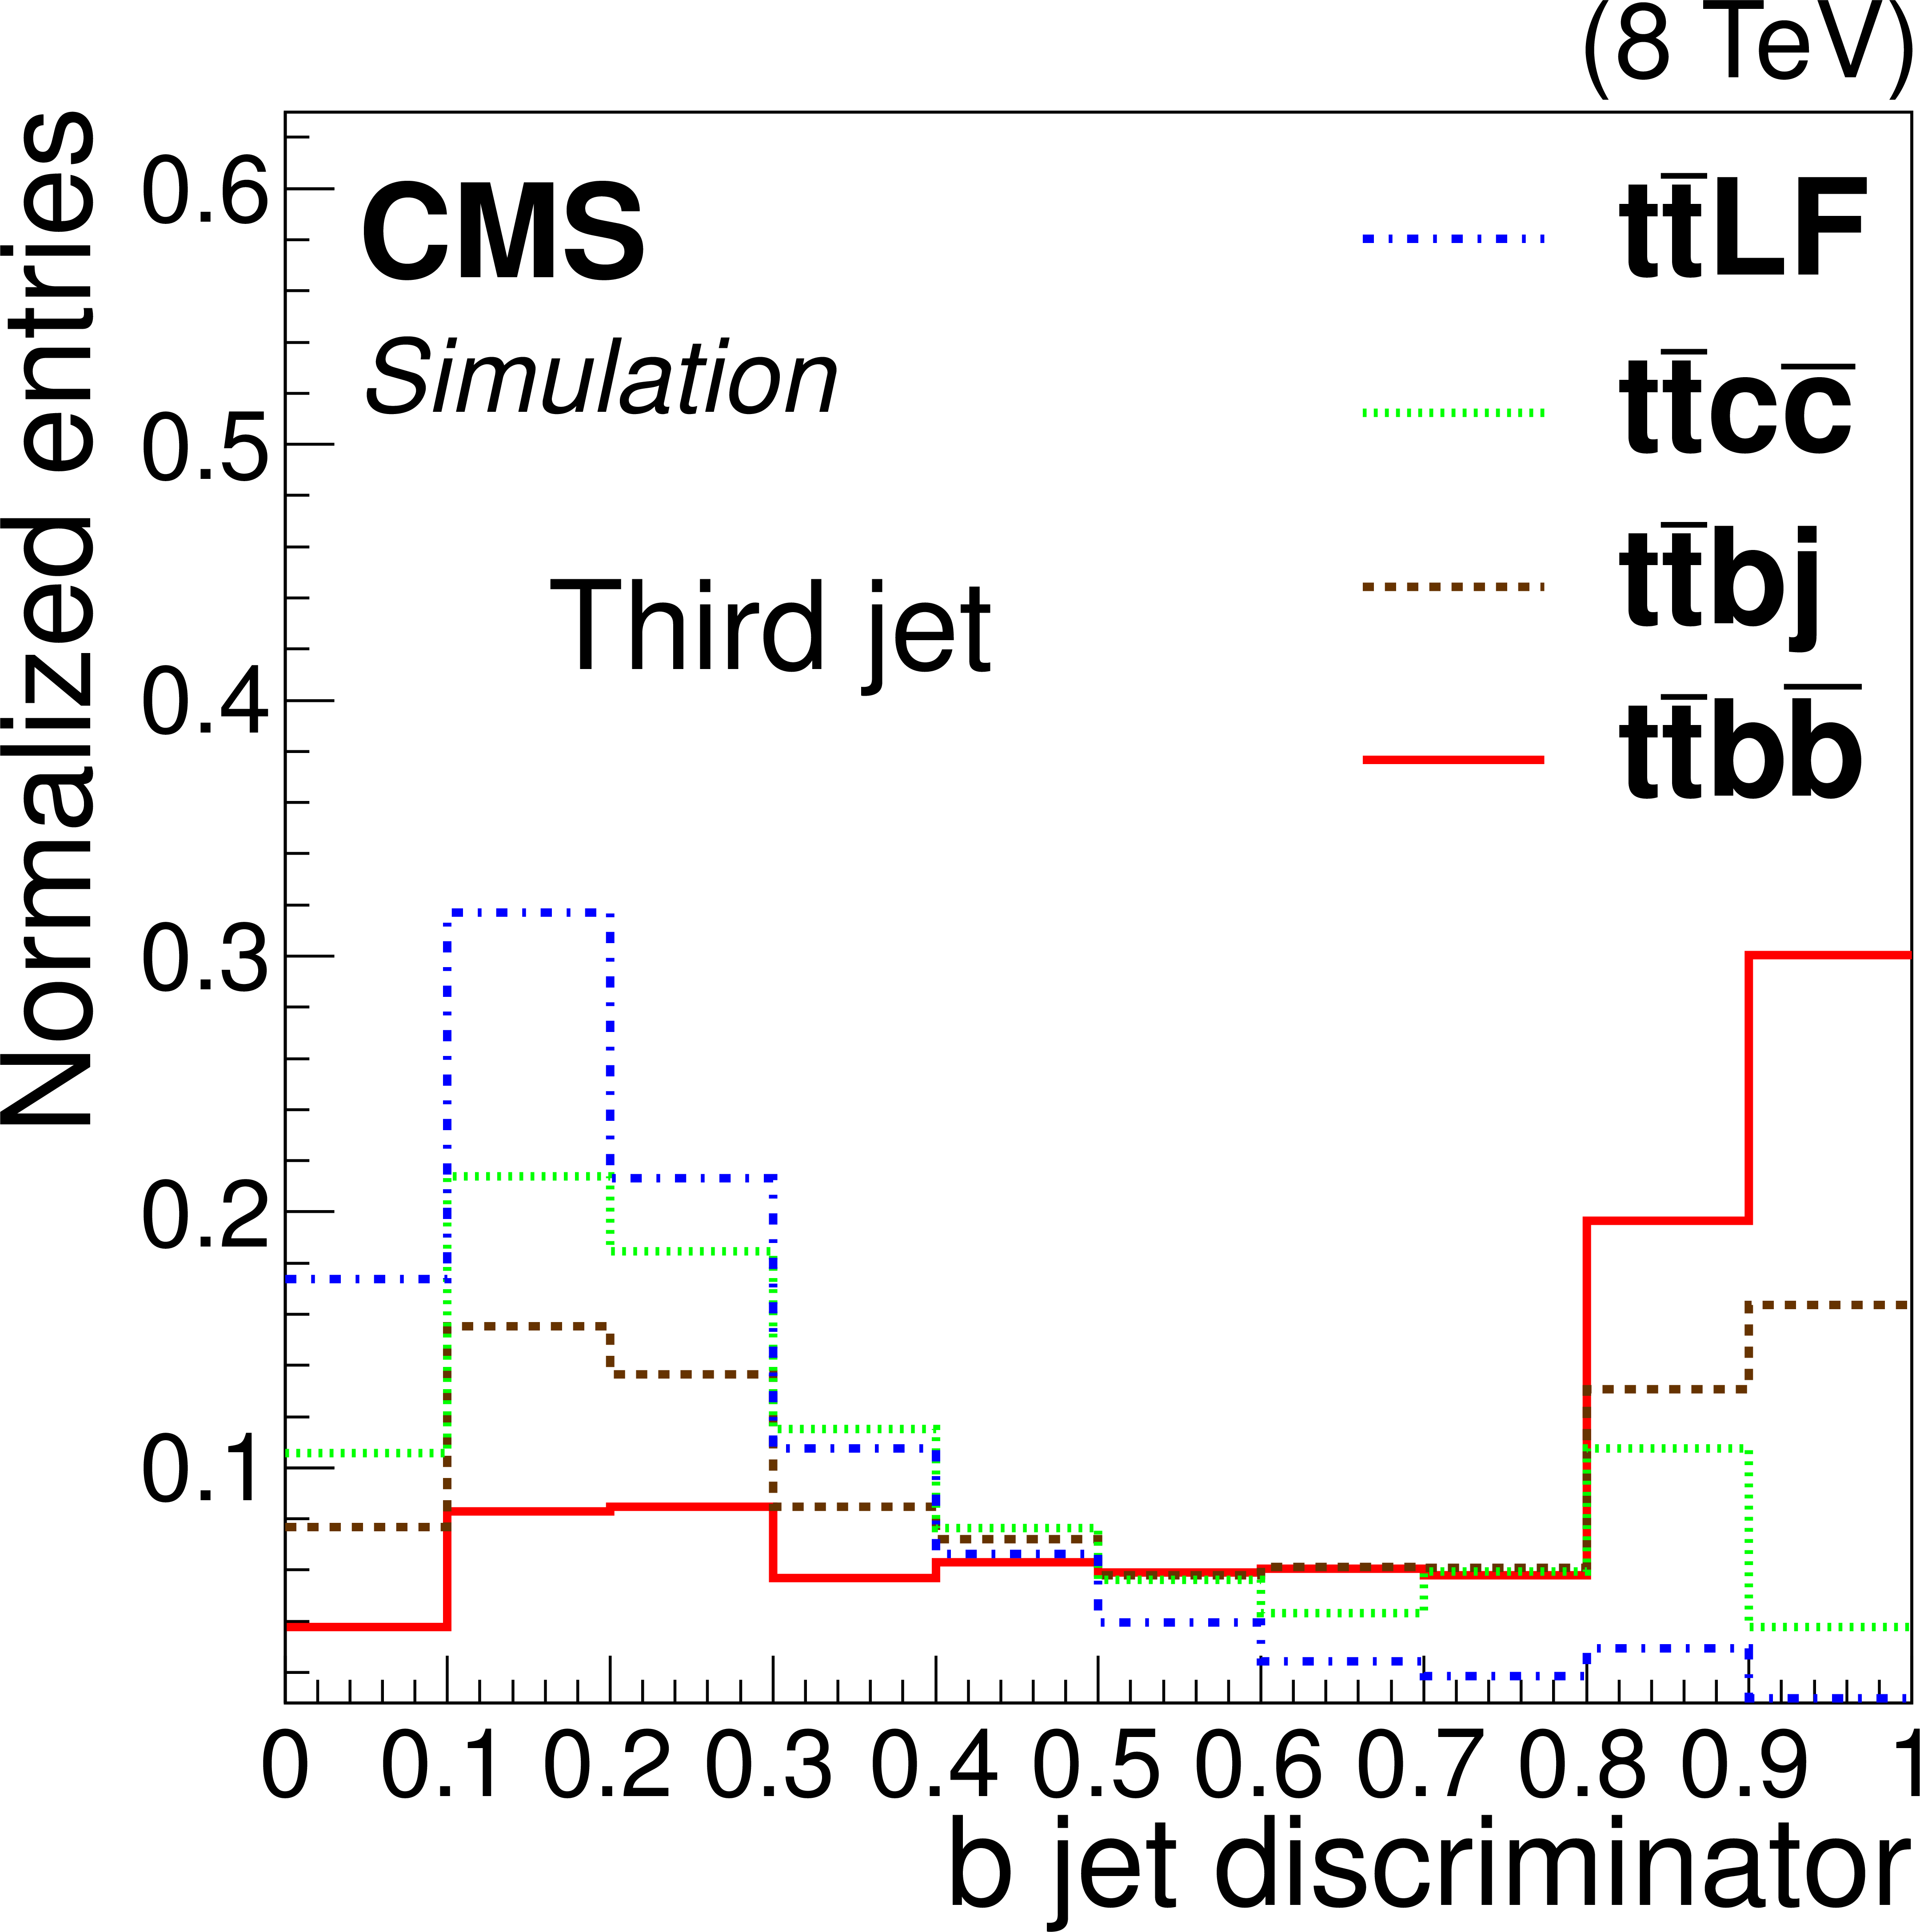
Figure 1-a:
Normalized distributions of the b jet discriminator for the third (a) and fourth (b) jets in an event, sorted in decreasing order of b-tagging discriminator value, after the full event selection. The histograms are obtained from MC simulation and are separated according to jet flavour. |
png pdf |
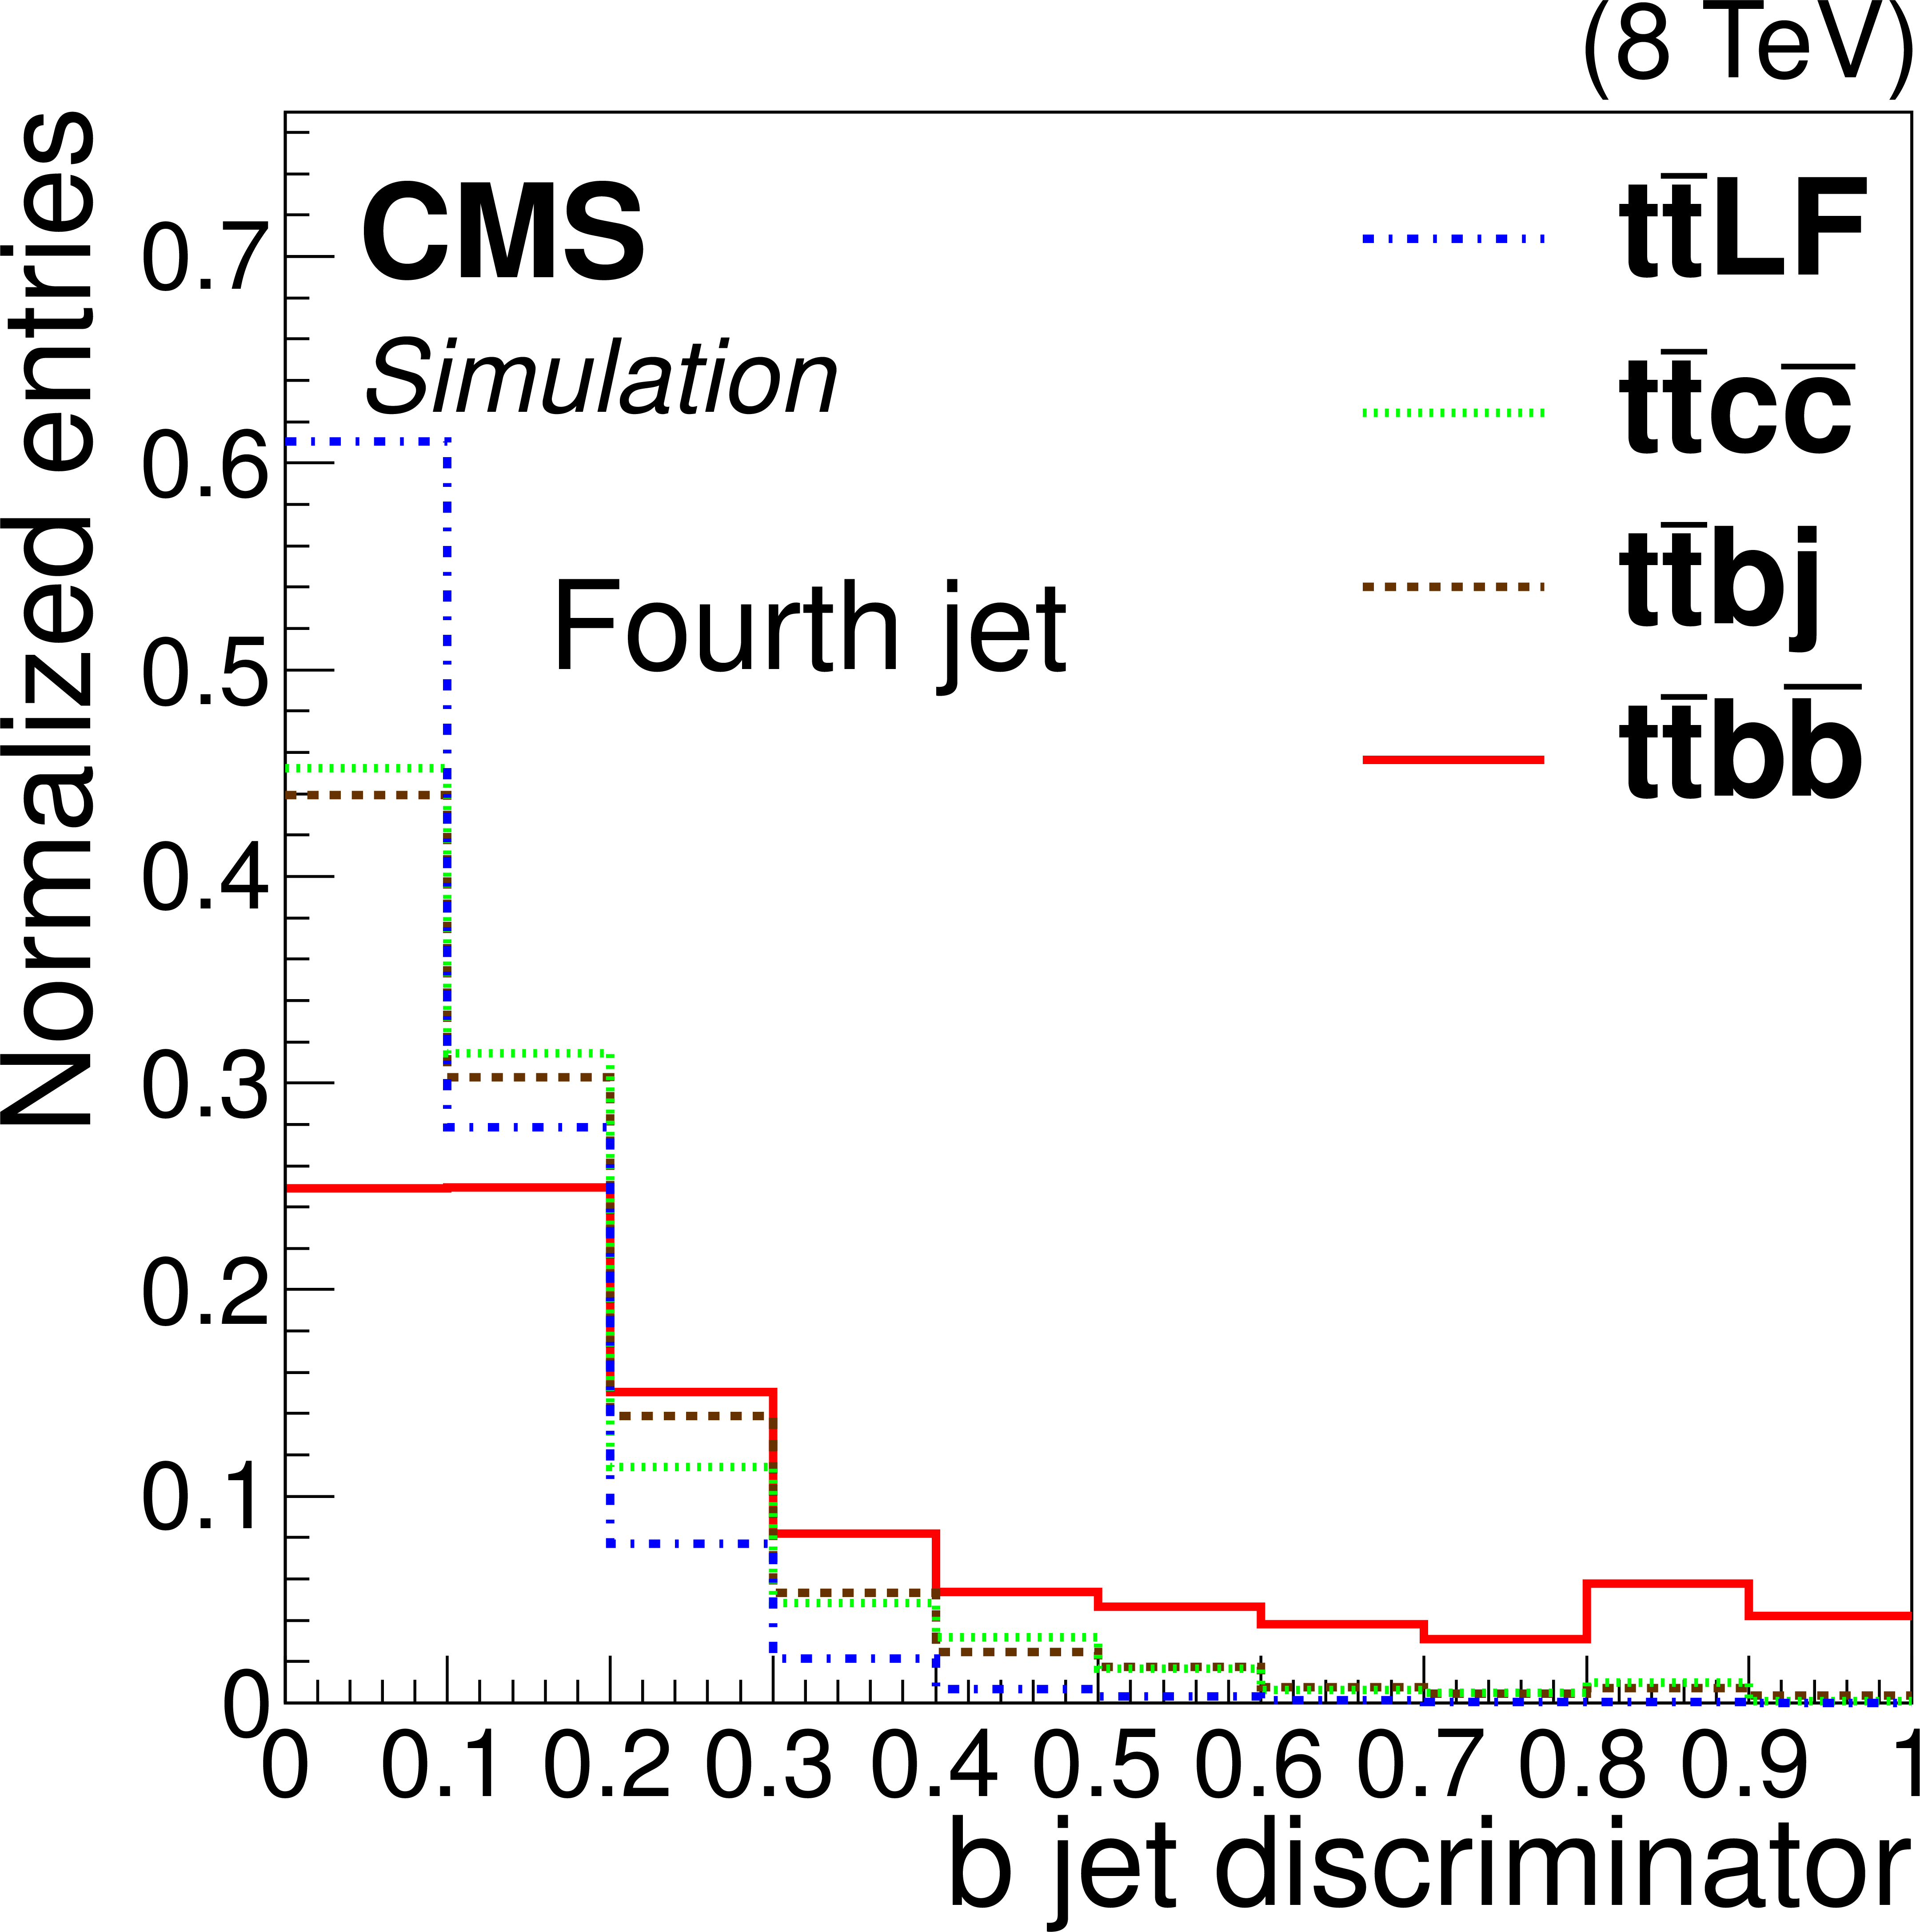
Figure 1-b:
Normalized distributions of the b jet discriminator for the third (a) and fourth (b) jets in an event, sorted in decreasing order of b-tagging discriminator value, after the full event selection. The histograms are obtained from MC simulation and are separated according to jet flavour. |

png pdf |
Figure 2-a:
Distributions of b jet discriminator for the third (a) and fourth (b) jets in events in decreasing order of b-tagging discriminator value, after the full event selection. Points are from data and stacked histograms from MC simulation using results from the fit to data. The ratio of the number of data events to the total number of MC events after the fit is shown in the lower panels. |
png pdf |
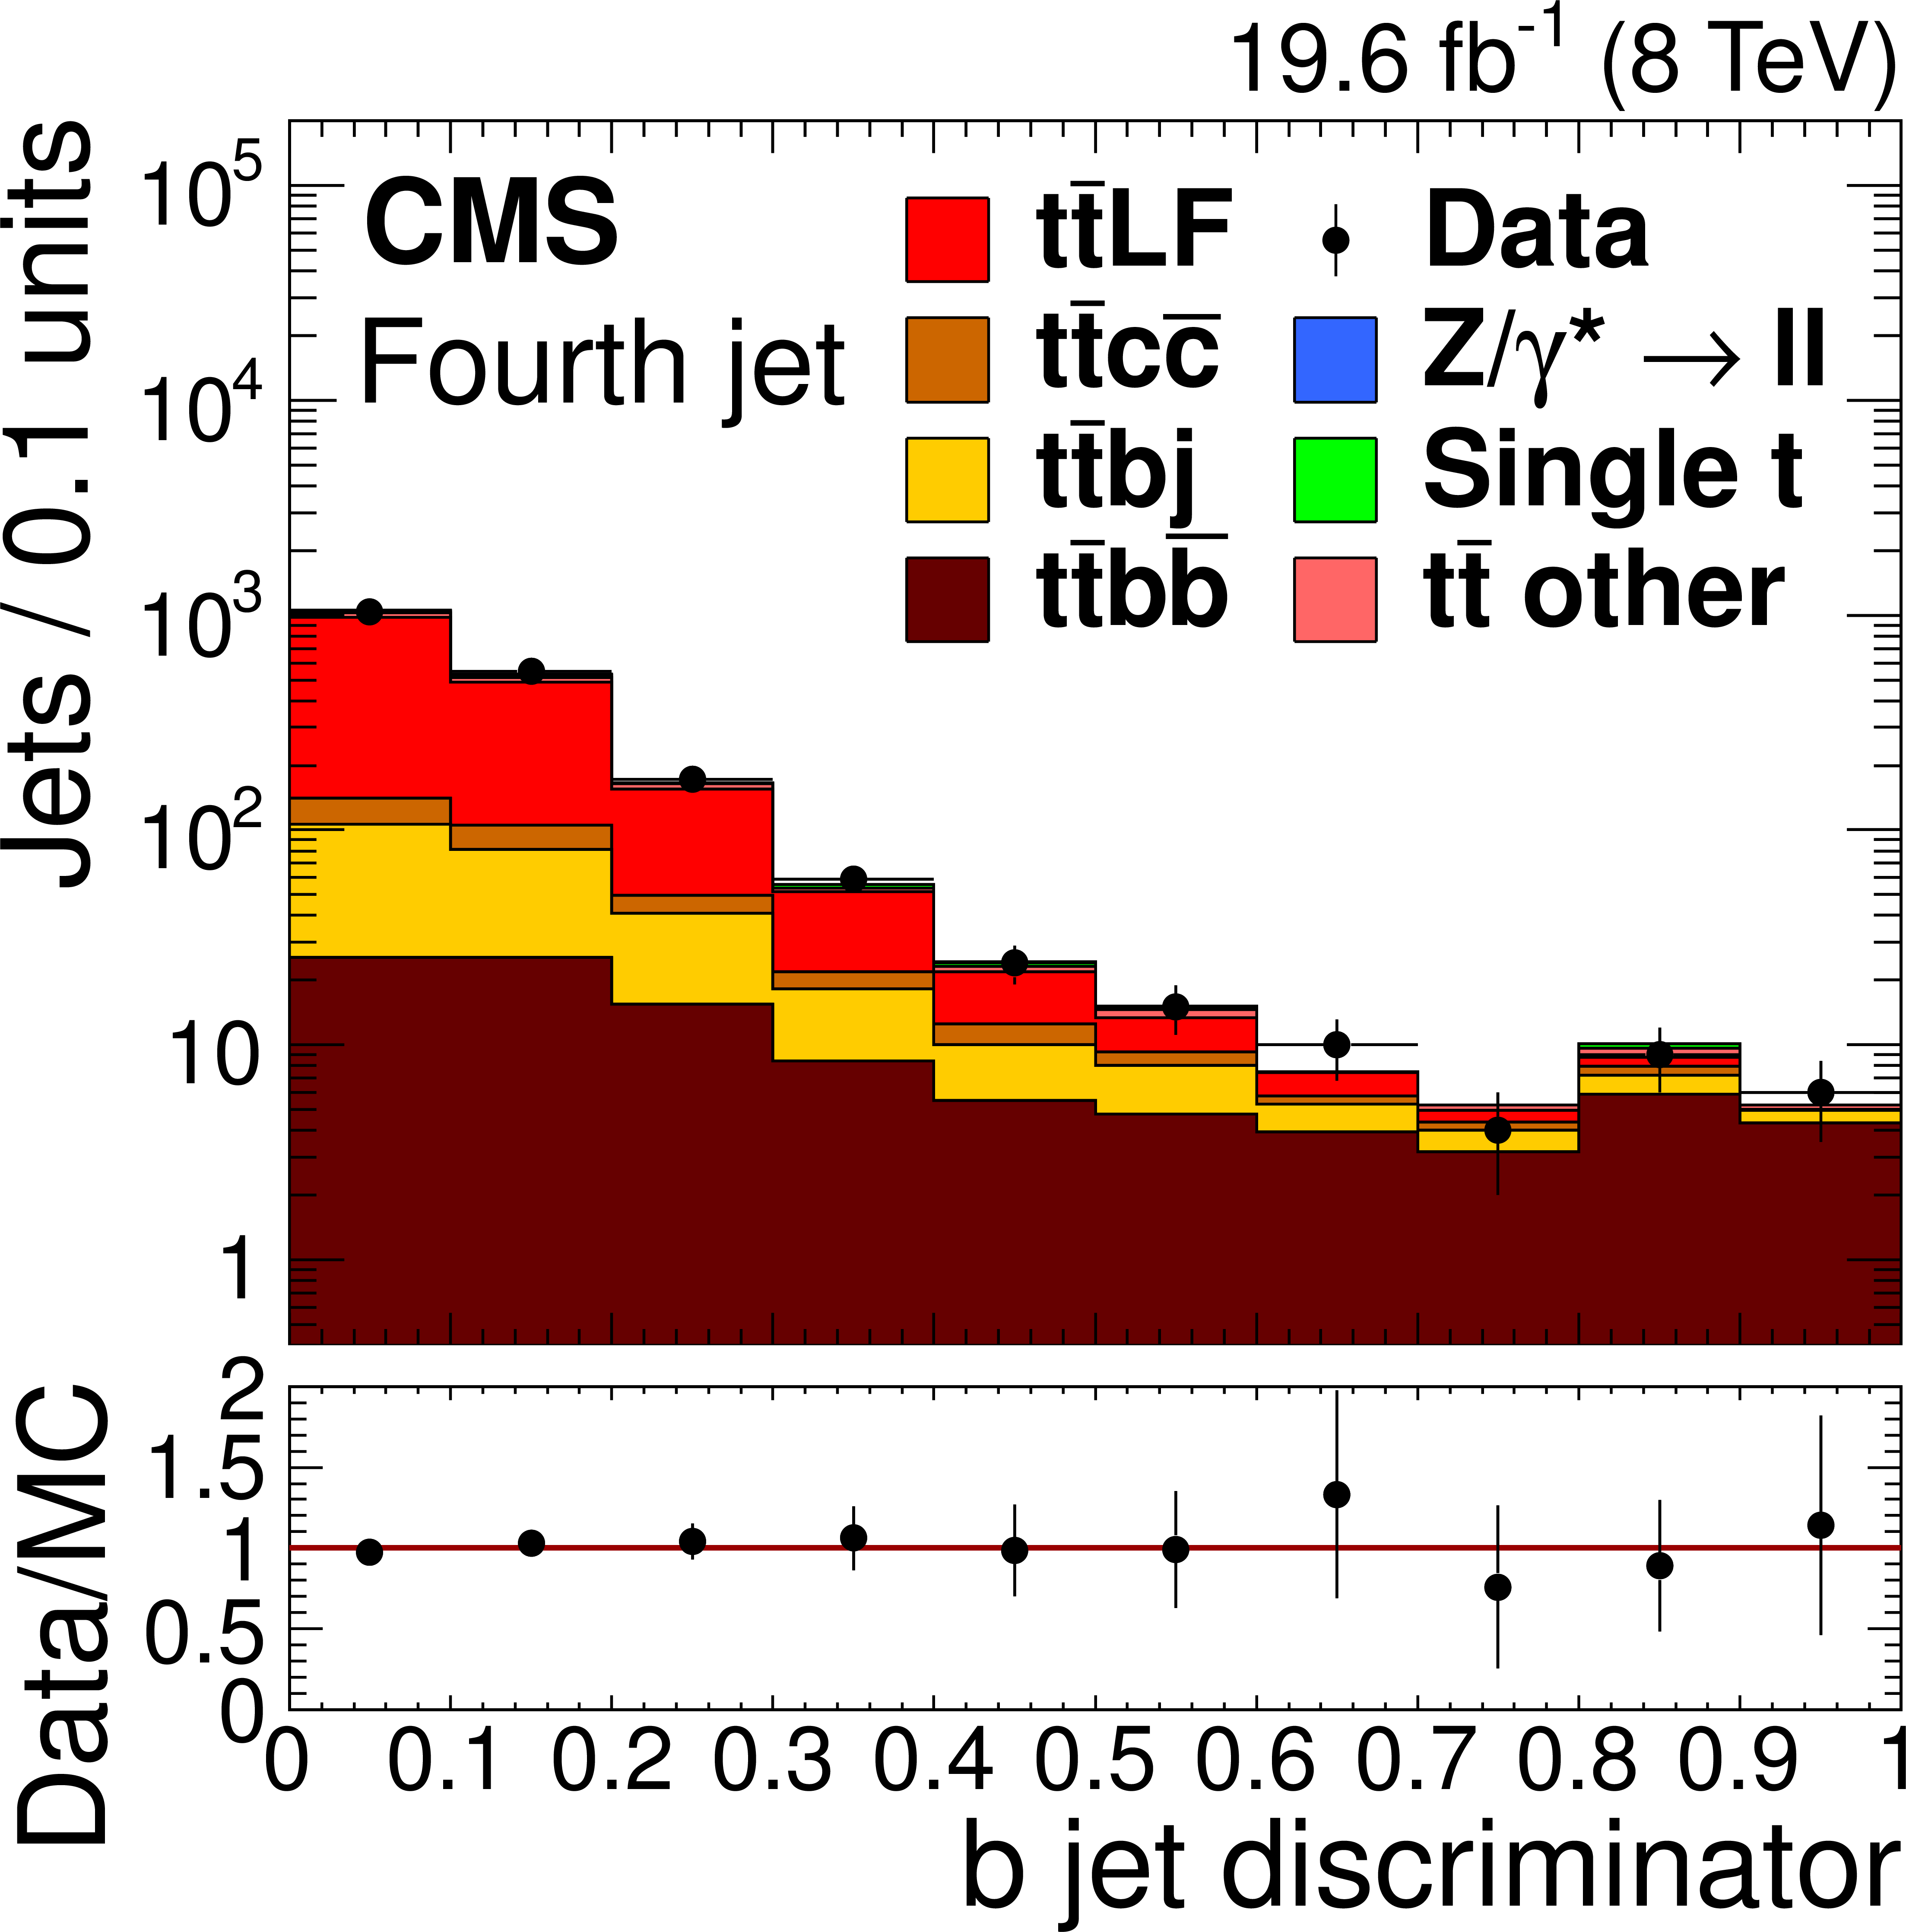
Figure 2-b:
Distributions of b jet discriminator for the third (a) and fourth (b) jets in events in decreasing order of b-tagging discriminator value, after the full event selection. Points are from data and stacked histograms from MC simulation using results from the fit to data. The ratio of the number of data events to the total number of MC events after the fit is shown in the lower panels. |

png pdf |
Figure 3:
Distribution of b jet multiplicity after the four-jet requirement but without the b-tagging requirement. Points are from data and stacked histograms from MC simulation using results from the fit to data. The ratio of the number of data events to the total number of MC events after the fit is shown in the lower panel. |
| Summary |
| A measurement of the cross section ratio $\sigma_\mathrm{t \bar{t} b \bar{b}} / \sigma_\mathrm{t \bar{t} jj }$ has been presented by the CMS experiment, using a data sample of pp collisions at a centre-of-mass energy of 8 TeV, corresponding to an integrated luminosity of 19.6 fb$^{−1}$. The individual cross sections $ \sigma_\mathrm{t \bar{t} jj }$ and $\sigma_\mathrm{t \bar{t} b \bar{b}}$ have also been determined. The cross section ratio was measured in a visible phase-space region using the dilepton decay mode of $ \mathrm{ t \bar{t} } $ events and corrected to the particle level, corresponding to the detector acceptance. The measured cross section ratio in the visible phase space is $\sigma_\mathrm{t \bar{t} b \bar{b}} / \sigma_\mathrm{t \bar{t} jj } =$ 0.022 $\pm$ 0.003 (stat) $\pm$ 0.005 (syst) with a minimum $ p_{\mathrm{T}}$ for the particle-level jets of 20 GeV/$c$. The cross section ratio has also been measured in the full phase space with minimum parton-jet $ p_{\mathrm{T}}$ thresholds of $ p_{\mathrm{T}} >$ 20 and $>$ 40 GeV/$c$ in order to compare with a NLO QCD calculation of the cross section ratio. The measurement is compatible within 1.6 standard deviations with the theoretical prediction. These are the first measurements of the cross sections $\sigma_\mathrm{t \bar{t} b \bar{b}}$ and $ \sigma_\mathrm{t \bar{t} jj }$, and their ratio. The result will provide important information about the main background in the search for $ \mathrm{t \bar{t} H }$ and as a figure of merit for testing the validity of NLO QCD calculations. |
|
|
Compact Muon Solenoid LHC, CERN |
|

|

|

|

|

|