

Compact Muon Solenoid
LHC, CERN
| CMS-TOP-14-003 ; CERN-PH-EP-2015-287 | ||
| Search for anomalous single top quark production in association with a photon in pp collisions at $\sqrt{s}=$ 8 TeV | ||
| CMS Collaboration | ||
| 12 November 2015 | ||
| JHEP 04 (2016) 035 | ||
| Abstract: The result of a search for flavor changing neutral currents (FCNC) through single top quark production in association with a photon is presented. The study is based on proton-proton collisions at a center-of-mass energy of 8 TeV using data collected with the CMS detector at the LHC, corresponding to an integrated luminosity of 19.8 fb$^{-1}$. The search for $\mathrm{t} \gamma$ events where $ \mathrm{ t \to Wb } $ and $\mathrm{ W \to \mu\nu }$ is conducted in final states with a muon, a photon, at least one hadronic jet with at most one being consistent with originating from a bottom quark, and missing transverse momentum. No evidence of single top quark production in association with a photon through a FCNC is observed. Upper limits at the 95% confidence level are set on the $ \mathrm{ t u \gamma } $ and $ \mathrm{ t c \gamma } $ anomalous couplings and translated into upper limits on the branching fraction of the FCNC top quark decays: $\mathcal{B}(\mathrm{ t \to u \gamma }) <$ 1.3 $\times$ 10$^{-4} $ and $\mathcal{B}(\mathrm{ t \to c \gamma }) <$ 1.7 $\times$ 10$^{-3}$. Upper limits are also set on the cross section of associated $\mathrm{t} \gamma$ production in a restricted phase-space region. These are the most stringent limits currently available. | ||
| Links: e-print arXiv:1511.03951 [hep-ex] (PDF) ; CDS record ; inSPIRE record ; HepData record ; CADI line (restricted) ; | ||
| Figures | |
png pdf |
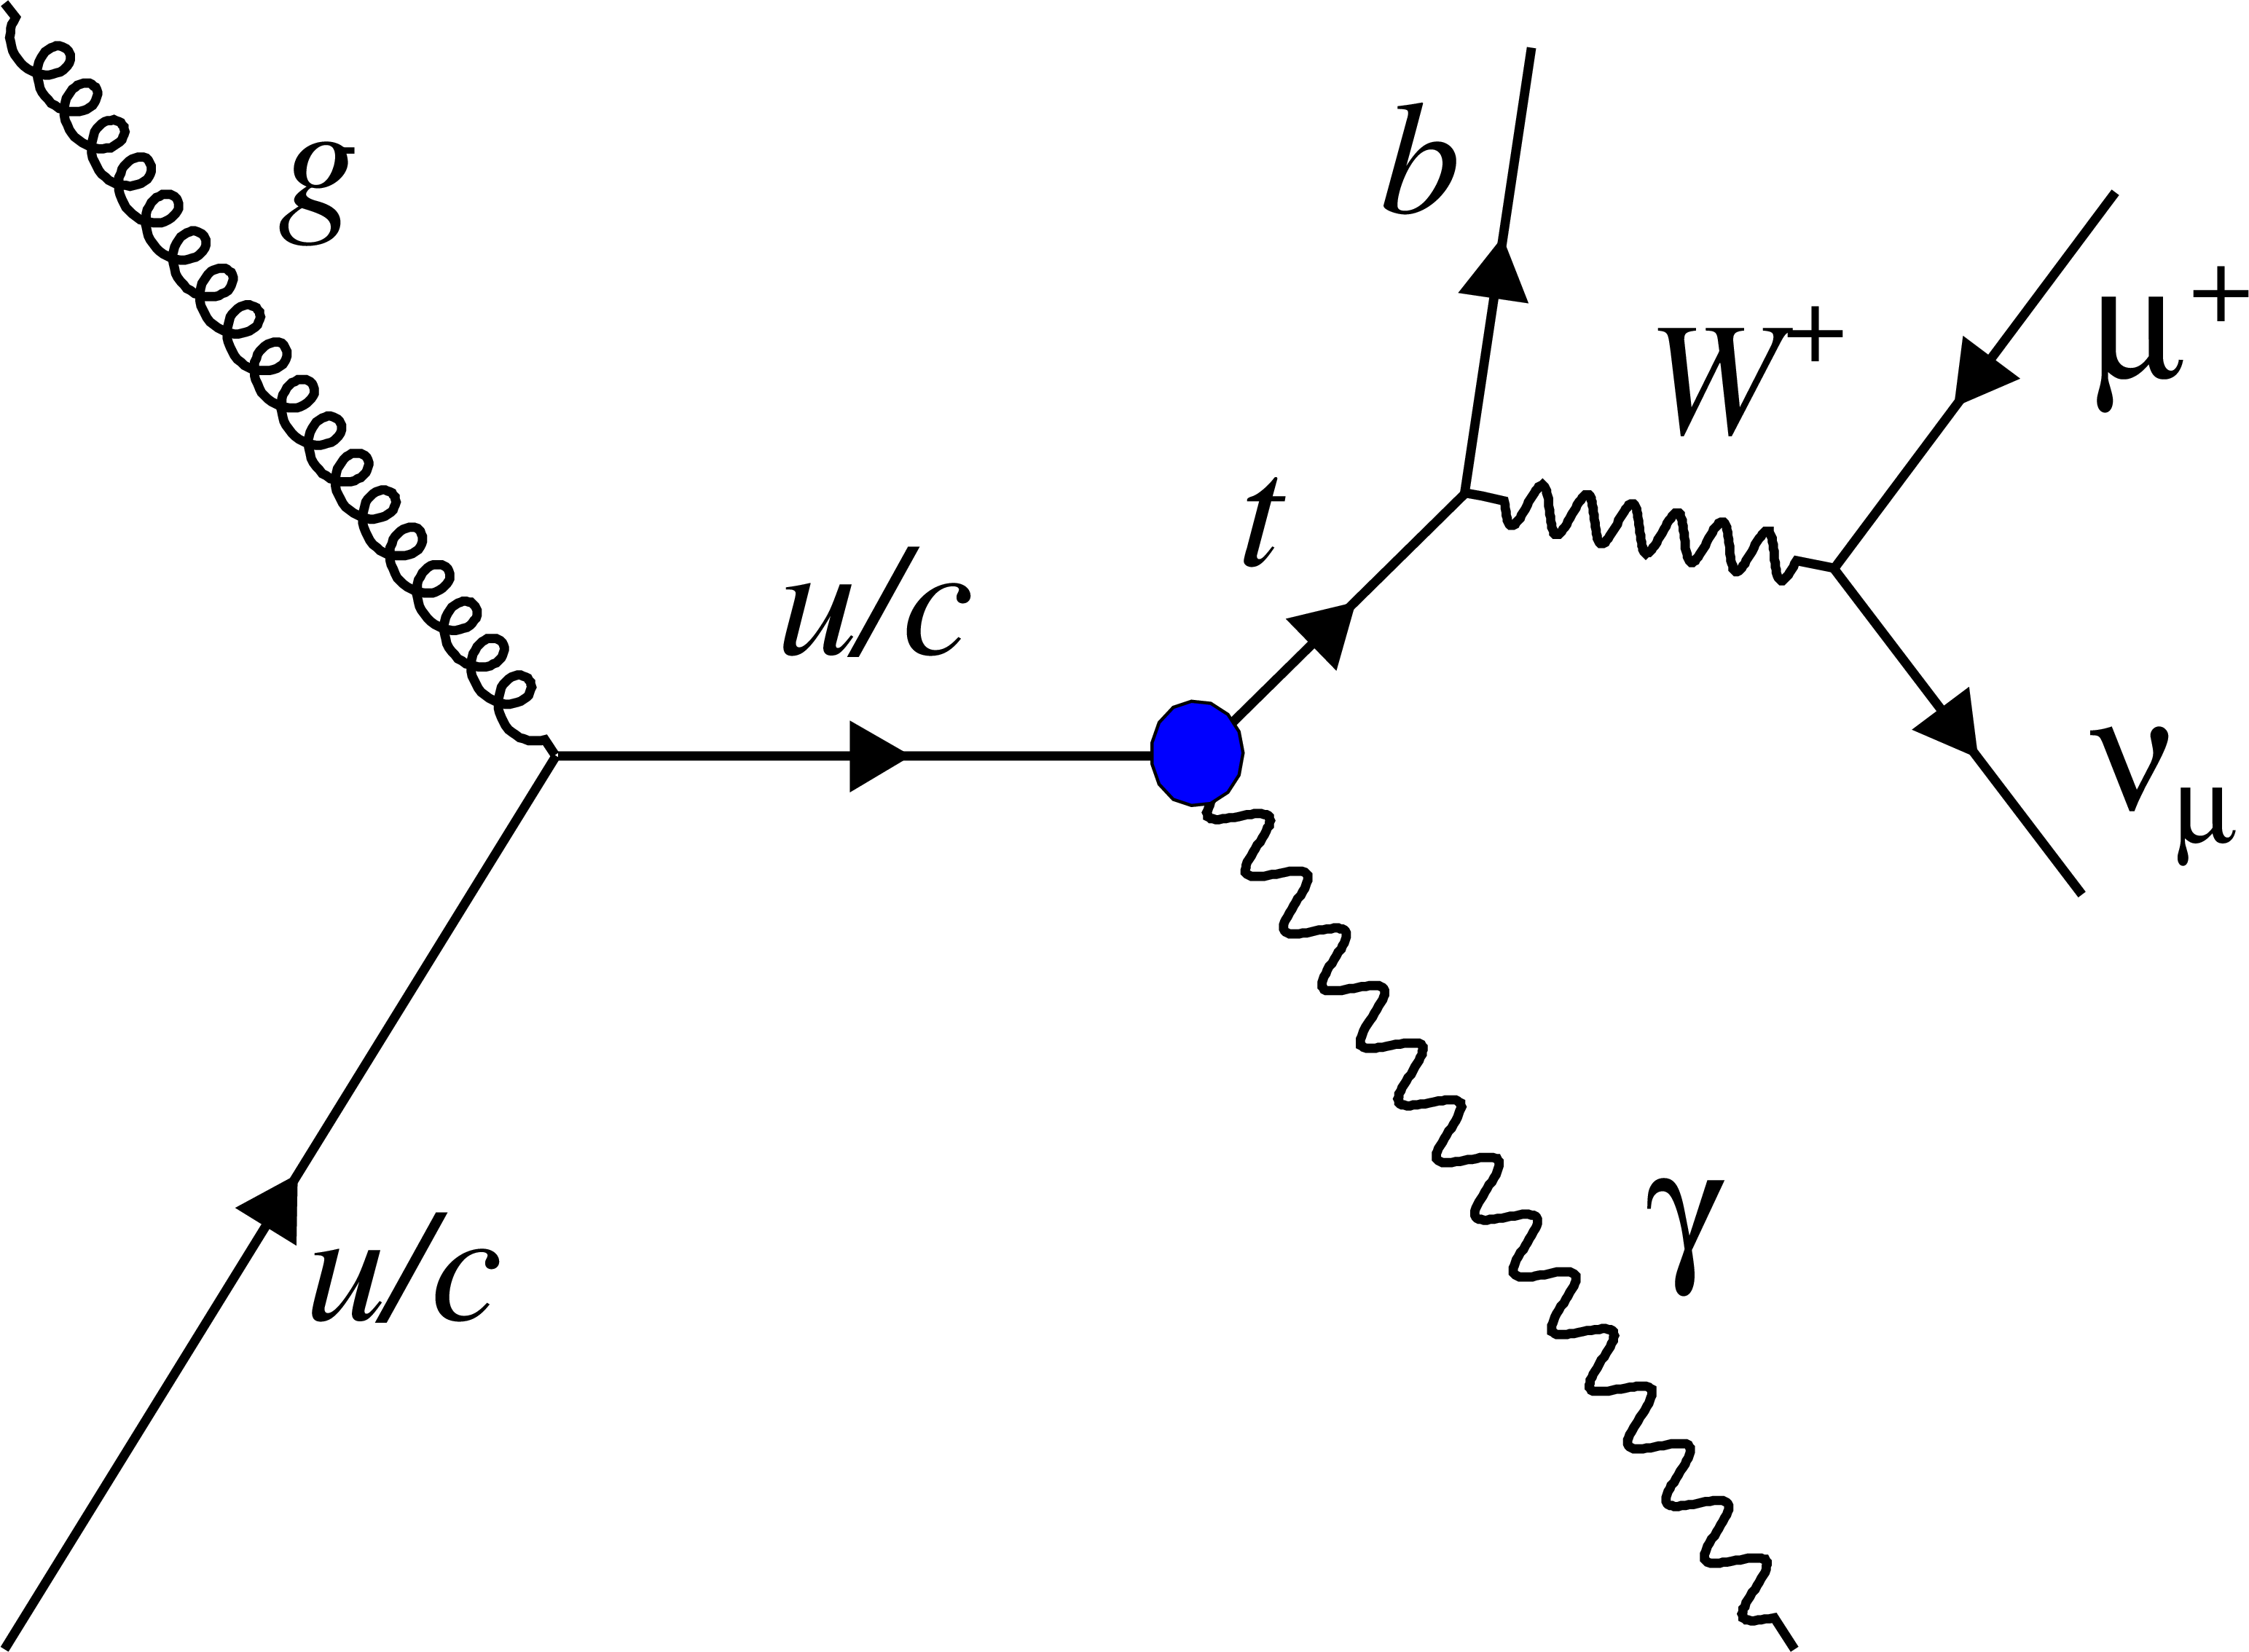
Figure 1:
Lowest-order Feynman diagram for single top quark production in association with a photon via a FCNC, including the muonic decay of the W boson from the top quark decay. The FCNC vertex is marked as a filled circle. |
png pdf |
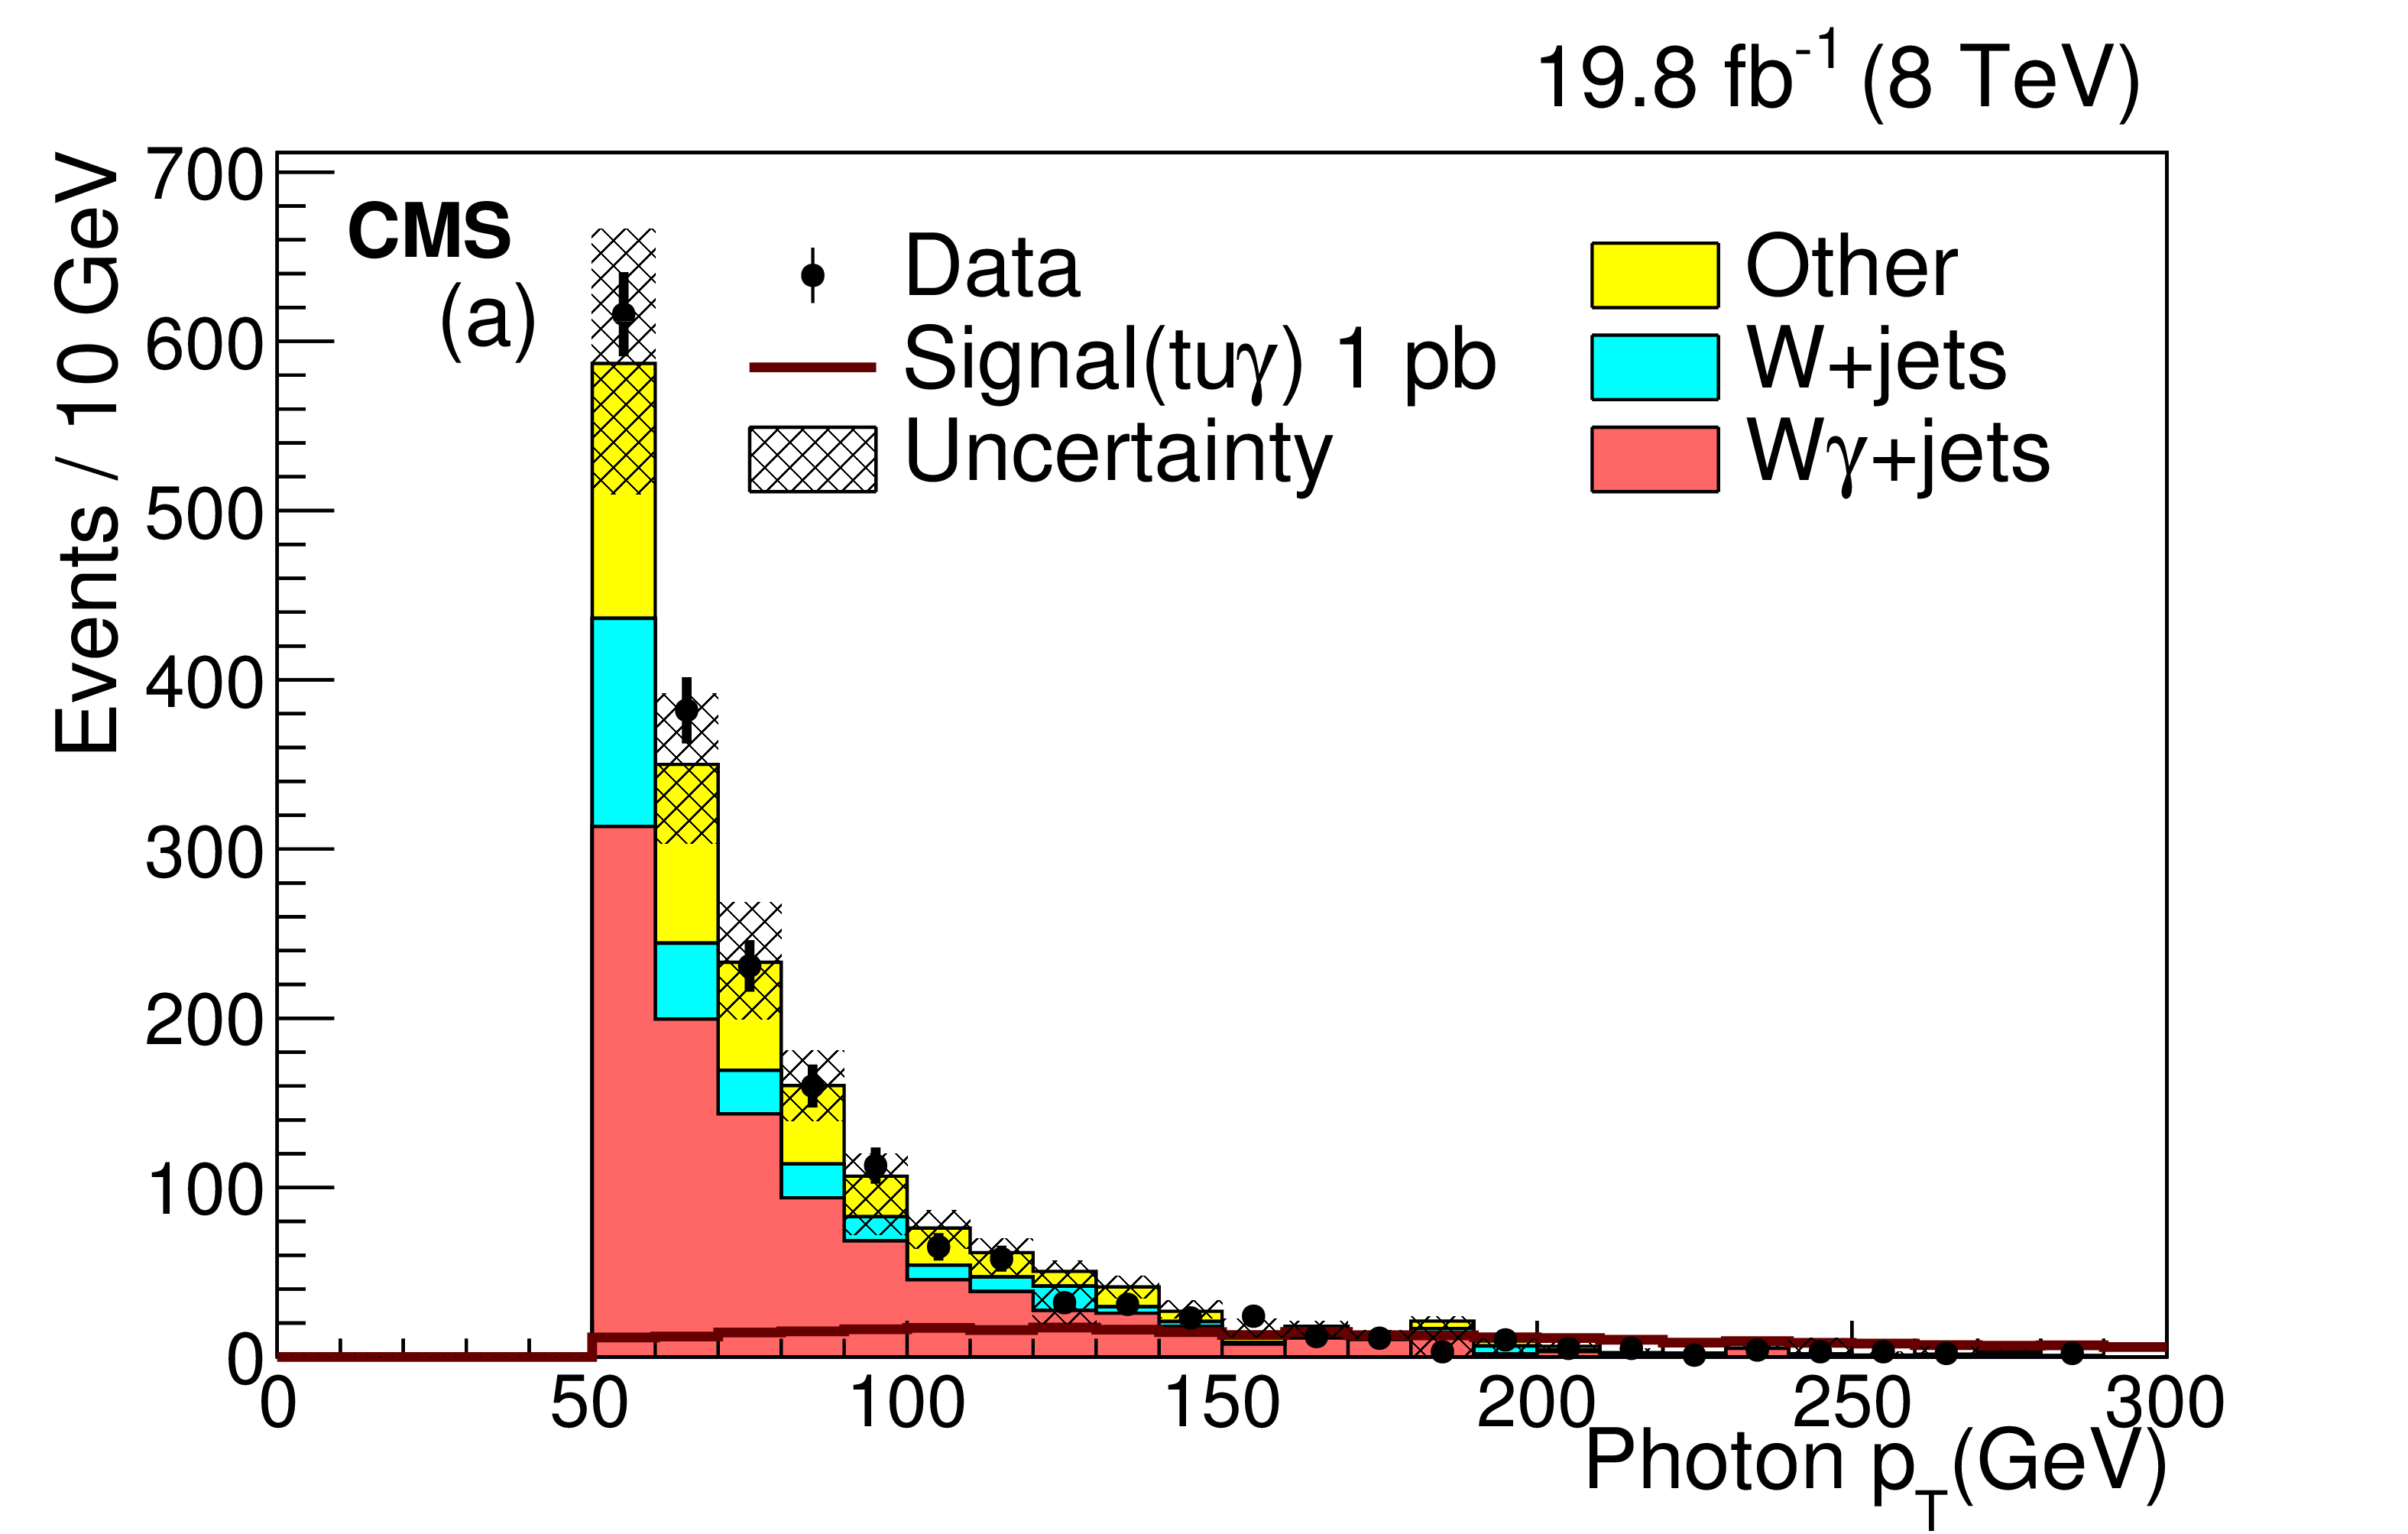
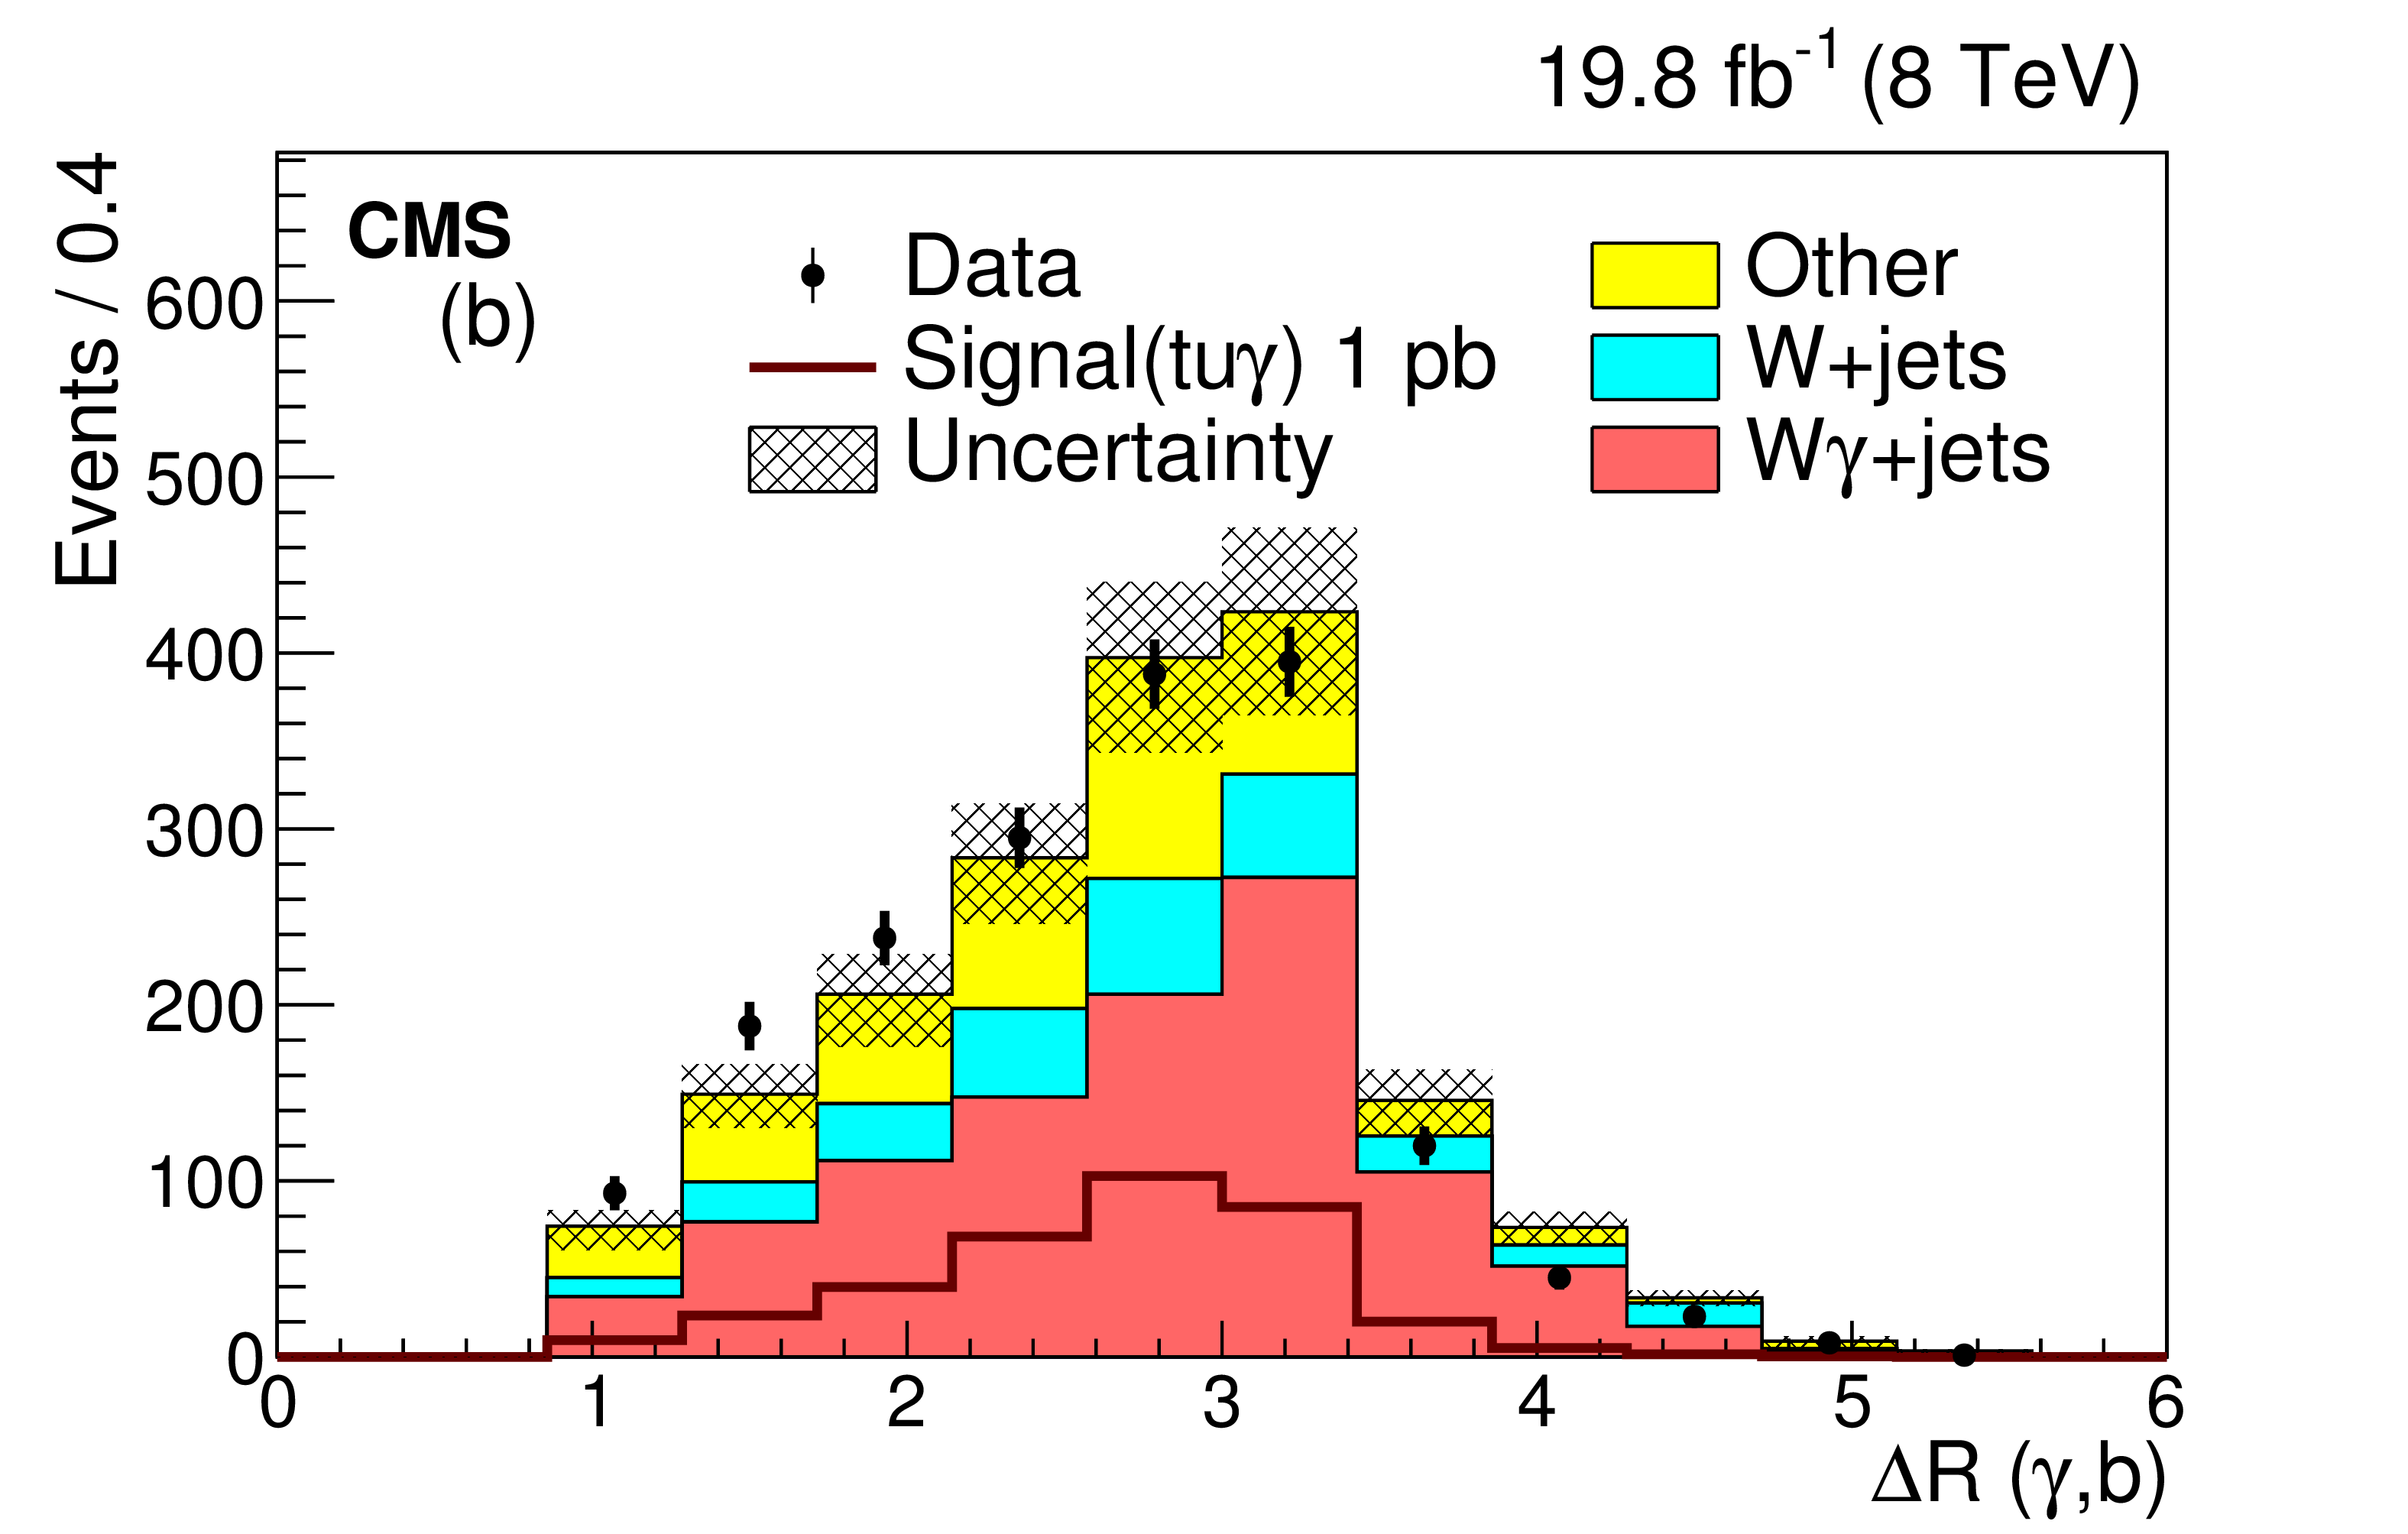
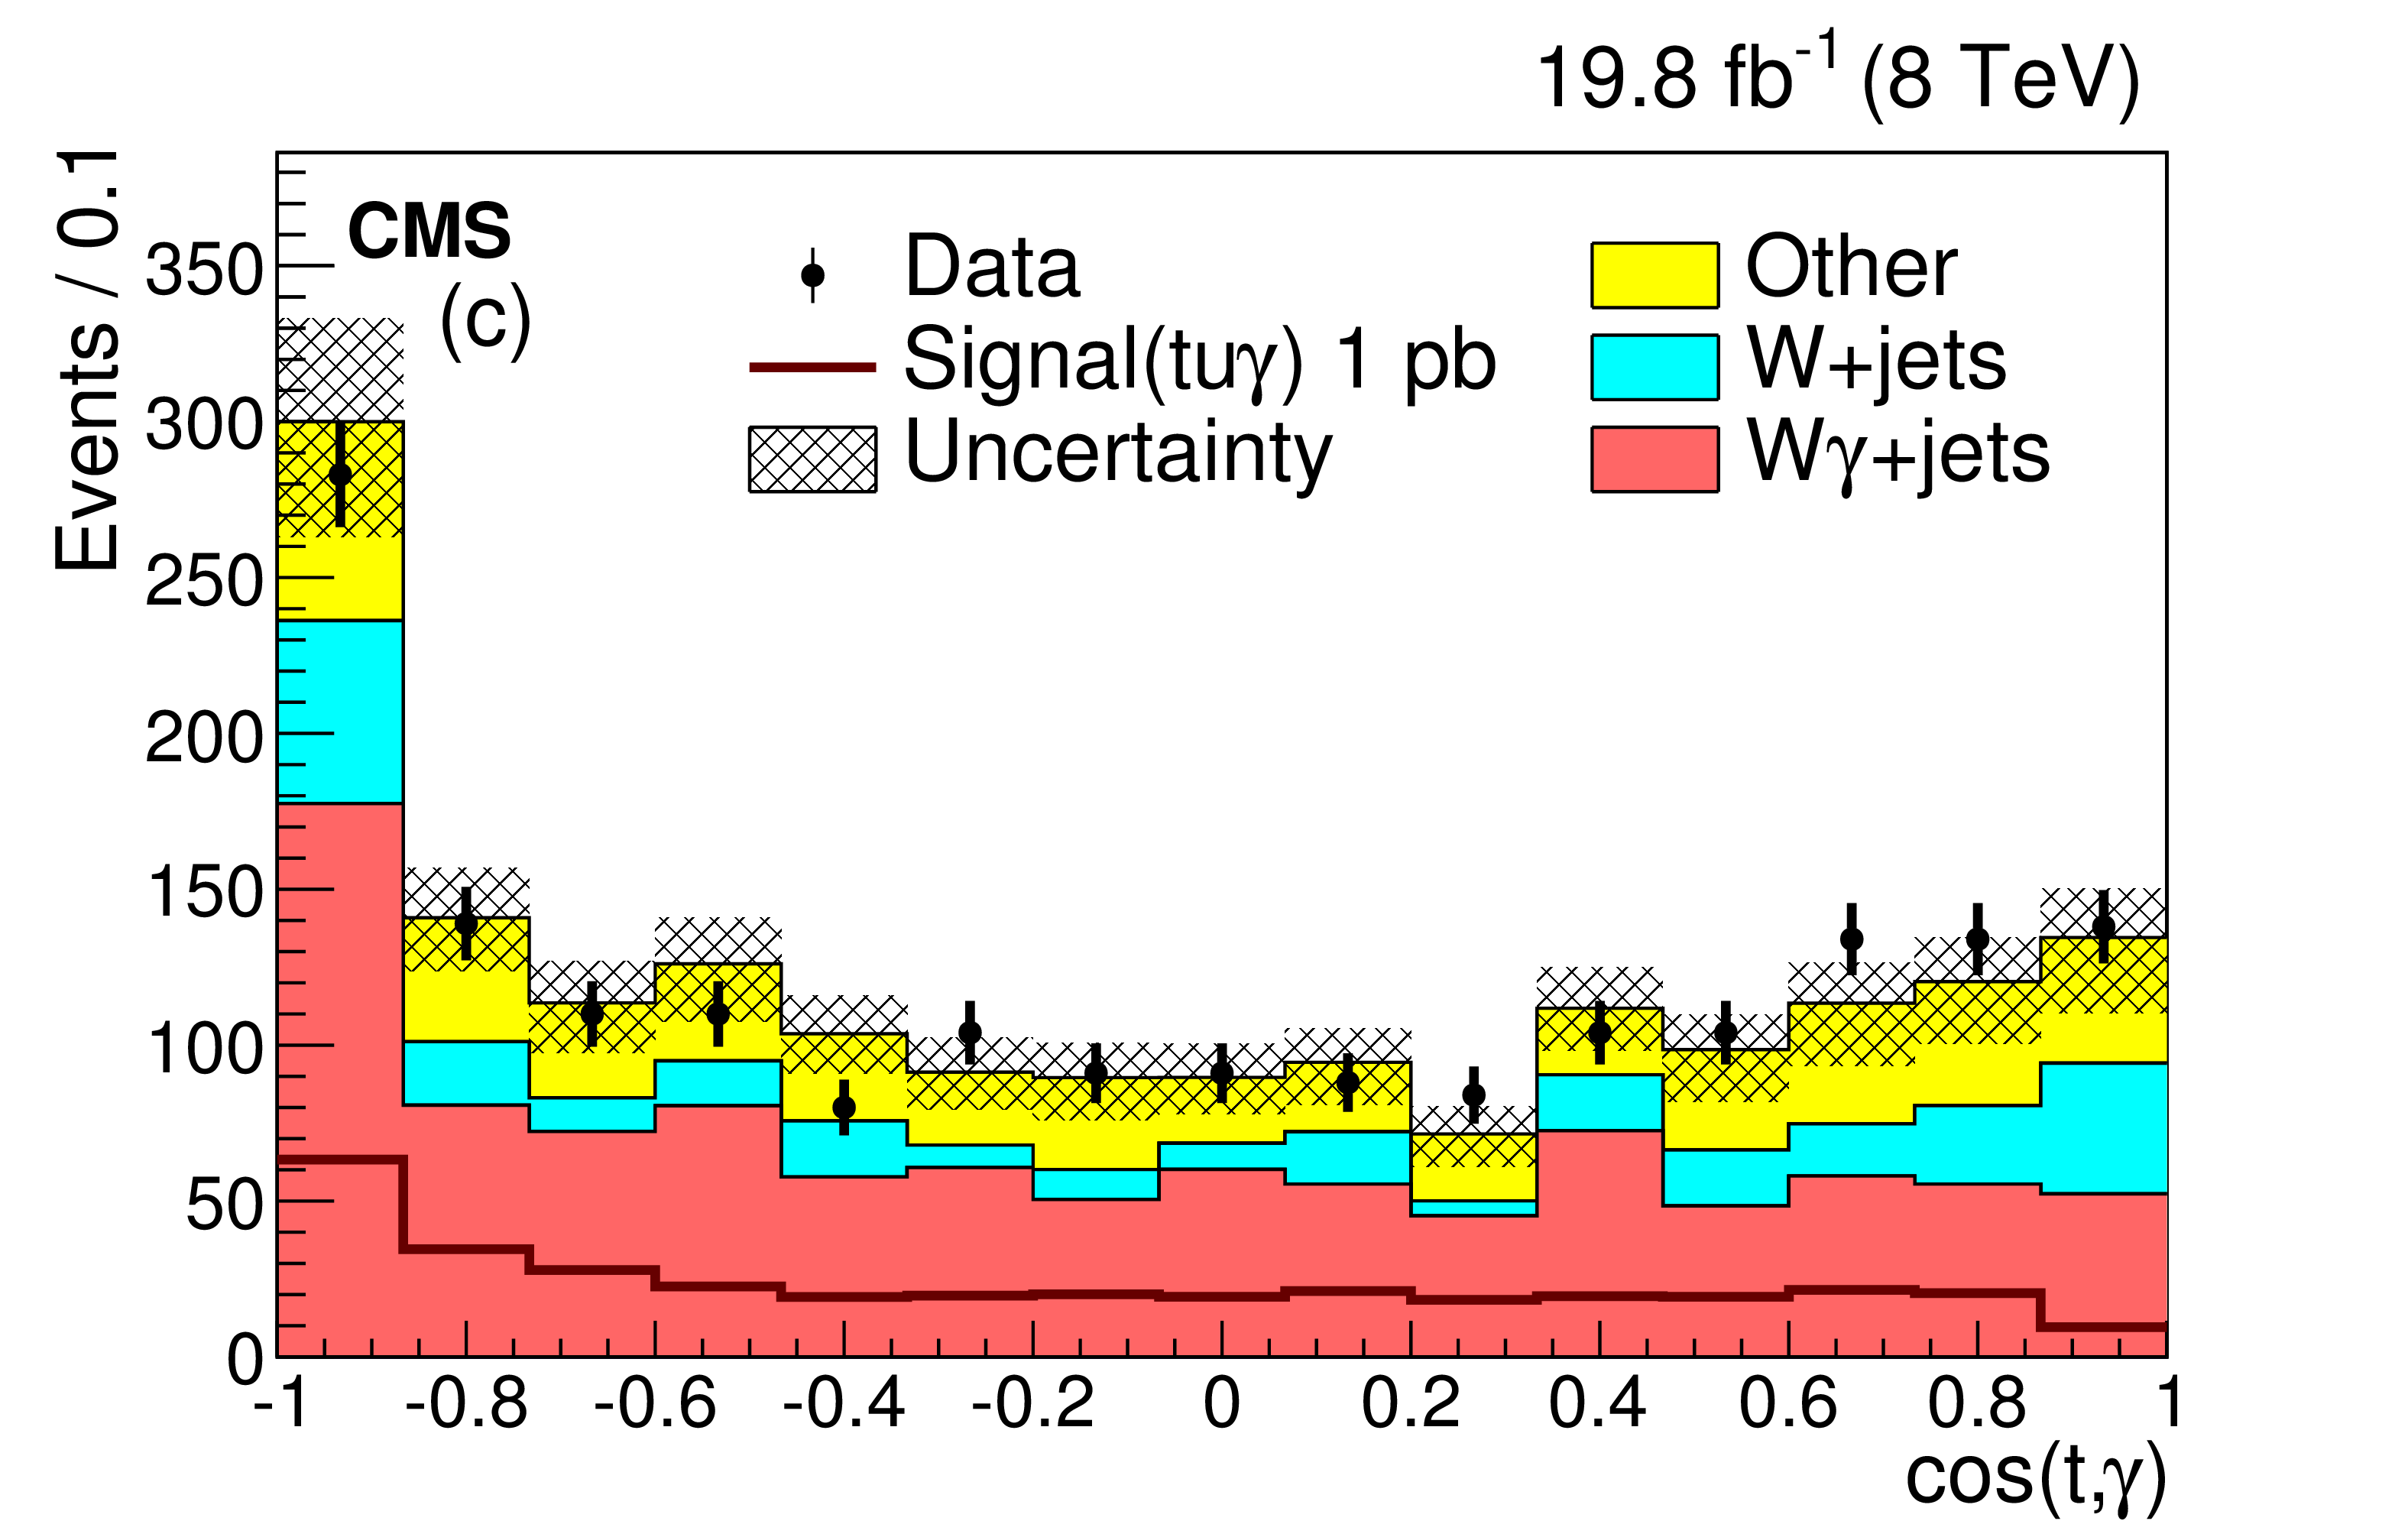
Figure 2-a:
Distributions of some of the input variables to the BDT: (a) $ {p_{\mathrm {T}}} $ of the photon, (b) $\Delta R(\gamma ,\mathrm{ b } )$, (c) $\cos(\mathrm{ t } ,\gamma )$, and (d) muon charge after the final event selection for data (points), the expected $\mathrm{ t } \mathrm{ u } \gamma $ signal (solid line), and background (histograms). The $\mathrm{ t } \mathrm{ u } \gamma $ signal distributions are normalized to a cross section of 1pb. The vertical bars on the points show the statistical uncertainties in the data. The hatched band shows the sum of the statistical and systematic uncertainties in the estimated background combined in quadrature. |
png pdf |
Figure 2-b:
Distributions of some of the input variables to the BDT: (a) $ {p_{\mathrm {T}}} $ of the photon, (b) $\Delta R(\gamma ,\mathrm{ b } )$, (c) $\cos(\mathrm{ t } ,\gamma )$, and (d) muon charge after the final event selection for data (points), the expected $\mathrm{ t } \mathrm{ u } \gamma $ signal (solid line), and background (histograms). The $\mathrm{ t } \mathrm{ u } \gamma $ signal distributions are normalized to a cross section of 1pb. The vertical bars on the points show the statistical uncertainties in the data. The hatched band shows the sum of the statistical and systematic uncertainties in the estimated background combined in quadrature. |
png pdf |
Figure 2-c:
Distributions of some of the input variables to the BDT: (a) $ {p_{\mathrm {T}}} $ of the photon, (b) $\Delta R(\gamma ,\mathrm{ b } )$, (c) $\cos(\mathrm{ t } ,\gamma )$, and (d) muon charge after the final event selection for data (points), the expected $\mathrm{ t } \mathrm{ u } \gamma $ signal (solid line), and background (histograms). The $\mathrm{ t } \mathrm{ u } \gamma $ signal distributions are normalized to a cross section of 1pb. The vertical bars on the points show the statistical uncertainties in the data. The hatched band shows the sum of the statistical and systematic uncertainties in the estimated background combined in quadrature. |
png pdf |
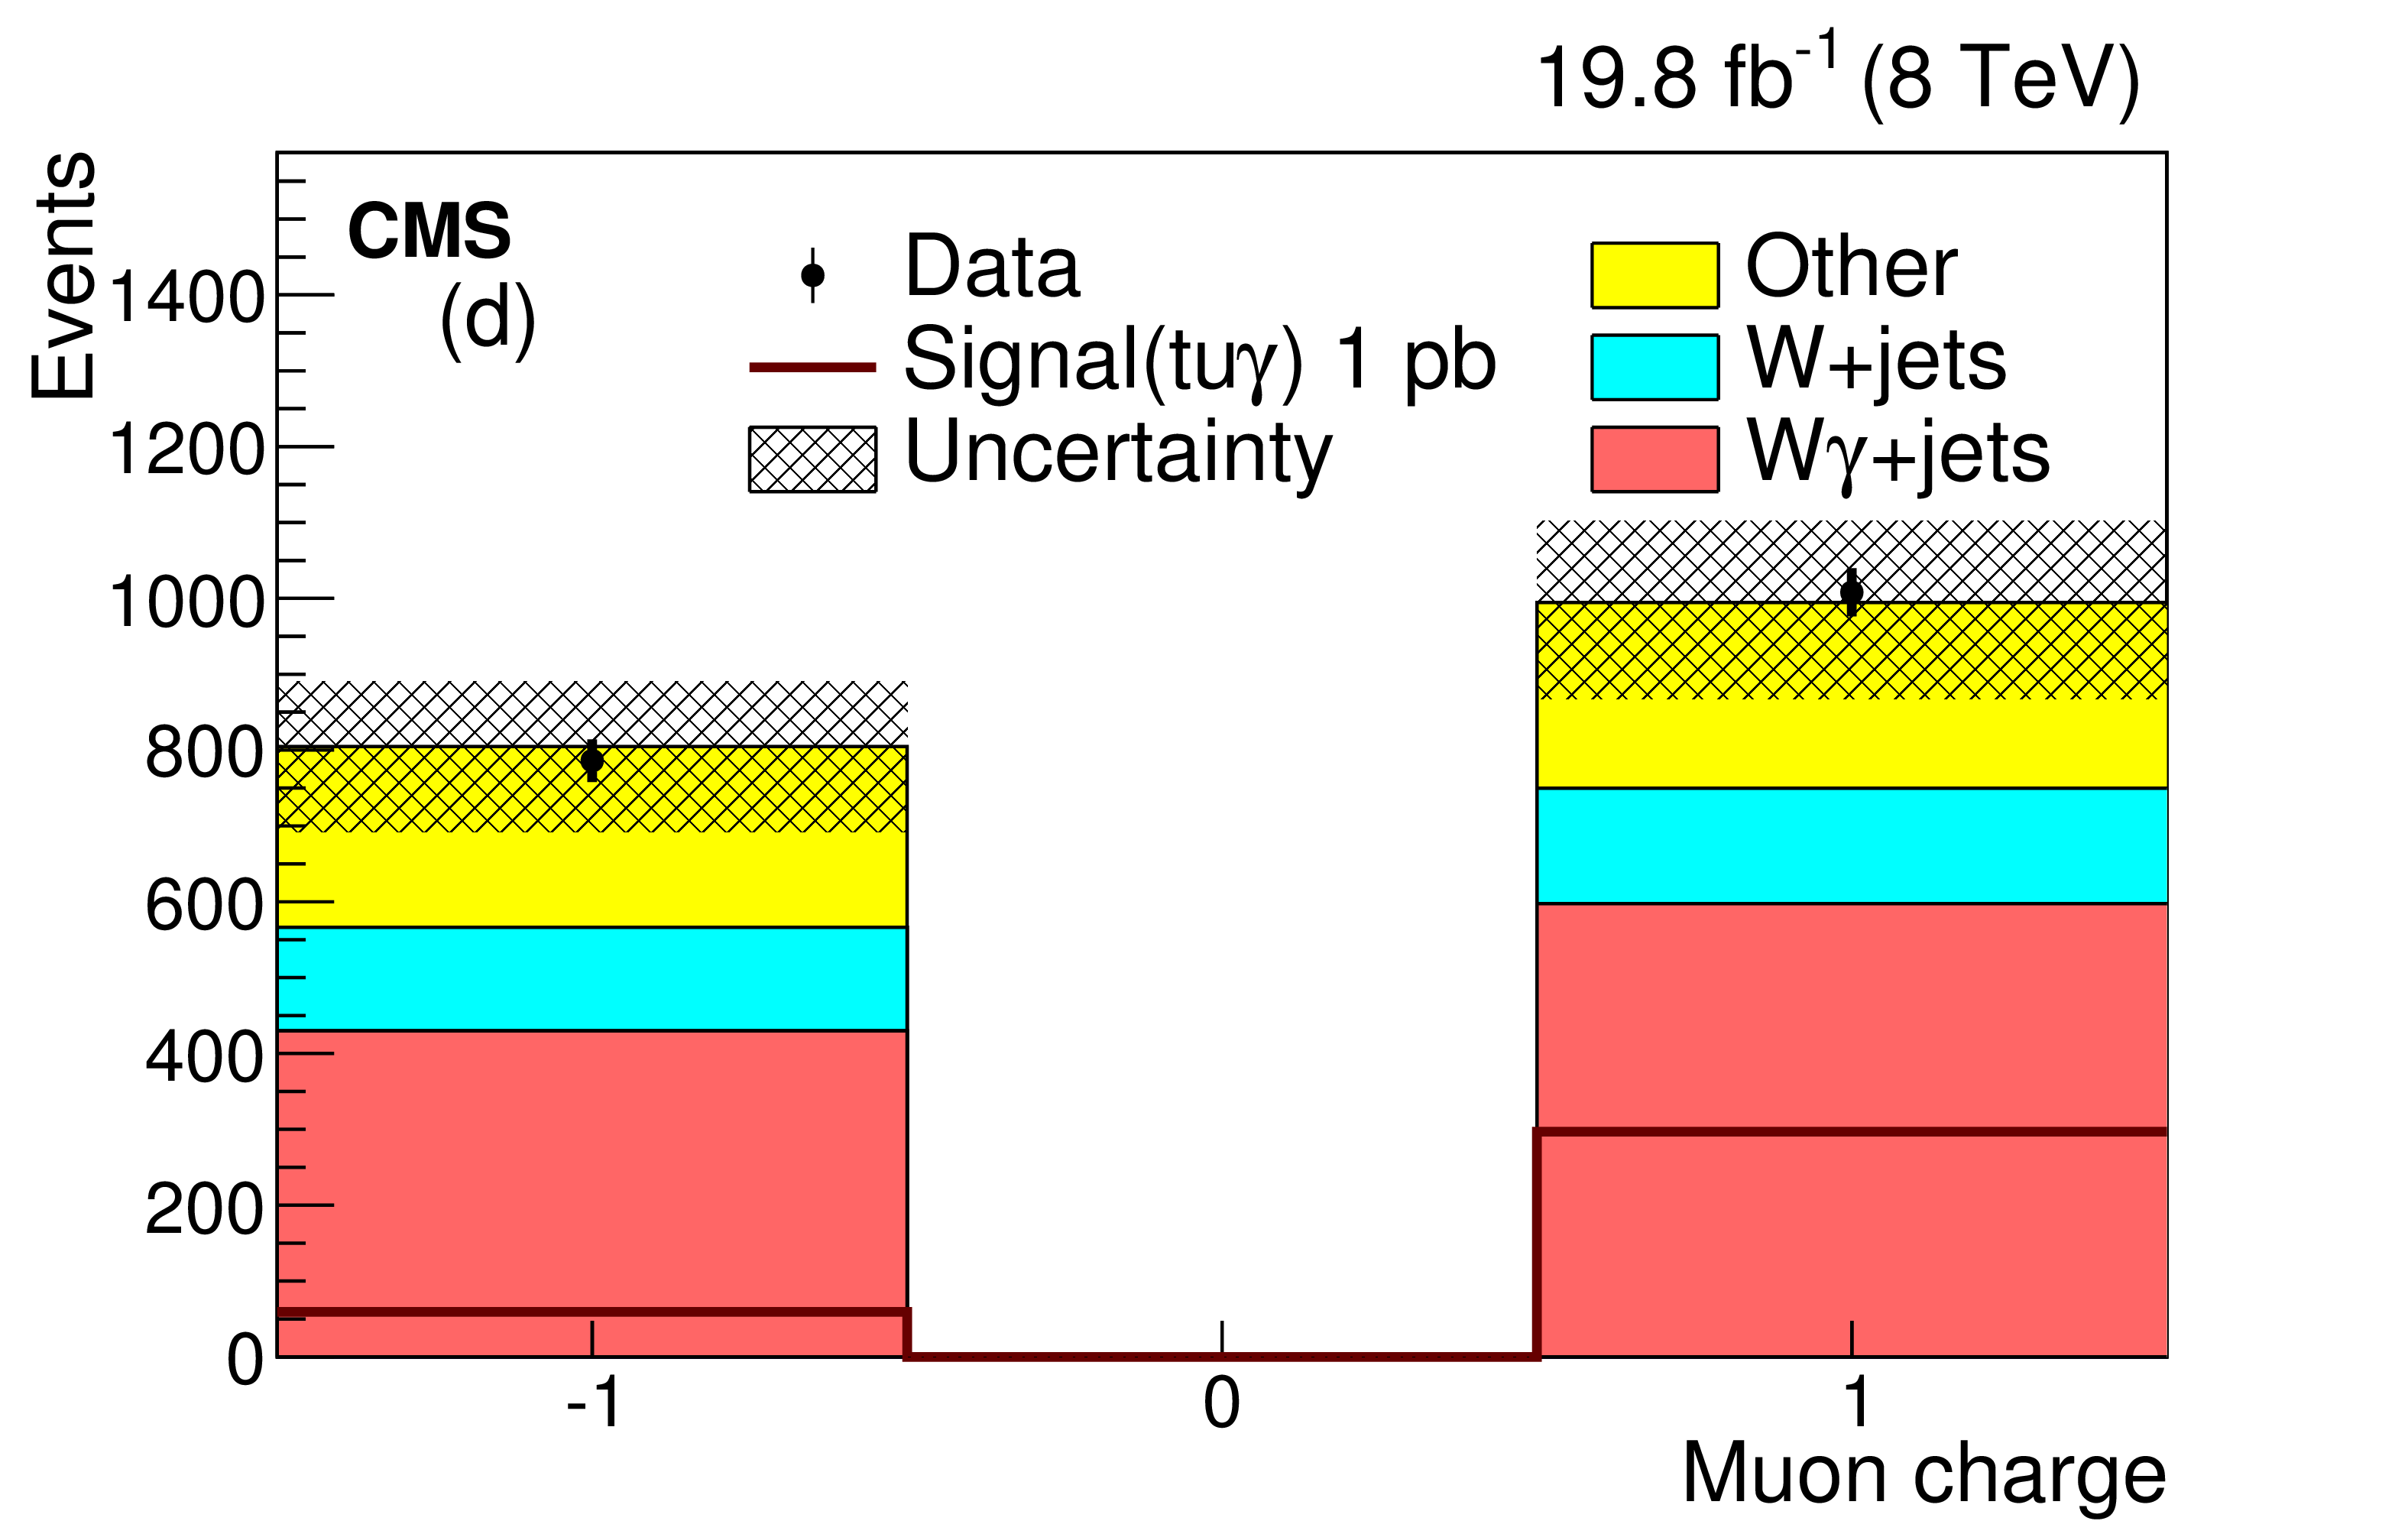
Figure 2-d:
Distributions of some of the input variables to the BDT: (a) $ {p_{\mathrm {T}}} $ of the photon, (b) $\Delta R(\gamma ,\mathrm{ b } )$, (c) $\cos(\mathrm{ t } ,\gamma )$, and (d) muon charge after the final event selection for data (points), the expected $\mathrm{ t } \mathrm{ u } \gamma $ signal (solid line), and background (histograms). The $\mathrm{ t } \mathrm{ u } \gamma $ signal distributions are normalized to a cross section of 1pb. The vertical bars on the points show the statistical uncertainties in the data. The hatched band shows the sum of the statistical and systematic uncertainties in the estimated background combined in quadrature. |
png pdf |
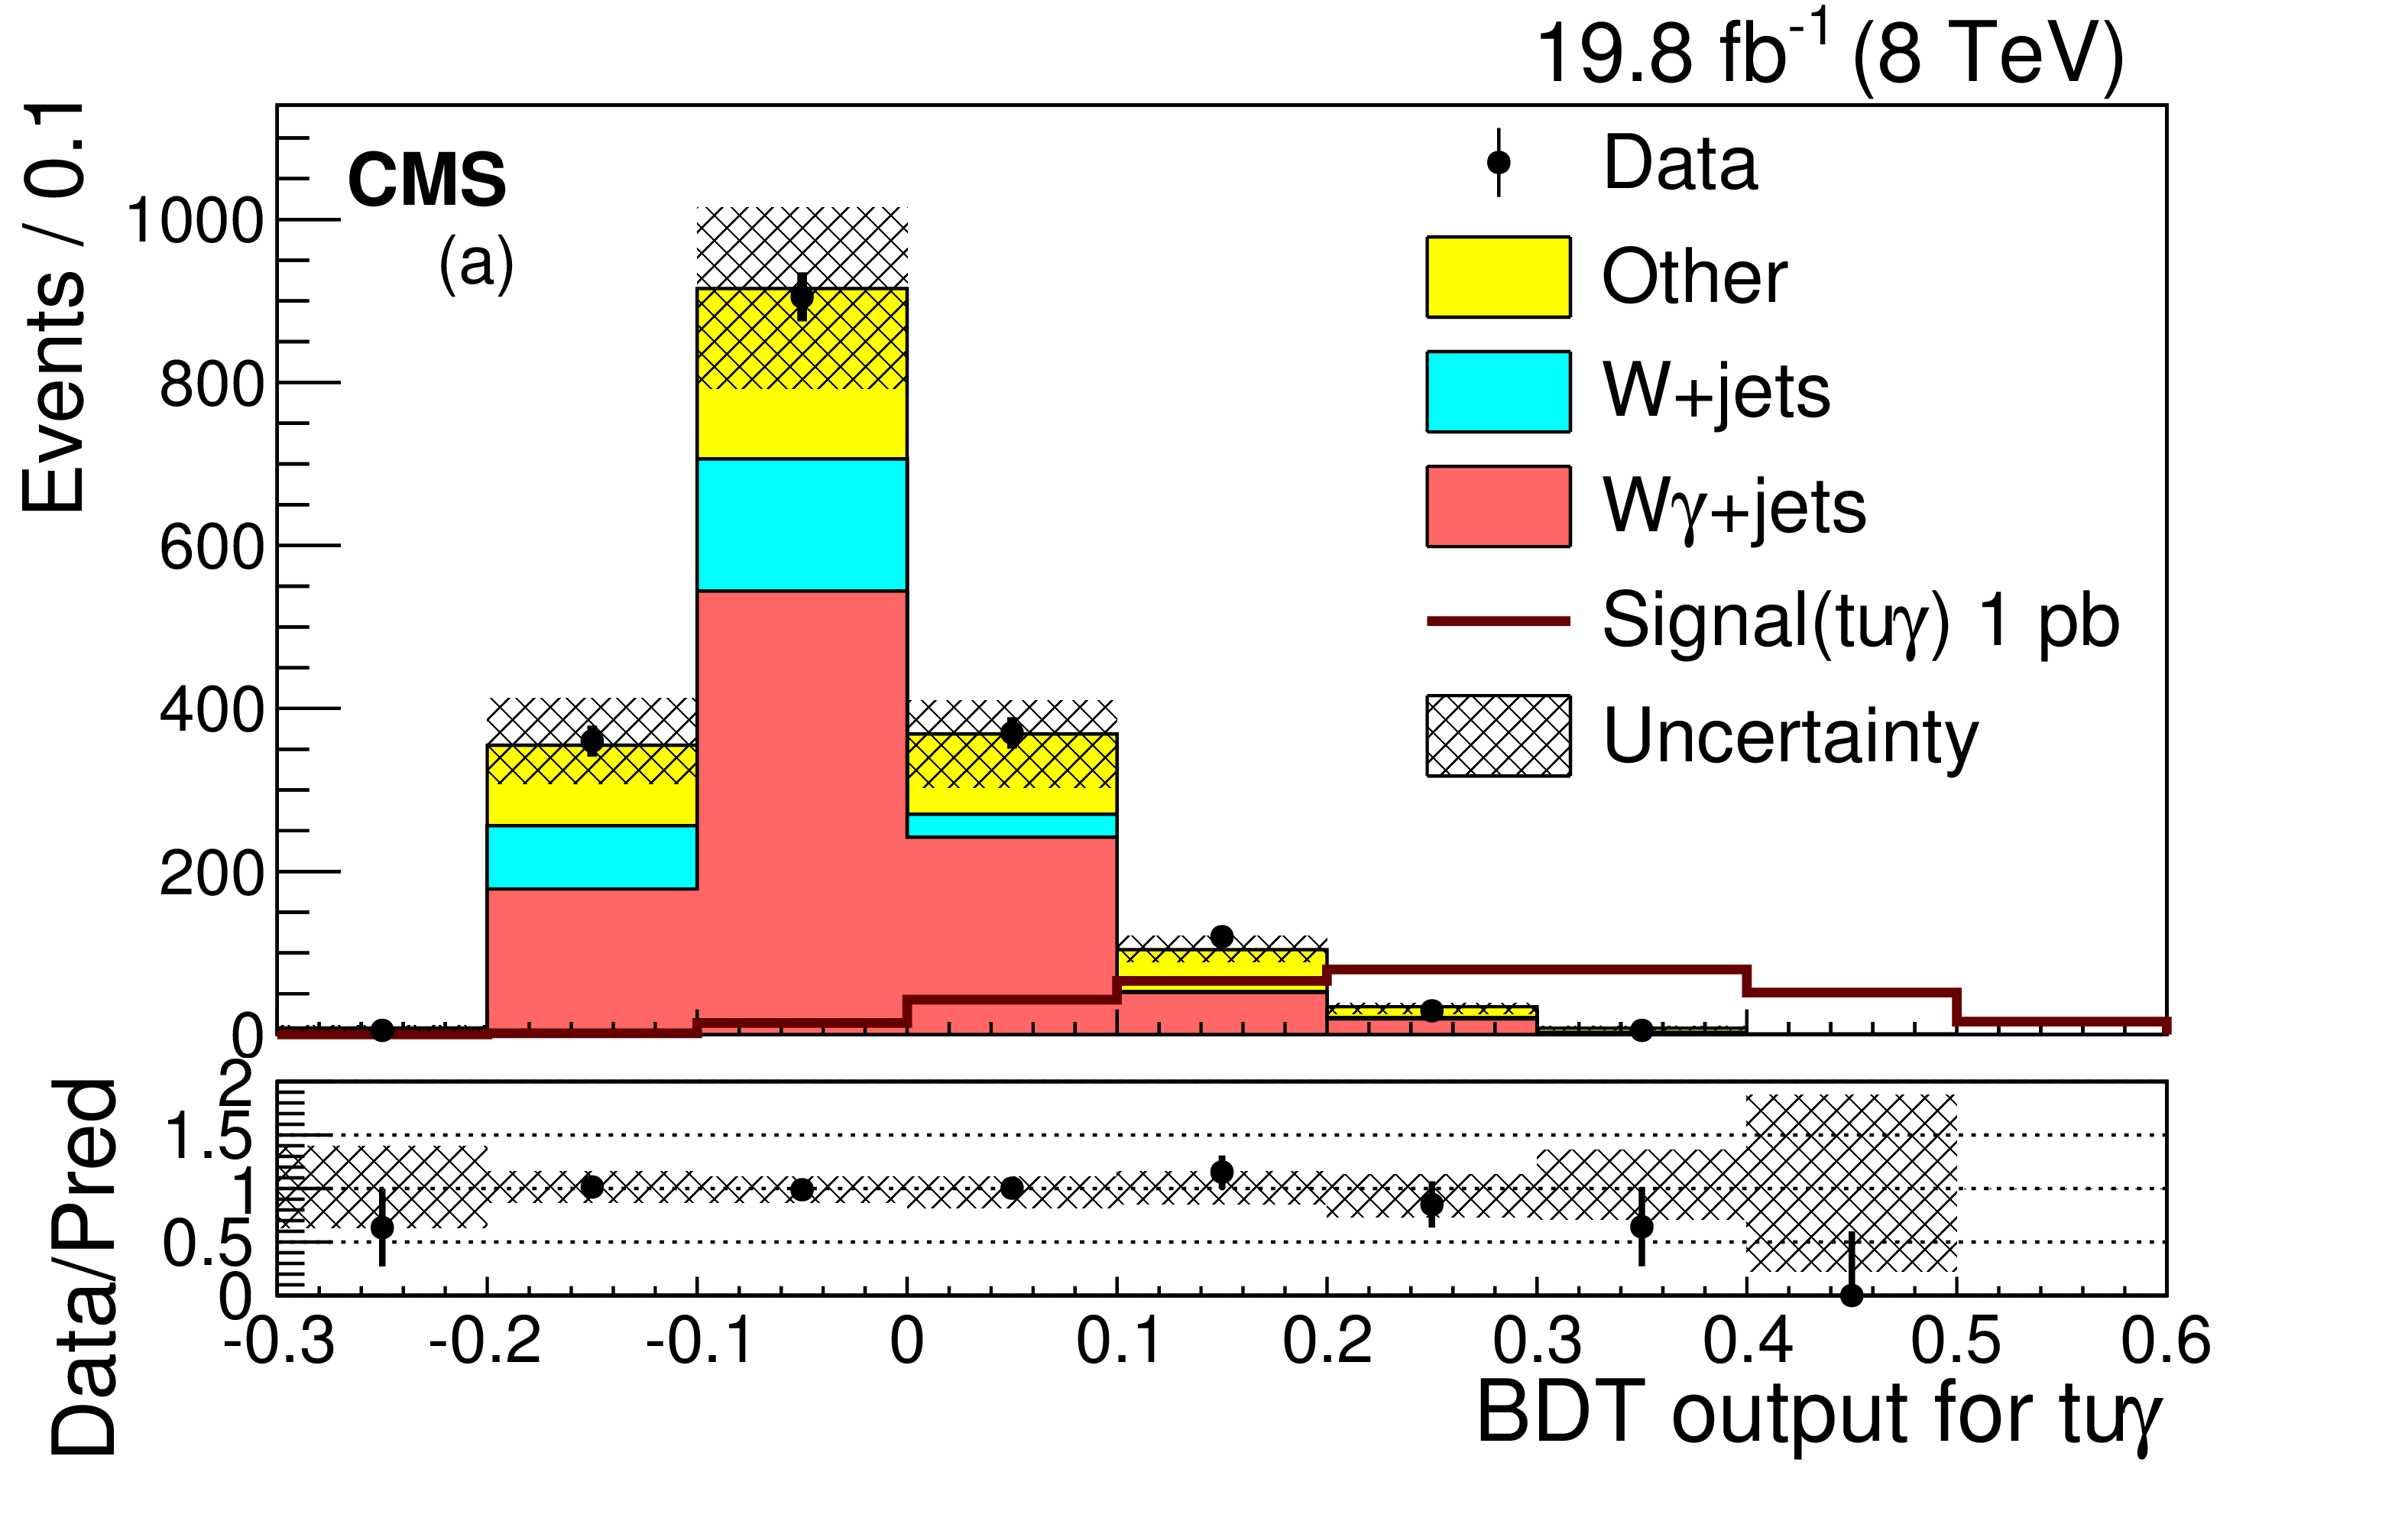
Figure 3-a:
The BDT output distributions for the data (points), the backgrounds (histograms), and the expected $\mathrm{ t } \mathrm{ u } \gamma $ (a) and $\mathrm{ t } \mathrm{ c } \gamma $ (b) signals (solid lines). The $\mathrm{ t } \mathrm{ u } \gamma $ and $\mathrm{ t } \mathrm{ c } \gamma $ signal distributions are normalized to a cross section of 1 pb. The vertical bars on the points give the statistical uncertainties. The hatched band shows the sum of the statistical and systematic uncertainties in the predicted background distributions combined in quadrature. The lower plots show the ratio of the data to the SM prediction. |
png pdf |
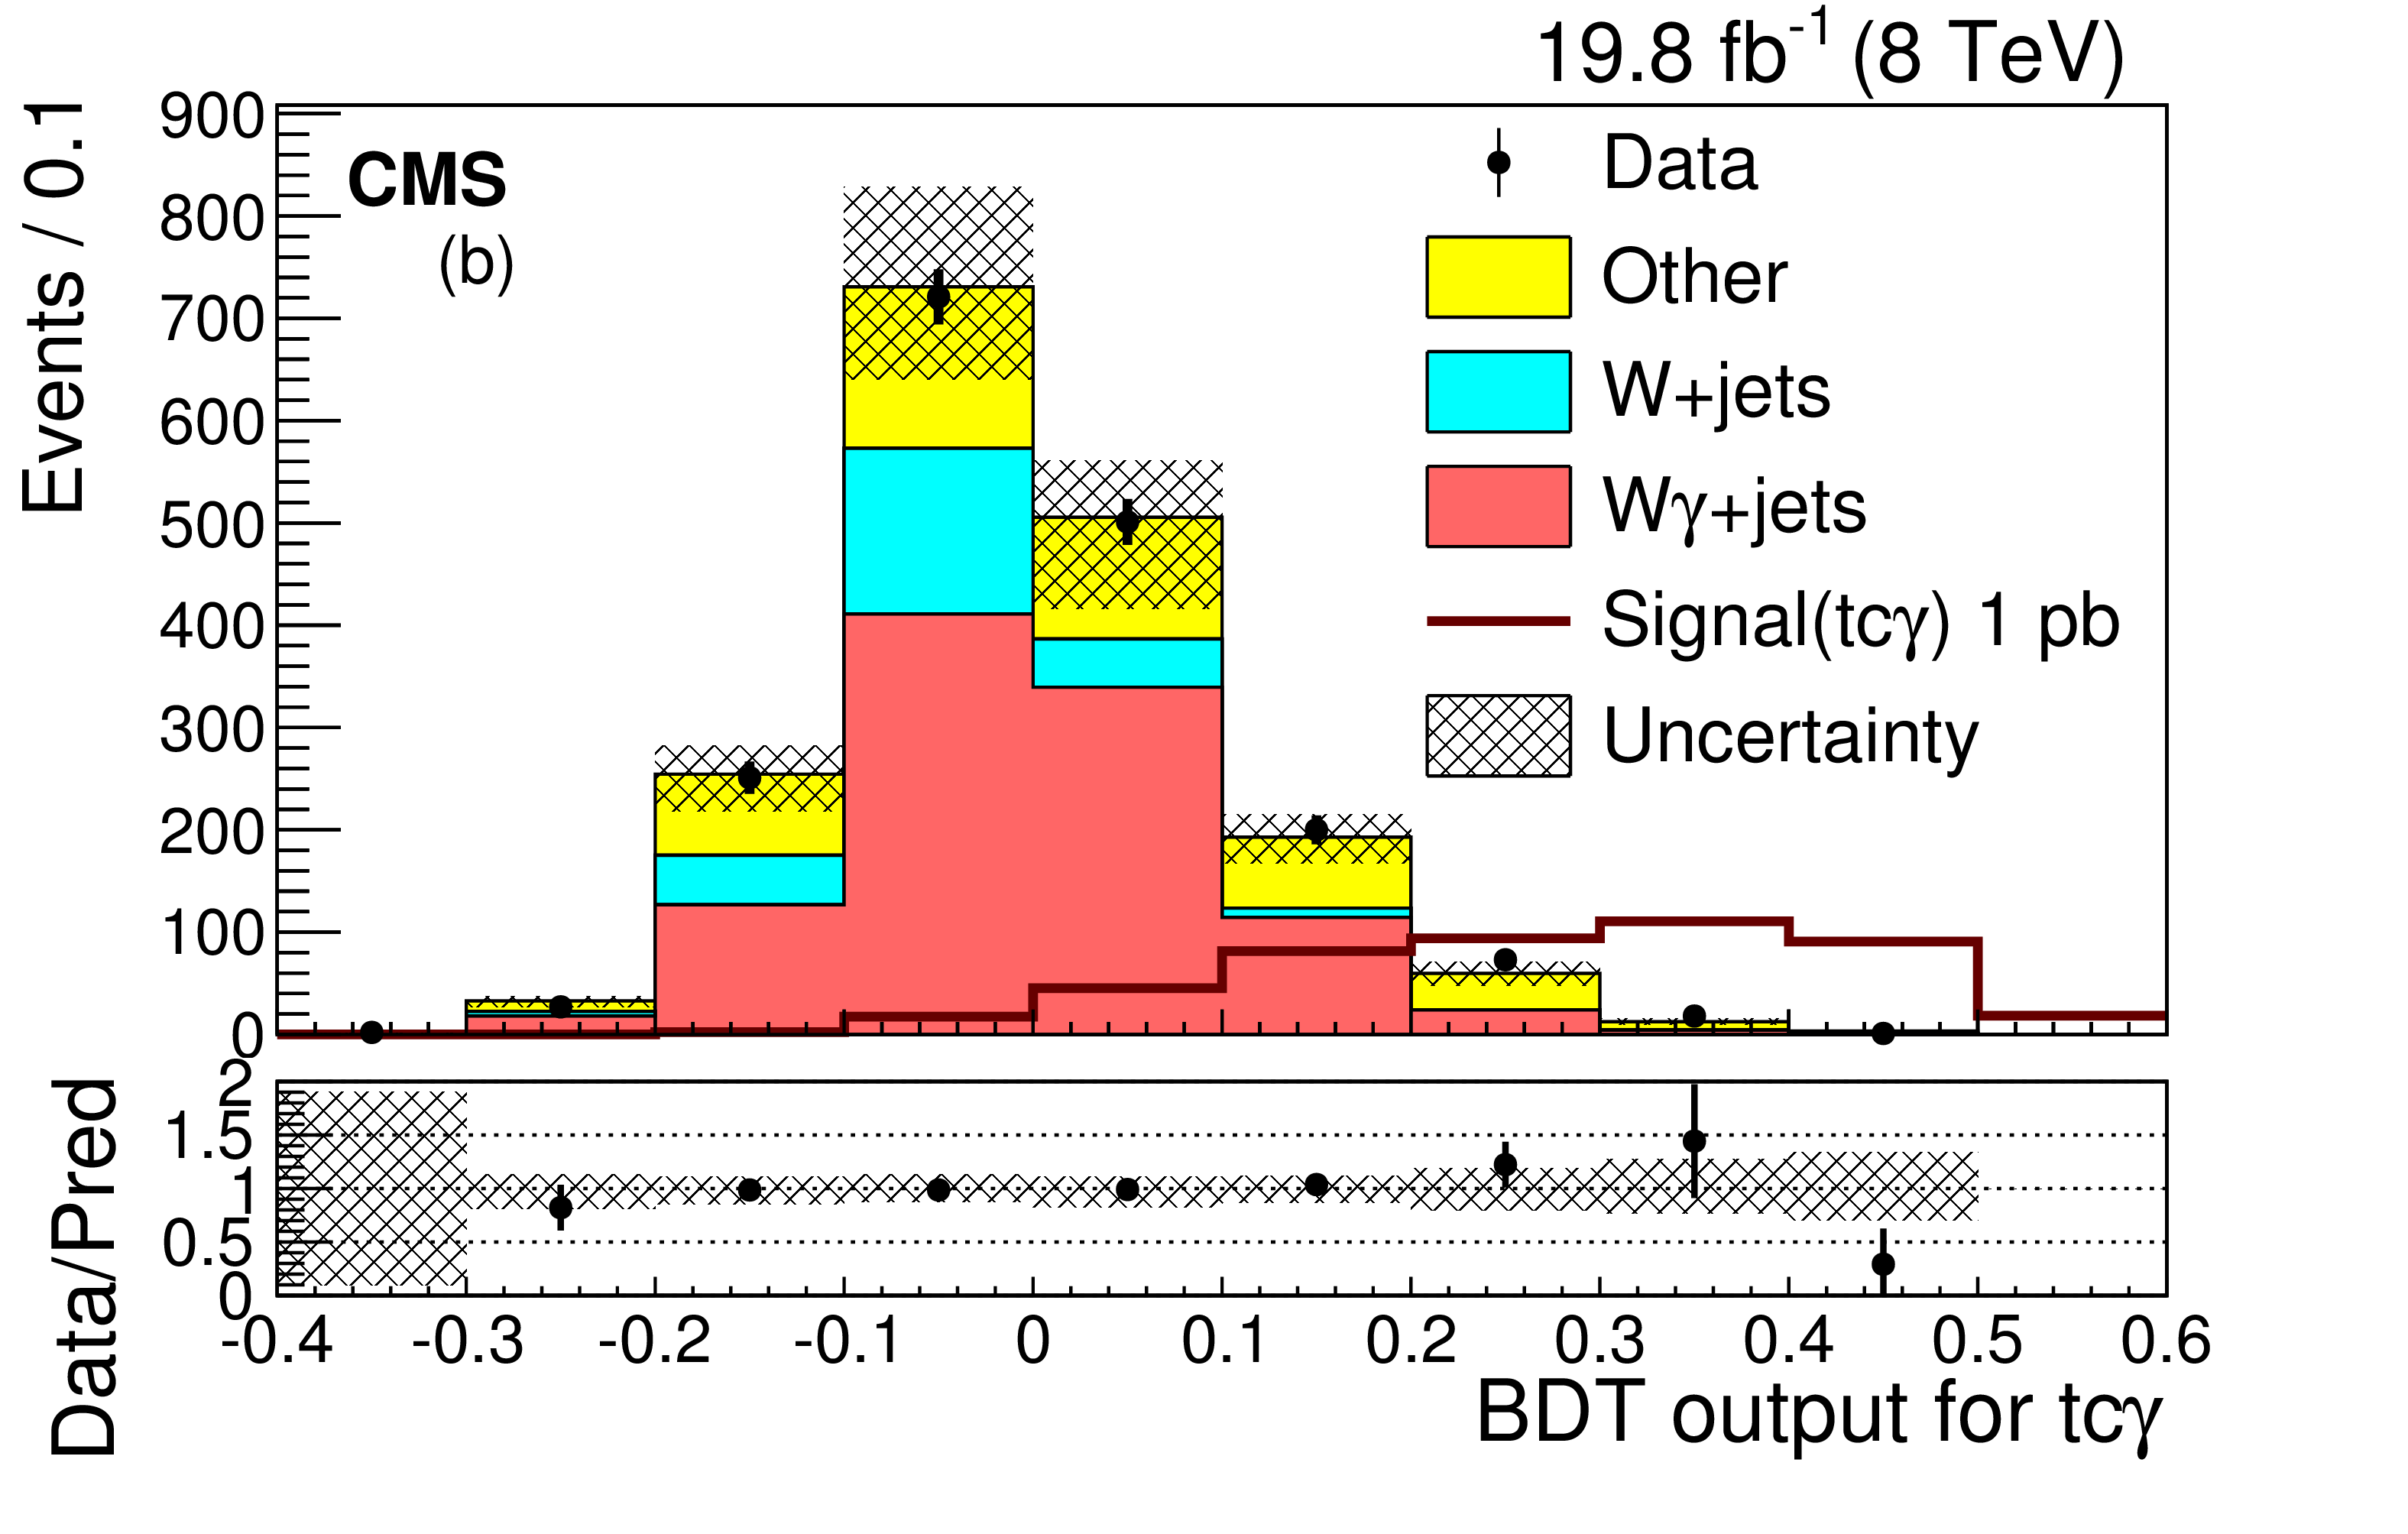
Figure 3-b:
The BDT output distributions for the data (points), the backgrounds (histograms), and the expected $\mathrm{ t } \mathrm{ u } \gamma $ (a) and $\mathrm{ t } \mathrm{ c } \gamma $ (b) signals (solid lines). The $\mathrm{ t } \mathrm{ u } \gamma $ and $\mathrm{ t } \mathrm{ c } \gamma $ signal distributions are normalized to a cross section of 1 pb. The vertical bars on the points give the statistical uncertainties. The hatched band shows the sum of the statistical and systematic uncertainties in the predicted background distributions combined in quadrature. The lower plots show the ratio of the data to the SM prediction. |
png pdf |
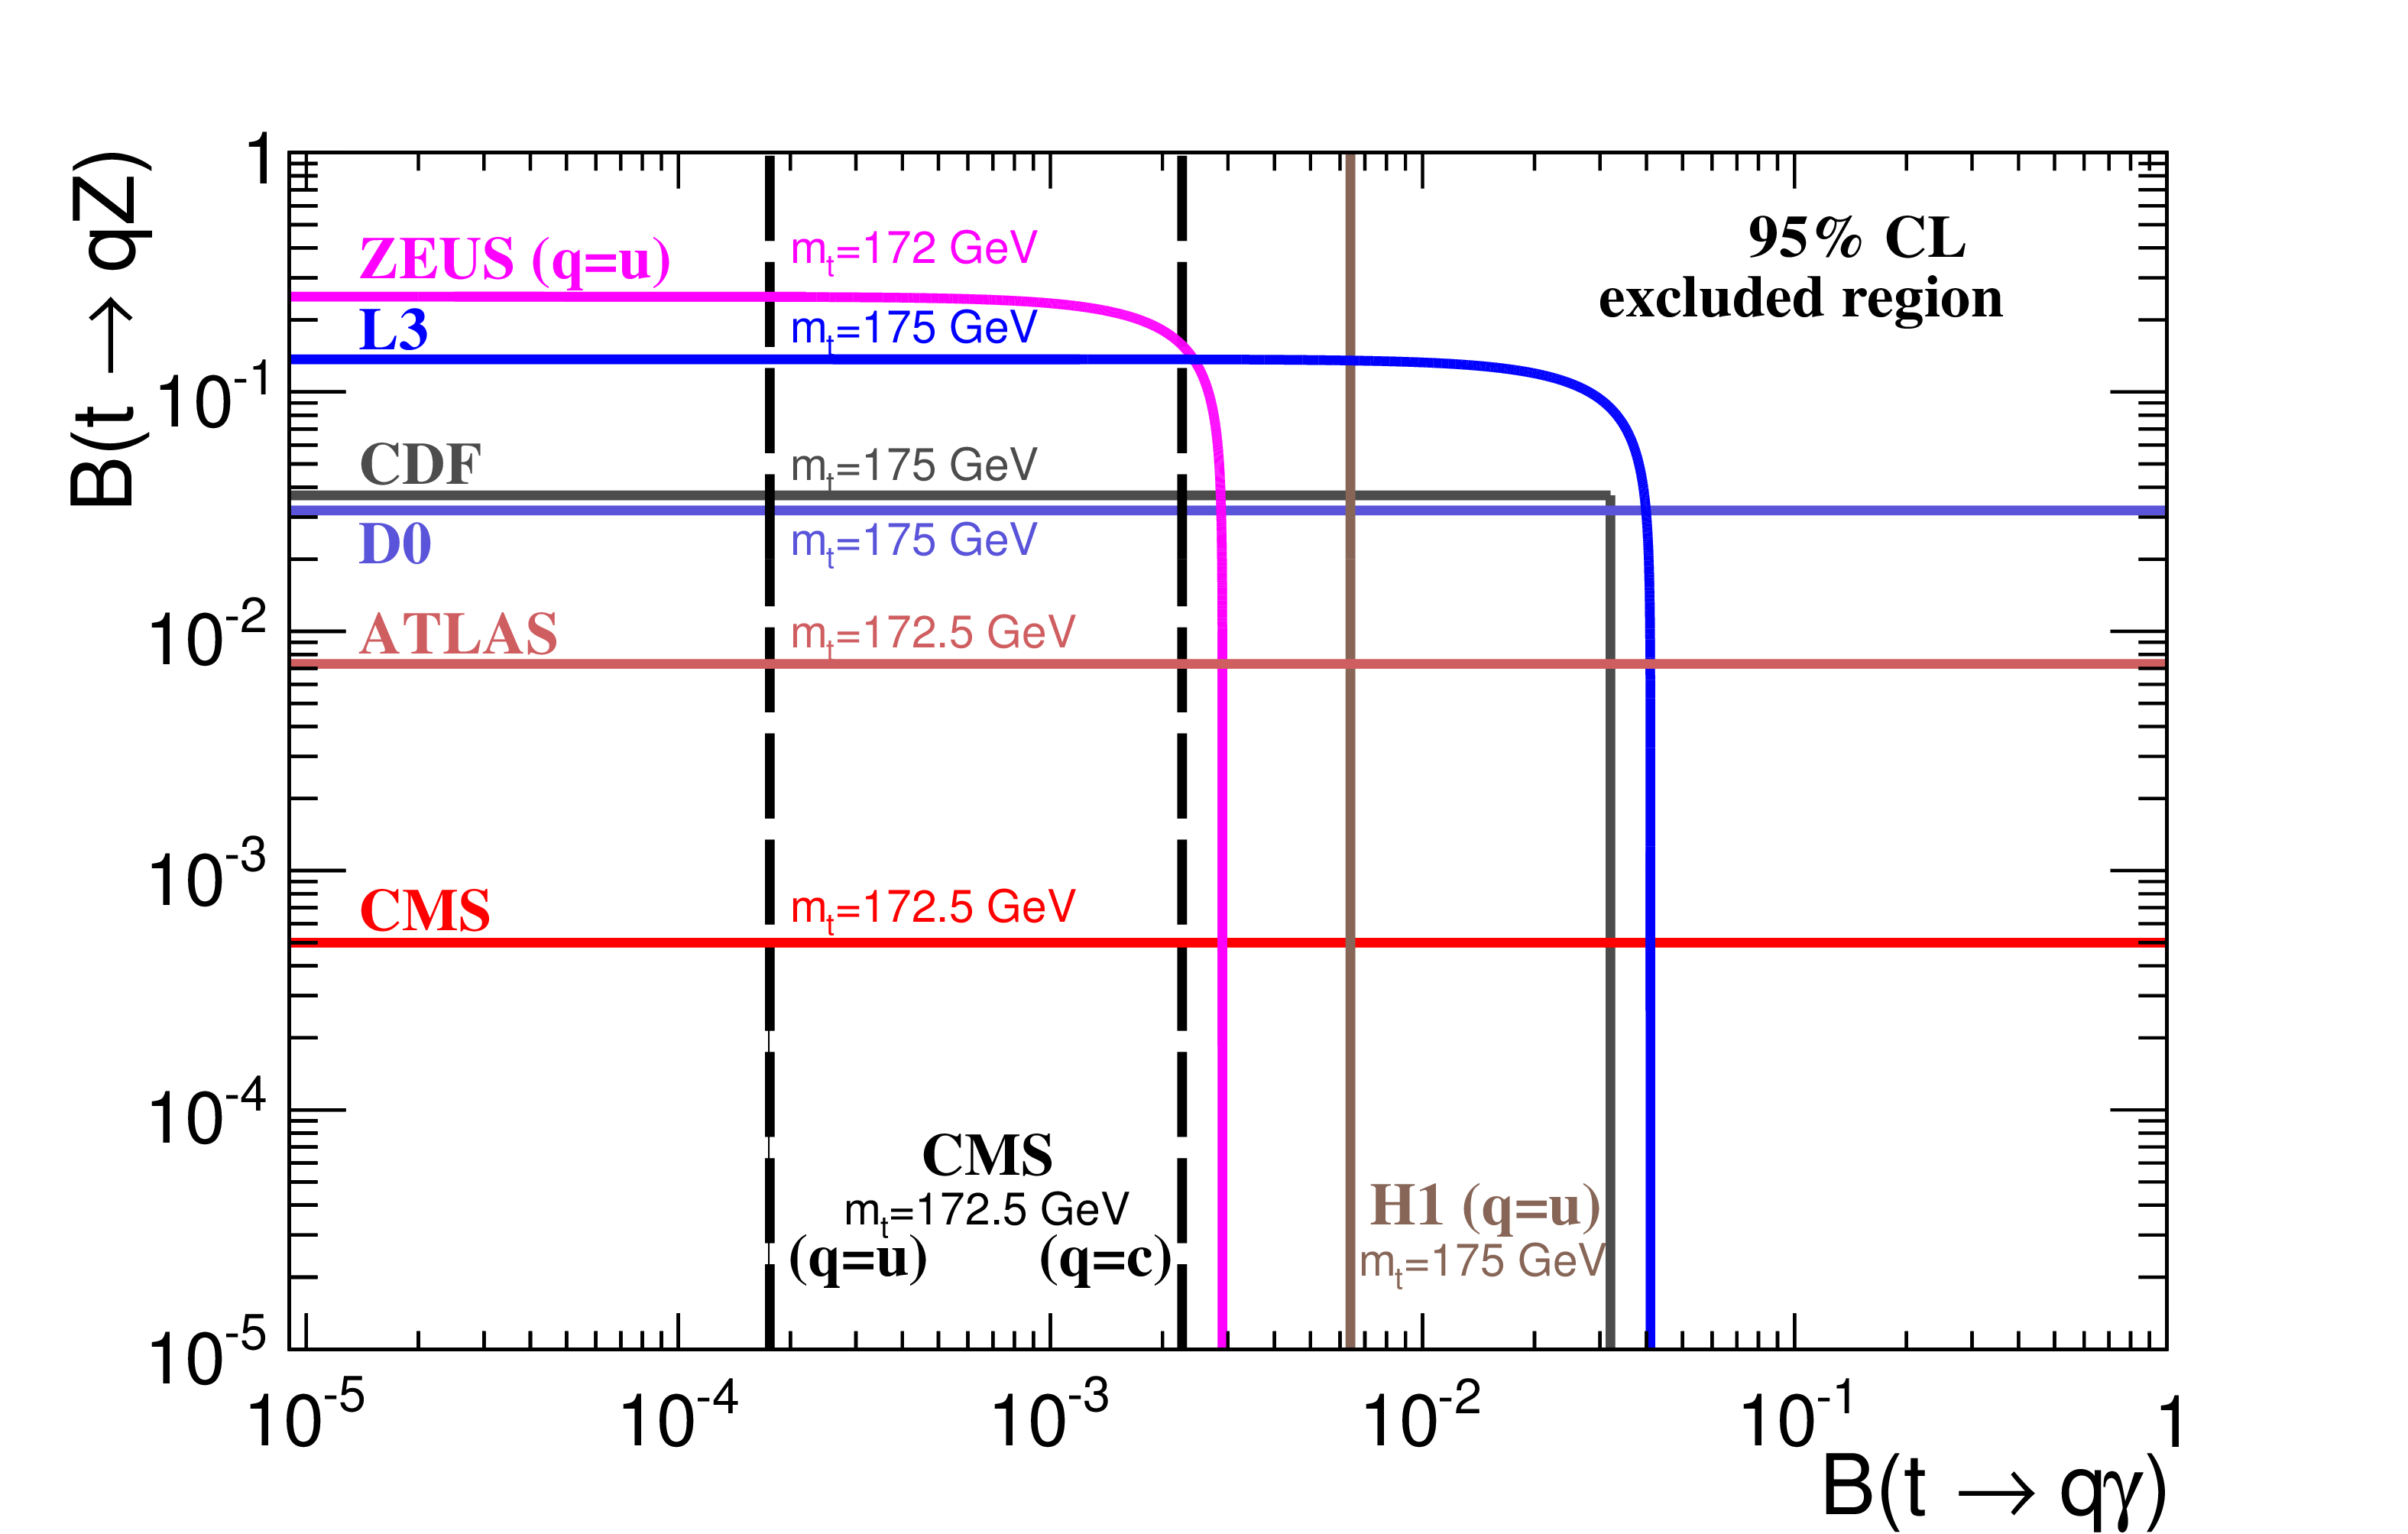
Figure 4:
The measured 95% CL upper limits on $\mathcal {B}(\mathrm{ t } \to \mathrm{q} \mathrm{Z} )$ versus $\mathcal {B}(\mathrm{ t } \to \mathrm{q} \gamma )$ from the L3 [5], ZEUS [6], H1 [7], D0 [55], CDF [8,56], ATLAS [57], and CMS [58] experiments. The two vertical dashed lines show the results of this analysis. |
| Tables | |

png pdf |
Table 1:
The expected and observed 95% CL upper limits on the FCNC $\mathrm{t} \mathrm{u} \gamma $ and $\mathrm{t} \mathrm{c} \gamma $ cross sections times branching fraction $\mathcal {B}(\mathrm{t} \to \mathrm{Z} \mathrm{b} \to \mathrm{b} \ell \nu _{\ell })$, the anomalous couplings $\kappa _{\mathrm{t} \mathrm{u} \gamma }$ and $\kappa _{\mathrm{t} \mathrm{c} \gamma }$, and the corresponding branching fractions $\mathcal {B}(\mathrm{t} \to \mathrm{u} \gamma )$ and $\mathcal {B}(\mathrm{t} \to \mathrm{c} \gamma )$ at LO and NLO are given. The one and two standard deviation ($\sigma $) ranges on the LO and NLO expected limits are also presented. |
png pdf |
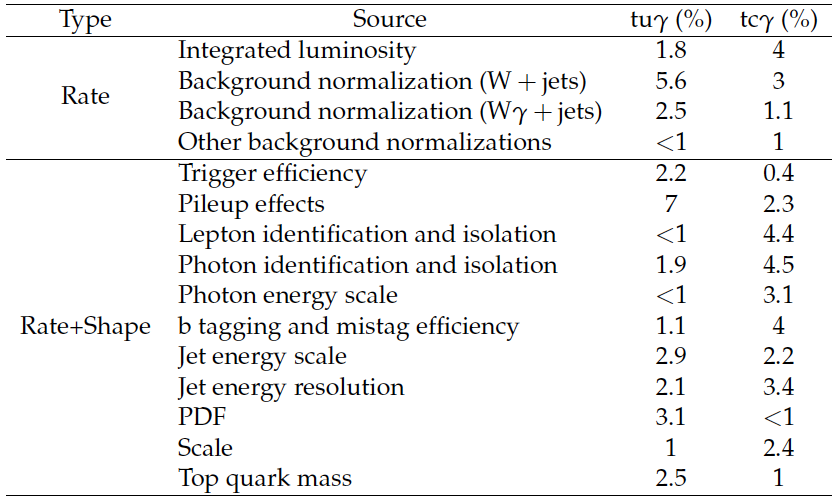
Table 2:
The sources and values of systematic uncertainties used to determine the observed and expected upper limits on the $\mathrm{t} \mathrm{u} \gamma $ and $\mathrm{t} \mathrm{c} \gamma $ cross sections. The values are given as a percentage of the expected upper limits. The sources are broken up into those that only affect the overall rate of signal events and those that affect both the rate and the shape of the BDT distributions. |
png pdf |
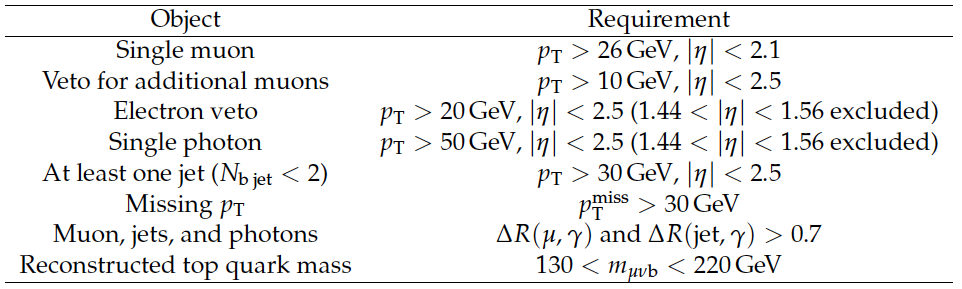
Table 3:
Definition of the fiducial region. |
png pdf |
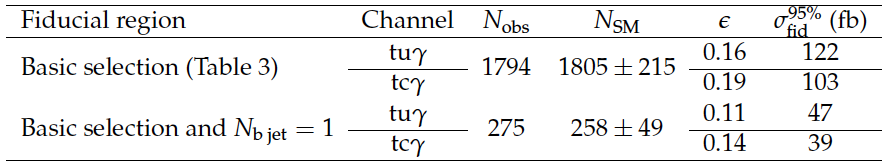
Table 4:
For the two signal channels, the total number of observed selected events in the data ($N_\text {obs}$), the SM expectations ($N_\mathrm {SM}$), the efficiencies ($\epsilon $), and the upper limits on the cross sections $\sigma _\text {fid}$ at the 95% CL in the fiducial region, without and with a requirement on the presence of a single accompanying b jet. |
| Summary |
| The result of a search for flavor changing neutral currents (FCNC) through single top quark production in association with a photon has been presented. The search is performed using proton-proton collisions at a center-of-mass energy of 8 TeV, corresponding to an integrated luminosity of 19.8 fb$^{-1}$, collected by the CMS detector at the LHC. The number of observed events is consistent with the SM prediction. Upper limits are set at 95% CL on the anomalous FCNC couplings of $\kappa_{ \mathrm{t u \gamma} } <$ 0.025 and $\kappa_{ \mathrm{t c \gamma} } <$ 0.091 using NLO QCD calculations. The corresponding upper limits on the branching fractions are $\mathcal{B}(\mathrm{ t \to u \gamma }) <$ 1.3 $\times$ 10$^{-4}$ and $\mathcal{B}(\mathrm{ t \to c \gamma }) <$ 1.7 $\times$ 10$^{-3}$, which are the most restrictive bounds to date. Observed upper limits on the cross section in a restricted phase space are found to be 47 fb and 39 fb at 95% CL for $\mathrm{t u \gamma}$ and $\mathrm{t c \gamma}$ production, respectively, when exactly one identified b jet is required in the data. These are the first results on anomalous tg production within a restricted phase-space region. |
|
|
Compact Muon Solenoid LHC, CERN |
|

|

|

|

|

|