

Compact Muon Solenoid
LHC, CERN
| CMS-TOP-14-021 ; CERN-PH-EP-2015-248 | ||
| Observation of top quark pairs produced in association with a vector boson in pp collisions at $\sqrt{s} =$ 8 TeV | ||
| CMS Collaboration | ||
| 5 October 2015 | ||
| J. High Energy Phys. 01 (2016) 096 | ||
| Abstract: Measurements of the cross sections for top quark pairs produced in association with a W or Z boson are presented, using 8 TeV pp collision data corresponding to an integrated luminosity of 19.5 fb$^{-1}$, collected by the CMS experiment at the LHC. Final states are selected in which the associated W boson decays to a charged lepton and a neutrino or the Z boson decays to two charged leptons. Signal events are identified by matching reconstructed objects in the detector to specific final state particles from $ \mathrm{ t \bar{t} W } $ or $\mathrm{ t \bar{t} Z }$ decays. The $ \mathrm{ t \bar{t} W } $ cross section is measured to be 382$^{+117}_{-102}$ fb with a significance of 4.8 standard deviations from the background-only hypothesis. The $\mathrm{ t \bar{t} Z }$ cross section is measured to be 242$^{+65}_{-55}$ fb with a significance of 6.4 standard deviations from the background-only hypothesis. These measurements are used to set bounds on five anomalous dimension-six operators that would affect the $ \mathrm{ t \bar{t} W } $ and $\mathrm{ t \bar{t} Z }$ cross sections. | ||
| Links: e-print arXiv:1510.01131 [hep-ex] (PDF) ; CDS record ; inSPIRE record ; HepData record ; CADI line (restricted) ; | ||
| Figures | |

png pdf |
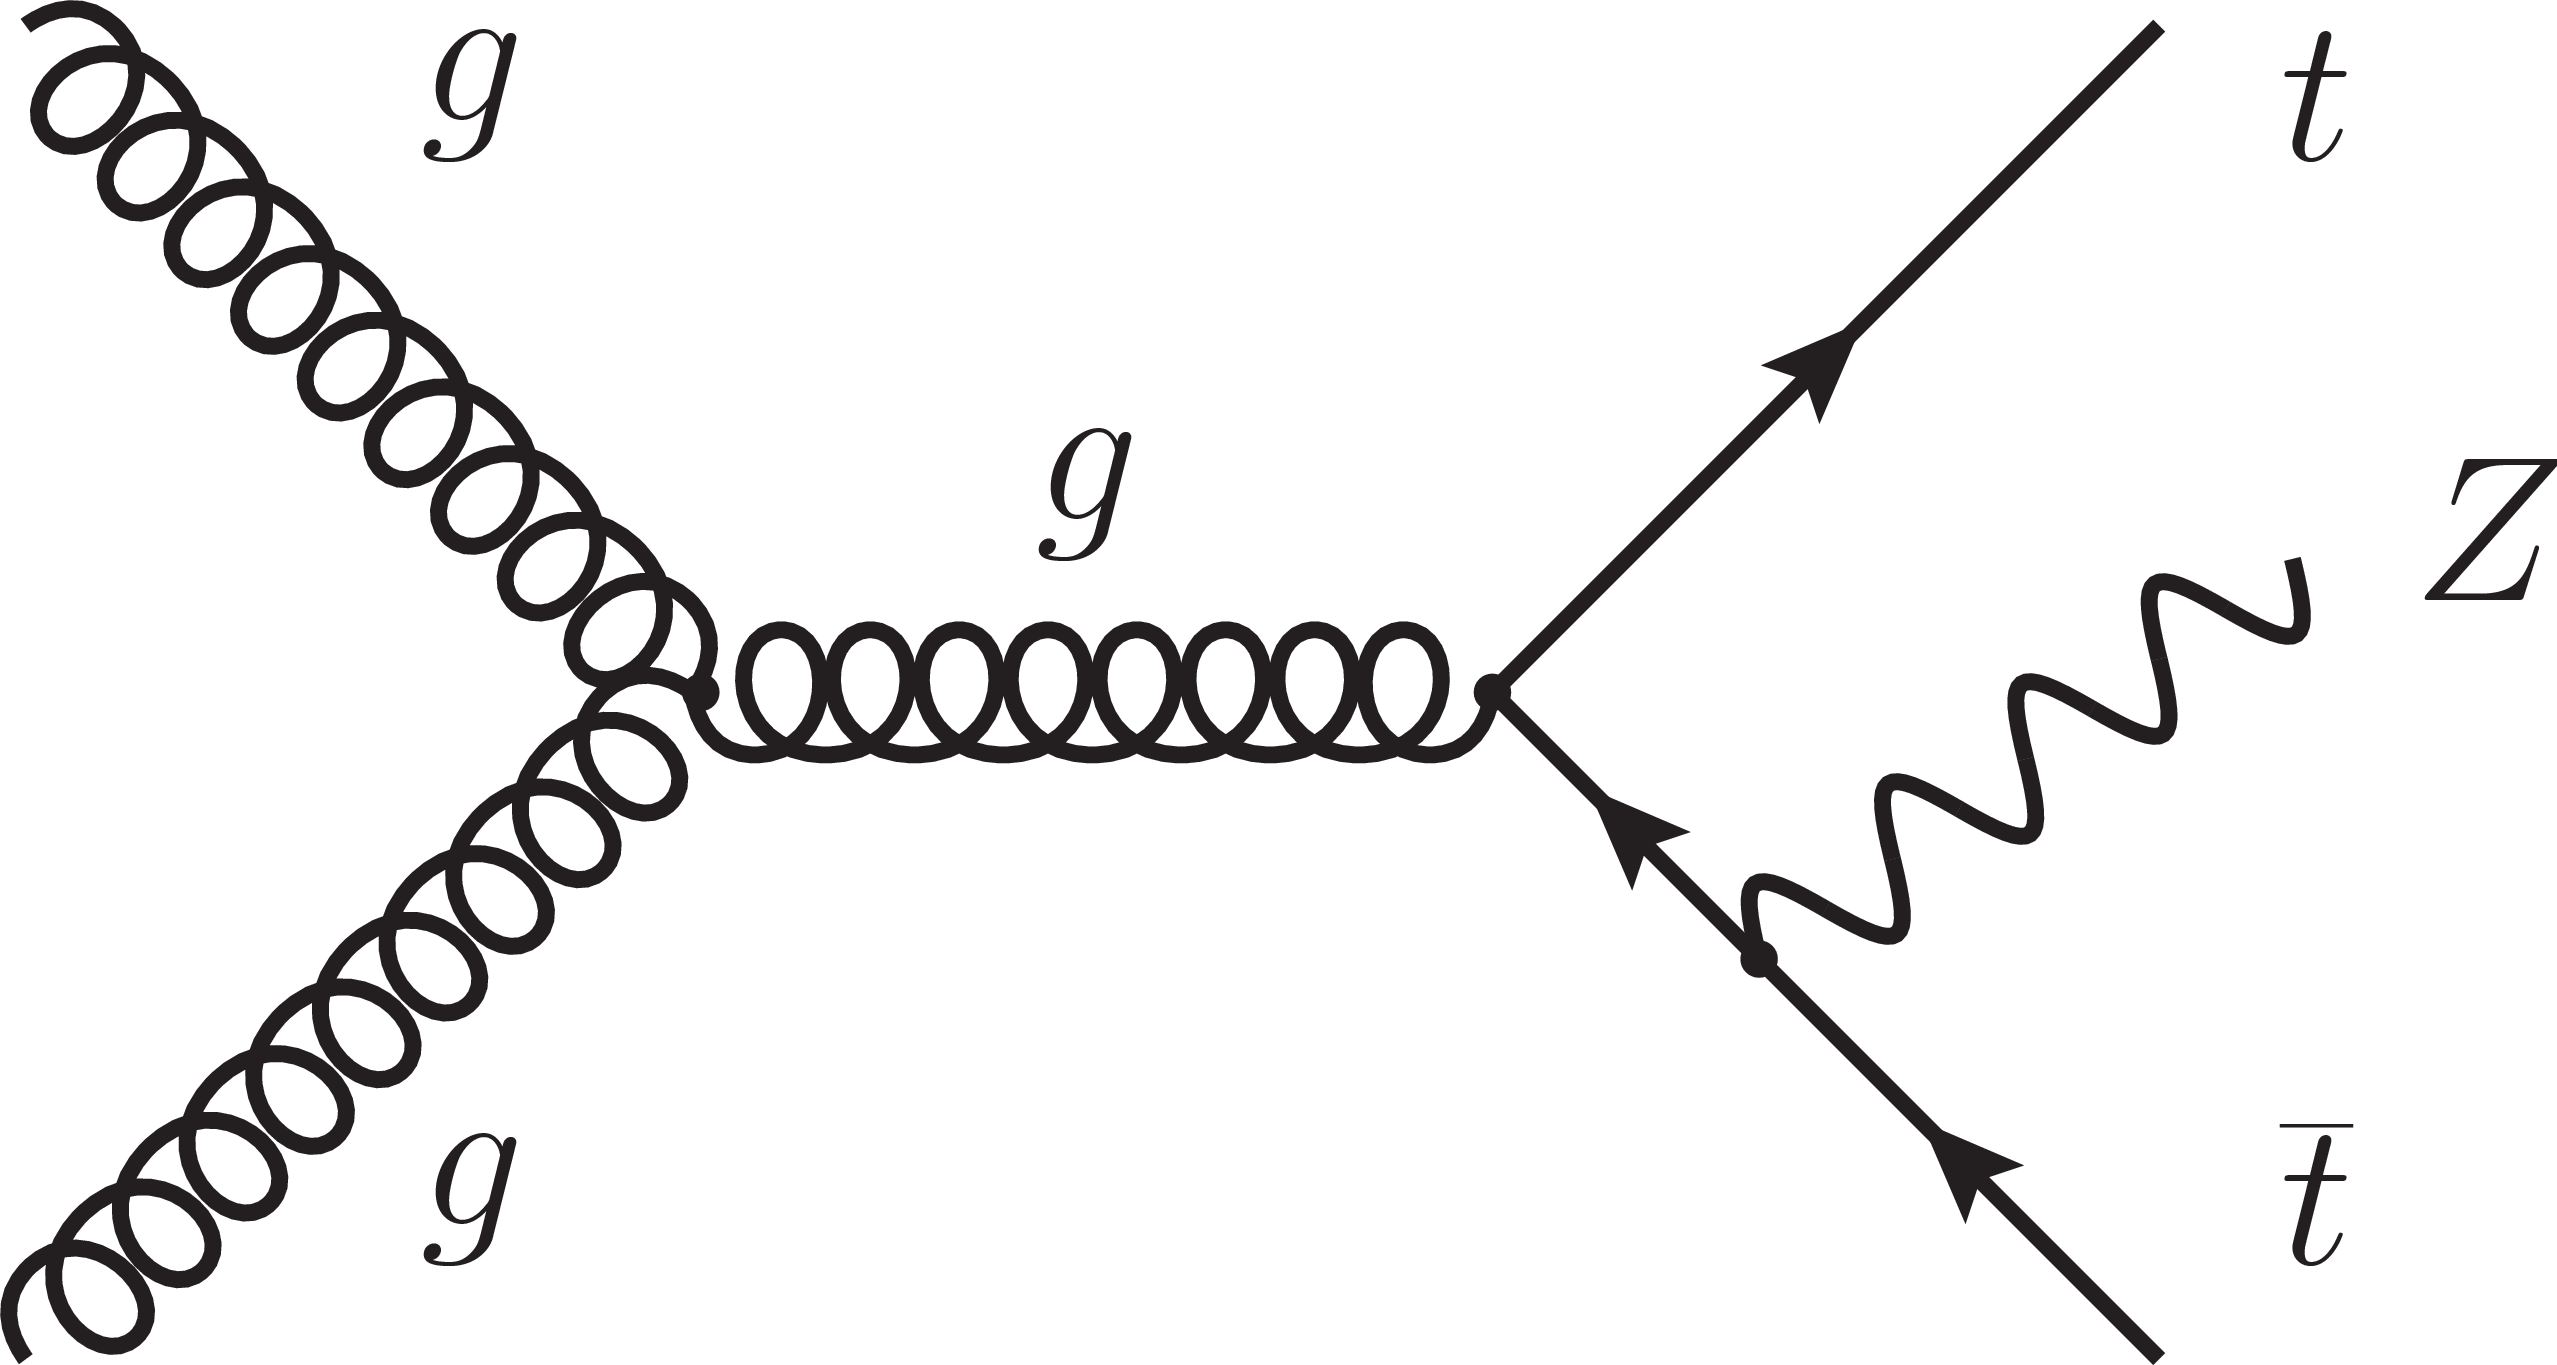
Figure 1-a:
Dominant leading order Feynman diagrams for $ \mathrm{ t \bar{t} W^+ } $ and $ \mathrm{ t \bar{t} Z } $ production at the LHC. The charge conjugate process of $ \mathrm{ t \bar{t} W^+ } $ produces $ \mathrm{ t \bar{t} W^- } $ . |
png pdf |
Figure 1-b:
Dominant leading order Feynman diagrams for $ \mathrm{ t \bar{t} W^+ } $ and $ \mathrm{ t \bar{t} Z } $ production at the LHC. The charge conjugate process of $ \mathrm{ t \bar{t} W^+ } $ produces $ \mathrm{ t \bar{t} W^- } $ . |
png pdf |
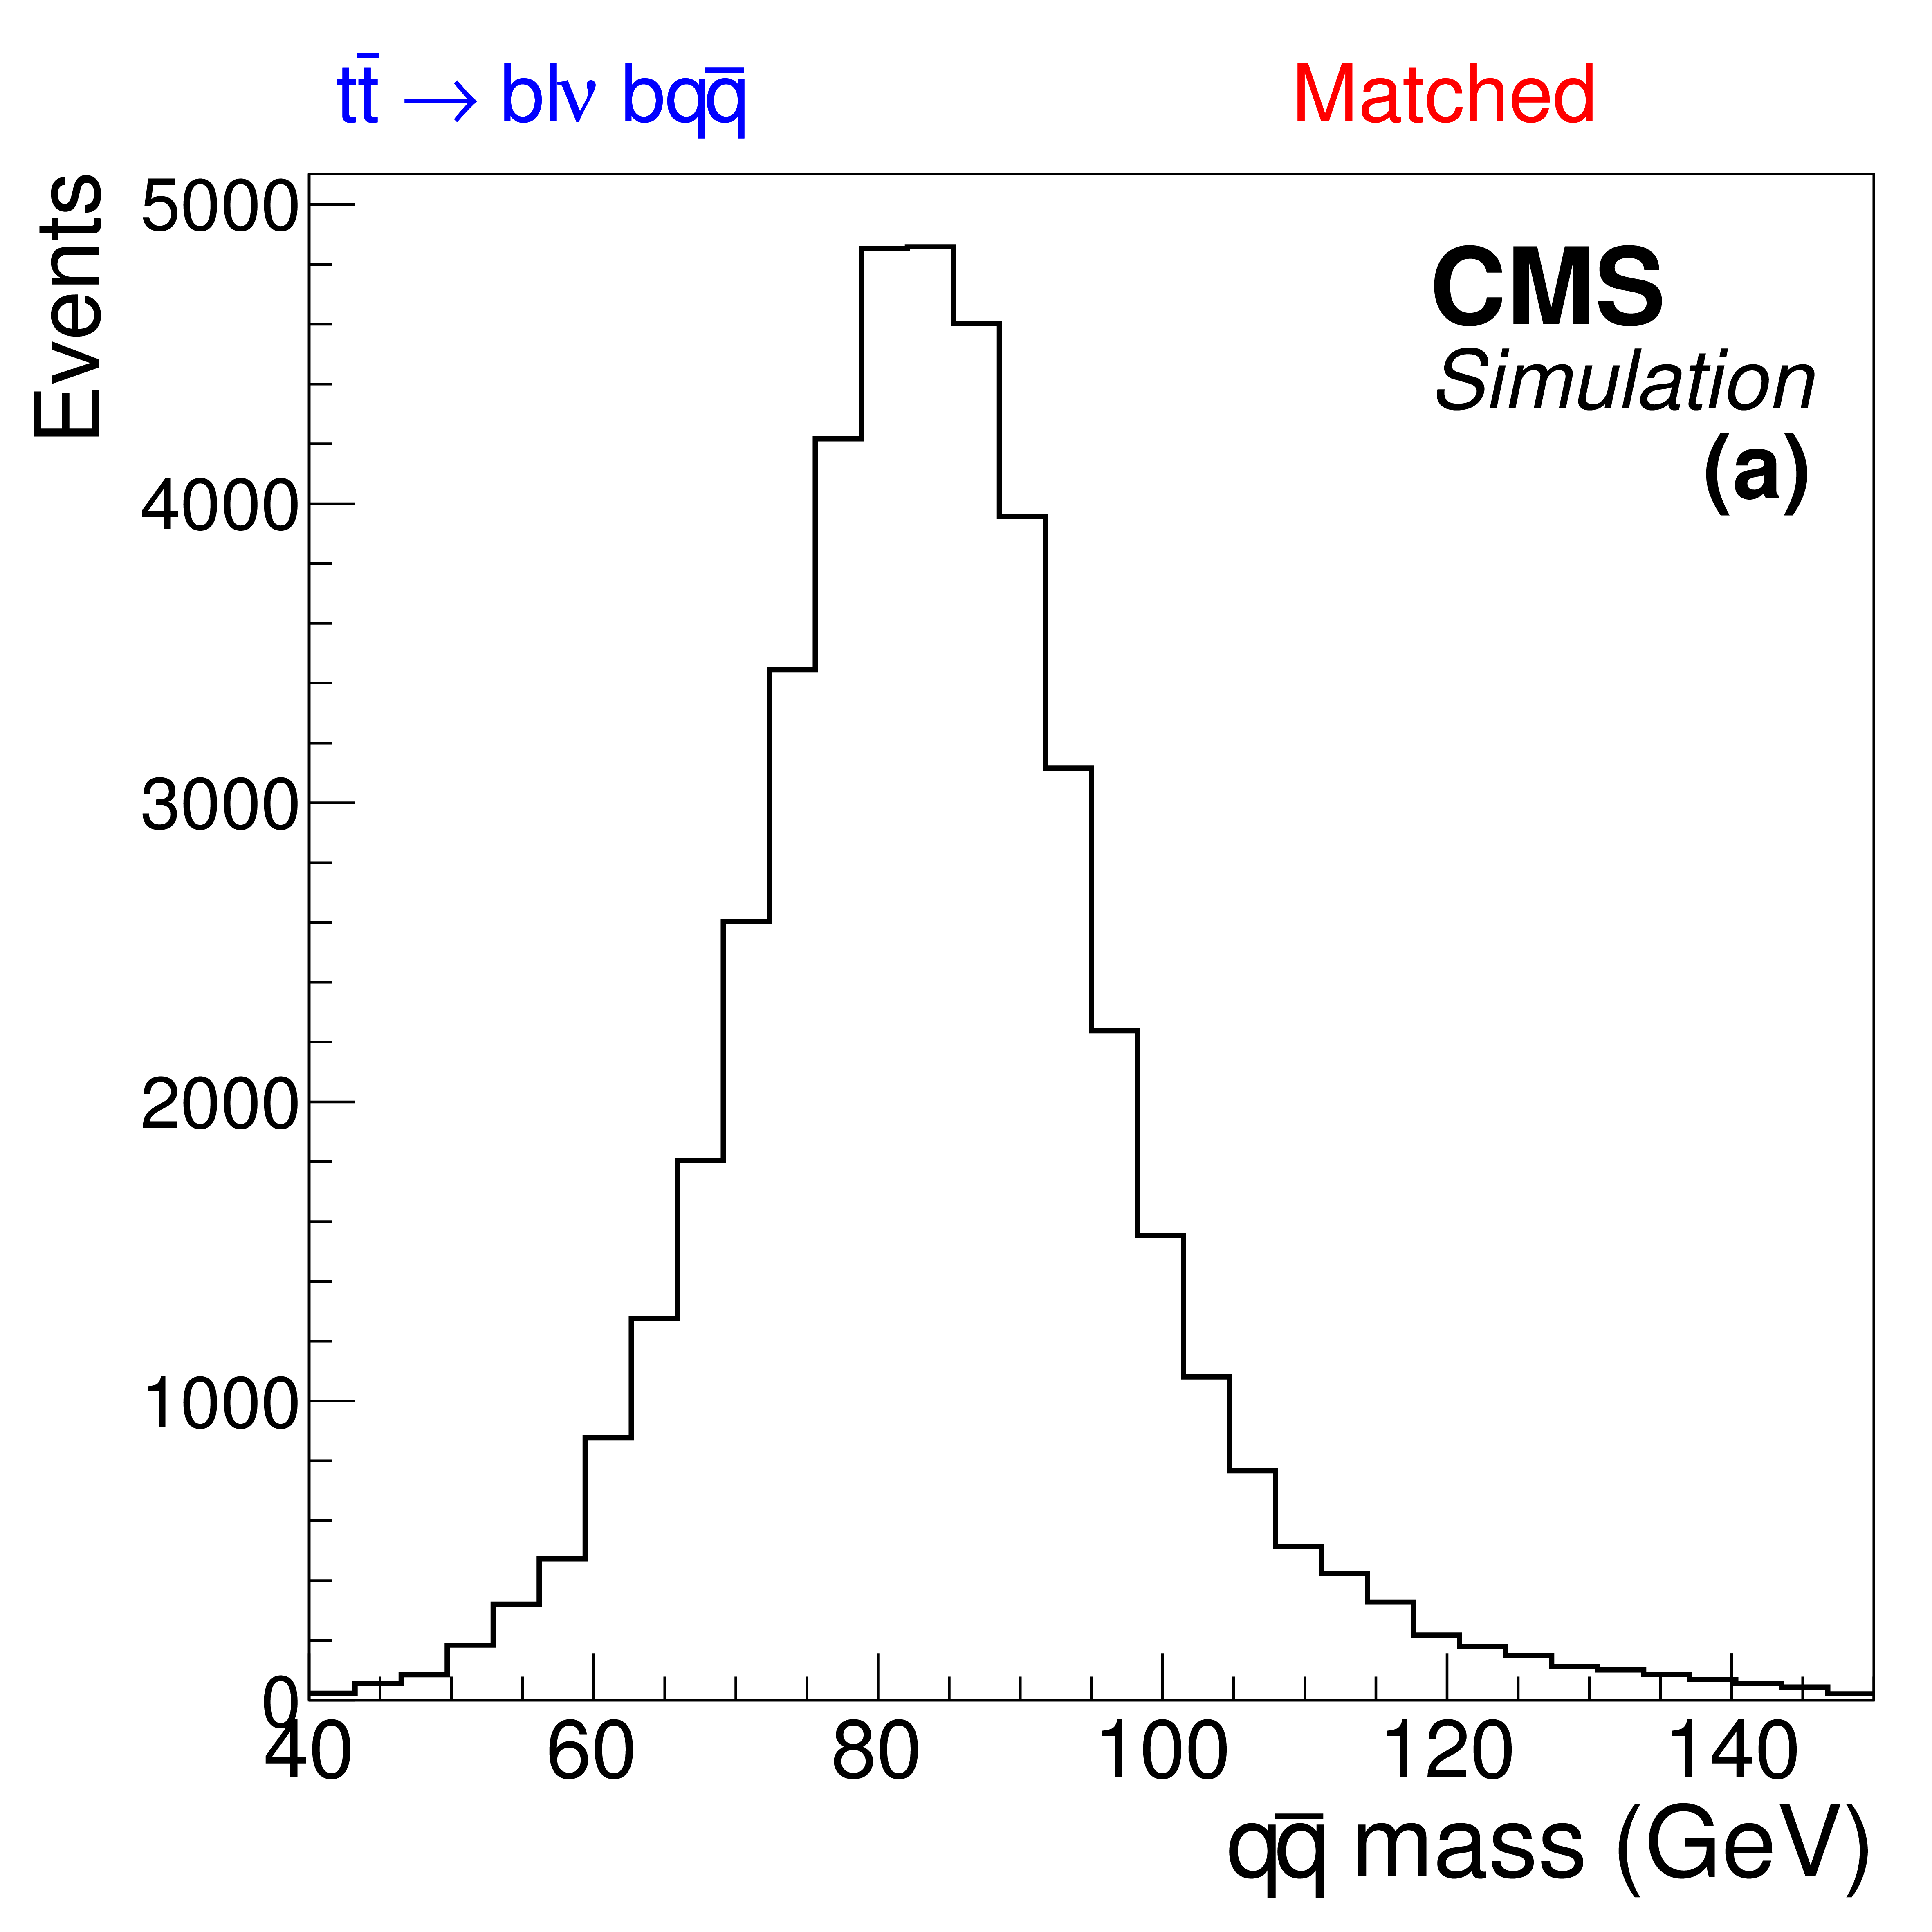
Figure 2-a:
Distributions from simulated $ \mathrm{ t \bar{t} Z \to b \ell \nu \ b q \bar{q} } $ events with exactly four jets. Shown are the invariant mass of two jets matched to a hadronic W boson decay (a), the invariant mass of any two jets (b), and the rescaled ratio of the two (c). |

png pdf |
Figure 2-b:
Distributions from simulated $ \mathrm{ t \bar{t} Z \to b \ell \nu \ b q \bar{q} } $ events with exactly four jets. Shown are the invariant mass of two jets matched to a hadronic W boson decay (a), the invariant mass of any two jets (b), and the rescaled ratio of the two (c). |
png pdf |
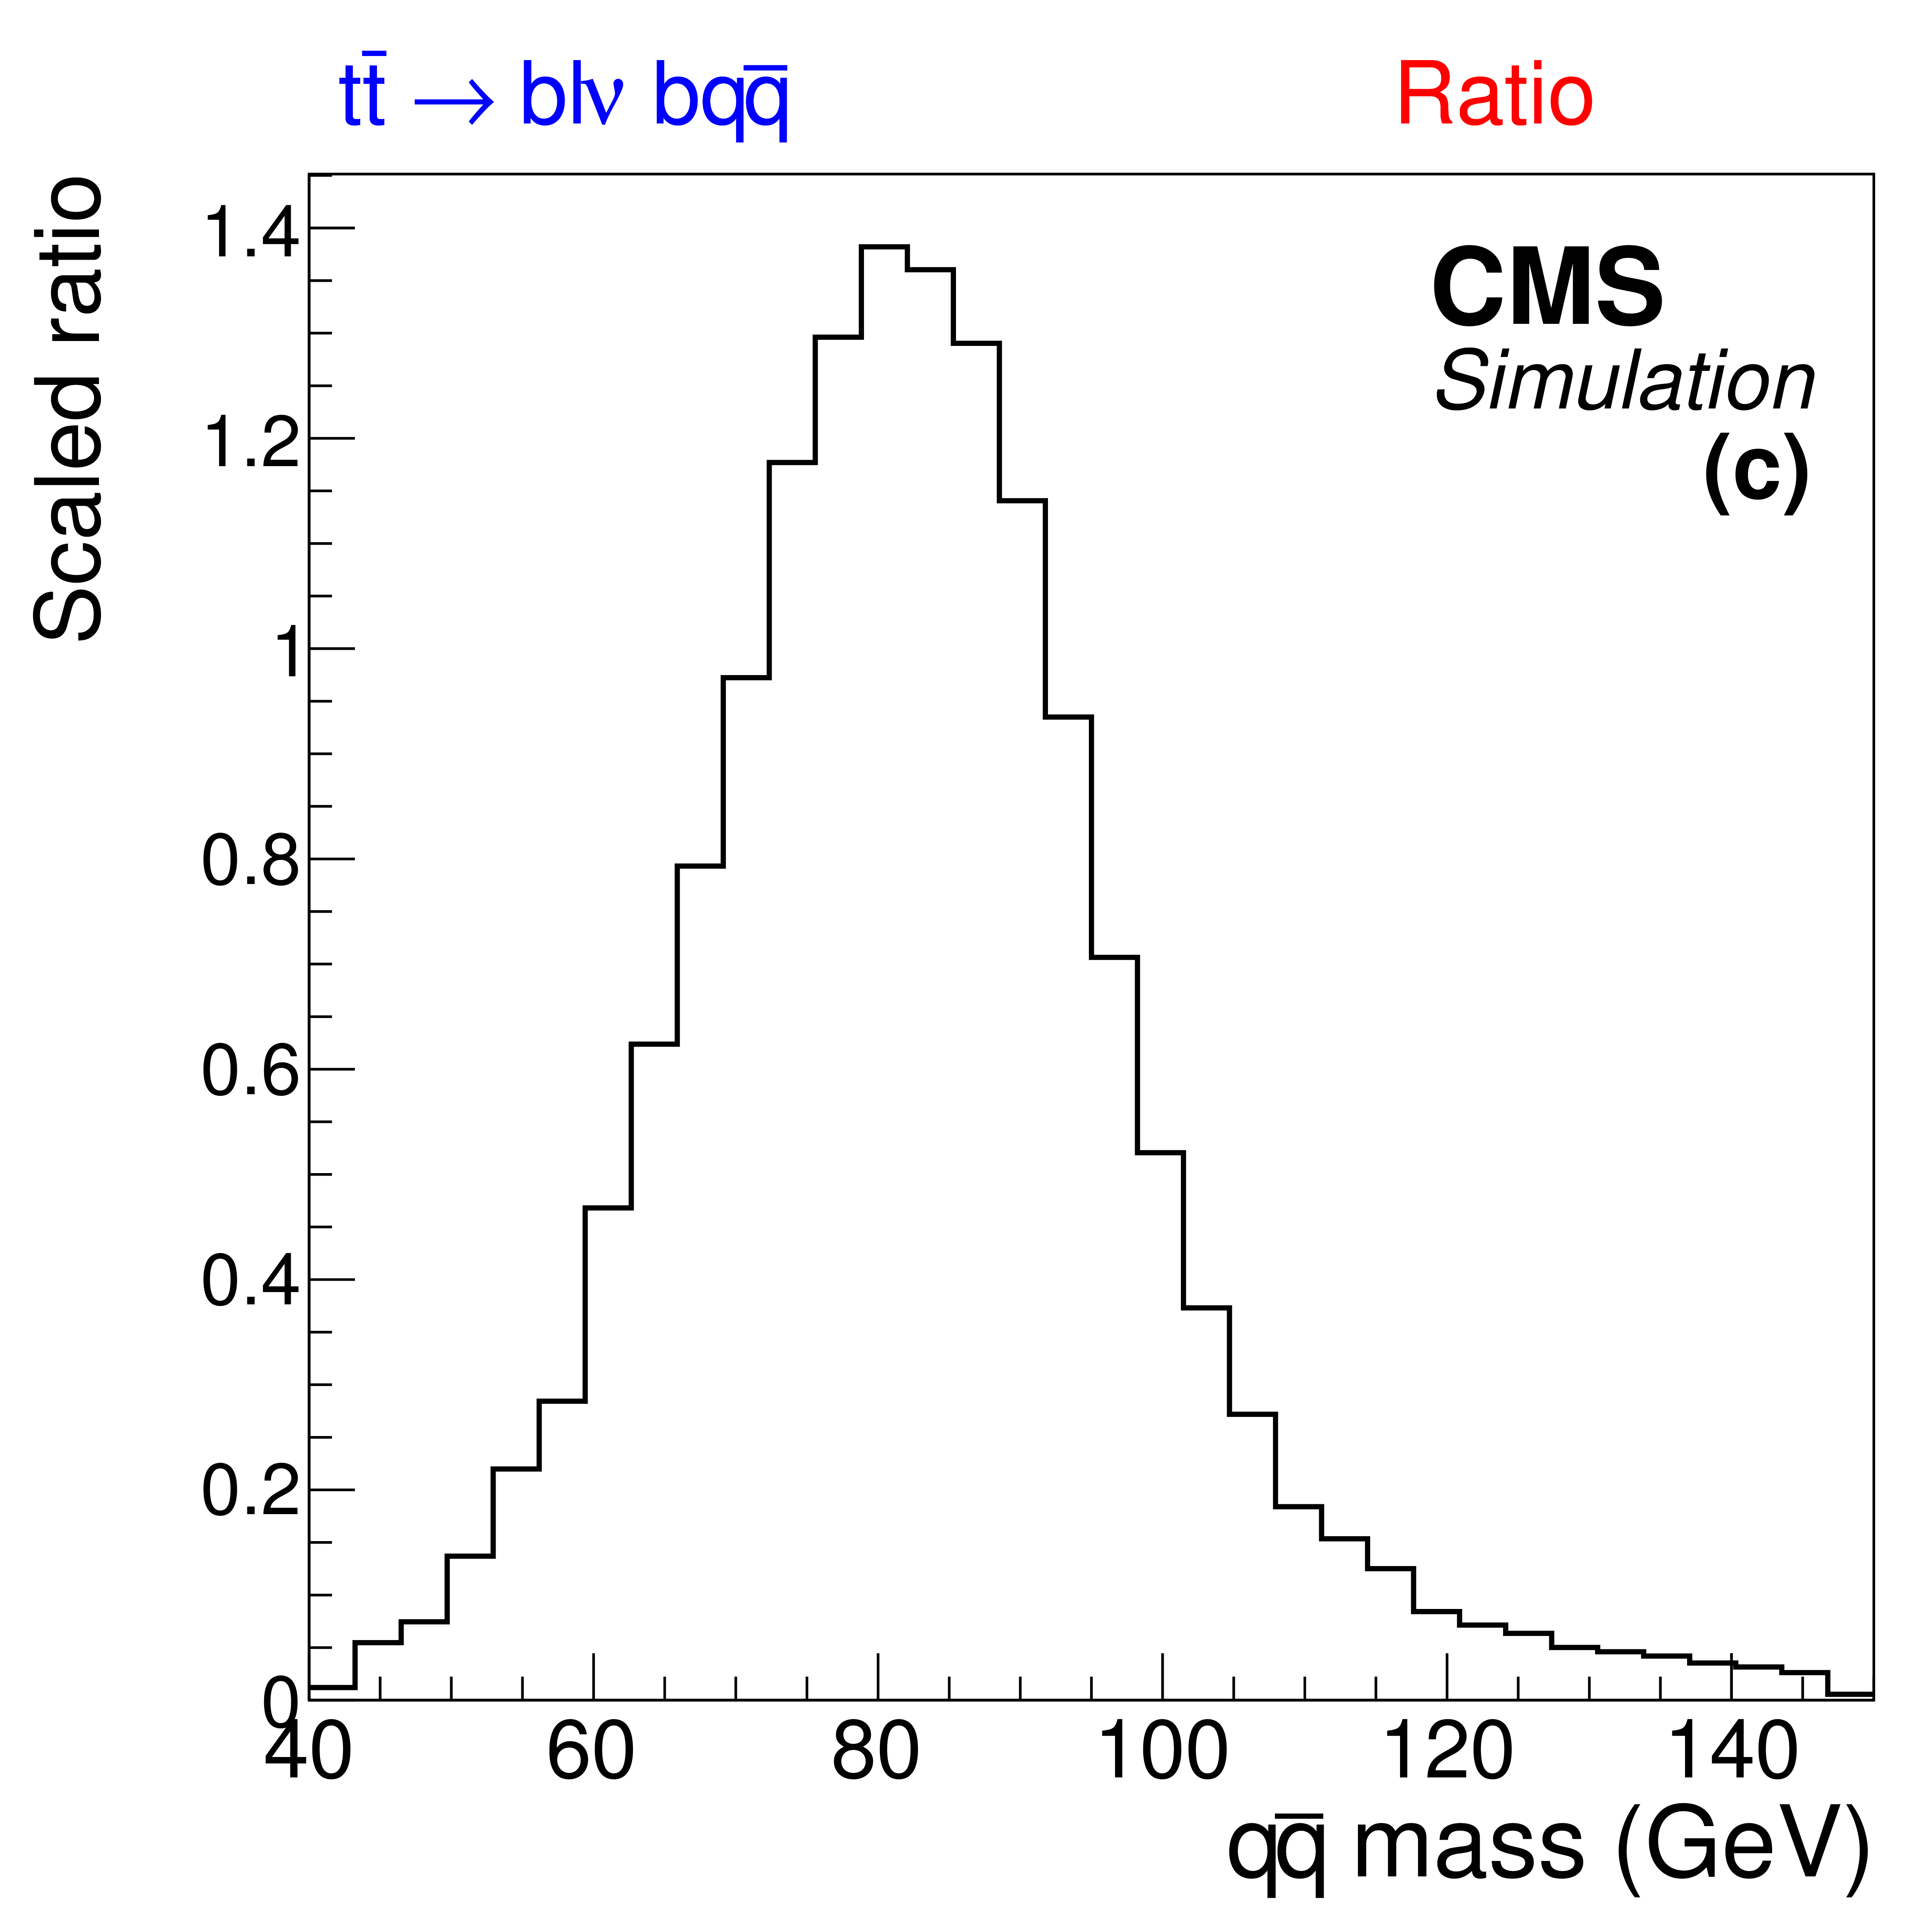
Figure 2-c:
Distributions from simulated $ \mathrm{ t \bar{t} Z \to b \ell \nu \ b q \bar{q} } $ events with exactly four jets. Shown are the invariant mass of two jets matched to a hadronic W boson decay (a), the invariant mass of any two jets (b), and the rescaled ratio of the two (c). |
png pdf |
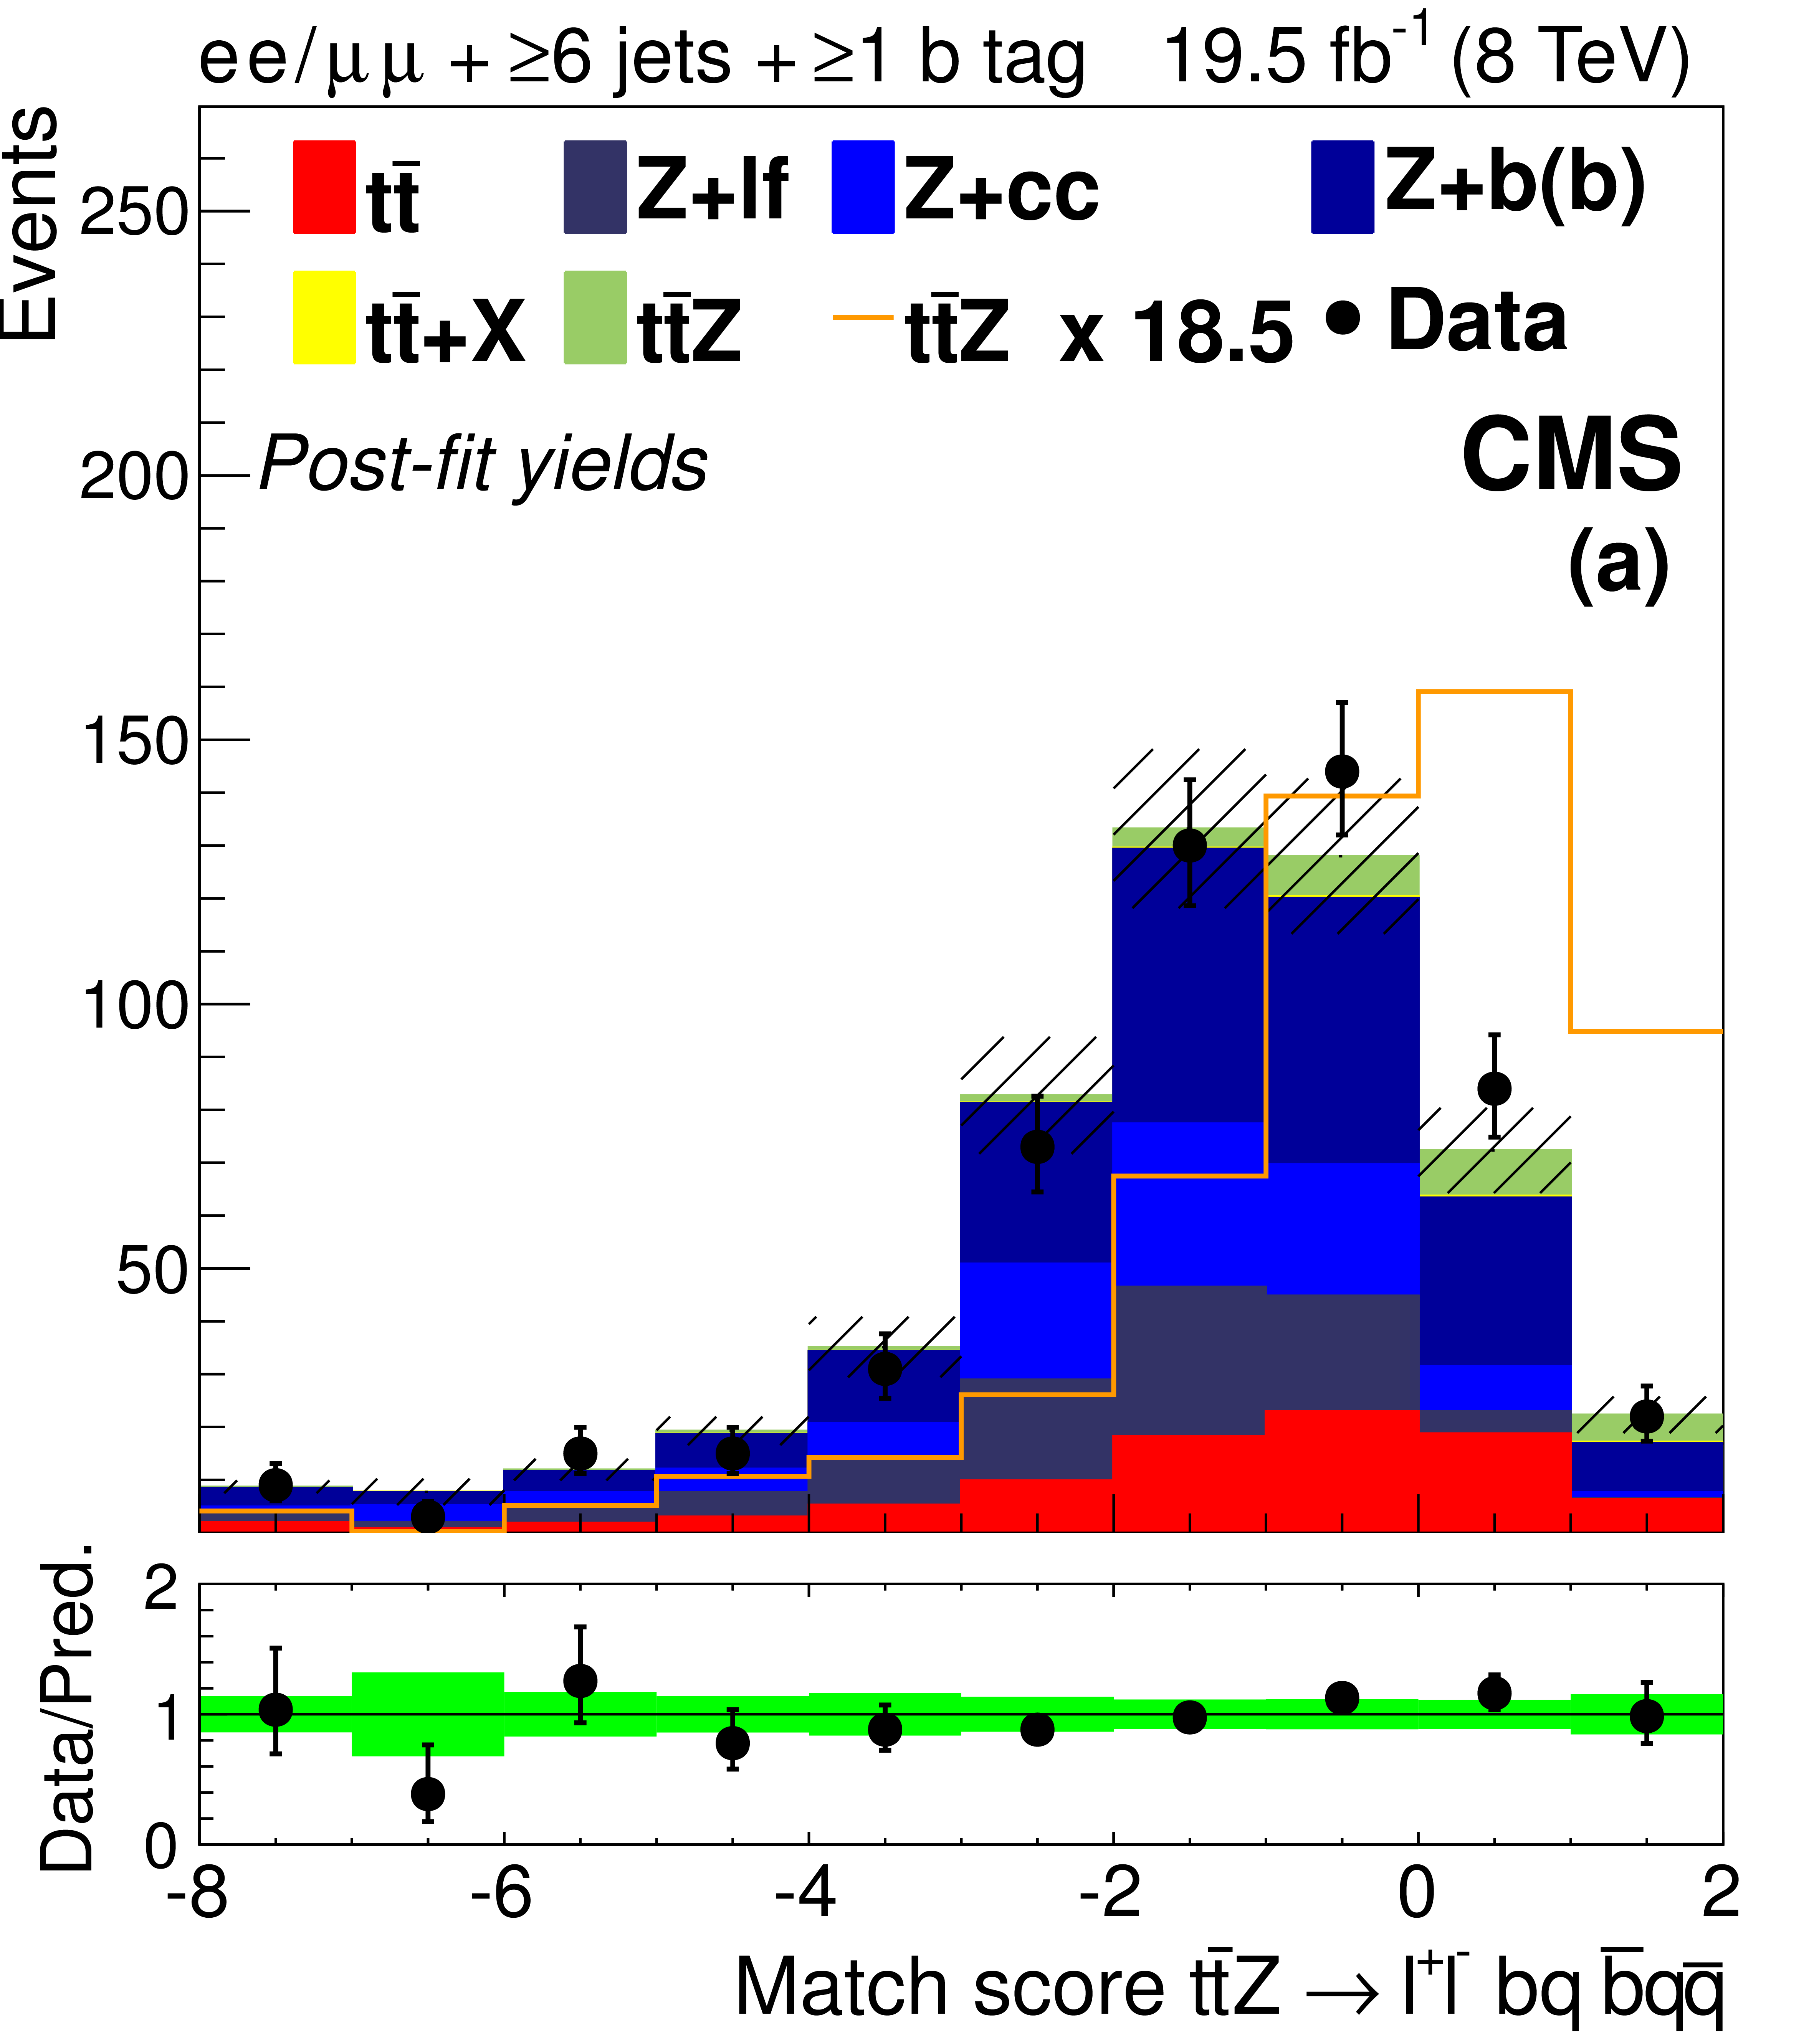
Figure 3-a:
Distributions for match scores with signal and background yields from the final fit described in Section 10. Plot (a) shows the match score for partially reconstructed hadronic $ \mathrm{ t \bar{t} } $ systems in SF OS dilepton events with six or more jets. Plots (b) and (c) show scores for fully reconstructed semileptonic $ \mathrm{ t \bar{t} } $ systems in events with at least four jets, and a SS $ \mathrm{ e \mu } $ pair, or three leptons, respectively. The 68% CL uncertainty in the signal plus background prediction is represented by hash marks in the stack histogram, and a green shaded region in the data-to-prediction ratio plot. The orange line in plot (a) shows the shape of the $ \mathrm{ t \bar{t} Z } $ signal, suitably normalized. ``Ch. misID'' indicates the charge-misidentified background. ``Other'' backgrounds include, $ \mathrm{ t \bar{t} \gamma^{*} } $ , $ \mathrm{ t \bar{t} W W } $ , $ \mathrm{ t b Z } $ , WWW, WWZ, and $ \mathrm{ W^{\pm } W^{\pm } }$. |
png pdf |
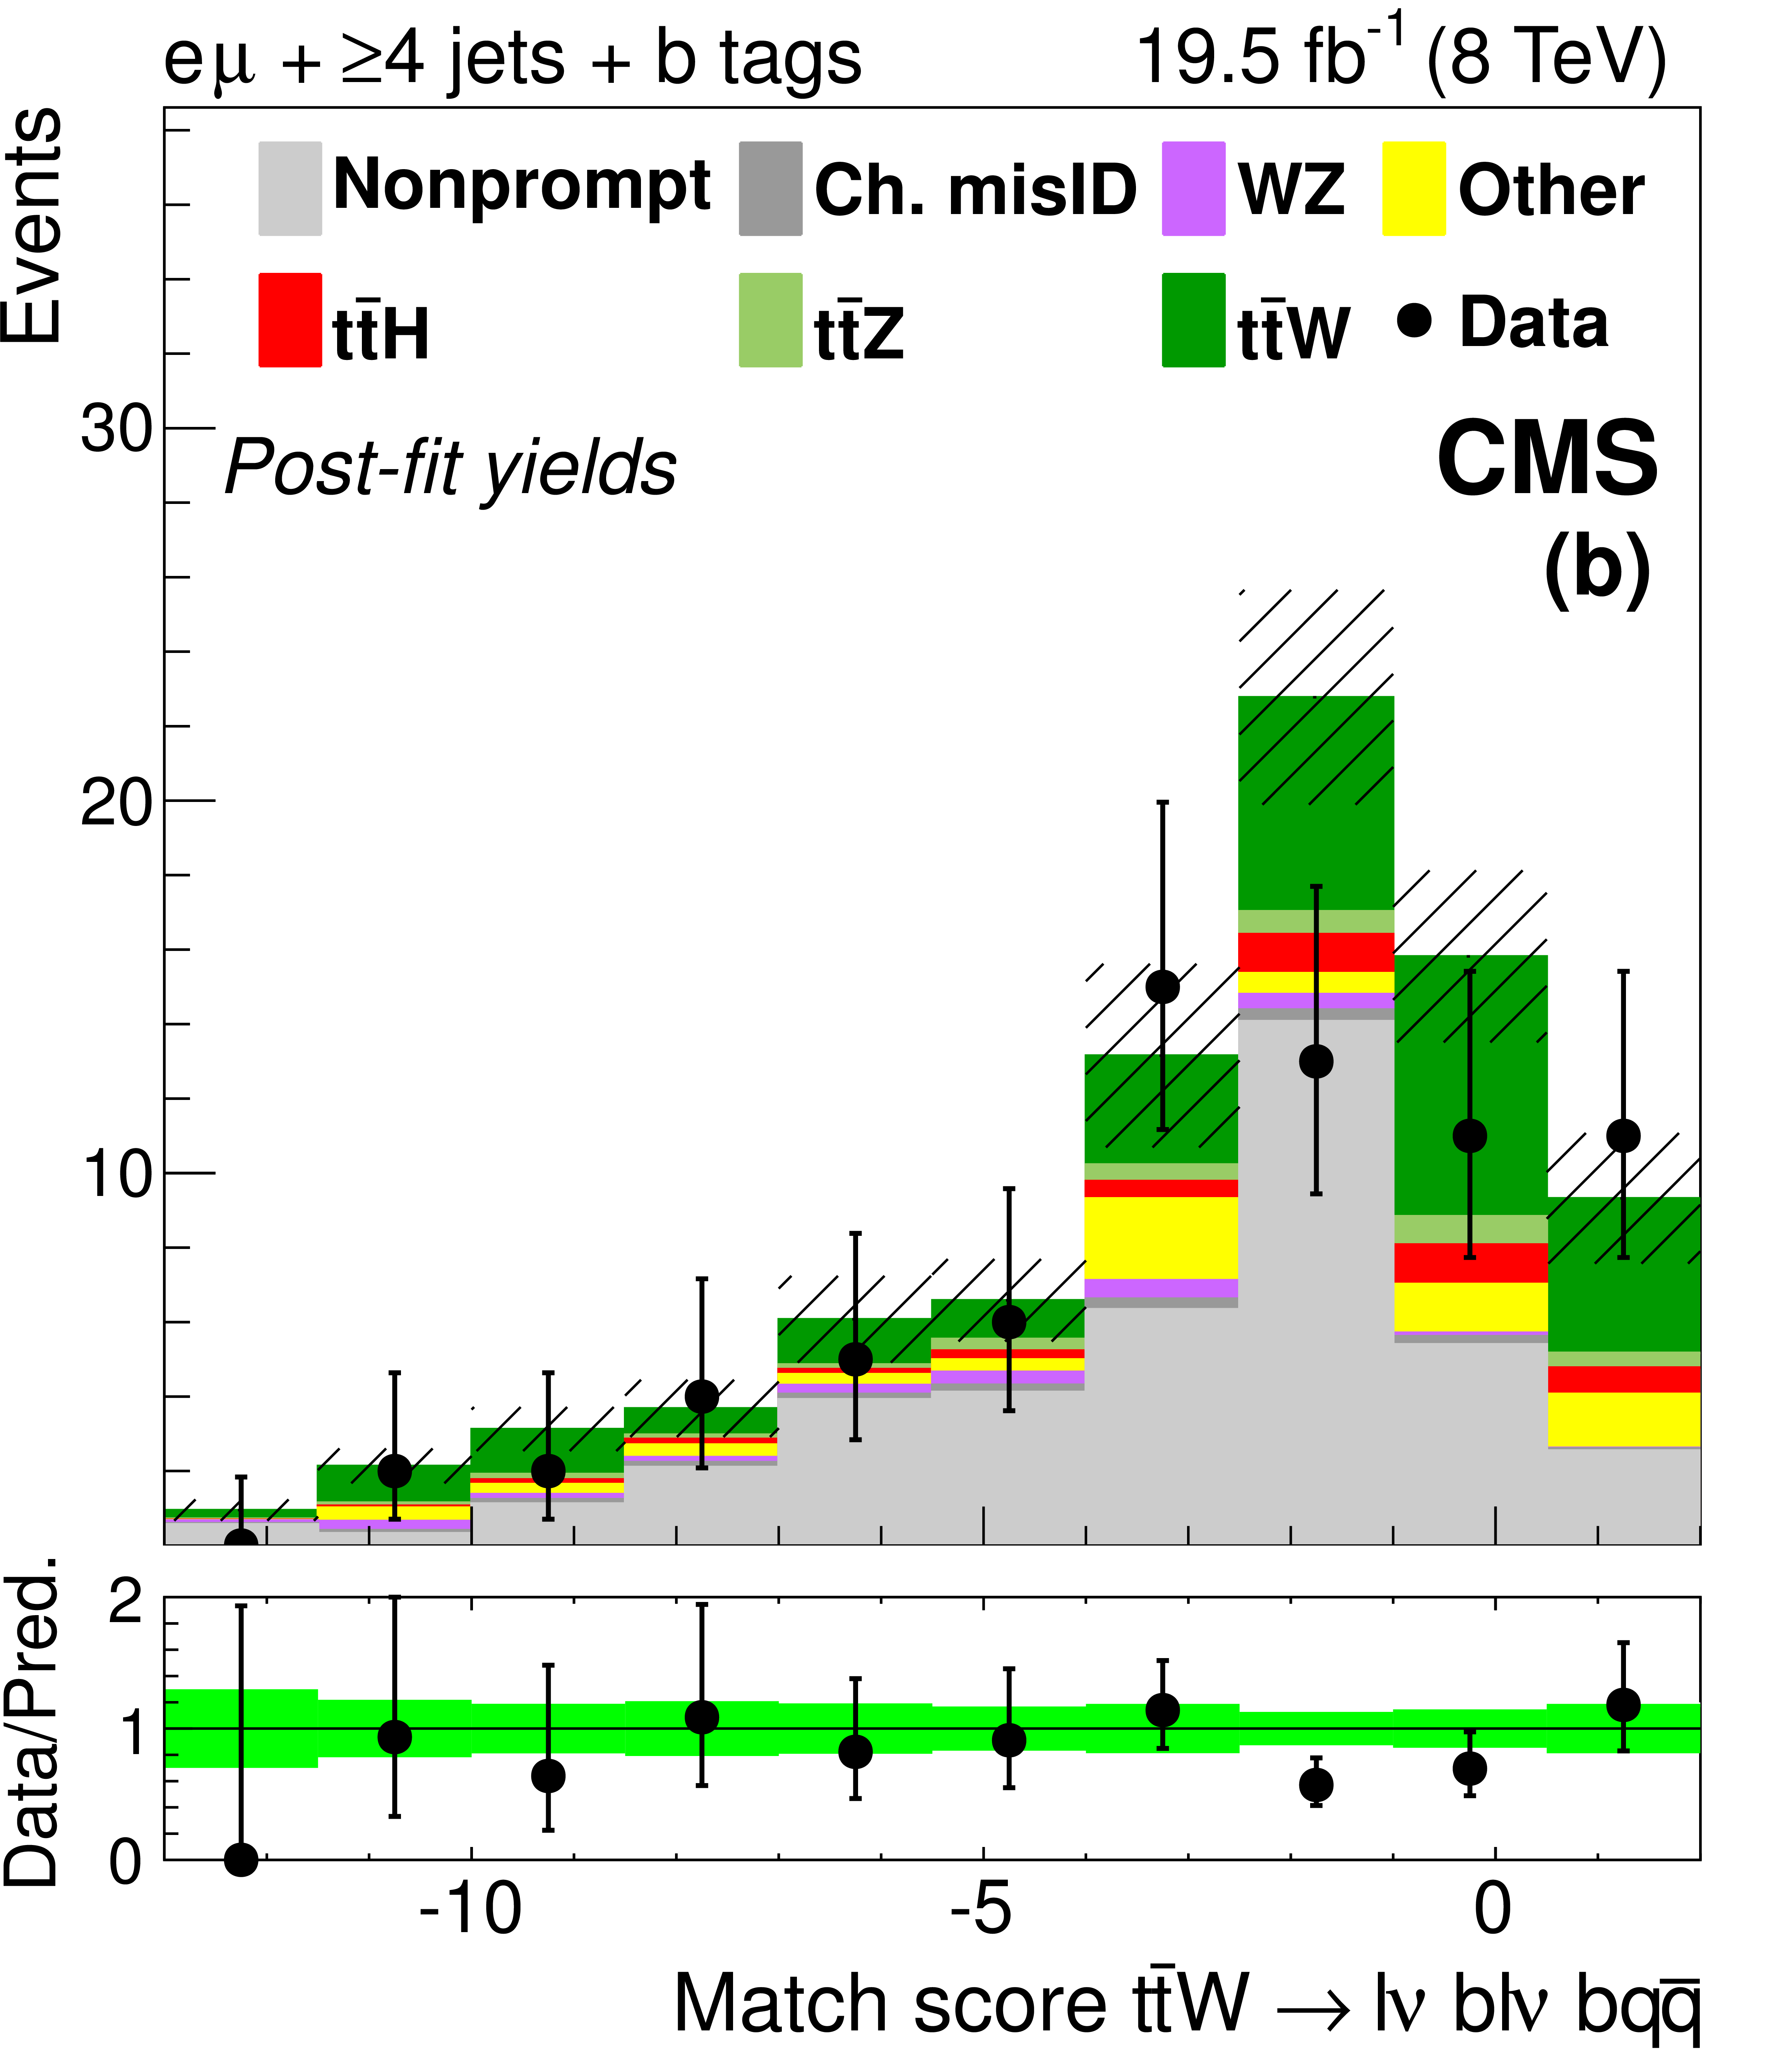
Figure 3-b:
Distributions for match scores with signal and background yields from the final fit described in Section 10. Plot (a) shows the match score for partially reconstructed hadronic $ \mathrm{ t \bar{t} } $ systems in SF OS dilepton events with six or more jets. Plots (b) and (c) show scores for fully reconstructed semileptonic $ \mathrm{ t \bar{t} } $ systems in events with at least four jets, and a SS $ \mathrm{ e \mu } $ pair, or three leptons, respectively. The 68% CL uncertainty in the signal plus background prediction is represented by hash marks in the stack histogram, and a green shaded region in the data-to-prediction ratio plot. The orange line in plot (a) shows the shape of the $ \mathrm{ t \bar{t} Z } $ signal, suitably normalized. ``Ch. misID'' indicates the charge-misidentified background. ``Other'' backgrounds include, $ \mathrm{ t \bar{t} \gamma^{*} } $ , $ \mathrm{ t \bar{t} W W } $ , $ \mathrm{ t b Z } $ , WWW, WWZ, and $ \mathrm{ W^{\pm } W^{\pm } }$. |
png pdf |
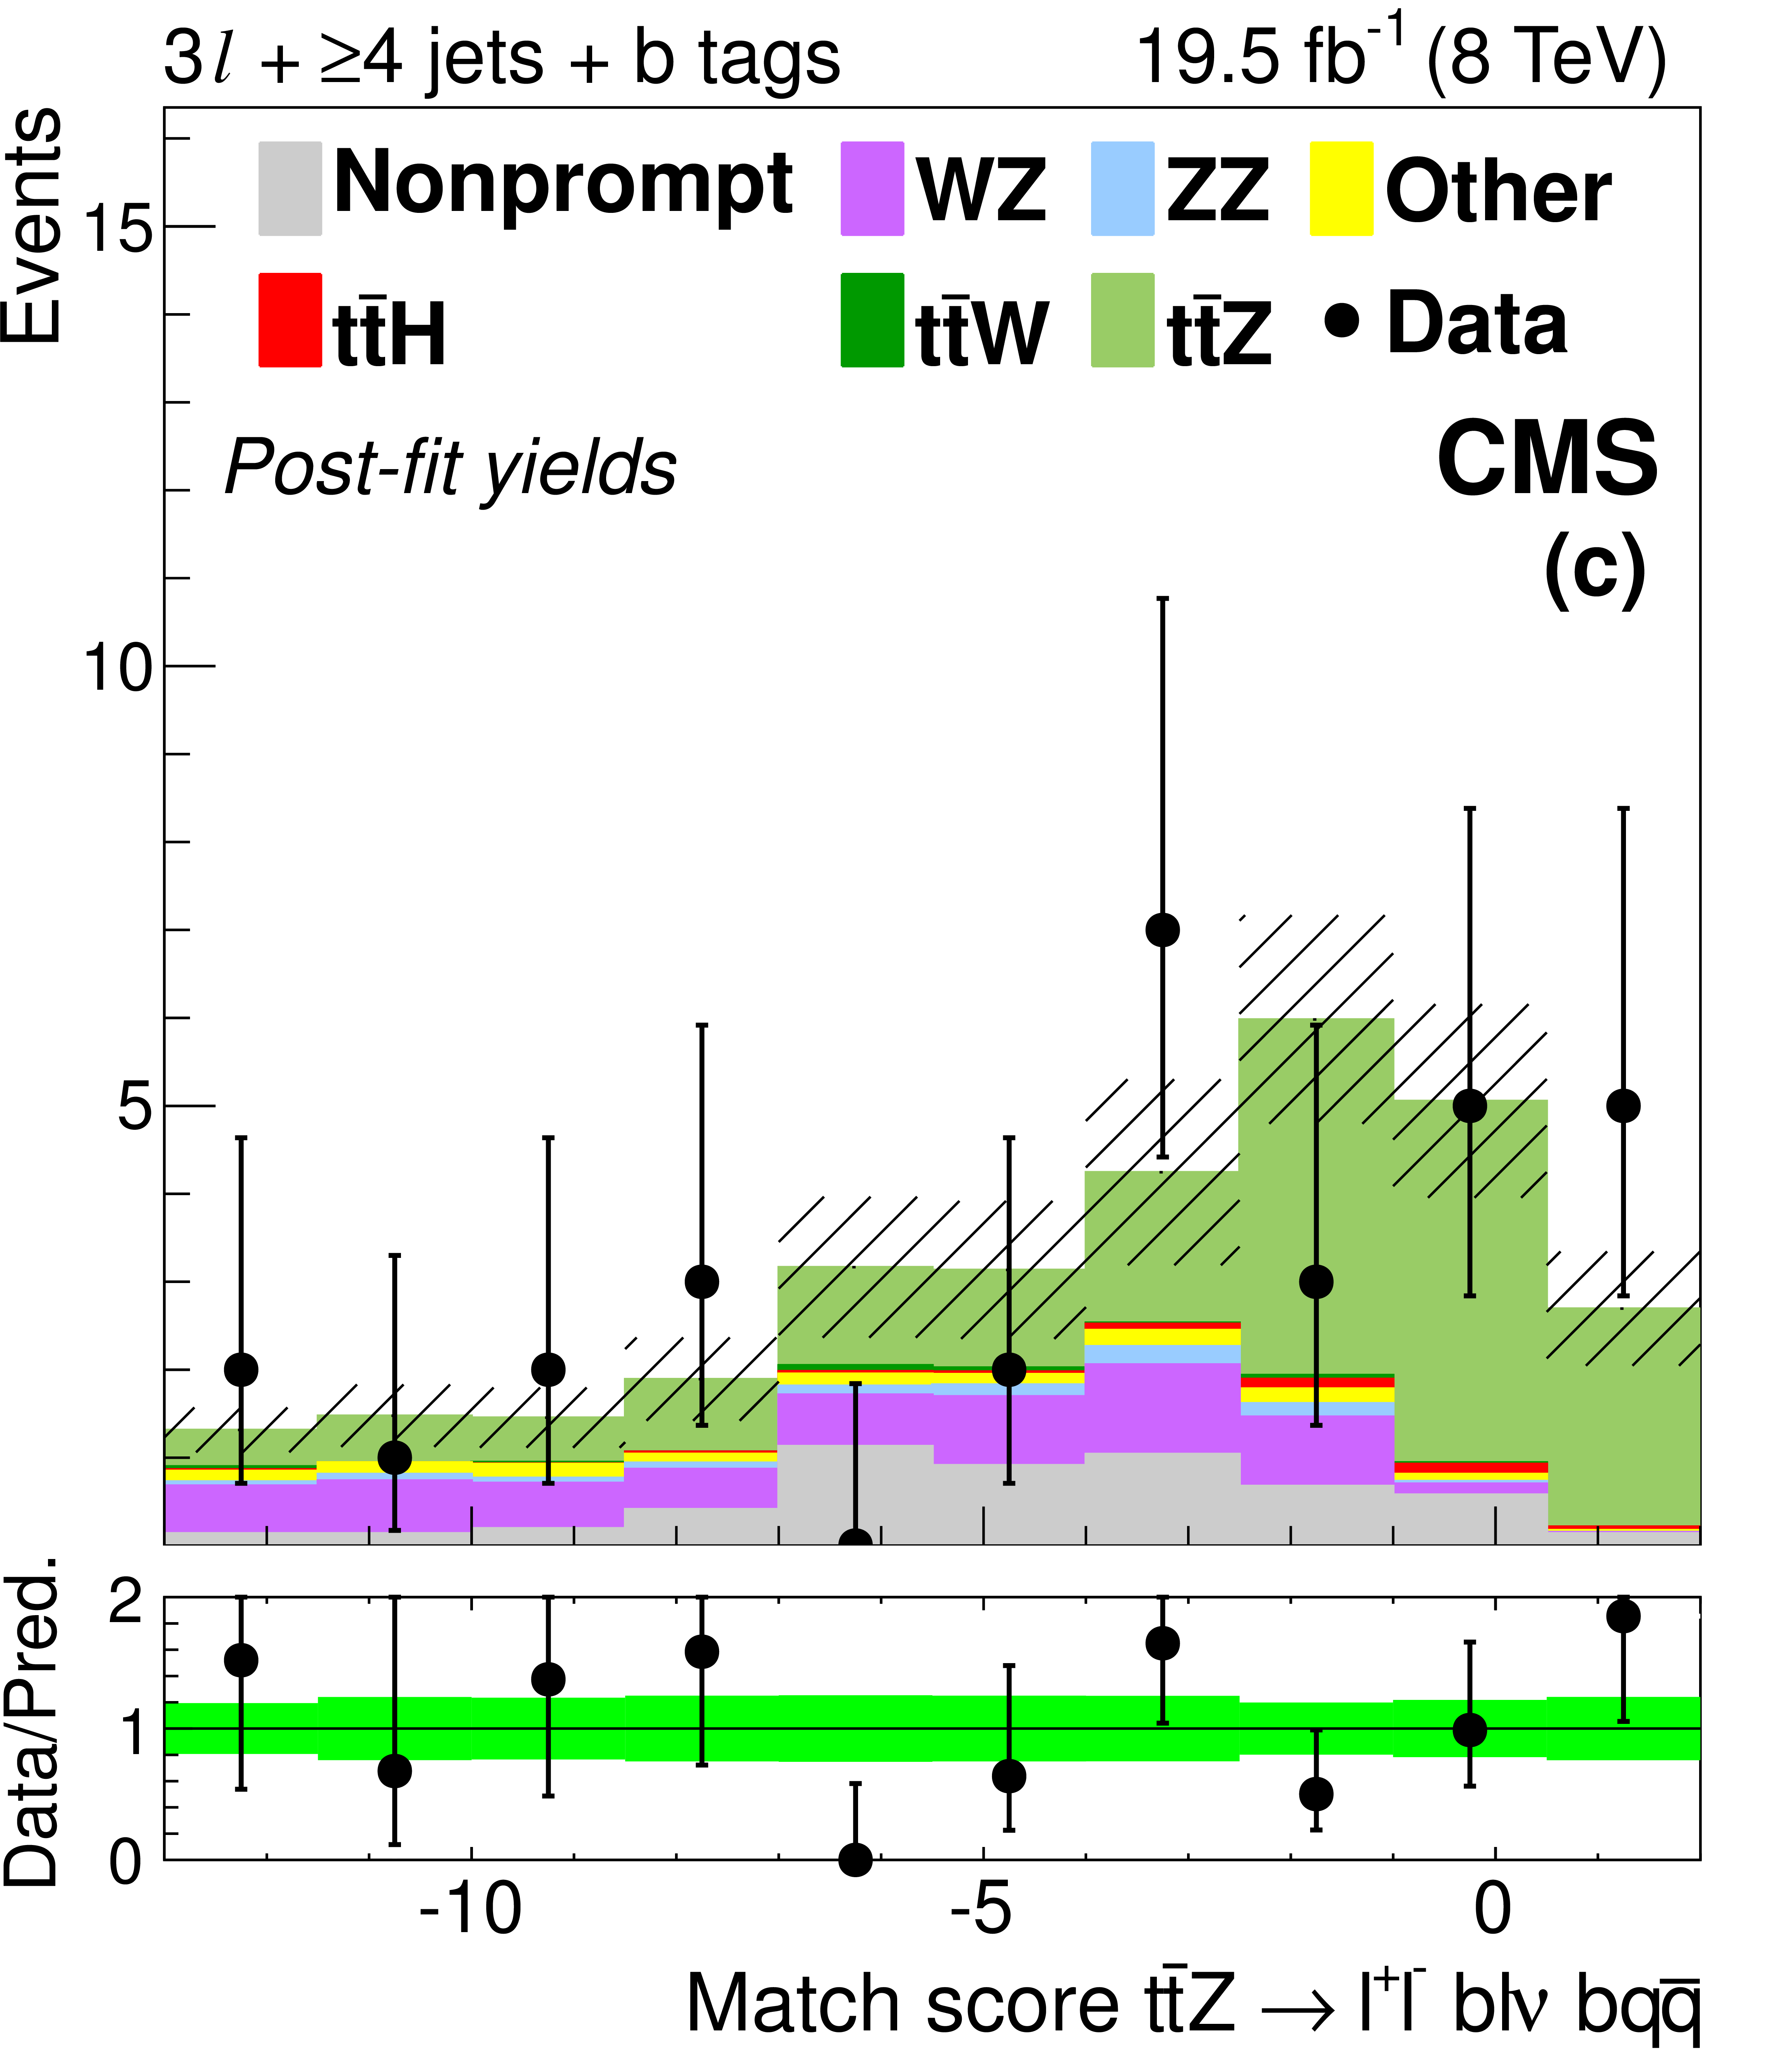
Figure 3-c:
Distributions for match scores with signal and background yields from the final fit described in Section 10. Plot (a) shows the match score for partially reconstructed hadronic $ \mathrm{ t \bar{t} } $ systems in SF OS dilepton events with six or more jets. Plots (b) and (c) show scores for fully reconstructed semileptonic $ \mathrm{ t \bar{t} } $ systems in events with at least four jets, and a SS $ \mathrm{ e \mu } $ pair, or three leptons, respectively. The 68% CL uncertainty in the signal plus background prediction is represented by hash marks in the stack histogram, and a green shaded region in the data-to-prediction ratio plot. The orange line in plot (a) shows the shape of the $ \mathrm{ t \bar{t} Z } $ signal, suitably normalized. ``Ch. misID'' indicates the charge-misidentified background. ``Other'' backgrounds include, $ \mathrm{ t \bar{t} \gamma^{*} } $ , $ \mathrm{ t \bar{t} W W } $ , $ \mathrm{ t b Z } $ , WWW, WWZ, and $ \mathrm{ W^{\pm } W^{\pm } }$. |
png pdf |
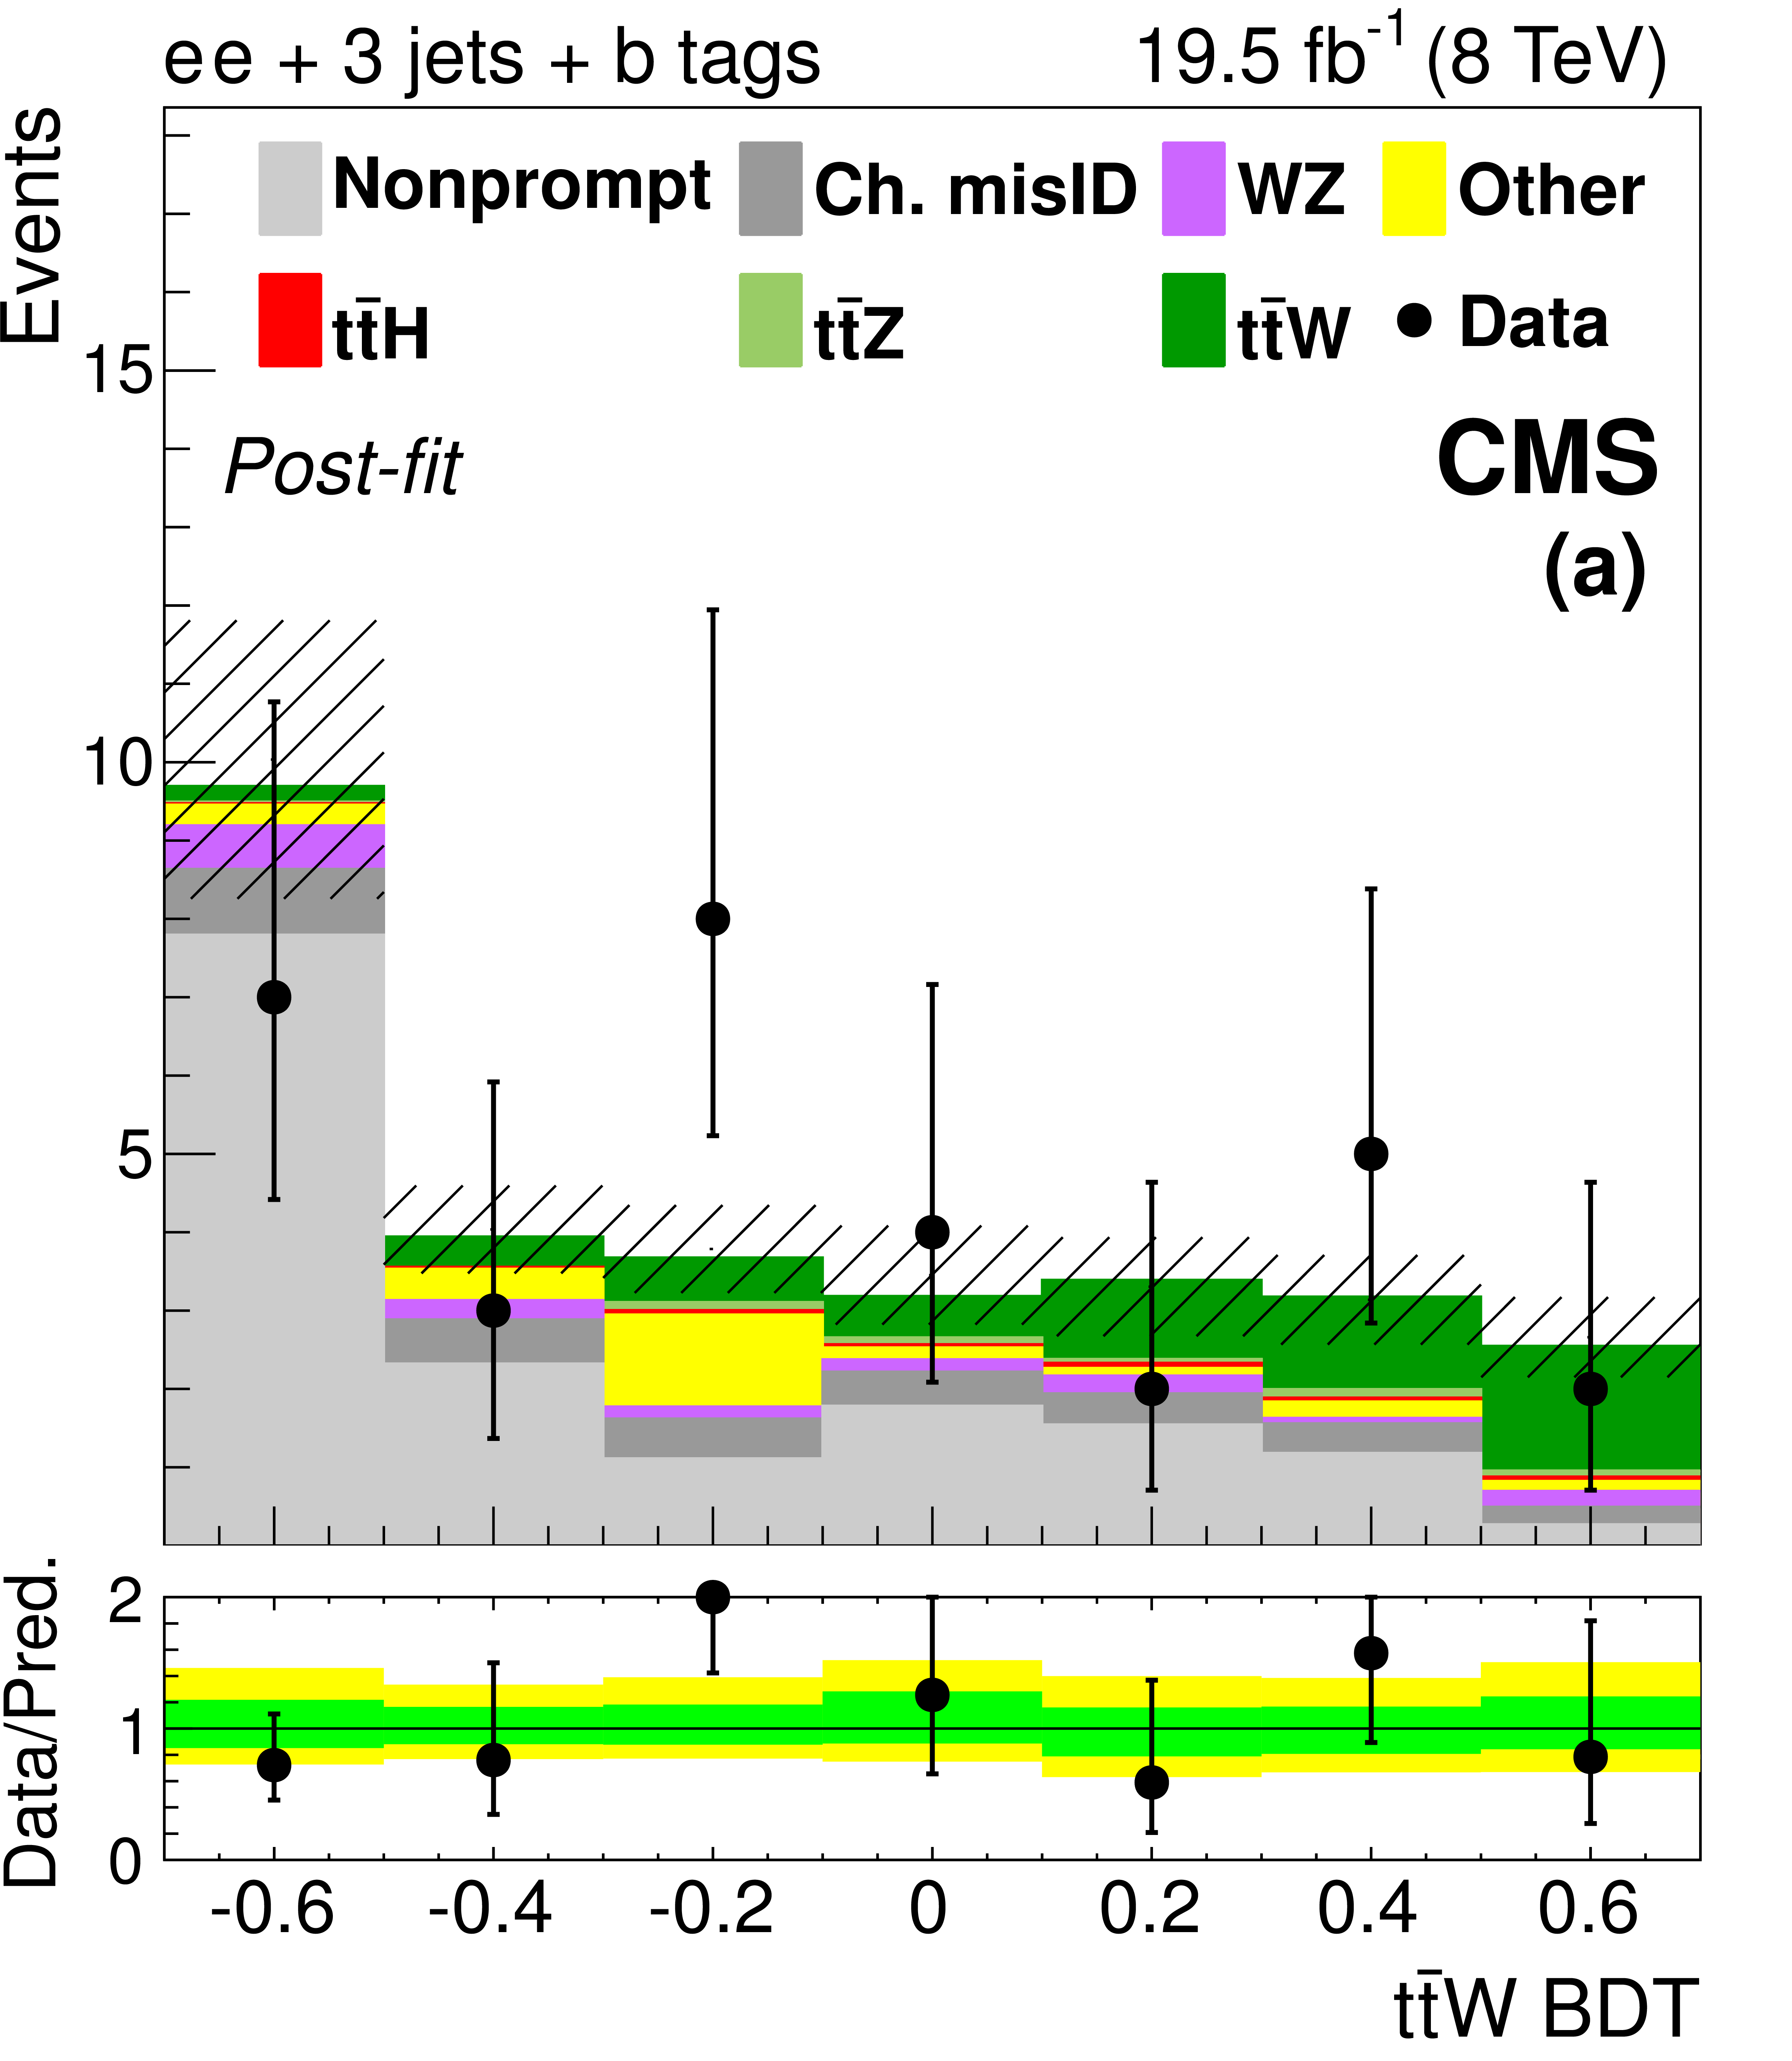
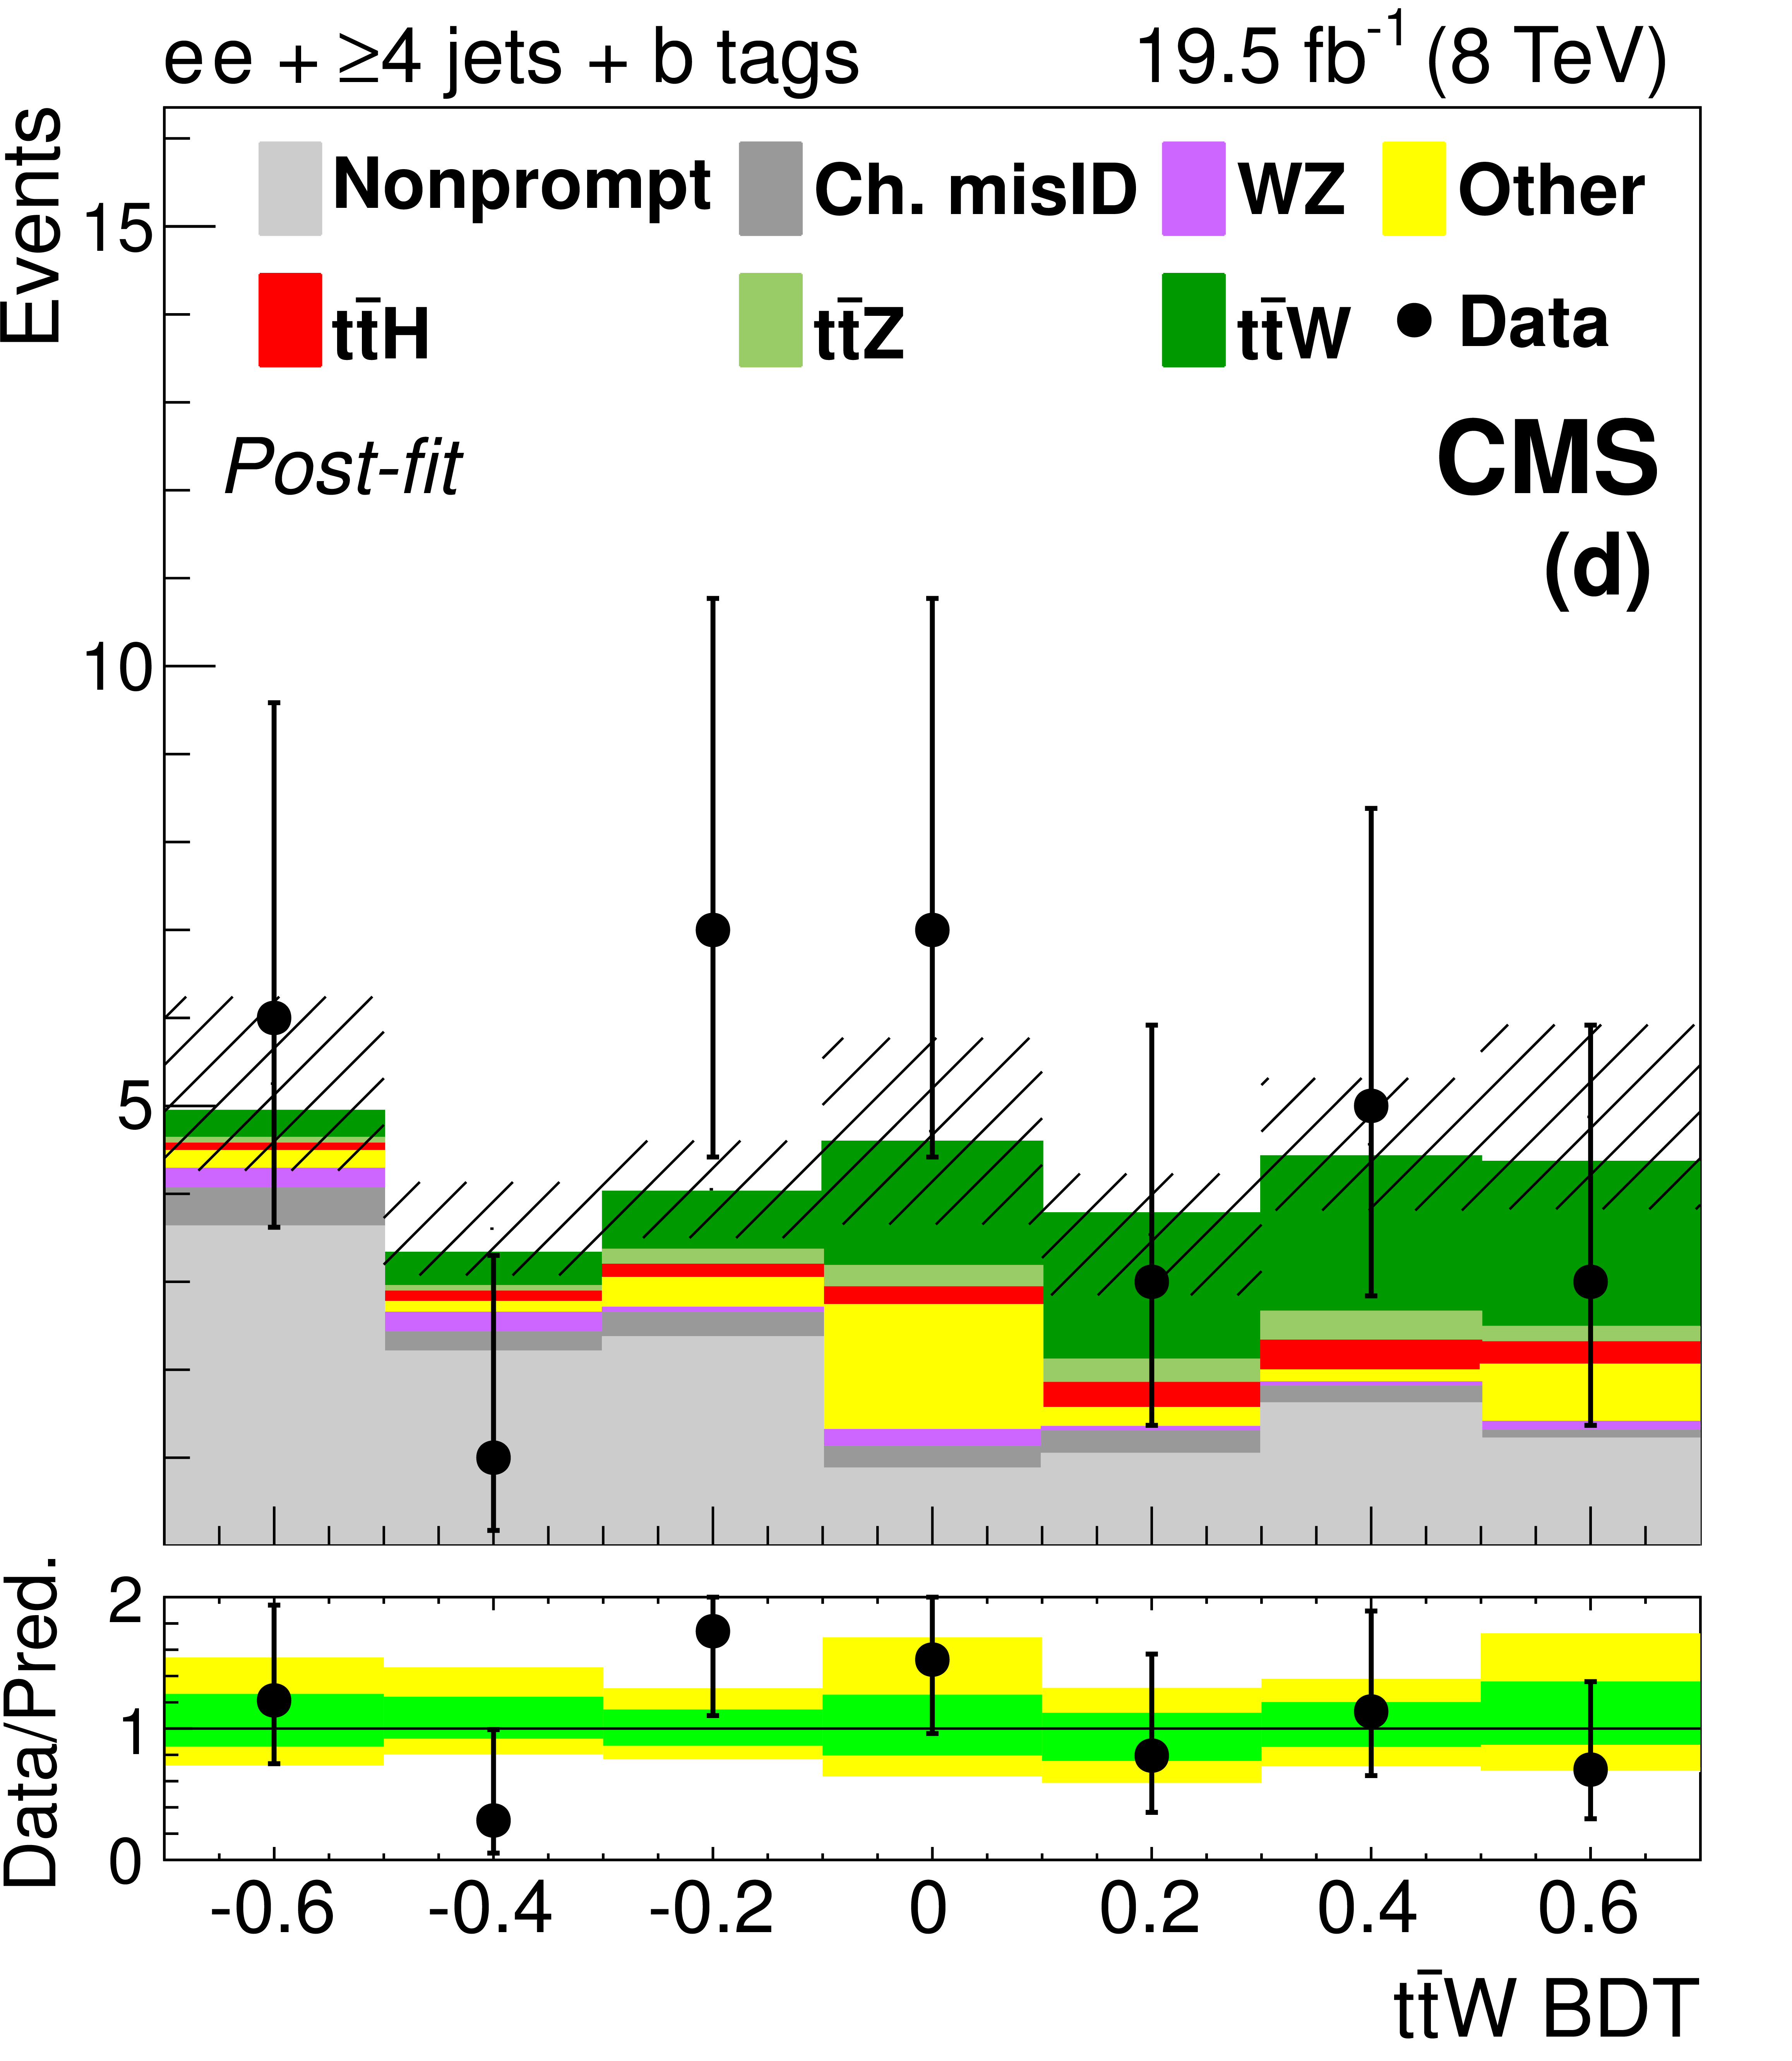
Figure 4-a:
The final discriminant for SS $ \mathrm{ t \bar{t} W }$ channel events with 3 jets (top) and ${\geq }4$ jets (bottom), after the final fit described in Section 10. The lepton flavors are $ \mathrm{ ee } $ (a, d), $ \mathrm{ e \mu } $ (b, e), and $\mu \mu $ (c, f). The 68% CL uncertainty in the fitted signal plus background is represented by hash marks in the stack histogram, and a green shaded region in the data-to-prediction ratio plot. The 95% CL band from the fit is shown in yellow. ``Ch. misID'' indicates the charge-misidentified background. ``Other'' backgrounds include $ \mathrm{ t \bar{t} \gamma }$, $ \mathrm{ t \bar{t} \gamma^{*} } $ , $ \mathrm{ t \bar{t} W W } $ , $ \mathrm{ t b Z } $ , WWW, WWZ, and $ \mathrm{ W^{\pm } W^{\pm } } $. |

png pdf |
Figure 4-b:
The final discriminant for SS $ \mathrm{ t \bar{t} W }$ channel events with 3 jets (top) and ${\geq }4$ jets (bottom), after the final fit described in Section 10. The lepton flavors are $ \mathrm{ ee } $ (a, d), $ \mathrm{ e \mu } $ (b, e), and $\mu \mu $ (c, f). The 68% CL uncertainty in the fitted signal plus background is represented by hash marks in the stack histogram, and a green shaded region in the data-to-prediction ratio plot. The 95% CL band from the fit is shown in yellow. ``Ch. misID'' indicates the charge-misidentified background. ``Other'' backgrounds include $ \mathrm{ t \bar{t} \gamma }$, $ \mathrm{ t \bar{t} \gamma^{*} } $ , $ \mathrm{ t \bar{t} W W } $ , $ \mathrm{ t b Z } $ , WWW, WWZ, and $ \mathrm{ W^{\pm } W^{\pm } } $. |
png pdf |
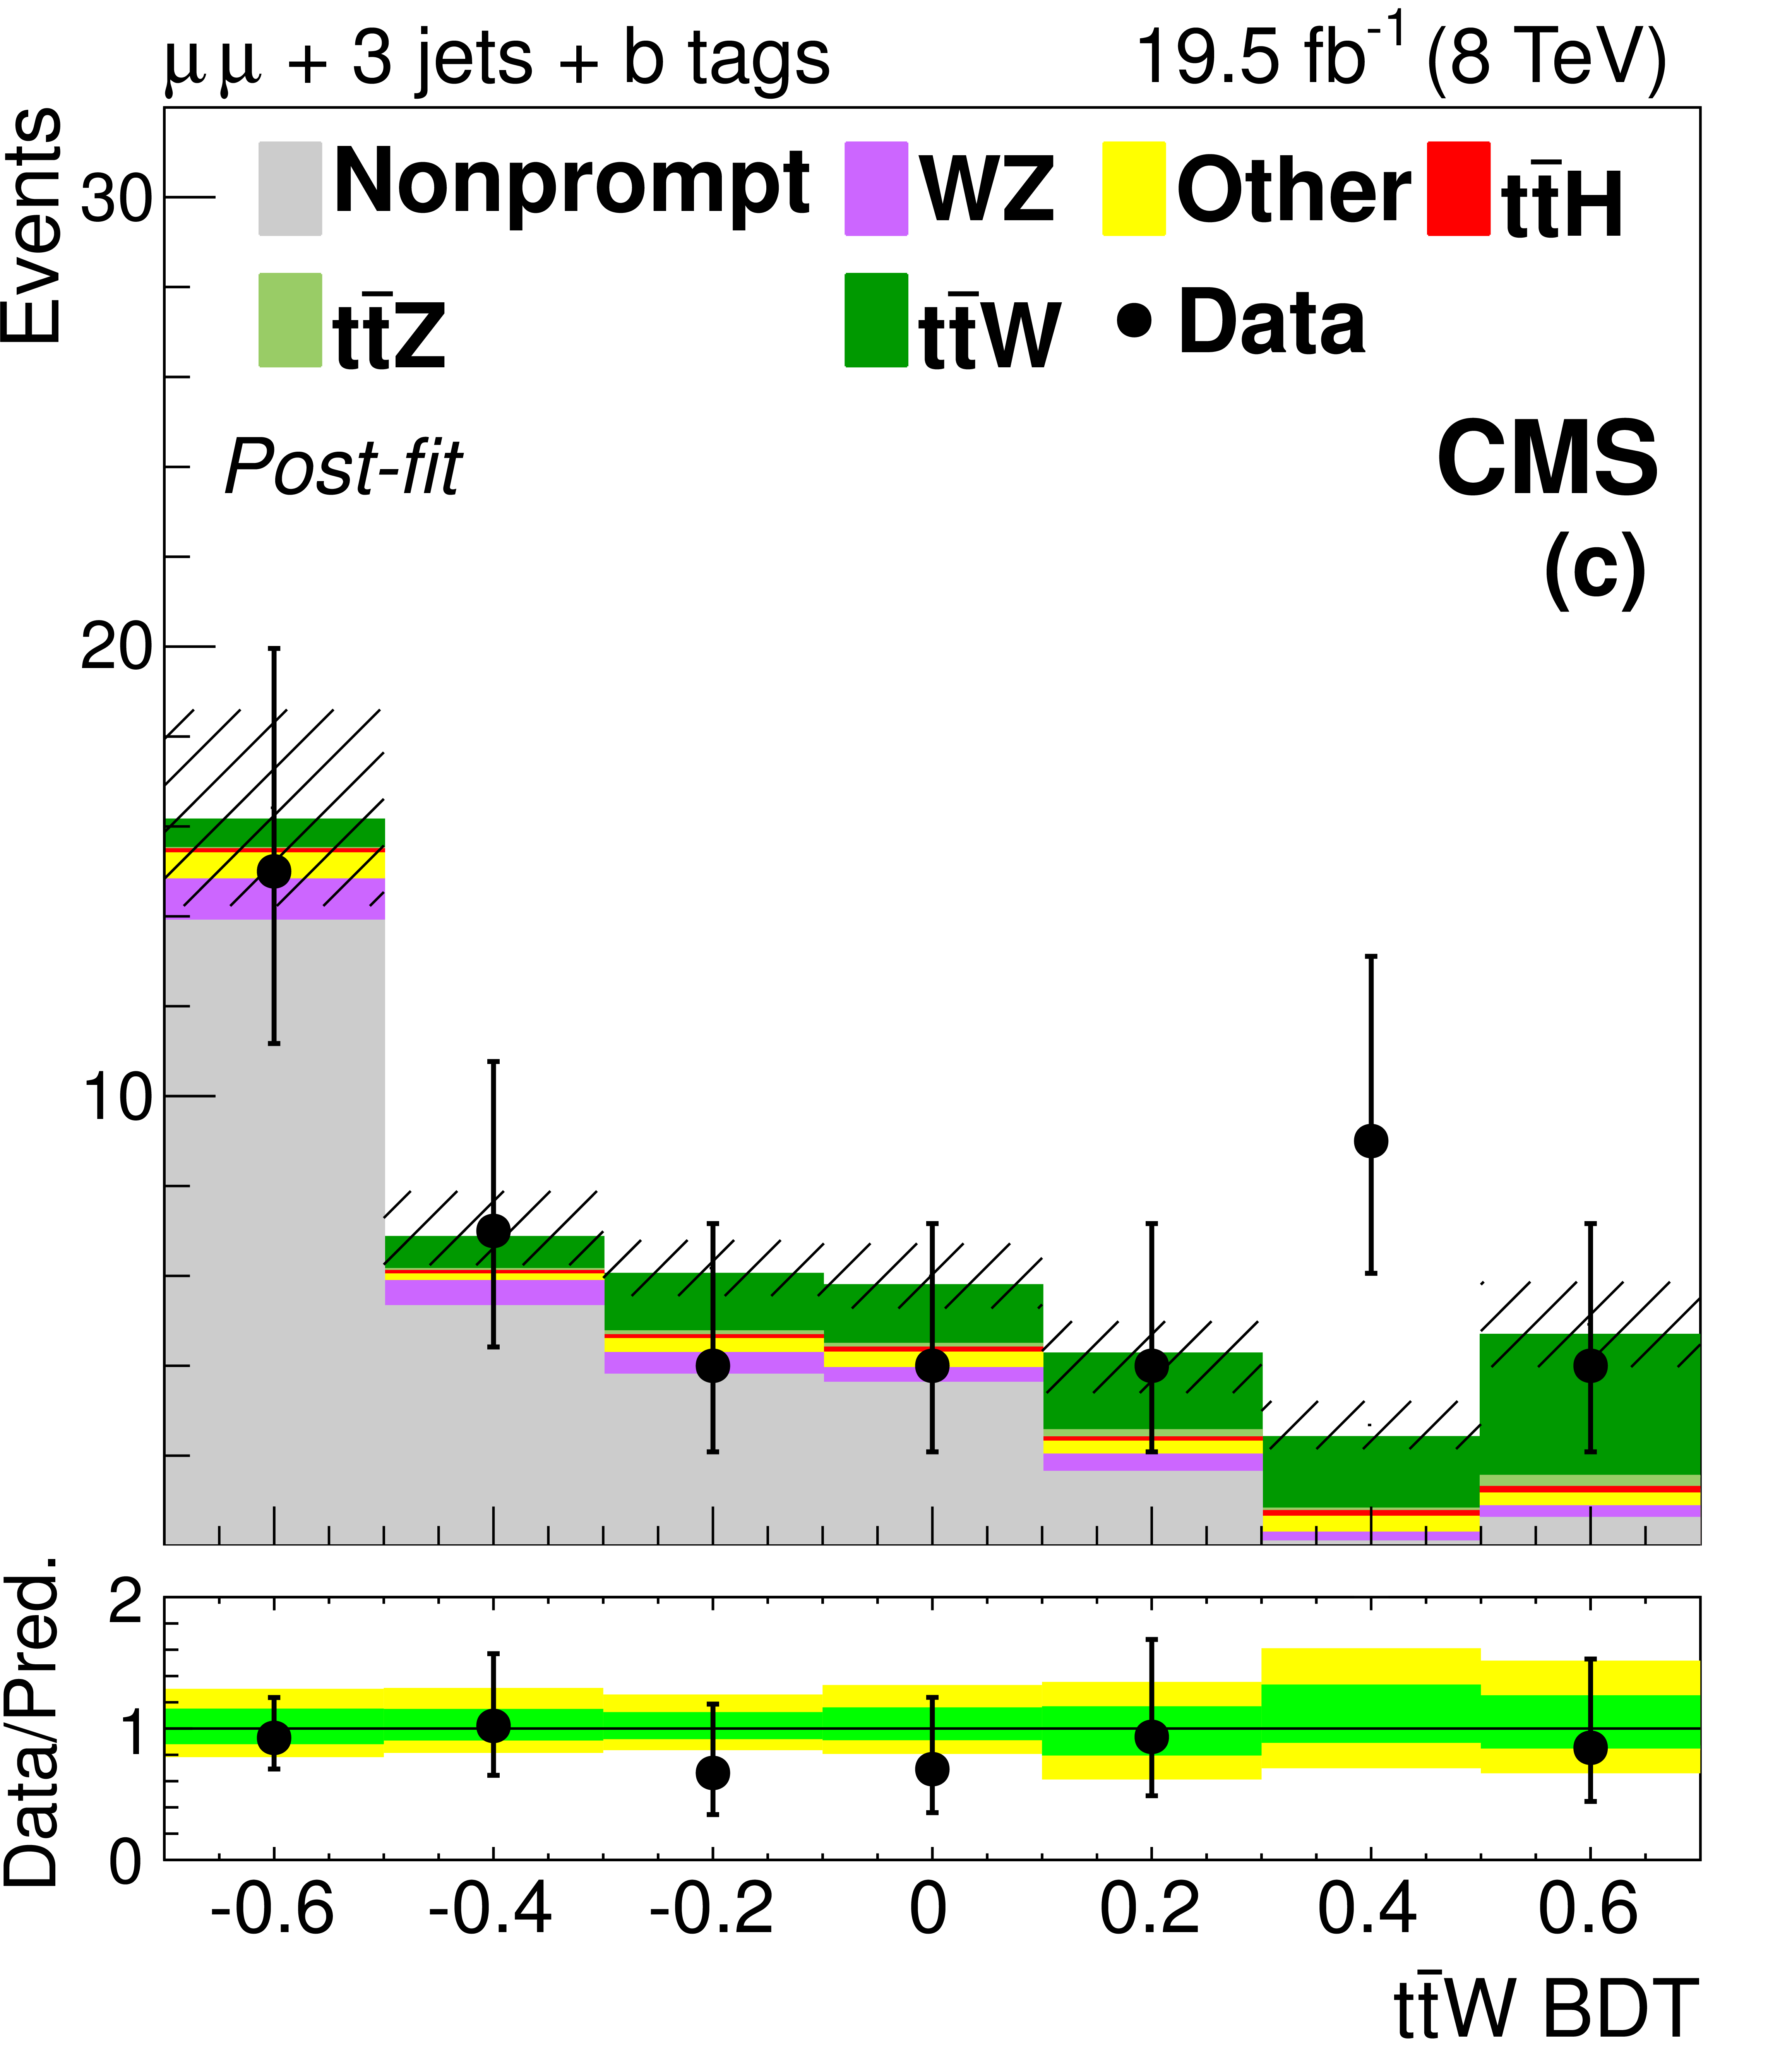
Figure 4-c:
The final discriminant for SS $ \mathrm{ t \bar{t} W }$ channel events with 3 jets (top) and ${\geq }4$ jets (bottom), after the final fit described in Section 10. The lepton flavors are $ \mathrm{ ee } $ (a, d), $ \mathrm{ e \mu } $ (b, e), and $\mu \mu $ (c, f). The 68% CL uncertainty in the fitted signal plus background is represented by hash marks in the stack histogram, and a green shaded region in the data-to-prediction ratio plot. The 95% CL band from the fit is shown in yellow. ``Ch. misID'' indicates the charge-misidentified background. ``Other'' backgrounds include $ \mathrm{ t \bar{t} \gamma }$, $ \mathrm{ t \bar{t} \gamma^{*} } $ , $ \mathrm{ t \bar{t} W W } $ , $ \mathrm{ t b Z } $ , WWW, WWZ, and $ \mathrm{ W^{\pm } W^{\pm } } $. |
png pdf |
Figure 4-d:
The final discriminant for SS $ \mathrm{ t \bar{t} W }$ channel events with 3 jets (top) and ${\geq }4$ jets (bottom), after the final fit described in Section 10. The lepton flavors are $ \mathrm{ ee } $ (a, d), $ \mathrm{ e \mu } $ (b, e), and $\mu \mu $ (c, f). The 68% CL uncertainty in the fitted signal plus background is represented by hash marks in the stack histogram, and a green shaded region in the data-to-prediction ratio plot. The 95% CL band from the fit is shown in yellow. ``Ch. misID'' indicates the charge-misidentified background. ``Other'' backgrounds include $ \mathrm{ t \bar{t} \gamma }$, $ \mathrm{ t \bar{t} \gamma^{*} } $ , $ \mathrm{ t \bar{t} W W } $ , $ \mathrm{ t b Z } $ , WWW, WWZ, and $ \mathrm{ W^{\pm } W^{\pm } } $. |

png pdf |
Figure 4-e:
The final discriminant for SS $ \mathrm{ t \bar{t} W }$ channel events with 3 jets (top) and ${\geq }4$ jets (bottom), after the final fit described in Section 10. The lepton flavors are $ \mathrm{ ee } $ (a, d), $ \mathrm{ e \mu } $ (b, e), and $\mu \mu $ (c, f). The 68% CL uncertainty in the fitted signal plus background is represented by hash marks in the stack histogram, and a green shaded region in the data-to-prediction ratio plot. The 95% CL band from the fit is shown in yellow. ``Ch. misID'' indicates the charge-misidentified background. ``Other'' backgrounds include $ \mathrm{ t \bar{t} \gamma }$, $ \mathrm{ t \bar{t} \gamma^{*} } $ , $ \mathrm{ t \bar{t} W W } $ , $ \mathrm{ t b Z } $ , WWW, WWZ, and $ \mathrm{ W^{\pm } W^{\pm } } $. |
png pdf |
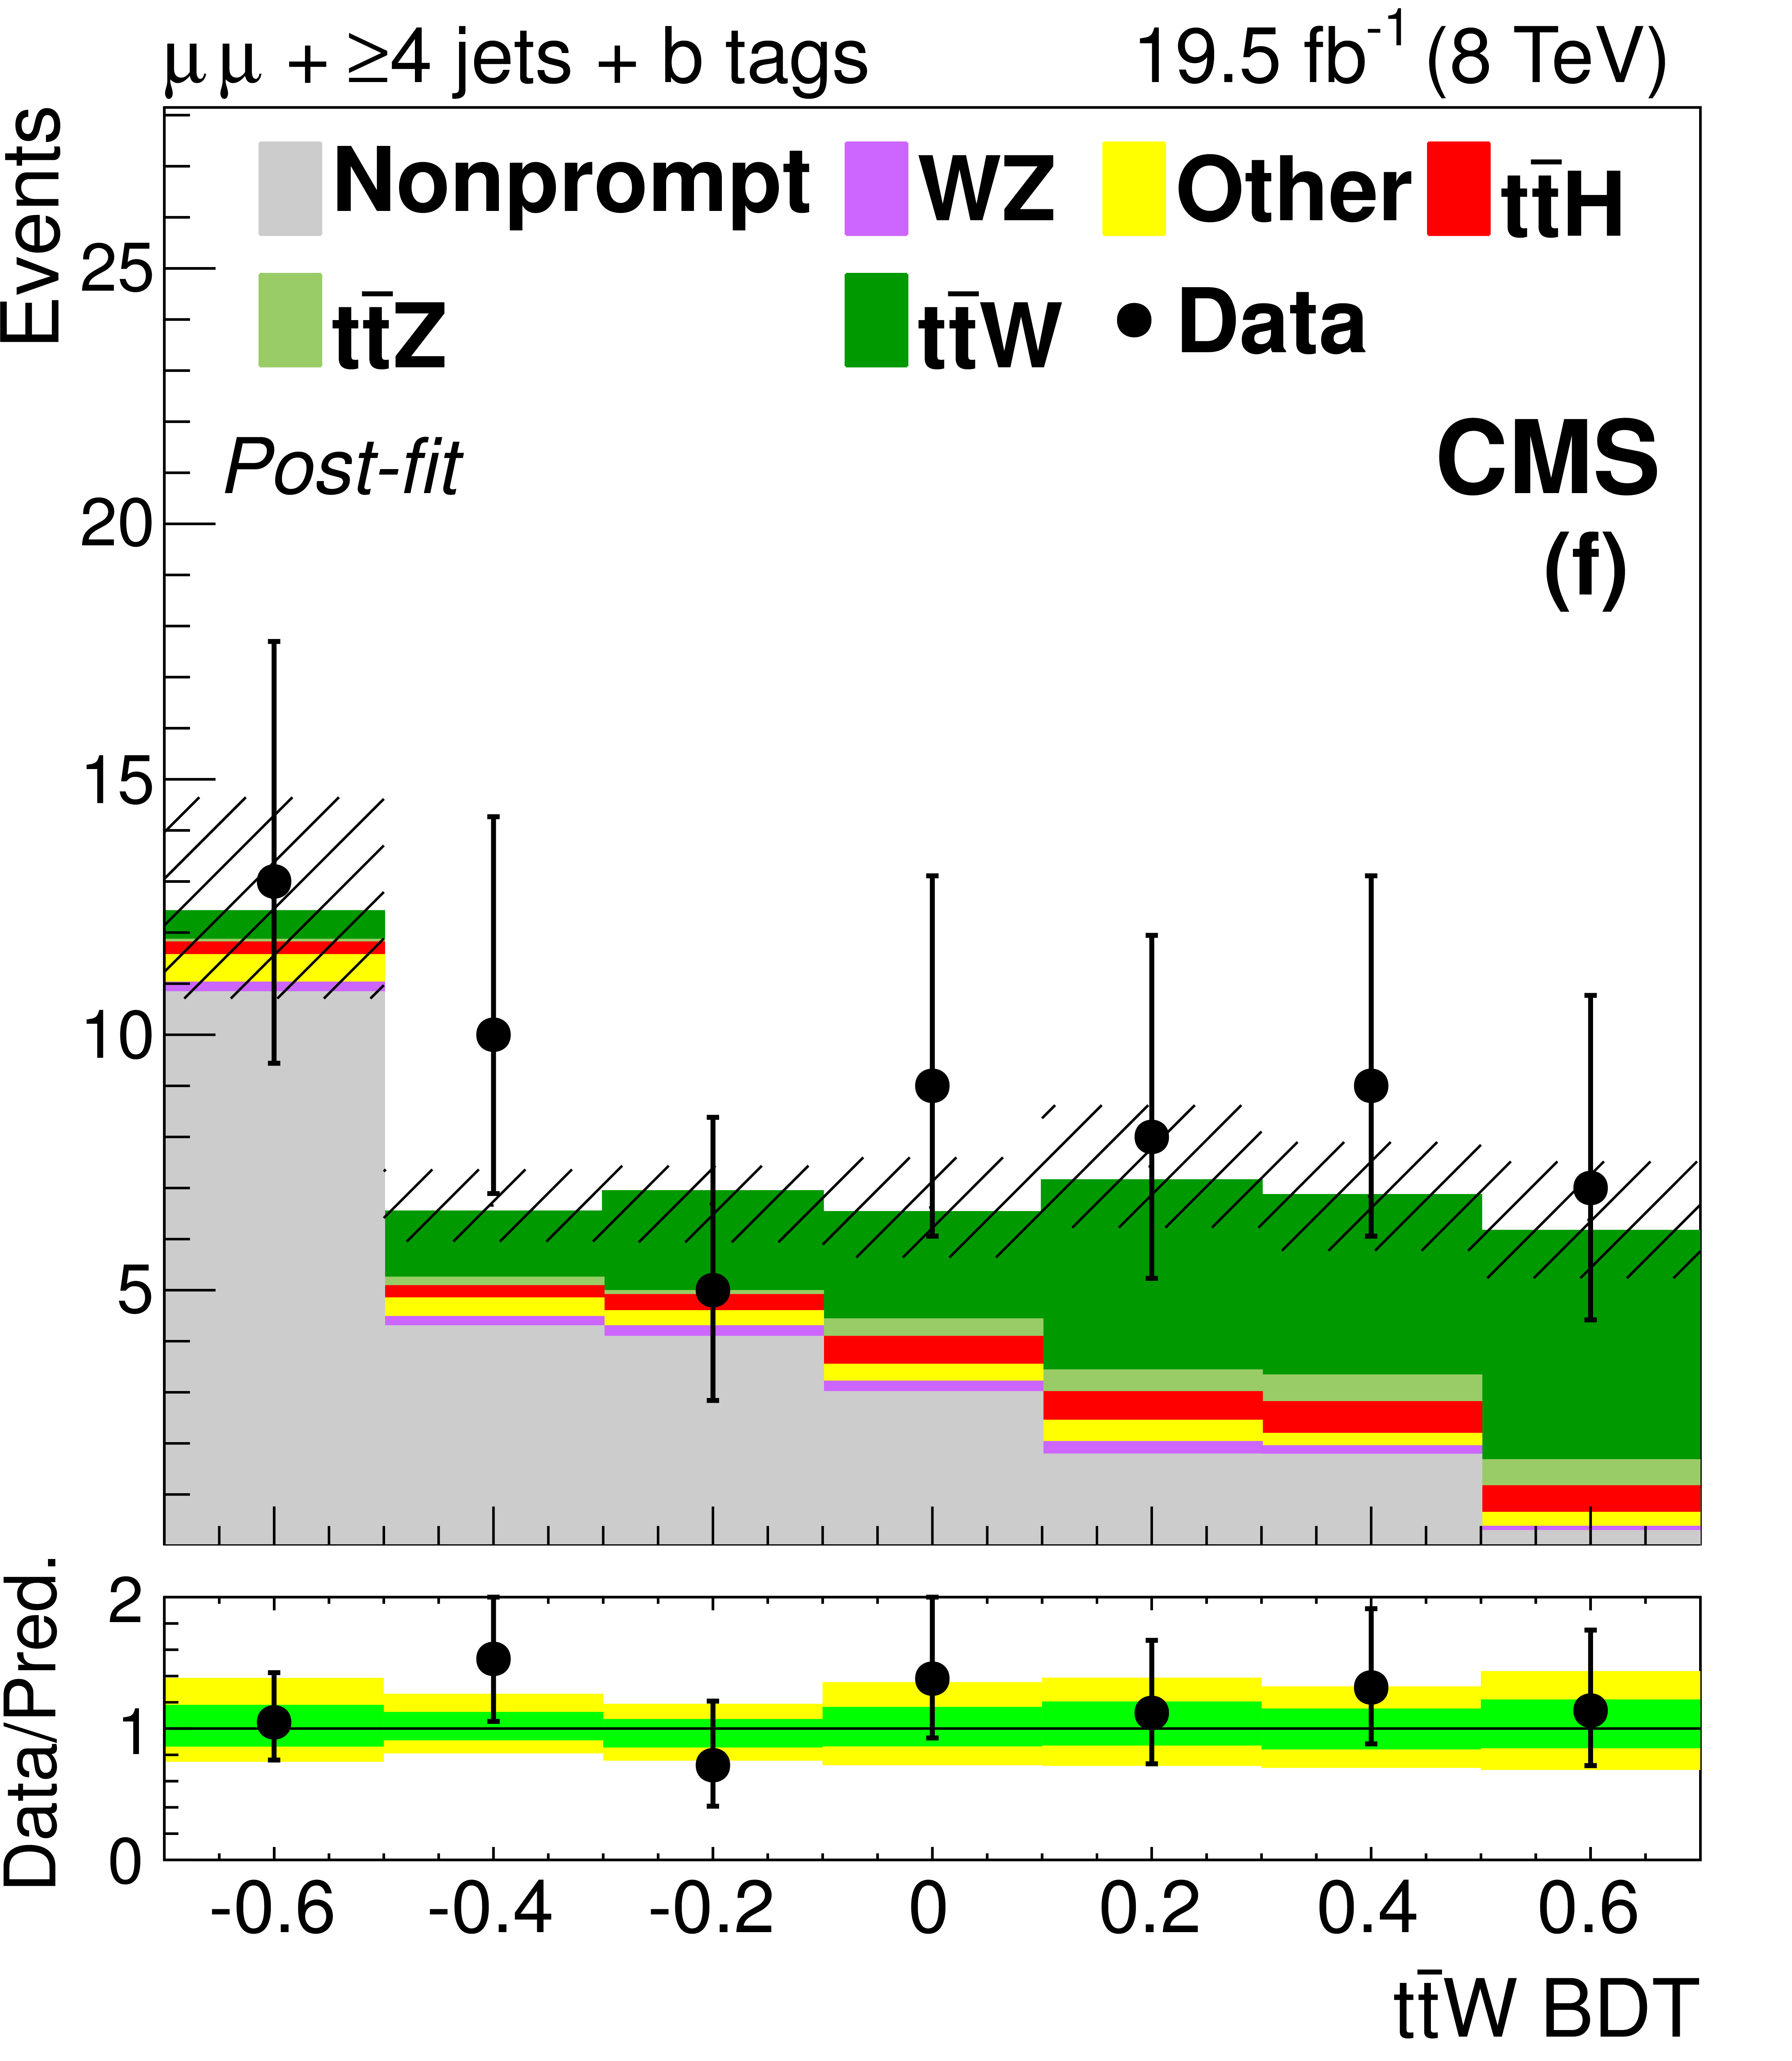
Figure 4-f:
The final discriminant for SS $ \mathrm{ t \bar{t} W }$ channel events with 3 jets (top) and ${\geq }4$ jets (bottom), after the final fit described in Section 10. The lepton flavors are $ \mathrm{ ee } $ (a, d), $ \mathrm{ e \mu } $ (b, e), and $\mu \mu $ (c, f). The 68% CL uncertainty in the fitted signal plus background is represented by hash marks in the stack histogram, and a green shaded region in the data-to-prediction ratio plot. The 95% CL band from the fit is shown in yellow. ``Ch. misID'' indicates the charge-misidentified background. ``Other'' backgrounds include $ \mathrm{ t \bar{t} \gamma }$, $ \mathrm{ t \bar{t} \gamma^{*} } $ , $ \mathrm{ t \bar{t} W W } $ , $ \mathrm{ t b Z } $ , WWW, WWZ, and $ \mathrm{ W^{\pm } W^{\pm } } $. |
png pdf |
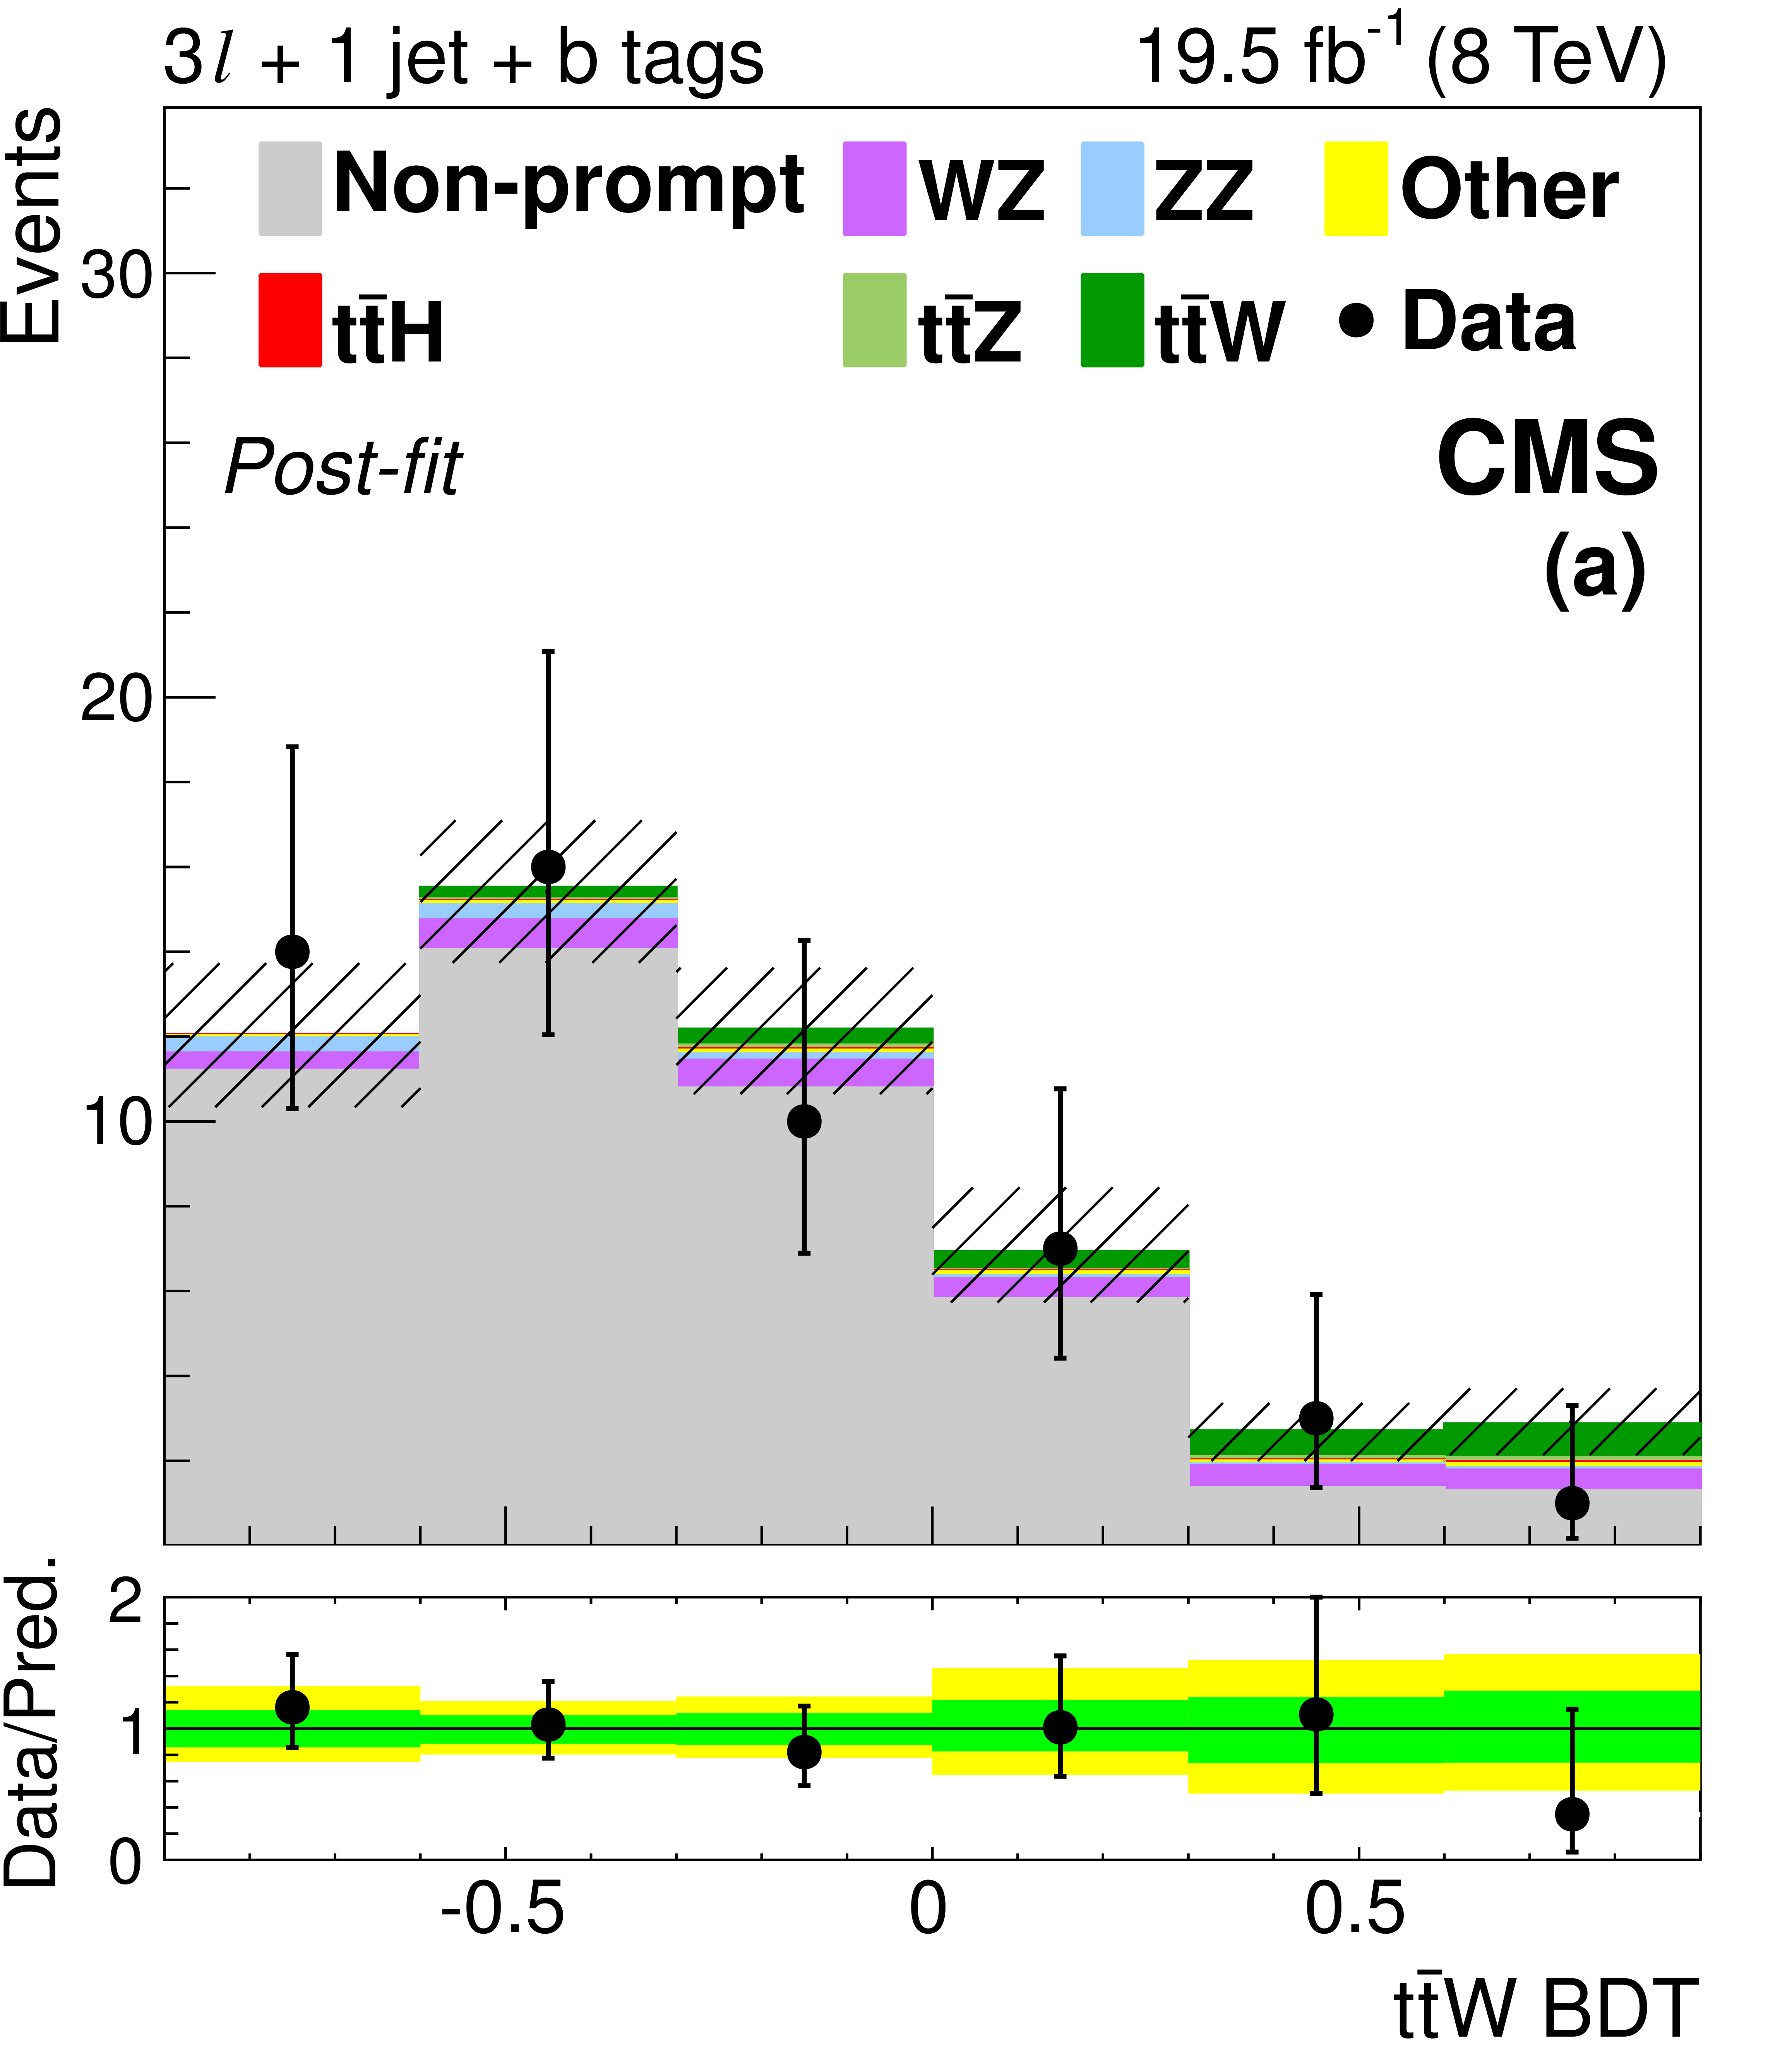
Figure 5-a:
The final discriminant for 3$\ell $ $ \mathrm{ t \bar{t} W }$ channel events with 1 jet (a) and ${\geq }2$ jets (b) after the final fit described in Section 10. The 68% CL uncertainty in the fitted signal plus background is represented by hash marks in the stack histogram, and a green shaded region in the data-to-prediction ratio plot. The 95% CL band from the fit is shown in yellow. ``Other'' backgrounds include $ \mathrm{ t \bar{t} \gamma }$, $ \mathrm{ t \bar{t} \gamma^{*} } $ , $ \mathrm{ t \bar{t} W W } $ , $ \mathrm{ b t Z }$, WWW, and WWZ. |
png pdf |
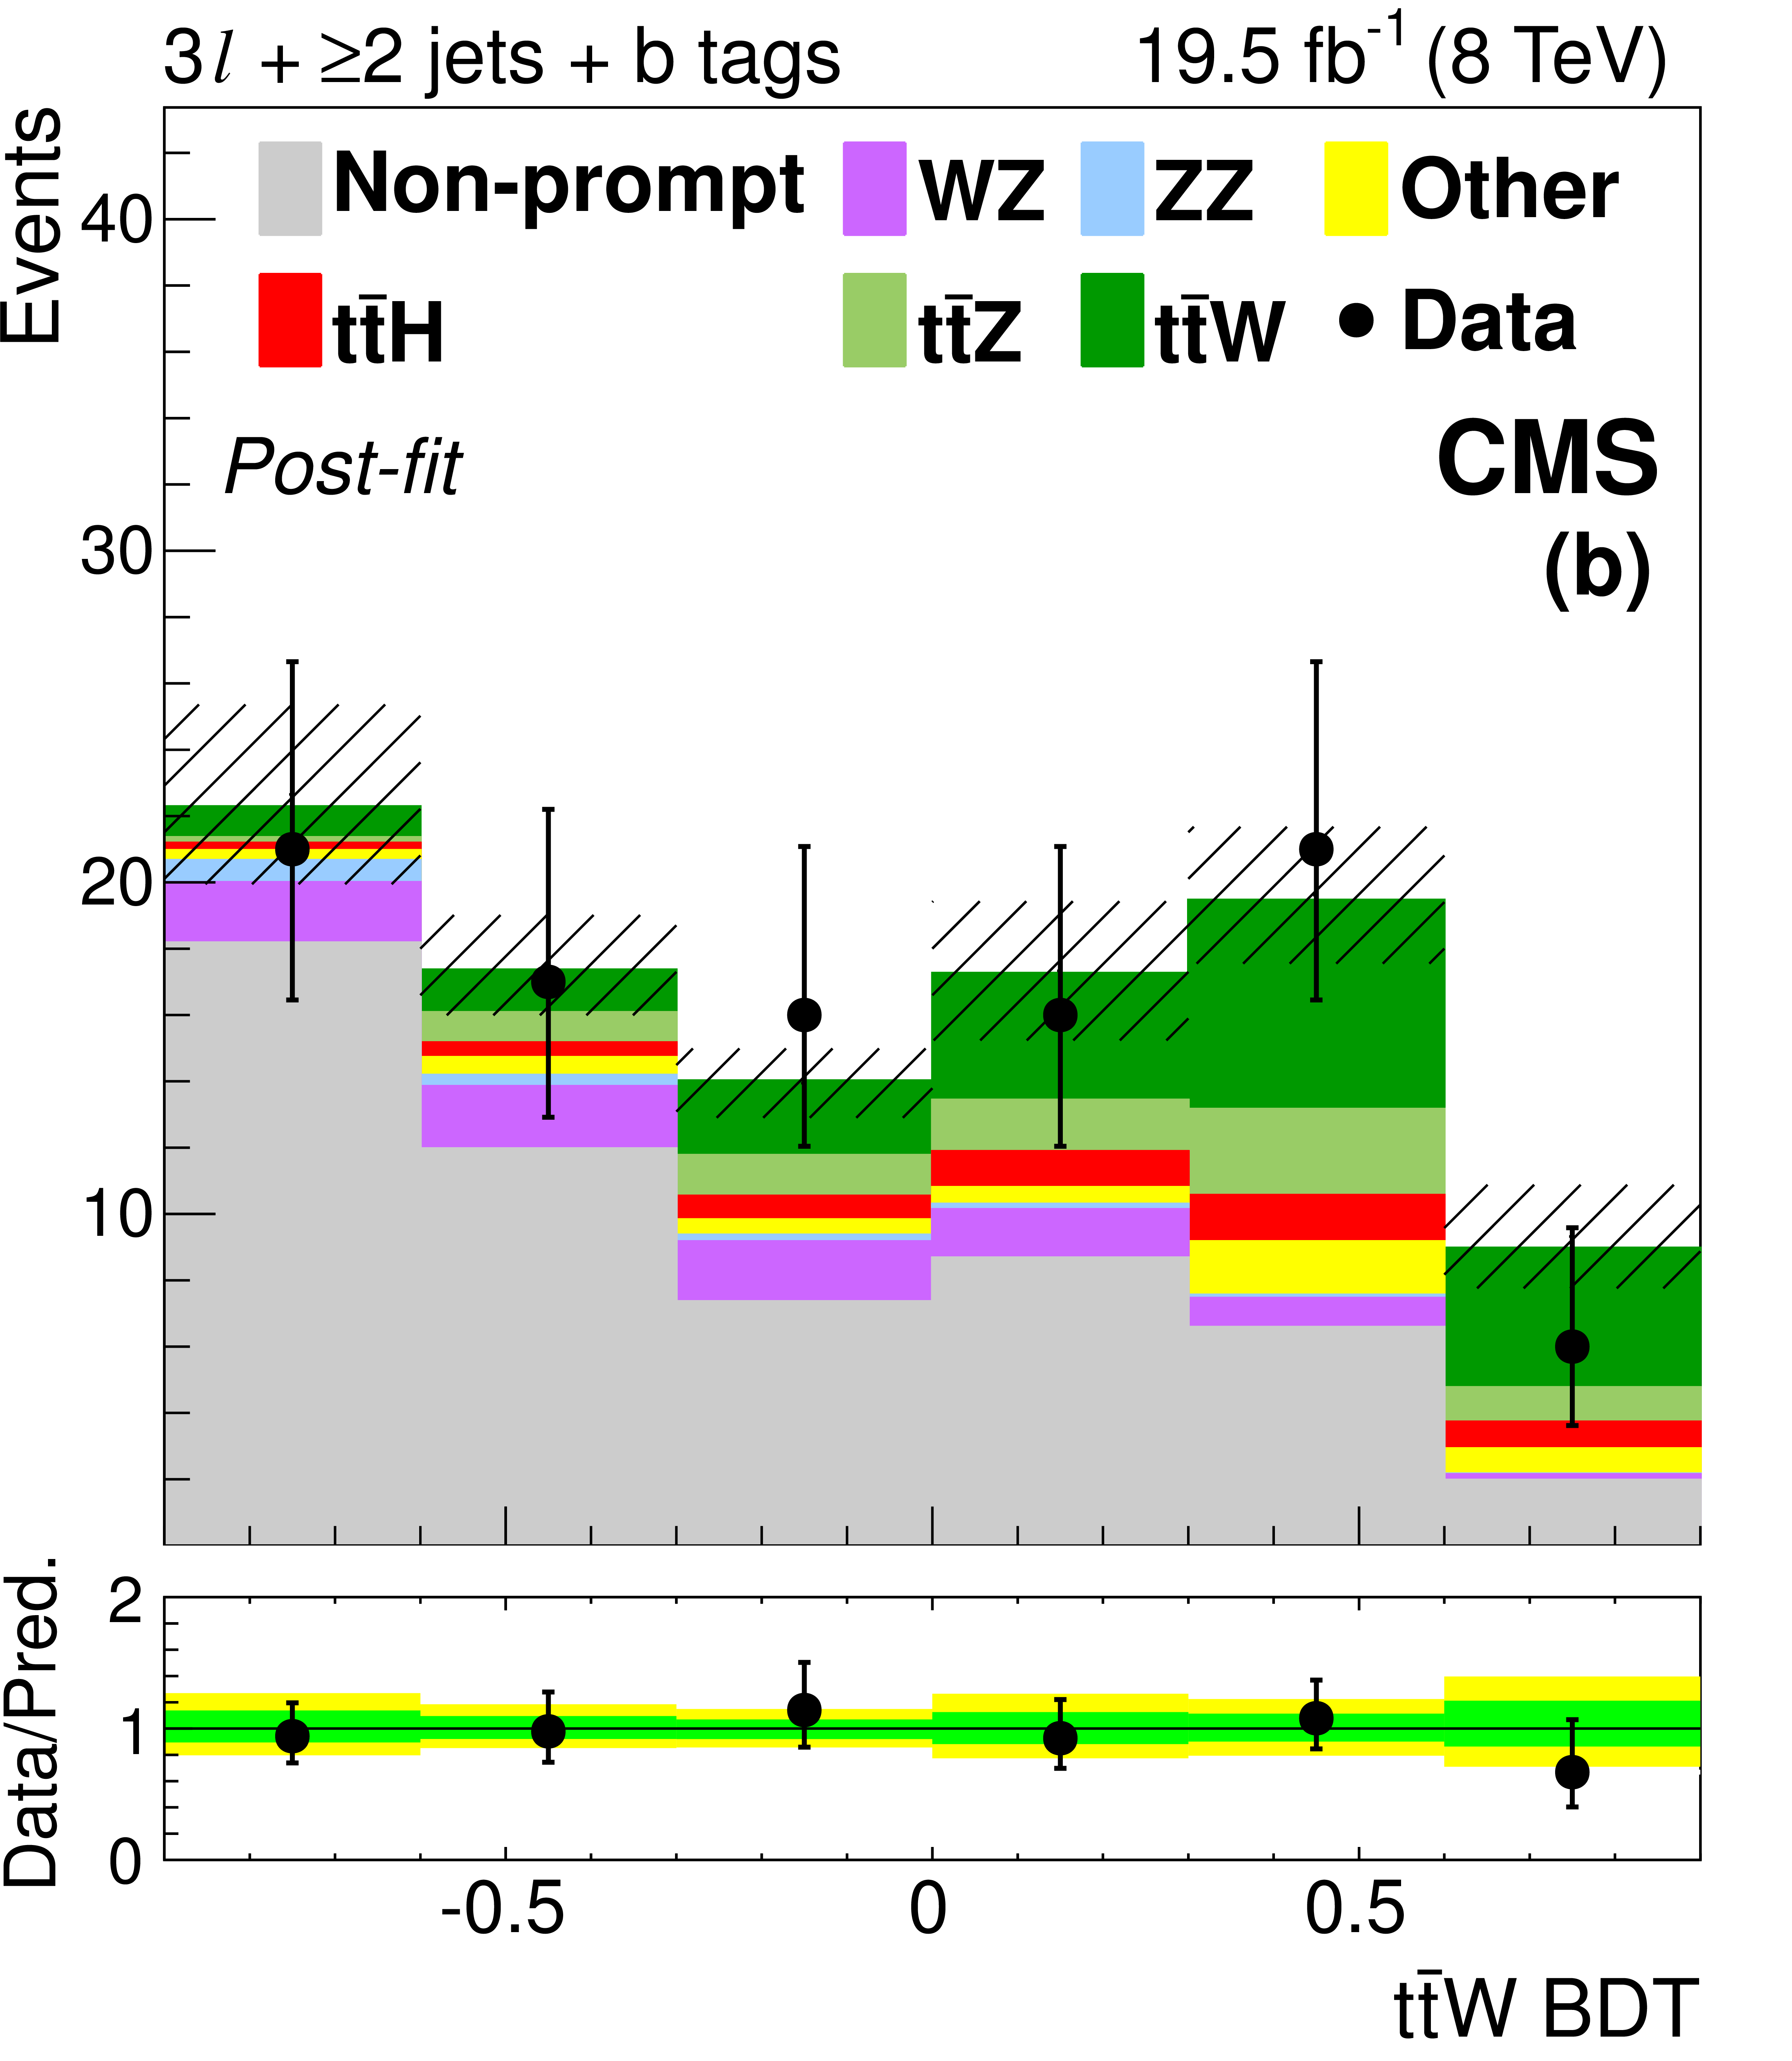
Figure 5-b:
The final discriminant for 3$\ell $ $ \mathrm{ t \bar{t} W }$ channel events with 1 jet (a) and ${\geq }2$ jets (b) after the final fit described in Section 10. The 68% CL uncertainty in the fitted signal plus background is represented by hash marks in the stack histogram, and a green shaded region in the data-to-prediction ratio plot. The 95% CL band from the fit is shown in yellow. ``Other'' backgrounds include $ \mathrm{ t \bar{t} \gamma }$, $ \mathrm{ t \bar{t} \gamma^{*} } $ , $ \mathrm{ t \bar{t} W W } $ , $ \mathrm{ b t Z }$, WWW, and WWZ. |
png pdf |
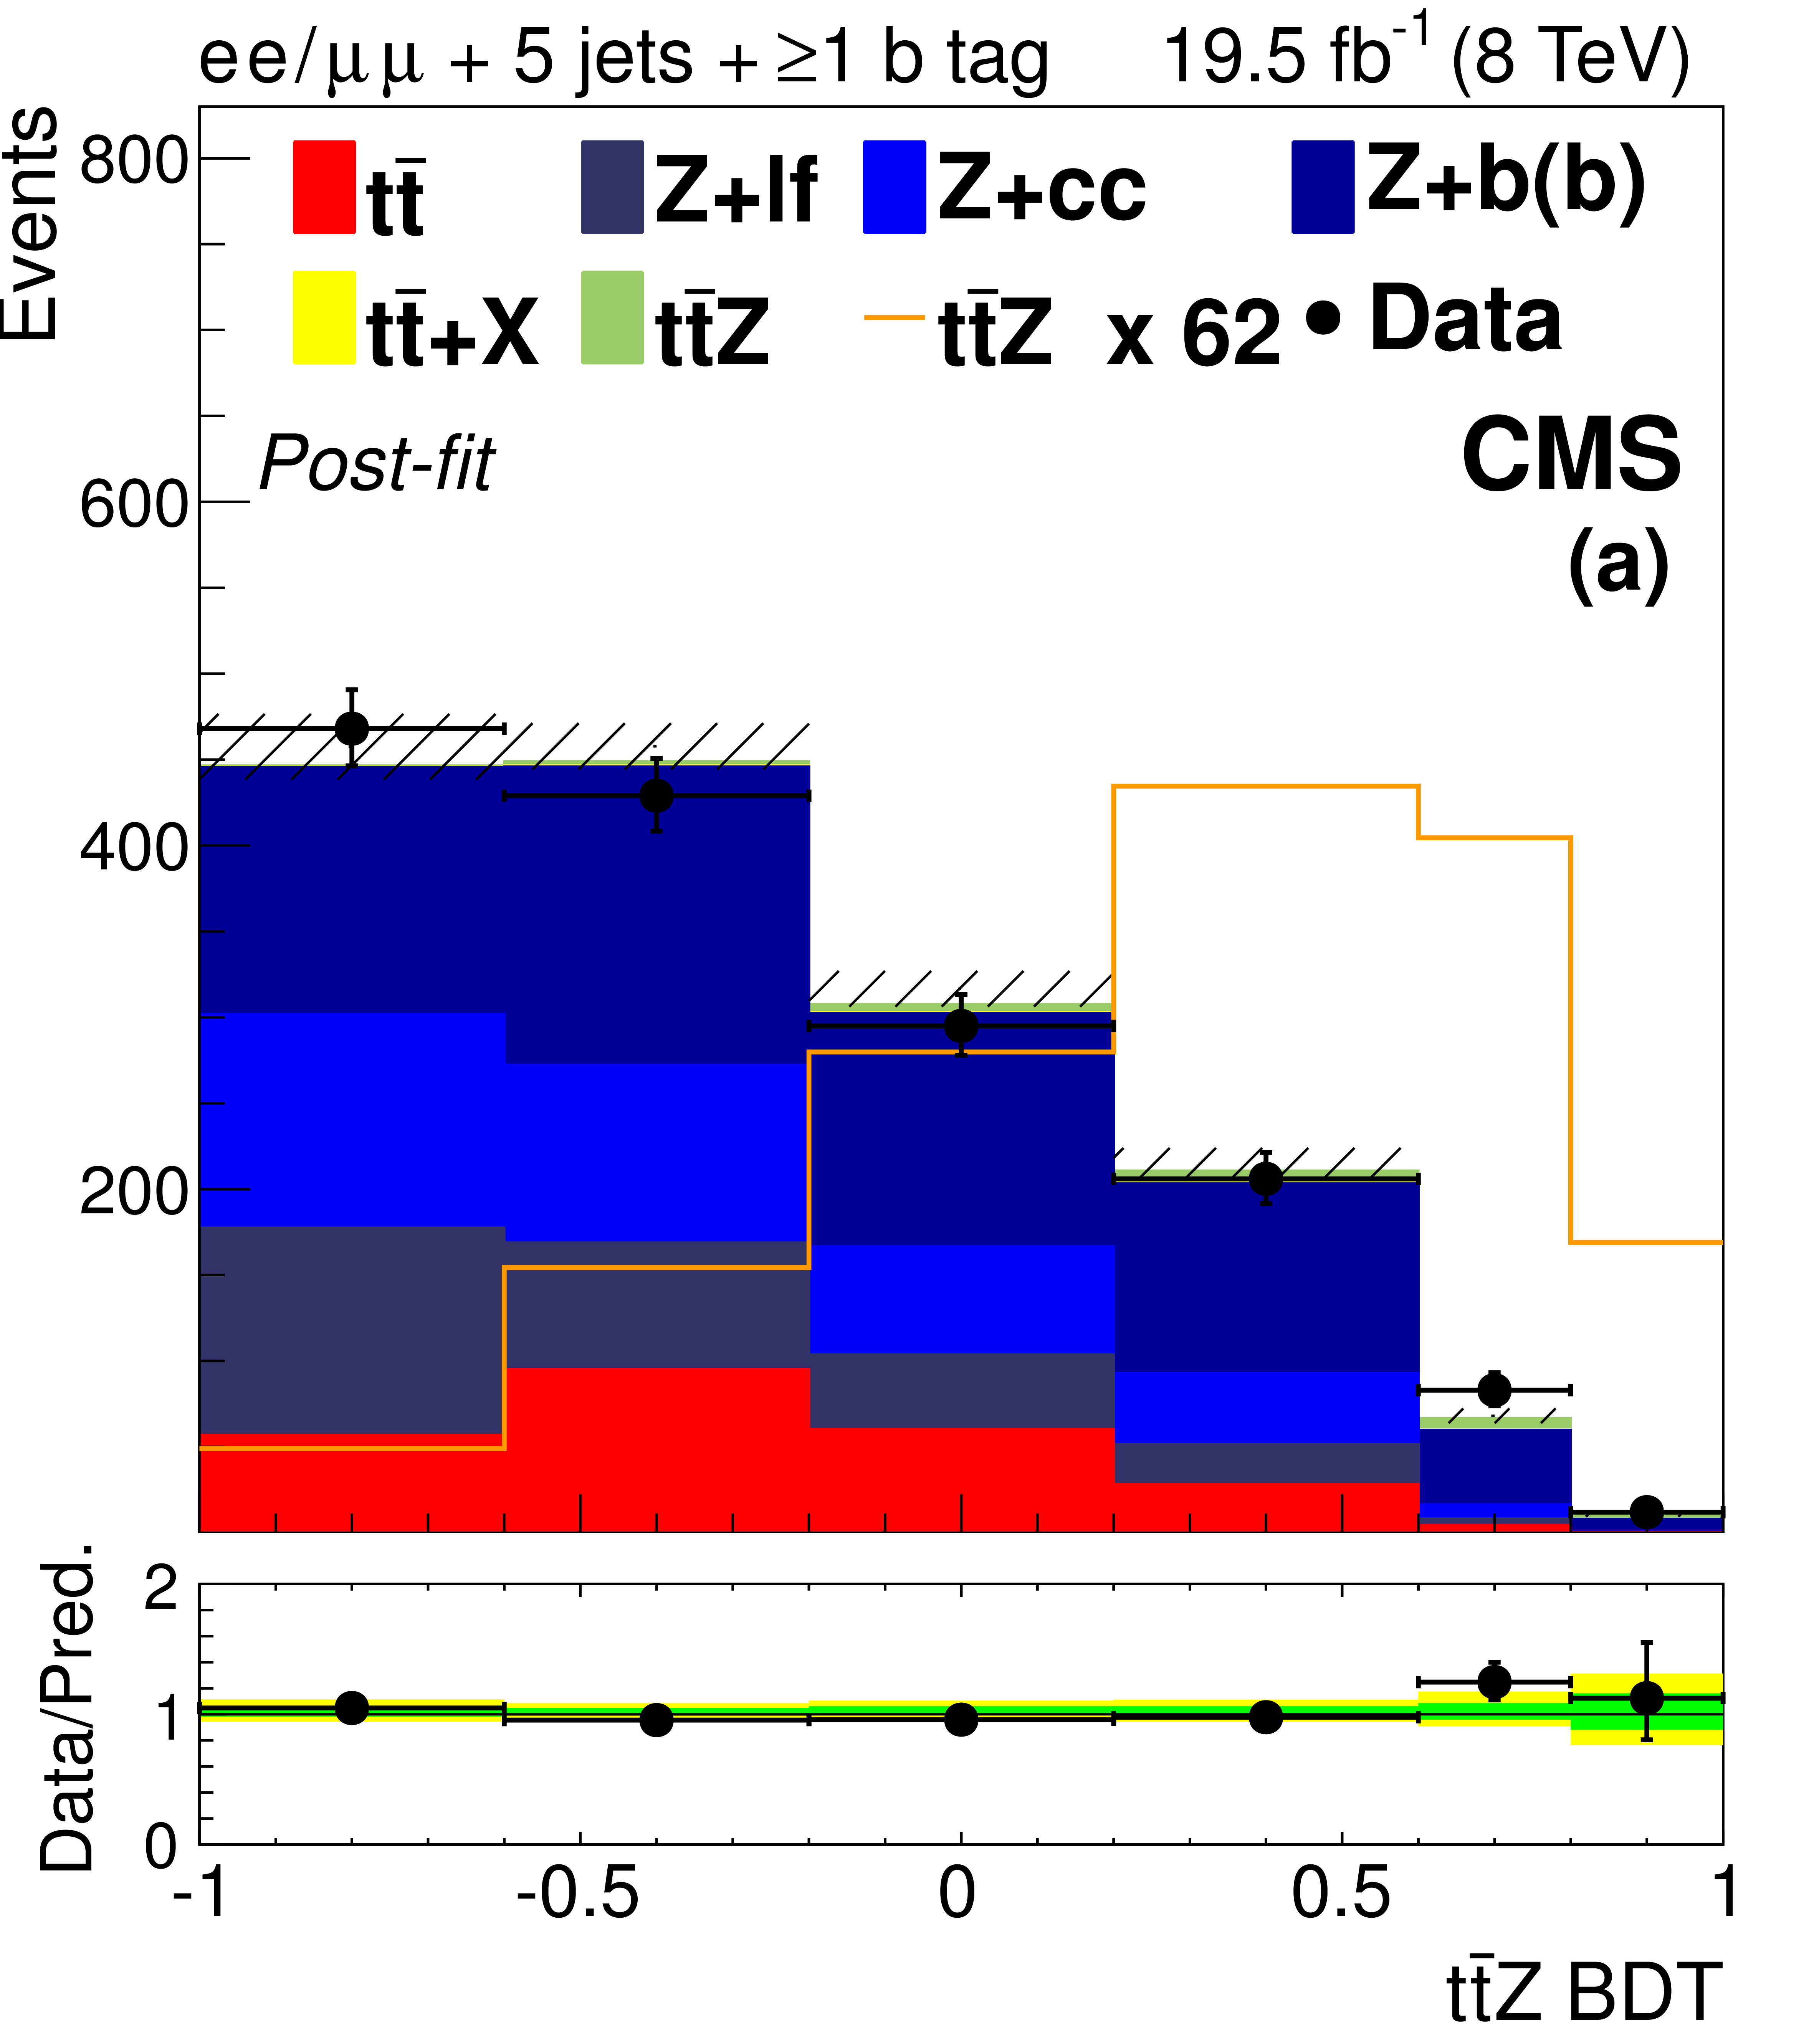
Figure 6-a:
The final discriminant for $ \mathrm{ t \bar{t} Z } $ channel events with two OS leptons and 5 jets (a) or ${\geq }6$ jets (d), three leptons and 3 jets (b) or $\geq $4 jets (e), or four leptons and two lepton pairs (c) or exactly one lepton pair (f) consistent with a $\mathrm{ Z } \to \ell \ell $ decay, after the final fit described in Section 10. The 68% CL uncertainty in the fitted signal plus background is represented by hash marks in the stack histogram, and a green shaded region in the data-to-prediction ratio plot. The 95% CL band from the fit is shown in yellow. The orange line shows the shape of the $ \mathrm{ t \bar{t} Z } $ signal, suitably normalized. The $ \mathrm{ t \bar{t} } $ +X background includes $ \mathrm{ t \bar{t} W }$, $\mathrm{ t \bar{t} H } $, and $ \mathrm{ t \bar{t} W W } $ ; ``Other'' backgrounds include $ \mathrm{ t \bar{t} \gamma }$, $ \mathrm{ t \bar{t} \gamma^{*} } $ , $ \mathrm{ t \bar{t} W W } $ , $ \mathrm{ t b Z } $ , WWW, and WWZ. |
png pdf |
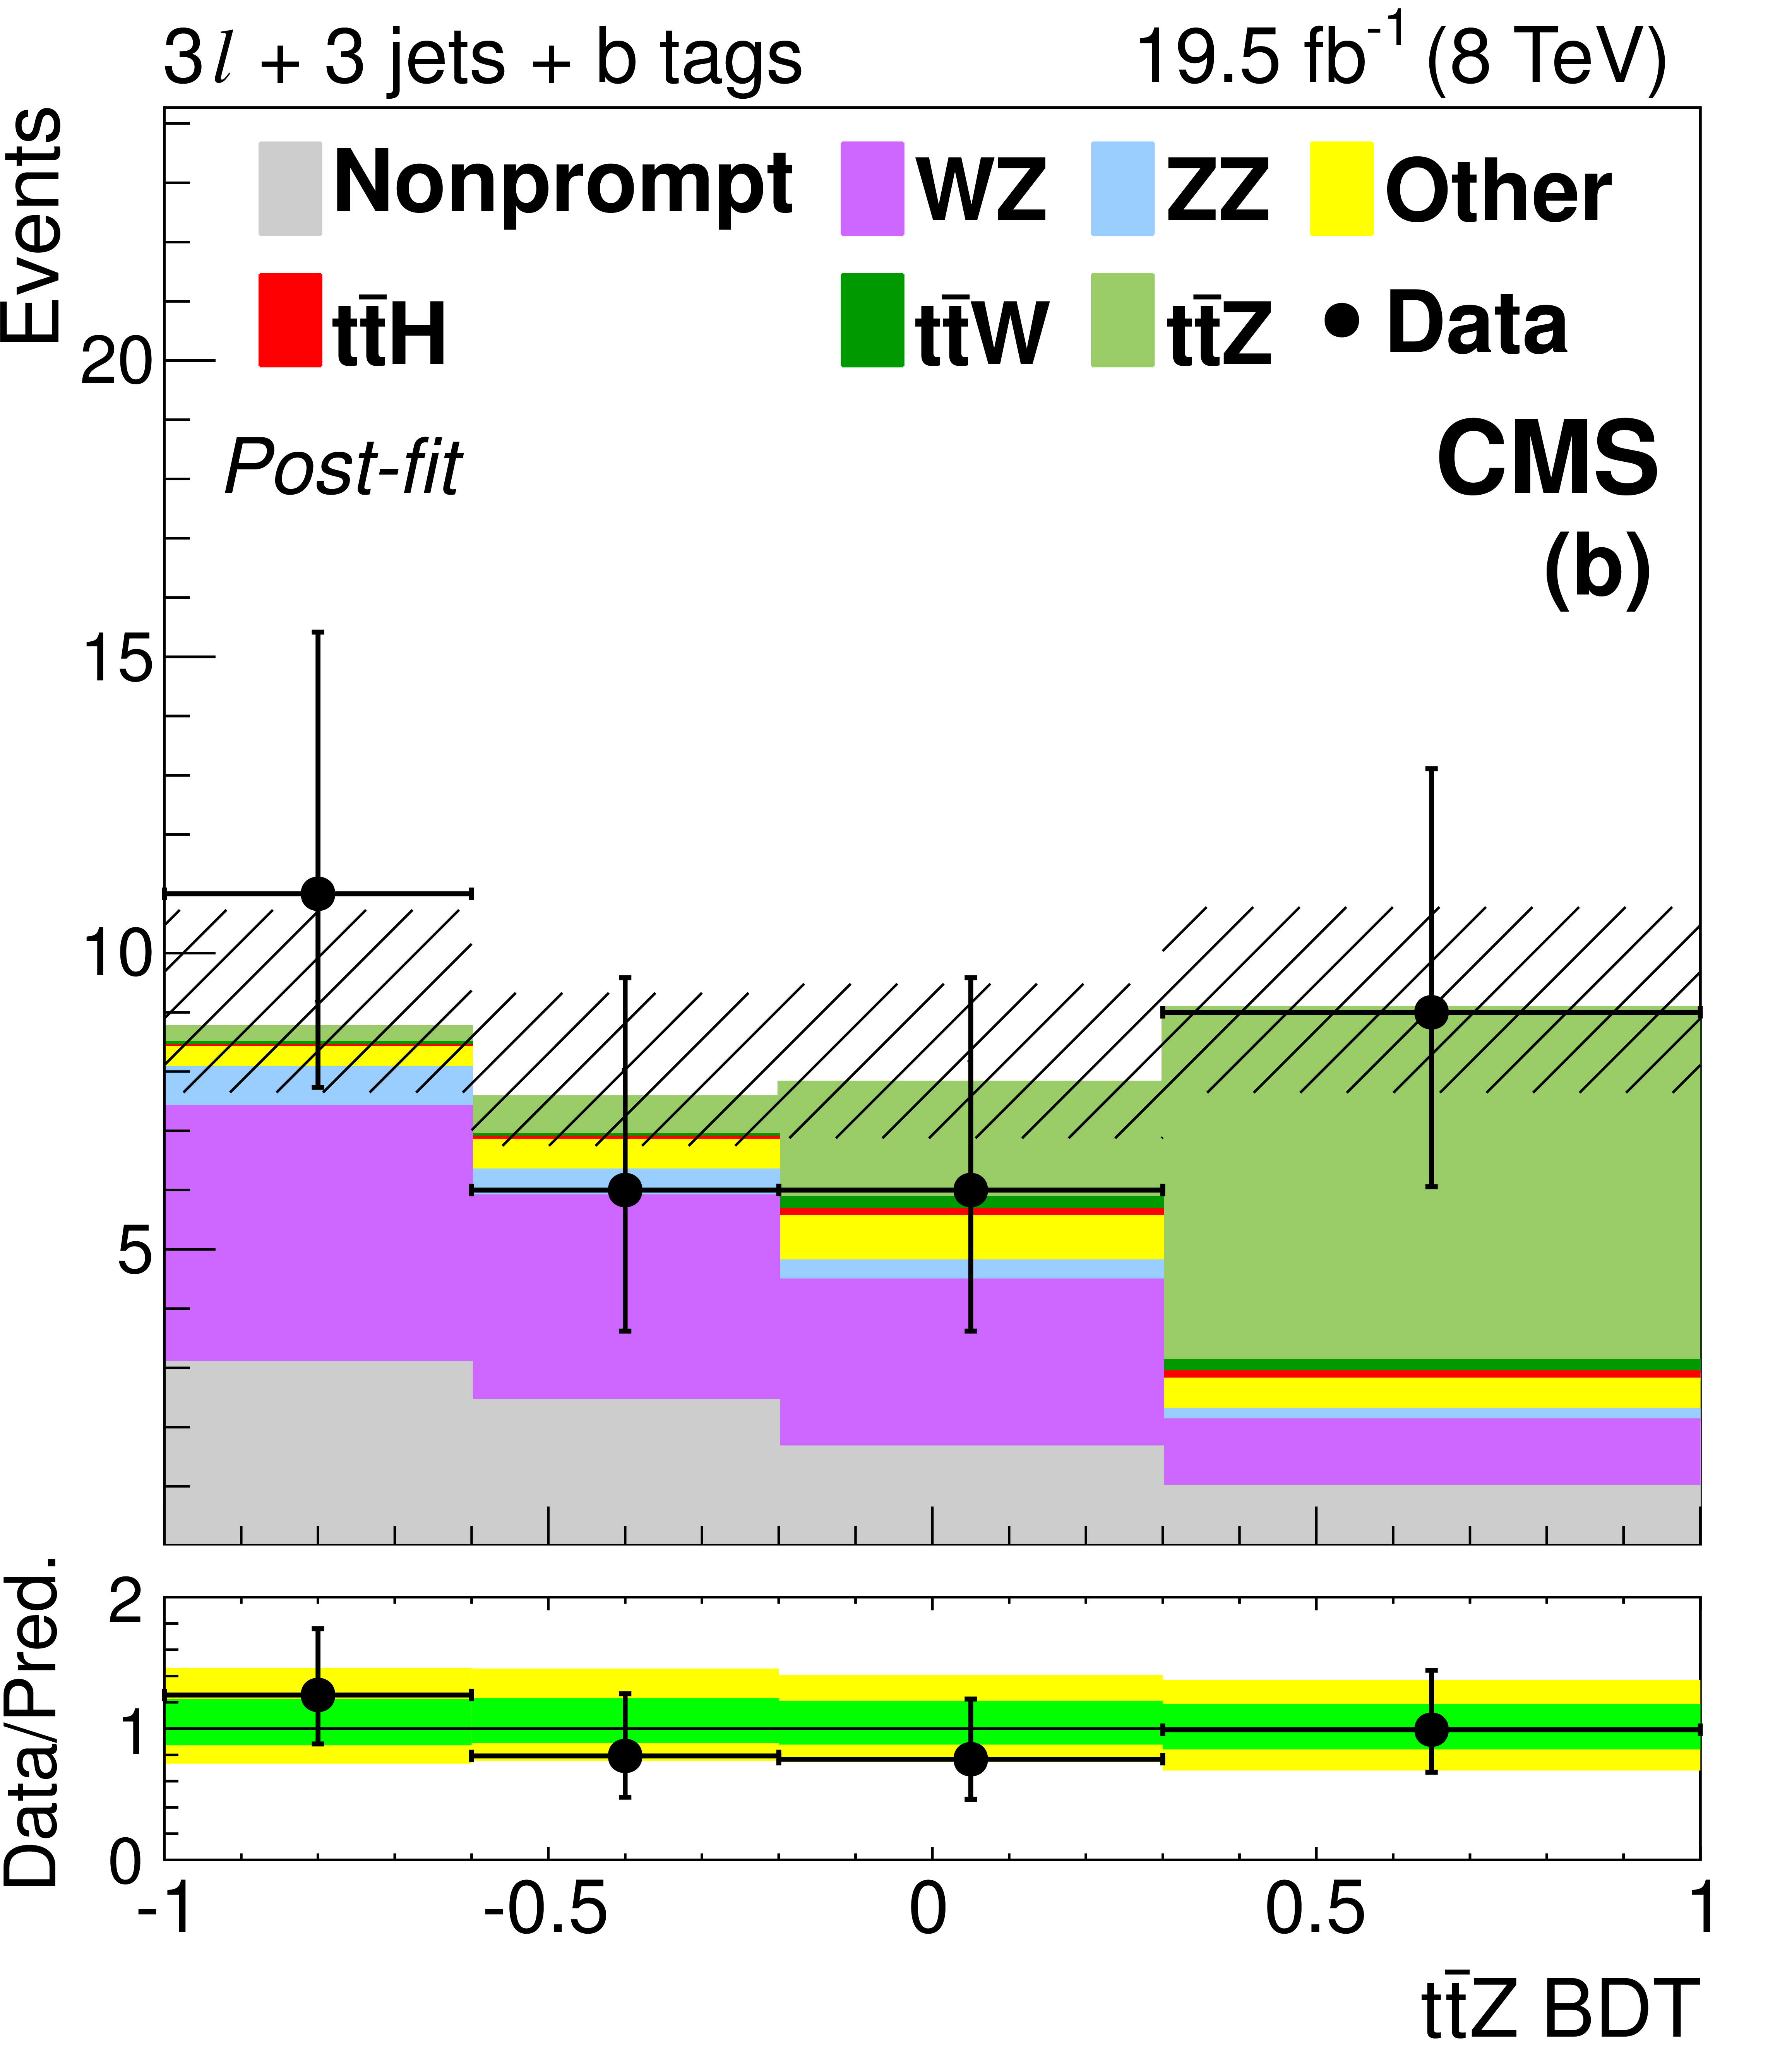
Figure 6-b:
The final discriminant for $ \mathrm{ t \bar{t} Z } $ channel events with two OS leptons and 5 jets (a) or ${\geq }6$ jets (d), three leptons and 3 jets (b) or $\geq $4 jets (e), or four leptons and two lepton pairs (c) or exactly one lepton pair (f) consistent with a $\mathrm{ Z } \to \ell \ell $ decay, after the final fit described in Section 10. The 68% CL uncertainty in the fitted signal plus background is represented by hash marks in the stack histogram, and a green shaded region in the data-to-prediction ratio plot. The 95% CL band from the fit is shown in yellow. The orange line shows the shape of the $ \mathrm{ t \bar{t} Z } $ signal, suitably normalized. The $ \mathrm{ t \bar{t} } $ +X background includes $ \mathrm{ t \bar{t} W }$, $\mathrm{ t \bar{t} H } $, and $ \mathrm{ t \bar{t} W W } $ ; ``Other'' backgrounds include $ \mathrm{ t \bar{t} \gamma }$, $ \mathrm{ t \bar{t} \gamma^{*} } $ , $ \mathrm{ t \bar{t} W W } $ , $ \mathrm{ t b Z } $ , WWW, and WWZ. |
png pdf |
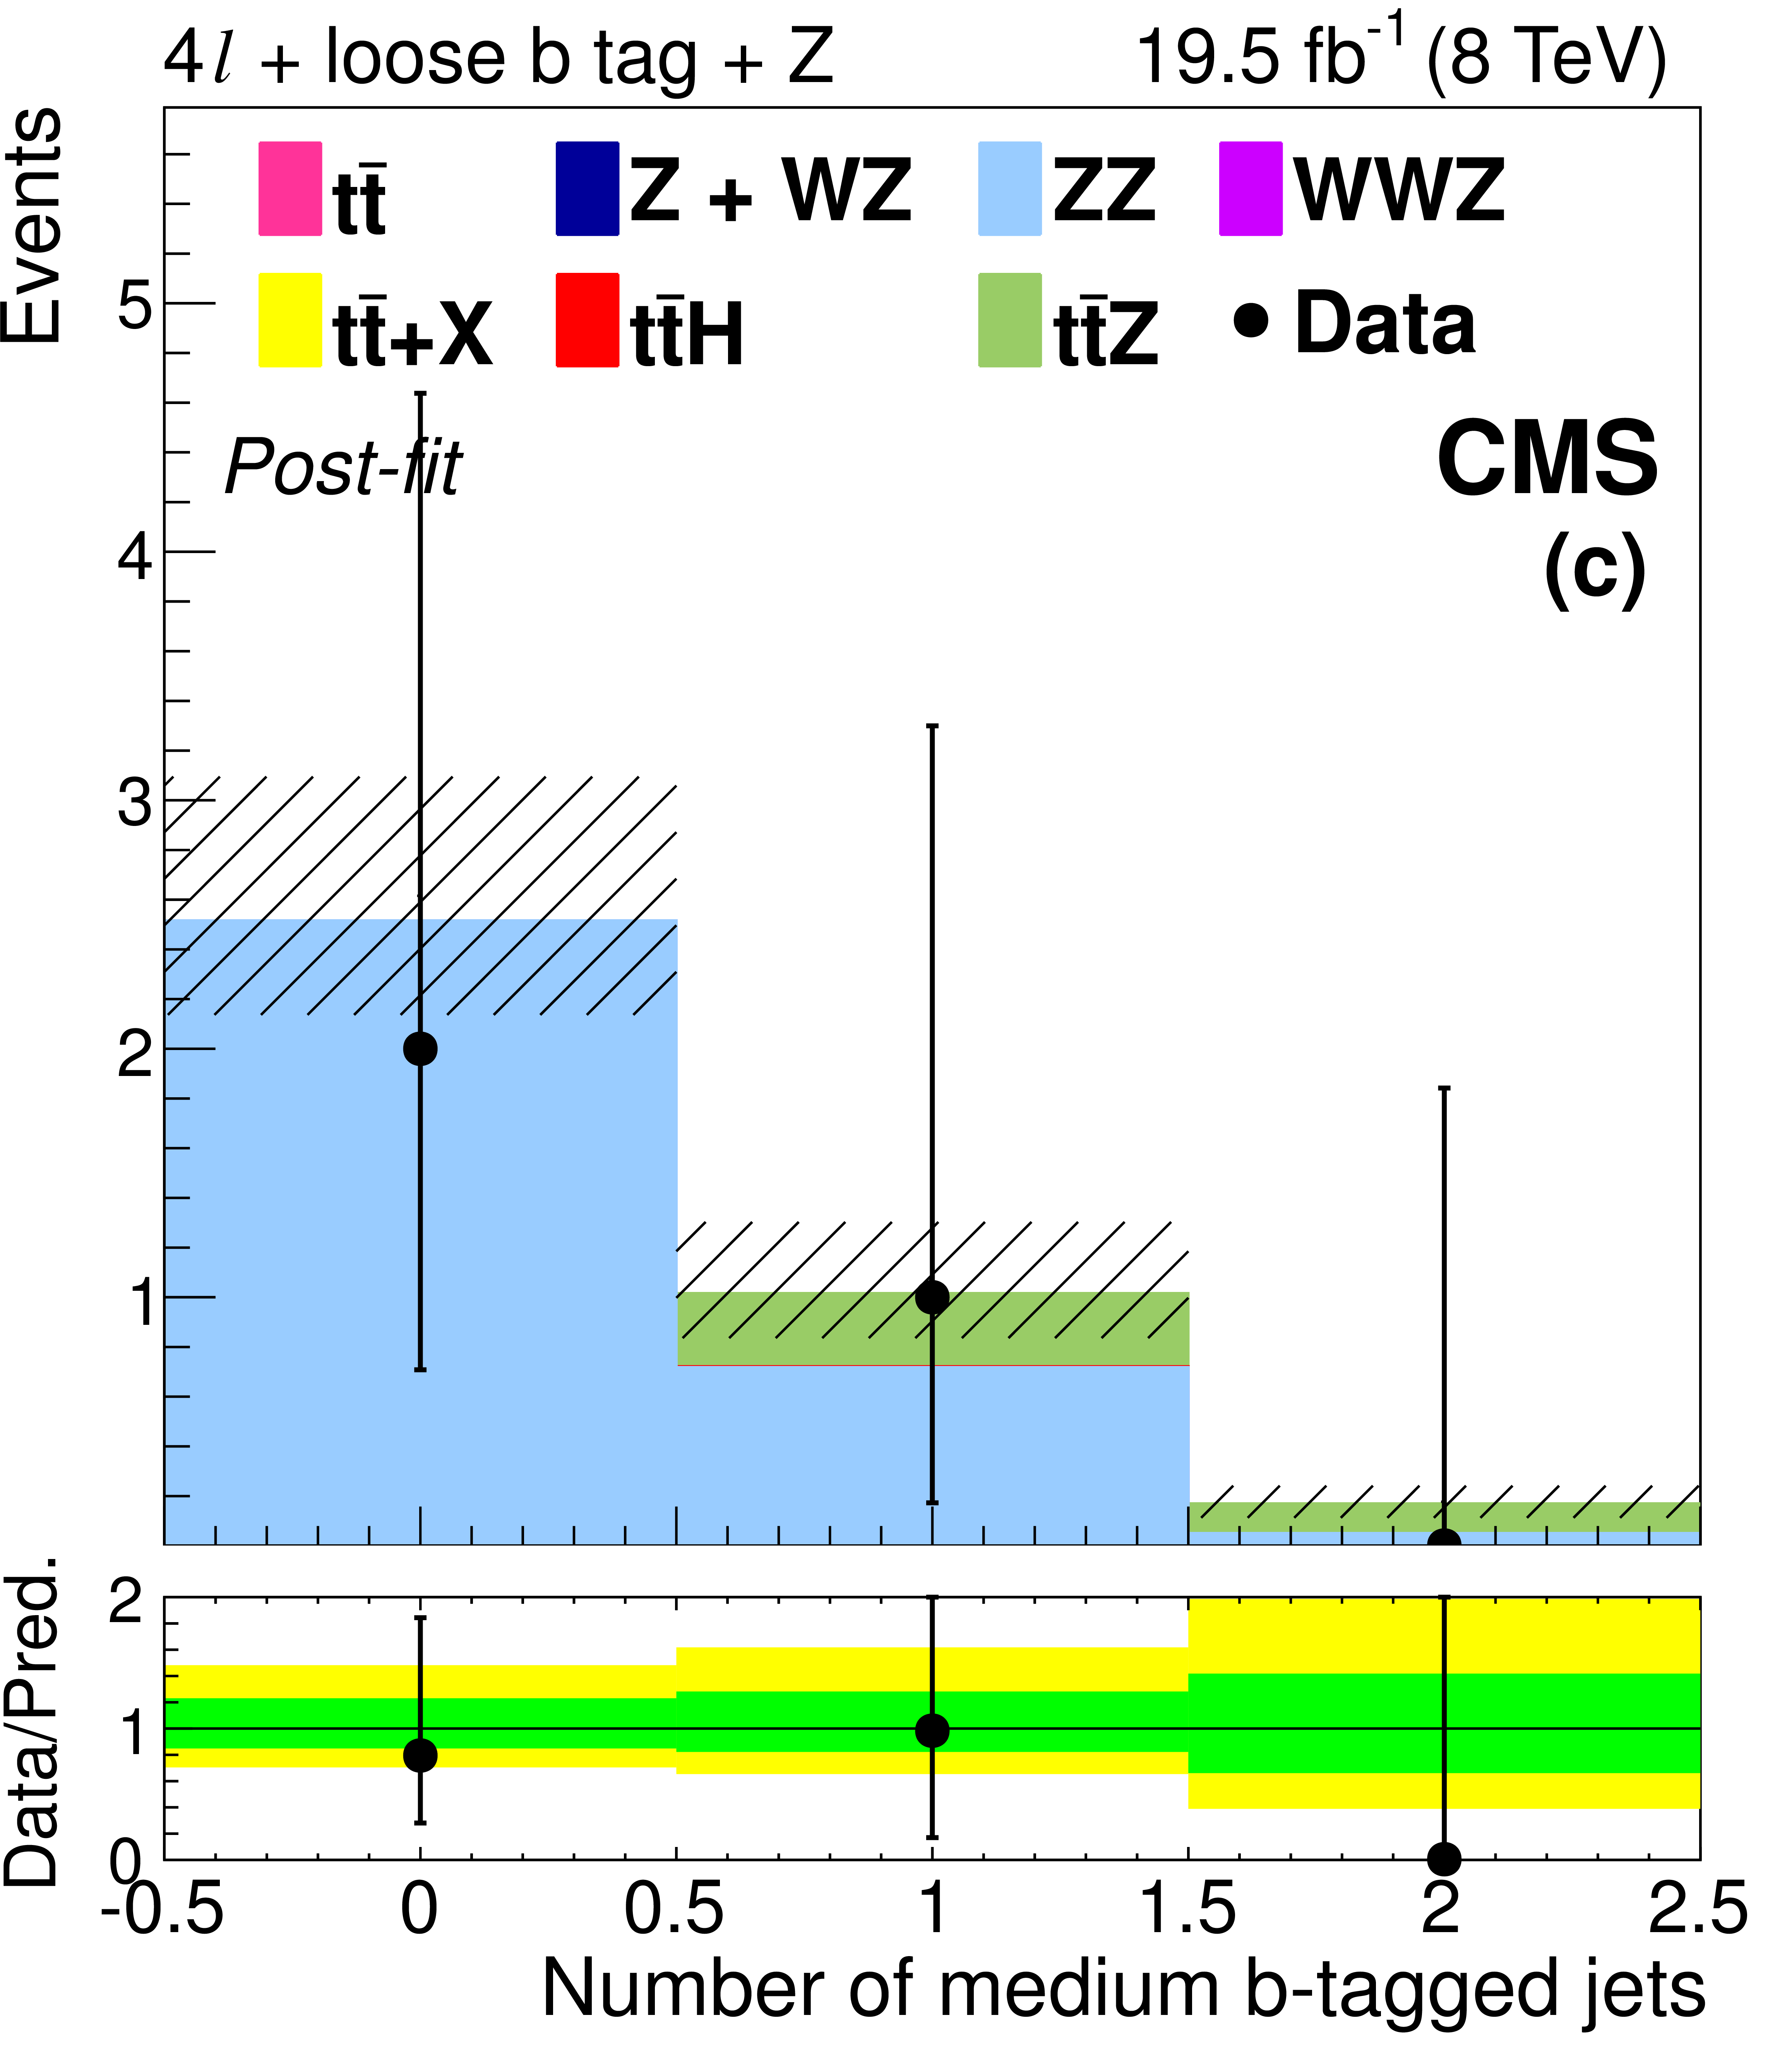
Figure 6-c:
The final discriminant for $ \mathrm{ t \bar{t} Z } $ channel events with two OS leptons and 5 jets (a) or ${\geq }6$ jets (d), three leptons and 3 jets (b) or $\geq $4 jets (e), or four leptons and two lepton pairs (c) or exactly one lepton pair (f) consistent with a $\mathrm{ Z } \to \ell \ell $ decay, after the final fit described in Section 10. The 68% CL uncertainty in the fitted signal plus background is represented by hash marks in the stack histogram, and a green shaded region in the data-to-prediction ratio plot. The 95% CL band from the fit is shown in yellow. The orange line shows the shape of the $ \mathrm{ t \bar{t} Z } $ signal, suitably normalized. The $ \mathrm{ t \bar{t} } $ +X background includes $ \mathrm{ t \bar{t} W }$, $\mathrm{ t \bar{t} H } $, and $ \mathrm{ t \bar{t} W W } $ ; ``Other'' backgrounds include $ \mathrm{ t \bar{t} \gamma }$, $ \mathrm{ t \bar{t} \gamma^{*} } $ , $ \mathrm{ t \bar{t} W W } $ , $ \mathrm{ t b Z } $ , WWW, and WWZ. |
png pdf |
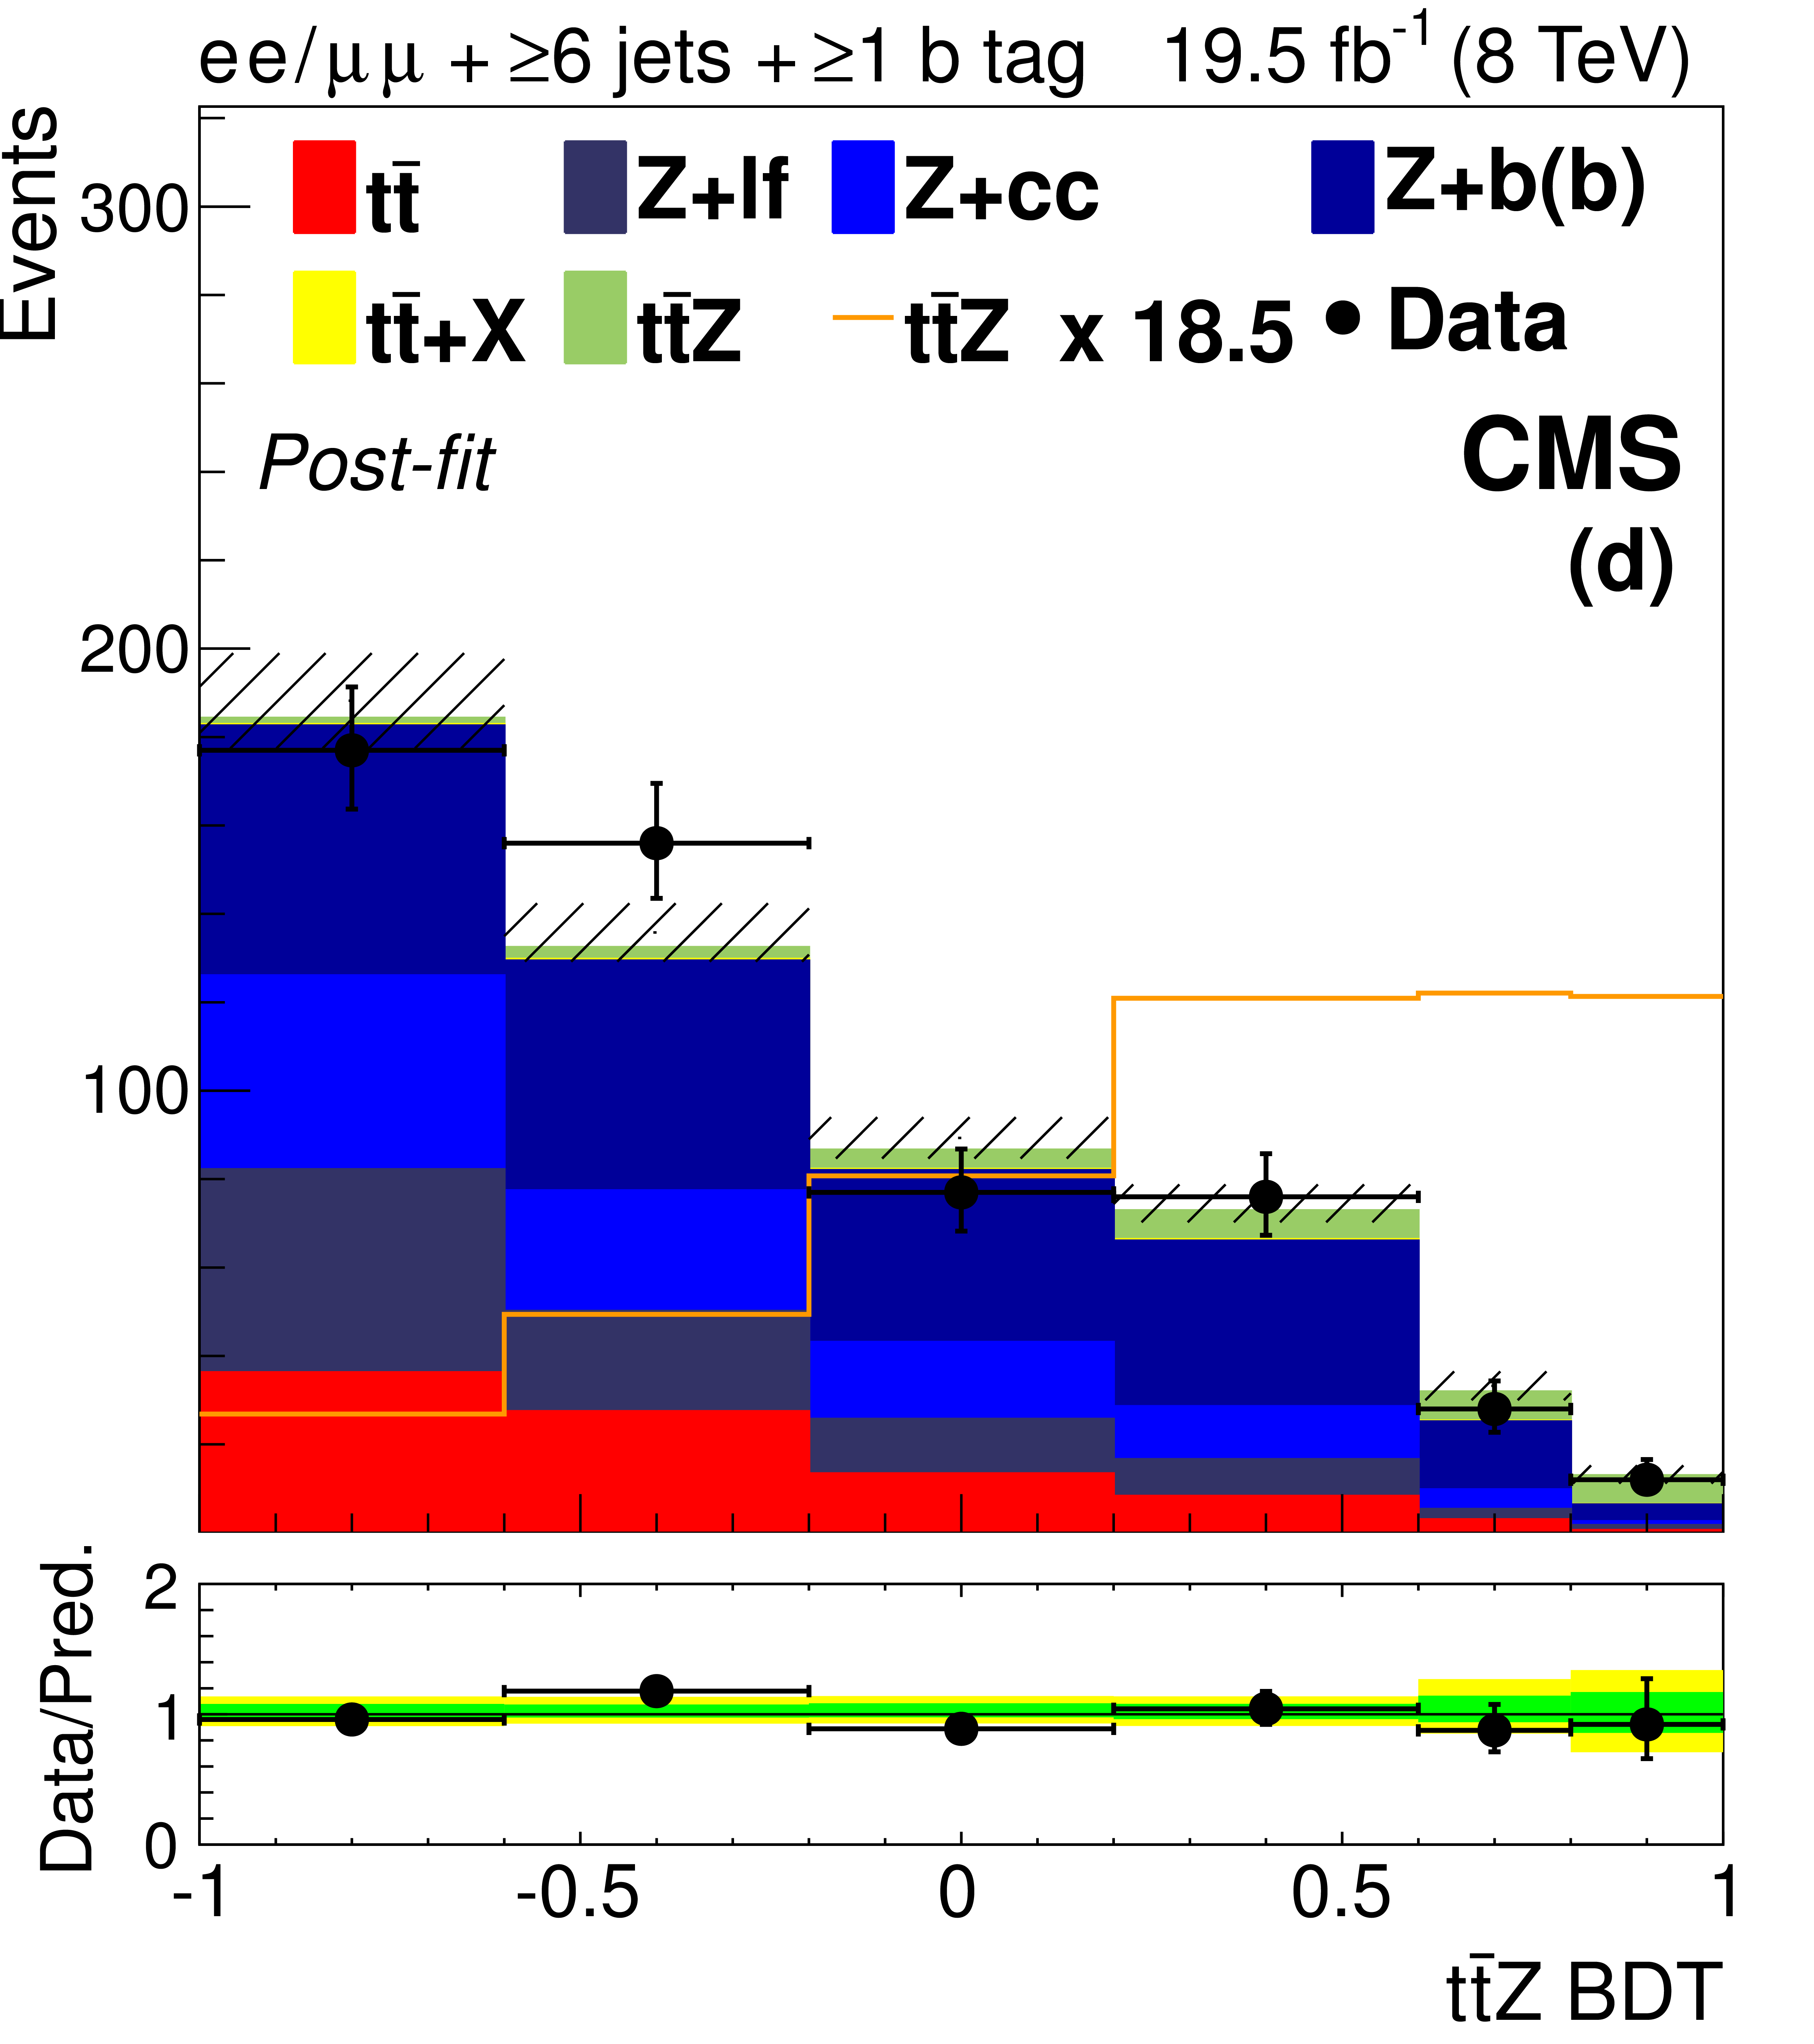
Figure 6-d:
The final discriminant for $ \mathrm{ t \bar{t} Z } $ channel events with two OS leptons and 5 jets (a) or ${\geq }6$ jets (d), three leptons and 3 jets (b) or $\geq $4 jets (e), or four leptons and two lepton pairs (c) or exactly one lepton pair (f) consistent with a $\mathrm{ Z } \to \ell \ell $ decay, after the final fit described in Section 10. The 68% CL uncertainty in the fitted signal plus background is represented by hash marks in the stack histogram, and a green shaded region in the data-to-prediction ratio plot. The 95% CL band from the fit is shown in yellow. The orange line shows the shape of the $ \mathrm{ t \bar{t} Z } $ signal, suitably normalized. The $ \mathrm{ t \bar{t} } $ +X background includes $ \mathrm{ t \bar{t} W }$, $\mathrm{ t \bar{t} H } $, and $ \mathrm{ t \bar{t} W W } $ ; ``Other'' backgrounds include $ \mathrm{ t \bar{t} \gamma }$, $ \mathrm{ t \bar{t} \gamma^{*} } $ , $ \mathrm{ t \bar{t} W W } $ , $ \mathrm{ t b Z } $ , WWW, and WWZ. |
png pdf |
Figure 6-e:
The final discriminant for $ \mathrm{ t \bar{t} Z } $ channel events with two OS leptons and 5 jets (a) or ${\geq }6$ jets (d), three leptons and 3 jets (b) or $\geq $4 jets (e), or four leptons and two lepton pairs (c) or exactly one lepton pair (f) consistent with a $\mathrm{ Z } \to \ell \ell $ decay, after the final fit described in Section 10. The 68% CL uncertainty in the fitted signal plus background is represented by hash marks in the stack histogram, and a green shaded region in the data-to-prediction ratio plot. The 95% CL band from the fit is shown in yellow. The orange line shows the shape of the $ \mathrm{ t \bar{t} Z } $ signal, suitably normalized. The $ \mathrm{ t \bar{t} } $ +X background includes $ \mathrm{ t \bar{t} W }$, $\mathrm{ t \bar{t} H } $, and $ \mathrm{ t \bar{t} W W } $ ; ``Other'' backgrounds include $ \mathrm{ t \bar{t} \gamma }$, $ \mathrm{ t \bar{t} \gamma^{*} } $ , $ \mathrm{ t \bar{t} W W } $ , $ \mathrm{ t b Z } $ , WWW, and WWZ. |
png pdf |
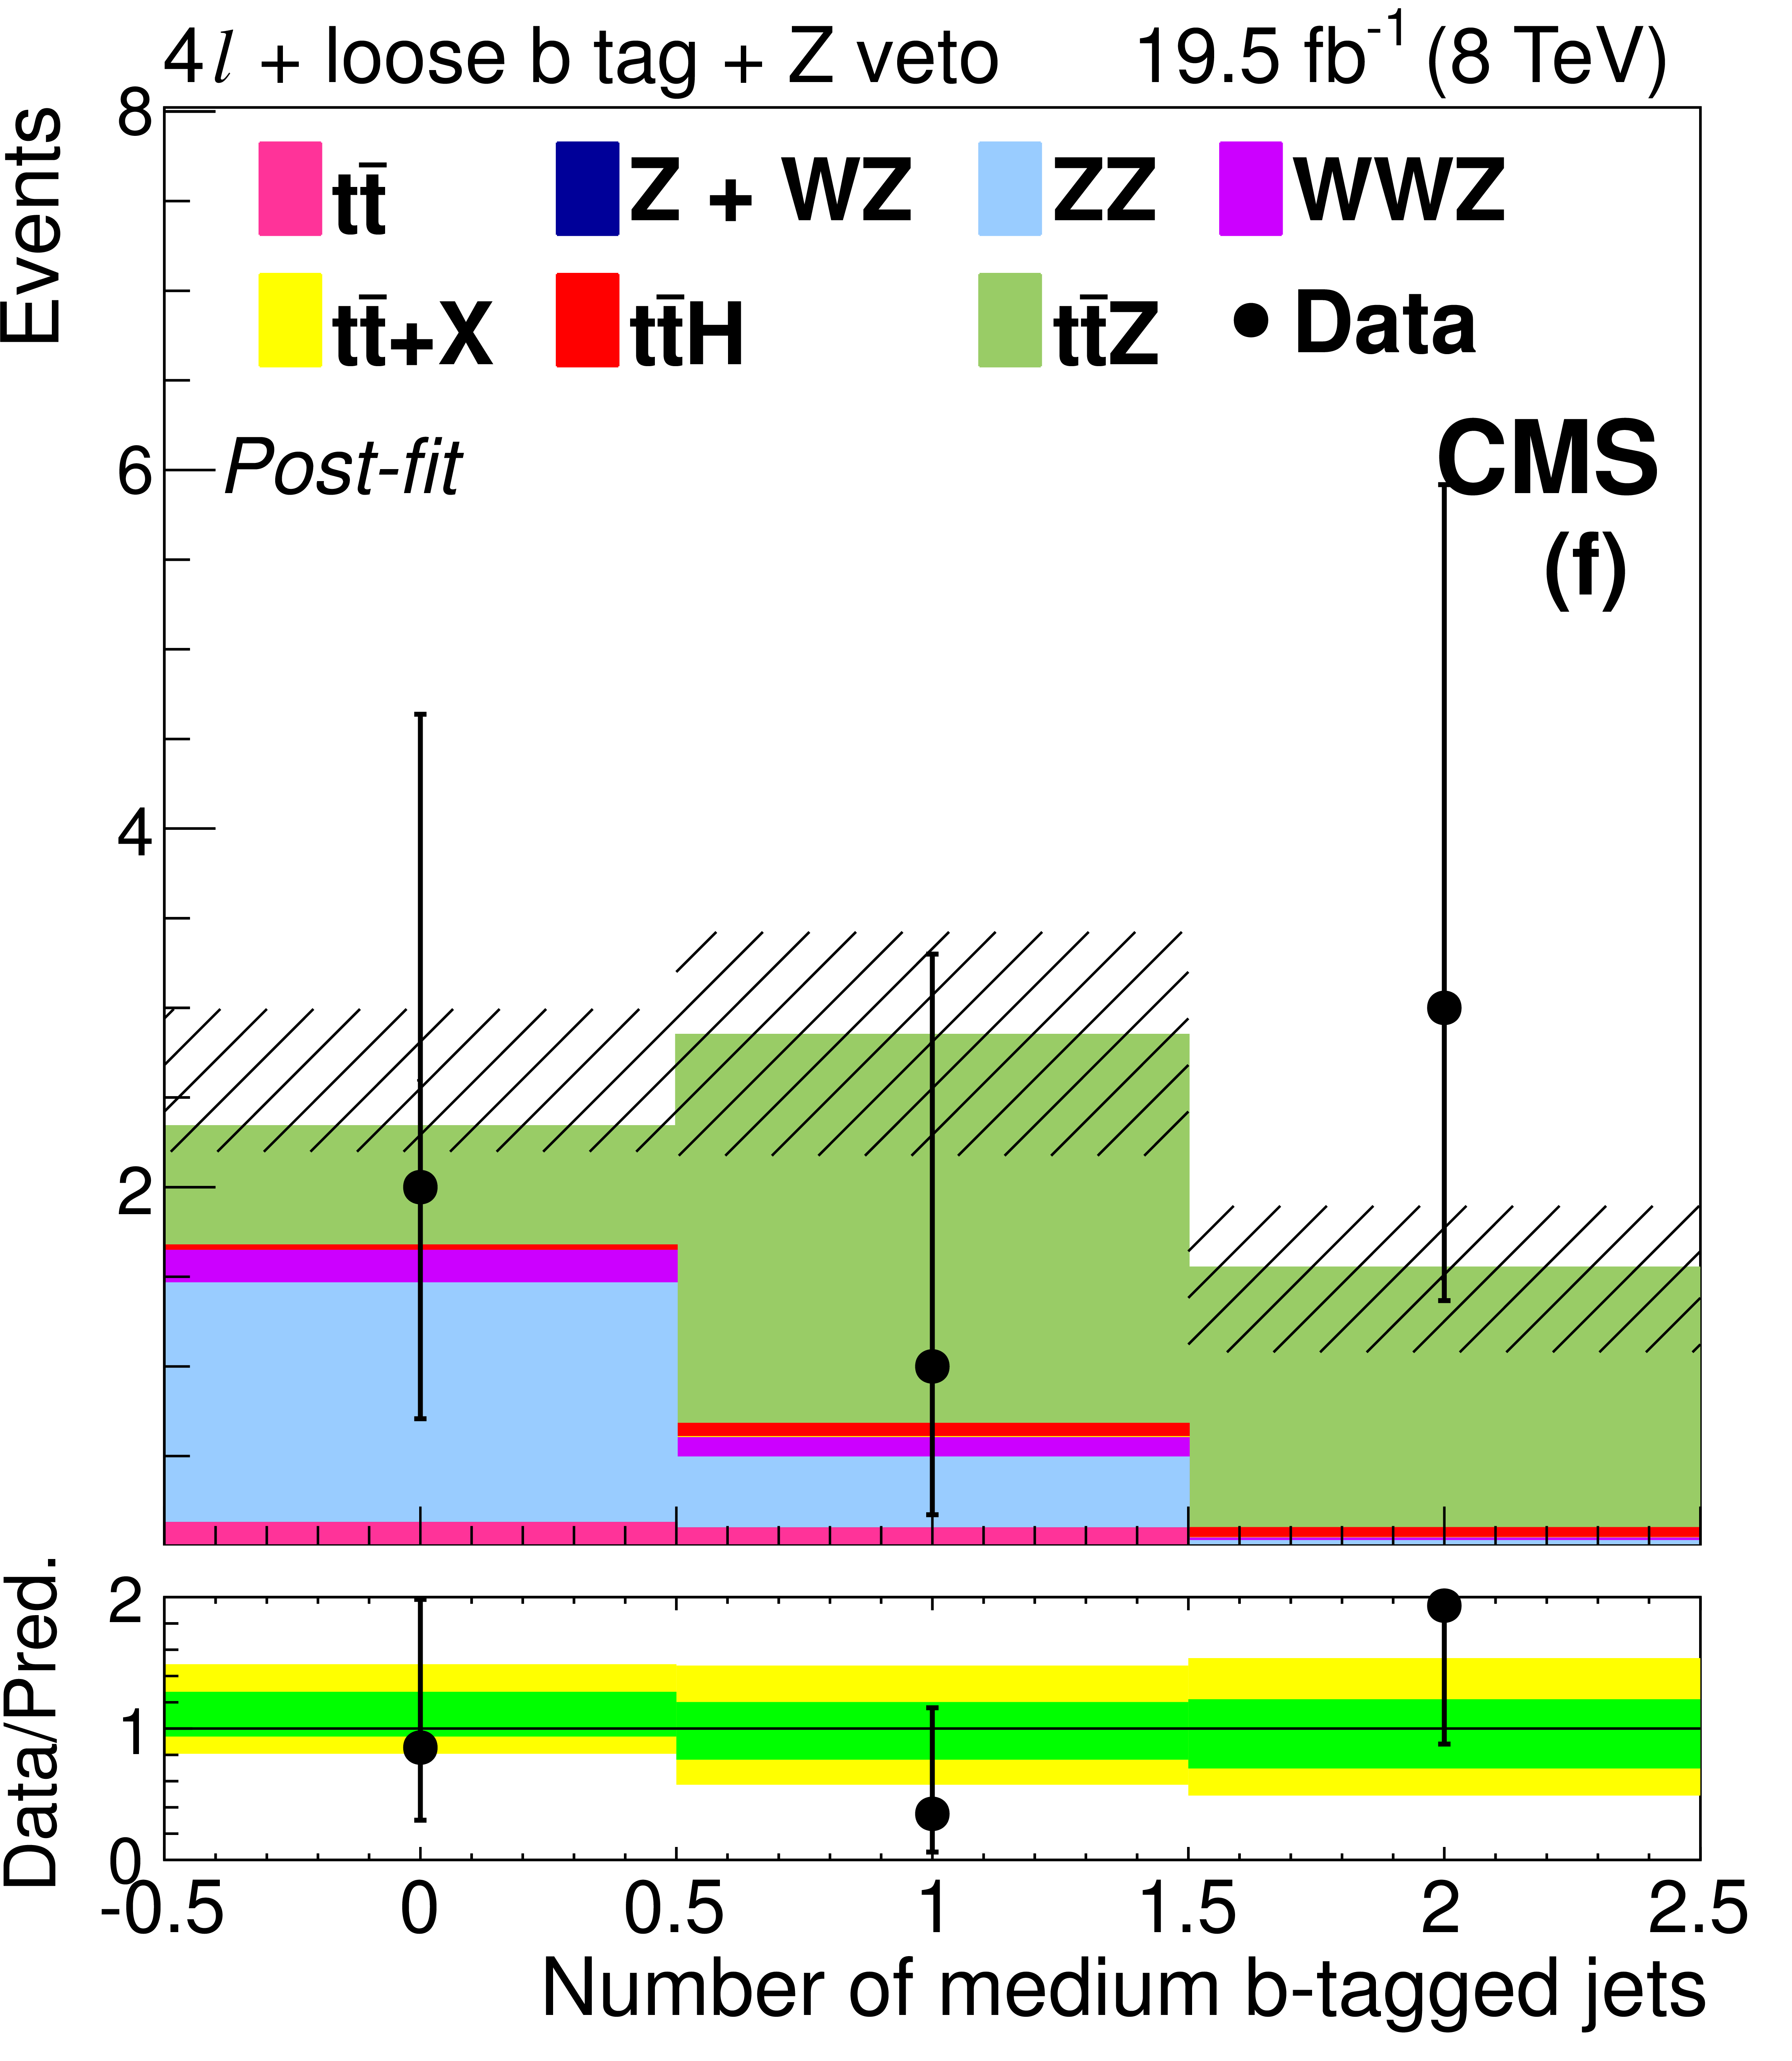
Figure 6-f:
The final discriminant for $ \mathrm{ t \bar{t} Z } $ channel events with two OS leptons and 5 jets (a) or ${\geq }6$ jets (d), three leptons and 3 jets (b) or $\geq $4 jets (e), or four leptons and two lepton pairs (c) or exactly one lepton pair (f) consistent with a $\mathrm{ Z } \to \ell \ell $ decay, after the final fit described in Section 10. The 68% CL uncertainty in the fitted signal plus background is represented by hash marks in the stack histogram, and a green shaded region in the data-to-prediction ratio plot. The 95% CL band from the fit is shown in yellow. The orange line shows the shape of the $ \mathrm{ t \bar{t} Z } $ signal, suitably normalized. The $ \mathrm{ t \bar{t} } $ +X background includes $ \mathrm{ t \bar{t} W }$, $\mathrm{ t \bar{t} H } $, and $ \mathrm{ t \bar{t} W W } $ ; ``Other'' backgrounds include $ \mathrm{ t \bar{t} \gamma }$, $ \mathrm{ t \bar{t} \gamma^{*} } $ , $ \mathrm{ t \bar{t} W W } $ , $ \mathrm{ t b Z } $ , WWW, and WWZ. |
png pdf |
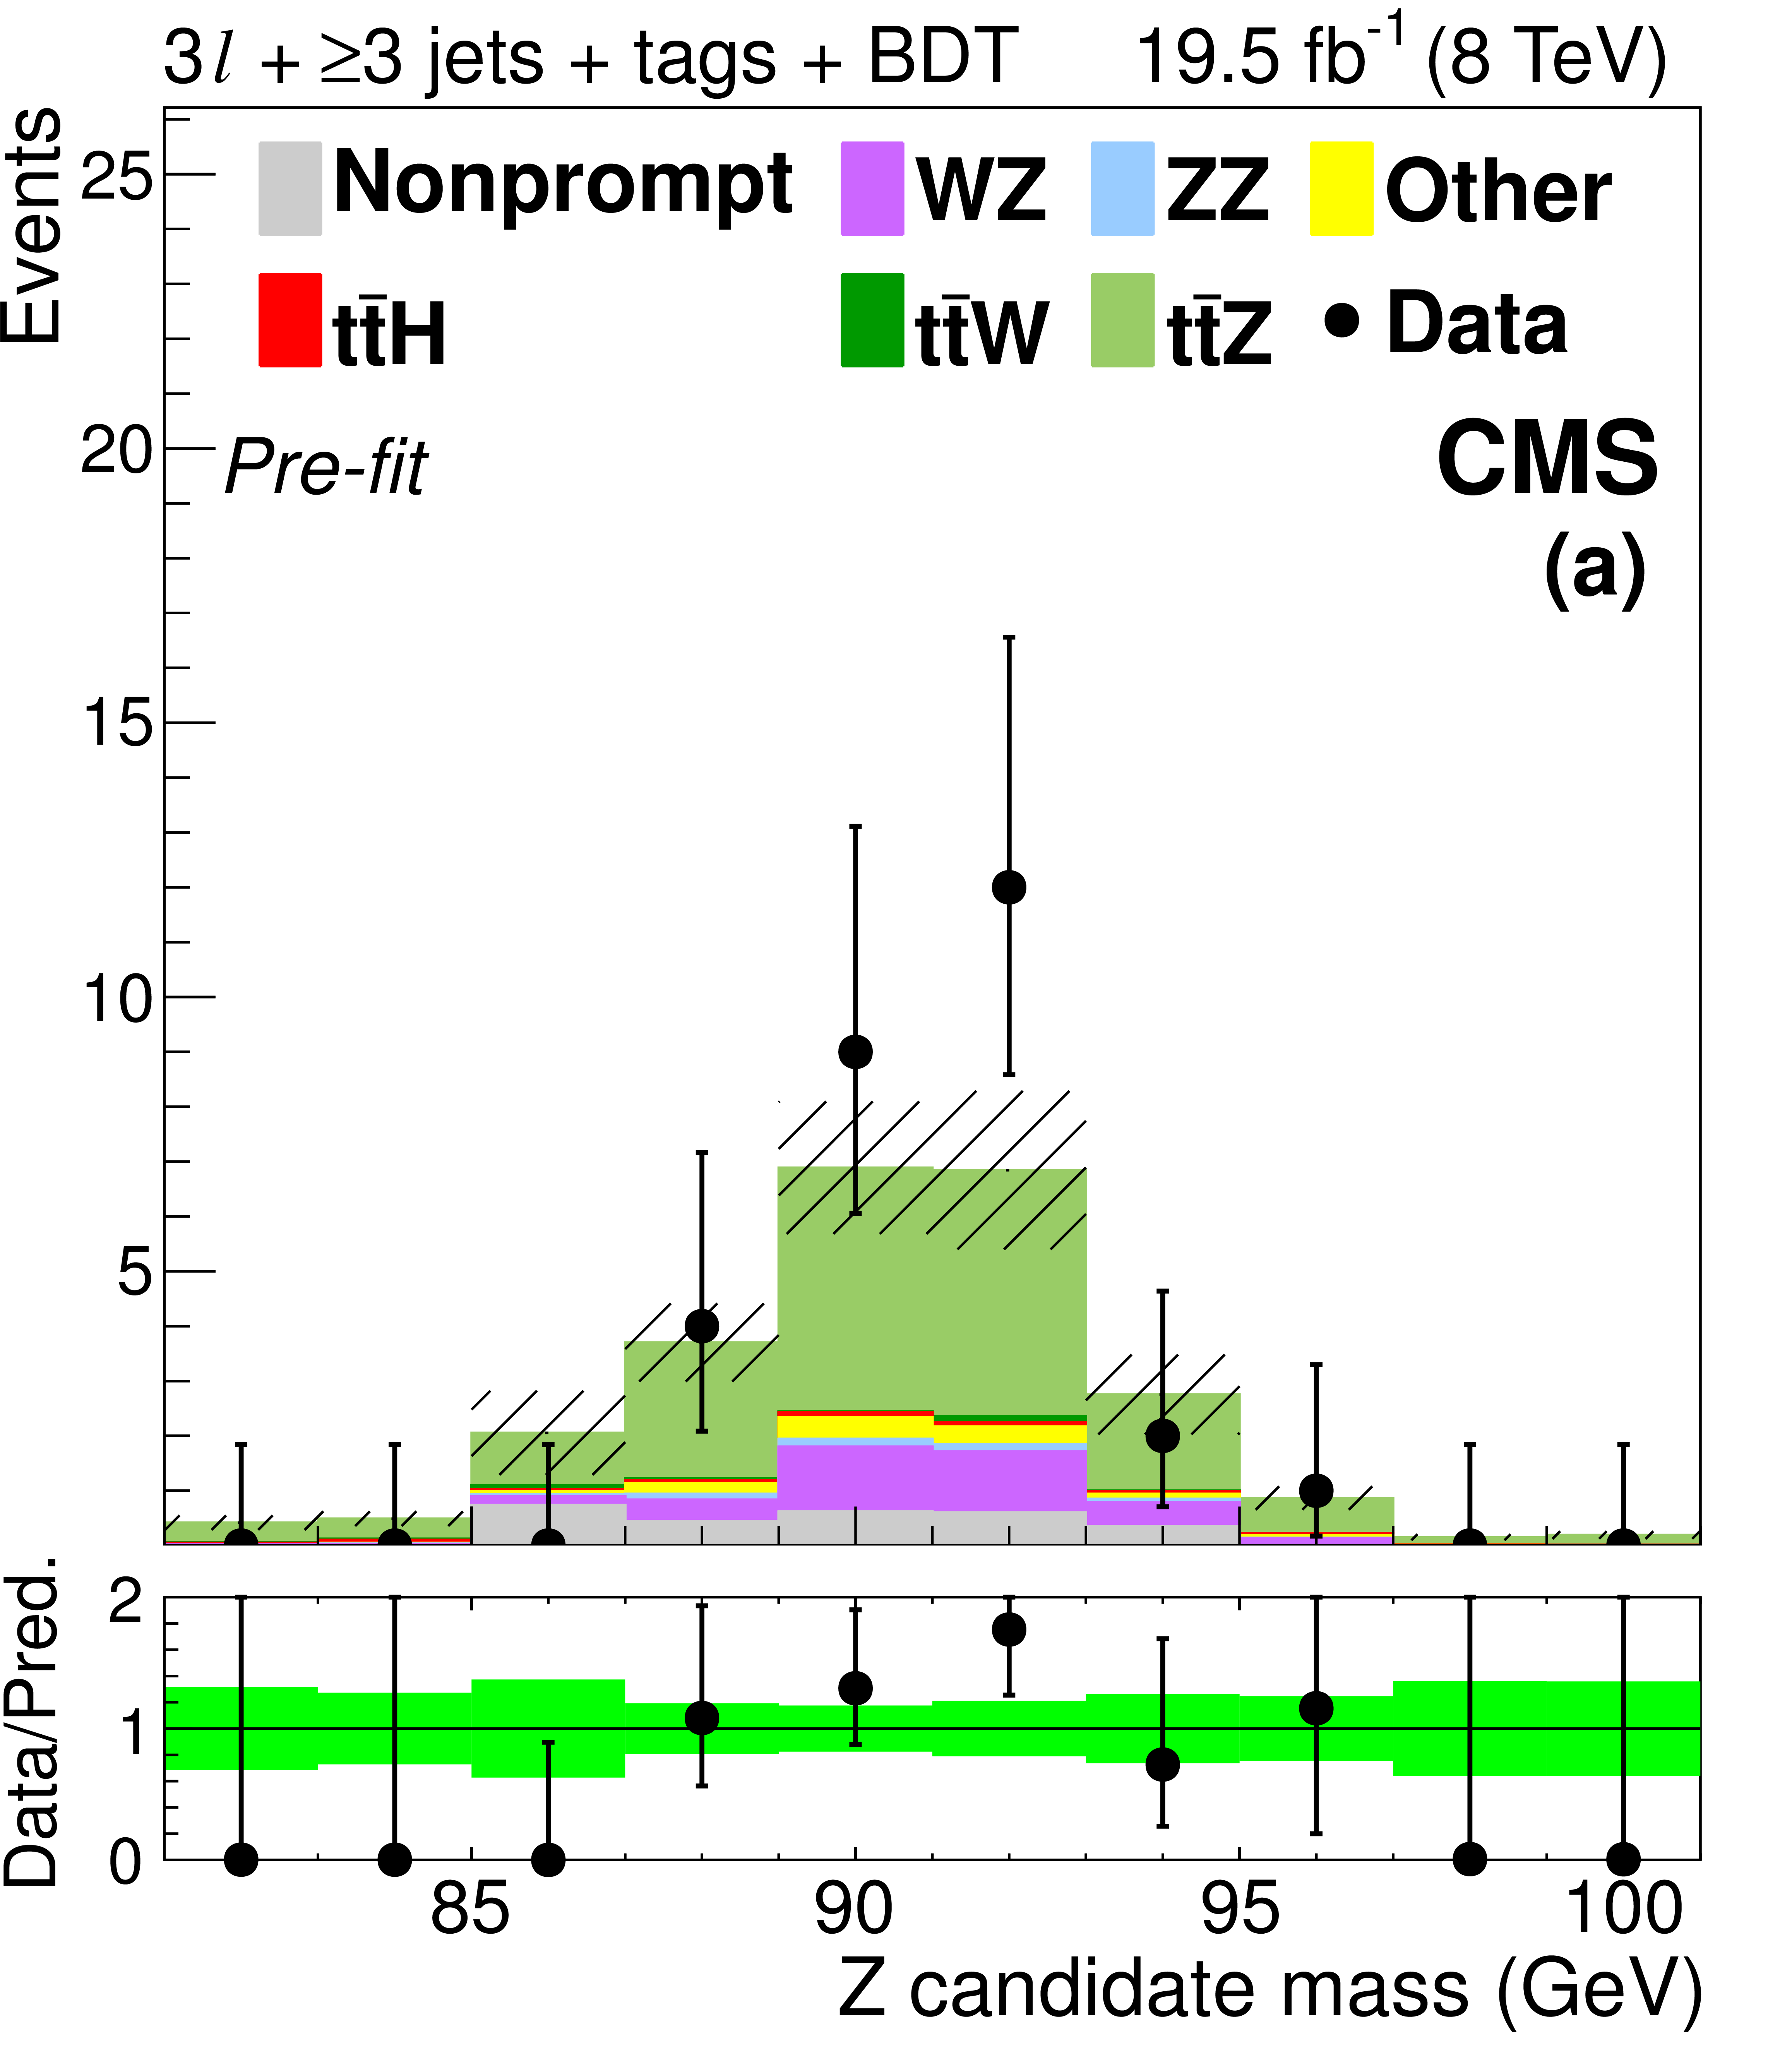
Figure 7-a:
Distributions of the mass (a) and $ {p_{\mathrm {T}}} $ (d) of the lepton pair identified with the Z boson decay, the number of jets (b) and medium b-tagged jets (e), and the mass of the best fit dijet pair from a W boson decay (c) and trijet system from a top quark decay (f). The plots show signal-like events from the 3$\ell $ $ \mathrm{ t \bar{t} Z } $ channel (3 jets with BDT $ > 0.3$ and ${\geq }4$ jets with BDT $ > -0.2$) before the final fit described in Section 10 is performed. The green band in the data-to-prediction ratio plot denotes the 68% CL rate and shape uncertainties in the signal plus background prediction. ``Other'' backgrounds include $ \mathrm{ t \bar{t} \gamma }$, $ \mathrm{ t \bar{t} \gamma^{*} } $ , $ \mathrm{ t \bar{t} W W } $ , $ \mathrm{ t b Z } $ , WWW, and WWZ. |
png pdf |
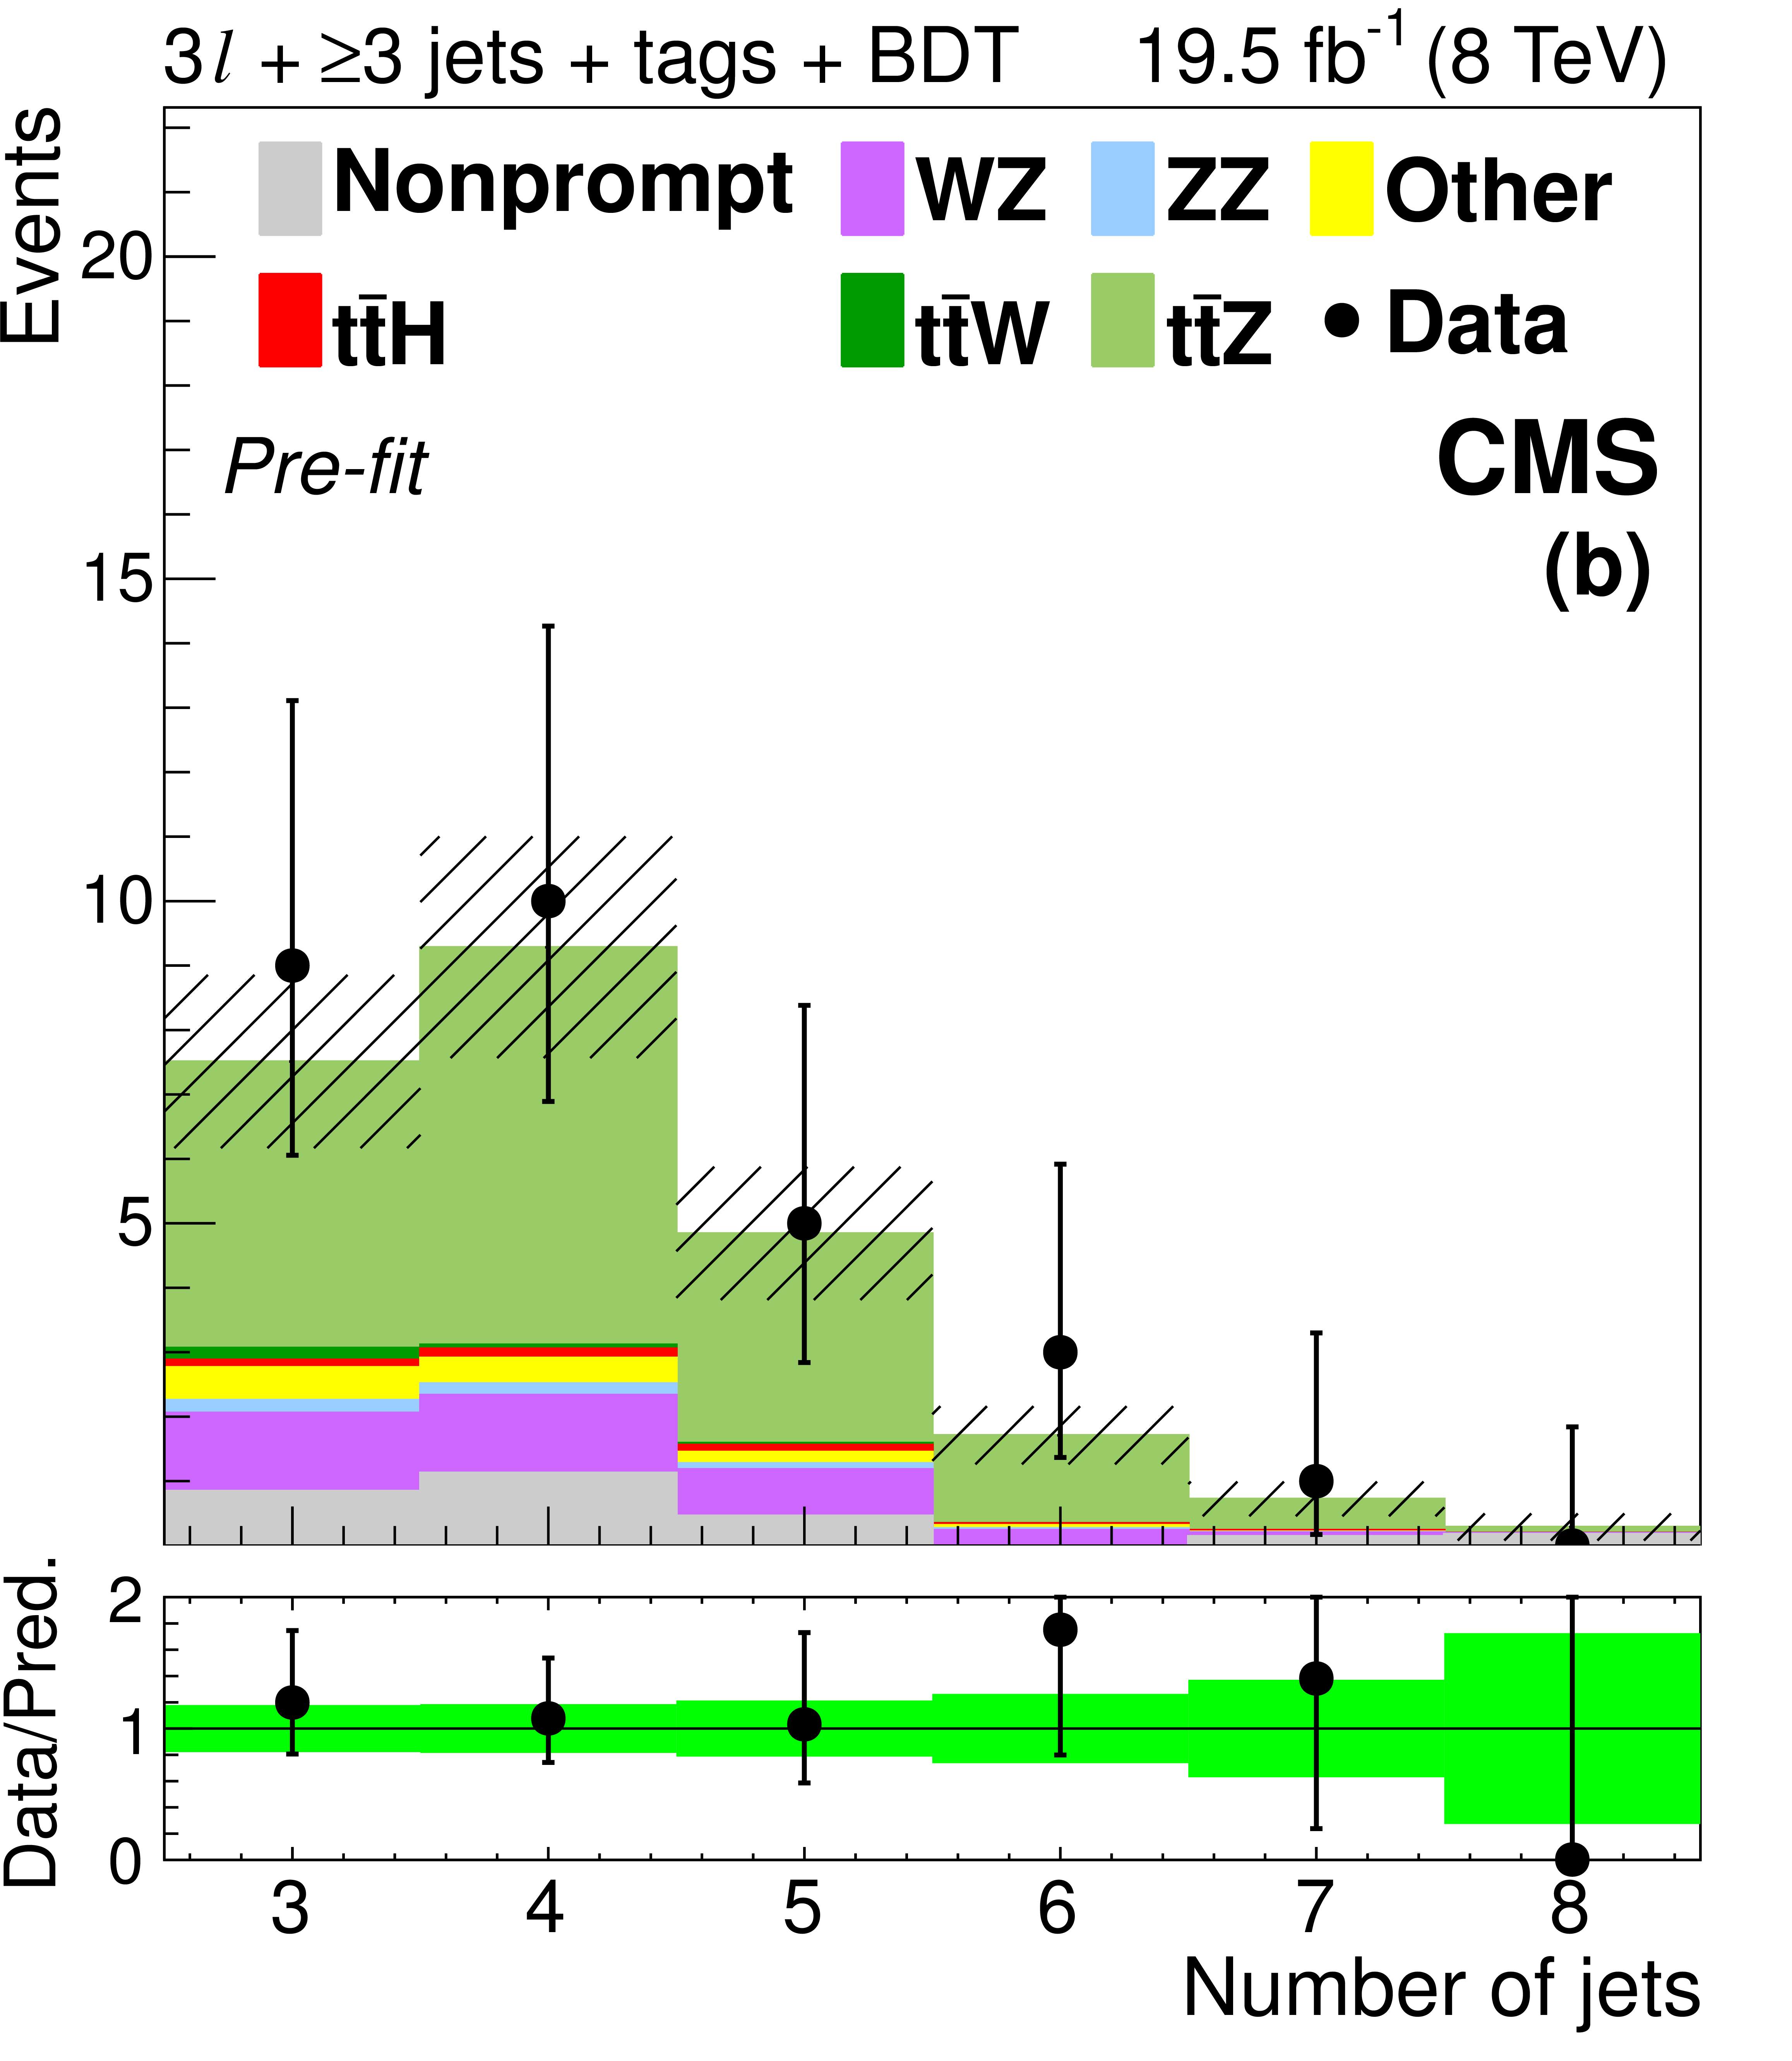
Figure 7-b:
Distributions of the mass (a) and $ {p_{\mathrm {T}}} $ (d) of the lepton pair identified with the Z boson decay, the number of jets (b) and medium b-tagged jets (e), and the mass of the best fit dijet pair from a W boson decay (c) and trijet system from a top quark decay (f). The plots show signal-like events from the 3$\ell $ $ \mathrm{ t \bar{t} Z } $ channel (3 jets with BDT $ > 0.3$ and ${\geq }4$ jets with BDT $ > -0.2$) before the final fit described in Section 10 is performed. The green band in the data-to-prediction ratio plot denotes the 68% CL rate and shape uncertainties in the signal plus background prediction. ``Other'' backgrounds include $ \mathrm{ t \bar{t} \gamma }$, $ \mathrm{ t \bar{t} \gamma^{*} } $ , $ \mathrm{ t \bar{t} W W } $ , $ \mathrm{ t b Z } $ , WWW, and WWZ. |
png pdf |
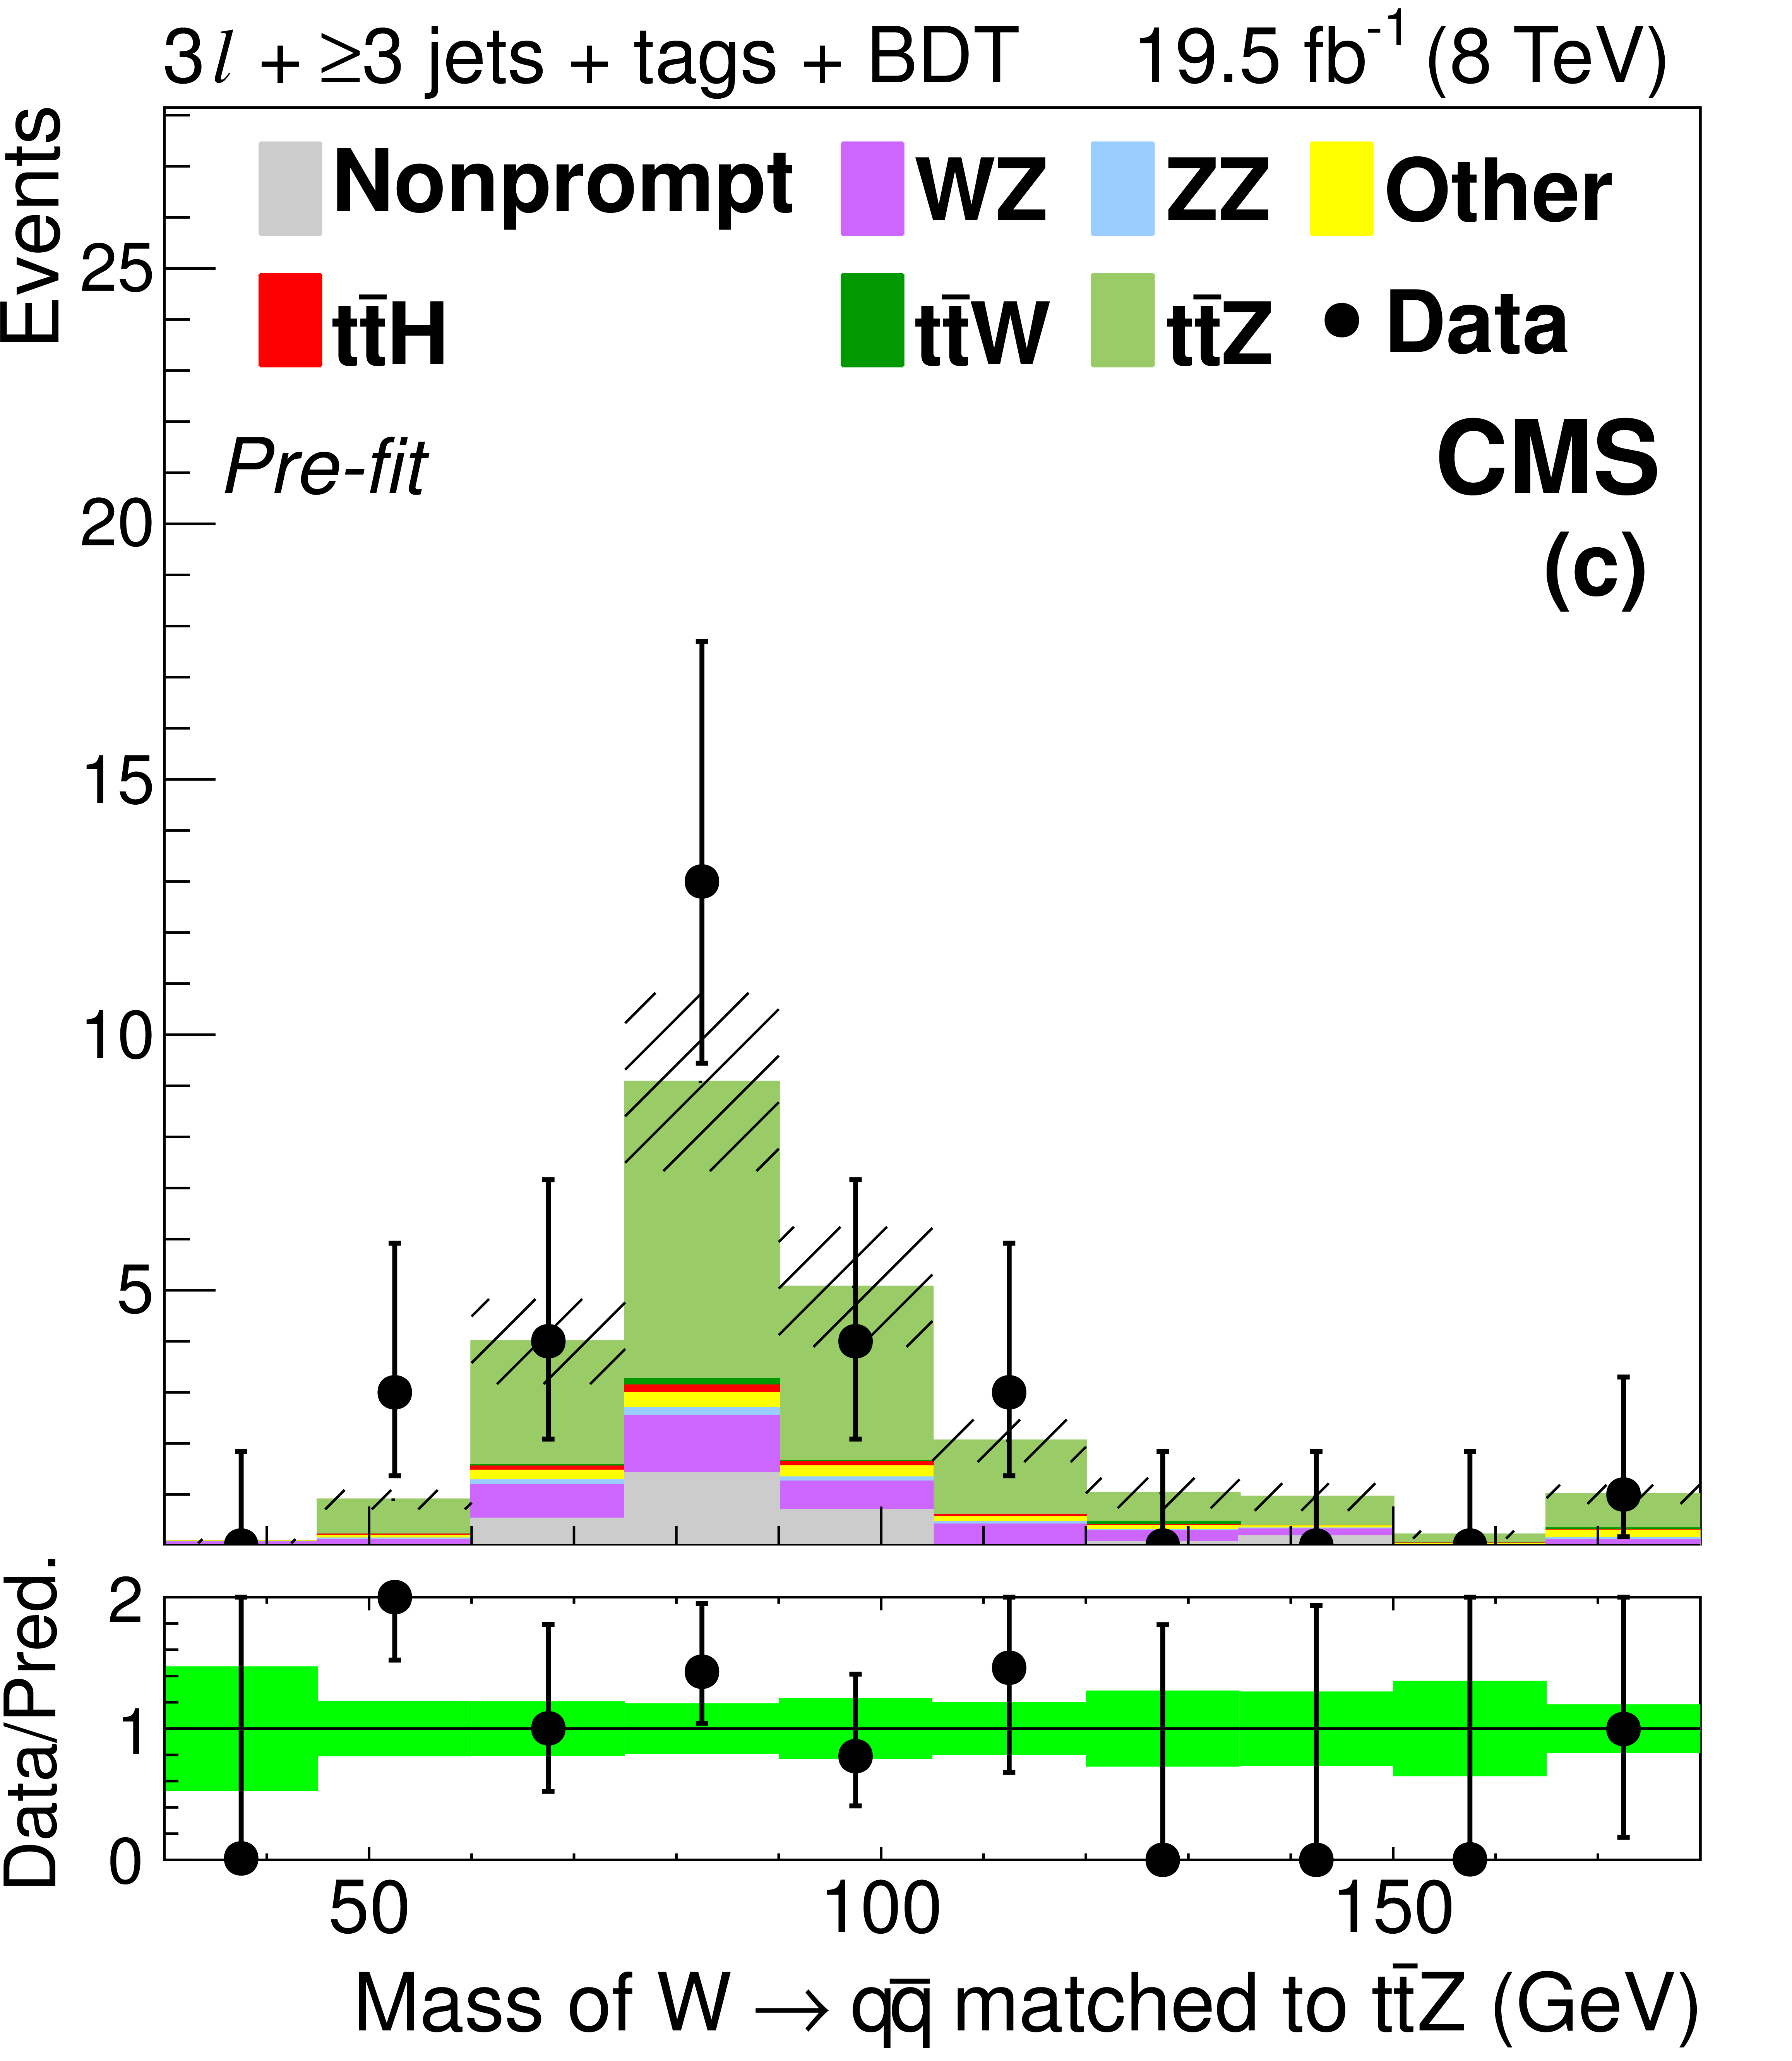
Figure 7-c:
Distributions of the mass (a) and $ {p_{\mathrm {T}}} $ (d) of the lepton pair identified with the Z boson decay, the number of jets (b) and medium b-tagged jets (e), and the mass of the best fit dijet pair from a W boson decay (c) and trijet system from a top quark decay (f). The plots show signal-like events from the 3$\ell $ $ \mathrm{ t \bar{t} Z } $ channel (3 jets with BDT $ > 0.3$ and ${\geq }4$ jets with BDT $ > -0.2$) before the final fit described in Section 10 is performed. The green band in the data-to-prediction ratio plot denotes the 68% CL rate and shape uncertainties in the signal plus background prediction. ``Other'' backgrounds include $ \mathrm{ t \bar{t} \gamma }$, $ \mathrm{ t \bar{t} \gamma^{*} } $ , $ \mathrm{ t \bar{t} W W } $ , $ \mathrm{ t b Z } $ , WWW, and WWZ. |

png pdf |
Figure 7-d:
Distributions of the mass (a) and $ {p_{\mathrm {T}}} $ (d) of the lepton pair identified with the Z boson decay, the number of jets (b) and medium b-tagged jets (e), and the mass of the best fit dijet pair from a W boson decay (c) and trijet system from a top quark decay (f). The plots show signal-like events from the 3$\ell $ $ \mathrm{ t \bar{t} Z } $ channel (3 jets with BDT $ > 0.3$ and ${\geq }4$ jets with BDT $ > -0.2$) before the final fit described in Section 10 is performed. The green band in the data-to-prediction ratio plot denotes the 68% CL rate and shape uncertainties in the signal plus background prediction. ``Other'' backgrounds include $ \mathrm{ t \bar{t} \gamma }$, $ \mathrm{ t \bar{t} \gamma^{*} } $ , $ \mathrm{ t \bar{t} W W } $ , $ \mathrm{ t b Z } $ , WWW, and WWZ. |
png pdf |
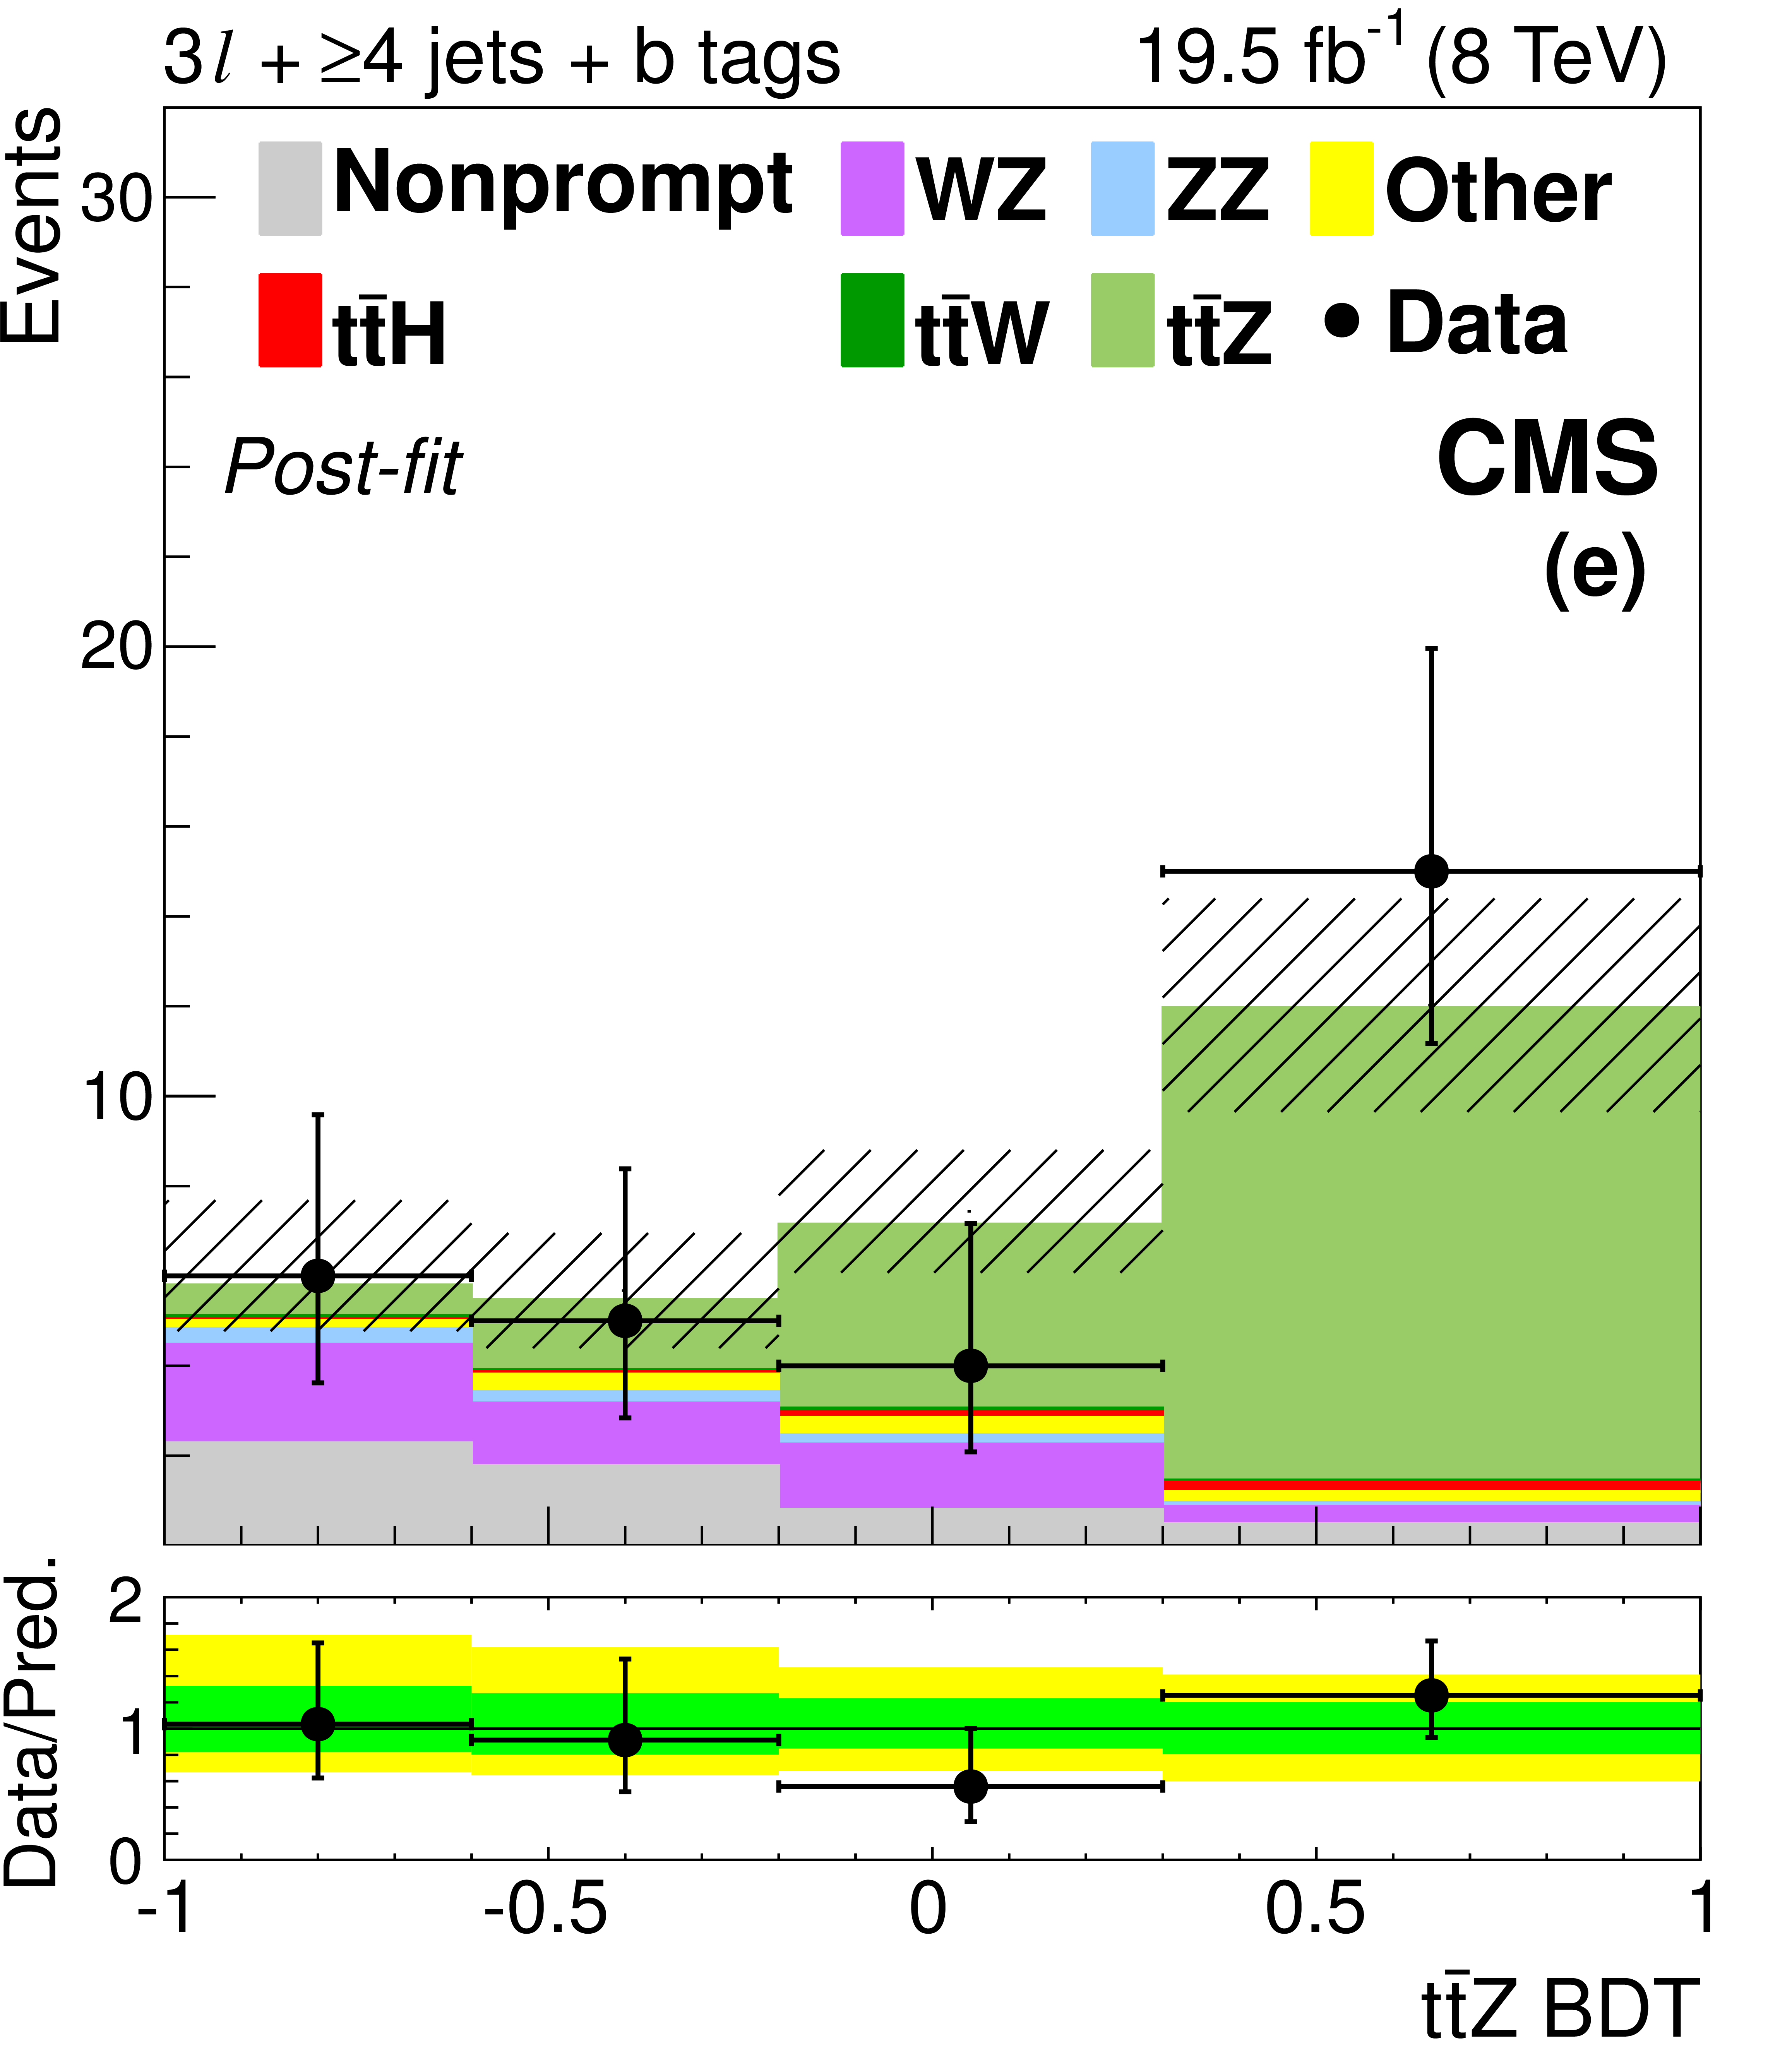
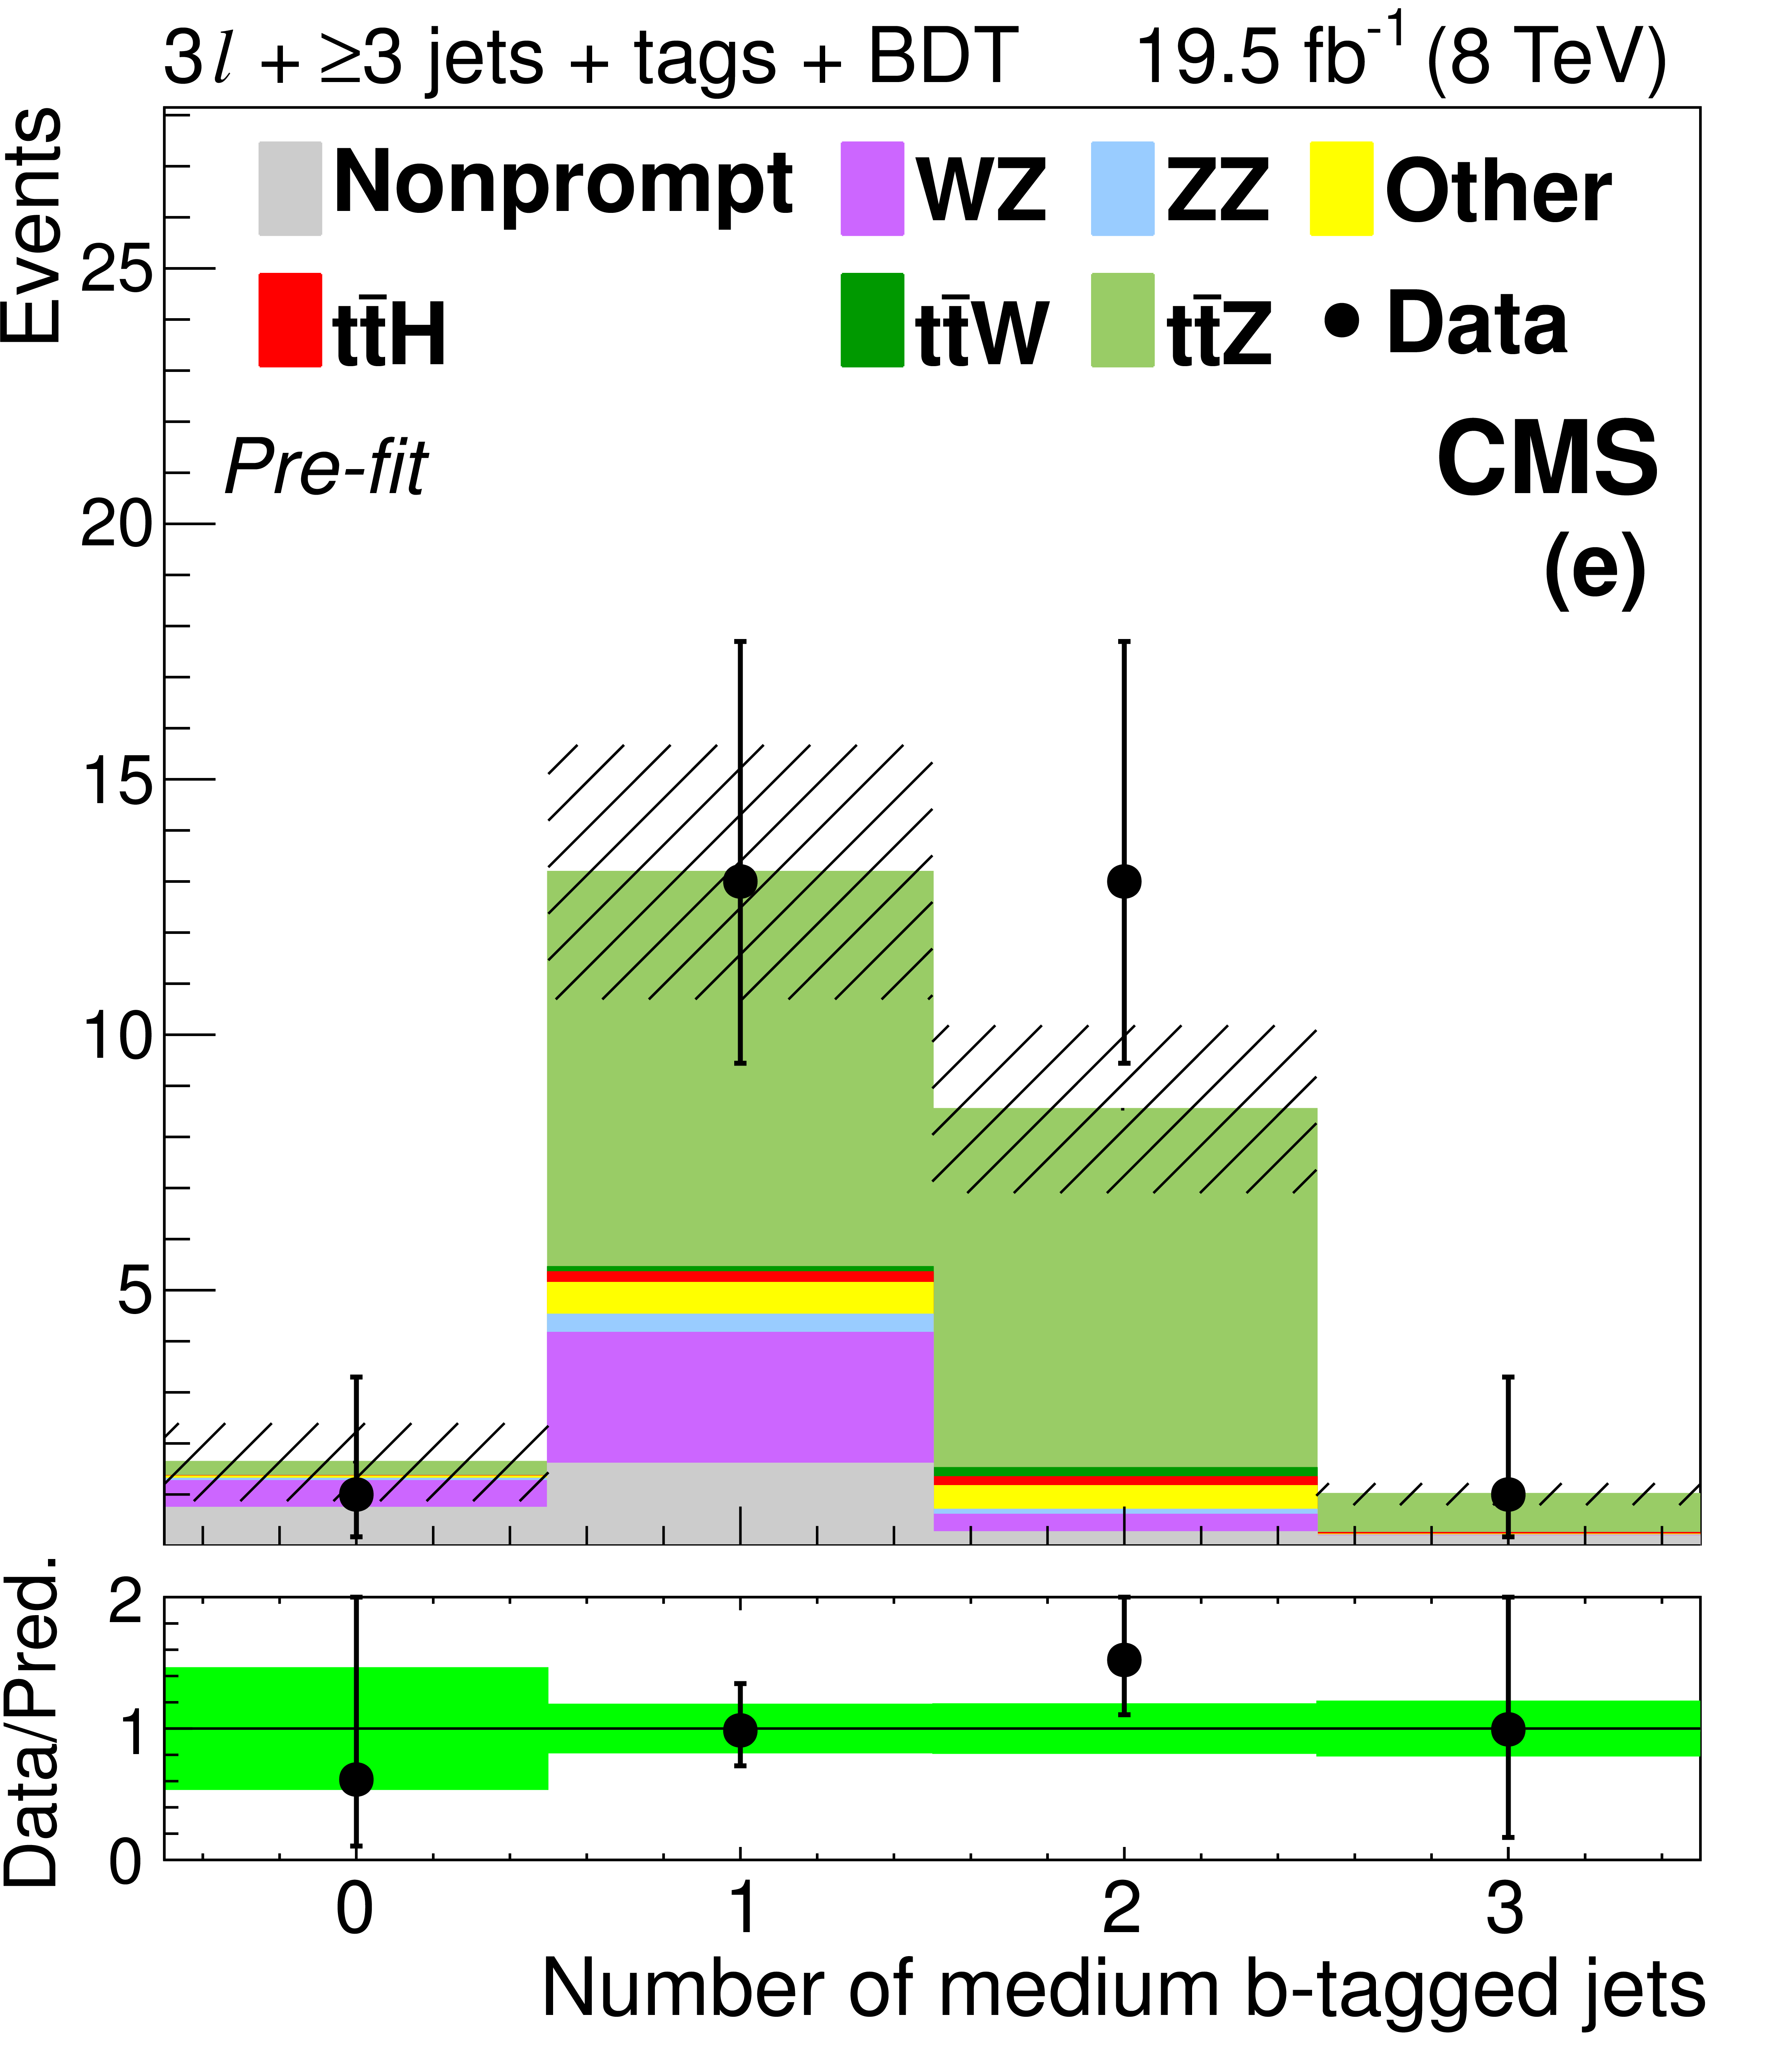
Figure 7-e:
Distributions of the mass (a) and $ {p_{\mathrm {T}}} $ (d) of the lepton pair identified with the Z boson decay, the number of jets (b) and medium b-tagged jets (e), and the mass of the best fit dijet pair from a W boson decay (c) and trijet system from a top quark decay (f). The plots show signal-like events from the 3$\ell $ $ \mathrm{ t \bar{t} Z } $ channel (3 jets with BDT $ > 0.3$ and ${\geq }4$ jets with BDT $ > -0.2$) before the final fit described in Section 10 is performed. The green band in the data-to-prediction ratio plot denotes the 68% CL rate and shape uncertainties in the signal plus background prediction. ``Other'' backgrounds include $ \mathrm{ t \bar{t} \gamma }$, $ \mathrm{ t \bar{t} \gamma^{*} } $ , $ \mathrm{ t \bar{t} W W } $ , $ \mathrm{ t b Z } $ , WWW, and WWZ. |
png pdf |
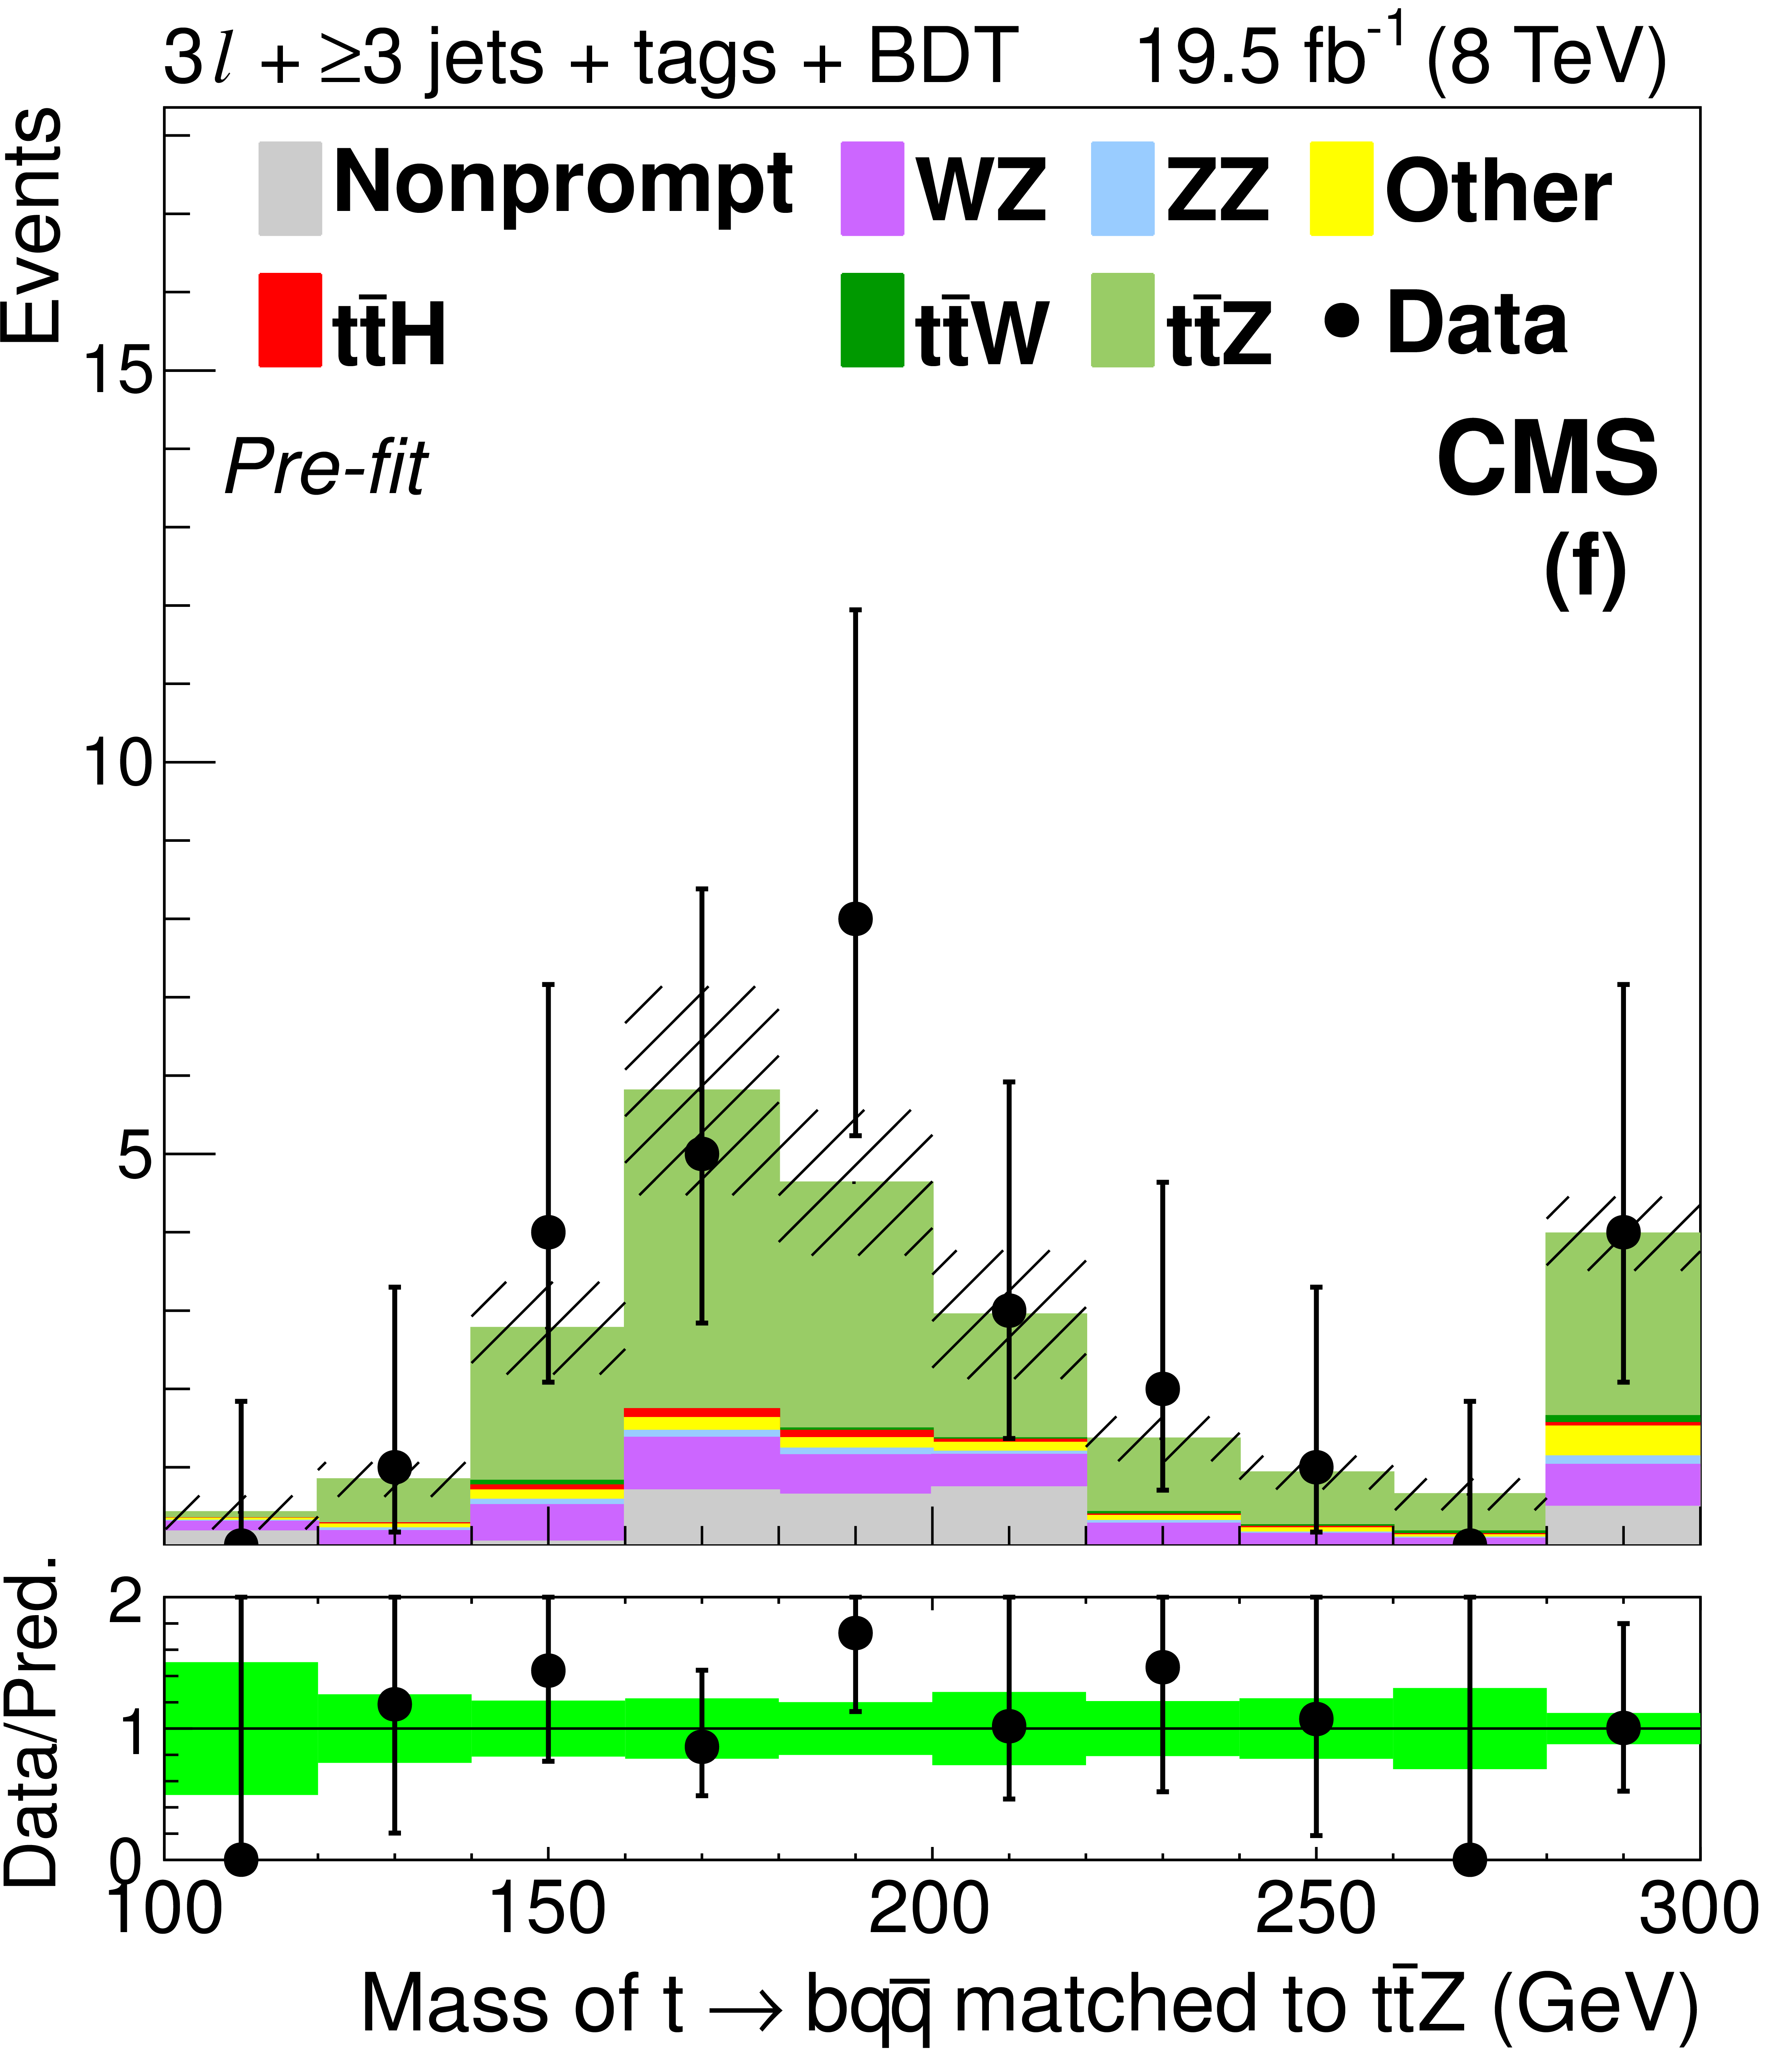
Figure 7-f:
Distributions of the mass (a) and $ {p_{\mathrm {T}}} $ (d) of the lepton pair identified with the Z boson decay, the number of jets (b) and medium b-tagged jets (e), and the mass of the best fit dijet pair from a W boson decay (c) and trijet system from a top quark decay (f). The plots show signal-like events from the 3$\ell $ $ \mathrm{ t \bar{t} Z } $ channel (3 jets with BDT $ > 0.3$ and ${\geq }4$ jets with BDT $ > -0.2$) before the final fit described in Section 10 is performed. The green band in the data-to-prediction ratio plot denotes the 68% CL rate and shape uncertainties in the signal plus background prediction. ``Other'' backgrounds include $ \mathrm{ t \bar{t} \gamma }$, $ \mathrm{ t \bar{t} \gamma^{*} } $ , $ \mathrm{ t \bar{t} W W } $ , $ \mathrm{ t b Z } $ , WWW, and WWZ. |

png pdf |
Figure 8:
Profile likelihood as a function of $\sigma ( \mathrm{ t \bar{t} W } )$ and $\sigma ( \mathrm{ t \bar{t} Z } )$. Lines denote the 1 to 5 standard deviation ($\sigma $) CL contours. |
png pdf |
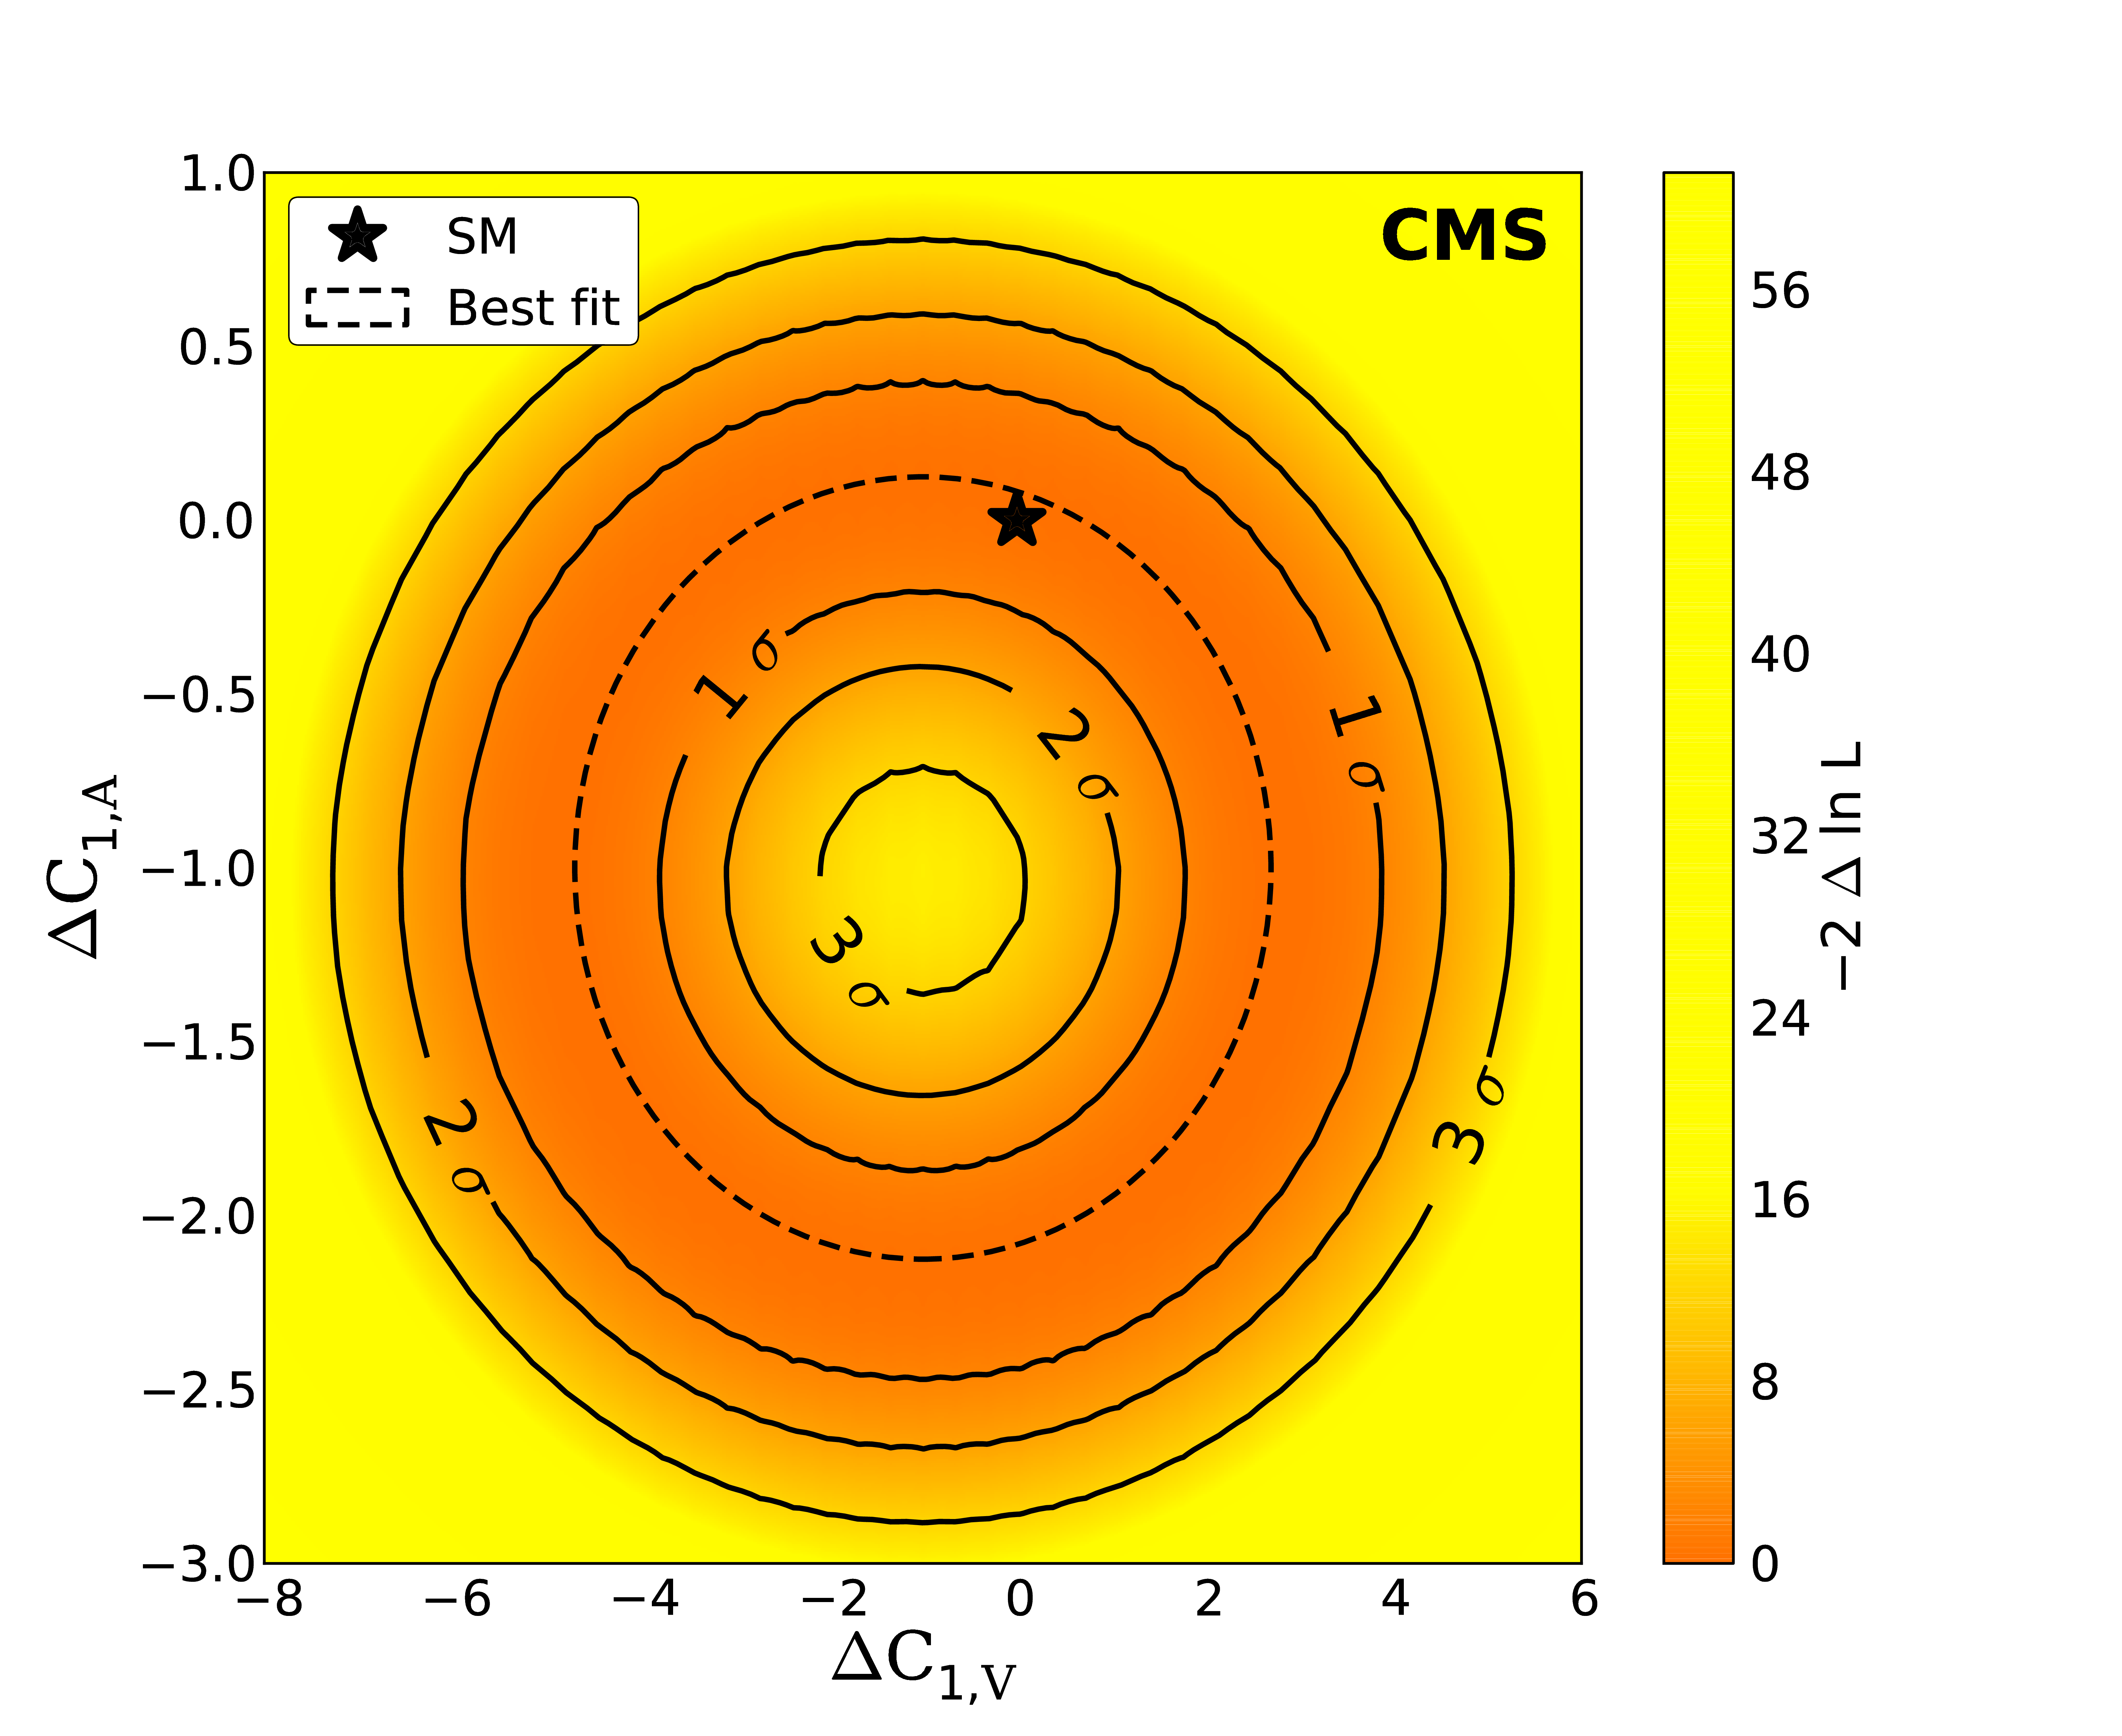
Figure 9:
Difference between the profile likelihood and the best fit profile likelihood functions for the relative vector and axial components of the tZ coupling. Contours corresponding to the best fit and the 1, 2, and 3 standard deviation ($\sigma $) CLs are shown in lines. |

png pdf |
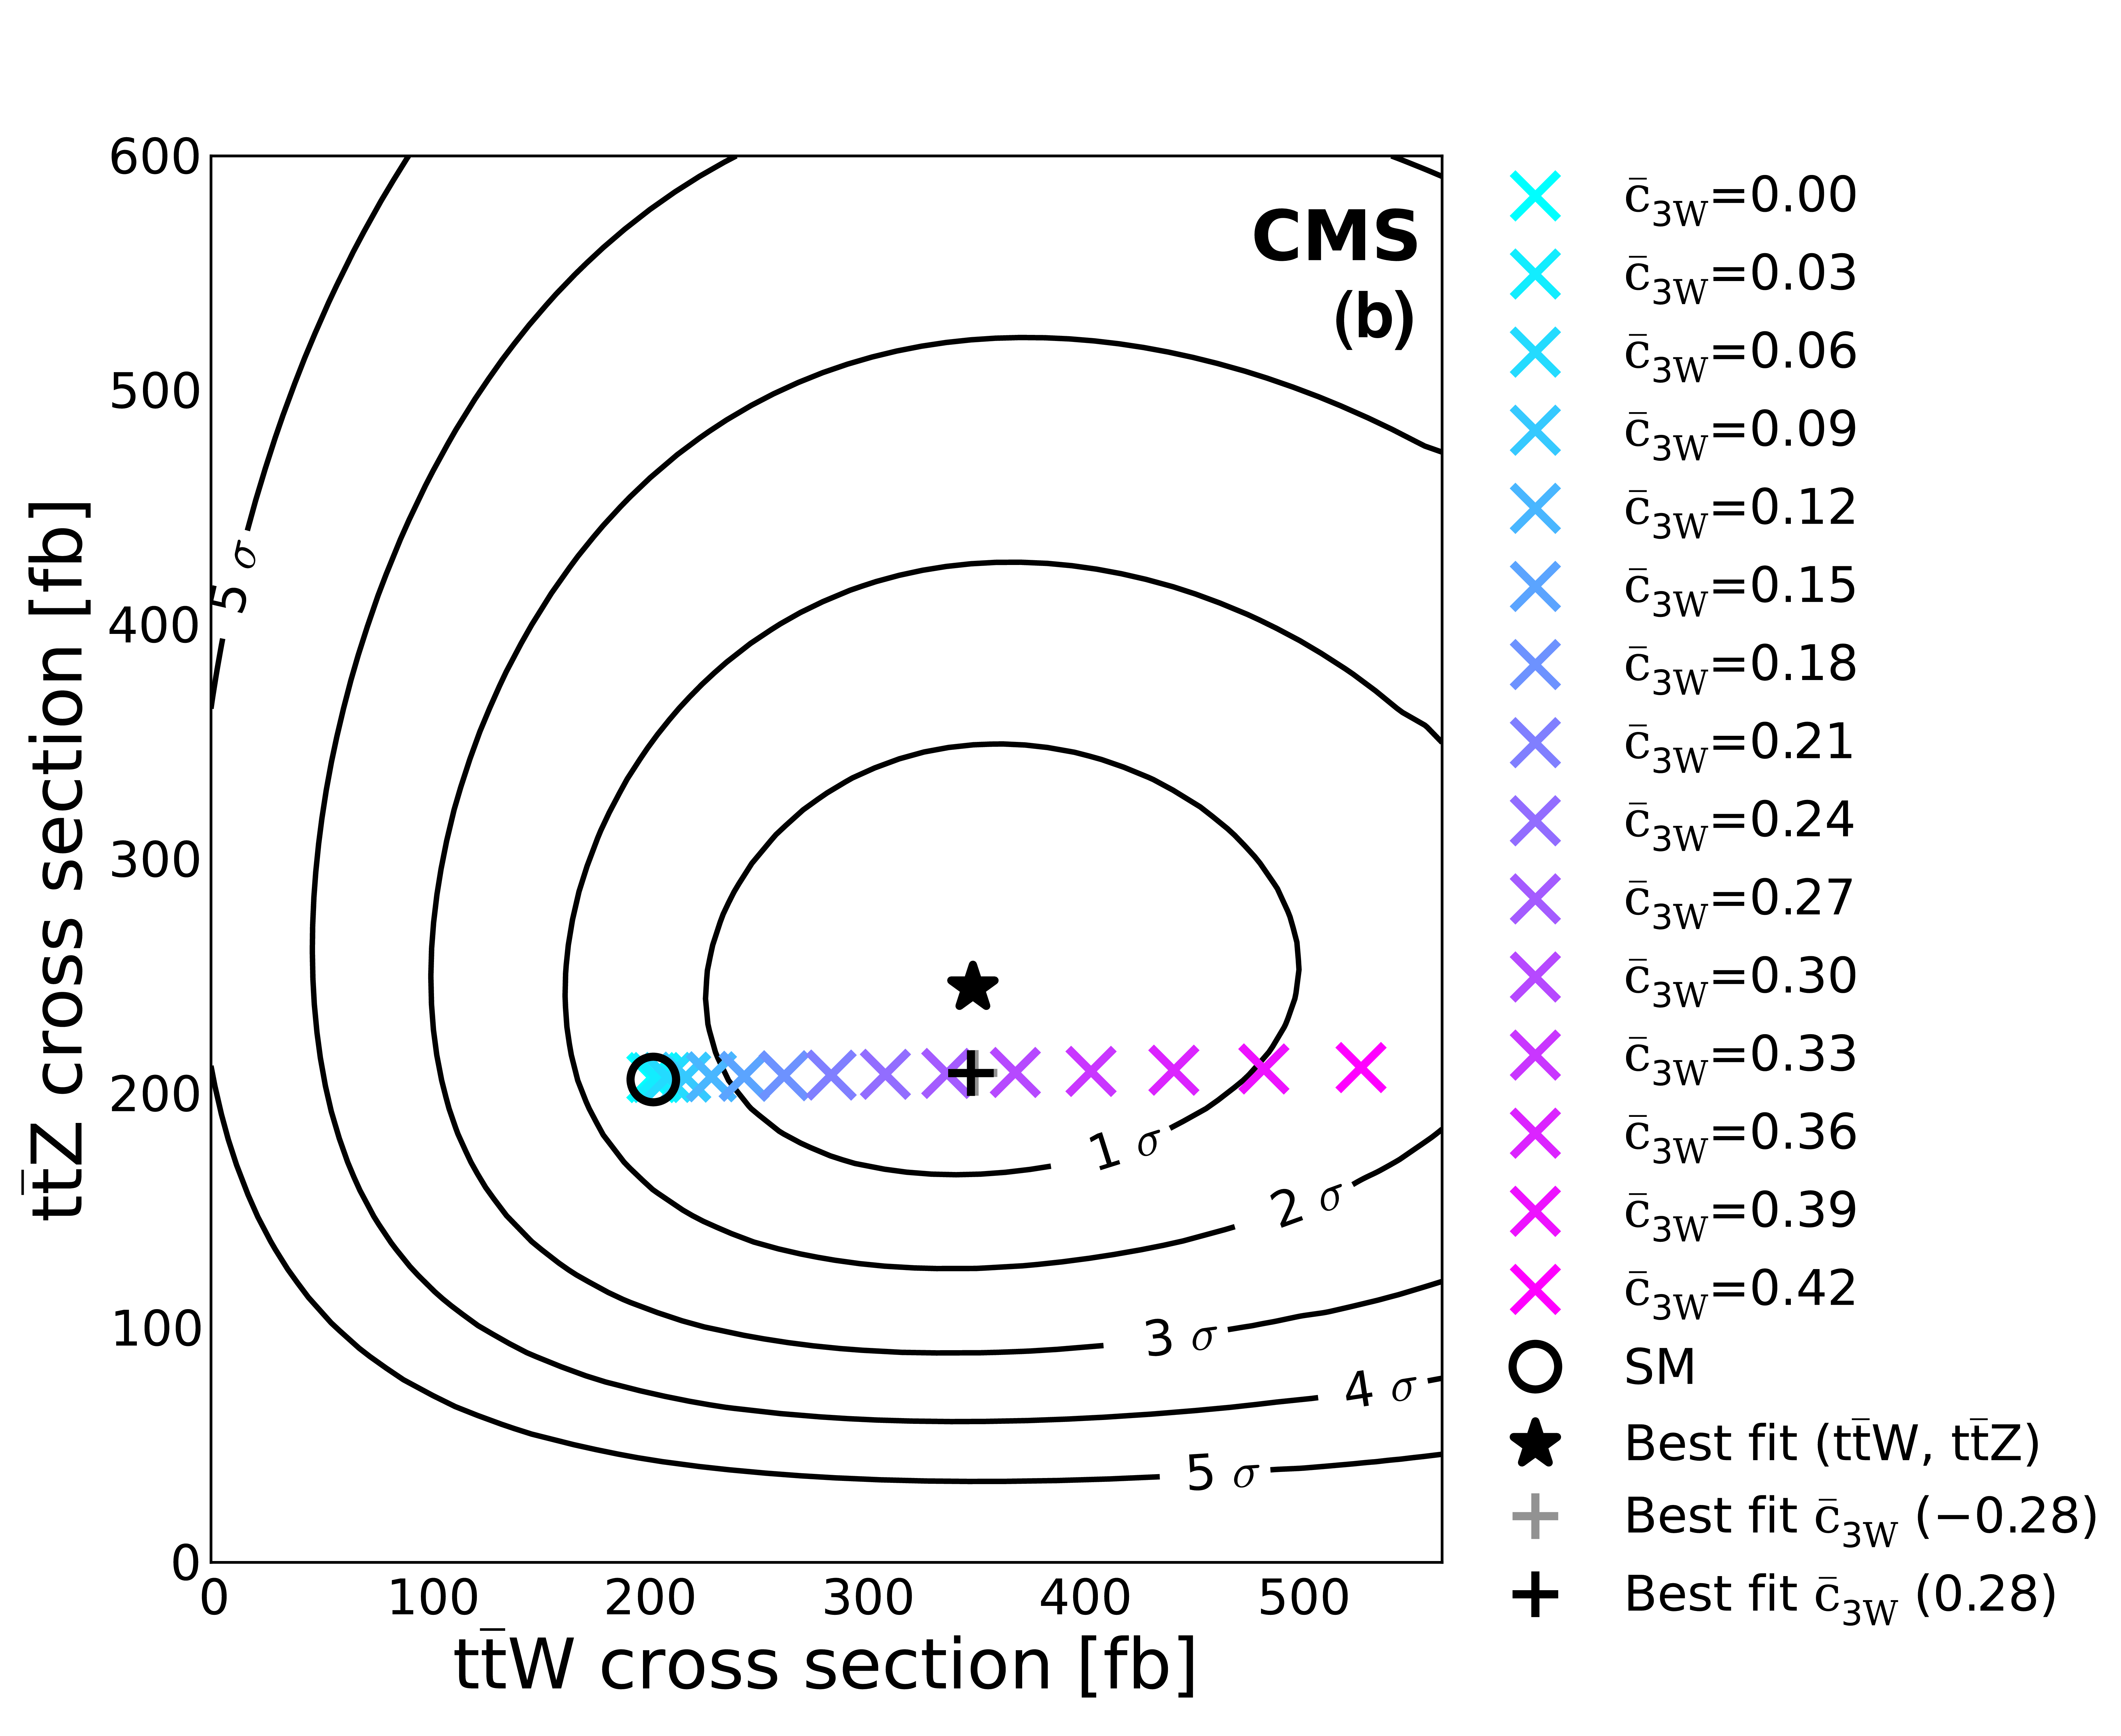
Figure 10-a:
Sampled coefficient values for $\bar{c}_{\mathrm {uB}}$ (a), $\bar{c}_{\mathrm {3W}}$ (b), $\bar{c}'_{\mathrm {HQ}}$ (c), $\bar{c}_{\mathrm {Hu}}$ (d), and $\bar{c}_{\mathrm {HQ}}$ (e), plotted in the ($\sigma ( \mathrm{ t \bar{t} W } )$, $\sigma ( \mathrm{ t \bar{t} Z })$) plane. There are typically two best fit values, one greater and one less than zero, which lie on top of one another in the plane. |
png pdf |
Figure 10-b:
Sampled coefficient values for $\bar{c}_{\mathrm {uB}}$ (a), $\bar{c}_{\mathrm {3W}}$ (b), $\bar{c}'_{\mathrm {HQ}}$ (c), $\bar{c}_{\mathrm {Hu}}$ (d), and $\bar{c}_{\mathrm {HQ}}$ (e), plotted in the ($\sigma ( \mathrm{ t \bar{t} W } )$, $\sigma ( \mathrm{ t \bar{t} Z })$) plane. There are typically two best fit values, one greater and one less than zero, which lie on top of one another in the plane. |
png pdf |
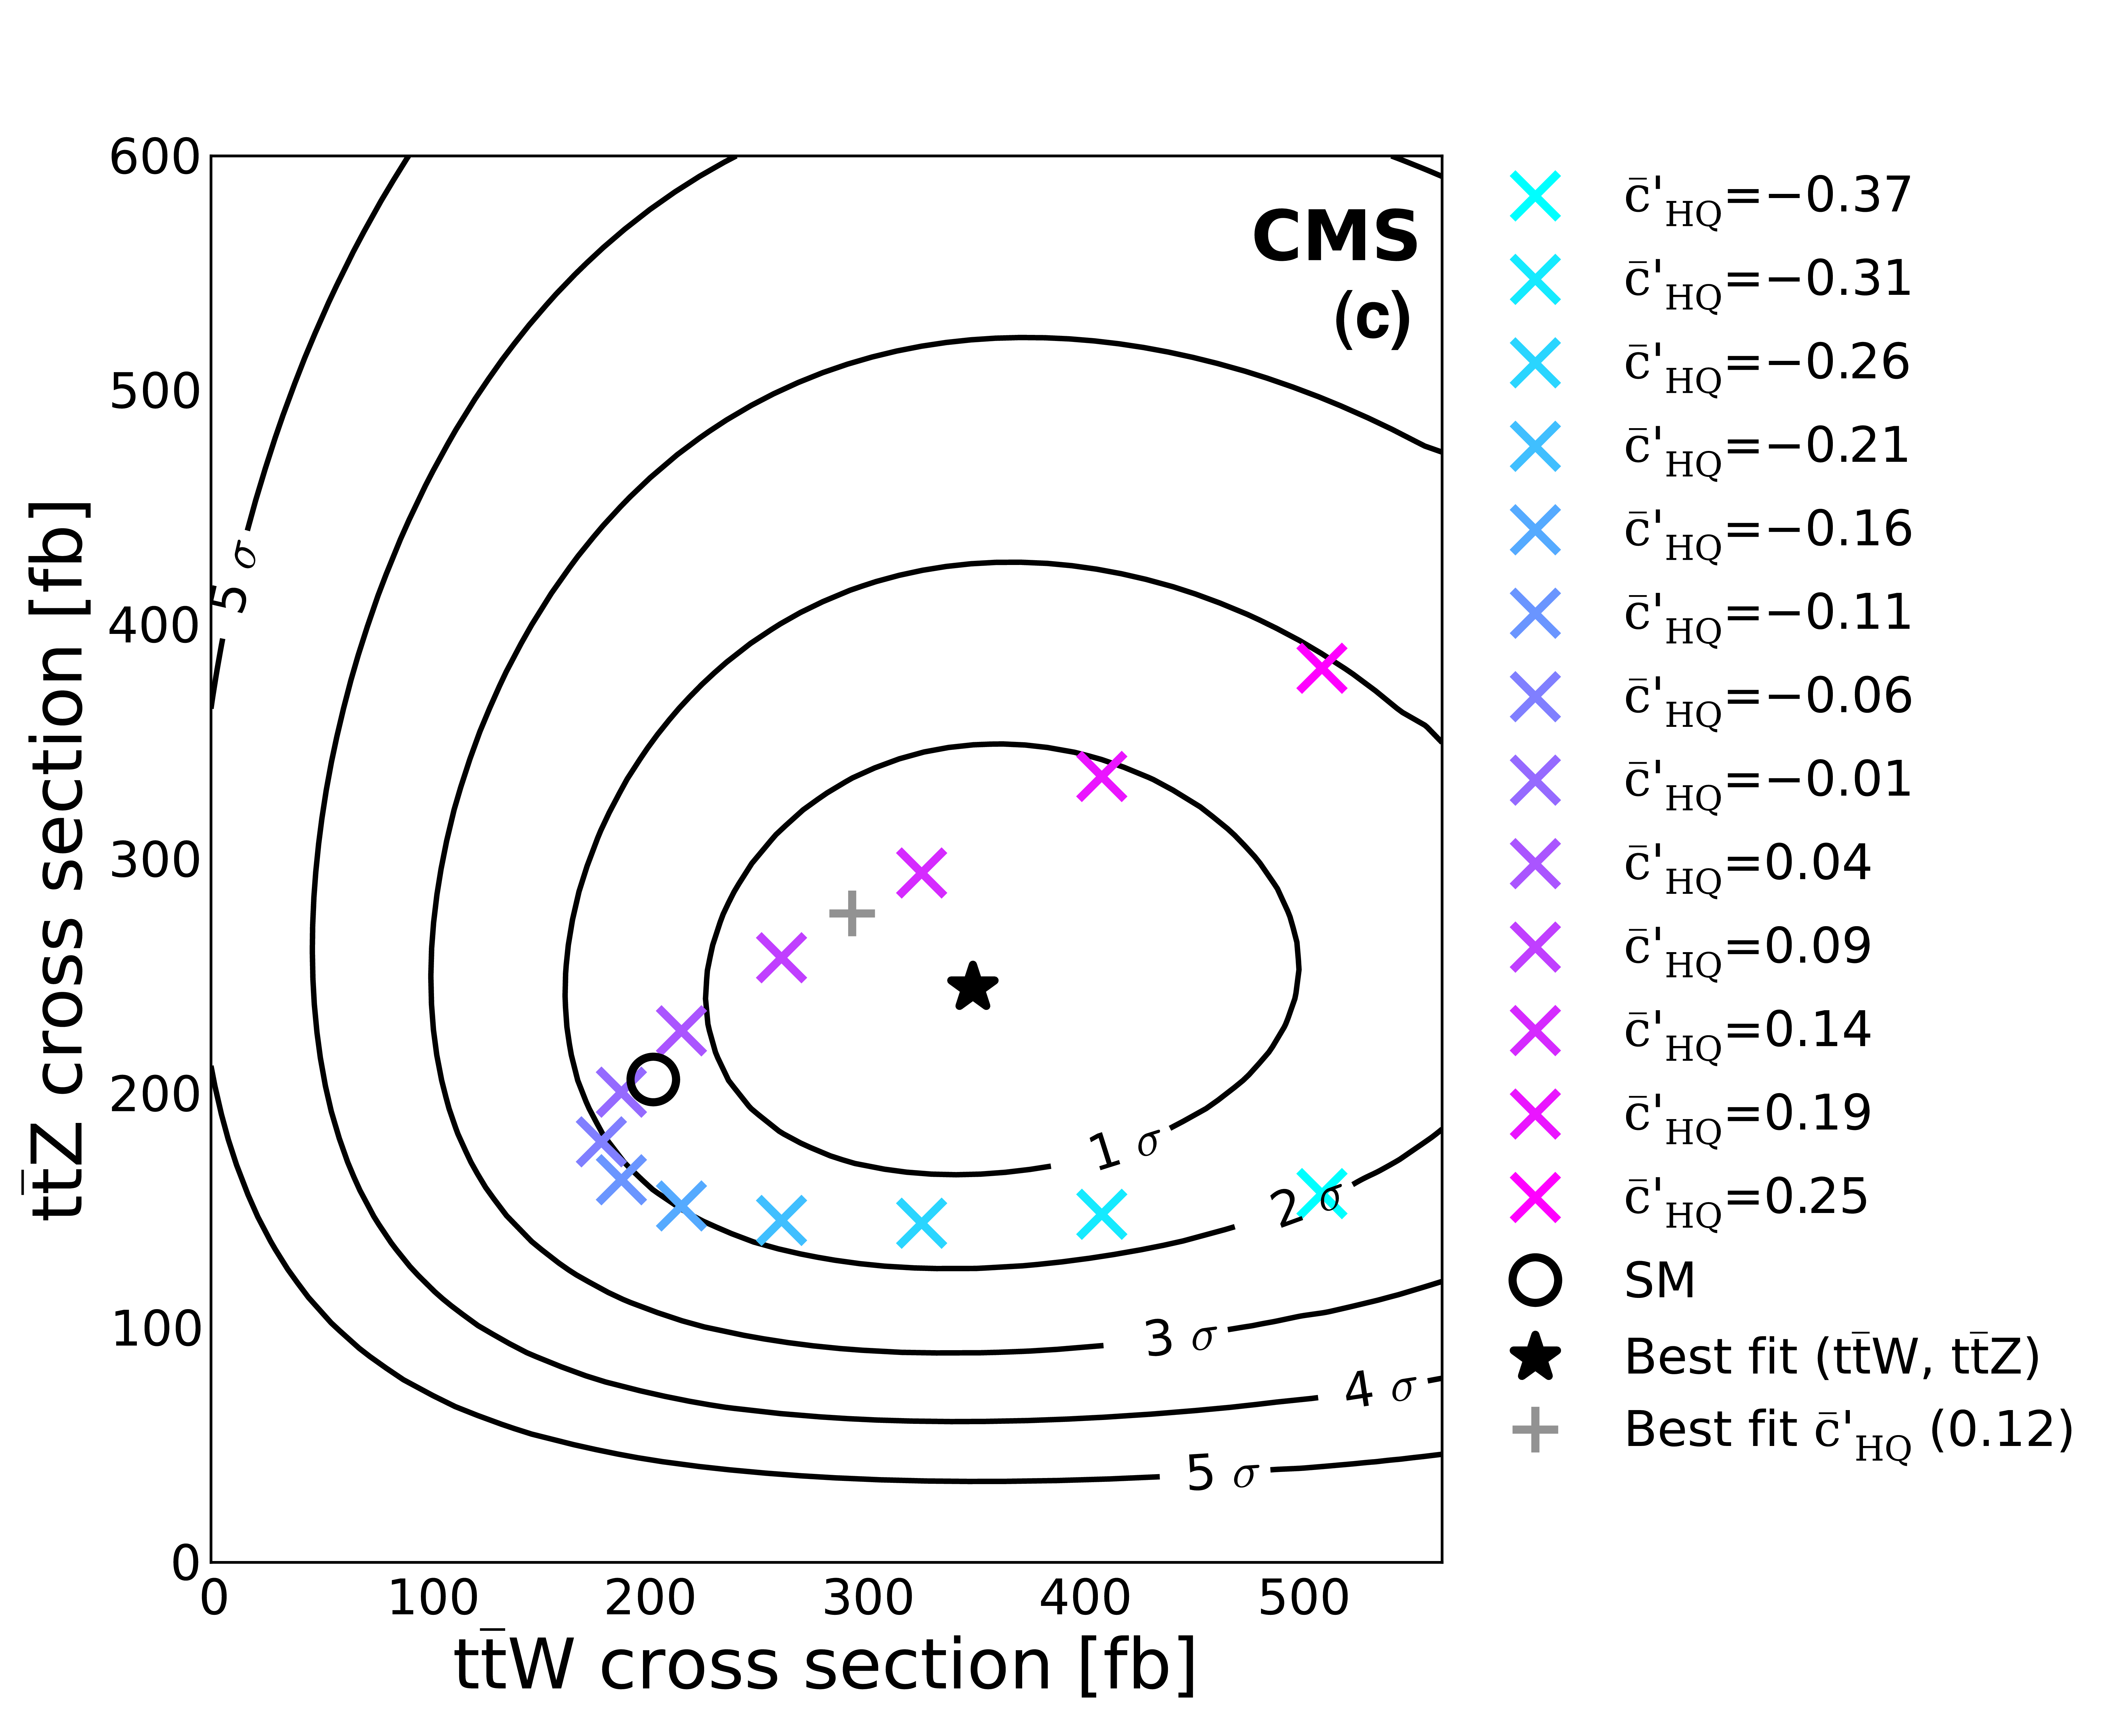
Figure 10-c:
Sampled coefficient values for $\bar{c}_{\mathrm {uB}}$ (a), $\bar{c}_{\mathrm {3W}}$ (b), $\bar{c}'_{\mathrm {HQ}}$ (c), $\bar{c}_{\mathrm {Hu}}$ (d), and $\bar{c}_{\mathrm {HQ}}$ (e), plotted in the ($\sigma ( \mathrm{ t \bar{t} W } )$, $\sigma ( \mathrm{ t \bar{t} Z })$) plane. There are typically two best fit values, one greater and one less than zero, which lie on top of one another in the plane. |
png pdf |
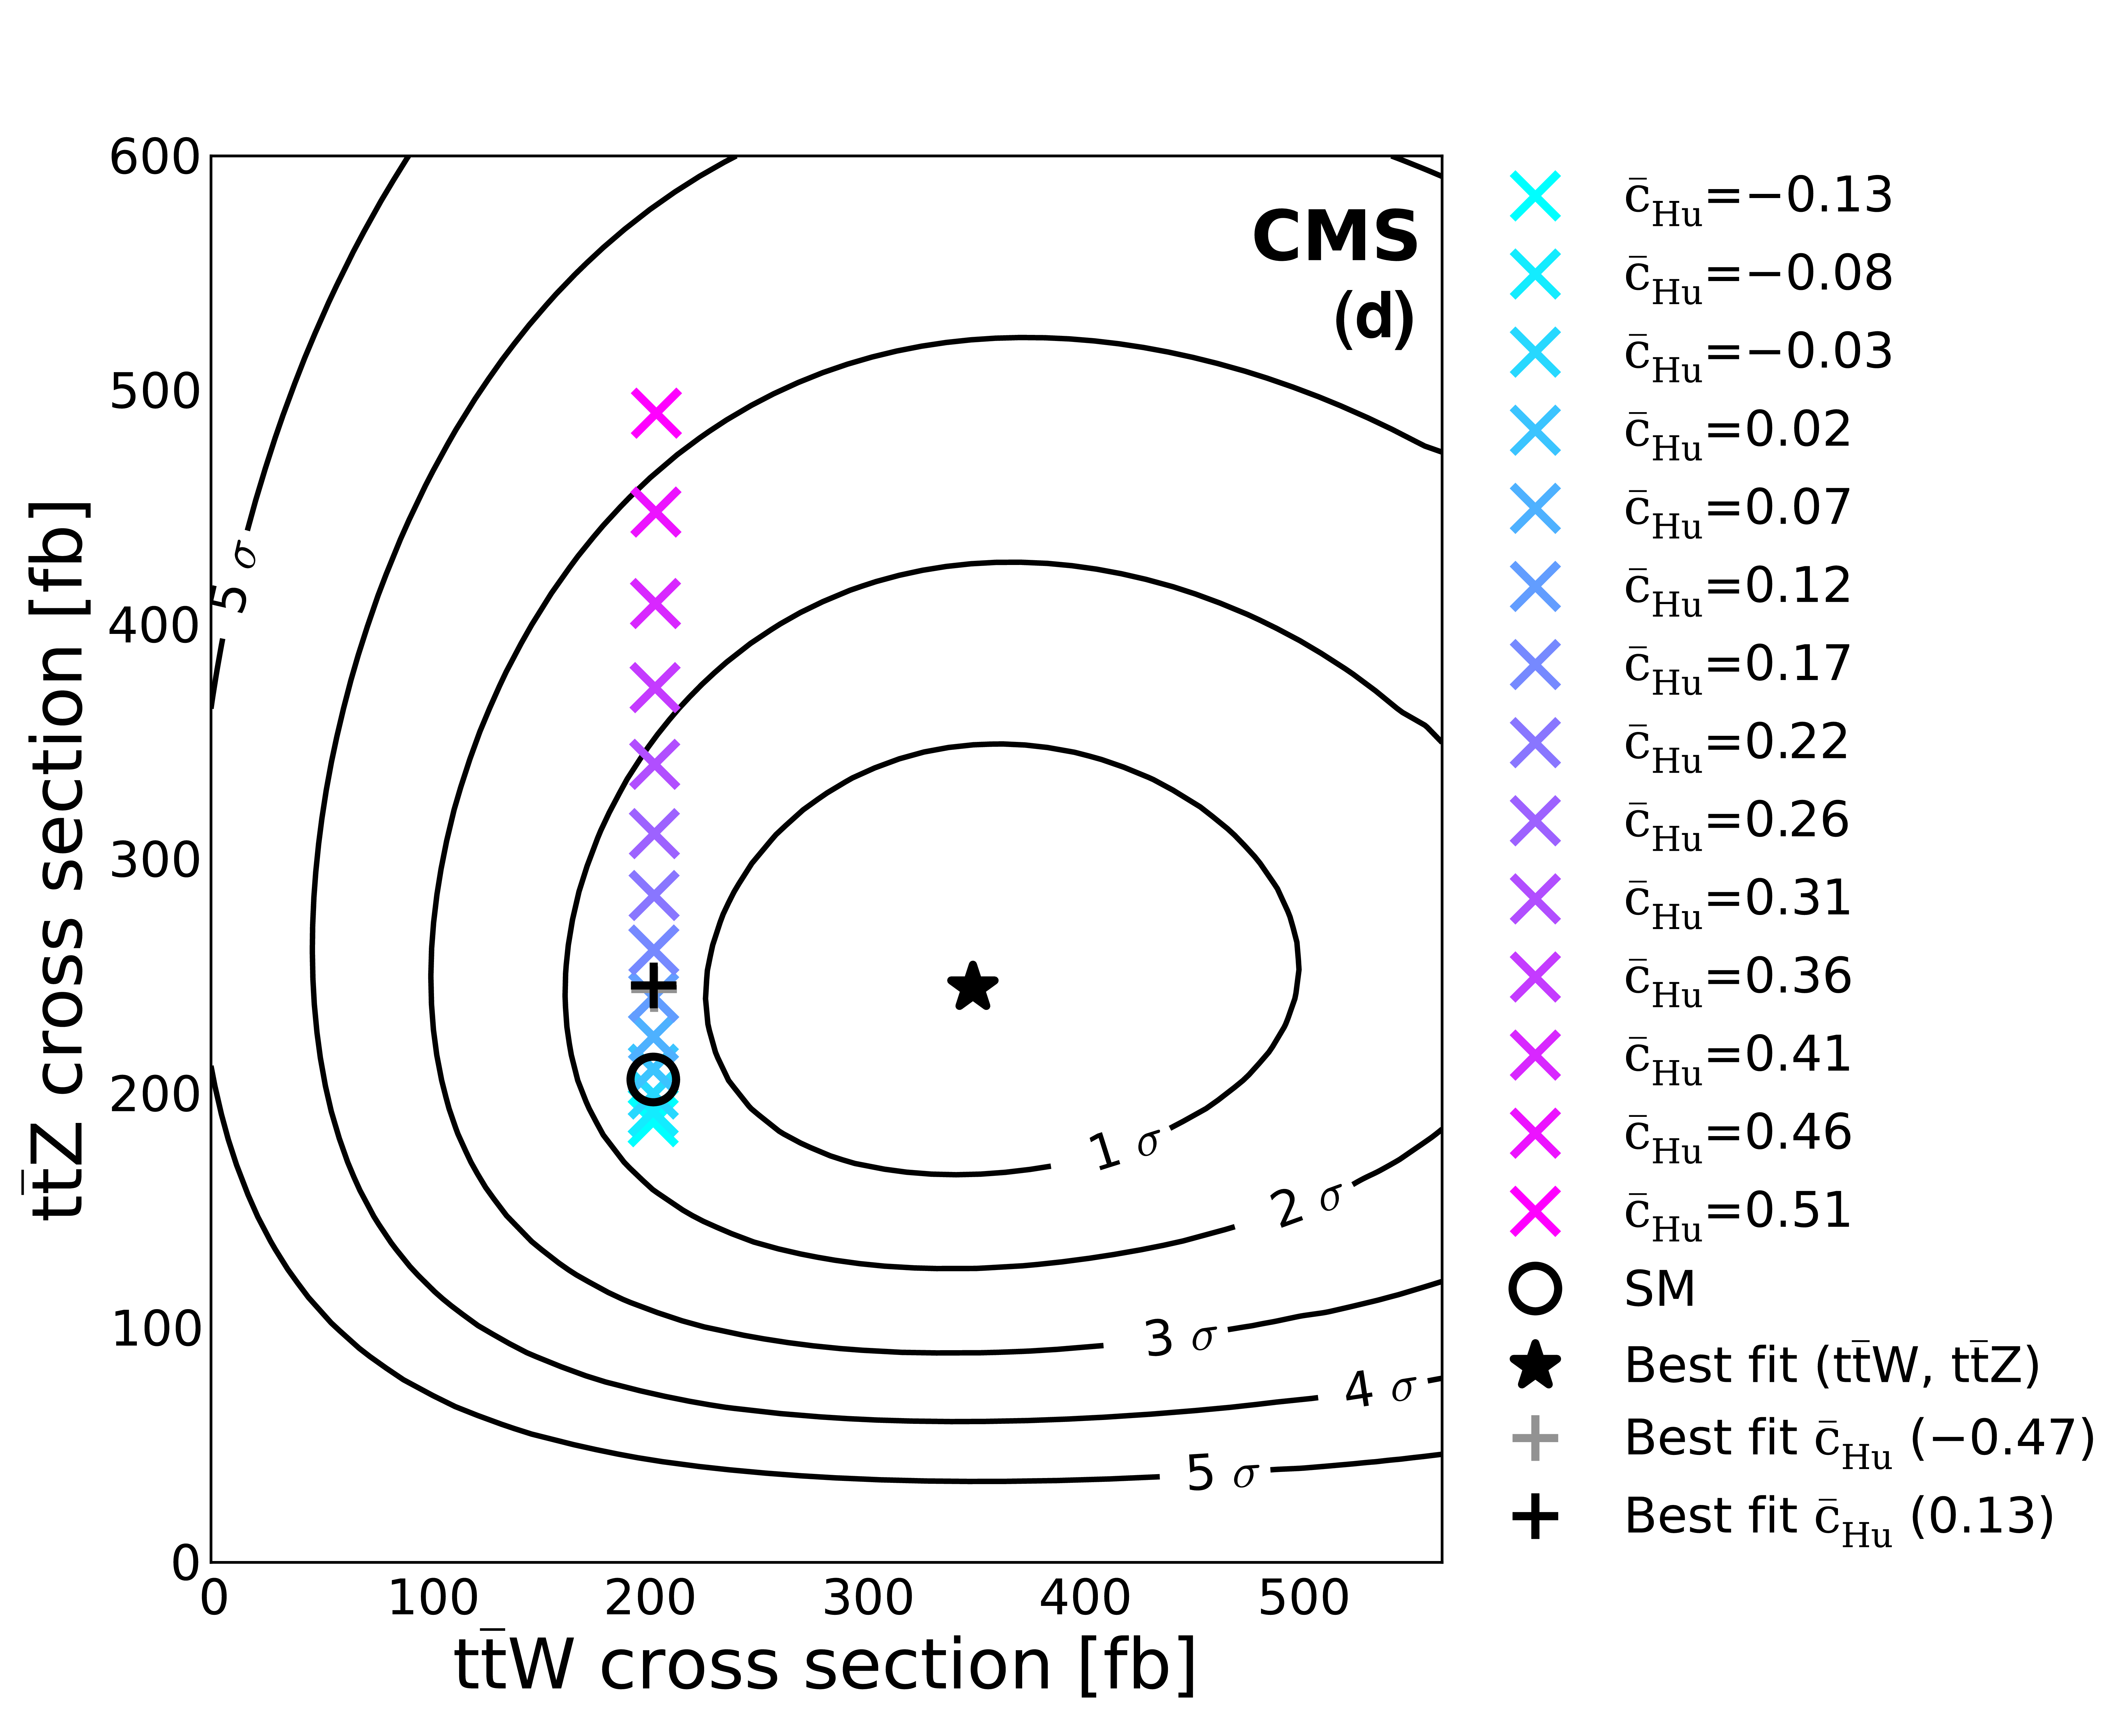
Figure 10-d:
Sampled coefficient values for $\bar{c}_{\mathrm {uB}}$ (a), $\bar{c}_{\mathrm {3W}}$ (b), $\bar{c}'_{\mathrm {HQ}}$ (c), $\bar{c}_{\mathrm {Hu}}$ (d), and $\bar{c}_{\mathrm {HQ}}$ (e), plotted in the ($\sigma ( \mathrm{ t \bar{t} W } )$, $\sigma ( \mathrm{ t \bar{t} Z })$) plane. There are typically two best fit values, one greater and one less than zero, which lie on top of one another in the plane. |
png pdf |
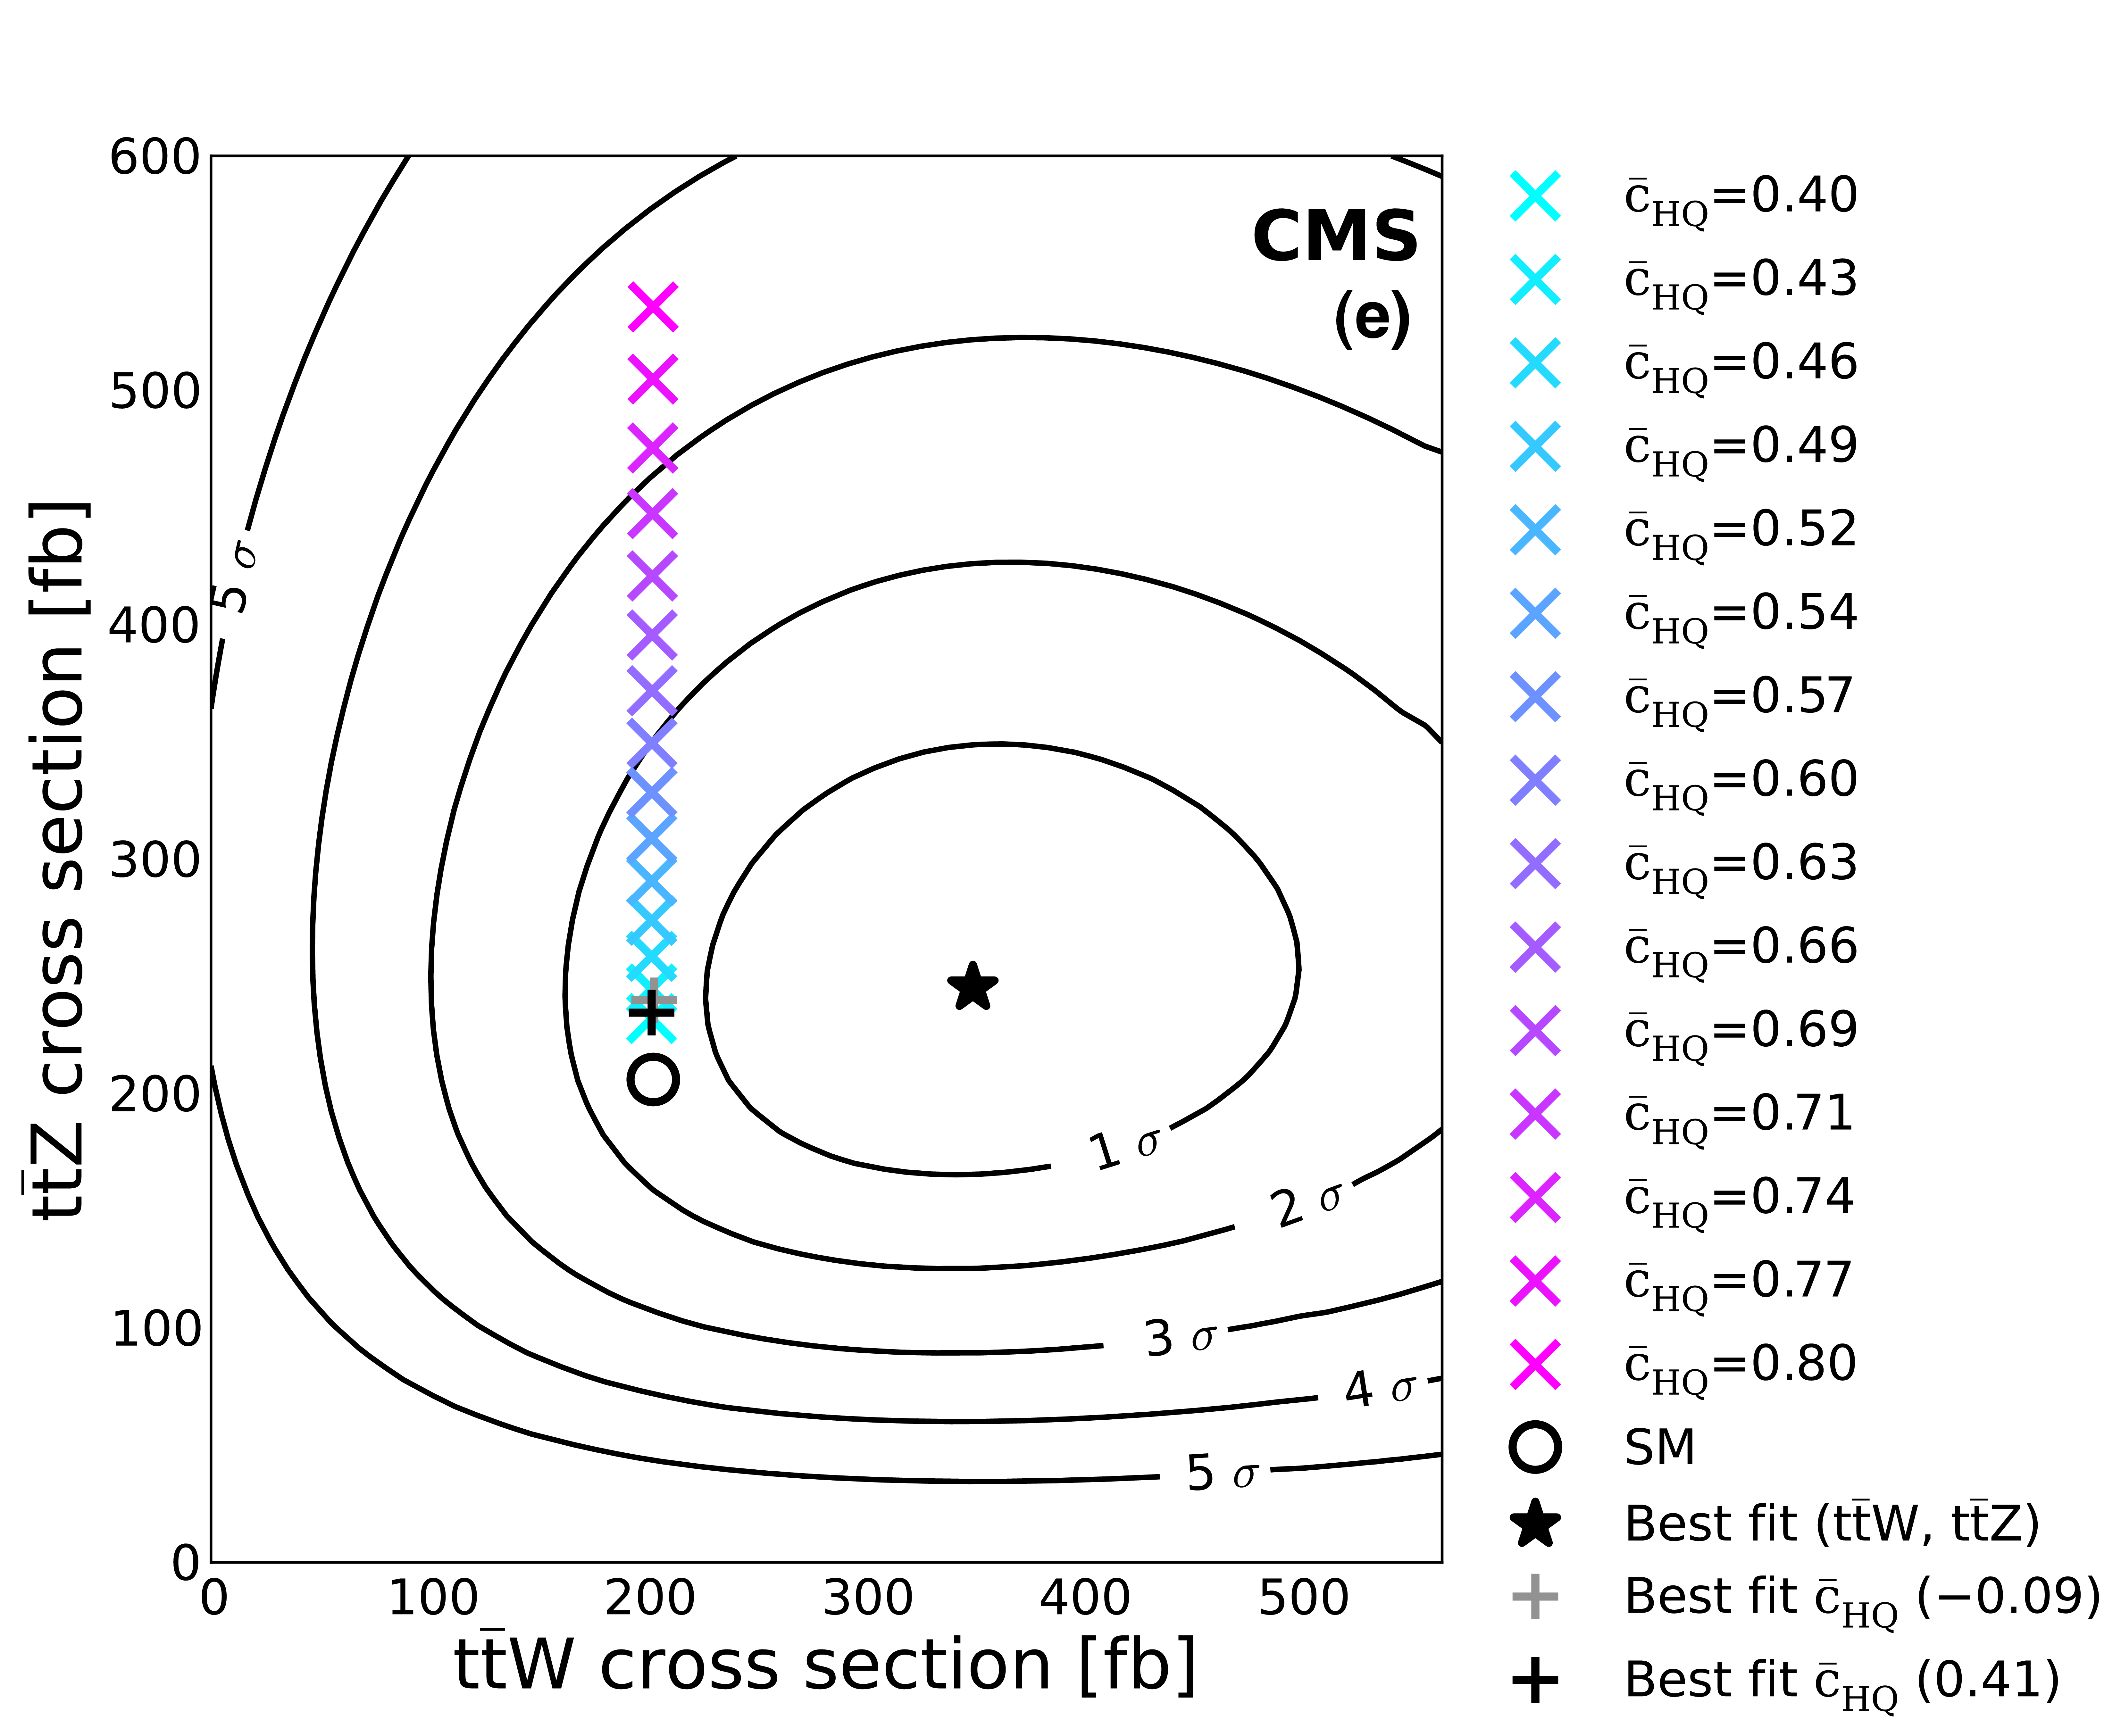
Figure 10-e:
Sampled coefficient values for $\bar{c}_{\mathrm {uB}}$ (a), $\bar{c}_{\mathrm {3W}}$ (b), $\bar{c}'_{\mathrm {HQ}}$ (c), $\bar{c}_{\mathrm {Hu}}$ (d), and $\bar{c}_{\mathrm {HQ}}$ (e), plotted in the ($\sigma ( \mathrm{ t \bar{t} W } )$, $\sigma ( \mathrm{ t \bar{t} Z })$) plane. There are typically two best fit values, one greater and one less than zero, which lie on top of one another in the plane. |
| Tables | |
png pdf |
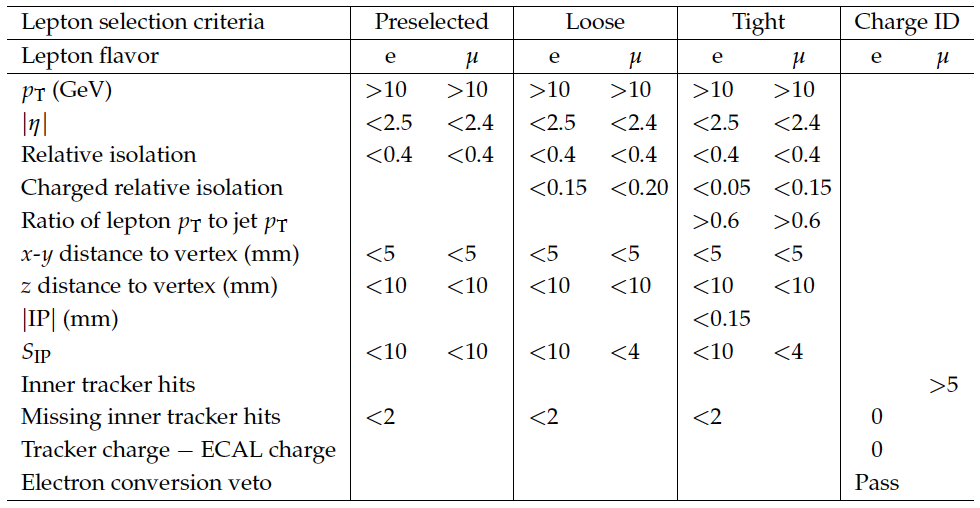
Table 1:
Summary of preselected, loose, tight, and charge ID lepton selection requirements. |
png pdf |
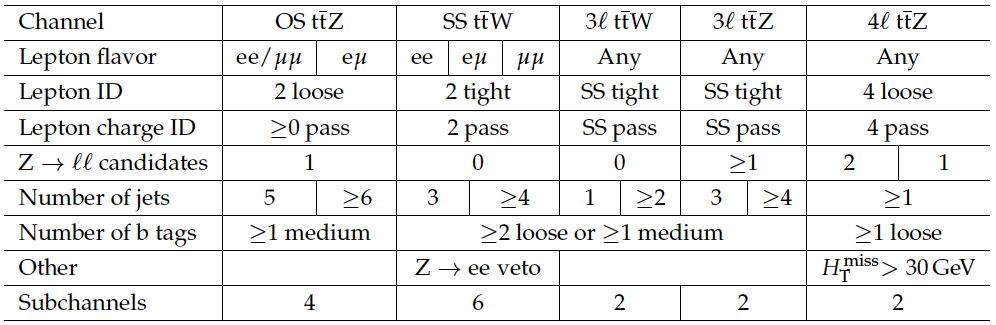
Table 2:
Summary of selection requirements for each channel. |

png pdf |
Table 3:
Expected yields after the final fit described in Section 10, compared to the observed data for OS $ \mathrm{ t \bar{t} Z }$ final states. Here ``hf'' and ``lf'' stand for heavy and light flavors, respectively. |
png pdf |
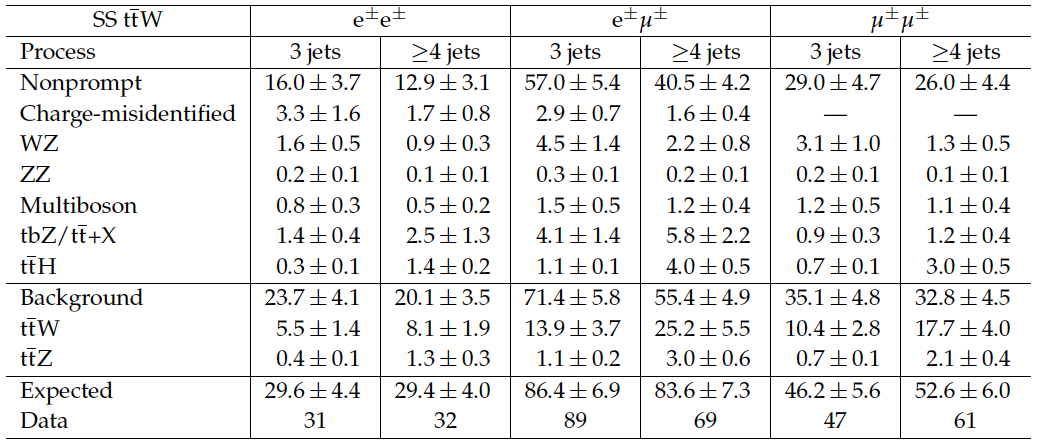
Table 4:
Expected yields after the final fit described in Section 10, compared to the observed data for SS $ \mathrm{ t \bar{t} W }$ final states. The multiboson process includes WWW, WWZ, and $ \mathrm{ W^{\pm} W^{\pm} } $; $ \mathrm{ t \bar{t} } $+X includes $ \mathrm{ t \bar{t} } \gamma $, $ \mathrm{ t \bar{t} } \gamma^{*} $, and $ \mathrm{ t \bar{t} W W } $. |
png pdf |
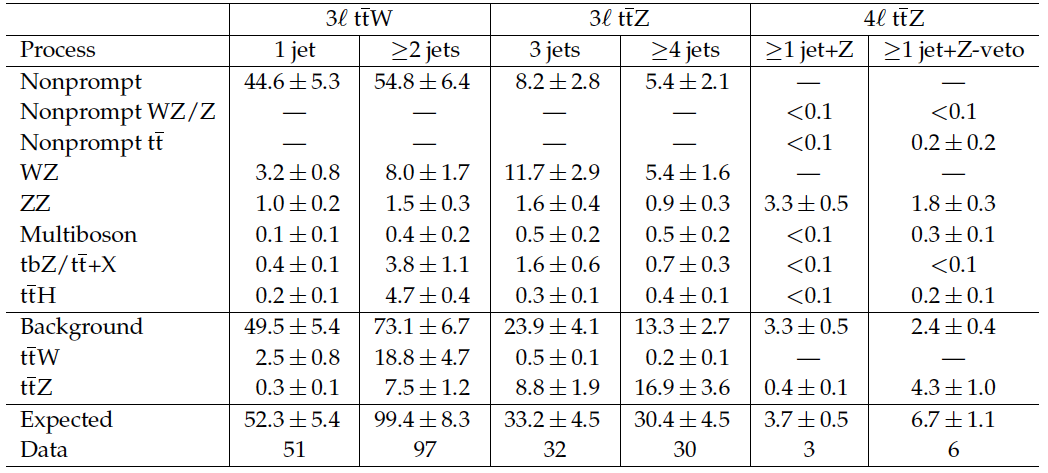
Table 5:
Expected yields after the final fit described in Section 10, compared to the observed data for 3$\ell $ $ \mathrm{ t \bar{t} W }$ and three and 4$\ell $ $ \mathrm{ t \bar{t} Z }$ final states. The 4$\ell $ ``Z-veto'' channel has exactly one lepton pair consistent with a Z boson decay; the ``Z'' channel has two. The multiboson process includes WWW and WWZ; $ \mathrm{ t \bar{t} } $+X includes $ \mathrm{ t \bar{t} } \gamma $, $ \mathrm{ t \bar{t} } \gamma^{*} $, and $ \mathrm{ t \bar{t} W W } $. |
png pdf |
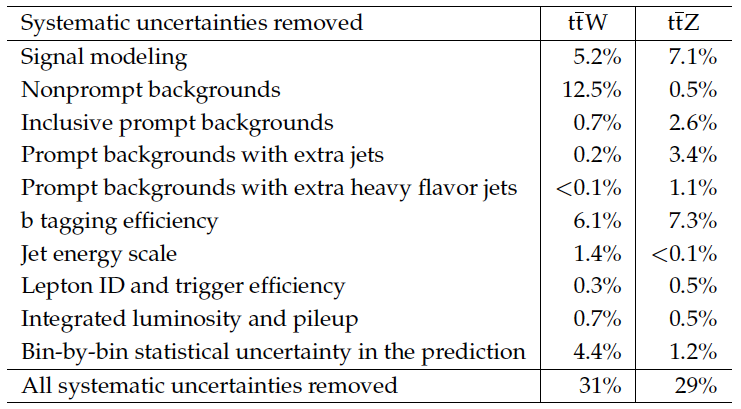
Table 6:
Reduction in the expected signal strength uncertainties produced by removing sets of systematic uncertainties. The quantities in each column are not expected to add in quadrature. |
png pdf |
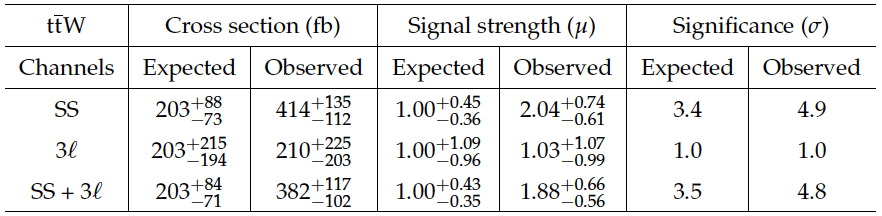
Table 7:
Expected and observed measurements of the cross section and signal strength with 68% CL ranges and significances for $ \mathrm{ t \bar{t} W }$, in SS dilepton and 3$\ell $ channels. |
png pdf |
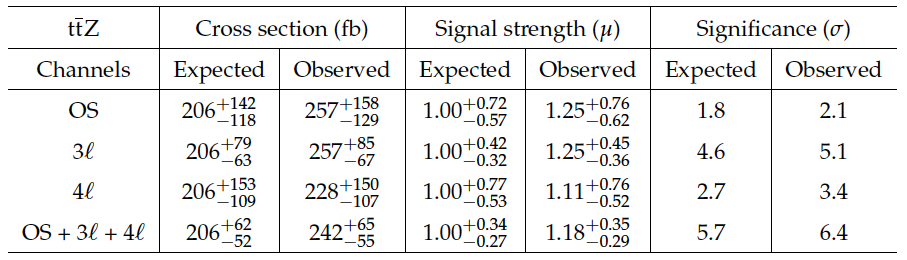
Table 8:
Expected and observed measurements of the cross section and signal strength with 68% CL ranges and significances for $ \mathrm{ t \bar{t} Z }$, in OS dilepton, 3$\ell $, and 4$\ell $ channels. |
png pdf |
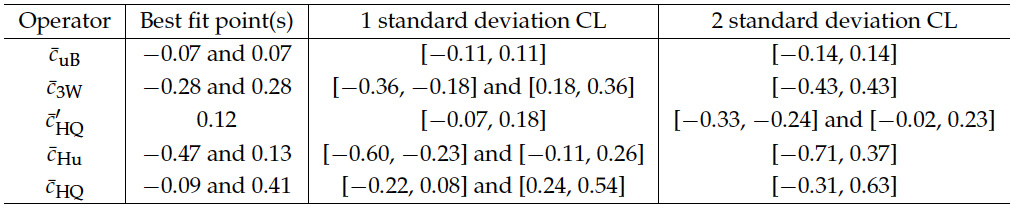
Table 9:
Constraints from this $ \mathrm{ t \bar{t} Z }$ and $ \mathrm{ t \bar{t} W }$ measurement on selected dimension-six operators. |
png pdf |
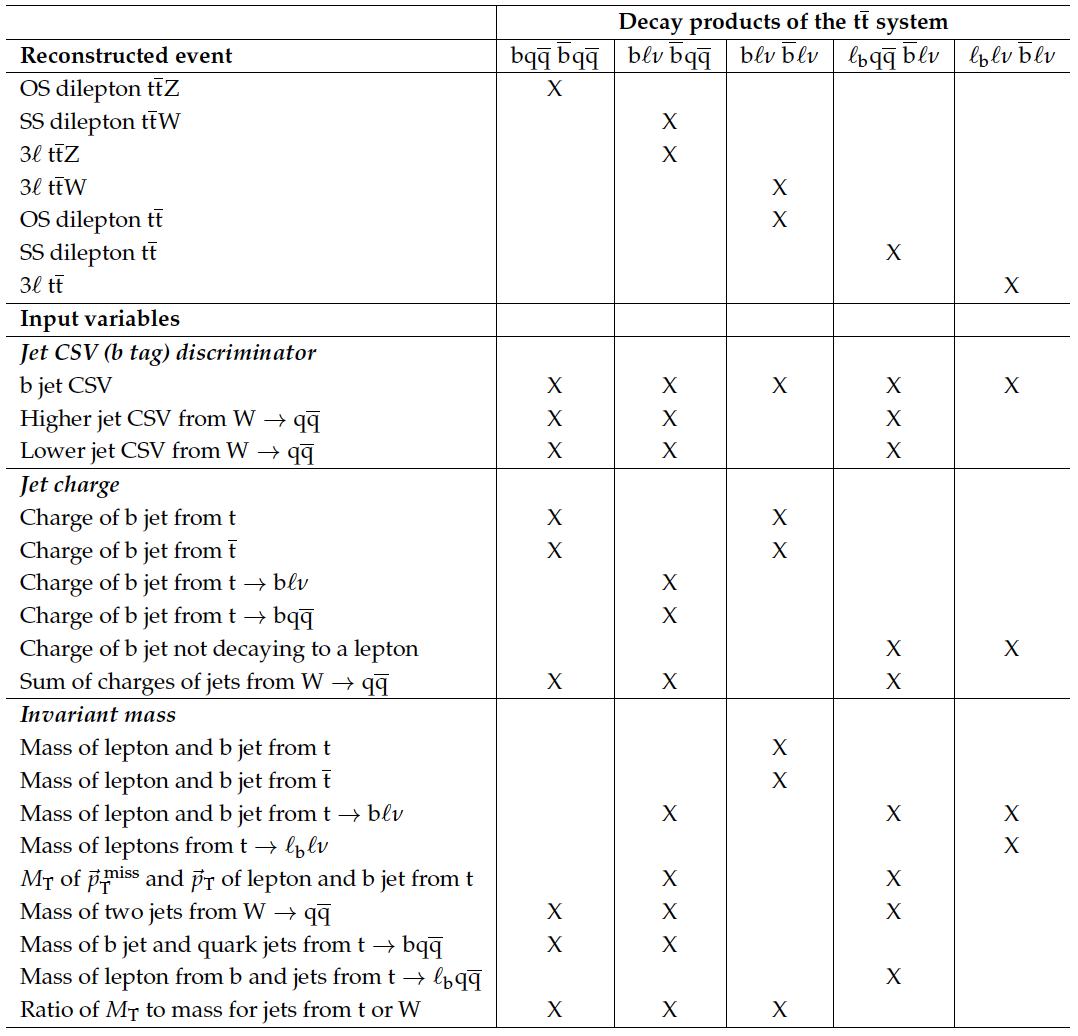
Table 10:
Variables used to match leptons and jets to their parent particles in reconstructing $ \mathrm{ t \bar{t} W }$, $ \mathrm{ t \bar{t} Z }$, and $ \mathrm{ t \bar{t} } $ events. In $ \mathrm{ t \bar{t} Z }$ events, the two leptons matched to the Z boson decay are removed and the remaining $ \mathrm{ t \bar{t} } $ system is reconstructed. In $ \mathrm{ t \bar{t} W }$ events, the $ \mathrm{ t \bar{t} } $ system is reconstructed with the leptons that best match the $ \mathrm{ t \bar{t} } $ decay, and the lepton from the associated W boson (and any variables with $p_\mathrm {T}^\text{miss}$) are not used. In $ \mathrm{ t \bar{t} } $ events, $\ell _{\mathrm{b}} $ denotes a lepton from b-hadron decay. |
png pdf |
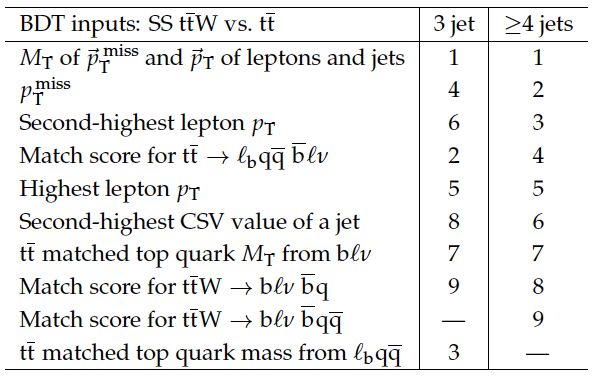
Table 11:
Input variables to the BDT that distinguishes SS $ \mathrm{ t \bar{t} W }$ from $ \mathrm{ t \bar{t} } $, ranked by signal-background separation. |
png pdf |
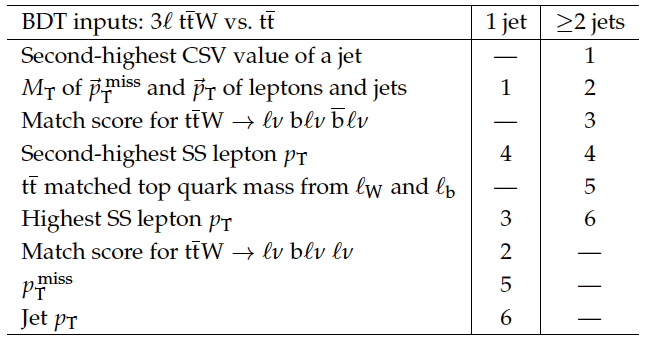
Table 12:
Input variables to BDT that distinguishes 3$\ell $ $ \mathrm{ t \bar{t} W }$ from $ \mathrm{ t \bar{t} } $, ranked by signal-background separation. |
png pdf |
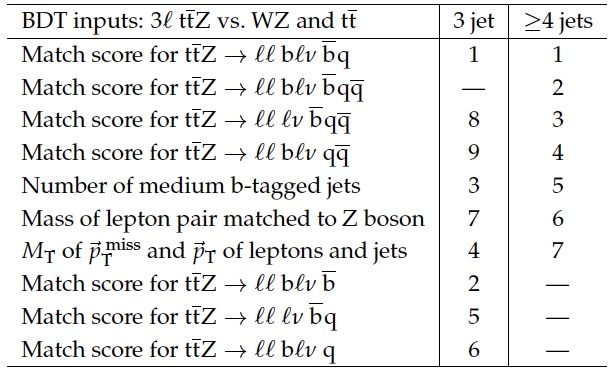
Table 13:
Input variables to BDT that distinguishes 3$\ell $ $ \mathrm{ t \bar{t} Z }$ from WZ and $ \mathrm{ t \bar{t} } $, ranked by signal-background separation. |
png pdf |
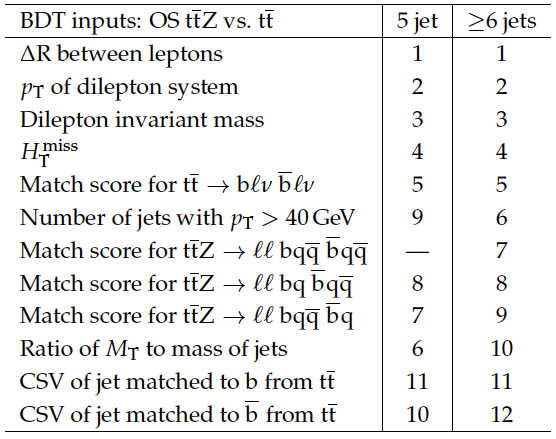
Table 14:
Input variables to BDT that distinguishes OS $ \mathrm{ t \bar{t} Z }$ from $ \mathrm{ t \bar{t} } $ (used as input to the final discriminant), ranked by signal-background separation. |
png pdf |
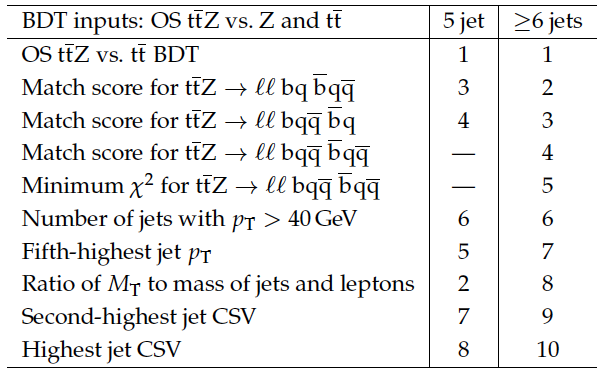
Table 15:
Input variables to BDT that distinguishes OS $ \mathrm{ t \bar{t} Z }$ from Z boson and $ \mathrm{ t \bar{t} } $ (the final discriminant), ranked by signal-background separation. |
| Summary |
| An observation of top quark pairs produced in association with a Z boson and measurements of the $ \mathrm{ t \bar{t} W } $ and $ \mathrm{ t \bar{t} Z } $ cross sections have been made, using 19.5 fb$^{-1}$ of 8 TeV pp collision data collected by the CMS detector at the LHC. Signatures from different decay modes of the top quark pair resulting in final states with two, three, and four leptons have been analyzed. Signal events have been identified by uniquely matching reconstructed leptons and jets to final state particles from $ \mathrm{ t \bar{t} W } $ and $ \mathrm{ t \bar{t} Z } $ decays. Results from two independent $ \mathrm{ t \bar{t} W } $ channels and three $ \mathrm{ t \bar{t} Z } $ channels have been presented, along with combined measurements. The combined $ \mathrm{ t \bar{t} W } $ cross section measurement in same-sign dilepton and three-lepton events is 382$^{+117}_{-102}$ fb, 4.8 standard deviations from the background-only hypothesis, where a significance of 3.5 standard deviations is expected in the standard model. Combining opposite-sign dilepton, three-lepton, and four-lepton channels, the $ \mathrm{ t \bar{t} Z } $ cross section is measured to be 242$^{+65}_{-55}$ fb, an observation with a significance of 6.4 standard deviations from the background-only hypothesis, and in agreement with the standard model expectation. Using the measured cross sections, limits have been placed on the vector and axial couplings of the Z boson to the top quark, and on the Wilson coefficients of five dimension-six operators parameterizing new physics: $\bar{c}_{\mathrm {uB}}$, $\bar{c}'_{\mathrm {HQ}}$, $\bar{c}_{\mathrm {HQ}}$, $\bar{c}_{\mathrm {Hu}}$ (d), and $\bar{c}_{\mathrm {3W}}$. These measurements are compatible with the standard model predictions, and are the most sensitive reported to date to these high mass scale processes. |
|
|
Compact Muon Solenoid LHC, CERN |
|

|

|

|

|

|