Test of lepton universality with $\Lambda^{0}_{b} \to p K^- \ell^+ \ell^-$ decays
[to restricted-access page]Information
LHCb-PAPER-2019-040
CERN-EP-2019-272
arXiv:1912.08139 [PDF]
(Submitted on 17 Dec 2019)
JHEP 05 (2020) 040
Inspire 1771447
Tools
Abstract
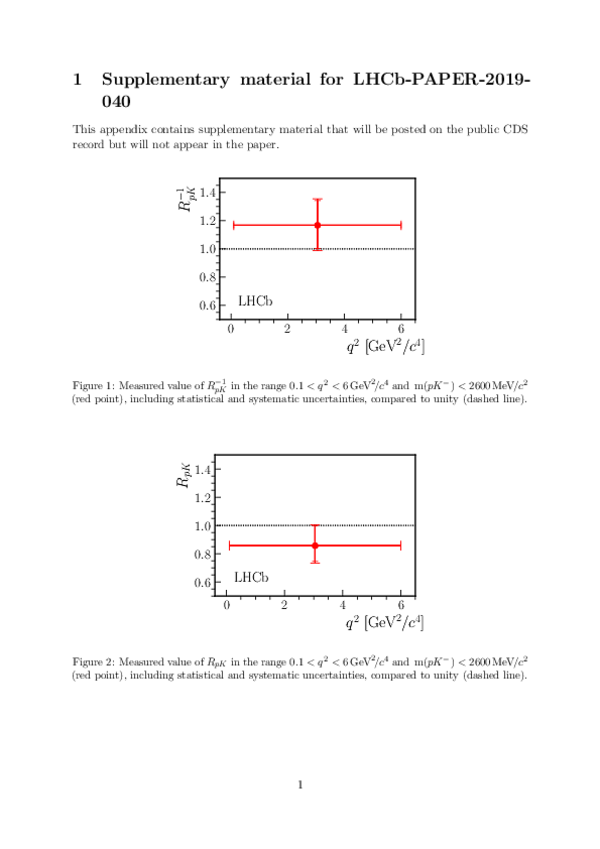
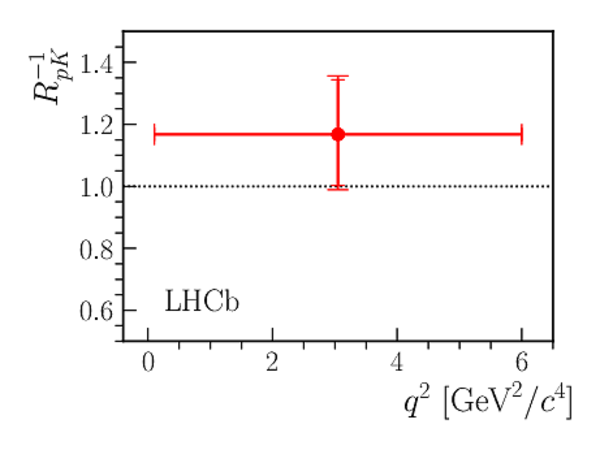
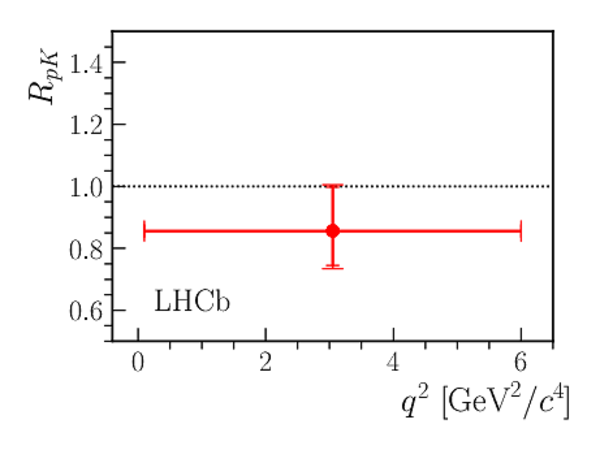
The ratio of branching fractions of the decays $\Lambda^{0}_{b}\to pK^{-}e^{+}e^{-}$ and $\Lambda^{0}_{b}\to pK^{-}\mu^{+}\mu^{-}$, $R^{-1}_{pK}$, is measured for the first time using proton-proton collision data corresponding to an integrated luminosity of 4.7 $fb^{-1}$ recorded with the LHCb experiment at center-of-mass energies of 7, 8 and 13 TeV. In the dilepton mass-squared range $0.1 < q^{2} < 6.0$ $GeV^{2}/c^{4}$ and the $pK^{-}$ mass range $m(pK^{-}) < 2600$ $MeV/c^{2}$, the ratio of branching fractions is measured to be $R^{-1}_{pK} = 1.17 ^{+0.18}_{-0.16} \pm 0.07$, where the first uncertainty is statistical and the second systematic. This is the first test of lepton universality with b baryons and the first observation of the decay $\Lambda^{0}_{b}\to pK^{-}e^{+}e^{-}$.
Figures and captions
|
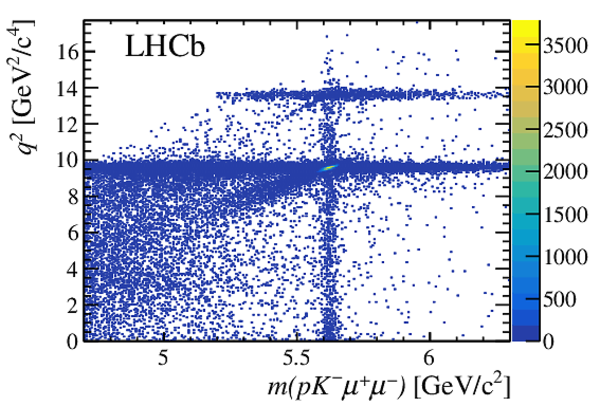
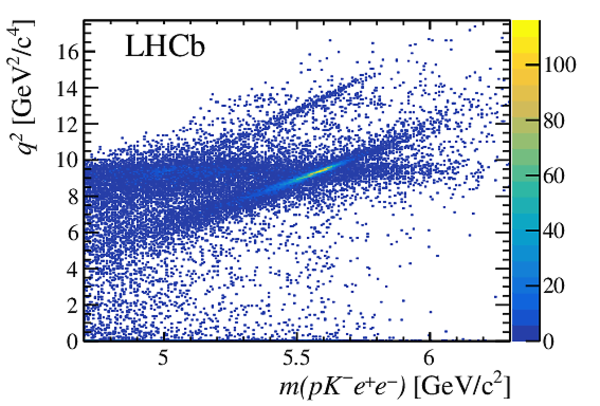
Distributions of dilepton invariant mass squared, $ q^2$ , for $\Lambda ^0_ b $ candidates as a function of $pK^-\ell^+\ell^-$ invariant mass, in data, for (left) $\ell=\mu$ and (right) $\ell=e$. The complete selection is applied to both distributions, except for $ q^2$ and $ m_{\textrm{corr}}$ requirements, defined in Sec. 3. |
Fig1a.pdf [51 KiB] HiDef png [1 MiB] Thumbnail [510 KiB] *.C file |
|
|
Fig1b.pdf [55 KiB] HiDef png [1020 KiB] Thumbnail [496 KiB] *.C file |
|
|
|
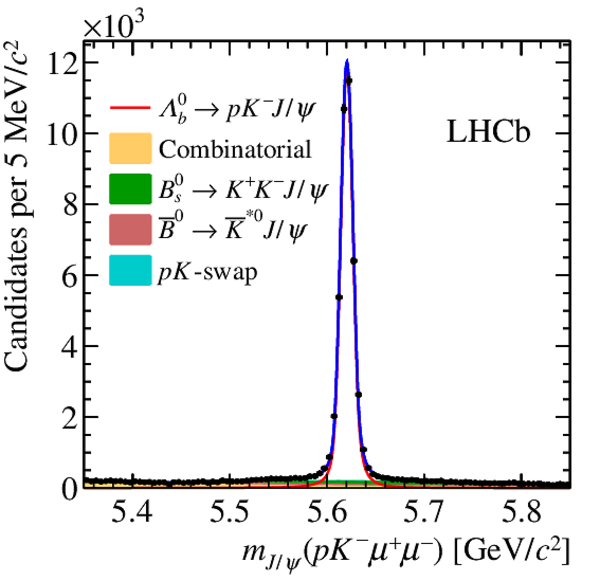
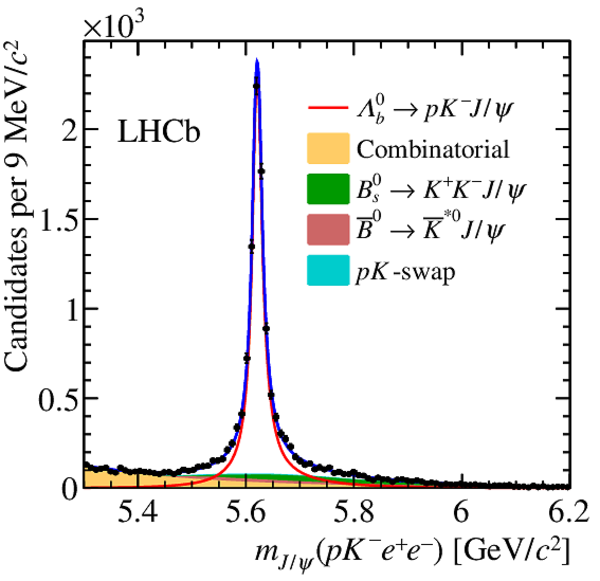
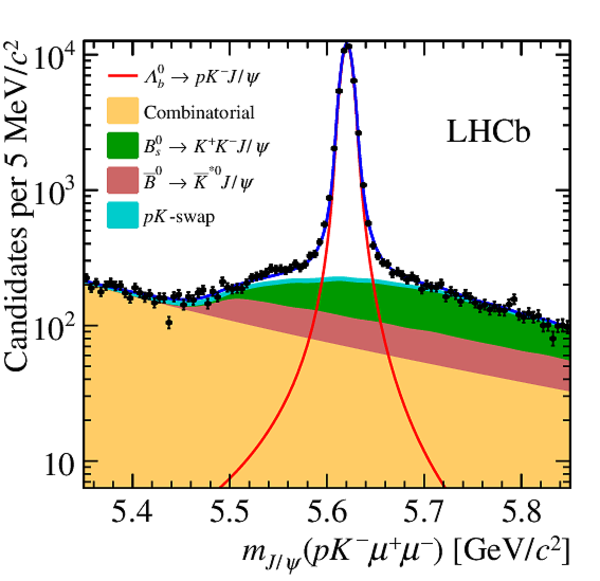
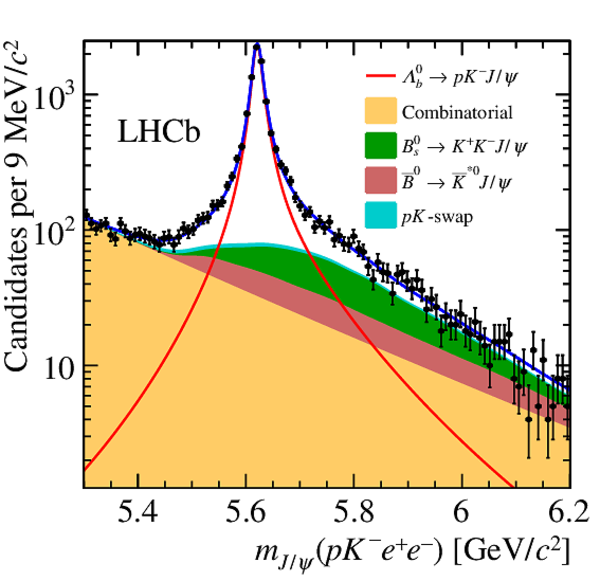
Invariant-mass distribution, with the $ { J \mskip -3mu/\mskip -2mu\psi }$ mass constraint applied, of $\Lambda ^0_ b \rightarrow p K ^- { J \mskip -3mu/\mskip -2mu\psi } ( \rightarrow \mu ^+\mu ^- )$ (left) and $\Lambda ^0_ b \rightarrow p K ^- { J \mskip -3mu/\mskip -2mu\psi } (\rightarrow e ^+ e ^- )$ (right) candidates, summed over trigger and data-taking categories. The black points represent the data, while the solid blue curve shows the sum of the fit to the different categories. The signal component is represented by the red curve and the shaded shapes are the background components, as detailed in the legend. |
Fig2a.pdf [38 KiB] HiDef png [267 KiB] Thumbnail [214 KiB] *.C file |
|
|
Fig2b.pdf [37 KiB] HiDef png [281 KiB] Thumbnail [222 KiB] *.C file |
|
|
|
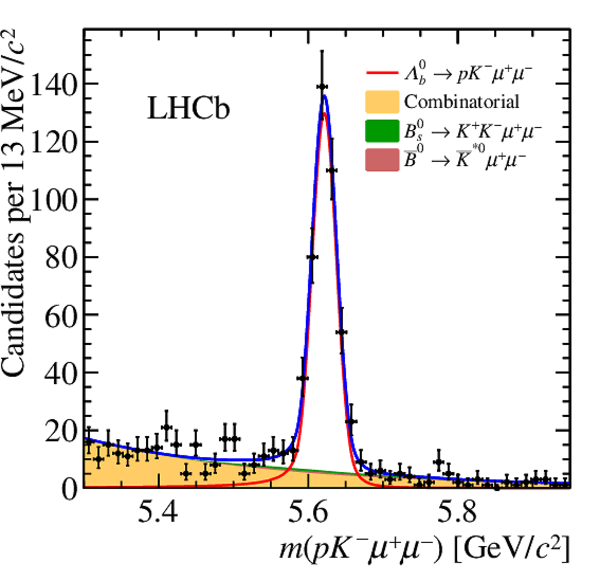
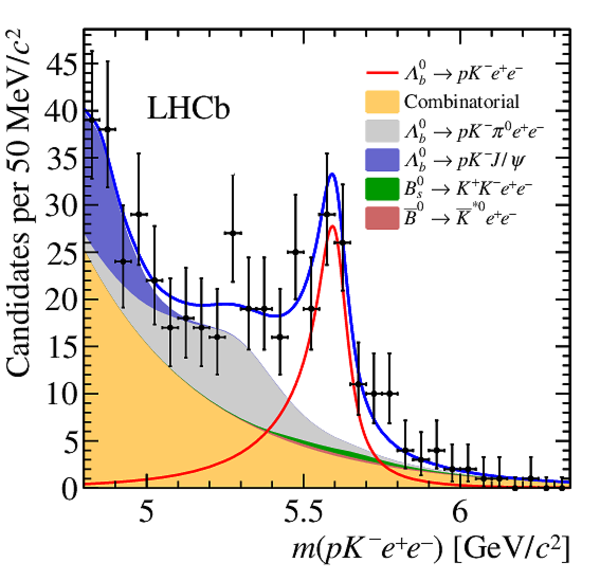
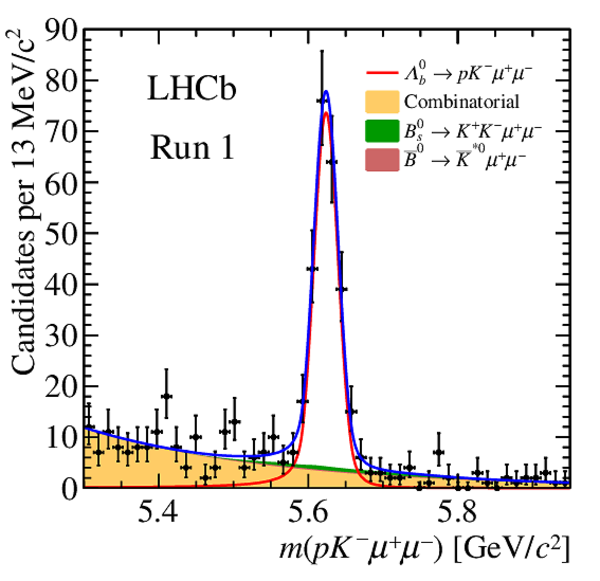
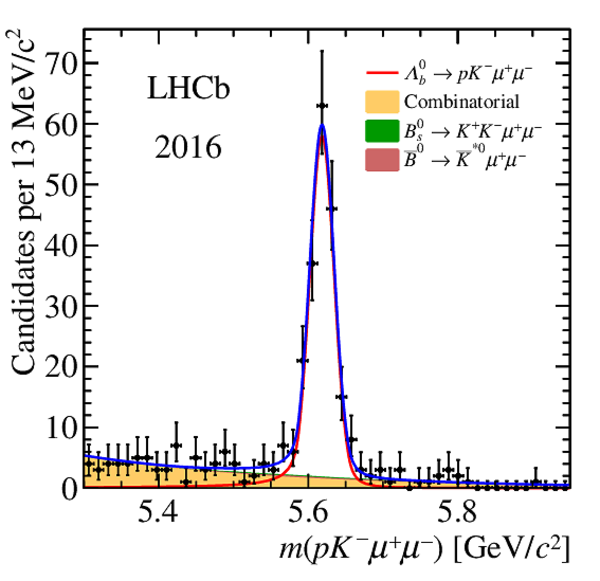
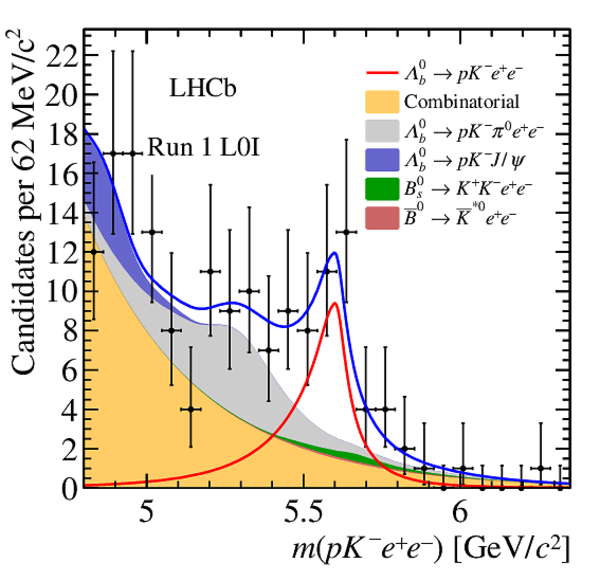
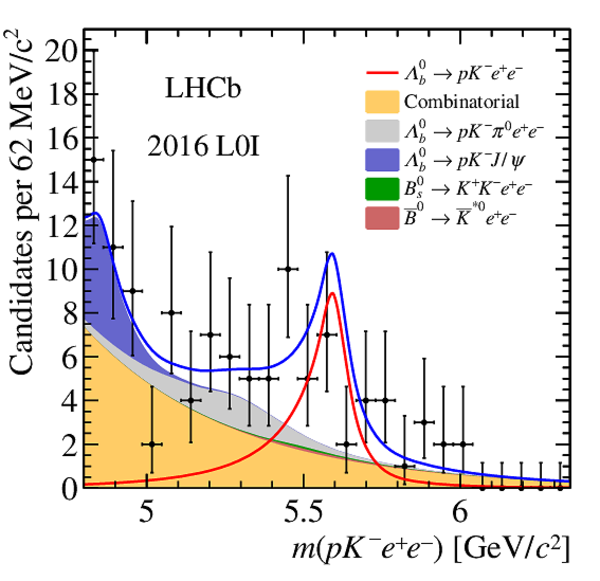
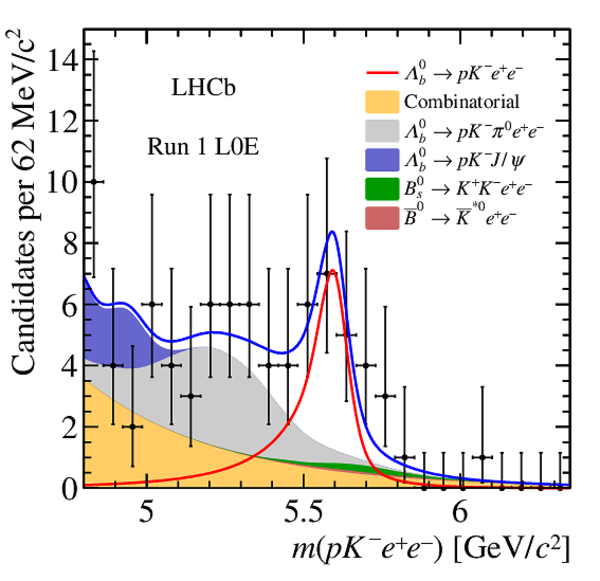
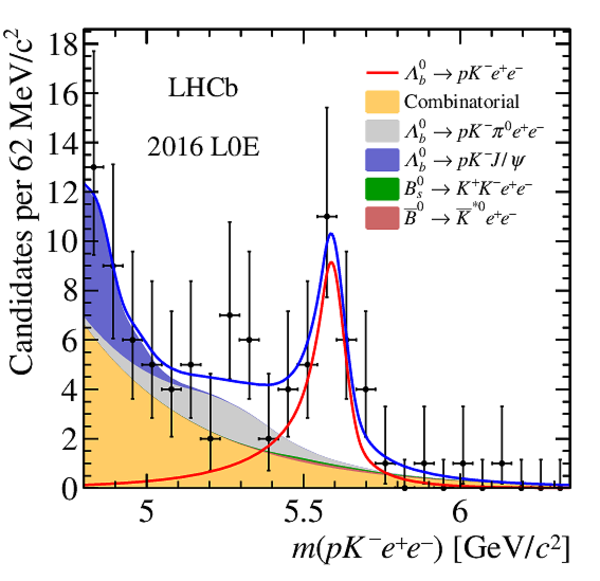
Invariant-mass distribution of (left) $\Lambda ^0_ b \rightarrow p K ^- \mu ^+\mu ^- $ and (right) $\Lambda ^0_ b \rightarrow p K ^- e ^+ e ^- $ candidates summed over trigger and data-taking categories. The black points represent the data, while the solid blue curve shows the total PDF. The signal component is represented by the red curve and the combinatorial, $\overline{ B } {}^0 \rightarrow \overline{ K } {}^{*0} \ell^+ \ell^- $ and $ B ^0_ s \rightarrow K^{+} K^{-} \ell^+ \ell^- $ components by yellow, brown and green filled histograms. In the electron model, the grey and blue filled histograms represent the partially reconstructed and $\Lambda ^0_ b \rightarrow p K ^- { J \mskip -3mu/\mskip -2mu\psi } (\rightarrow e ^+ e ^- )$ backgrounds. |
Fig3a.pdf [22 KiB] HiDef png [311 KiB] Thumbnail [240 KiB] *.C file |
|
|
Fig3b.pdf [21 KiB] HiDef png [388 KiB] Thumbnail [308 KiB] *.C file |
|
|
|
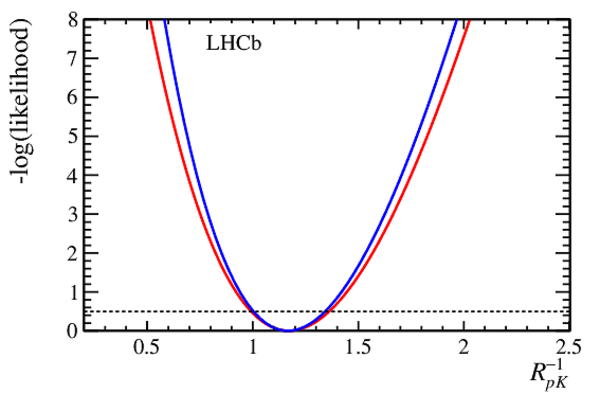
Logarithm of the profile likelihood of the $ R_{ p K }^{-1}$ parameter in blue (red) including only statistical (total) uncertainty. The dashed line indicates the one standard deviation interval. |
Fig4.pdf [16 KiB] HiDef png [146 KiB] Thumbnail [129 KiB] *.C file |
|
|
Animated gif made out of all figures. |
PAPER-2019-040.gif Thumbnail |

|
Tables and captions
|
Resonant and nonresonant mode $ q^2$ and $ p K ^-\ell^+ \ell^- $ invariant-mass ranges. For the resonant modes, the four-body invariant mass is computed with a $ { J \mskip -3mu/\mskip -2mu\psi }$ mass constraint on the dilepton system. |
Table_1.pdf [70 KiB] HiDef png [39 KiB] Thumbnail [18 KiB] tex code |

|
|
Systematic uncertainties in percent associated to the ratio of branching fractions, $r_{\mathcal{B} }$, for the different data taking periods. For uncertainties that are correlated between data taking periods, a single value is given. |
Table_3.pdf [40 KiB] HiDef png [60 KiB] Thumbnail [28 KiB] tex code |

|
|
Systematic uncertainties in percent associated to the measurement of $ R_{ p K }^{-1}$ , for the different data taking periods and trigger categories. For uncertainties that are correlated between data taking periods and categories, a single value is given. |
Table_4.pdf [49 KiB] HiDef png [46 KiB] Thumbnail [20 KiB] tex code |

|
Supplementary Material [file]
![HiDef png [1 MiB]](Directory_LHCb-PAPER-2019-040/hidef_Fig1a.png)
![HiDef png [1020 KiB]](Directory_LHCb-PAPER-2019-040/hidef_Fig1b.png)
![HiDef png [267 KiB]](Directory_LHCb-PAPER-2019-040/hidef_Fig2a.png)
![HiDef png [281 KiB]](Directory_LHCb-PAPER-2019-040/hidef_Fig2b.png)
![HiDef png [311 KiB]](Directory_LHCb-PAPER-2019-040/hidef_Fig3a.png)
![HiDef png [388 KiB]](Directory_LHCb-PAPER-2019-040/hidef_Fig3b.png)
![HiDef png [146 KiB]](Directory_LHCb-PAPER-2019-040/hidef_Fig4.png)
![HiDef png [39 KiB]](Directory_LHCb-PAPER-2019-040/hidef_Table_1.png)
![HiDef png [60 KiB]](Directory_LHCb-PAPER-2019-040/hidef_Table_3.png)
![HiDef png [46 KiB]](Directory_LHCb-PAPER-2019-040/hidef_Table_4.png)
![HiDef png [83 KiB]](Directory_LHCb-PAPER-2019-040/supplementary/hidef_Fig10.png)
![HiDef png [69 KiB]](Directory_LHCb-PAPER-2019-040/supplementary/hidef_Fig11.png)
![HiDef png [65 KiB]](Directory_LHCb-PAPER-2019-040/supplementary/hidef_Fig12.png)
![HiDef png [102 KiB]](Directory_LHCb-PAPER-2019-040/supplementary/hidef_Fig13.png)
![HiDef png [73 KiB]](Directory_LHCb-PAPER-2019-040/supplementary/hidef_Fig5.png)
![HiDef png [72 KiB]](Directory_LHCb-PAPER-2019-040/supplementary/hidef_Fig6.png)
![HiDef png [336 KiB]](Directory_LHCb-PAPER-2019-040/supplementary/hidef_Fig7a.png)
![HiDef png [304 KiB]](Directory_LHCb-PAPER-2019-040/supplementary/hidef_Fig7b.png)
![HiDef png [384 KiB]](Directory_LHCb-PAPER-2019-040/supplementary/hidef_Fig7c.png)
![HiDef png [364 KiB]](Directory_LHCb-PAPER-2019-040/supplementary/hidef_Fig7d.png)
![HiDef png [345 KiB]](Directory_LHCb-PAPER-2019-040/supplementary/hidef_Fig7e.png)
![HiDef png [362 KiB]](Directory_LHCb-PAPER-2019-040/supplementary/hidef_Fig7f.png)
![HiDef png [342 KiB]](Directory_LHCb-PAPER-2019-040/supplementary/hidef_Fig8a.png)
![HiDef png [381 KiB]](Directory_LHCb-PAPER-2019-040/supplementary/hidef_Fig8b.png)
![HiDef png [74 KiB]](Directory_LHCb-PAPER-2019-040/supplementary/hidef_Fig9.png)
Created on 20 April 2024.