Information
LHCb-PAPER-2022-023
CERN-EP-2022-193
arXiv:2210.14945 [PDF]
(Submitted on 26 Oct 2022)
JHEP 07 (2023) 119
Inspire 2172077
Tools
Abstract
The first observation of the $B^0_s \to D^{*+}D^{*-}$ decay and the measurement of its branching ratio relative to the $B^0 \to D^{*+}D^{*-}$ decay are presented. The data sample used corresponds to an integrated luminosity of $9 \text{fb}^{-1}$ of proton-proton collisions recorded by the LHCb experiment at centre-of-mass energies of 7, 8 and $13 \text{TeV}$ between 2011 and 2018. The decay is observed with more than $10$ standard deviations and the time-integrated ratio of branching fractions is determined to be \begin{align*} \frac{\mathcal{B}(B^0_s \to D^{*+}D^{*-})}{\mathcal{B}(B^0 \to D^{*+}D^{*-})} = 0.269 \pm 0.032 \pm 0.011 \pm 0.008 , \end{align*} where the first uncertainty is statistical, the second systematic and the third due to the uncertainty of the fragmentation fraction ratio $f_s/f_d$. The $B^0_s \to D^{*+}D^{*-}$ branching fraction is calculated to be \begin{align*} \mathcal{B}(B^0_s \to D^{*+}D^{*-}) = (2.15 \pm 0.26 \pm 0.09 \pm 0.06 \pm 0.16)\times 10^{-4} , \end{align*} where the fourth uncertainty is due to the $B^0 \to D^{*+}D^{*-}$branching fraction. These results are calculated using the average $B^0_s$ meson lifetime in simulation. Correction factors are reported for scenarios where either a purely heavy or a purely light $B^0_s$ eigenstate is considered.
Figures and captions
|
Dominant Feynman diagrams for $ B \rightarrow D D $ decays comprising (top left) tree, (top right) penguin, (bottom left) $ W $ -exchange and (bottom right) penguin-annihilation transitions. The $ B ^0_ s \rightarrow D ^{*+} D ^{*-} $ decay can only occur via the $ W $ -exchange or penguin-annihilation diagram. |
Figure1a.pdf [35 KiB] HiDef png [26 KiB] Thumbnail [12 KiB] *.C file |

|
|
Figure1b.pdf [45 KiB] HiDef png [30 KiB] Thumbnail [15 KiB] *.C file |

|
|
|
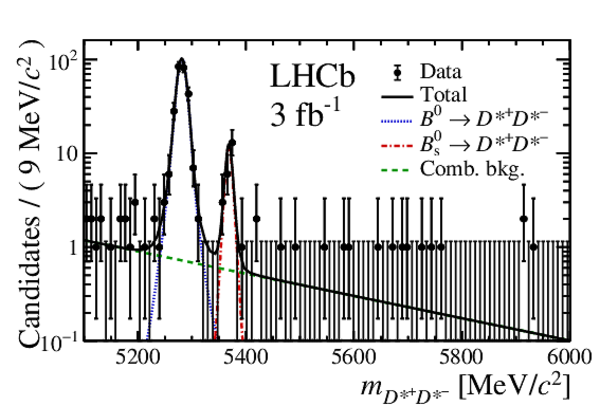
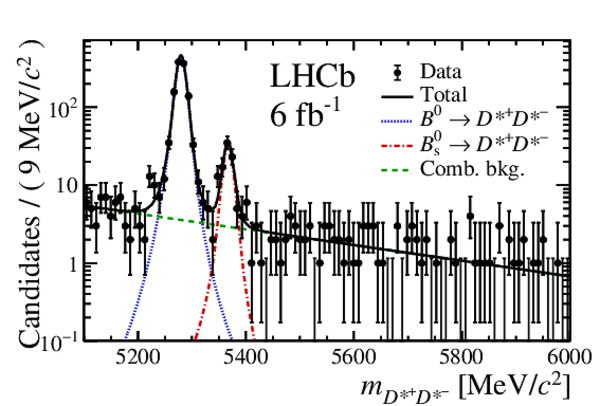
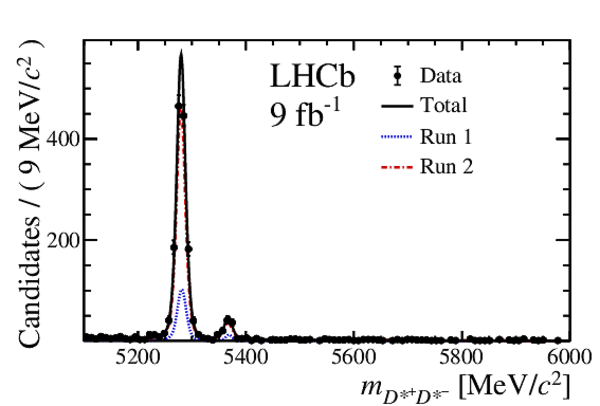
Distributions of the $ D ^{*+}$ $ D ^{*-}$ mass for (left) Run 1 and (right) Run 2 data samples, with the fit results overlaid. In addition to the full fit result (solid black), each of the individual components are shown: the $ B ^0 \rightarrow D ^{*+} D ^{*-} $ signal (dotted blue), the $ B ^0_ s \rightarrow D ^{*+} D ^{*-} $ signal (dash-dotted red) and the combinatorial background (dashed green). |
Figure2a.pdf [24 KiB] HiDef png [266 KiB] Thumbnail [239 KiB] *.C file |
|
|
Figure2b.pdf [31 KiB] HiDef png [276 KiB] Thumbnail [250 KiB] *.C file |
|
|
|
Animated gif made out of all figures. |
PAPER-2022-023.gif Thumbnail |

|
![HiDef png [26 KiB]](Directory_LHCb-PAPER-2022-023/hidef_Figure1a.png)
![HiDef png [30 KiB]](Directory_LHCb-PAPER-2022-023/hidef_Figure1b.png)
![HiDef png [266 KiB]](Directory_LHCb-PAPER-2022-023/hidef_Figure2a.png)
![HiDef png [276 KiB]](Directory_LHCb-PAPER-2022-023/hidef_Figure2b.png)
Tables and captions
|
Systematic uncertainties relative to the measured value of the ratio of branching fractions for Run 1, Run 2, and their combination, taking into account correlations. |
Table_1.pdf [49 KiB] HiDef png [70 KiB] Thumbnail [31 KiB] tex code |

|
![HiDef png [70 KiB]](Directory_LHCb-PAPER-2022-023/hidef_Table_1.png)
Supplementary Material [file]
| Supplementary material full pdf |
supple[..].pdf [196 KiB] |
|
|
This ZIP file contains supplemetary material for the publication LHCb-PAPER-2022-023. The files are: supplementary.pdf : An overview of the extra figures *.pdf, *.png, *.eps : The figures in variuous formats |
Figure3a.pdf [32 KiB] HiDef png [293 KiB] Thumbnail [250 KiB] *C file |
|
|
Figure3b.pdf [31 KiB] HiDef png [171 KiB] Thumbnail [143 KiB] *C file |
|
![HiDef png [293 KiB]](Directory_LHCb-PAPER-2022-023/supplementary/hidef_Figure3a.png)
![HiDef png [171 KiB]](Directory_LHCb-PAPER-2022-023/supplementary/hidef_Figure3b.png)
Created on 26 April 2024.