The event displays below are approved to be shown by ATLAS speakers at conferences and similar events. Click on the thumbnail images to access full-size displays. If you wish to use these event displays for other purposes than presentations of ATLAS results, please
.
This page shows events from the Run 3 splashes and collisions starting in 2021 not included in any publications.
The main Event Display Public Page gives an overview of public event displays which can all be found via the event display search engine .
.
|
Event display of an event (Run 470492, Event 1756541, Beam 1) containing horizontal muons recorded by the ATLAS experiment during a special run for detector calibration on 18 March 2024. In this special run when all magnetic fields were turned off and where only the ATLAS muon spectrometer and the "Tile" hadronic calorimeter were enabled, a bunch of protons from the LHC scrapes a collimator positioned upstream of the ATLAS detector, producing particles. The particles approach the ATLAS detector almost horizontally; the ATLAS Trigger system then filters on muons only, which are used as horizontal probes to calibrate the detector. In this event display, the muons produced by LHC Beam 1 enter ATLAS from the right hand side of the bottom picture (the "A-Side" of the detector) traveling to the left (the "C-Side"). The figure on the top left shows an axial view of the ATLAS detector. The figure at the bottom shows a side view of the ATLAS detector. From the centre of the detector progressing outwards, the energy deposits in the Tile calorimeter (the red layer) are shown as yellow boxes, and the hits in the Muon Spectrometer (the outer blue layer) are shown as yellow and red blocks. The reconstructed track segments and tracks are shown as green and cyan lines.
|

|
|
Event display of an event (Run 470492, Event 1756541, Beam 1) containing horizontal muons recorded by the ATLAS experiment during a special run for detector calibration on 18 March 2024. In this special run when all magnetic fields were turned off and where only the ATLAS muon spectrometer and the "Tile" hadronic calorimeter were enabled, a bunch of protons from the LHC scrapes a collimator positioned upstream of the ATLAS detector, producing particles. The particles approach the ATLAS detector almost horizontally; the ATLAS Trigger system then filters on muons only, which are used as horizontal probes to calibrate the detector. In this event display, the muons produced by LHC Beam 1 enter ATLAS from the right-hand side of the picture (the "A-Side" of the detector), traveling to the left (the "C-Side"). The figure shows a cut-out view of the ATLAS detector; starting from the center of the detector, the image shows the energy deposits in the Tile calorimeter (yellow/orange tiles), the hits in the New Small Wheel (NSW) muon detector (orange/green lines) and in the endcap MDT and TGC muon detectors (green and purple boxes, respectively), as well as the reconstructed muon segments (red lines). |

|
|
Event display (Run 469573, Event 874810) of a splash event recorded by ATLAS during the LHC beam-splash test on Friday the 8th of March 2024 as the LHC restarts in preparation for the third year of Run-3 data taking. In the beam splash test, a single bunch of protons from the LHC hits a collimator upstream of the ATLAS detector, thereby generating a large number of particles, which are then used to probe the correct operation of the ATLAS detector as a whole. In this event display, the spray of particles in the LHC Beam 2 enters ATLAS from the left-hand side of the picture (the "C-Side" of the detector), traveling to the right (the "A-Side"). The figure on the left shows an axial view of the ATLAS detector. The figure at the bottom shows a side view of the ATLAS detector. The figure on the right shows the energy deposits in the cells of the ATLAS calorimeter. From the centre of the detector progressing outwards, the image shows particle interactions in the TRT detector, in the electromagnetic and hadronic calorimeters, and in the muon detectors, respectively. A few modules in TRT were disabled during this run. The data visualized in the picture have been recorded using a newly upgraded threshold-based data filter (the trigger) based on energy deposits in the electromagnetic calorimeter on the A-Side of the detector. This new digital trigger digitizes and reconstructs these energies at the beam-collision frequency.
|

|
|
Event display (
Run 469573, Event 874810) of a splash event recorded by ATLAS during the LHC beam-splash test on Friday, the 8th of March 2024, as the LHC restarts in preparation for the third year of Run-3 data taking. In the "beam splash" test, a single bunch of protons from the LHC hits a collimator upstream of the ATLAS detector, thereby generating a large number of particles, which are then used to probe the correct operation of the ATLAS detector as a whole. In this event display, the spray of particles in the LHC Beam 2 enters ATLAS from the left-hand side of the picture (the "C-Side" of the detector), traveling to the right (the "A-Side"). In the figure, the main 3D view shows a cut-out view of the ATLAS detector, where different radial sectors of the detector have been switched off for visualization purposes. From the center of the detector progressing outwards, the image shows particle interactions in the TRT detector (red/white stripes), in the electromagnetic (squares of different hues of green) and hadronic (yellow/orange boxes) calorimeters, and in the muon detectors (orange/purple/green lines), respectively. On the right of the figure, two additional views show a zoomed-in projection of the same event on the transversal plane: the top-right view, starting from the center, shows the particle interaction in the TRT detector (red/white dots), and in the barrel electromagnetic (squares of different hues of green) and hadronic (yellow/orange boxes) calorimeters; while the bottom-right view shows a detailed view of the particle interaction in the central TRT detector only. The data visualized in the picture have been recorded using a newly upgraded threshold-based data filter (the trigger) based on energy deposits in the electromagnetic calorimeter on the A-Side of the detector. This new digital trigger digitizes and reconstructs these energies at the beam-collision frequency.
|

|
|
Visualisation of a Z to e+e- candidate event (Run 462107, event 307841400) recorded on October 4th 2023 produced in lead-lead collisions at a centre-of-mass energy per nucleon pair of 5.36 TeV. The image shows a cutout 3D view of the ATLAS detector. Starting from the point where the two beams of lead ions from the LHC collide, the image shows the tracks of charged particles as they are reconstructed in the inner detector (orange tracks), the energy deposits in the LAr (green/teal boxes) and Tile (yellow/orange boxes) calorimeters. Inner detectors tracks corresponding to the two electron candidates are highlighted with bright green lines. Electron candidates have opposite charge, transverse momentum of 33 GeV and 28 GeV, and an invariant mass of 91.4 GeV. The insert placed on the left bottom side of the image shows a transverse projection of the same event, in which only the energy deposits in the barrel calorimeters are shown.
|

|
|
Visualisation of an unbalanced high-pT di-jet event (Run 461641, event 238038043) recorded on September 27th, 2023. The event was selected using the high-level jet trigger in lead-lead collision data at a centre-of-mass energy per nucleon pair of 5.36 TeV. The right image shows a cutout 3D view of the ATLAS detector; starting from the center, the tracks of charged particles reconstructed in the inner detector (orange lines) and the energy deposits in the electromagnetic (green/teal boxes) and hadronic (yellow/orange boxes) calorimeters are displayed, as well as the reconstructed particle jets (yellow cones). The left image shows a transverse projection of the same event, in which only the energy deposits in the barrel calorimeters are shown. The leading and sub-leading jets shown by the yellow cones are characterized by a notable pT asymmetry (~0.6).
|

|
|
Visualisation of a dijet event (Run 461641, event 236939012) recorded on September 27th 2023) selected using the high-level jet trigger in lead-lead collision data at a centre-of-mass energy per nucleon pair of 5.36 TeV. The right display shows a projection in which only the phi coordinates of the particles, energy deposits and jets are plotted, while the central display shows a 3D view of the ATLAS detector. Green/teal and yellow/orange bars correspond to the energy depositions in the electromagnetic and hadronic calorimeters, respectively, while the tracks of charged particles reconstructed in the inner detector are displayed in orange. The leading and sub-leading jets are shown by the yellow cones and are detected at negative (η = -1.35) and positive (η = 0.75) pseudorapidities, respectively.
|

|
|
Visualisation of an event (Run 461641, event 236731885, recorded on September 27th 2023) with an azimuthally balanced pair of high-pT jets, selected using the high-level jet trigger in lead-lead collision data at a centre-of-mass energy per nucleon pair of 5.36 TeV. The figure shows a 3D view of the ATLAS detector. Starting from the point where the two beams of lead ions from the LHC collide, the image shows the tracks of charged particles as they are reconstructed in the inner detector (orange tracks), the energy deposits in the LAr (green/teal boxes) and Tile (yellow/orange boxes) calorimeters. The two jets are shown by the yellow cones and are both detected at η~1.3. A projection of the same event onto the transverse plane is also shown in the bottom-left corner.
|

|
|
Event display for an exclusive γγ→ττ candidate decaying into an electron and three charged pions in lead-lead collision data at 5.36 TeV triggered by the TRT detector with the L1 trigger. Event 793849435 from run 462205 recorded on 6th October 2023 is shown. The event contains an electron with pT=1.9 GeV and three additional charged-particle tracks with pT=0.7 GeV, pT=0.4 GeV and pT=0.2 GeV, and no additional activity in the detector. The right image shows a cutout view of the ATLAS detector; starting from the center, the tracks of four reconstructed charged particles are shown (orange lines), as well as the energy deposit in the electromagnetic calorimeter (green box). The left image shows a transversal view of the same event focusing on the central part of the detector; starting from the center, the tracks of four reconstructed charged particles are shown (orange lines), as well as hits from the Pixel (white dots), SCT (yellow dots), and TRT (white and red dots) subdetectors, and the energy deposit in the electromagnetic calorimeter (green box). All charged-particle tracks with pT > 100 MeV are shown. All calorimeter cells passing the following ET thresholds are shown: ET > 250 MeV for the electromagnetic calorimeter and hadronic Tile calorimeter, ET > 800 MeV for the hadronic endcap calorimeter, and ET > 100 MeV for the forward calorimeter.
|

|
|
Event display for an exclusive J/Psi candidate decaying into two charged leptons in lead-lead collision data at 5.36 TeV triggered by the TRT detector with the L1 trigger. Event 2794836345 from run 462205 recorded on 6th October 2023 is shown. The event contains two charged-particle tracks with pT=1.5 GeV and pT=1.4 GeV, with an invariant mass of 3.1 GeV, and no additional activity in the detector. The left image shows a cutout view of the ATLAS detector; starting from the center, the tracks of two reconstructed charged particles are shown (orange lines). The right image shows a transversal view of the same event focusing on the central part of the detector; starting from the center, the tracks of two reconstructed charged particles are shown (orange lines), as well as hits from the Pixel (white dots), SCT (yellow dots), and TRT (white and red dots) subdetectors. All charged-particle tracks with pT > 100 MeV are shown. No calorimeter cells pass the following ET thresholds: ET > 250 MeV for the electromagnetic calorimeter and hadronic Tile calorimeter, ET > 800 MeV for the endcap hadronic calorimeter, and ET > 100 MeV for the forward calorimeter.
|

|
|
Event display (Run 461633, Event 9203837) of an ultraperipheral heavy ion collision event recorded in ATLAS on 26 September 2023, when stable beams of lead ions colliding at a centre-of-mass energy per nucleon pair of 5.36 TeV were delivered to ATLAS by the LHC. The figure shows a 3D view of the ATLAS detector. Starting from the point where the two beams of lead ions from the LHC collide, the figure shows the tracks of charged particles as they are reconstructed in the inner detector (orange tracks), the energy deposits in the LAr (green/teal boxes) and Tile (yellow/orange boxes) calorimeters.The right-hand view shows a projection of the same event onto the transverse plane.
|

|
|
Event display (Run 461633, Event 9203837) of an ultraperipheral heavy ion collision event recorded in ATLAS on 26 September 2023, when stable beams of lead ions colliding at a centre-of-mass energy per nucleon pair of 5.36 TeV were delivered to ATLAS by the LHC. The figure on the top left shows a transverse view of the ATLAS detector. The figure on the middle right shows the energy deposits in the cells of the ATLAS calorimeter. The figure at the bottom shows a side view of the ATLAS detector. Starting from the centre of the ATLAS detector, the reconstructed tracks of the charged particles in the inner detector are shown as coloured lines. The energy deposits in the electromagnetic (the green layer) and hadronic (the red layer) calorimeters are shown as yellow boxes. The hits in the muon spectrometer (the outer blue layer) are shown as red and grey blocks.
|

|
|
Event display (Run 461633, Event 3419440) of a heavy ion collision event recorded in ATLAS on 26 September 2023, when stable beams of lead ions colliding at a centre-of-mass energy per nucleon pair of 5.36 TeV were delivered to ATLAS by the LHC. The figure shows a 3D view of the ATLAS detector. Starting from the point where the two beams of lead ions from the LHC collide, the figure shows the tracks of charged particles as they are reconstructed in the inner detector (orange tracks), the energy deposits in the LAr (green/teal boxes) and Tile (yellow/orange boxes) calorimeters, and the tracks reconstructed in the muon spectrometer (red tracks) together with the associated muon chambers (green/purple boxes). The left-hand view shows a projection of the same event onto the transverse plane.
|

|
|
Event display (Run 461633, Event 3419440) of a heavy ion collision event recorded in ATLAS on 26 September 2023, when stable beams of lead ions colliding at a centre-of-mass energy per nucleon pair of 5.36 TeV were delivered to ATLAS by the LHC. The figure on the top left shows a transverse view of the ATLAS detector. The figure on the middle right shows the energy deposits in the cells of the ATLAS calorimeter. The figure at the bottom shows a side view of the ATLAS detector. Starting from the centre of the ATLAS detector, the reconstructed tracks of the charged particles in the inner detector are shown as coloured lines. The energy deposits in the electromagnetic (the green layer) and hadronic (the red layer) calorimeters are shown as yellow boxes. The hits in the muon spectrometer (the outer blue layer) are shown as red and grey blocks. Reconstructed candidate muon tracks are indicated by the cyan lines.
|

|
|
An event display of a collision event (Run 451896, Event 349429897) recorded in ATLAS on 11 May 2023, when stable beams of 2400 bunches of protons at the energy of 6.8 TeV per beam were delivered to ATLAS for the first time in 2023 by the LHC. The figure on the left shows an axial view of the ATLAS detector. The figure at the bottom shows a side view of the ATLAS detector. Starting from the centre of the ATLAS detector, the hits and reconstructed tracks of the charged particles in the Inner Detector are shown as dots and coloured lines, respectively. The energy deposits in the electromagnetic (the green layer) and hadronic (the red layer) calorimeters are shown as yellow boxes. The hits in the Muon Spectrometer (the outer blue layer) are shown as red and gray blocks. The reconstructed track segments and tracks in the Muon Spectrometer are shown as green and cyan lines, respectively. The figure on the right shows the energy deposits in the cells of the ATLAS calorimeter.
|

|
|
An event display of a collision event (Run 451896, Event 349429897) recorded in ATLAS on 11 May 2023, when stable beams of 2400 bunches of protons at the energy of 6.8 TeV per beam were delivered to ATLAS for the first time in 2023 by the LHC. The figure on the right shows a cut-out view of the ATLAS detector; starting from the center of the detector, the image shows the reconstructed tracks of charged particles (orange lines), the energy deposits in the LAr (squares in different hues of green) and Tile (yellow/orange squares) calorimeters, as well as the reconstructed muon tracks (red lines) and their associated hits (green lines) inside the MDT and TGC chambers (green/blue and purple boxes, respectively). The bottom view on the left shows a zoomed-in projection of the same event on the transversal plane, with a focus on the inner detectors; starting from the center, the image shows the hits in the Pixel (white dots), SCT (yellow strips), and TRT (white/red dots) detectors, the reconstructed tracks of charged particles (orange lines), the reconstructed muon tracks (red lines), as well as the energy deposits in the barrel electromagnetic region of the LAr calorimeter (green squares) and in the Tile hadronic calorimeter (yellow/orange squares).
|

|
|
Event display of a collision event (Run number 450227, Event number 6327489) recorded by the ATLAS experiment on 21 April 2023, when stable beams of protons at the energy of 6.8 TeV per beam were delivered to ATLAS by the LHC. The figure on the left shows an axial view of the ATLAS detector. The figure at the bottom shows a side view of the ATLAS detector. Starting from the center of the ATLAS detector, the hits and reconstructed tracks of the charged particles in the Inner Detector are shown as dots and colored lines, respectively. The energy deposits in the electromagnetic (the green layer) and hadronic (the red layer) calorimeters are shown as yellow/green boxes. The hits in the Muon Spectrometer (the outer blue layer) are shown as red and gray blocks. The reconstructed track segments and tracks in the Muon Spectrometer are shown as green and cyan lines, respectively. The figure on the right shows the energy deposits in the cells of the ATLAS calorimeter.
|

|
|
Event display of a collision event (Run number 450227, Event number 6327489) recorded by the ATLAS experiment on 21 April 2023, when stable beams of protons at the energy of 6.8 TeV per beam were delivered to ATLAS by the LHC. The image on the left shows a cut-out view of the ATLAS detector; starting from the center, the view shows the tracks of the charged particles as they are reconstructed in the Inner Detector (orange lines), as well as the energy deposits in the electromagnetic (squares in different hues of green) and hadronic (yellow boxes) calorimeters. The right inset shows a transversal projection of the central part of the detector; the image shows, starting from the center, the hits in the Pixel (white dots), SCT (yellow squares), and TRT (red and white dots) detectors respectively, and the reconstructed tracks of charged particles (orange lines), as well as the energy deposits in the barrel electromagnetic (green boxes) and hadronic (yellow boxes) calorimeters.
|

|
|
Event display of an event (Run 449604, Event 228336, Beam 1) containing horizontal muons recorded by the ATLAS experiment during a special run for detector calibration on 18 April 2023. In this special run, where only the ATLAS muon spectrometer and the Tile calorimeter were enabled, a bunch of protons from the LHC scrapes a collimator upstream of the ATLAS detector to produce muons. These muons travel through the ATLAS detector almost horizontally, and are used to calibrate the detector. In this event display, the muons produced by LHC Beam 1 enter ATLAS from the right hand side of the picture (the "A-Side" of the detector) traveling to the left (the "C-Side"). The figure on the top left shows an axial view of the ATLAS detector. The figure at the bottom shows a side view of the ATLAS detector. From the centre of the detector progressing outwards, the energy deposits in the Tile calorimeter (the red layer) are shown as yellow boxes, and the hits in the Muon Spectrometer (the outer blue layer) are shown as yellow and red blocks. The reconstructed track segments and tracks are shown as green and cyan lines.
|

|
|
Event display of an event (Run 449604, Event 228336, Beam 1) containing horizontal muons recorded by the ATLAS experiment during a special run for detector calibration on 18 April 2023. In this special run, where only the ATLAS muon spectrometer and the Tile calorimeter were enabled, a bunch of protons from the LHC scrapes a collimator upstream of the ATLAS detector to produce muons. These muons travel through the ATLAS detector almost horizontally, and are used to calibrate the detector. In this event display, the muons produced by LHC Beam 1 enter ATLAS from the right hand side of the picture (the "A-Side" of the detector) traveling to the left (the "C-Side"). The figure on the left shows a cut-out view of the ATLAS detector; starting from the center of the detector, the image shows the energy deposits in the Tile calorimeter (yellow/orange tiles), the energy deposits in the Minimum Bias Trigger Scintillators (circular yellow squares close to the beam pipe), the hits in the New Small Wheel (NSW) muon detector (orange/green lines) and the relative reconstructed muon segments (red lines), and the reconstructed muon segments (red lines) in the endcap MDT muon detectors (green boxes). The right bottom inset shows a longitudinal projection of the same view.
|

|
|
Event display of an event (Run 449604, Event 228336, Beam 1) containing horizontal muons recorded by the ATLAS experiment during a special run for detector calibration on 18 April 2023. In this special run, where only the ATLAS muon spectrometer and the Tile calorimeter were enabled, a bunch of protons from the LHC scrapes a collimator upstream of the ATLAS detector to produce muons. These muons travel through the ATLAS detector almost horizontally, and are used to calibrate the detector. In this event display, the muons produced by LHC Beam 1 enter ATLAS from the right hand side of the picture (the "A-Side" of the detector) traveling to the left (the "C-Side"). The figure shows a cut-out, zoomed in view of the central part of the ATLAS detector; starting from the center of the detector, the image shows the energy deposits in the Tile calorimeter (yellow/orange tiles), the energy deposits in the Minimum Bias Trigger Scintillators (circular yellow squares close to the beam pipe), the hits in the New Small Wheel (NSW) muon detector (orange/green lines) and the relative reconstructed muon segments (red lines), and the reconstructed muon segments (red lines) in the endcap MDT muon detectors (green boxes).
|

|
|
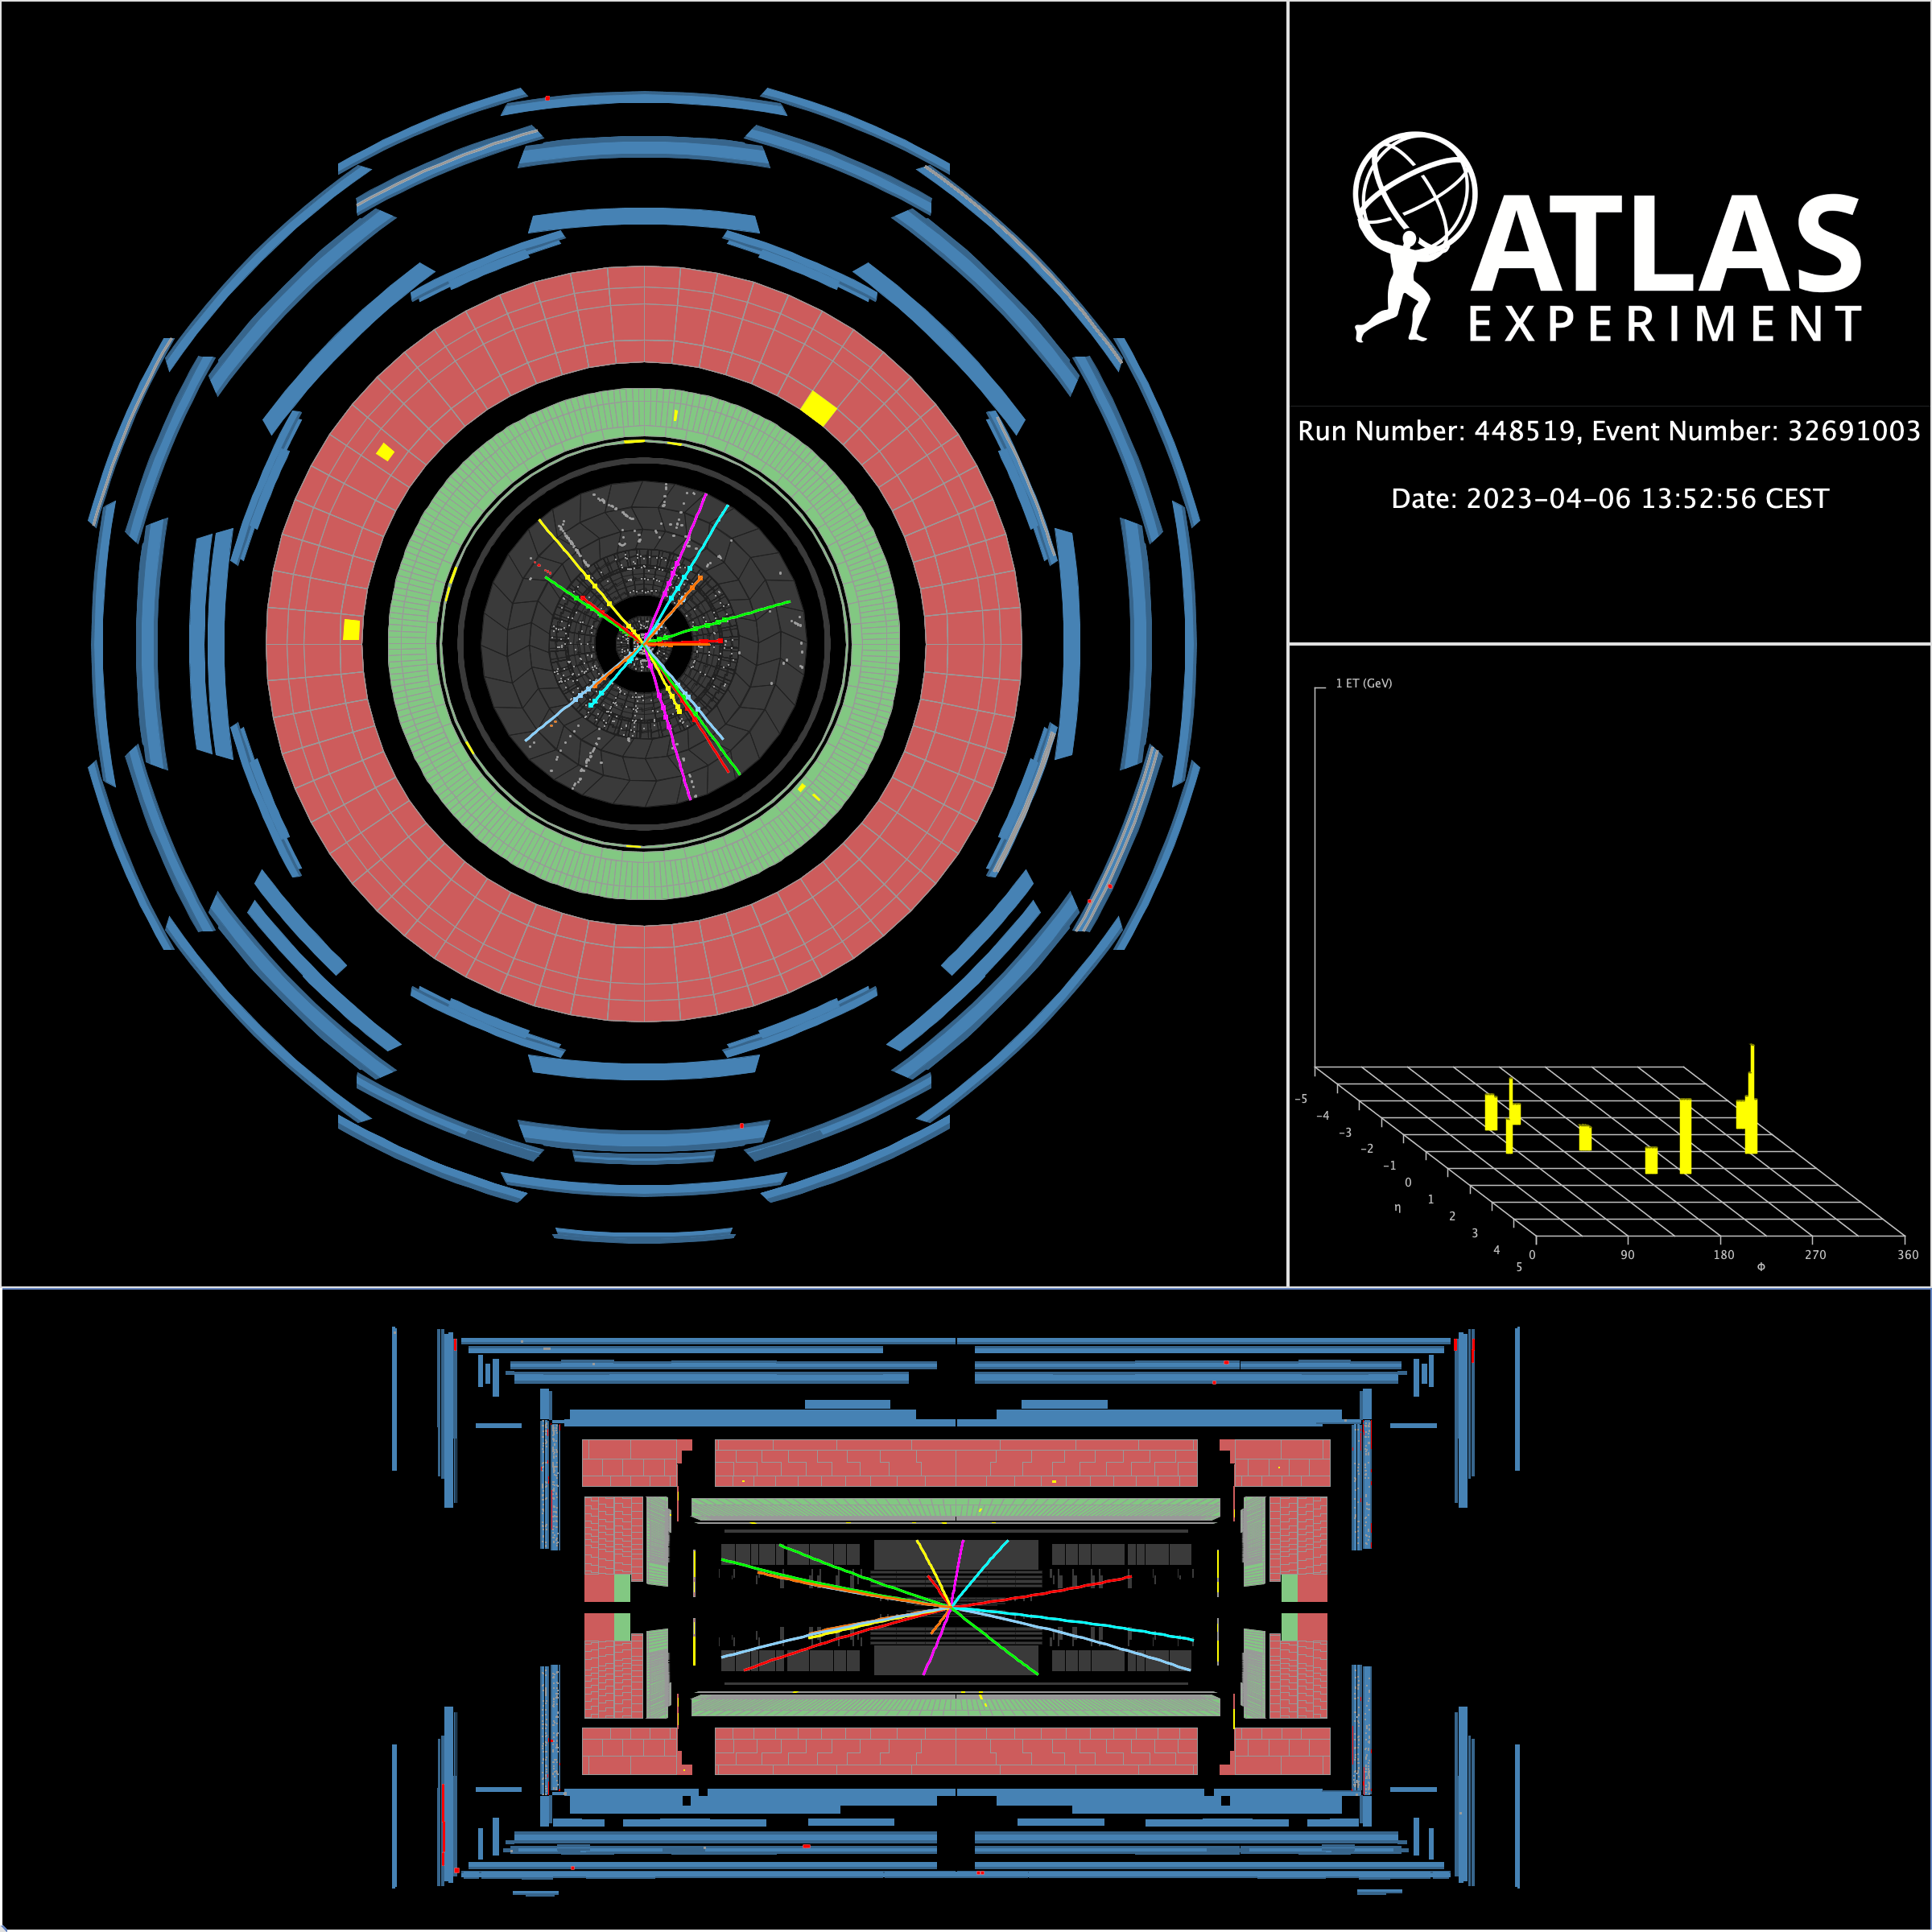
Event display (Run 448519, Event 32691003) of a collision event recorded by the ATLAS experiment on 6 April 2023, when stable beams of protons at the injection energy of 450 GeV per beam were delivered to ATLAS by the LHC. The image on the right shows a cut-out view of the ATLAS detector; starting from the center, the views shows the tracks of the charged particles as they are reconstructed in the Inner Detector (orange lines) and the energy deposits in the electromagnetic (green squares) and hadronic (yellow squares) calorimeters. The left image shows a zoomed-in view of the Inner Detector; it shows, starting from the center, the hits in the Pixel (white dots), SCT (yellow squares) and TRT (red and white dots) detectors respectively, as well as the reconstructed tracks of charged particles (orange lines). During this commissioning period the ATLAS Solenoid and Toroid magnets were turned off meaning that there was no magnetic field within the detector to bend the trajectories of charged particles. |

|
|
Event display (Run 448519, Event 32691003) of a collision event recorded by the ATLAS experiment on 6 April 2023, when stable beams of protons at the injection energy of 450 GeV per beam were delivered to ATLAS by the LHC. The figure on the left shows an axial view of the ATLAS detector. The figure at the bottom shows a side view of the ATLAS detector. The figure on the right shows the energy deposits in the cells of the ATLAS calorimeter. Starting from the center of the ATLAS detector, the hits and reconstructed tracks of the charged particles in the Inner Detector are shown as dots and colored lines, respectively. The energy deposits in the electromagnetic (the green layer) and hadronic (the red layer) calorimeters are shown as yellow boxes. The hits in the Muon Spectrometer (the outer blue layer) are shown as red and gray blocks. During this commissioning period the ATLAS Solenoid and Toroid magnets were turned off meaning that there was no magnetic field within the detector to bend the trajectories of charged particles. |
|
|
Event display (Run 447975, Event 523835) of a splash event recorded by ATLAS during the LHC beam-splash test on Friday 31 March 2023 as the LHC restarts in preparation for the second year of Run-3 data taking. In the "beam splash" test, a single bunch of protons from the LHC hits a collimator upstream of the ATLAS detector, thereby generating a large number of particles, which are then used to probe the correct operation of the ATLAS detector as a whole. In this event display, the spray of particles in the LHC Beam 1 enters ATLAS from the right hand side of the picture (the "A-Side" of the detector) traveling to the left (the "C-Side"). The figure shows a cut-out view of the ATLAS detector, where different radial sectors of the detector have been switched off for visualization purpose. From the centre of the detector progressing outwards, the image shows particle interactions in the TRT detector (red/white stripes), in the electromagnetic (squares of different hues of green) and hadronic (yellow/orange boxes) calorimeters, and in the muon detectors (orange/purple/green lines), respectively. The data visualised in the picture have been recorded using a threshold-based data filter (the trigger) based on energy deposits in the electromagnetic calorimeter on the C-Side of the detector.
|

|
|
Event display (Run 447975, Event 553517) of a splash event recorded by ATLAS during the LHC beam-splash test on Friday 31 March 2023 as the LHC restarts in preparation for the second year of Run-3 data taking. In the "beam splash" test, a single bunch of protons from the LHC hits a collimator upstream of the ATLAS detector, thereby generating a large number of particles, which are then used to probe the correct operation of the ATLAS detector as a whole. In this event display, the spray of particles in the LHC Beam 2 enters ATLAS from the left hand side of the picture (the "C-Side" of the detector) traveling to the right (the "A-Side"). The figure shows a cut-out view of the ATLAS detector, where different radial sectors of the detector have been switched off for visualization purpose. From the centre of the detector progressing outwards, the image shows particle interactions in the TRT detector (red/white stripes), in the electromagnetic (squares of different hues of green) and hadronic (yellow/orange boxes) calorimeters, and in the muon detectors (orange/purple/green lines), respectively. The data visualised in the picture have been recorded using a threshold-based data filter (the trigger) based on energy deposits in the electromagnetic calorimeter on the A-Side of the detector.
|

|
|
Event display (Run 447975, Event 523835) of a splash event recorded by ATLAS during the LHC beam-splash test on Friday 31 March 2023 as the LHC restarts in preparation for the second year of Run-3 data taking. In the beam splash test, a single bunch of protons from the LHC hits a collimator upstream of the ATLAS detector, thereby generating a large number of particles, which are then used to probe the correct operation of the ATLAS detector as a whole. In this event display, the spray of particles in the LHC Beam 1 enters ATLAS from the right hand side of the picture (the "A-Side" of the detector) traveling to the left (the "C-Side"). The figure on the left shows an axial view of the ATLAS detector. The figure at the bottom shows a side view of the ATLAS detector. The figure on the right shows the energy deposits in the cells of the ATLAS calorimeter. From the centre of the detector progressing outwards, the image shows particle interactions in the TRT detector, in the electromagnetic and hadronic calorimeters, and in the muon detectors, respectively. A few modules in TRT were disabled during this run. The data visualised in the picture have been recorded using a threshold-based data filter (the trigger) based on energy deposits in the electromagnetic calorimeter on the C-Side of the detector.
|

|
|
Event display (Run 447975, Event 553517) of a splash event recorded by ATLAS during the LHC beam-splash test on Friday 31 March 2023 as the LHC restarts in preparation for the second year of Run-3 data taking. In the beam splash test, a single bunch of protons from the LHC hits a collimator upstream of the ATLAS detector, thereby generating a large number of particles, which are then used to probe the correct operation of the ATLAS detector as a whole. In this event display, the spray of particles in the LHC Beam 2 enters ATLAS from the left hand side of the picture (the "C-Side" of the detector) traveling to the right (the "A-Side"). The figure on the left shows an axial view of the ATLAS detector. The figure at the bottom shows a side view of the ATLAS detector. The figure on the right shows the energy deposits in the cells of the ATLAS calorimeter. From the centre of the detector progressing outwards, the image shows particle interactions in the TRT detector, in the electromagnetic and hadronic calorimeters, and in the muon detectors, respectively. A few modules in TRT were disabled during this run. The data visualised in the picture have been recorded using a threshold-based data filter (the trigger) based on energy deposits in the electromagnetic calorimeter on the A-Side of the detector.
|

|
|
Event display (Run 447705, Event 98869) of a splash event recorded by ATLAS during the LHC beam-splash test on Tuesday 28 March 2023 as the LHC restarts in preparation for the second year of Run-3 data taking. In the beam splash test, a single bunch of protons from the LHC hits a collimator upstream of the ATLAS detector, thereby generating a large number of particles, which are then used to probe the correct operation of the ATLAS detector as a whole. In this event display, the spray of particles in the LHC Beam 2 enters ATLAS from the left hand side of the picture (the "C-Side" of the detector) traveling to the right (the "A-Side"). From the centre of the detector progressing outwards, the image shows particle interactions in the TRT detector (red/white stripes), the LAr (squares in different shades of green) and Tile (yellow/orange boxes) calorimeters, respectively. Part of the LAr and Tile energy deposits were removed from the image to show the inner TRT measurements. The data visualised in the picture have been recorded using a threshold-based data filter (the trigger) based on energy deposits in the electromagnetic calorimeter on the A-Side of the detector. |

|
|
Event display (Run 447705, Event 98869) of a splash event recorded by ATLAS during the LHC beam-splash test on Tuesday 28 March 2023 as the LHC restarts in preparation for the second year of Run-3 data taking. In the beam splash test, a single bunch of protons from the LHC hits a collimator upstream of the ATLAS detector, thereby generating a large number of particles, which are then used to probe the correct operation of the ATLAS detector as a whole. In this event display, the spray of particles in the LHC Beam 2 enters ATLAS from the left hand side of the picture (the "C-Side" of the detector) traveling to the right (the "A-Side"). The figure on the left shows an axial view of the ATLAS detector. The figure at the bottom shows a side view of the ATLAS detector. The figure on the right shows the energy deposits in the cells of the ATLAS calorimeter. From the centre of the detector progressing outwards, the image shows particle interactions in the TRT detector, in the electromagnetic and hadronic calorimeters, and in the muon detectors, respectively. A few modules in TRT were disabled during this run. The data visualised in the picture have been recorded using a threshold-based data filter (the trigger) based on energy deposits in the electromagnetic calorimeter on the A-Side of the detector. |

|
|
Event display (Run 428648, Event 633647719) of a collision event containing a Z->tautau candidate in a final state with a muon and the visible products of a hadronically-decaying tau lepton. The event was recorded on July, 19 2022 when stable beams of protons at the energy of 6.8 TeV per beam were delivered by the LHC. The figure shows a 2D axial view of the ATLAS detector. Starting from the center of the ATLAS detector, the hits and reconstructed tracks of the charged particles in the Inner Detector are shown as cyan-coloured dots and lines, respectively. The energy deposits in the electromagnetic (the green layer) and hadronic (the red layer) calorimeters are shown as yellow boxes. The hits in the Muon Spectrometer (the outer blue layer) are shown as orange blocks. The white cone represents the reconstructed jet seeding the ATLAS reconstruction of hadronically-decaying tau leptons. The green, blue and red tracks inside the cone are identified as originating from three charged pions compatible with the visible decays of a tau lepton. Their transverse momenta are 14.6 GeV, 5.5 GeV and 4.2 GeV. The energy deposits in yellow inside the white cone are the most energetic clusters of cells in the event. On the opposite side of the cone, a single isolated track (shown in orange) is detected by the Inner Detector and the Muon Spectrometer, consistent with an isolated muon from a leptonically decaying tau lepton.
|

|
|
Event display (Run 428648, Event 633647719) of a collision event containing a Z->tautau candidate in a final state with a muon and the visible products of a hadronically-decaying tau lepton. The event was recorded on July, 19 2022 when stable beams of protons at the energy of 6.8 TeV per beam were delivered by the LHC. The figure shows a 2D axial view of the ATLAS detector. Starting from the center of the ATLAS detector, the hits and reconstructed tracks of the charged particles in the Inner Detector are shown as cyan-coloured dots and lines, respectively. The energy deposits in the electromagnetic (the green layer) and hadronic (the red layer) calorimeters are shown as yellow boxes. The white cone represents the reconstructed jet seeding the ATLAS reconstruction of hadronically-decaying tau leptons. The green, blue and red tracks inside the cone are identified as originating from three charged pions consistent with the visible decays of the tau lepton. Their transverse momenta are 14.6 GeV, 5.5 GeV and 4.2 GeV, respectively. The energy deposits in yellow inside the white cone are the most energetic clusters of cells in the event. On the opposite side of the cone, a single isolated track (shown in orange) is detected by the Inner Detector and the Muon Spectrometer (not shown on this figure), consistent with an isolated muon from a leptonically decaying tau lepton.
|

|
|
Event display (Run 428648, Event 633647719) of a collision event containing a Z->tautau candidate in a final state with a muon and the visible products of a hadronically-decaying tau lepton. The event was recorded on July, 19 2022 when stable beams of protons at the energy of 6.8 TeV per beam were delivered by the LHC. The figure shows a 2D side view of the ATLAS detector. Starting from the center of the ATLAS detector, the hits and reconstructed tracks of the charged particles in the Inner Detector are shown as cyan-coloured dots and lines, respectively. The energy deposits in the electromagnetic (the green layer) and hadronic (the red layer) calorimeters are shown as yellow boxes. The hits in the Muon Spectrometer (the outer blue layer) are shown as orange blocks. The white cone represent the reconstructed jet seeding the ATLAS reconstruction of hadronically-decaying tau leptons. The green, blue and red tracks inside the cone are identified as originating from three charged pions consistent with the visible decays of the tau lepton. Their transverse momenta are 14.6 GeV, 5.5 GeV and 4.2 GeV. The energy deposits in yellow inside the white cone are the most energetic clusters of cells in the event. On the bottom part of the detector, a single isolated track (shown in orange) is detected by the Inner Detector and the Muon Spectrometer, consistent with an isolated muon from a leptonically decaying tau lepton.
|

|
|
Event display (Run 428580, Event 612079972) of a collision event containing a dilepton ttbar candidate recorded in ATLAS on 18 July 2022 when stable beams of protons at the energy of 6.8 TeV per beam were delivered by the LHC. The figure shows a 3D view of the ATLAS detector. Starting from the point where the two beams of protons from the LHC collide, the figure shows the tracks of charged particles as they are reconstructed in the inner detector (orange tracks), an electron track (green line), a muon track (red line) as well as the energy deposits in the LAr (green and cyan blocks for the barrel and endcap respectively) and Tile (yellow/orange blocks) calorimeters. Muon chambers associated with the muon track are shown in green (MDT endcap) and purple (TGC) boxes. The event contains two jets that have passed b-tagging requirements and these are delineated with cyan cones. The lower-left-hand view shows a projection of the same event onto the transverse plane, showing in addition the hits in the barrel of the Pixel (white) and SCT (yellow) detectors, as well as the direction of the missing transverse momentum (dashed white line).
|

|
|
Event display (Run 427394, Event 2167971) of a collision event containing a J/ѱ to e+ e- candidate recorded in ATLAS on 5 July 2022, when stable beams of protons at the energy of 6.8 TeV per beam were delivered to ATLAS for the first time by the LHC. The figure shows a 3D view of the ATLAS detector. Starting from the point where the two beams of protons from the LHC collide, the figure shows the tracks of charged particles as they are reconstructed in the inner detector (orange tracks), two electron tracks (green lines), as well as the energy deposits in the electromagnetic (green boxes) and hadronic (yellow/orange boxes) calorimeters. The upper-left-hand view shows a projection of the same event onto the transverse plane, showing in addition the hits in the barrel of the Pixel (white), SCT (yellow), and TRT (white/red) detectors.
|

|
|
Event display (Run 427514, Event 68319093) of a collision event recorded in ATLAS on 7 July 2022, when stable beams of protons at the energy of 6.8 TeV were delivered to ATLAS by the LHC. The red line shows a muon candidate with transverse momentum of 15 GeV reconstructed using information from the inner tracking detectors and the ATLAS Muon Spectrometer end-cap. The muon candidate was among the first reconstructed using hits in the Micromegas (MM) chambers of the New Small Wheel (NSW) on side C. The NSW, installed during the long shutdown between Runs 2 and 3, is outlined in white and the MM hits are shown as orange lines. Additional muon chambers associated with the track are shown as green (MDT endcap) and purple (TGC endcap) boxes. Also shown in the figure are the tracks of charged particles as they are reconstructed in the inner detector (orange tracks), as well as the energy deposits in the electromagnetic (green boxes) and hadronic (yellow/orange boxes) calorimeters. The bottom-left view is a projection of the same event onto the transverse plane, showing in addition the hits in the TRT detector in white (red) for hits (high-threshold hits).
|

|
|
Event display of a collision event (Run 427394, Event 10631430) containing a Z to e+ e- candidate recorded in ATLAS on 5 July 2022, when stable beams of protons at the energy of 6.8 TeV per beam were delivered to ATLAS for the first time by the LHC. The figure shows a 3D view of the ATLAS detector. Starting from the point where the two beams of protons from the LHC collide, the figure shows the tracks of charged particles as they are reconstructed in the inner detector (orange tracks), two electron tracks (green lines), as well as the energy deposits in the electromagnetic (green boxes) calorimeter. The right-hand view shows a projection of the same event onto the transverse plane, showing the objects described above, as well as the hits in the Pixel (white), SCT (yellow), and TRT (white/red) detectors. Also shown are the energy deposits in the electromagnetic (green boxes) calorimeter.
|

|
|
Event display of a collision event (Run 427394, Event 21060879) containing a Z to µ+ µ- candidate recorded in ATLAS on 5 July 2022, when stable beams of protons at the energy of 6.8 TeV per beam were delivered to ATLAS for the first time by the LHC. The figure shows a 3D view of the ATLAS detector. Starting from the point where the two beams of protons from the LHC collide, the figure shows the tracks of charged particles as they are reconstructed in the inner detector (orange tracks), the energy deposits in the electromagnetic (green boxes) and hadronic (yellow/orange boxes) calorimeters, and in the muon spectrometer (red tracks) together with the muon chambers associated with them (blue/green/purple) boxes. The left-hand view shows a projection of the same event onto the transverse plane, showing the tracks of charged particles reconstructed in the inner detector (orange tracks), and in the muon spectrometer (red tracks). Also shown are the hits in the Pixel (white), SCT (yellow), and TRT (white/red) detectors, as well as energy deposits in the electromagnetic (green boxes) and hadronic (yellow boxes) calorimeters.
|

|
|
Event display of a collision event (Run 427394, Event 3606971) containing a J/ѱ to µ+ µ- candidate recorded in ATLAS on 5 July 2022, when stable beams of protons at the energy of 6.8 TeV per beam were delivered to ATLAS for the first time by the LHC. The figure shows a 3D view of the ATLAS detector. Starting from the point where the two beams of protons from the LHC collide, the figure shows the tracks of charged particles as they are reconstructed in the inner detector (orange tracks), the energy deposits in the electromagnetic (green boxes) and hadronic (yellow/orange boxes) calorimeters, and the muon tracks (red tracks) together with the muon chambers associated with them (green/purple) boxes. The top-left view shows a projection of the same event onto the transverse plane, showing the tracks of charged particles reconstructed in the inner detector (orange tracks), and the muon tracks (red tracks). Also shown are the hits in the Pixel (white), SCT (yellow), and TRT (white/red) detectors.
|

|
|
Event display of a collision event (Run 427394, Event 3038977) recorded in ATLAS on 5 July 2022, when stable beams of protons at the energy of 6.8 TeV per beam were delivered to ATLAS for the first time by the LHC. The figure on the left shows an axial view of the ATLAS detector. The figure on the right shows the energy deposits in the cells of the ATLAS calorimeters. The figure at the bottom shows a side view of the ATLAS detector. Starting from the center of the ATLAS detector, the hits and reconstructed tracks of the charged particles in the Inner Detector are shown as dots and colored lines, respectively. The energy deposits in the electromagnetic (the green layer) and hadronic (the red layer) calorimeters are shown as yellow boxes, as well as red and green bars. The hits in the Muon Spectrometer (the outer blue layer) are shown as red and yellow blocks.
|

|
|
Event display of a collision event (Run 427394, Event 3038977) recorded in ATLAS on 5 July 2022, when stable beams of protons at the energy of 6.8 TeV per beam were delivered to ATLAS for the first time by the LHC. The bottom-right figure shows a 3D view of the ATLAS detector. Starting from the point where the two beams of protons from the LHC collide, the figure shows the tracks of charged particles as they are reconstructed in the inner detector (orange tracks), the energy deposits in the electromagnetic (green boxes) and hadronic (yellow boxes) calorimeters, as well as the reconstructed particle jets (yellow cones). The barrel magnet and the muon chambers in the barrel region of the detector (blue boxes) are shown as a semi-transparent cut-out. At the center, the picture shows the beam pipe, where the protons accelerated by the LHC enter the detector. The top-left view shows a projection of the same event on the transverse plane, showing the tracks of charged particles reconstructed in the inner detector (orange tracks) and the energy deposits in the electromagnetic (green boxes) and hadronic (yellow boxes) calorimeters, as well as the reconstructed particle jets (yellow cones). The top figure shows a close-up view of the inner detector; starting from the center, it shows the hits in the Pixel (white), SCT (yellow), and TRT (white/red) detectors, as well as the reconstructed tracks (orange) of charged particles.
|

|
|
Event display (Run 423110, Event 789870) of a collision event recorded in ATLAS on 28 May 2022, when stable beams of protons at the injection energy of 450 GeV per beam were delivered to ATLAS by the LHC. The red line shows a muon candidate reconstructed using information from the inner tracking detectors and three stations of the ATLAS Muon Spectrometer end-cap. The muon candidate was reconstructed using hits in the Micromegas chambers of the New Small Wheel on side A. A side view of the event is shown in the lower part of the image. The New Small Wheels are shown together with the MDT chambers (green) used to reconstruct the muon trajectory.
|

|
|
Event display (Run 423803, Event 3826924) of an event recorded in ATLAS on 2 June 2022, when proton beams at the injection energy of 450 GeV per beam were delivered from the LHC, scraping nearby collimators and producing muons that passed horizontally through the ATLAS detector. The figures at the top show representations of the New Small Wheels of the ATLAS Muon Spectrometer with hits in red and yellow. On the top left the Small-Strip Thin-Gap chambers (sTGC) on ATLAS side C are displayed. The top center plot shows correspondingly the sTGC chambers on side A. The top right view displays the Micromegas chambers on side A. The figure on the bottom left shows a side view of the ATLAS detector and the figure on the bottom right an axial view. The energy deposits in the hadronic calorimeters (red layer) are shown as yellow boxes. The hits in the Muon Spectrometer (outer blue layer) are shown as red and yellow blocks. Reconstructed track segments are shown as green lines.
|

|
|
Event display of a collision event (Run 423110, Event 184635) recorded in ATLAS on 28 May 2022, when stable beams of protons at the injection energy of 450 GeV per beam were delivered to ATLAS by the LHC. The figure on the left shows an axial view of the ATLAS detector. The figure on the right shows the energy deposits in the cells of the ATLAS calorimeter. The figure at the bottom shows a side view of the ATLAS detector. Starting from the center of the ATLAS detector, the hits and reconstructed tracks of the charged particles in the Inner Detector are shown as dots and colored lines, respectively. The energy deposits in the electromagnetic (the green layer) and hadronic (the red layer) calorimeters are shown as yellow boxes. The hits in the Muon Spectrometer (the outer blue layer) are shown as red and gray blocks.
|

|
|
Event display of a collision event (Run 423110, Event 184635) recorded in ATLAS on 28 May 2022, when stable beams of protons at the injection energy of 450 GeV per beam were delivered to ATLAS by the LHC. The view on the left shows a cut-out view of the ATLAS detector: from the interaction point, the orange lines represent reconstructed tracks, the green and yellow boxes show energy deposits in the electromagnetic (EMB and EMEC) and hadronic (Tile) calorimeters, respectively, and the teal blocks show energy deposits in the hadronic endcap calorimeter (HEC). The top right inset shows a projection of the reconstructed tracks on the transverse plane of the detector. The orange lines represent reconstructed tracks, the pink dots in the center show the measurements from the Pixel detector, the yellow boxes visualize the measurements from the SCT, and the white dots in the gray annulus represent measurements in the TRT. The energy deposits in the cells of the electromagnetic and hadronic calorimeters are shown in the green and yellow boxes respectively.
|

|
|
Event display of a collision event (Run 423110, Event 184635) recorded in ATLAS on 28 May 2022, when stable beams of protons at the injection energy of 450 GeV per beam were delivered to ATLAS by the LHC. The view in the center shows a cut-out view of the ATLAS detector: from the interaction point, the orange lines represent reconstructed tracks, the green and yellow boxes show energy deposits in the electromagnetic (EMB and EMEC) and hadronic (Tile) calorimeters respectively, the teal blocks show energy deposits in the hadronic endcap calorimeter, the semi-transparent blue boxes show measurements in the barrel muon chambers, and the green and purple boxes show measurements in the endcap muon chambers. The lower left inset shows a projection of the reconstructed tracks on the transverse plane of the detector. The orange lines represent reconstructed tracks, the pink dots in the center show the measurements from the Pixel detector, the yellow boxes visualize the measurements from the SCT, and the white dots in the gray annulus represent measurements in the TRT. The energy deposits in the cells of the electromagnetic (EMB and EMEC) and hadronic (Tile) calorimeters are shown in the green and yellow boxes respectively.
|

|
|
Event display of a collision event (Run 423110, Event 183777) recorded in ATLAS on 28 May 2022, when stable beams of protons at the injection energy of 450 GeV per beam were delivered to ATLAS by the LHC. The figure on the left shows an axial view of the ATLAS detector. The figure on the right shows the energy deposits in the cells of the ATLAS calorimeter. The figure at the bottom shows a side view of the ATLAS detector. Starting from the center of the ATLAS detector, the hits and reconstructed tracks of the charged particles in the Inner Detector are shown as dots and colored lines, respectively. The energy deposits in the electromagnetic (the green layer) and hadronic (the red layer) calorimeters are shown as yellow boxes. The hits in the Muon Spectrometer (the outer blue layer) are shown as red, gray and cyan blocks. A reconstructed candidate muon track is indicated by the cyan line in the Muon Spectrometer.
|

|
|
Event display of a collision event (Run 423110, Event 183777) recorded in ATLAS on 28 May 2022, when stable beams of protons at the injection energy of 450 GeV per beam were delivered to ATLAS by the LHC. The figure on the right shows a cut-out view of the ATLAS detector: from the interaction point, the orange lines represent tracks of charged particles reconstructed in the inner detector, the yellow blocks show energy deposits in the hadronic calorimeter, the teal blocks visualize energy deposits in the hadronic endcap calorimeter, the semi-transparent blue boxes are the barrel muon chambers, the red line represents the track of a muon reconstructed from measurements in the MDT (orange lines) and RPC (green lines) sub-detectors; the purple lines visualize other RPC hits. The figure in the lower left inset shows a side view of the ATLAS detector. Starting from the center of the detector, the orange lines represent tracks from charged particles reconstructed in the inner detector, the yellow blocks show energy deposits in the hadronic calorimeter (Tile), the teal blocks visualize energy deposits in the hadronic endcap calorimeter (HEC), the semi-transparent blue boxes are the muon chambers, the purple lines represent the muon track reconstructed from measurements in the MDT (orange/red lines) and RPC (purple lines) sub-detectors, and the green and purple boxes show measurements in the endcap muon chambers.
|

|
|
Event display of a splash event recorded by ATLAS during the LHC "beam splash" tests on Saturday 07 May 2022 as the LHC restarts in preparation for Run 3 data taking. In the beam splash tests, a single bunch of protons from the LHC hits a collimator placed in the beamline 140m in front of the ATLAS interaction point, thereby generating a large number of particles, which are then used to probe the correct operation of the ATLAS detector as a whole. Single bunches can hit the collimator in successive rotations in the LHC ring with decreasing intensities in each pass. This display (Run 420624, Event 556109) comes from the second pass of the bunch in the LHC ring. In this event display, the spray of particles enters ATLAS from the right hand side of the picture (the "A-Side" of the detector) travelling to the left (the "C-Side"). From the centre of the detector moving outwards, the image shows particle interactions in the TRT detector (red and white), the LAr (different hues of green) and Tile (yellow) calorimeters, MDT (blue), RPC (purple) and TGC (white) muon detectors, respectively. The orange lines in the two inlets on the right show the reconstructed muon segments. The data visualised in the picture have been recorded using a threshold-based data filter (the trigger) based on energy deposits in the electromagnetic calorimeter on the C-Side of the detector.
|

|
|
Event display of a splash event recorded by ATLAS during the LHC "beam splash" tests on Saturday 07 May 2022 as the LHC restarts in preparation for Run 3 data taking. In the beam splash tests, a single bunch of protons from the LHC hits a collimator placed in the beamline 140m in front of the ATLAS interaction point, thereby generating a large number of particles, which are then used to probe the correct operation of the ATLAS detector as a whole. Single bunches can hit the collimator in successive rotations in the LHC ring with decreasing intensities in each pass. This display (Run 420624, Event 556109) comes from the second pass of the bunch in the LHC ring. In this event display, the spray of particles enters ATLAS from the left hand side of the picture (the "A-Side" of the detector) travelling to the right (the "C-Side"). From the centre of the detector moving outwards, the image shows particle interactions in the TRT detector (red and white), the LAr (different hues of green) and Tile (yellow) calorimeters, MDT (blue) and RPC (purple) muon detectors, respectively. The data visualised in the picture have been recorded using a threshold-based data filter (the trigger) based on energy deposits in the electromagnetic calorimeter on the C-Side of the detector.
|

|
|
Event display of a splash event recorded by ATLAS during the LHC "beam splash" tests on Saturday 07 May 2022 as the LHC restarts in preparation for Run 3 data taking. In the beam splash tests, a single bunch of protons from the LHC hits a collimator placed in the beamline 140m in front of the ATLAS interaction point, thereby generating a large number of particles, which are then used to probe the correct operation of the ATLAS detector as a whole. Single bunches can hit the collimator in successive rotations in the LHC ring with decreasing intensities in each pass. This display (Run 420624, Event 556108) comes from the first pass of the bunch in the LHC ring. In this event display, the spray of particles enters ATLAS from the right hand side of the picture (the "A-Side" of the detector) travelling to the left (the "C-Side"). From the centre of the detector moving outwards, the image shows particle interactions in the TRT detector (red and white), the LAr (different hues of green) and Tile (yellow) calorimeters, MDT (blue), RPC (purple) and TGC (white) muon detectors, respectively. The orange lines in the two inlets on the right show the reconstructed muon segments. The data visualised in the picture have been recorded using a threshold-based data filter (the trigger) based on energy deposits in the electromagnetic calorimeter on the C-Side of the detector.
|

|
|
Event display of a splash event recorded by ATLAS during the LHC "beam splash" tests on Saturday 07 May 2022 as the LHC restarts in preparation for Run 3 data taking. In the beam splash tests, a single bunch of protons from the LHC hits a collimator placed in the beamline 140m in front of the ATLAS interaction point, thereby generating a large number of particles, which are then used to probe the correct operation of the ATLAS detector as a whole. Single bunches can hit the collimator in successive rotations in the LHC ring with decreasing intensities in each pass. This display (Run 420624, Event 556108) comes from the first pass of the bunch in the LHC ring. In this event display, the spray of particles enters ATLAS from the left hand side of the picture (the "A-Side" of the detector) travelling to the right (the "C-Side"). From the centre of the detector moving outwards, the image shows particle interactions in the TRT detector (red and white), the LAr (different hues of green) and Tile (yellow) calorimeters, MDT (blue) and RPC (purple) muon detectors, respectively. The data visualised in the picture have been recorded using a threshold-based data filter (the trigger) based on energy deposits in the electromagnetic calorimeter on the C-Side of the detector.
|

|
|
Event display of a splash event recorded by ATLAS during the LHC "beam splash" tests on Saturday 07 May 2022 as the LHC restarts in preparation for Run 3 data taking. In the beam splash tests, a single bunch of protons from the LHC hits a collimator placed in the beamline 140m in front of the ATLAS interaction point, thereby generating a large number of particles, which are then used to probe the correct operation of the ATLAS detector as a whole. Single bunches can hit the collimator in successive rotations in the LHC ring with decreasing intensities in each pass. This display (Run 420624, Event 556109) comes from the second pass of the bunch in the LHC ring. The spray of particles enters ATLAS from the right hand side of the picture (the "A-Side" of the detector) travelling to the left (the "C-Side"). The figure on the left shows an axial view of the ATLAS detector. The figure on the right shows the energy deposits in the cells of the ATLAS calorimeter. The figure at the bottom shows a side view of the ATLAS detector. From the centre of the detector moving outwards, the image shows particle interactions in the TRT detector, in the electromagnetic and hadronic calorimeters, and in the muon detectors, respectively. The data visualised in the picture have been recorded using a threshold-based data filter (the trigger) based on energy deposits in the electromagnetic calorimeter on the C-Side of the detector.
|

|
|
Event display of a splash event recorded by ATLAS during the LHC "beam splash" tests on Saturday 07 May 2022 as the LHC restarts in preparation for Run 3 data taking. In the beam splash tests, a single bunch of protons from the LHC hits a collimator placed in the beamline 140m in front of the ATLAS interaction point, thereby generating a large number of particles, which are then used to probe the correct operation of the ATLAS detector as a whole. Single bunches can hit the collimator in successive rotations in the LHC ring with decreasing intensities in each pass. This display (Run 420624, Event 556108) comes from the first pass of the bunch in the LHC ring. The spray of particles enters ATLAS from the right hand side of the picture (the "A-Side" of the detector) travelling to the left (the "C-Side"). The figure on the left shows an axial view of the ATLAS detector. The figure on the right shows the energy deposits in the cells of the ATLAS calorimeter. The figure at the bottom shows a side view of the ATLAS detector. From the centre of the detector moving outwards, the image shows particle interactions in the TRT detector, in the electromagnetic and hadronic calorimeters, and in the muon detectors, respectively. The data visualised in the picture have been recorded using a threshold-based data filter (the trigger) based on energy deposits in the electromagnetic calorimeter on the C-Side of the detector.
|

|
| Event display of a splash event recorded by ATLAS during the LHC "beam splash" tests on Thursday 28 April 2022 as the LHC restarts in preparation for Run 3 data taking. In the beam splash tests, a single proton beam from the LHC hits a collimator placed in the beamline before the ATLAS detector. In this event display (Run 419373, Event 611639), the spray of particles enters ATLAS from the right hand side of the picture (the "A-Side" of the detector) travelling to the left (the "C-Side"). The figure on the left shows an axial view of the ATLAS detector. The figure on the right shows the energy deposits in the cells of the ATLAS calorimeter. The figure at the bottom shows a side view of the ATLAS detector. From the centre of the detector moving outwards, the image shows particle interactions in the TRT detector, in the electromagnetic and hadronic calorimeters, and in the muon detectors, respectively. The data visualised in the picture have been recorded using a threshold-based data filter (the trigger) based on energy deposits in the electromagnetic calorimeter on the C-Side of the detector.
|

|
| Event display of a splash event recorded by ATLAS during the LHC "beam splash" tests on Thursday 28 April 2022 as the LHC restarts in preparation for Run 3 data taking. In the beam splash tests, a single proton beam from the LHC hits a collimator placed in the beamline before the ATLAS detector. In this event display (Run 419373, Event 642936), the spray of particles enters ATLAS from the left hand side of the picture (the "C-Side" of the detector) travelling to the right (the "A-Side"). The figure on the left shows an axial view of the ATLAS detector. The figure on the right shows the energy deposits in the cells of the ATLAS calorimeter. The figure at the bottom shows a side view of the ATLAS detector. From the centre of the detector moving outwards, the image shows particle interactions in the TRT detector, in the electromagnetic and hadronic calorimeters, and in the muon detectors, respectively. The data visualised in the picture have been recorded using a threshold-based data filter (the trigger) based on energy deposits in the electromagnetic calorimeter on the A-Side of the detector.
|

|
| On Friday 22 April 2022, the first events from the LHC "beam splash" tests were recorded by the ATLAS experiment as the LHC restarts in preparation for Run 3. During the beam splash tests, a single proton beam from the LHC hits a collimator placed in the beamline before the ATLAS detector. In this event display (Run 418554, Event 188446), the spray of particles enters ATLAS from the left hand side of the picture (the "C-Side" of the detector) travelling to the right (the "A-Side"). The figure on the left shows an axial view of the ATLAS detector. The figure on the right shows the energy deposits in the cells of the ATLAS calorimeter. The figure at the bottom shows a side view of the ATLAS detector. From the centre of the detector moving outwards, the image shows particle interactions in the TRT detector, in the electromagnetic and hadronic calorimeters, and in the muon detectors, respectively. The data visualised in the picture have been recorded using a threshold-based data filter (the trigger) based on energy deposits in the electromagnetic calorimeter on the A-Side of the detector.
|

|
| On Friday 22 April 2022, the first events from the LHC "beam splash" tests were recorded by the ATLAS experiment as the LHC restarts in preparation for Run 3. During the beam splash tests, a single proton beam from the LHC hits a collimator placed in the beamline before the ATLAS detector. In this event display (Run 418554, Event 188446), the spray of particles enters ATLAS from the left hand side of the picture (the "C-Side" of the detector) travelling to the right (the "A-Side"). From the centre of the detector moving outwards, the image shows particle interactions in the TRT detector (red and white), in the electromagnetic (different hues of green) and hadronic (yellow and orange) calorimeters, respectively. The data visualised in the picture have been recorded using a threshold-based data filter (the trigger) based on energy deposits in the electromagnetic calorimeter on the A-Side of the detector.
|

|
Beam splashes and 450 GeV Test Collisions fall 2021
| On Tuesday 19 Oct 2021, the first events from the LHC "beam splash" tests were recorded by ATLAS. These tests are the first observations of particle collisions as the LHC restarts in preparation for Run 3, and are used by the experiments to check that all instruments, workflows, machines, and software run as expected. During such beam splash tests, the particle beam accelerated by the LHC is focused on a fixed target placed in the beamline before the detector, and the particles created in the interaction move on, along the beamline and outwards. They pass through many layers of particle detectors, interact with them and leave some amount of their energy. In the image, a cutout view of the ATLAS detector is shown. The pipe at the centre is the beampipe, conveying accelerated particles from the LHC; in this particular event, a single proton test beam from the LHC (known as beam 1) is coming into the ATLAS detector, from the left of the picture (which shows the so-called "A-Side" of the detector) and travelling to the right (showing the "C-Side"). The red/white stripes are used to visualise the particle-matter interactions in the inner layers (here showing the interaction with the TRT, which is part of the inner tracking detectors); green boxes show the energy deposits in the LAr calorimeters, which are specially built concentric to the beamline to interact with electrons and photons and also in the forward regions to interact with hadrons; and yellow boxes visualise energy deposits in the TileCal hadronic calorimeter conceived to detect hadrons. The blue boxes surrounding the central part of the image are part of the ATLAS muon spectrometer, and they are shown here for context. The data visualised in the picture have been recorded using a threshold-based data filter (the trigger) based on energy deposits in the electromagnetic calorimeter on the C-Side of the detector (in particular, the L1_EM20C). By looking at images like this one, ATLAS physicists can check that all the sub-detectors are working and confirm the validity of the data taking. This is an important step in testing the whole data workflow, in anticipation of stable beams with proton collisions.
|

|
| On Tuesday 19 Oct 2021, the first events from the LHC "beam splash" tests were recorded by ATLAS. These tests are the first observations of particle collisions as the LHC restarts in preparation for Run 3, and are used by the experiments to check that all instruments, workflows, machines, and software run as expected. During such beam splash tests, the particle beam accelerated by the LHC is focused on a fixed target placed in the beamline before the detector, and the particles created in the interaction move on, along the beamline and outwards. They pass through many layers of particle detectors, interact with them and leave some amount of their energy. In the image, a cutout view of the ATLAS detector is shown. The pipe at the centre is the beampipe, conveying accelerated particles from the LHC; in this particular event, a single proton test beam from the LHC (known as beam 1) is coming into the ATLAS detector, from the left of the picture (which shows the so-called "A-Side" of the detector) and travelling to the right (showing the "C-Side"). The red/white stripes are used to visualise the particle-matter interaction in the inner layers (here showing the interaction with the TRT, which is part of the inner tracking detectors); green boxes show the energy deposits in the LAr calorimeters, which are specially built concentric to the beamline to interact with electrons and photons, and also in the forward regions to interact with hadrons; and yellow boxes visualise energy deposits in the TileCal hadronic calorimeter conceived to detect hadrons. The orange stripes surrounding the inner part of the detector show energy deposits in the MDT chambers; these chambers are part of the ATLAS Muon Spectrometer, the system dedicated to the detection and measurement of muons. The image also shows the barrel toroid, the large black toroidal structure surrounding the detector in the central region, and the two barrel end-caps: as part of the ATLAS magnets, they provide the main magnetic field needed to bend the particles, to measure their momentum. The large wheel-shaped grey frame is part of the supporting structures for the muon chambers and is shown here for context. The data visualised in the picture have been recorded using a threshold-based data filter (the trigger) based on energy deposits in the electromagnetic calorimeter on the C-Side of the detector (in particular, the L1_EM20C). By looking at images like this one, ATLAS physicists can check that all the sub-detectors are working well and confirm the validity of the data taking. This is an important step in testing the whole data workflow, in anticipation of stable beams with proton collisions.
|

|
| On Tuesday 19 Oct 2021, the first events from the LHC "beam splash" tests were recorded by ATLAS. These tests are the first observations of particle collisions as the LHC restarts in preparation for Run 3, and are used by the experiments to check that all instruments, workflows, machines, and software run as expected. During such beam splash tests, the particle beam accelerated by the LHC is focused on a fixed target placed in the beamline before the detector, and the particles created in the interaction move on, along the beamline and outwards. They pass through many layers of particle detectors, interact with them and leave some amount of their energy. In this particular event, as shown in the bottom left picture, a single proton test beam from LHC (known as beam 1) is coming into the ATLAS detector from the right of the picture (the so called "A-Side" of the detector) travelling to the left (the "C-Side"). In the image, the yellow boxes show energy deposits in all layers of the ATLAS detector. From the centre moving outwards, the image shows particle interactions in the inner tracking detectors, in the electromagnetic and hadronic calorimeters, and in the muon detectors, respectively. The data visualised in the picture have been recorded using a threshold-based data filter (the trigger) based on energy deposits in the electromagnetic calorimeter on the C-Side of the detector (in particular, the L1_EM20C). By looking at images like this one, ATLAS physicists can check that all the sub-detectors are working well and confirm the validity of the data taking. This is an important step in testing the whole data workflow, in anticipation of stable beams with proton collisions.
|

|
| During "beam splash" tests, particle bunches accelerated in the Large Hadron Collider (LHC) are directed towards a fixed target, thereby generating a large number of particles, which are then used to probe the correct operation of the ATLAS detector as a whole. In this display, a single bunch hit the fixed target three times in a row, each time making another turn in the LHC ring on 19 October 2021. The image shows the energy deposited from the interaction of the particles generated in the three subsequent "beam splash" events. For each event, the LHC turn number and two views are provided: a transversal view (on the left of each row) and a cut-out view of the ATLAS detector (on the right). The view on the left shows the energy deposits in the barrel electromagnetic calorimeter (shown as green boxes) and in the barrel and endcap hadronic calorimeter (shown as yellow boxes). The view on the right shows a cut-out 3D view of the ATLAS detector, focusing on the areas of the inner tracking detectors and the calorimeters. The pipe at the centre is the beampipe, conveying accelerated particles from the LHC. The red/white rings visualise the particle-matter interaction in the inner layers (here showing the interaction with the TRT, which is part of the inner tracking detectors); green boxes show the energy deposits in the LAr calorimeters, which are specially built concentric to the beamline to interact with electrons and photons, and also in the forward regions to interact with hadrons; and yellow boxes visualise energy deposits in the TileCal hadronic calorimeter conceived to detect hadrons. The three visualisations clearly show the decrease of the amount of energy generated by the each "beam splash" and deposited into the ATLAS detector at each turn of the single proton bunch in the LHC ring.
|

|
| Event display of a test collision event recorded in ATLAS on 29 October 2021, when stable beams of protons at the injection energy of 450 GeV per beam were delivered to ATLAS during the LHC pilot beam test. Starting from the center of the ATLAS detector, the hits and reconstructed tracks of the charged particles in the Inner Detector are shown as dots and colored lines, respectively. The energy deposits in the LAr calorimeter (the green layer) and Tile calorimeter (the red layer) are shown as yellow boxes. The reconstructed track segments and their associated hits in the Muon Spectrometer (the outer blue layer) are shown as green lines and yellow blocks, respectively.
|

|
| Event display of a test collision event recorded in ATLAS on 29 October 2021, when stable beams of protons at the injection energy of 450 GeV per beam were delivered to ATLAS during the LHC pilot beam test. The view on the right shows a cut-out view of the ATLAS detector: from the center, the orange lines represent reconstructed tracks, and the green and yellow boxes show energy deposits in the electromagnetic and hadronic calorimeters, respectively. The top left inset shows a projection of the reconstructed tracks on the transversal plane of the detector, with the energy deposits in the cells of the electromagnetic calorimeter (barrel and endcap areas) and the barrel hadronic calorimeter. The bottom left inset shows a detailed view of the reconstructed tracks and hits from the inner tracking detectors; starting from the center, the four layers of white dots represent measurements from the Pixel detector; the yellow lines and boxes visualize the measurements from the SCT detector; the white, red, and orange dots contained in the annulus grey area represent the measurements from the TRT detector, with the orange being the measurements associated with the reconstructed tracks.
|

|
| Event display of a test collision event recorded in ATLAS on 29 October 2021, when stable beams of protons at the injection energy of 450 GeV per beam were delivered to ATLAS during the LHC pilot beam test. The view on the left shows a cut-out view of the ATLAS detector: from the center, the orange lines represent reconstructed tracks; the green and yellow boxes show energy deposits in the electromagnetic and hadronic calorimeters respectively; the purple tracklets visualize the passage of a muon through the barrel and endcap muon chambers, represented as blue and green boxes respectively. The top right inset shows a projection of the reconstructed tracks on the transversal plane of the detector, with the energy deposits in the cells of the electromagnetic calorimeter (barrel and endcap areas) and the barrel hadronic calorimeter. The bottom right inset shows a detailed view of the reconstructed tracks and hits from the inner tracking detectors; starting from the center, the four layers of white dots represent measurements from the Pixel detector; the yellow lines and boxes visualize the measurements from the SCT detector; the white, red, and orange dots contained in the annulus grey area represent the measurements from the TRT detector, with the orange being the measurements associated with the reconstructed tracks.
|

|
Major updates:
-- ManuellaVincter - 2021-10-23
Responsible: ManuellaVincter
Subject: public


Copyright &© 2008-2024 by the contributing authors. All material on this collaboration platform is the property of the contributing authors.
or Ideas, requests, problems regarding TWiki? use
Discourse or
Send feedback


