
JetEtmissApproved2011EtmissWithPileup
Etmiss performance under high pile conditions in 2011 data
|
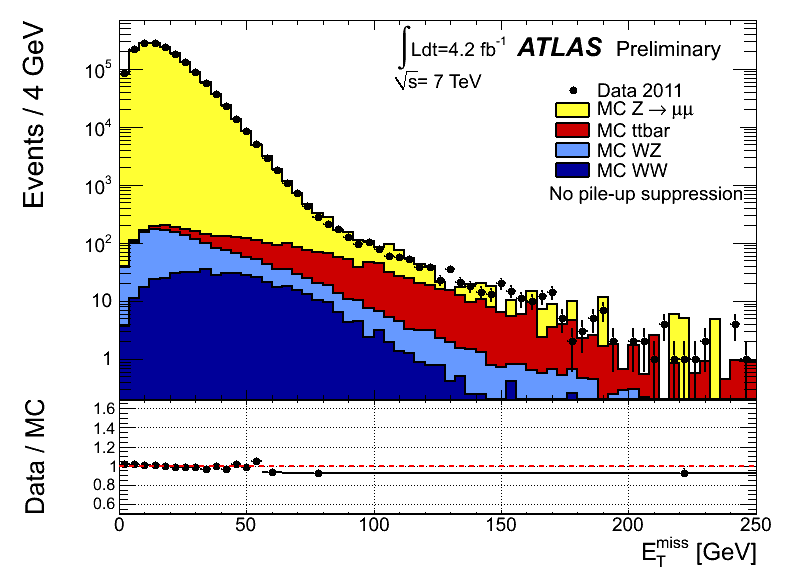
[MET distribution in Z events]
Distribution of missing ET as measured in a data sample of Z->μμ events.
The expectation from Monte Carlo simulation is superimposed and normalized to data, after
each MC sample is weighted with its corresponding cross-section.
The lower part of the figure shows the ratio between data and MC distributions.
eps file
gif file
|  |
|
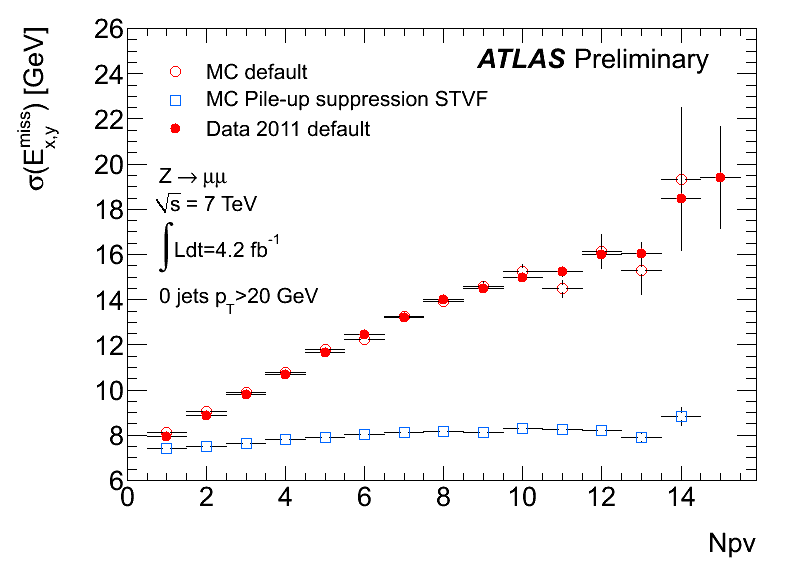
[Etmiss resolution vs number of reconstructed vertices]
Resolution of x and y missing ET components as a function of the number of primary vertices without pile-up suppression for data and MC in events with Z bosons produced without jets above 20 GeV in pT. The resolution after pile-up suppression, based on the ratio of the sum pT of the tracks associated to the primary vertex and all tracks not associated to reconstructed objects, is shown for MC simulation.
eps file
gif file
|  |
|
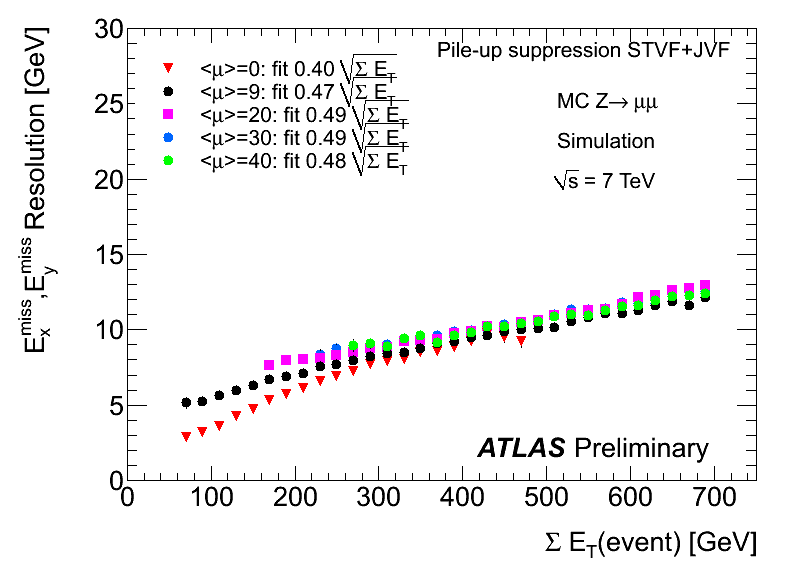
[Etmiss resolution vs SumEt for number of interactions]
Resolution of x and y missing ET component as a function of the scalar sum of transverse energies of all the calorimeter energy depositions and muons(SumET) without pile-up suppression. Simulated Z->μμ events with different values of the average number of interactions per bunch crossing (<μ>) are shown. The numbers in the legend result from the fit of the resolutions parameterization as a function of sqrt(SumET).
eps file
gif file
|  |
|
[Etmiss resolution vs SumEt for number of interactions after pile-up interactions]
Resolution of x and y missing ET components as a function of the scalar sum of transverse energies of all the calorimeter energy depositions and muons (SumET), after pile-up suppression, based on the ratio of the sum pT of the tracks associated to the primary vertex and all tracks.
The SumET on the abscissa is not corrected for pile-up. Simulated Z->μμ events with different values of the average number of interactions per bunch crossing(<μ>) are shown. The numbers in the legend result from the fit of the resolutions parameterization as a function of sqrt(SumET).
The worsening of the bias in Etmiss response for pTZ=40 GeV after pile-up suppression, averaged on the different <μ> samples, is of the order of 1 GeV.
eps file
gif file
|  |
Major updates:
-- TancrediCarli - 01-Jun-2012
Responsible: TancrediCarli
Subject: public


Copyright &© 2008-2024 by the contributing authors. All material on this collaboration platform is the property of the contributing authors.
or Ideas, requests, problems regarding TWiki? use
Discourse or
Send feedback


