
JetEtmissApproved2011PileupOffsetAndJVF
| [Jet Offset in data (I)] Calorimeter jet pT as a function of number of reconstructed primary vertices (NPV), for the central pseudo-rapidity region. Calorimeter jets reconstructed at the EM scale are associated to track jets in bins of pT. Each point shows the most probable value of calorimeter jet pT, for a specific pT (track jet) range and NPV. eps file png file |  |
| [Jet Offset in data (II)] a pT-independent pile-up correction based on simulation (MC11a) is applied to calorimeter jets, and is found to greatly reduce the pile-up contribution. Note that by construction, the pile-up correction is close to zero at the average number of primary vertices, NPV = 5.4. eps file png file | 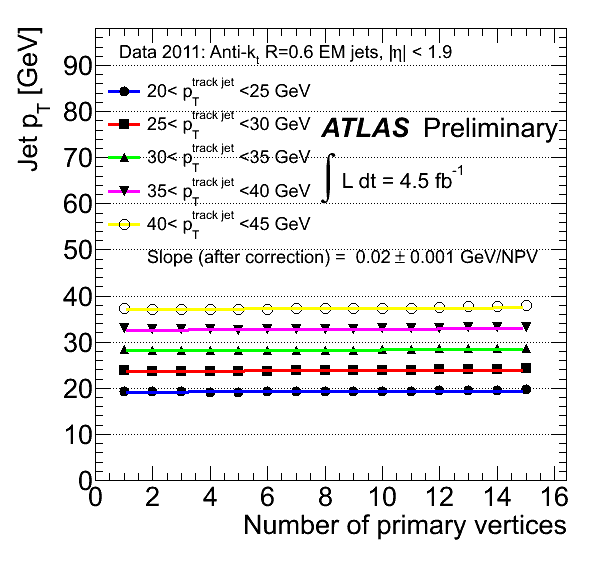 |
| [Jet Offset at high luminosity] A data set with an integrated luminosity of 0.4 pb-1 and approximately 30 interactions per bunch crossing. Reconstructed tracks originating from the chosen primary vertex were matched within &DeltaR < 0.6 to anti-kt R = 0.6 topo-cluster jets. The sum of the pT of the matched tracks is insensitive to pile-up and correlated with the true jet pT. In each bin of matched track pT, we see clearly the dependence of the calorimeter jet pT on in-time pile-up, as described by the number of reconstructed primary vertices (NPV). This dependence remains linear up to at least NPV = 30, and it is in quantitative agreement with the results of similar studies performed in 2011 data with significantly less pile-up. eps file png file |  |
| [Jet Vertex Fraction Discriminant] The jet vertex fraction (JVF) quantifies the fraction of track transverse momentum associated to a jet from the hard-scattering interaction. Discrimination between jets produced in the hard-scatter and those originating in pile-up using the JVF in events simulated at L=2×1033cm-‐2s‐1 and 25 ns bunch spacing. Monte Carlo truth information is used to separate jets from pile-up with pT > 20 GeV in the central region of the detector, and the JVF discriminant is shown for each class of jets. eps file png file |  |
| [Jet Vertex Fraction Distribution in Z events] The jet vertex fraction (JVF) distribution in data and Monte Carlo simulation for jets in in Z → ll (l = e, μ) events. Events must contain at least one primary vertex consisting of 3 or more tracks and are then required to contain exactly two leptons (which are oppositely signed in the case of muons) with pT > 20 GeV and |η| < 2.5 which form an invariant mass 76 < mll < 106 GeV. Jets are reconstructed using an anti‐kt algorithm with distance parameter R = 0.4 and are required to have pT > 25 GeV and |η| < 2.5. The Monte Carlo overestimates the number of jets at low values of JVF, where the jets have a large contribution from vertices coming from additional proton-proton interactions (pile-up). eps file png file | 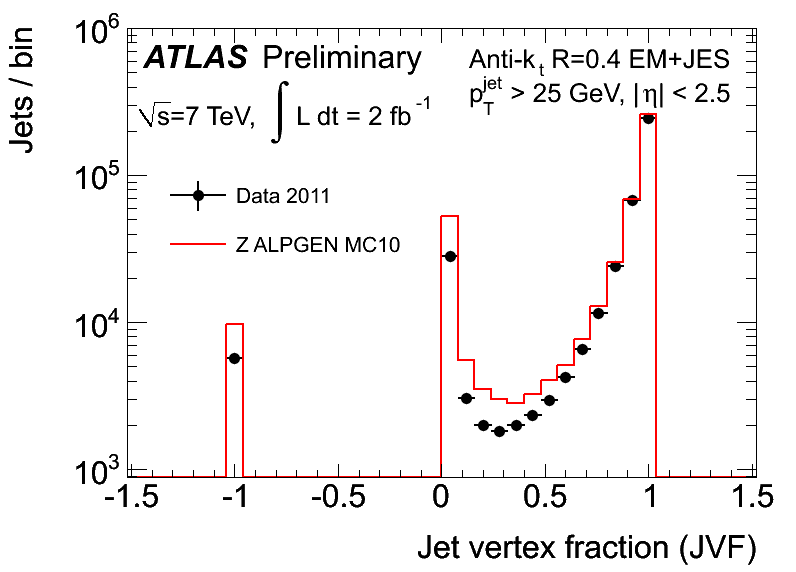 |
|
[Jet Vertex Fraction performance in Z events]
The average number of jets, Njet, before (black) and after (red) a cut
on the jet vertex fraction, |JVF|>0.75, as a function of the number of
primary vertices (containing at least 3 tracks) in data and Monte Carlo
simulation for jets in Z → ll (l = e, μ) events. Events are required to
contain exactly two leptons (which are oppositely signed in the case of
muons) with pT > 20 GeV and |η| < 2.5 which form an invariant mass 76 <
mll < 106 GeV. Jets are reconstructed using an anti-kt algorithm with
distance parameter D = 0.4 and are required to have pT > 2 GeV and
|η| < 2.5. Before the JVF cut, |  |
Major updates:
-- ArielSchwartzman - 04-Jan-2012 Responsible: ArielSchwartzman
Subject: public
Topic revision: r3 - 2012-01-06 - ArielSchwartzman

or Ideas, requests, problems regarding TWiki? use Discourse or Send feedback