
JetEtmissApproved2013HighMuEtmiss
Information Common To All Plots ρ is calculated using kt R=0.4 jets reconstructed from locally calibrated (LCW) topoclusters within |η|<2. The density calculation is with respect to the Voronoi area of the jets as defined in JHEP 0804 (2008) 005| ETmiss linearity as a function of the true ETmiss in events with different number of interactions per bunch crossing (<μ>), in Z'->ttbar (mZ=2 TeV) events for 25 ns bunch spacing. ETmiss is calculated taking into account only the calorimeter deposits. The ETmiss linearity is expected to be zero if the reconstructed ETmiss has the correct scale. The positive bias at low true ETmiss is due to the finite resolution of the ETmiss measurement, and is highly dependent on the topology of the process studied. For true ETmiss above 150 GeV (250 GeV) and <μ>=40 (<μ>=140), the linearity is within ~1%. The ETmiss value at which the linearity reaches a constant value increases with <μ>, due to the poorer resolution in high <μ> events. The evolution of the resolution as a function of <μ> was also studied and is consistent with the results shown here. |  [eps] |
| Dependence of the pile-up contribution to ∑ET on μ in Z'->ttbar (mZ=2 TeV) events with different numbers of interactions per bunch crossing (<μ>) and 25 ns bunch spacing. ETmiss is calculated taking into account only the calorimeter deposits. The pileup noise (σnoisepile-up) used in the topoclustering is optimized for each value of pileup. The pileup contribution to ∑ET is defined as ∑ETPU = ∑ET ∑ETTruth where ∑ETTruth is due to all the interacting particles from the hard scatter, excluding muons. The points are fitted by ∑ETPU=c√μ. The resolution worsens as <μ> increases, but the effect is mitigated by use of the optimized σnoisepile-up value. | 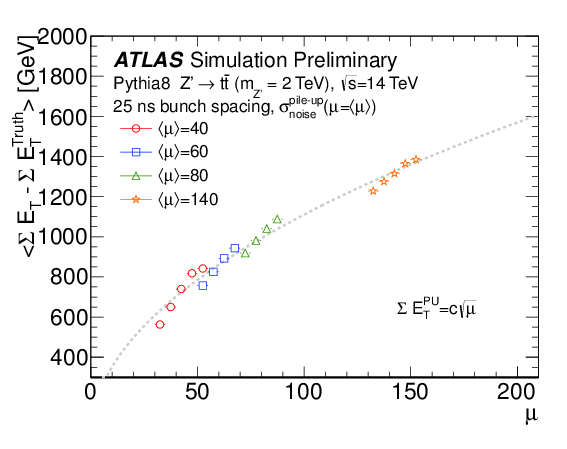 [eps] |
| Ex,ymiss resolution as a function of ∑ET in Z'-> ttbar (mZ=2 TeV) events and 25 ns bunch spacing, in events with different numbers of interactions per bunch crossing (<μ>). ETmiss is calculated taking into account only the calorimeter deposits. The pileup noise (σnoisepile-up) used in the topoclustering is optimized for each value of <μ>. The resolution curves are fitted with s+k √ ∑ET . For events with higher levels of pile-up the distribution gets shifted upwards but does not change its slope as a function of ∑ET. This effectively means that in the resolution curves the <μ> dependence is absorbed by the s-term, whereas the k-term remains approximately constant. |  [eps] |
| Ex,ymiss resolution as a function of the number of truth vertices (Nvtx) in Z'-> ttbar (mZ=2 TeV) events and 25 ns bunch spacing, in events with different numbers of interactions per bunch crossing (<μ>). ETmiss is calculated taking into account only the calorimeter deposits. The pileup noise (σnoisepile-up) used in the topoclustering is optimized for each value of <μ>. The resolution is fitted with a straight line to show that the Ex,ymiss resolution increases linearly with the number of truth vertices, and independently of <μ>, when the optimal pileup noise values are used. |  [eps] |
| Ex,ymiss resolution as a function of the number of truth vertices (Nvtx) in events with an average of 40 interactions per bunch crossing (<μ>) for different values of pileup noise (σnoisepile-up) in dijet events at 25 ns bunch spacing. ETmiss is calculated taking into account only the calorimeter deposits. In general, tightening σnoisepile-up results in poorer Ex,ymiss resolution. | 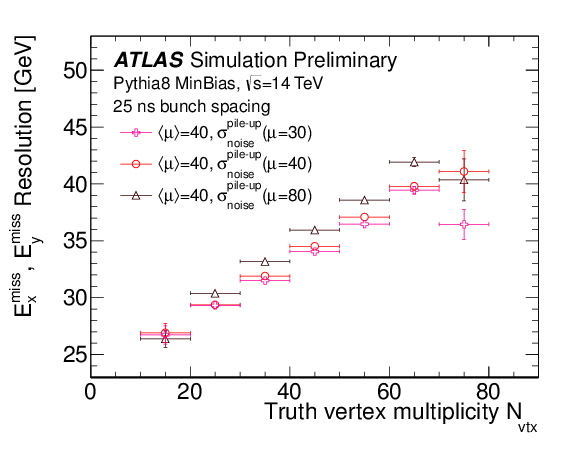 [eps] |
Major updates:
-- MichaelBegel - 29-Jul-2013 Responsible: MichaelBegel
Subject: public
Topic revision: r2 - 2013-07-30 - MichaelBegel

or Ideas, requests, problems regarding TWiki? use Discourse or Send feedback