 Information Common To All Plots
ρ is calculated using kt R=0.4 jets reconstructed from
locally calibrated (LCW) topoclusters within |η|<2. The density
calculation is with respect to the Voronoi area of the jets as defined
in JHEP 0804 (2008) 005
Information Common To All Plots
ρ is calculated using kt R=0.4 jets reconstructed from
locally calibrated (LCW) topoclusters within |η|<2. The density
calculation is with respect to the Voronoi area of the jets as defined
in JHEP 0804 (2008) 005| Distributions of the event-by-event median pT density (ρ) for different values of the mean number of interactions per bunch crossing (<μ>). Despite the optimization of the noise thresholds in each case, an increase in the RMS of the ρ distribution is observed with higher values of <μ>. | 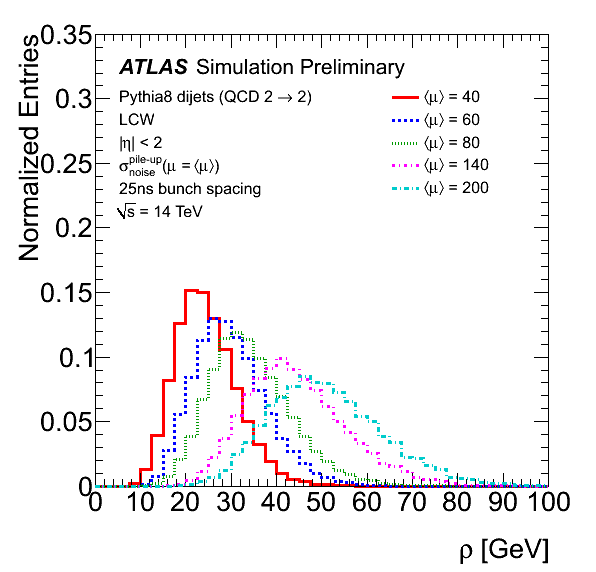 [eps] | |
| Dependence of the event-by-event median pT density (ρ) on the mean number of interactions per bunch crossing (<μ>). For each choice of pileup noise (σnoisepile-up), the dependence is approximately linear. The effect of increasing the pileup noise value is visible as a moderation of the effect of pileup on ρ. Optimization of σnoisepile-up results in partial suppression of pileup activity in the calorimeter. |  [eps] | |
| The residual dependence of reconstructed jet pT on in-time (left) and out-of-time (right) pileup as a function of |η|, after subtraction of the pileup contribution to the jet pT. This contribution is calculated as the median event-by-event pT density (ρ) multiplied by the jet area (A). The residual dependence is largest in the forward region, as ρ is calculated in the central region only. It is observed that the choice of the pileup noise (σnoisepile-up) has a small effect on the residual pileup dependence. | 
[eps] |

[eps] |
| The mean pT response of anti‐kt R=0.4 jets as a function of truth jet pT for events with 80 interactions per bunch crossing (solid lines, <μ>=80) and with no pileup (dotted lines, <μ>=0). In <μ>=80 events, there is a significant increase in the response due to the additional contribution of pileup particles; this additional energy from pileup is not correlated with the hard scatter jet pT. Three different values of pileup noise (σnoisepile-up) are chosen for both <μ>=80 and <μ>=0 events. Higher values of sigma reduce the pT response in both cases. In events with no pileup this indicates that signal is being suppressed. In events with <μ>=80, higher values of σnoisepile-up partially reduce the extra energy from pileup, but σnoisepile-up alone is not able to fully restore the jet response to that of the jets with <μ>=0. | 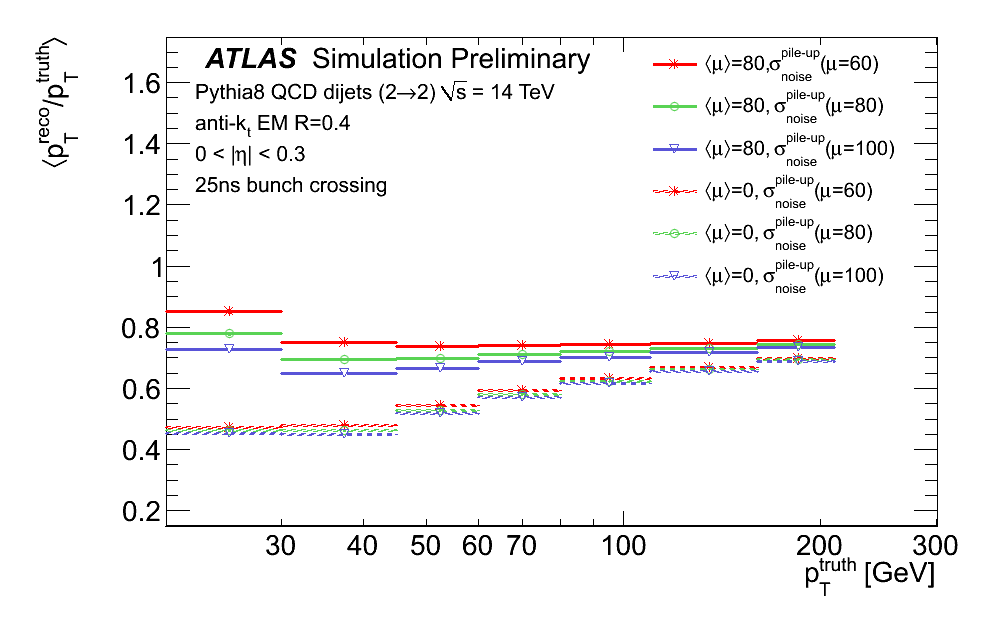 [eps] | |
| The mean pT response of anti‐kt R=0.4 jets as a function of truth jet pT for events with 80 interactions per bunch crossing (solid lines, <μ>=80) and with no pileup (dotted lines, <μ>=0). In the case of <μ>=80 events, the response is shown after each step of the jet energy scale calibration. Green: before pileup subtraction and calibration (EM scale). Light blue: after pileup subtraction and residual pileup correction using the event-by-event median pT density, ρ. Pileup subtraction restores the jet response to that of the jets with <μ>=0. Application of the jet energy scale correction restores the response to unity. |  [eps] | |
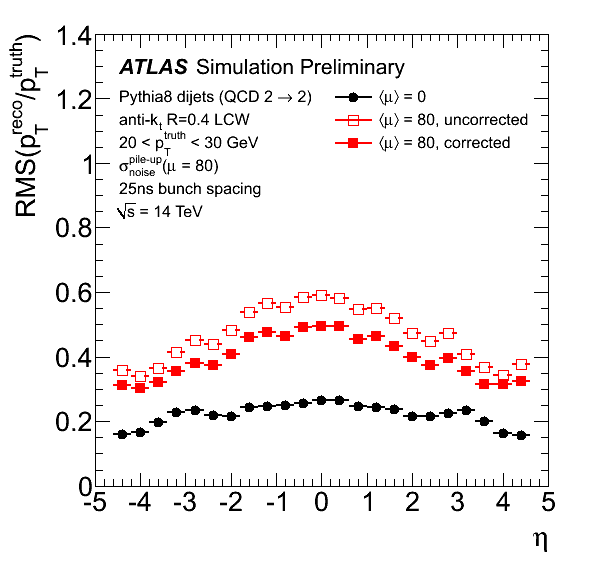
| The RMS width of the pT response distribution for reconstructed jets as a function of eta. Truth jets are built using stable particles from the hard-scatter collision, excluding muons and neutrinos. The black circles represent simulated data without pileup. The closed (open) squares correspond to simulated data with pileup before (after) the application of the event-by-event jet area pileup subtraction using the median pT density. The degradation in the width of the response distribution increases with increased pileup activity, though in each case the pileup subtraction procedure is able to recover ~25% of the degradation in the central region of the calorimeter. The remaining degradation may be attributed to local fluctuations in pileup activity. Finally, it is also seen that the choice of pileup noise has comparatively little effect on the RMS in the absence of pileup. | 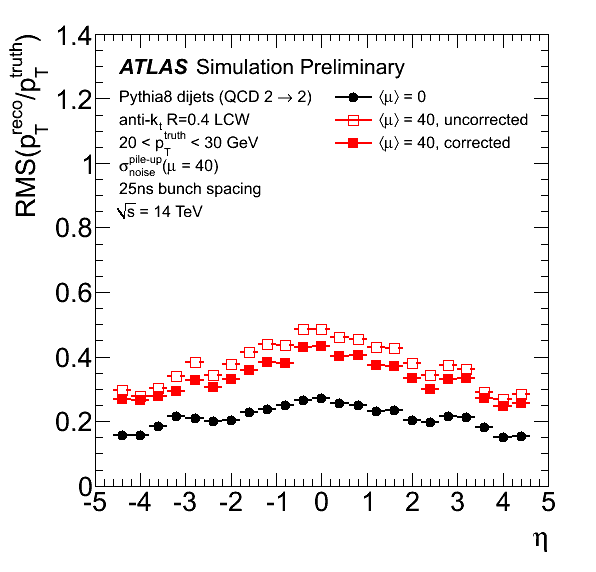
[eps] 
[eps] |
[eps] 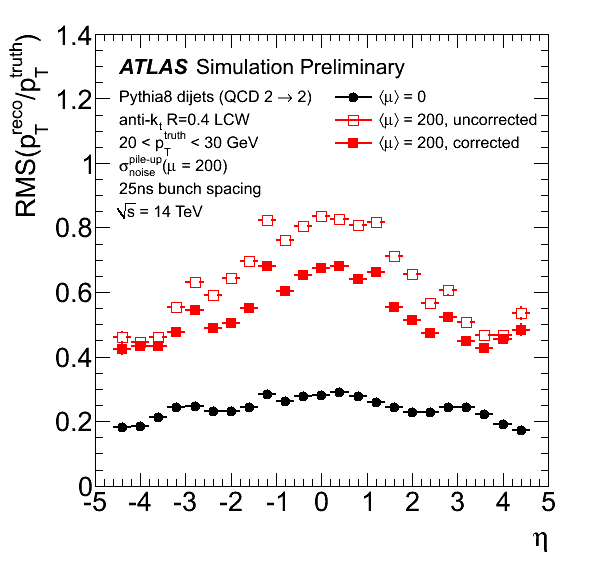
[eps] |
| The fractional jet energy resolution (Eur. Phys. J. C, 73 3 (2013) 2306) as a function of truth jet pT for different values of the mean number of interactions per bunch crossing (<μ>). Reconstructed jets have been calibrated to the EM+JES scale, including the pileup correction. This correction uses the event-by-event median pT density (ρ) to subtract the effects of pileup from the jet pT. The value of pileup noise (σnoisepile-up) used in the topoclustering is optimized for each value of <μ> except in the case of no pileup <μ>=0; in this case the value of σnoisepile-up is optimized for <μ>=30, as it is in 2012 data. The increased fractional resolution with <μ> is due to local fluctuations in the pileup activity within events, which is not captured by the global event-by‐event median pT density (ρ) used in calibration. | 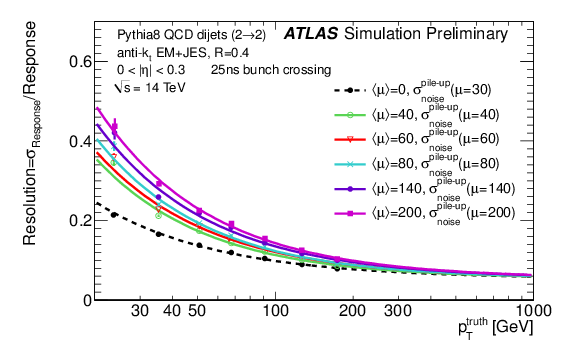 [eps] | |
| The noise term of the anti-kt R=0.4 jet energy resolution as a function of the mean number of interactions per bunch crossing (<μ>). Reconstructed jets have been calibrated to EM+JES scale, including the pileup correction. This correction uses the event-by-event median pT density (ρ) to subtract the effects of pileup from the jet pT. The red asterisks represent jets in events where the pileup noise (σnoisepile-up) is optimized for the value of <μ>. The dashed black line indicates the value of the noise term for jets in events with no pileup (μ=0) and a σnoisepile-up value optimized for <μ>=30, as used in 2012 data. The noise term is extracted by fitng the fractional energy resolution with a noise, stochastic, and constant term as defined in Eur. Phys. J. C, 73 3 (2013) 2306. The constant term is calculated for jets in events with μ=0. It is observed that the noise term increases as √ μ |  [eps] | |
Major updates:
-- MichaelBegel - 26-Jul-2013 Responsible: MichaelBegel
Subject: public
Topic revision: r4 - 2013-07-30 - MichaelBegel
or Ideas, requests, problems regarding TWiki? use Discourse or Send feedback
