 Information Common To All Plots
ρ is calculated using kt R=0.4 jets reconstructed from
locally calibrated (LCW) topoclusters within |η|<2. The density
calculation is with respect to the Voronoi area of the jets as defined
in JHEP 0804 (2008) 005
Information Common To All Plots
ρ is calculated using kt R=0.4 jets reconstructed from
locally calibrated (LCW) topoclusters within |η|<2. The density
calculation is with respect to the Voronoi area of the jets as defined
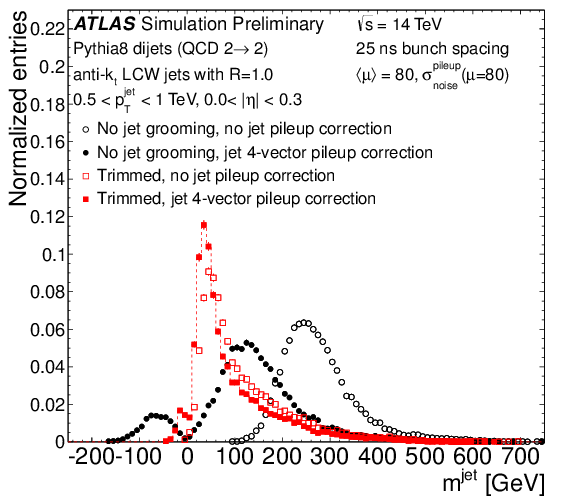
in JHEP 0804 (2008) 005| The anti‐kt R=1.0 jet mass distribution in dijet events where the mean number of interactions per bunch crossing (<μ>) is 40, 80, 140, and 200. Four measurements are shown for each value of <μ>. The open circles represent ungroomed jets with no correction for pileup. The closed black circles represent ungroomed jets after correcting the jet 4-vector using the event-by-event median pT density (ρ) and the jet area. The open (closed) squares represent trimmed jets before (after) pileup correction. When both trimming and the 4-vector pileup correction are applied (closed squares) the pileup correction is made to the subjets only, before their pT fraction is calculated. After 4-vector jet pileup correction, a fraction of jets can acquire negative mass; this is understood in terms of local fluctuations in the pT density that result in an over-correction. | 
[eps] 
[eps] |
[eps] 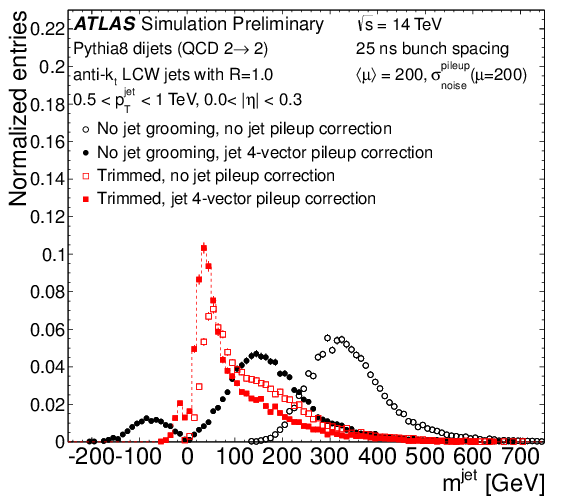
[eps] |
| The anti‐kt R=1.0 jet mass distribution in Z′→ttbar events where the mean number of interactions per bunch crossing (<μ>) is 40, 80, 140, and 200. Four measurements are shown for each value of <μ>. The open circles represent ungroomed jets with no correction for pileup. The closed black circles represent ungroomed jets after correcting the jet 4-vector using the event-by-event median pT density (ρ) and the jet area. The open (closed) squares represent trimmed jets before (after) pileup correction. When both trimming and the 4-vector pileup correction are applied (closed squares) the pileup correction is made to the subjets only, before their pT fraction is calculated. After 4-vector jet pileup correction, a fraction of jets can acquire negative mass; this is understood in terms of local fluctuations in the pT density that result in an over-correction. |

[eps] 
[eps] 
[eps] |

[eps] 
[eps] |
| The anti‐kt R=1.0 jet mass distribution in dijet events where the mean number of interactions per bunch crossing (<μ>) is 40, 80, 140, and 200. Four measurements are shown: ungroomed jets with no correction for pileup, ungroomed jets after correcting the jet 4-vector using the event-by-event median pT density (ρ) and the jet area, trimmed jets before pileup correction, and jets after both trimming and the 4-vector pileup correction are applied. The pileup correction is made to the subjets only, before their pT fraction is calculated. After 4-vector jet pileup correction, a fraction of jets can acquire negative mass; this is understood in terms of local fluctuations in the pT density that results in an over correction. The shape of the mass distribution is clearly dependent on <μ>, even after trimming. When both trimming and jet 4-vector pileup subtraction are applied, the jet mass distribution is stable even at <μ>=200. | 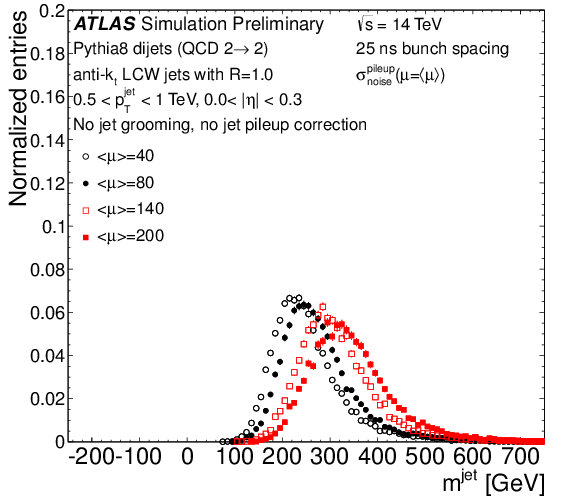
[eps] 
[eps] |

[eps] 
[eps] |
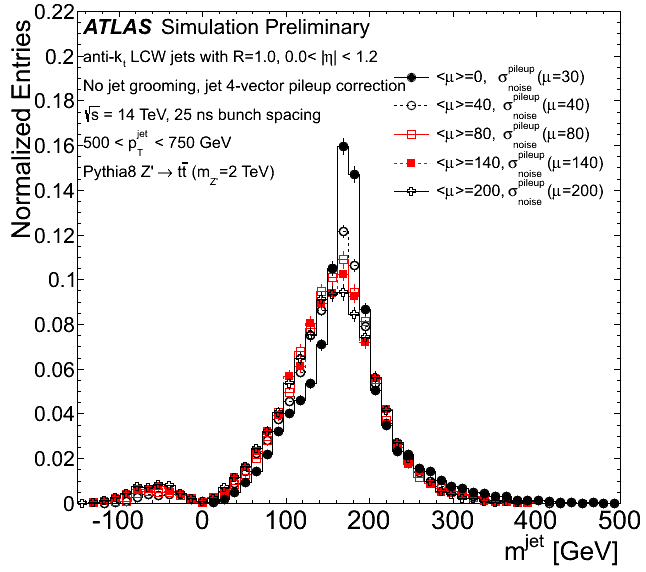
| The anti‐kt R=1.0 jet mass distribution in Z′→ttbar events where the mean number of interactions per bunch crossing (<μ>) is 40, 80, 140, and 200. Four measurements are shown: ungroomed jets with no correction for pileup, ungroomed jets after correcting the jet 4-vector using the event-by-event median pT density (ρ) and the jet area, trimmed jets before pileup correction, and jets after both trimming and the 4-vector pileup correction are applied. The pileup correction is made to the subjets only, before their pT fraction is calculated. After 4-vector jet pileup correction, a fraction of jets can acquire negative mass; this is understood in terms of local fluctuations in the pT density that results in an over correction. The shape of the mass distribution is clearly dependent on <μ>, even after trimming. When both trimming and jet 4-vector pileup subtraction are applied, the jet mass distribution is stable even at <μ>=200. | 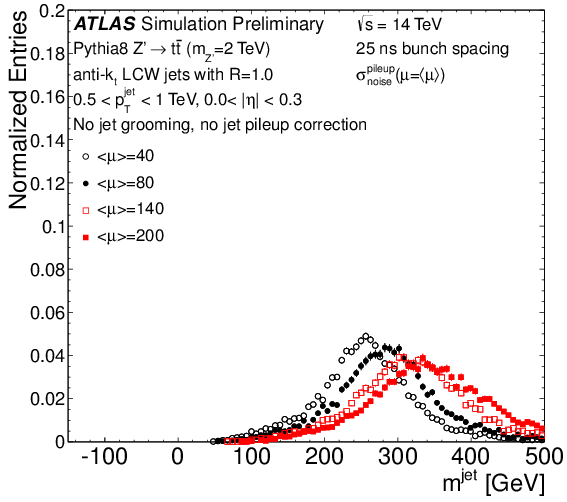
[eps] 
[eps] |

[eps] 
[eps] |
| The anti‐kt As above, but adding the <μ>=0 results. | 
[eps] 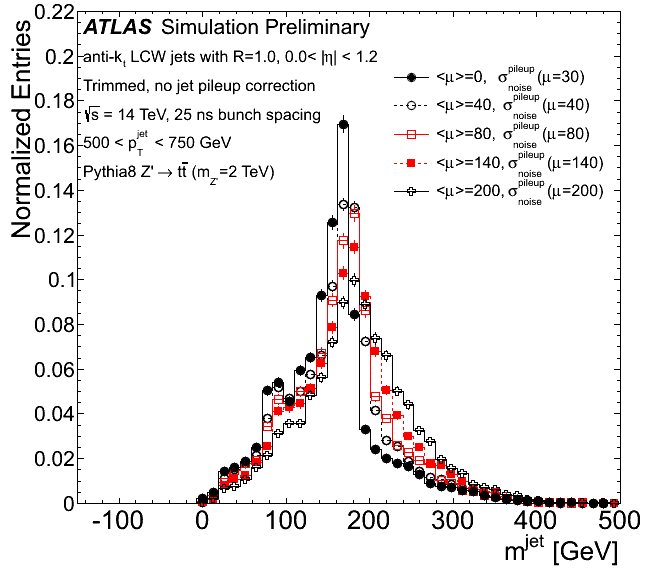
[eps] |
[eps] 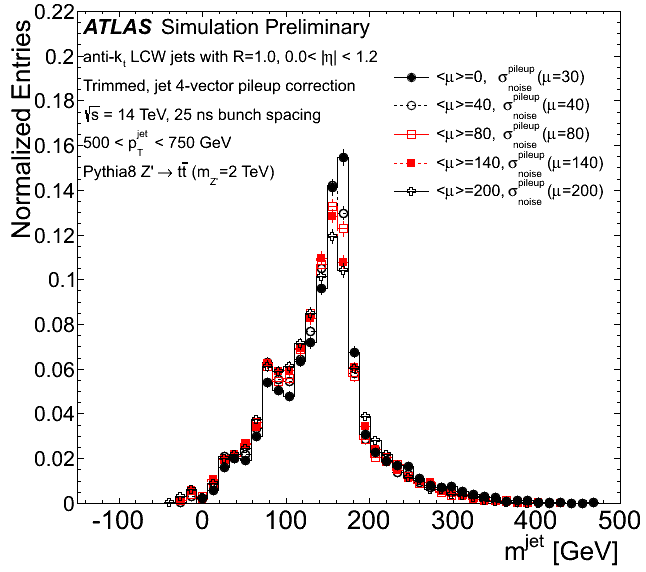
[eps] |
| The anti‐kt R=1.0 jet mass distribution in Z->ttbar (mZ=2 TeV) events where the mean number of interactions per bunch crossing (<μ>) is zero (closed circles), 40 (open circles), 80 (open squares), and 140 (closed squares). The value of the pileup noise (σnoisepile-up) used in the topoclustering is optimized for each value of pileup, except in the case of the μ=0 distribution (closed circles) where the value of sigma is optimized for <μ>=30, as in 2012 data. The ungroomed jets are displayed on the left; trimmed jets on the right. The shape of the mass distribution is clearly dependent on <μ> in the ungroomed case; the top mass peak is not visible above <μ>=40. Although trimming partially restores the position and width of the top mass peak, the shape of the mass distribution is still dependent on <μ>. The effect of pileup is particularly noticeable in the <μ>=140 (closed squares) distribution, where both the top mass peak and the smaller peak visible at the W mass are significantly degraded. | 
[pdf] | 
[pdf] |
| The mean of the anti-kt R=1.0 jet mass distribution as a function of the number of truth vertices (Nvtx) in dijet events where the mean number of interactions per bunch crossing (<μ>) is 40, 80, 140, and 200. Four measurements are shown for each value of <μ>; the open circles represent ungroomed jets with no correction for pileup. The closed black circles represent ungroomed jets after correcting the jet 4-vector using the event-by-event median pT density (ρ) and the jet area. The open (closed) squares represent trimmed jets before (after) pileup correction. When both trimming and the 4-vector pileup correction are applied (closed squares) the pileup correction is made to the subjets only, before their pT fraction is calculated. The mean of the jet mass is calculated using only jets with positive mass. Both trimming and the jet 4-vector pileup correction remove the <μ>-dependence on the mean mass up to <μ>=140. At <μ>=200, trimming alone is not sufficient to remove the <μ>-‐dependence entirely. | 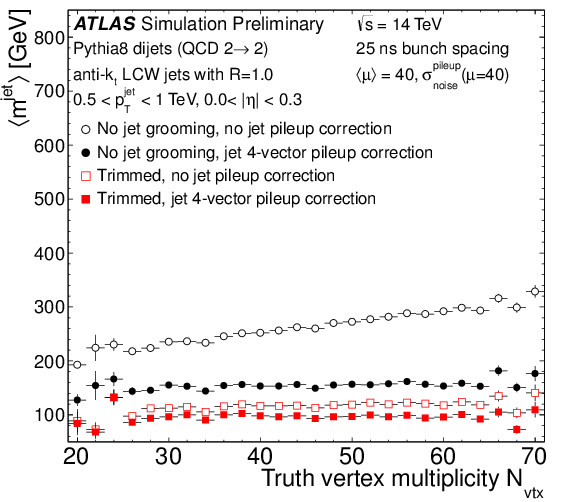
[eps] 
[eps] | 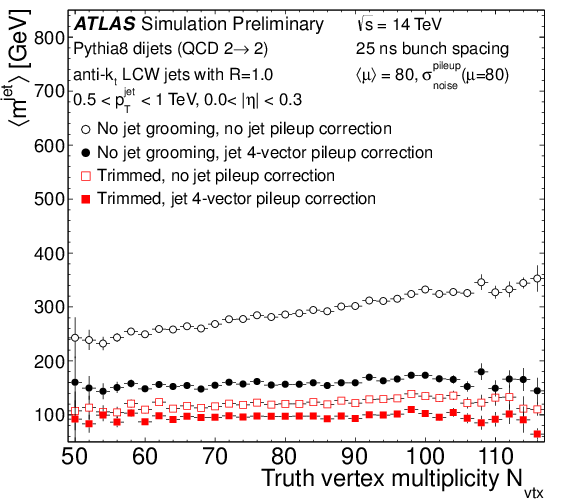
[eps] 
[eps] |
| The mean of the anti-kt R=1.0 jet mass distribution as a function of the number of truth vertices (Nvtx) in Z′→ttbar events where the mean number of interactions per bunch crossing (<μ>) is 40, 80, 140, and 200. Four measurements are shown for each value of <μ>; the open circles represent ungroomed jets with no correction for pileup. The closed black circles represent ungroomed jets after correcting the jet 4-vector using the event-by-event median pT density (ρ) and the jet area. The open (closed) squares represent trimmed jets before (after) pileup correction. When both trimming and the 4-vector pileup correction are applied (closed squares) the pileup correction is made to the subjets only, before their pT fraction is calculated. The mean of the jet mass is calculated using only jets with positive mass. Both trimming and the jet 4-vector pileup correction remove the <μ>-dependence on the mean mass up to <μ>=140. At <μ>=200, trimming alone is not sufficient to remove the <μ>-‐dependence entirely. | 
[eps] 
[eps] | 
[eps] 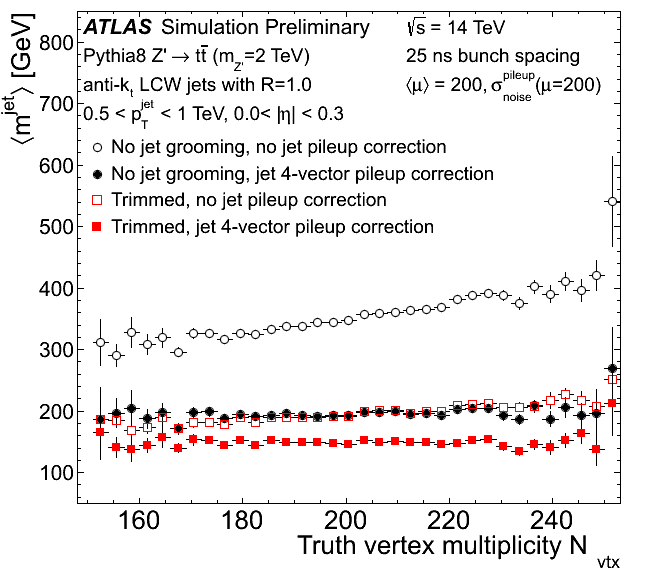
[eps] |
| The mean of the anti-kt R=1.0 jet mass distribution as a function of the number of truth vertices (Nvtx) in dijet events for different values of the mean number of interactions per bunch crossing (<μ>). The open (closed) markers represent jets before (after) application of the jet 4-vector pileup correction using the event-by-event median pT density (ρ) and the jet area. Three different values of the pileup noise (σnoisepile-up) are considered, with the circles corresponding to the optimized value for each value of <μ>. The mean of the jet mass is calculated using only jets with positive mass. Raising σnoisepile-up used in topoclustering reduces the mean vlaue of the jet mass, but does not affect the dependence on Nvtx; this dependence is, however, removed entirely with the application of the jet 4-vector pileup correction. In the case of trimmed jets, the variation of σnoisepile-up has a negligible effect on the mean jet mass; both trimming and increasing σnoisepile-up have the effect of excluding soft radiation from the jet. | 
[eps] | 
[eps] |
Major updates:
-- MichaelBegel - 29-Jul-2013 Responsible: MichaelBegel
Subject: public
Topic revision: r5 - 2013-08-09 - MichaelBegel
 |
|
|
or Ideas, requests, problems regarding TWiki? use Discourse or Send feedback