 Information Common To All Plots
ρ is calculated using kt R=0.4 jets reconstructed from
locally calibrated (LCW) topoclusters within |η|<2. The density
calculation is with respect to the Voronoi area of the jets as defined
in JHEP 0804 (2008) 005
Information Common To All Plots
ρ is calculated using kt R=0.4 jets reconstructed from
locally calibrated (LCW) topoclusters within |η|<2. The density
calculation is with respect to the Voronoi area of the jets as defined
in JHEP 0804 (2008) 005| Mean calorimeter-track jet mass ratio distributions rmtrack jet as a function of jet mass for anti-kt, R = 1.0 trimmed jets. The distributions are shown for proton-proton collisions with a centre-of-mass energy of √s = 8 TeV and an integrated luminosity of L = 20 fb-1 in the central calorimeter region, |η| < 1.2 and in the range 600 < pT < 800 GeV. The data/MC comparison Rmtrack jet for Pythia (blue) and Herwig (red) is shown in the lower part of the plot. | 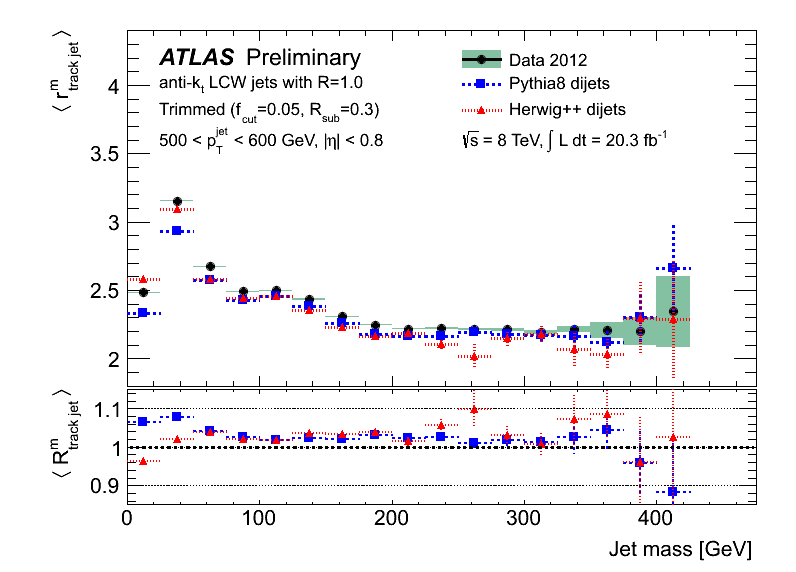 [eps] |
| Mean calorimeter-track jet mass ratio distributions rmtrack jet as a function of jet pT for anti-kt, R = 1.0 trimmed jets. The distributions are shown for proton-proton collisions with a centre-of-mass energy of √s = 8 TeV and an integrated luminosity of L = 20 fb-1 in the central calorimeter region, |η| < 1.2 and in the range 600 < pT < 800 GeV. The data/MC comparison Rmtrack jet for Pythia (blue) and Herwig (red) is shown in the lower part of the plot. |  [eps] |
| Mean calorimeter-track jet mass ratio distributions rmtrack jet as a function of jet mass/pT for anti-kt, R = 1.0 trimmed jets. The distributions are shown for proton-proton collisions with a centre-of-mass energy of √s = 8 TeV and an integrated luminosity of L = 20 fb-1 in the central calorimeter region, |η| < 1.2 and in the range 600 < pT < 800 GeV. The data/MC comparison Rmtrack jet for Pythia (blue) and Herwig (red) is shown in the lower part of the plot. |  [eps] |
Major updates:
-- MichaelBegel - 07-Aug-2013 Responsible: MichaelBegel
Subject: public
Topic revision: r2 - 2013-08-09 - MichaelBegel

or Ideas, requests, problems regarding TWiki? use Discourse or Send feedback