
Public Liquid-Argon Calorimeter Plots on Detector Status
Introduction
The LAr commissioning and performance plots below are approved to be shown by ATLAS speakers at conferences and similar events. Please do not add figures on your own. Contact the LAr project leader in case of questions and/or suggestions.Detector Description
 eps
eps |
|
 eps
eps |
|
pdf file with corresponding page numbers |
 |
 |
 |
Readout Electronics
The two schematics are documented in the ATLAS Detector paper| Liquid Argon Readout Electronics Chain |
 eps pdf
 |
|
| Liquid Argon Front End Board Schematics |
 eps pdf
 |
Detector Status
|
LAr dead and problematic channels: A detailed description of how dead and problematic LAr read-out channels are discovered and treated/masked for data analysis can be found in the paper "Monitoring and data quality assessment of the ATLAS liquid argon calorimeter" | Link to ATLAS Detector Status Table |
| LAr High Voltage Correction |
 HV Corrections (September 2009) |
Liquid argon temperature stability and homogeneity


LAr Purity Stability
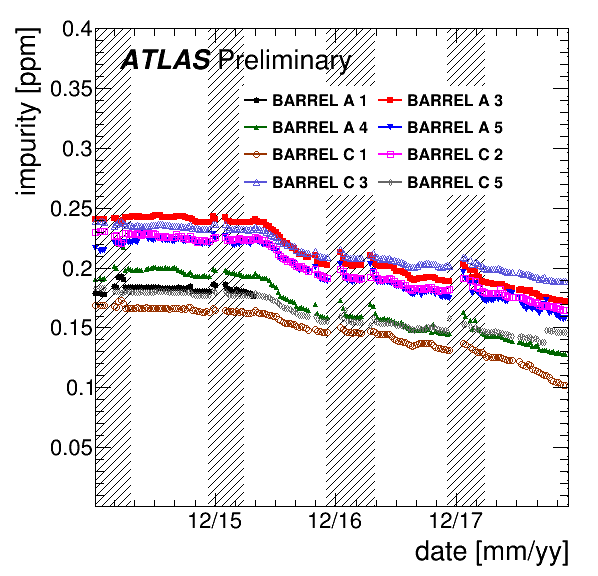
| Measured impurity in oxygen equivalent of the liquid argon in the barrel cryostat (run 2): Each point shows the mean of the purity values measured during one week starting at the beginning of 2015 until the end of 2018. Periods between pp-runs are marked hatched. Data points during collisions are not taken into account due to high radiation in the calorimeter that lead to signals in the ionization chambers. Most of the monitors show charge-up effects after periods of time without high voltage. The decreasing trend in all monitors is correlated with the data taking periods. A clear explanation is not yet found, a change of other input parameters (like temperature or high voltage of the ionization chambers) is excluded. The measured purity in barrel A 1 after middle 2016 is excluded due to problems which are not yet understood. Barrel A 2 and barrel C 4 monitors are not working properly. |
 eps version, pdf version |
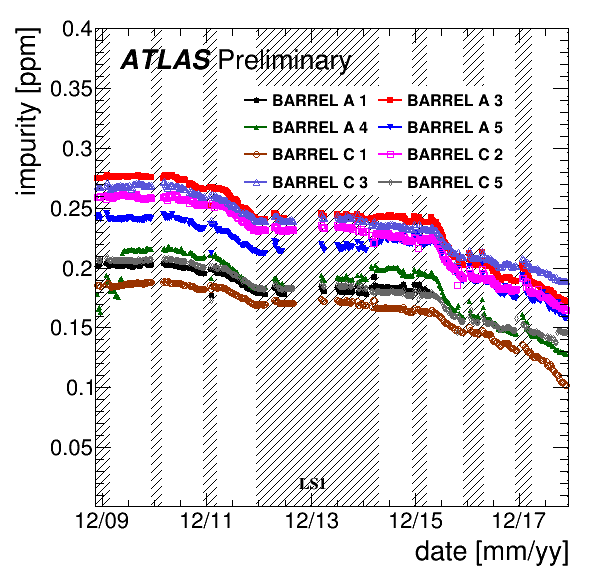
| Measured impurity in oxygen equivalent of the liquid argon in the barrel cryostat (run 1 + run 2): Each point shows the mean of the purity values measured during one week starting at the end of 2009 until the end of 2018. Periods between pp-runs are marked hatched. Data points during collisions are not taken into account due to high radiation in the calorimeter that lead to signals in the ionization chambers. Most of the monitors show charge-up effects after periods of time without high voltage. The decreasing trend in all monitors is correlated with the data taking periods. A clear explanation is not yet found, a change of other input parameters (like temperature or high voltage of the ionization chambers) is excluded. The leap of the measured purity in barrel A 4 at the beginning of 2010 is unclear; a connection with an actual improvement of the purity can be excluded. The measured purity in barrel A 1 after middle 2016 is excluded due to problems which are not yet understood. Barrel A 2 and barrel C 4 monitors are not working properly. |
 eps version, pdf version |
| Measured impurity in oxygen equivalent of the liquid argon in the end-cap cryostat on side A (run 2): Each point shows the mean of the purity values measured during one week starting at the beginning of 2015 until the end of 2018. Last letter A, B or C in the legend corresponds to the monitor position with respect to phi. Periods between pp-runs are marked hatched. Data points during collisions are not taken into account due to high radiation in the calorimeter that lead to signals in the ionization chambers. Most of the monitors show charge-up effects after periods of time without high voltage. |
 eps version, pdf version |
| Measured impurity in oxygen equivalent of the liquid argon in the end-cap cryostat on side A (run 1 + run 2): Each point shows the mean of the purity values measured during one week starting at the end of 2009 until the end of 2018. Last letter A, B or C in the legend corresponds to the monitor position with respect to phi. Periods between pp-runs are marked hatched. Data points during collisions are not taken into account due to high radiation in the calorimeter that lead to signals in the ionization chambers. Most of the monitors show charge-up effects after periods of time without high voltage. The decreasing trend in all monitors before LS1 is correlated with the data taking periods. A clear explanation is not yet found, a change of other input parameters (like temperature or high voltage of the ionization chambers) is excluded. |
 eps version, pdf version |
| Measured impurity in oxygen equivalent of the liquid argon in the end-cap cryostat on side C (run 2): Each point shows the mean of the purity values measured during one week starting at the beginning of 2015 until the end of 2018. Last letter A, B or C in the legend corresponds to the monitor position with respect to phi. Periods between pp-runs are marked hatched. Data points during collisions are not taken into account due to high radiation in the calorimeter that lead to signals in the ionization chambers. Most of the monitors show charge-up effects after periods of time without high voltage. The measured purity in HEC 1 C B after middle 2016 is excluded due to problems which are not yet understood. HEC 1 C C, HEC 2 C B and EC C top monitors are not working properly. |
 eps version, pdf version |
| Measured impurity in oxygen equivalent of the liquid argon in the end-cap cryostat on side C (run 1 + run 2): Each point shows the mean of the purity values measured during one week starting at the end of 2009 until the end of 2018. Last letter A, B or C in the legend corresponds to the monitor position with respect to phi. Periods between pp-runs are marked hatched. Data points during collisions are not taken into account due to high radiation in the calorimeter that lead to signals in the ionization chambers. Most of the monitors show charge-up effects after periods of time without high voltage. The decreasing trend in all monitors before LS1 is correlated with the data taking periods. A clear explanation is not yet found, a change of other input parameters (like temperature or high voltage of the ionization chambers) is excluded. The measured purity in HEC 1 C B after middle 2016 is excluded due to problems which are not yet understood. HEC 1 C C, HEC 2 C B and EC C top monitors are not working properly. |
 eps version, pdf version |
| Measured impurity of the liquid argon in the barrel cryostat: Each point shows the mean of the purity values measured during one week starting middle of 2009 until beginning of 2016. Periods between pp-runs are marked gray. Data points during collisions are not taken into account due to high radiation in the calorimeter that lead to signals in the ionization chambers. Most of the monitors show charge-up effects after periods of time without high voltage. The decreasing trend in all monitors is correlated with the data taking periods. A clear explanation is not yet found, a change of other input parameters (like temperature or high voltage of the ionization chambers is excluded). The leap of the measured purity in barrel A4 at the beginning of 2009 is unclear; a connection with an actual improvement of the purity can be excluded. See here for more information. |
 eps - pdf
 |
| Measured impurity of the liquid argon in the end-cap cryostat on side A: Each point shows the mean of the purity values measured during one week starting middle of 2009 until beginning of 2016. Periods between pp-runs are marked gray. Data points during collisions are not taken into account due to high radiation in the calorimeter that lead to signals in the ionization chambers. Most of the monitors show charge-up effects after periods of time without high voltage. The decreasing trend in all monitors is correlated with the data taking periods. A clear explanation is not yet found, a change of other input parameters (like temperature or high voltage of the ionization chambers is excluded). See here for more information. |
 eps - pdf
 |
| Measured impurity of the liquid argon in the end-cap cryostat on side C: Each point shows the mean of the purity values measured during one week starting middle of 2009 until beginning of 2016. Periods between pp-runs are marked gray. Data points during collisions are not taken into account due to high radiation in the calorimeter that lead to signals in the ionization chambers. Most of the monitors show charge-up effects after periods of time without high voltage. The decreasing trend in all monitors is correlated with the data taking periods. A clear explanation is not yet found, a change of other input parameters (like temperature or high voltage of the ionization chambers is excluded). See here for more information. |
 eps - pdf
 |
Noise, Calibration, Signal Reconstruction


Ionization Pulse Shape
- Ionization Pulse Shape EM Barrel
| Ionization Pulse Shape in the 4 EM Barrel layers |
 (PS) (eps)  (Front) (eps)  (Middle) (eps)  (Back) (eps) |
- Ionization Pulse Shape EM endap
| Ionization Pulse Shape in the EM endcap middle layer |
 (Middle,HV=2.3kV) (eps)  (Middle,HV=2.1kV) (eps)  (Middle,HV=1.7kV) (eps)  (Middle,HV=1.5kV) (eps) |
- Ionization Pulse Shape FCal
|
Ionization Pulse Shape in the FCal |
 (FCal 3 pulse shape from cosmic muon data) |
- Ionization Pulse Shape HEC
| Ionization Pulse Shape in the HEC |
 (HEC layer 1 pulse shape)  (HEC layer 2 pulse shape)  (HEC layer 3 pulse shape)  (HEC layer 4 pulse shape) |
Monitoring plots
| LAr Data Quality Inefficiency for 2011 proton-proton data taking - Some details |

|
| LAr Data Quality Inefficiency for 2011 lead-lead data taking - Some details |

|
| Noise bursts |
 |
| Noise bursts fix in the presampler (Winter 08) |
 |
| Pedestals and noise stability |
 |
| Impact of FEB refurbishment (winter 09) |
 |
| Monitoring of timing |
 |
| DSP computation |
 |
Shutdown 2010-2011 - Splashes 2011
| Figure with caption |

|
| Figure with caption |

|
| Figure with caption |

|
The Electronic Performance Paper
Abstract :The ATLAS detector has been designed for operation at the Large Hadron Collider at CERN. ATLAS includes electromagnetic and hadronic liquid argon calorimeters, with almost 200,000 channels of data that must be sampled at the LHC bunch crossing frequency of 40 MHz. The calorimeter electronics calibration and readout are performed by custom electronics developed specifically for these purposes. This paper describes the system performance of the ATLAS liquid argon calibration and readout electronics, including noise, energy and time resolution, and long term stability, with data taken mainly from full-system calibration runs performed after installation of the system in the ATLAS detector hall at CERN. Here is the "Performance of the electronic readout of the ATLAS liquid argon calorimeters"


Local page variables
This section contains local page variables that you can use in editing this page to avoid hardcoding long paths etc. To use the variable, just enclose it with %, like: %IMG{name}% which will turn into- Set IMGNAME = %IF{"attachments[name='%DEFAULT{default="fig1"}%.png']" then="%DEFAULT{default="fig1"}%.png" else="%IF{"attachments[name='%DEFAULT{default="fig1"}%.jpg']" then="%DEFAULT{default="fig1"}%.jpg" else="%IF{"attachments[name='%DEFAULT{default="fig1"}%.jpeg']" then="%DEFAULT{default="fig1"}%.jpeg" else="File '%DEFAULT{default="fig1"}%' not found!"}%"}%"}%
- Set IMGPATH = /twiki/pub/AtlasPublic/LArCaloPublicResultsDetStatus/%IMGNAME{%DEFAULT{default="fig1"}%}%
- Set IMG =
- Set PDF = pdf version
- Set EPS = eps version
- Set PLOT = %IMG{%DEFAULT{default="fig1"}%}%
%EPS{%DEFAULT{default="fig1"}%}%, %PDF{%DEFAULT{default="fig1"}%}% - Set HALFPLOT = %IMG{"%DEFAULT{default="fig1"}%" IMGSIZE="175"}%
%EPS{%DEFAULT{default="fig1"}%}%, %PDF{%DEFAULT{default="fig1"}%}%
Responsible: EmmanuelMonnier
Last reviewed by: Never reviewed
| I | Attachment | History | Action | Size | Date | Who | Comment |
|---|---|---|---|---|---|---|---|
| |
BARREL_longterm_6.eps | r1 | manage | 653.4 K | 2016-05-17 - 18:29 | MartinAleksa | Purity Plots eps, png |
| |
BARREL_longterm_6.pdf | r1 | manage | 56.9 K | 2016-05-17 - 18:27 | MartinAleksa | Purity plots pdf |
| |
BARREL_longterm_6.png | r1 | manage | 61.4 K | 2016-05-17 - 18:29 | MartinAleksa | Purity Plots eps, png |
| |
EMEC_HEC_A_longterm_6.eps | r1 | manage | 630.9 K | 2016-05-17 - 18:29 | MartinAleksa | Purity Plots eps, png |
| |
EMEC_HEC_A_longterm_6.pdf | r1 | manage | 50.0 K | 2016-05-17 - 18:27 | MartinAleksa | Purity plots pdf |
| |
EMEC_HEC_A_longterm_6.png | r1 | manage | 50.8 K | 2016-05-17 - 18:29 | MartinAleksa | Purity Plots eps, png |
| |
EMEC_HEC_C_longterm_6.eps | r1 | manage | 591.3 K | 2016-05-17 - 18:29 | MartinAleksa | Purity Plots eps, png |
| |
EMEC_HEC_C_longterm_6.pdf | r1 | manage | 42.2 K | 2016-05-17 - 18:27 | MartinAleksa | Purity plots pdf |
| |
EMEC_HEC_C_longterm_6.png | r1 | manage | 42.8 K | 2016-05-17 - 18:29 | MartinAleksa | Purity Plots eps, png |
| |
SigRecFormula_Images_Comments.jpg | r1 | manage | 632.0 K | 2017-02-16 - 15:24 | MartinAleksa | Calibration formula |
| |
SigRecFormula_Images_Comments.pdf | r1 | manage | 70.8 K | 2017-02-16 - 15:27 | MartinAleksa | LAr Calibration |
| |
SigRecFormula_Images_Comments.ppt | r1 | manage | 137.0 K | 2017-02-16 - 15:24 | MartinAleksa | Calibration formula |
| |
barrels_run12.eps | r1 | manage | 44.7 K | 2019-01-29 - 10:42 | SteffenStaerz | Purity Plots Barrel Run 1+2 |
| |
barrels_run12.pdf | r1 | manage | 70.0 K | 2019-01-29 - 10:42 | SteffenStaerz | Purity Plots Barrel Run 1+2 |
| |
barrels_run12.png | r1 | manage | 31.7 K | 2019-01-29 - 10:42 | SteffenStaerz | Purity Plots Barrel Run 1+2 |
| |
barrels_run2.eps | r1 | manage | 26.7 K | 2019-01-29 - 10:40 | SteffenStaerz | Purity Plots Barrel Run 2 |
| |
barrels_run2.pdf | r1 | manage | 39.8 K | 2019-01-29 - 10:40 | SteffenStaerz | Purity Plots Barrel Run 2 |
| |
barrels_run2.png | r1 | manage | 28.8 K | 2019-01-29 - 10:40 | SteffenStaerz | Purity Plots Barrel Run 2 |
| |
cryo_a_run12.eps | r1 | manage | 44.5 K | 2019-01-29 - 10:45 | SteffenStaerz | Purity Plots Endcap A Run 1+2 |
| |
cryo_a_run12.pdf | r1 | manage | 80.9 K | 2019-01-29 - 10:45 | SteffenStaerz | Purity Plots Endcap A Run 1+2 |
| |
cryo_a_run12.png | r1 | manage | 29.8 K | 2019-01-29 - 10:45 | SteffenStaerz | Purity Plots Endcap A Run 1+2 |
| |
cryo_a_run2.eps | r1 | manage | 27.5 K | 2019-01-29 - 10:44 | SteffenStaerz | Purity Plots Endcap A Run 2 |
| |
cryo_a_run2.pdf | r1 | manage | 40.5 K | 2019-01-29 - 10:44 | SteffenStaerz | Purity Plots Endcap A Run 2 |
| |
cryo_a_run2.png | r1 | manage | 26.5 K | 2019-01-29 - 10:44 | SteffenStaerz | Purity Plots Endcap A Run 2 |
| |
cryo_c_run12.eps | r1 | manage | 30.9 K | 2019-01-29 - 10:46 | SteffenStaerz | Purity Plots Endcap C Run 1+2 |
| |
cryo_c_run12.pdf | r1 | manage | 58.2 K | 2019-01-29 - 10:46 | SteffenStaerz | Purity Plots Endcap C Run 1+2 |
| |
cryo_c_run12.png | r1 | manage | 26.7 K | 2019-01-29 - 10:46 | SteffenStaerz | Purity Plots Endcap C Run 1+2 |
| |
cryo_c_run2.eps | r1 | manage | 20.6 K | 2019-01-29 - 10:45 | SteffenStaerz | Purity Plots Endcap C Run 2 |
| |
cryo_c_run2.pdf | r1 | manage | 30.7 K | 2019-01-29 - 10:45 | SteffenStaerz | Purity Plots Endcap C Run 2 |
| |
cryo_c_run2.png | r1 | manage | 22.2 K | 2019-01-29 - 10:45 | SteffenStaerz | Purity Plots Endcap C Run 2 |
| |
lar-noise-2015data.pdf | r1 | manage | 151.4 K | 2016-01-25 - 17:07 | MartinAleksa | LAr total noise plots (2015) |
| |
noise_2015_ratio.eps | r1 | manage | 17.9 K | 2016-01-25 - 17:07 | MartinAleksa | LAr total noise plots (2015) |
| |
noise_2015_ratio.pdf | r1 | manage | 27.0 K | 2016-01-25 - 17:07 | MartinAleksa | LAr total noise plots (2015) |
| |
noise_2015_ratio.png | r1 | manage | 74.2 K | 2016-01-25 - 17:07 | MartinAleksa | LAr total noise plots (2015) |
| |
noise_data_2015.eps | r1 | manage | 17.6 K | 2016-01-25 - 17:07 | MartinAleksa | LAr total noise plots (2015) |
| |
noise_data_2015.pdf | r1 | manage | 27.7 K | 2016-01-25 - 17:07 | MartinAleksa | LAr total noise plots (2015) |
| |
noise_data_2015.png | r1 | manage | 77.0 K | 2016-01-25 - 17:07 | MartinAleksa | LAr total noise plots (2015) |
| |
noise_mc_2015.eps | r1 | manage | 17.3 K | 2016-01-25 - 17:07 | MartinAleksa | LAr total noise plots (2015) |
| |
noise_mc_2015.pdf | r1 | manage | 27.1 K | 2016-01-25 - 17:07 | MartinAleksa | LAr total noise plots (2015) |
| |
noise_mc_2015.png | r1 | manage | 77.3 K | 2016-01-25 - 17:07 | MartinAleksa | LAr total noise plots (2015) |
Topic revision: r37 - 2021-01-13 - EmmanuelMonnier

or Ideas, requests, problems regarding TWiki? use Discourse or Send feedback