

Compact Muon Solenoid
LHC, CERN
| CMS-PAS-B2G-16-010 | ||
| Search for diboson resonances in the semileptonic $\mathrm{X}\rightarrow\mathrm{Z}\mathrm{V}\rightarrow\ell^+\ell^- \mathrm{q\bar{q}}$ final state at $ \sqrt{s} = $ 13 TeV with CMS | ||
| CMS Collaboration | ||
| July 2016 | ||
| Abstract: A search for diboson resonances is performed in the semileptonic $\mathrm{X}\rightarrow\mathrm{Z}\mathrm{V}\rightarrow\ell^+\ell^- \mathrm{q\bar{q}}$ final state, where one vector boson decays hadronically (V = W, Z) and the other, a Z boson, decays into two leptons, in the mass range 550 $\le m_\mathrm{ZV} \le$ 2500 GeV. In this regime the V boson may be sufficiently boosted that its decay products are contained in a single jet, thus merged jet reconstruction and substructure techniques are utilised. The case where the hadronic decay products are resolved is also considered at low mass. At high signal masses the closeness of the leptons is taken into account to avoid leptonic Z reconstruction inefficiencies. The analysis exploits the kinematic and flavour information of the final state particles of the event in order to isolate the hypothetical signal. The results are based on the analysis of proton-proton collision data collected by CMS in 2015, corresponding to an integrated luminosity of 2.7 fb$^{-1}$ delivered by the LHC at center-of-mass energy of 13 TeV. | ||
| Links: CDS record (PDF) ; inSPIRE record ; CADI line (restricted) ; | ||
| Figures | |
png pdf |
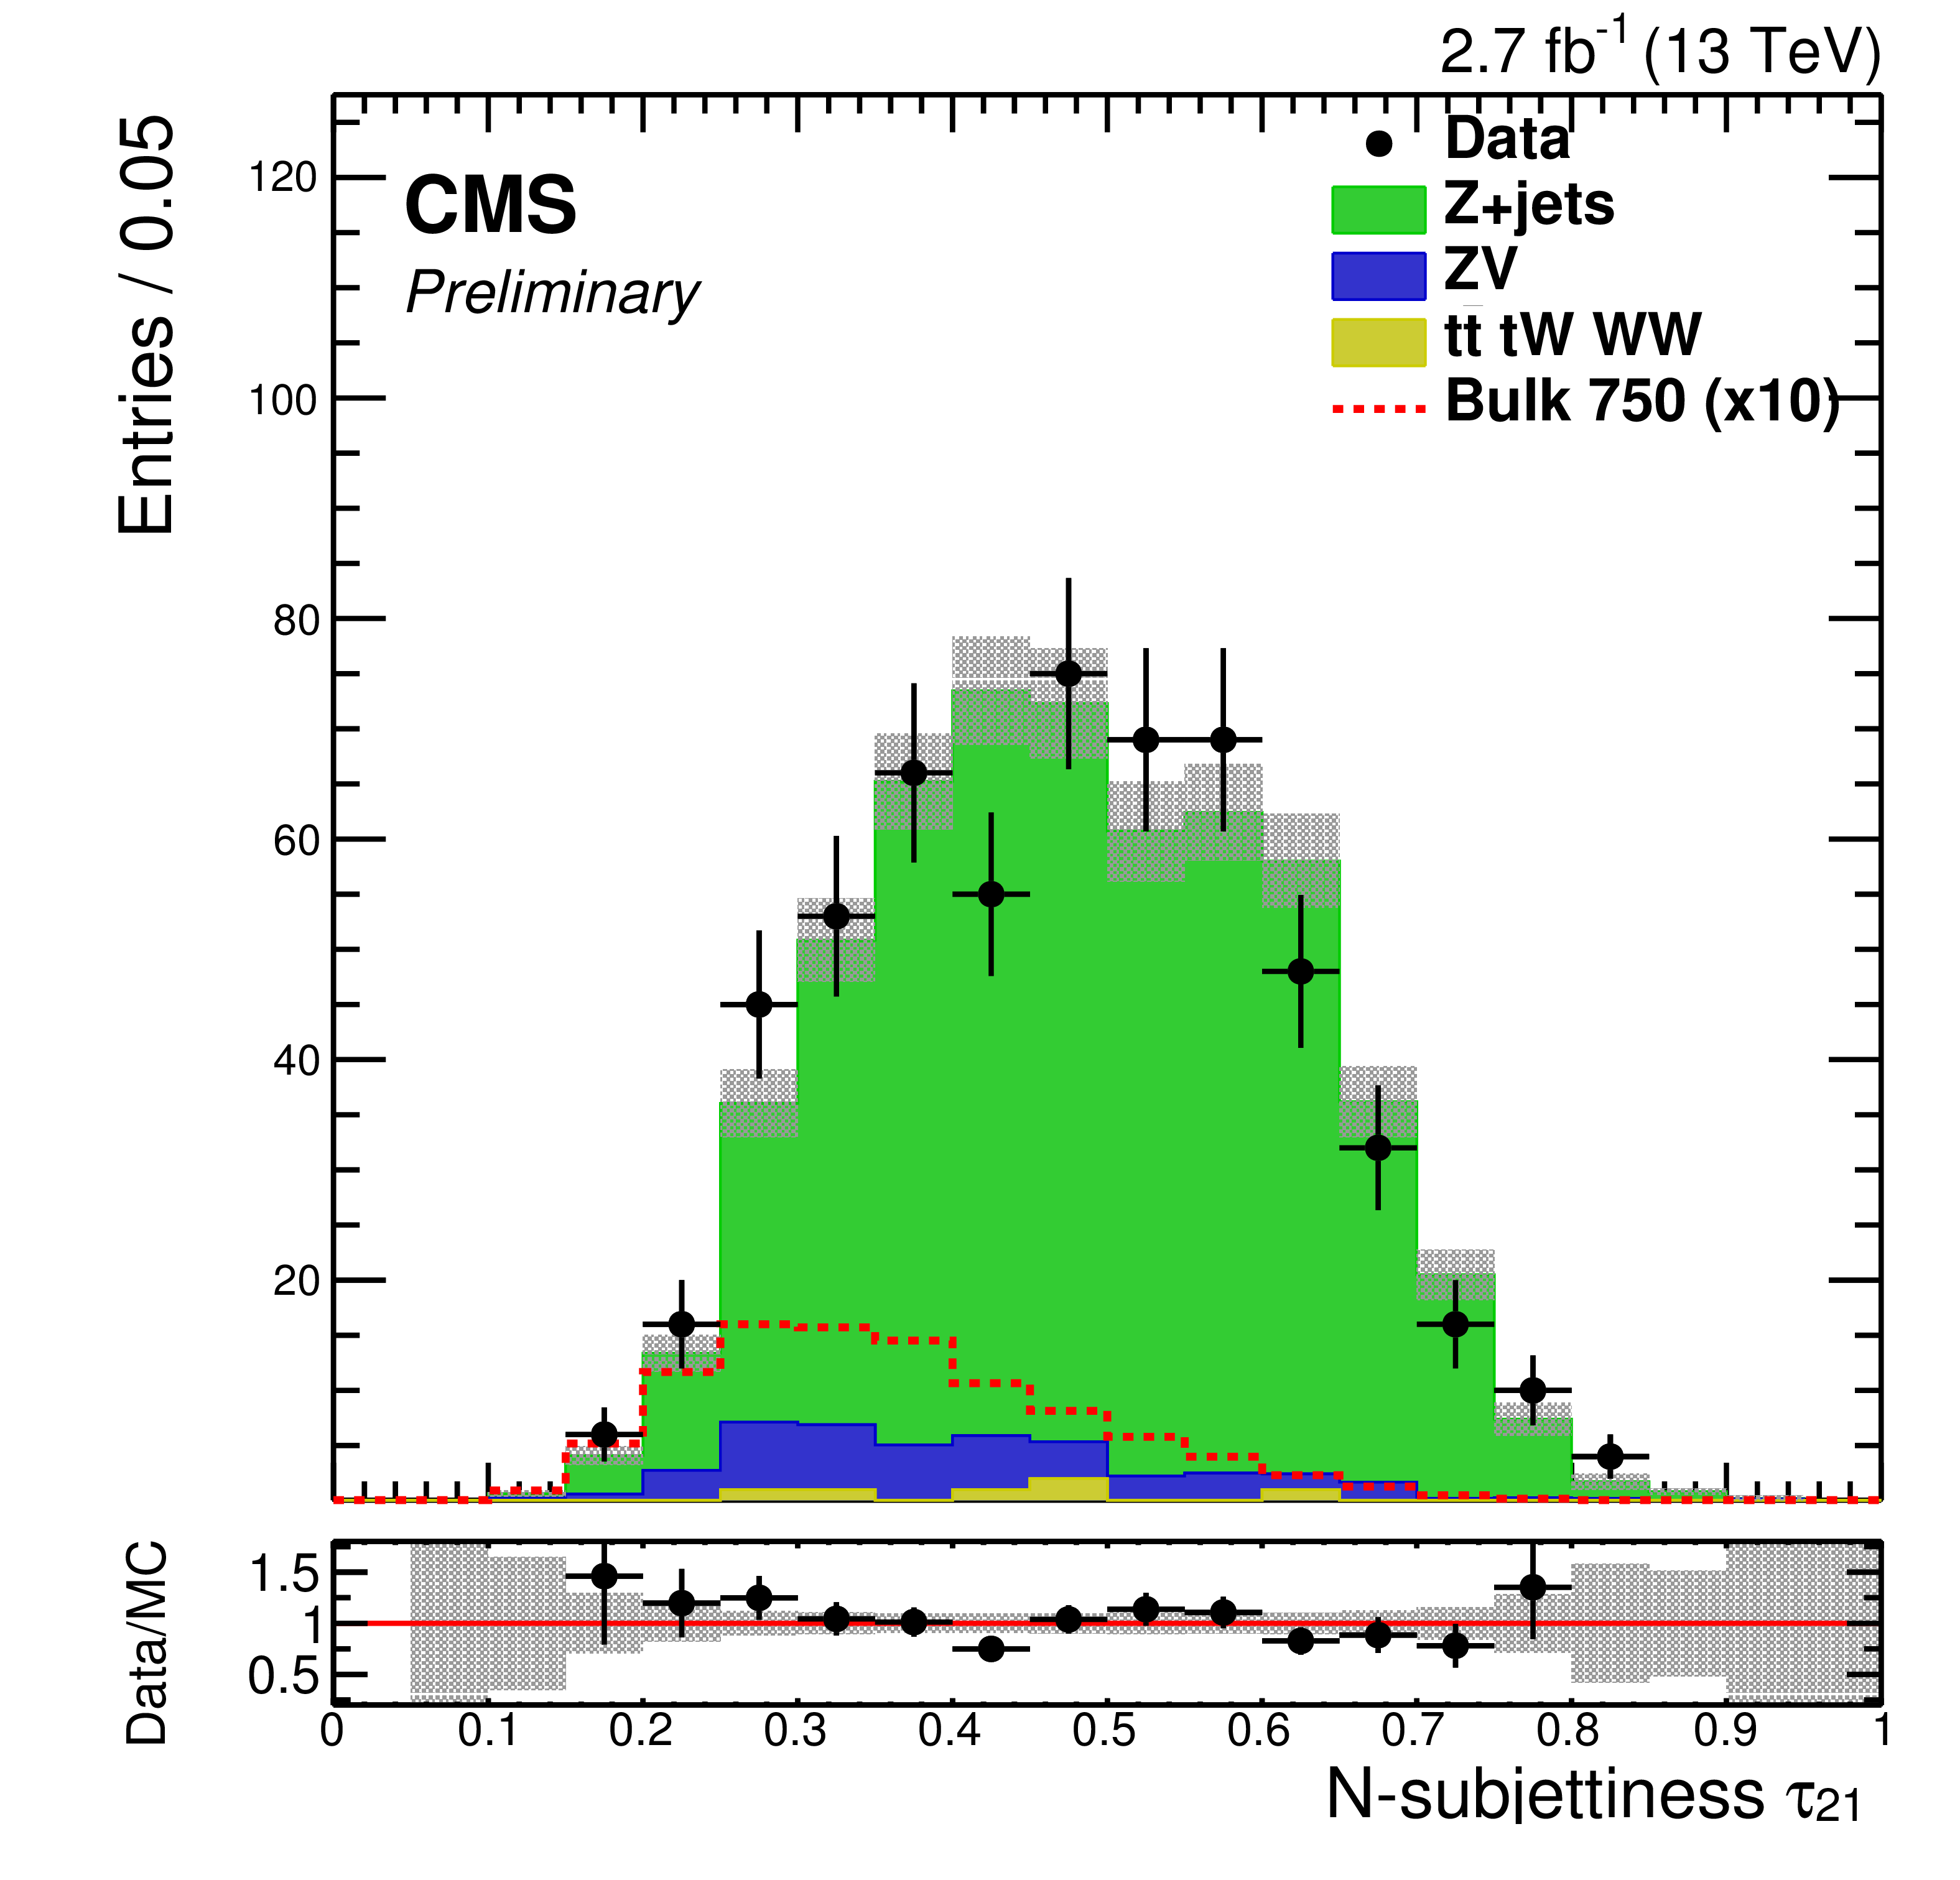
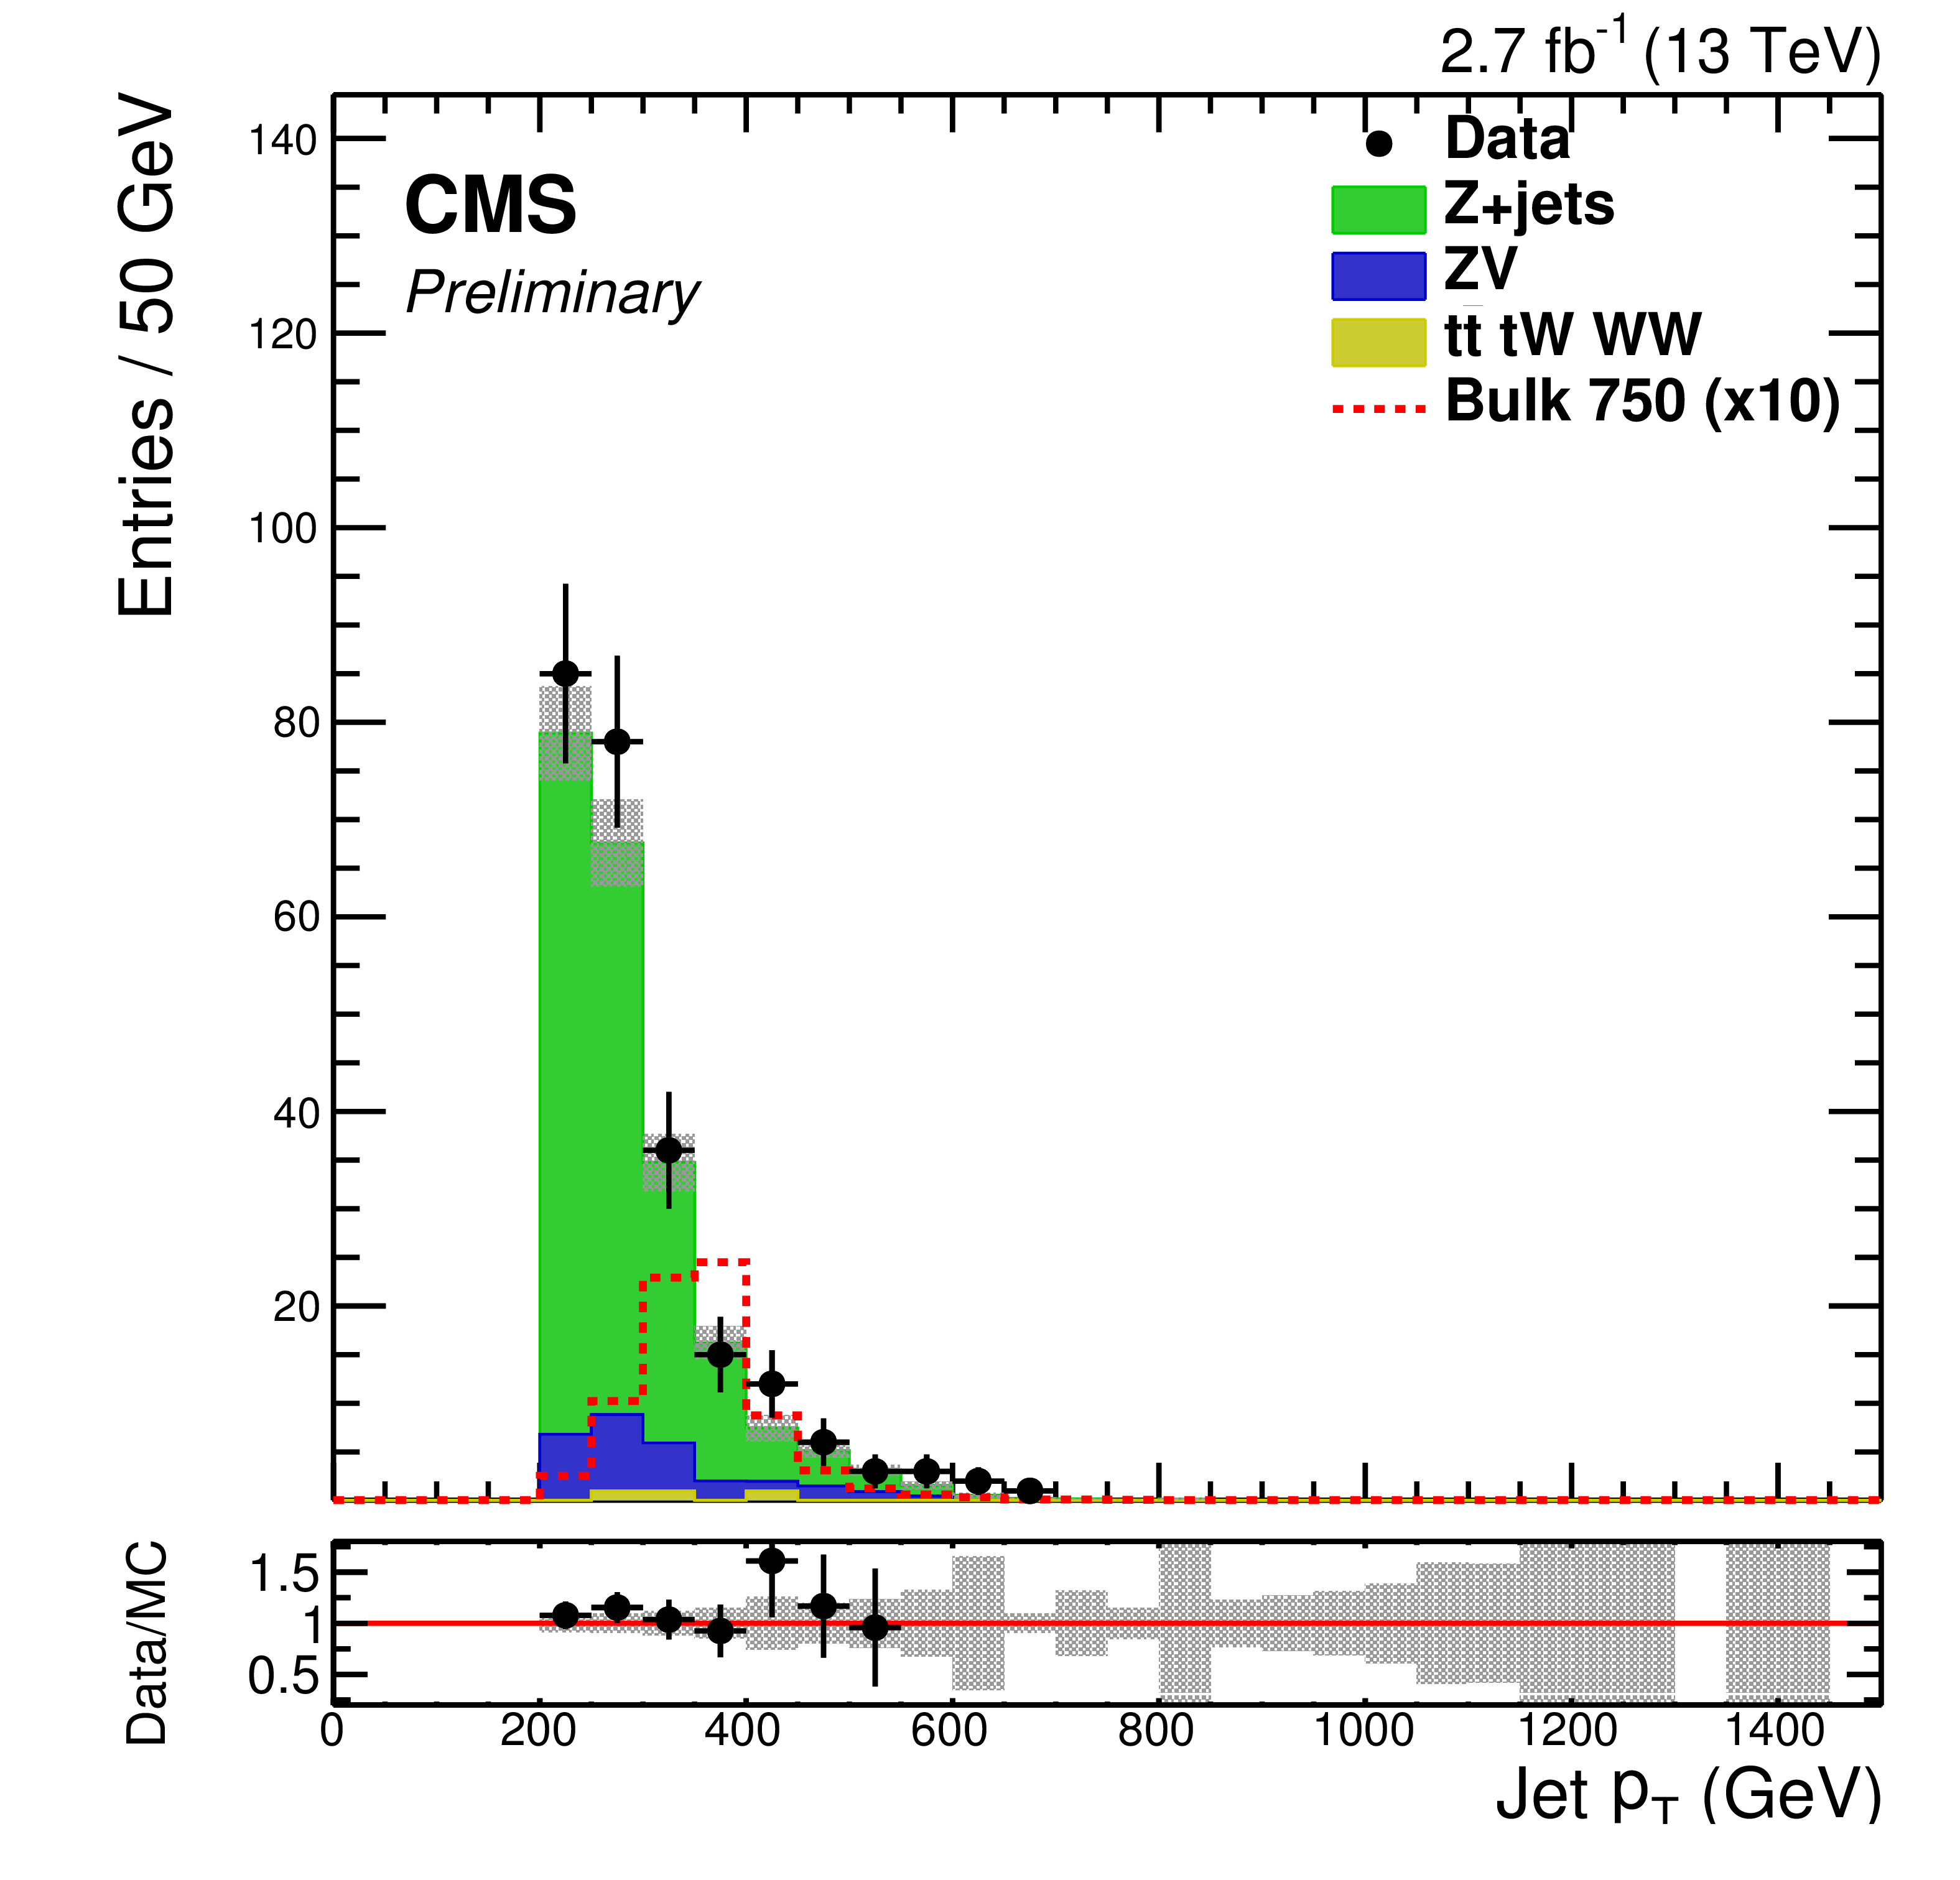
Figure 1-a:
Distribution of the boosted V candidate $\tau _{21}$ and $ {p_{\mathrm {T}}} (J)$ (after applying the $\tau _{21} < $ 0.45 cut) in data and simulation for events in the signal region of the low mass search. Backgrounds are shown separately for the dominant Z+jets contribution (green), the ZV SM diboson contribution (blue), and the lepton flavour symmetric backgrounds derived from e$\mu $ data (yellow). The gray band shows the statistical and systematic uncertainties on the background. The background for the $\tau _{2}/\tau _{1}$ distribution is normalised to the number of events in the data; the background for the $ {p_{\mathrm {T}}} (J)$ distribution is derived from a fit to the $ {m_\mathrm {ZV}}$ observable in the sideband region alone. |
png pdf |
Figure 1-b:
Distribution of the boosted V candidate $\tau _{21}$ and $ {p_{\mathrm {T}}} (J)$ (after applying the $\tau _{21} < $ 0.45 cut) in data and simulation for events in the signal region of the low mass search. Backgrounds are shown separately for the dominant Z+jets contribution (green), the ZV SM diboson contribution (blue), and the lepton flavour symmetric backgrounds derived from e$\mu $ data (yellow). The gray band shows the statistical and systematic uncertainties on the background. The background for the $\tau _{2}/\tau _{1}$ distribution is normalised to the number of events in the data; the background for the $ {p_{\mathrm {T}}} (J)$ distribution is derived from a fit to the $ {m_\mathrm {ZV}}$ observable in the sideband region alone. |

png pdf |
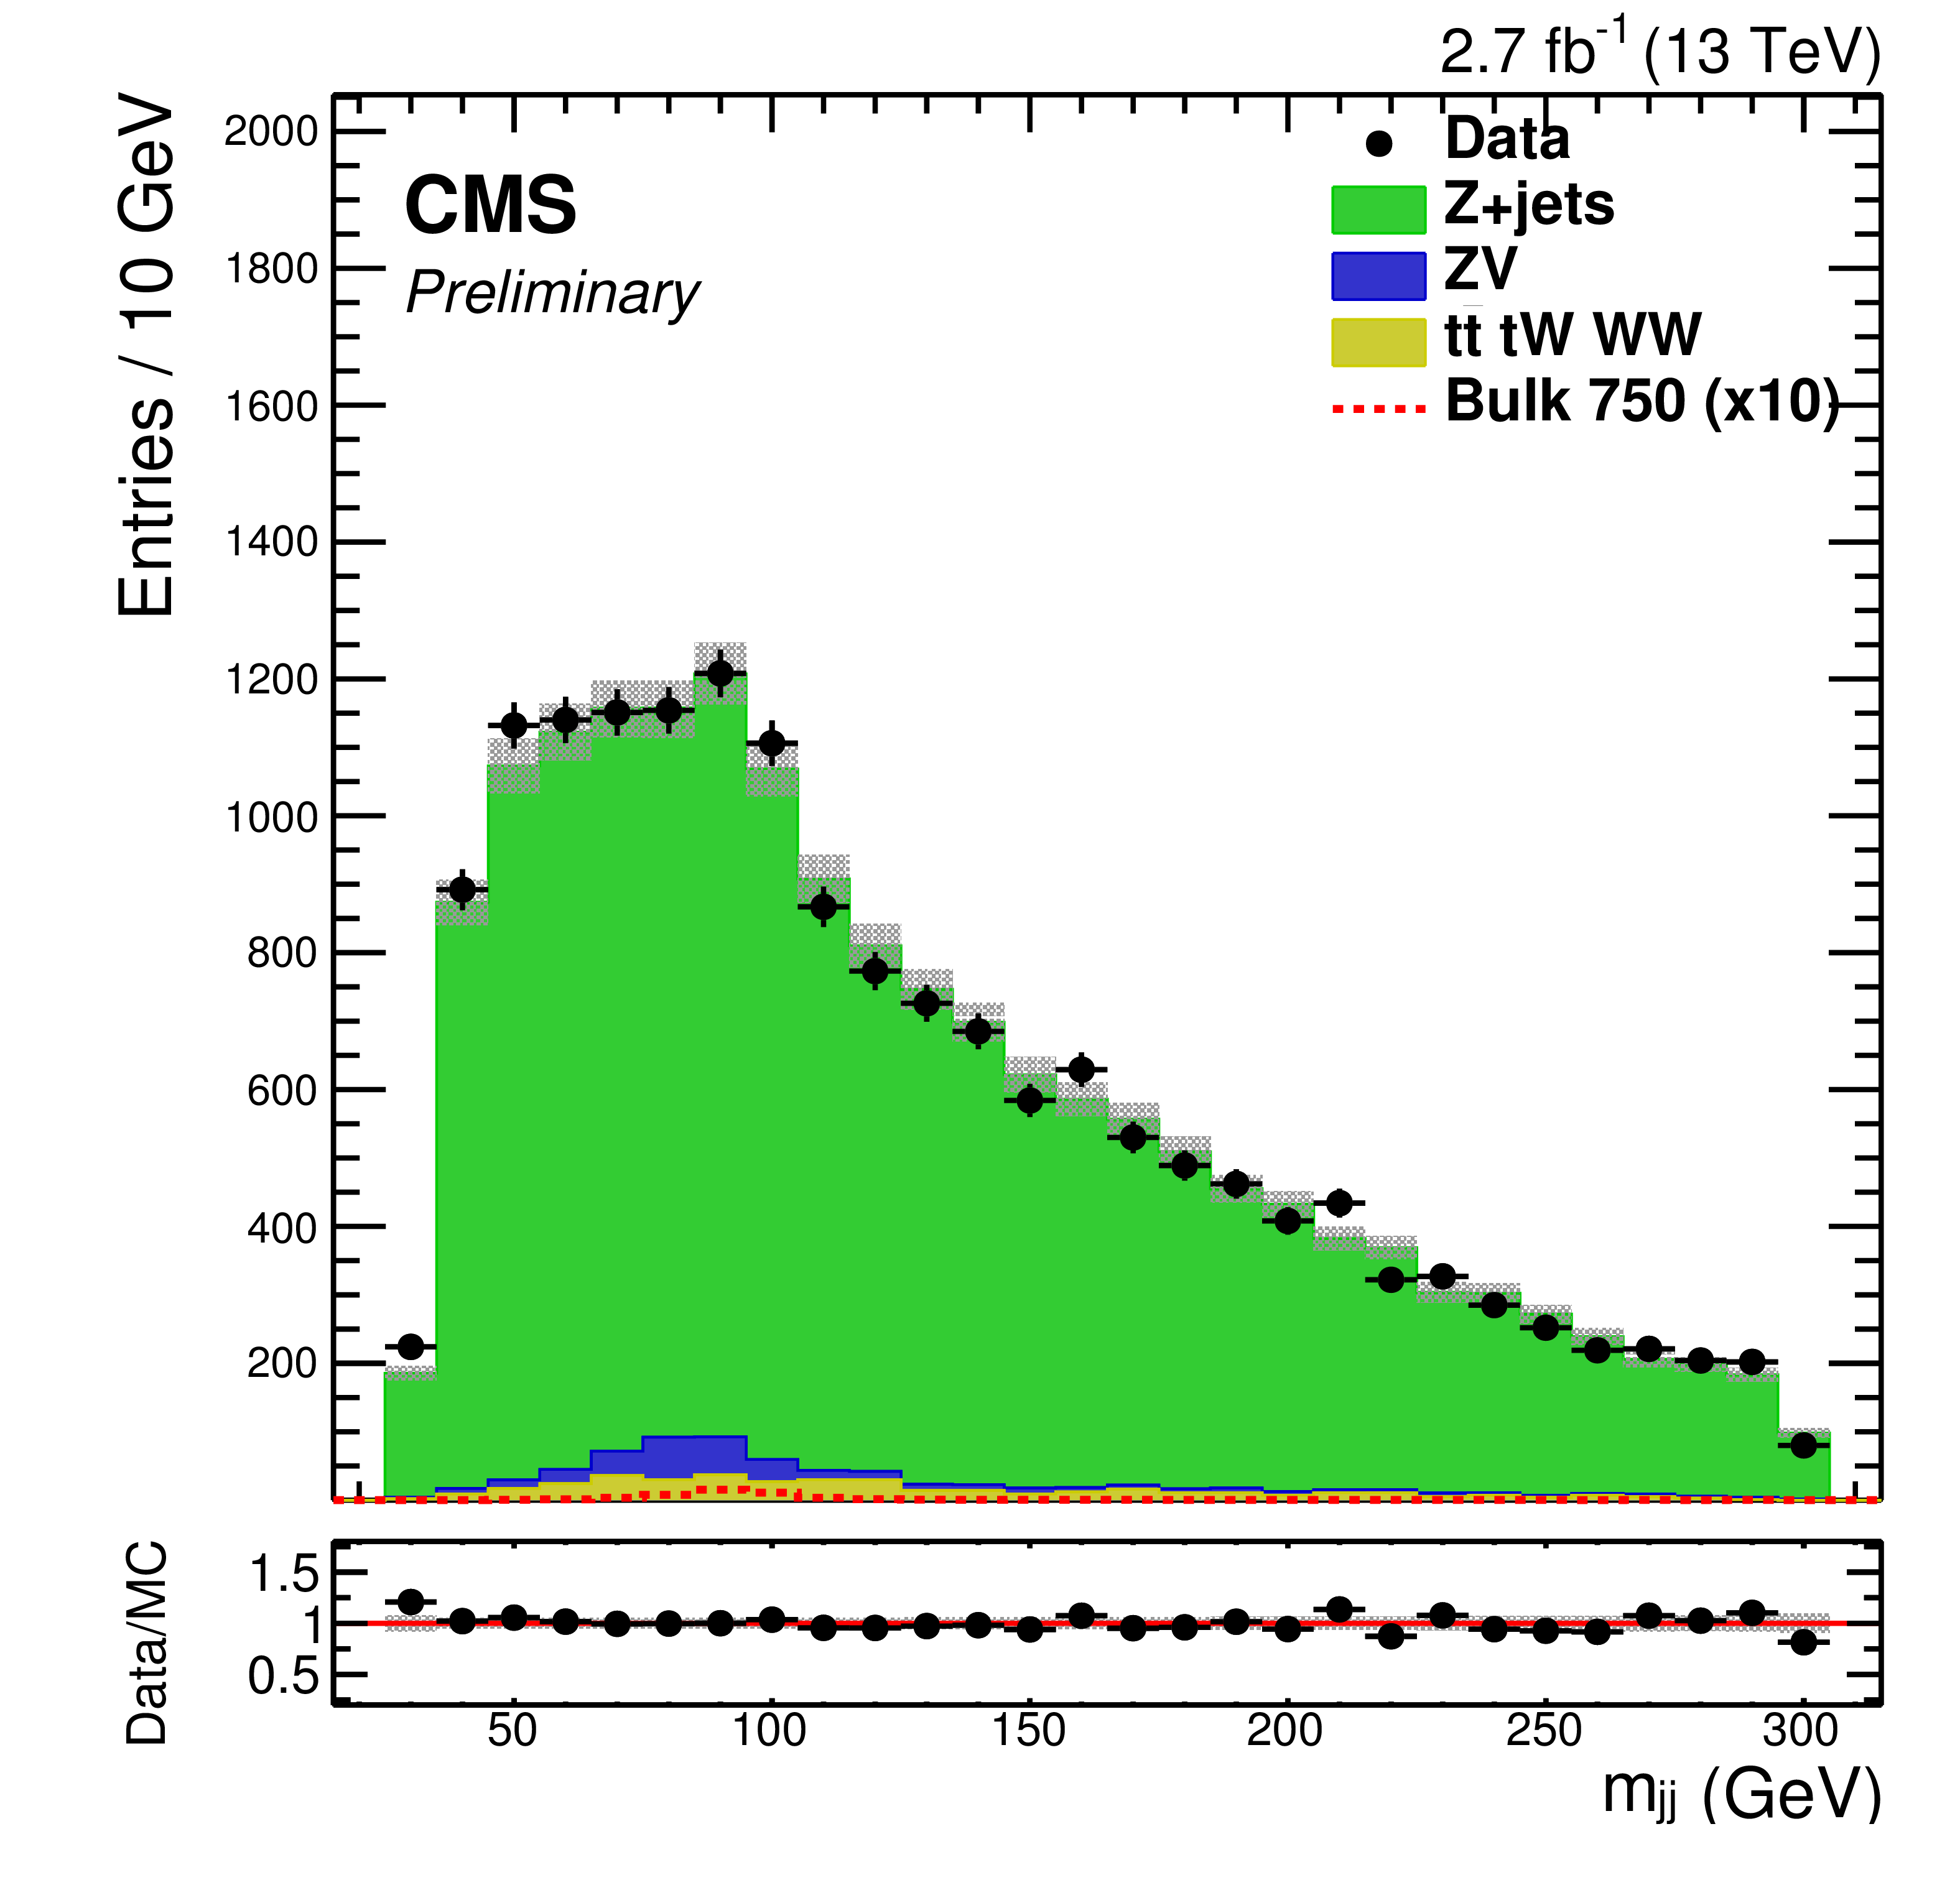
Figure 2-a:
Distribution of V candidate $ {m_\mathrm {J}}$ (a) and $ {m_\mathrm {jj}}$ (b) in data and simulation for events in the signal and sideband regions of the low mass search. Backgrounds are shown seperately for the dominant Z+jets contribution (green), the ZV SM diboson contribution (blue), and the lepton flavour symmetric backgrounds derived from e$\mu $ data (yellow). The gray band shows the statistical and systematic uncertainties on the background. Background normalizations are derived from a fit to the $ {m_\mathrm {ZV}}$ observable in the sideband region alone. |
png pdf |
Figure 2-b:
Distribution of V candidate $ {m_\mathrm {J}}$ (a) and $ {m_\mathrm {jj}}$ (b) in data and simulation for events in the signal and sideband regions of the low mass search. Backgrounds are shown seperately for the dominant Z+jets contribution (green), the ZV SM diboson contribution (blue), and the lepton flavour symmetric backgrounds derived from e$\mu $ data (yellow). The gray band shows the statistical and systematic uncertainties on the background. Background normalizations are derived from a fit to the $ {m_\mathrm {ZV}}$ observable in the sideband region alone. |
png pdf |
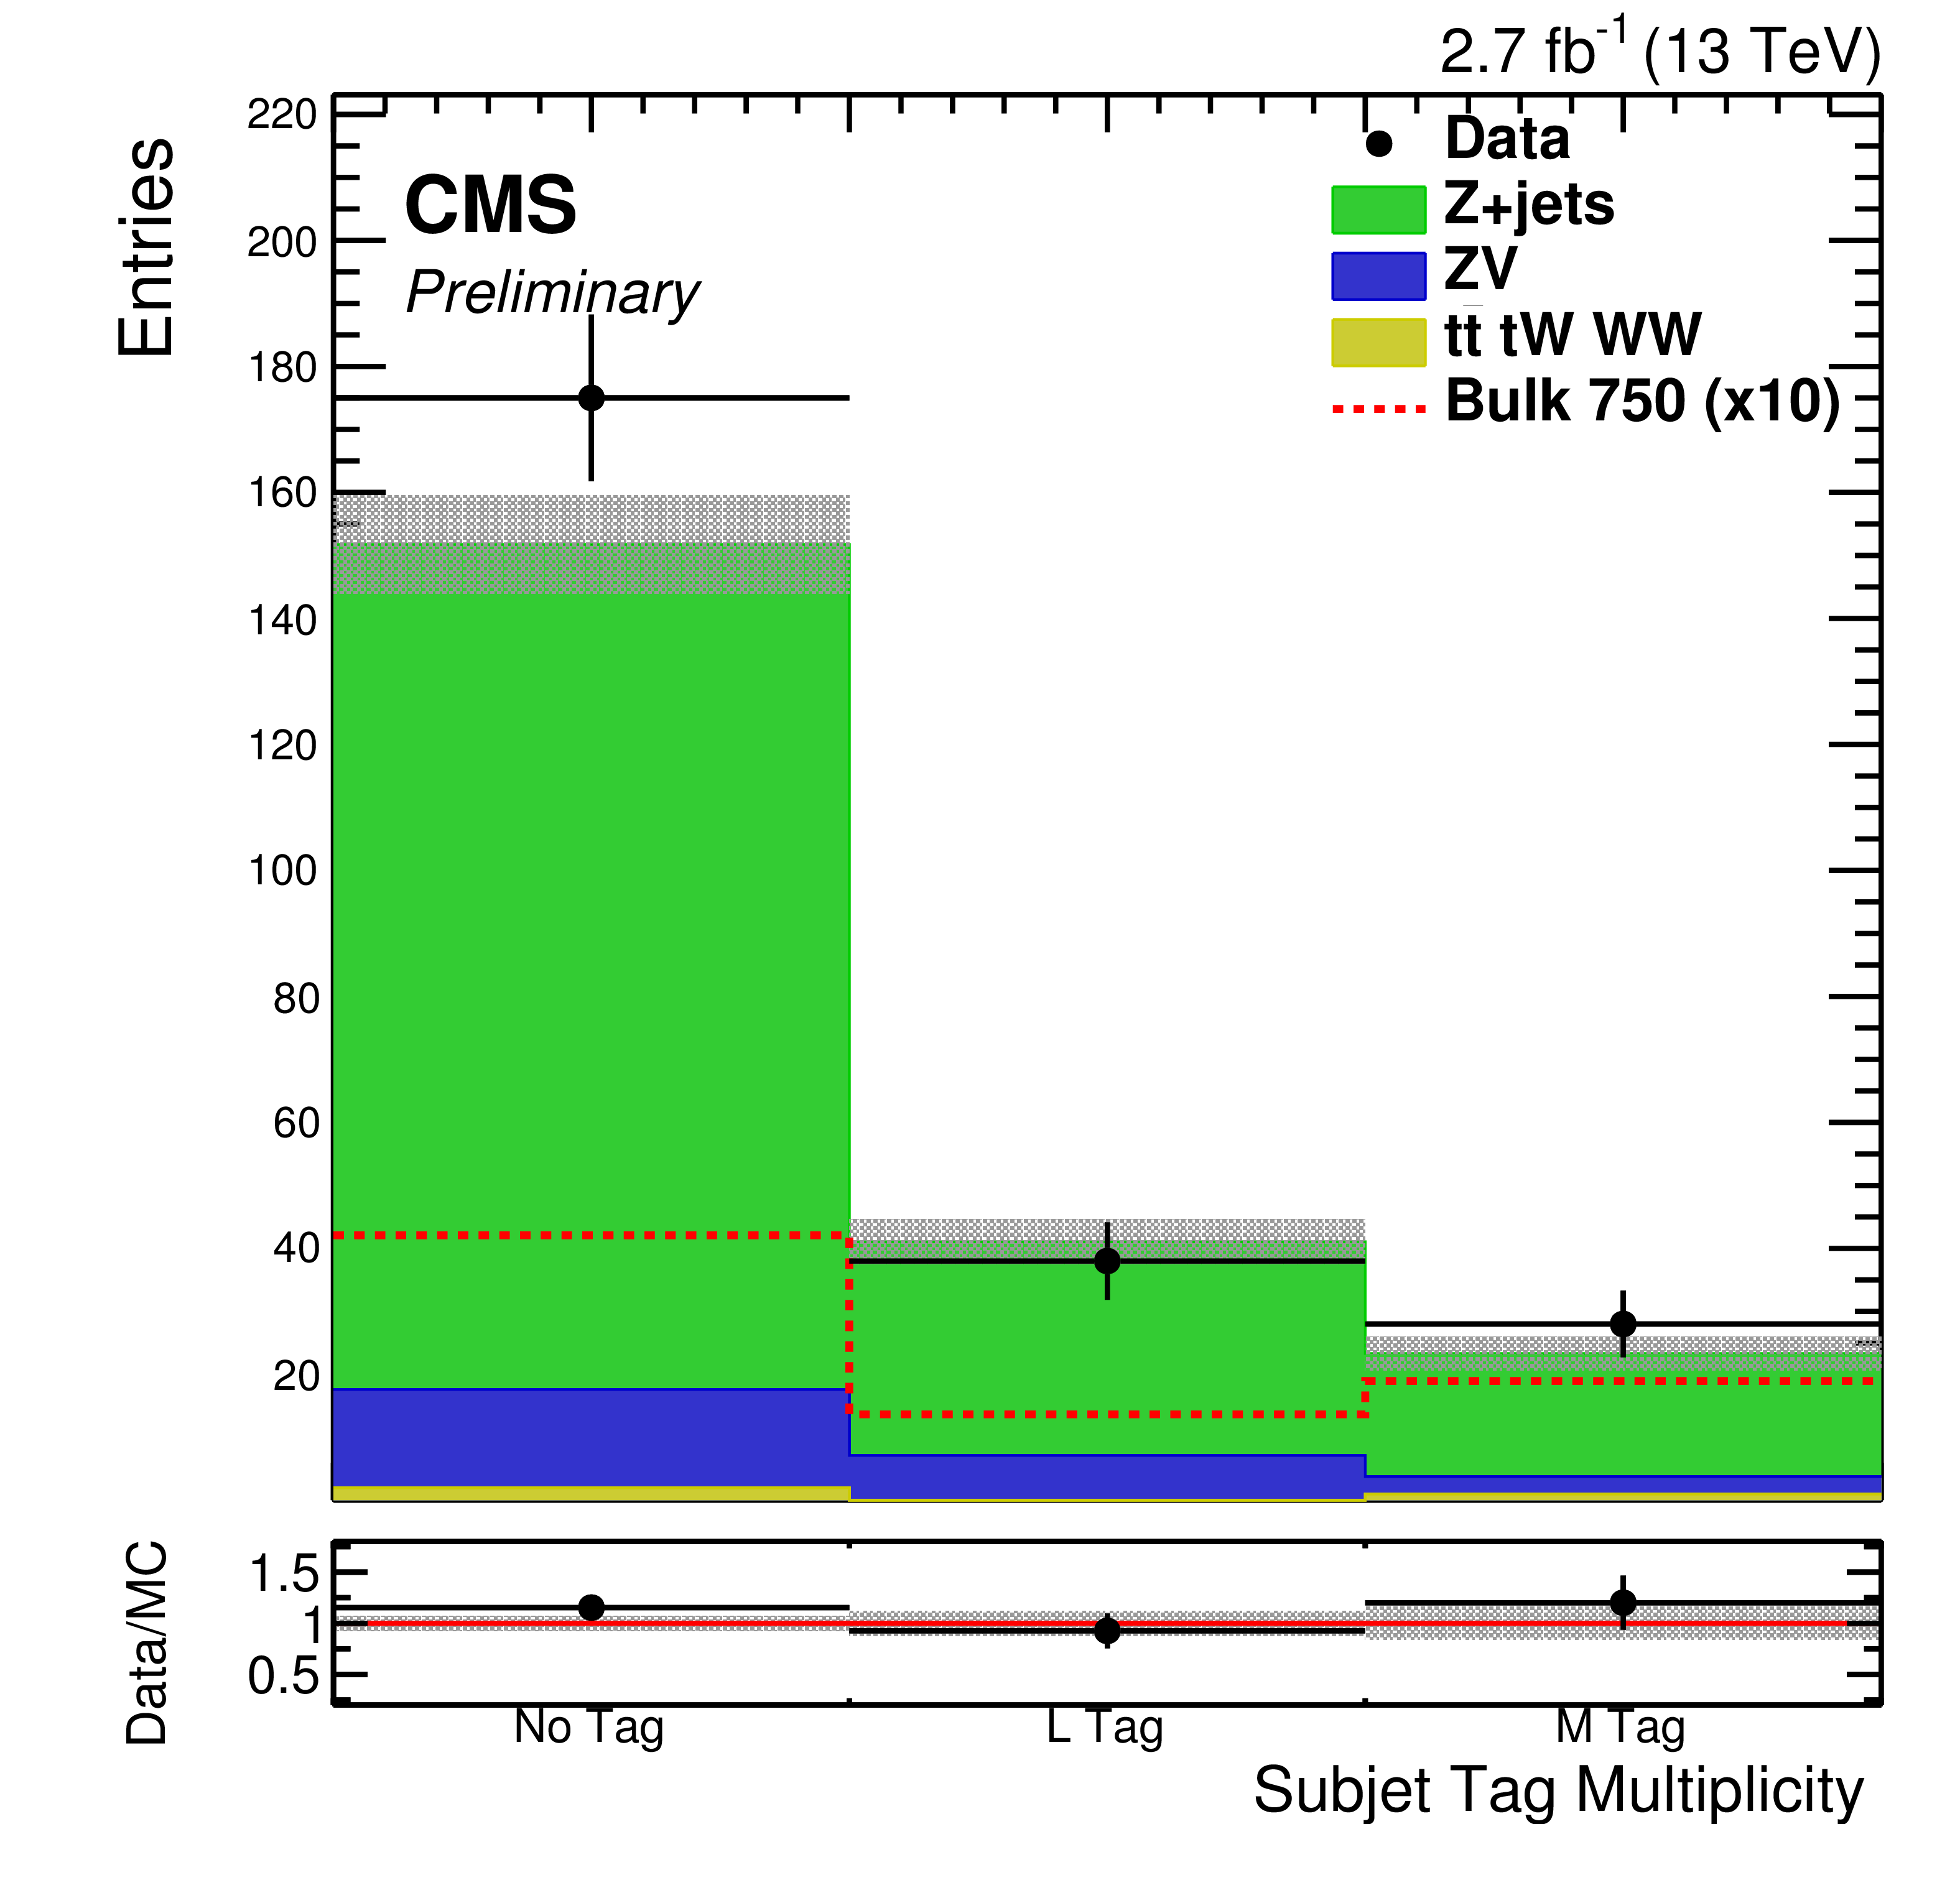
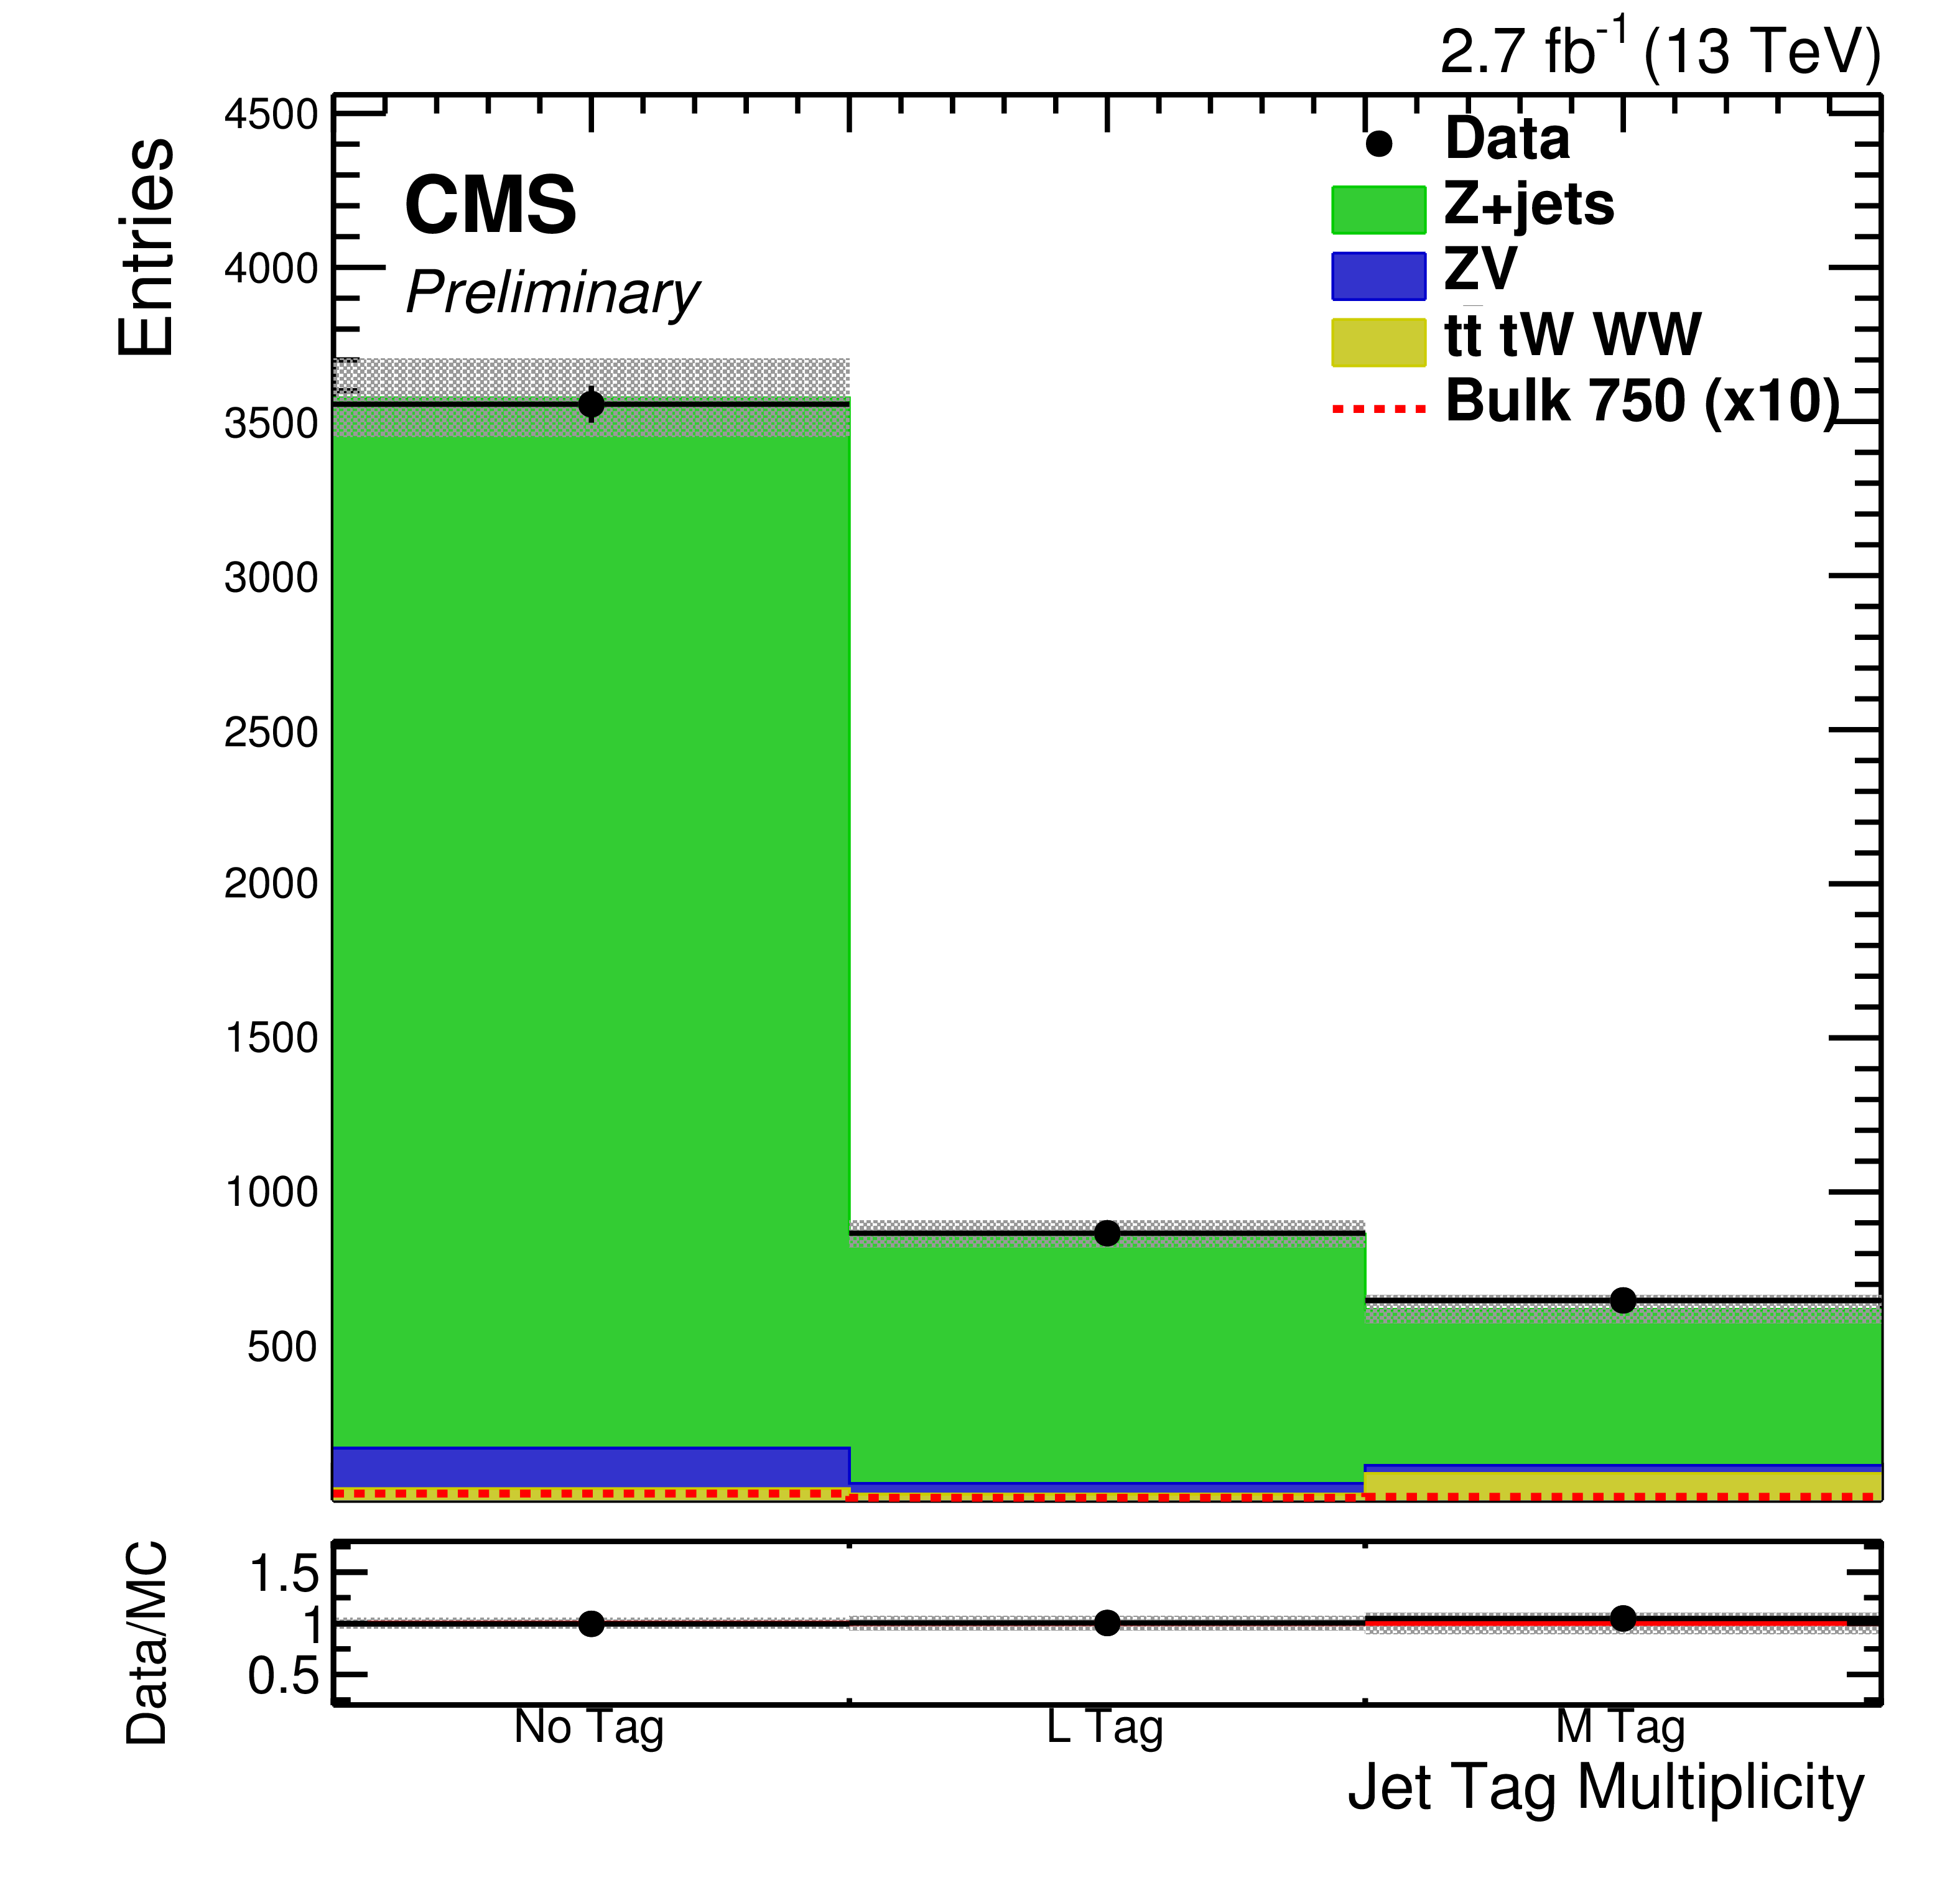
Figure 3-a:
The zero, loose and medium CSV tag multiplicity for the most b-like subjet of the boosted V candidates (a) and the most b-like jet of the resolved V candidates (b) for events in the signal region of the low mass search. The gray band shows the statistical and systematic uncertainties on the background. Background normalizations are derived from a fit to the $ {m_\mathrm {ZV}}$ observable in the sideband region alone. |
png pdf |
Figure 3-b:
The zero, loose and medium CSV tag multiplicity for the most b-like subjet of the boosted V candidates (a) and the most b-like jet of the resolved V candidates (b) for events in the signal region of the low mass search. The gray band shows the statistical and systematic uncertainties on the background. Background normalizations are derived from a fit to the $ {m_\mathrm {ZV}}$ observable in the sideband region alone. |
png pdf |
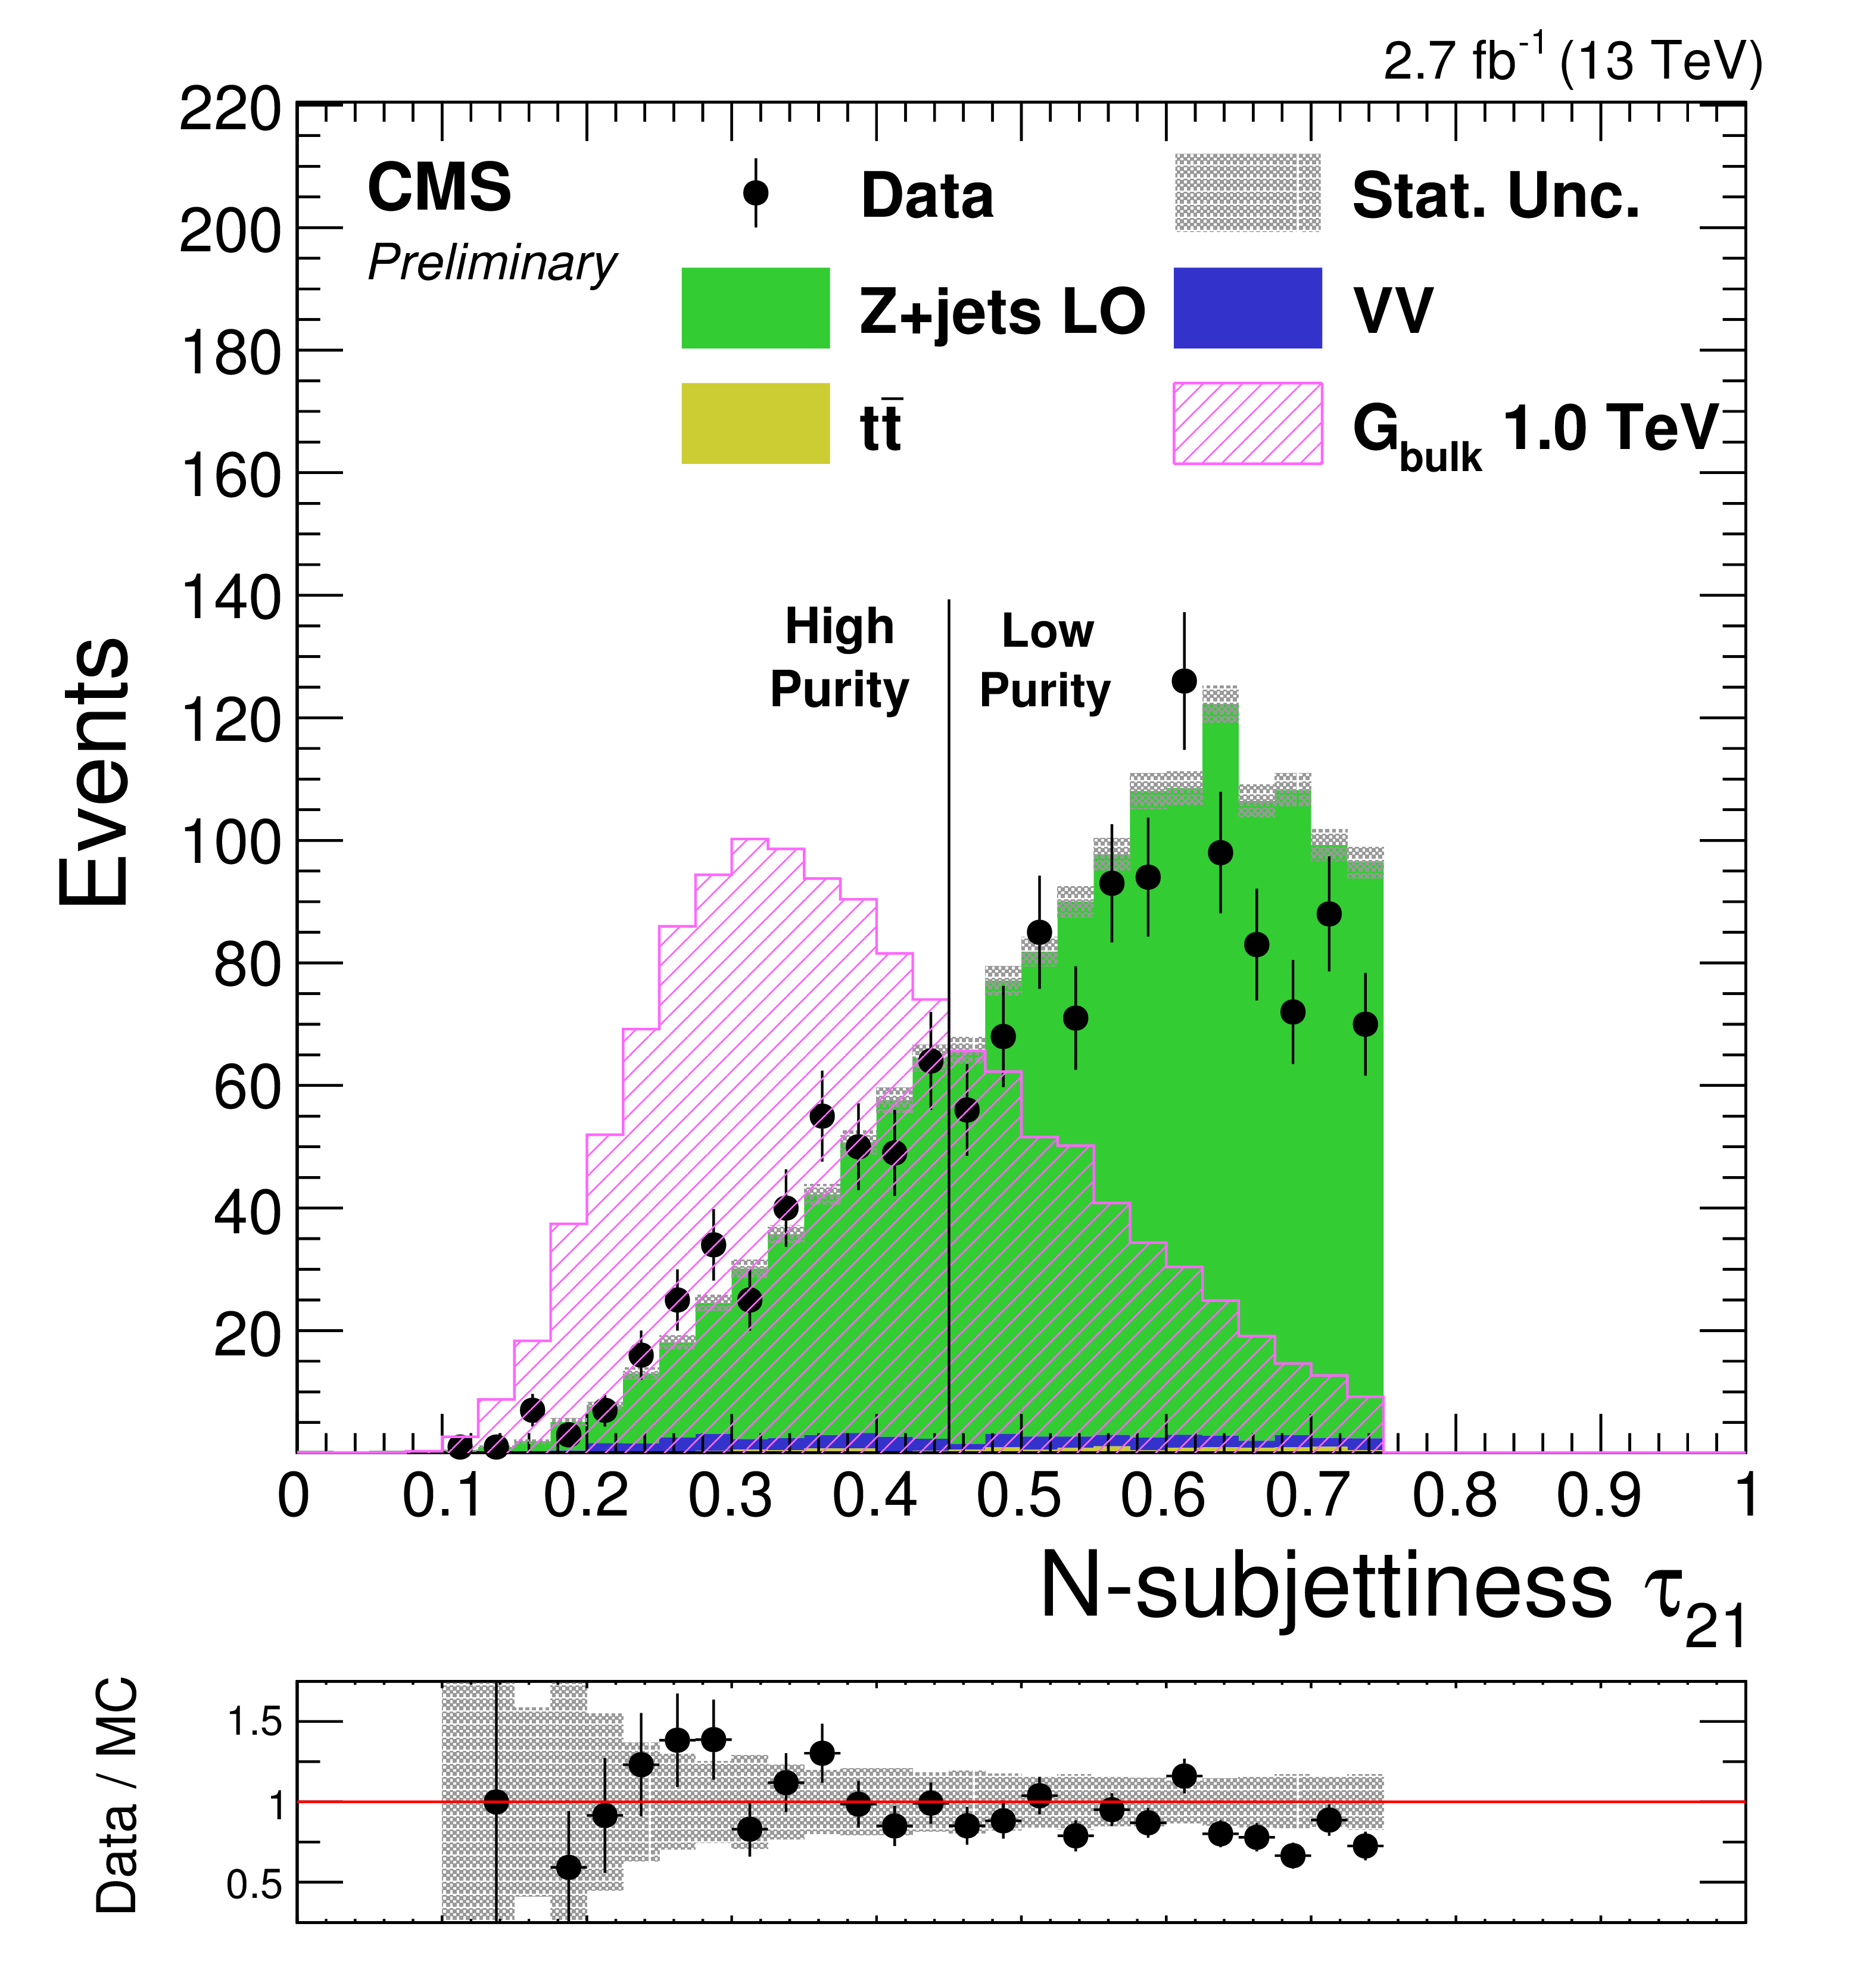
Figure 4:
Distribution of $\tau _{21}$ for data and simulated backgrounds in the high mass search; a simulated signal corresponding to a bulk graviton of 1 TeV is also shown. Simulated backgrounds are displayed as stacked histograms normalised to luminosity (2.7 fb$^{-1}$). The boundary at $ {\tau _{21}}= $ 0.45 separates the high purity and low purity categories. |
png pdf |
Figure 5-a:
The sideband $ {m_\mathrm {ZV}}$ distributions for the boosted V (a,b), resolved V (c,d), untagged (a,c) and tagged (b,d) categories of the low mass search after fitting the sideband data alone. The points show the data while the filled histograms show the background contributions. The grey band indicates the statistical and postfit systematic uncertainties on the normalization and shape of the background. |

png pdf |
Figure 5-b:
The sideband $ {m_\mathrm {ZV}}$ distributions for the boosted V (a,b), resolved V (c,d), untagged (a,c) and tagged (b,d) categories of the low mass search after fitting the sideband data alone. The points show the data while the filled histograms show the background contributions. The grey band indicates the statistical and postfit systematic uncertainties on the normalization and shape of the background. |

png pdf |
Figure 5-c:
The sideband $ {m_\mathrm {ZV}}$ distributions for the boosted V (a,b), resolved V (c,d), untagged (a,c) and tagged (b,d) categories of the low mass search after fitting the sideband data alone. The points show the data while the filled histograms show the background contributions. The grey band indicates the statistical and postfit systematic uncertainties on the normalization and shape of the background. |

png pdf |
Figure 5-d:
The sideband $ {m_\mathrm {ZV}}$ distributions for the boosted V (a,b), resolved V (c,d), untagged (a,c) and tagged (b,d) categories of the low mass search after fitting the sideband data alone. The points show the data while the filled histograms show the background contributions. The grey band indicates the statistical and postfit systematic uncertainties on the normalization and shape of the background. |
png pdf |
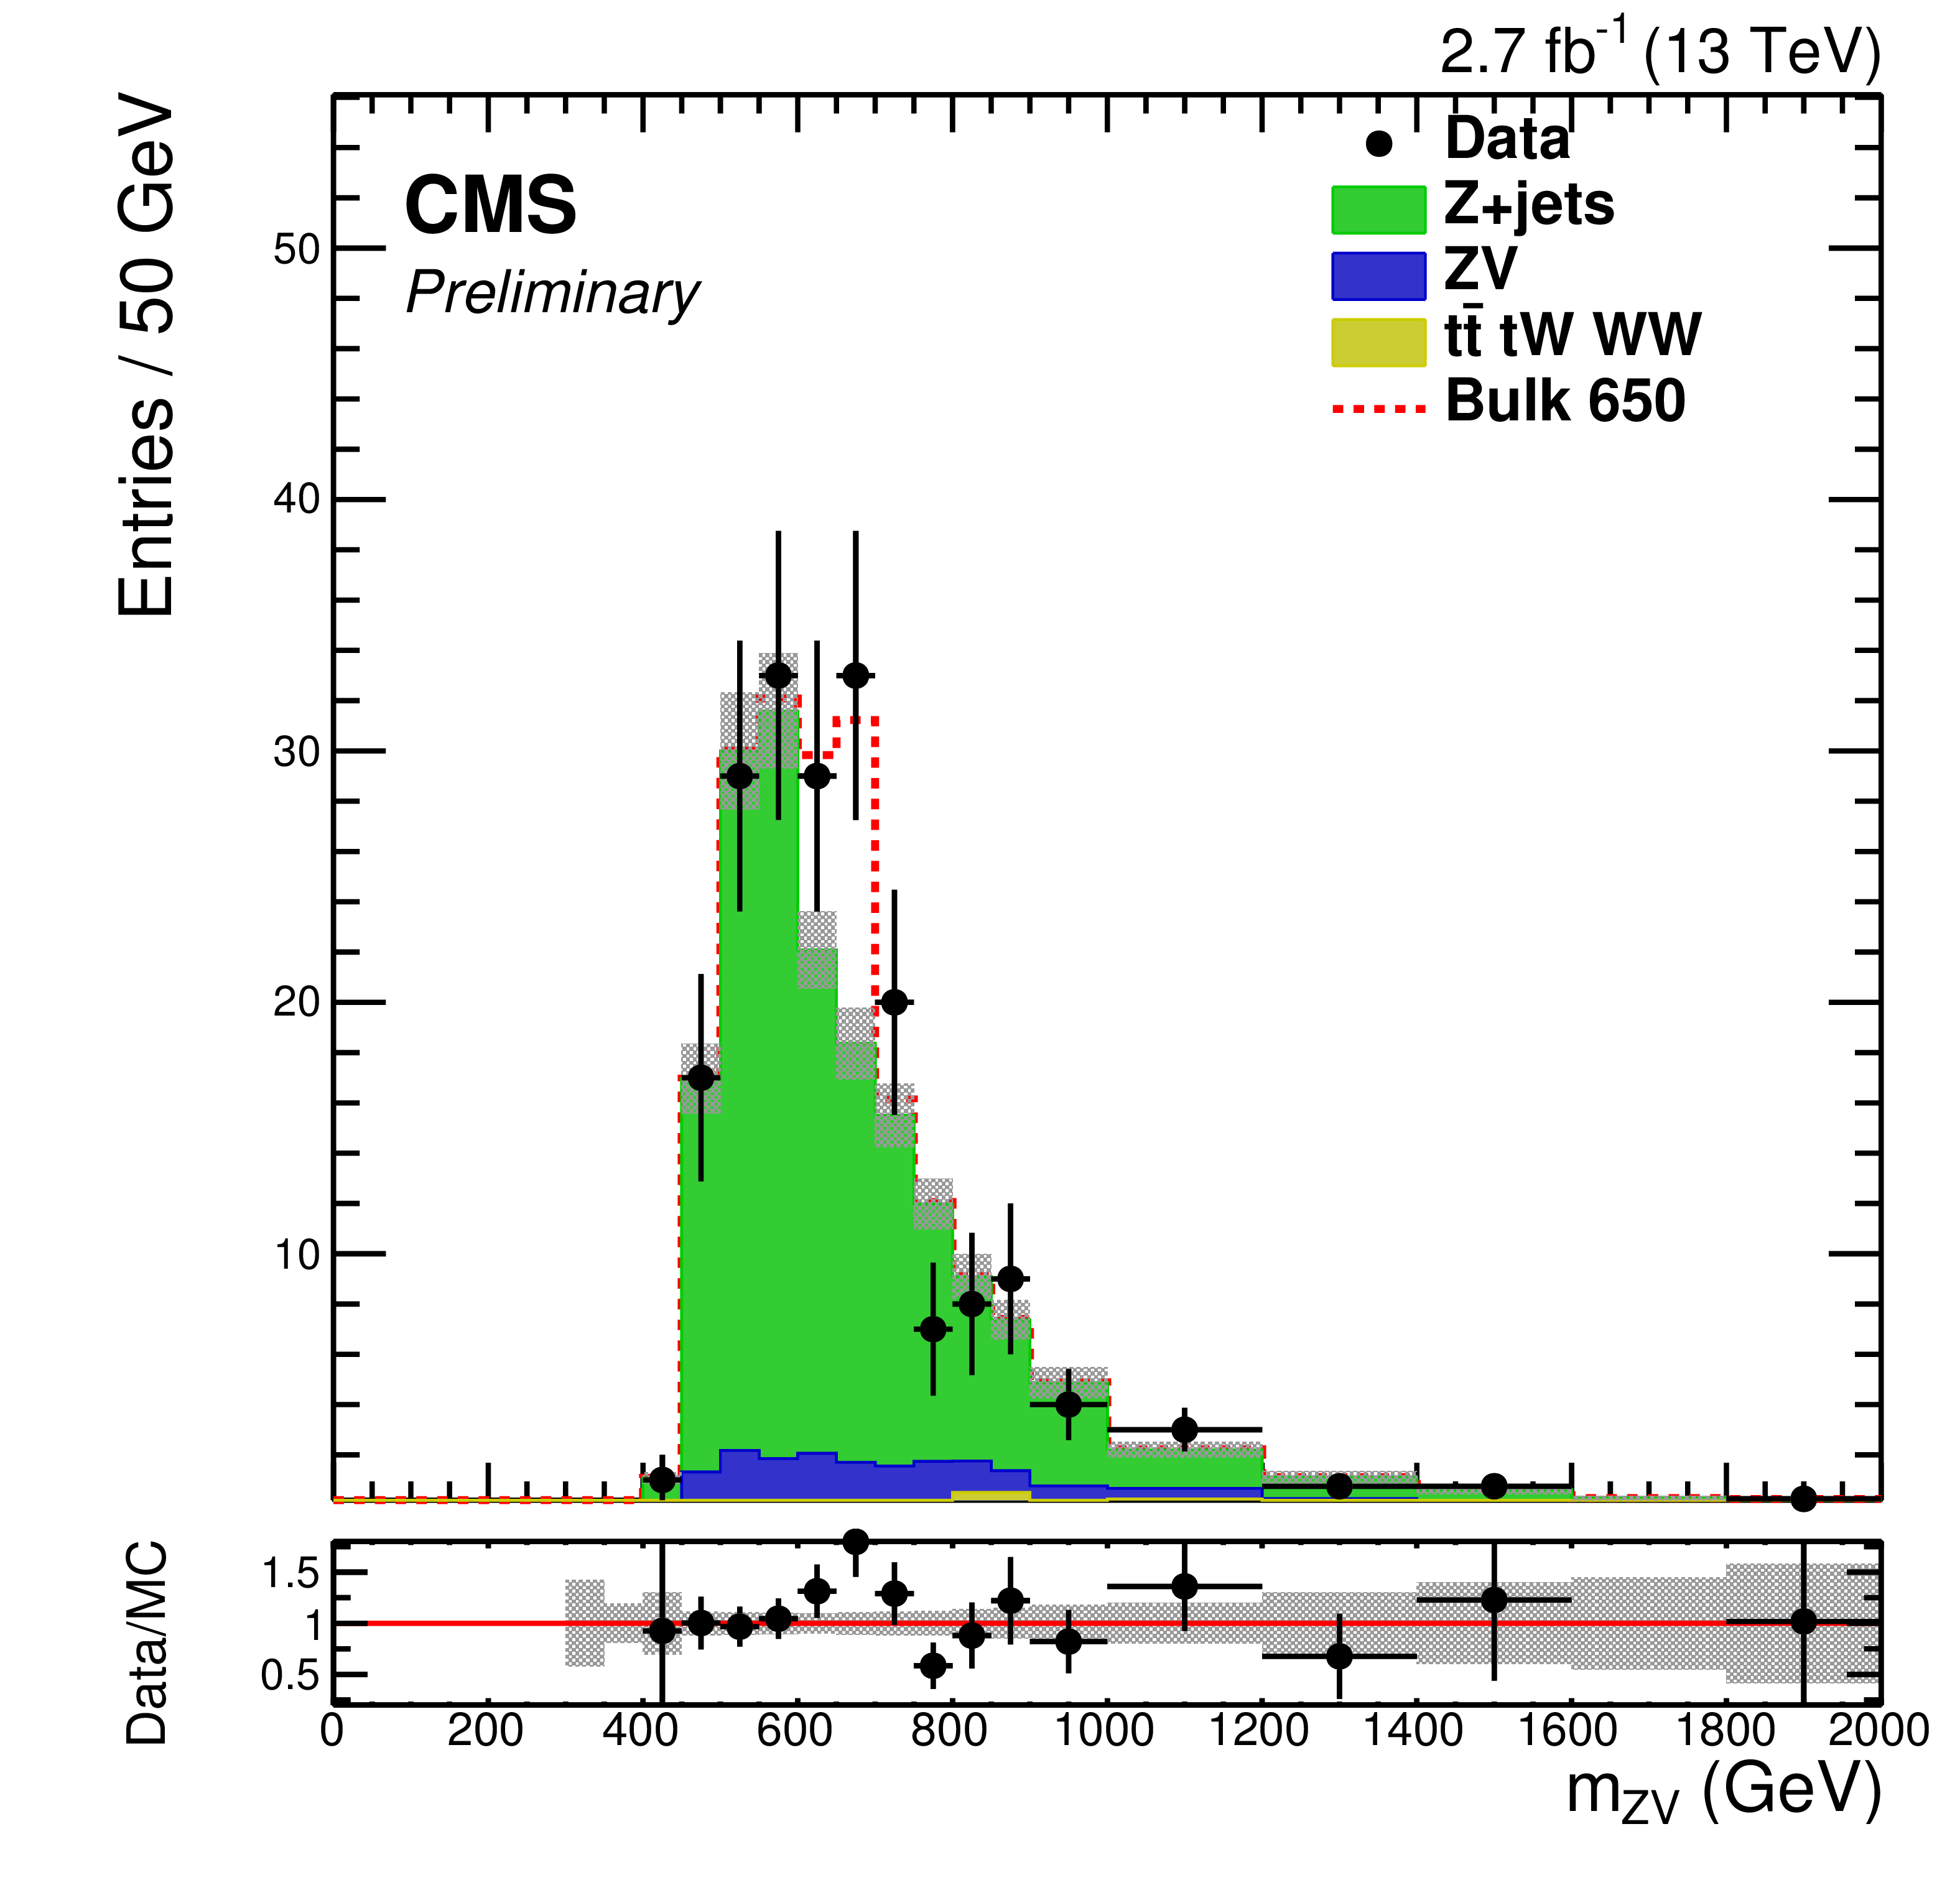
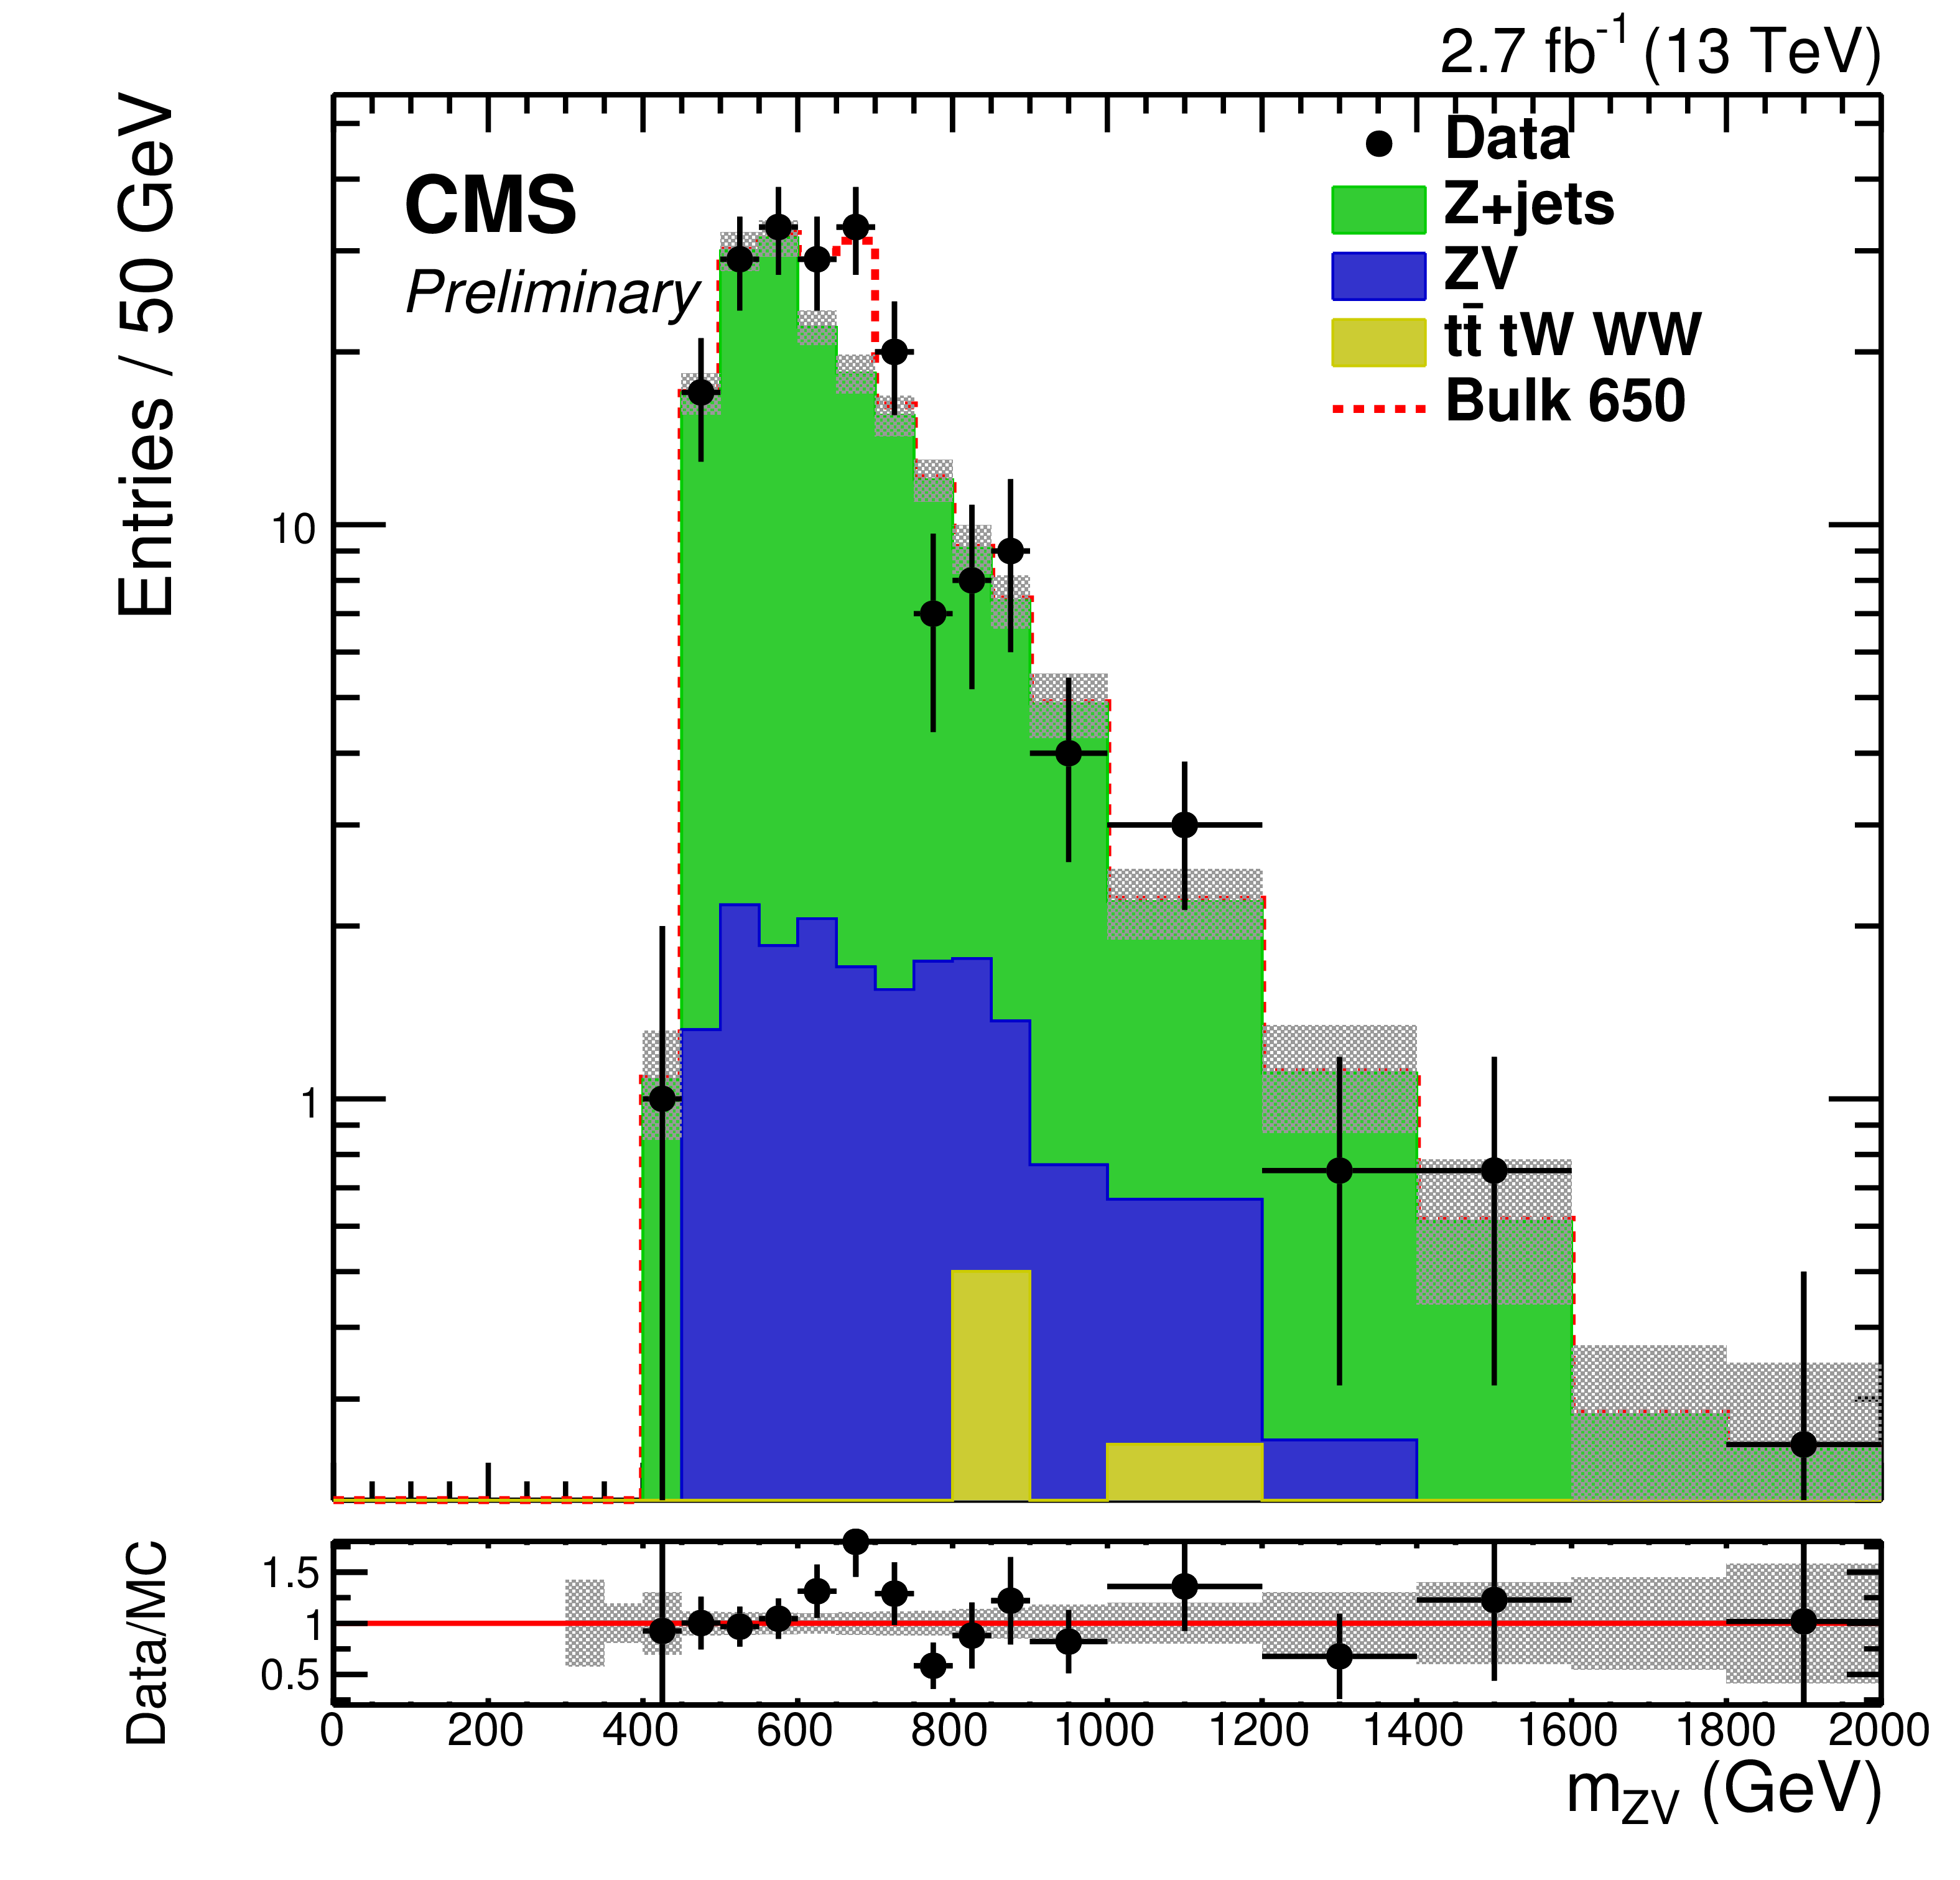
Figure 6-a:
The signal region $ {m_\mathrm {ZV}}$ distributions for the boosted V-untagged (a) and V-tagged (b) categories of the low mass search after fitting the signal and sideband regions using a signal plus background model. The points show the data while the filled histograms show the background contributions. The signal is represented by the red dashed histogram. The grey band indicates the statistical and systematic uncertainties on the normalization and shape of the background. |

png pdf |
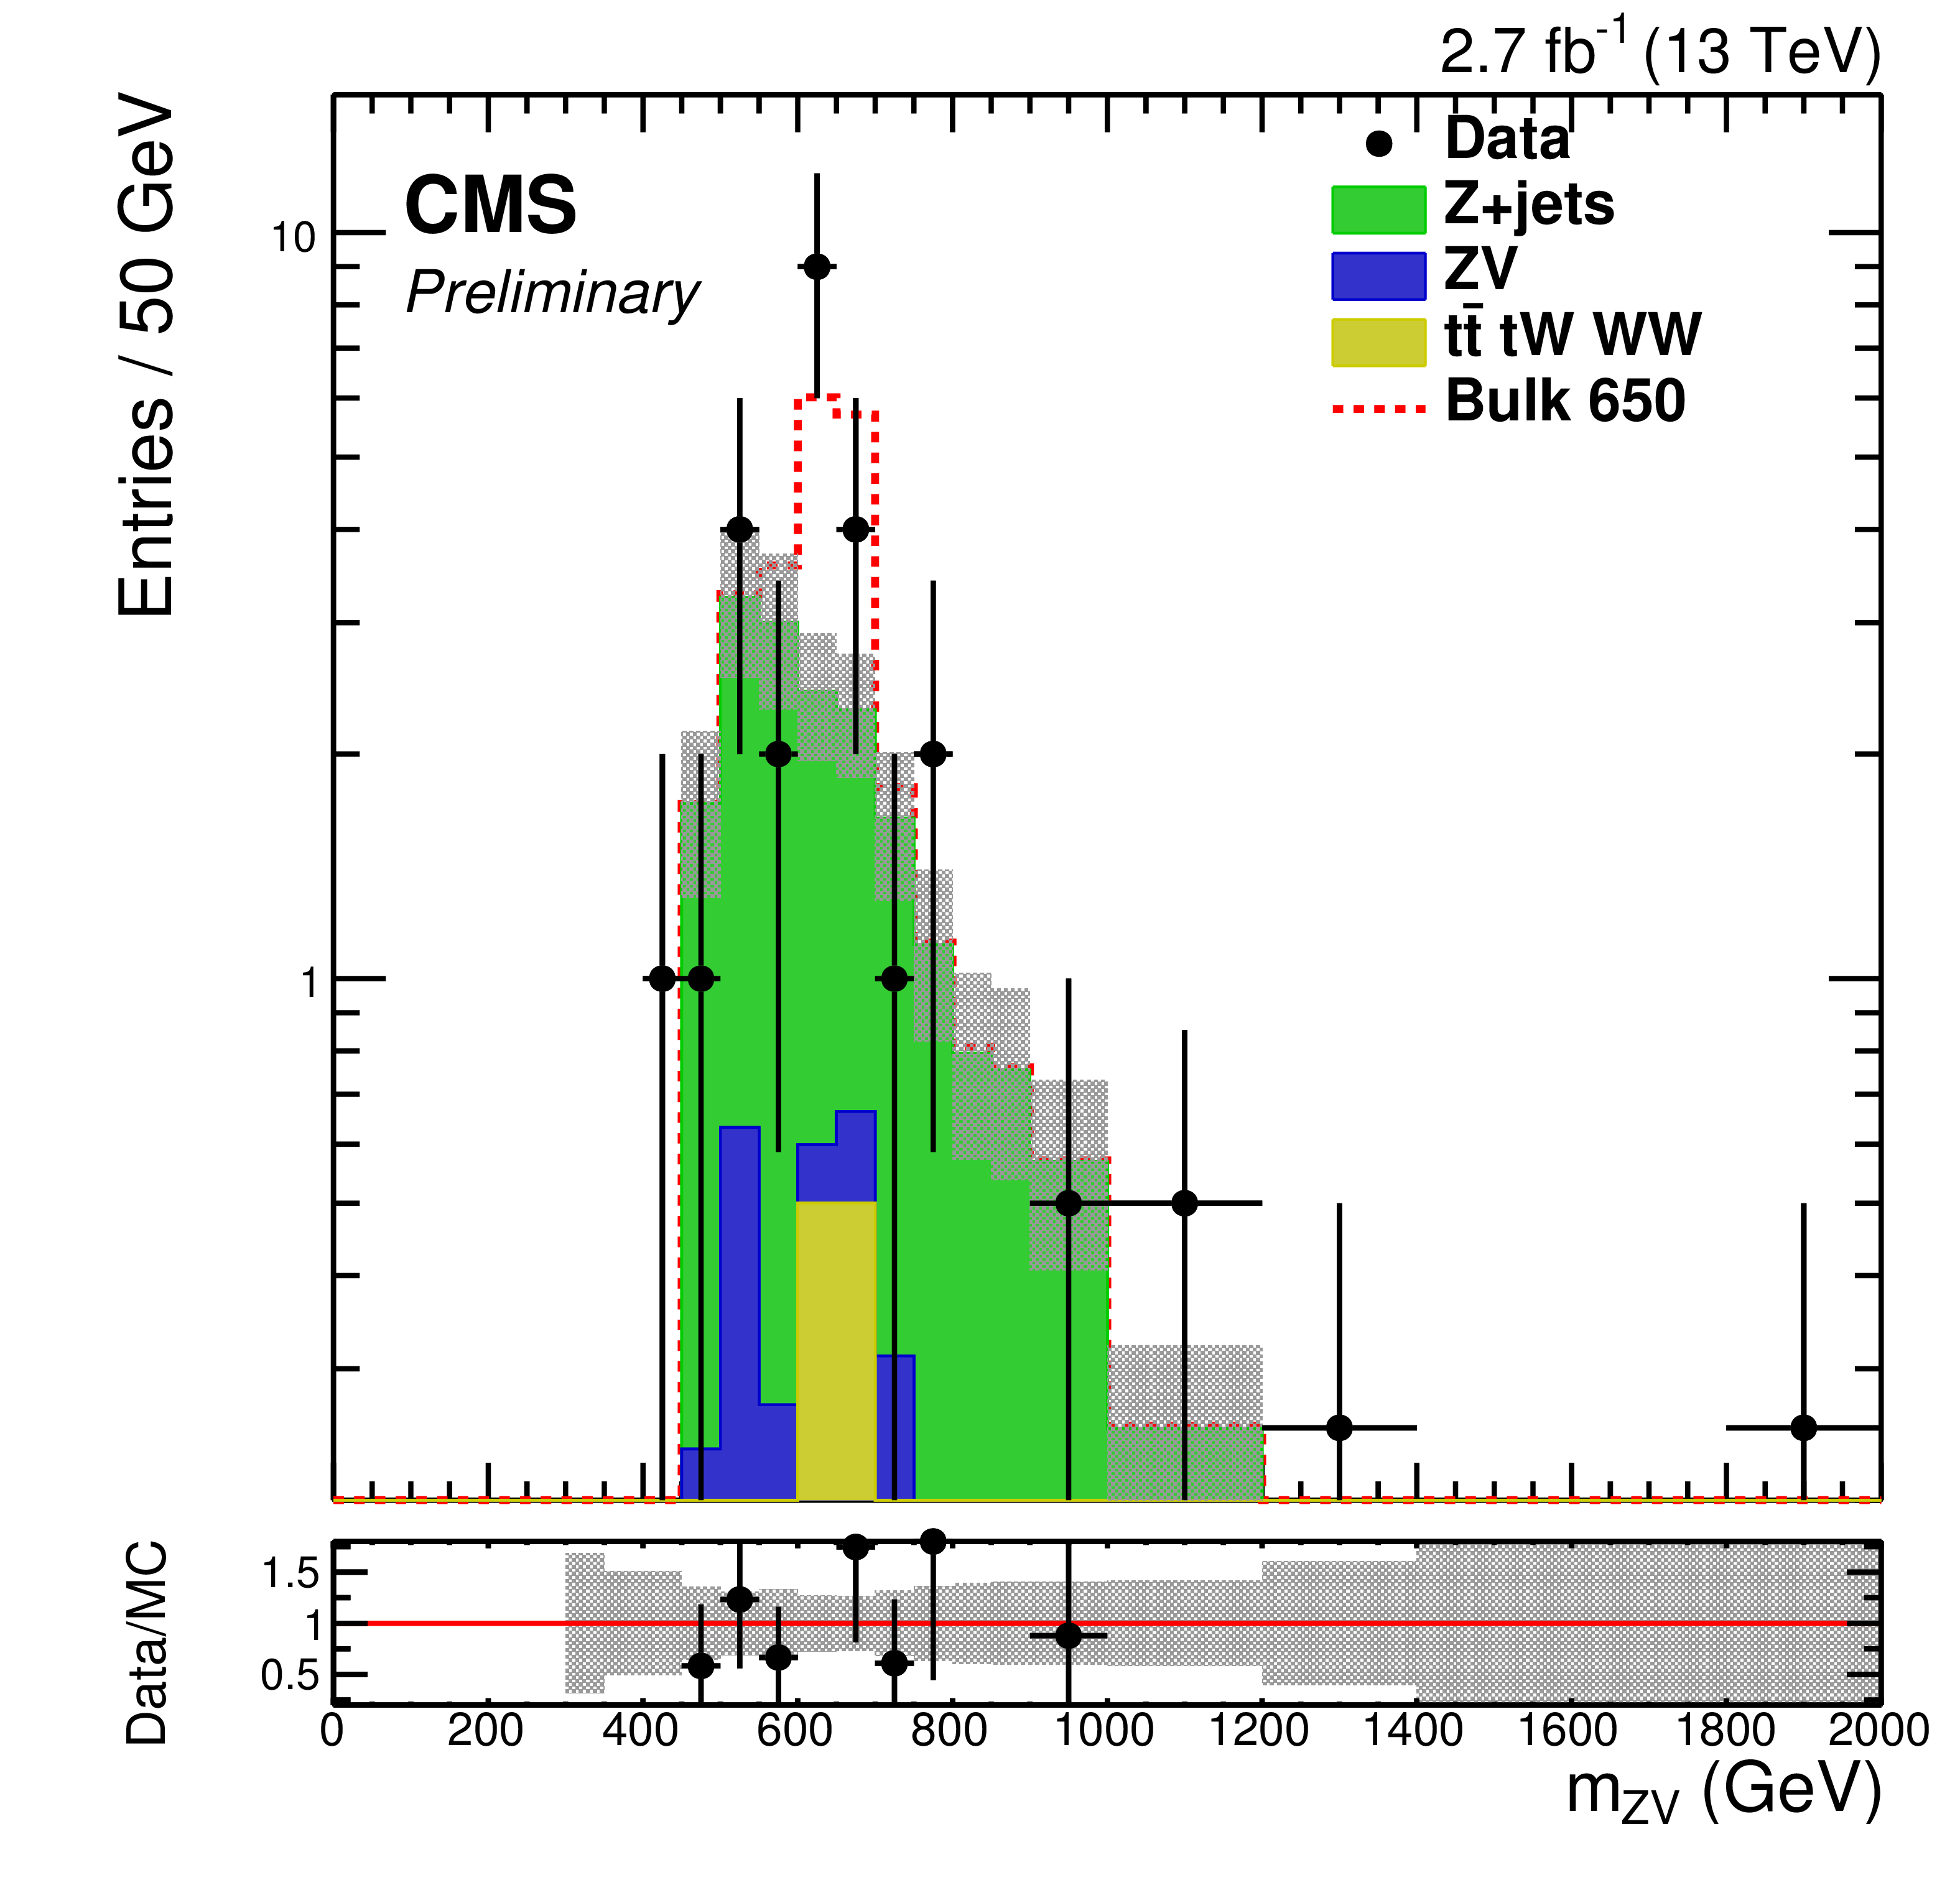
Figure 6-b:
The signal region $ {m_\mathrm {ZV}}$ distributions for the boosted V-untagged (a) and V-tagged (b) categories of the low mass search after fitting the signal and sideband regions using a signal plus background model. The points show the data while the filled histograms show the background contributions. The signal is represented by the red dashed histogram. The grey band indicates the statistical and systematic uncertainties on the normalization and shape of the background. |
png pdf |
Figure 6-c:
The signal region $ {m_\mathrm {ZV}}$ distributions for the boosted V-untagged (a) and V-tagged (b) categories of the low mass search after fitting the signal and sideband regions using a signal plus background model. The points show the data while the filled histograms show the background contributions. The signal is represented by the red dashed histogram. The grey band indicates the statistical and systematic uncertainties on the normalization and shape of the background. |
png pdf |
Figure 6-d:
The signal region $ {m_\mathrm {ZV}}$ distributions for the boosted V-untagged (a) and V-tagged (b) categories of the low mass search after fitting the signal and sideband regions using a signal plus background model. The points show the data while the filled histograms show the background contributions. The signal is represented by the red dashed histogram. The grey band indicates the statistical and systematic uncertainties on the normalization and shape of the background. |
png pdf |
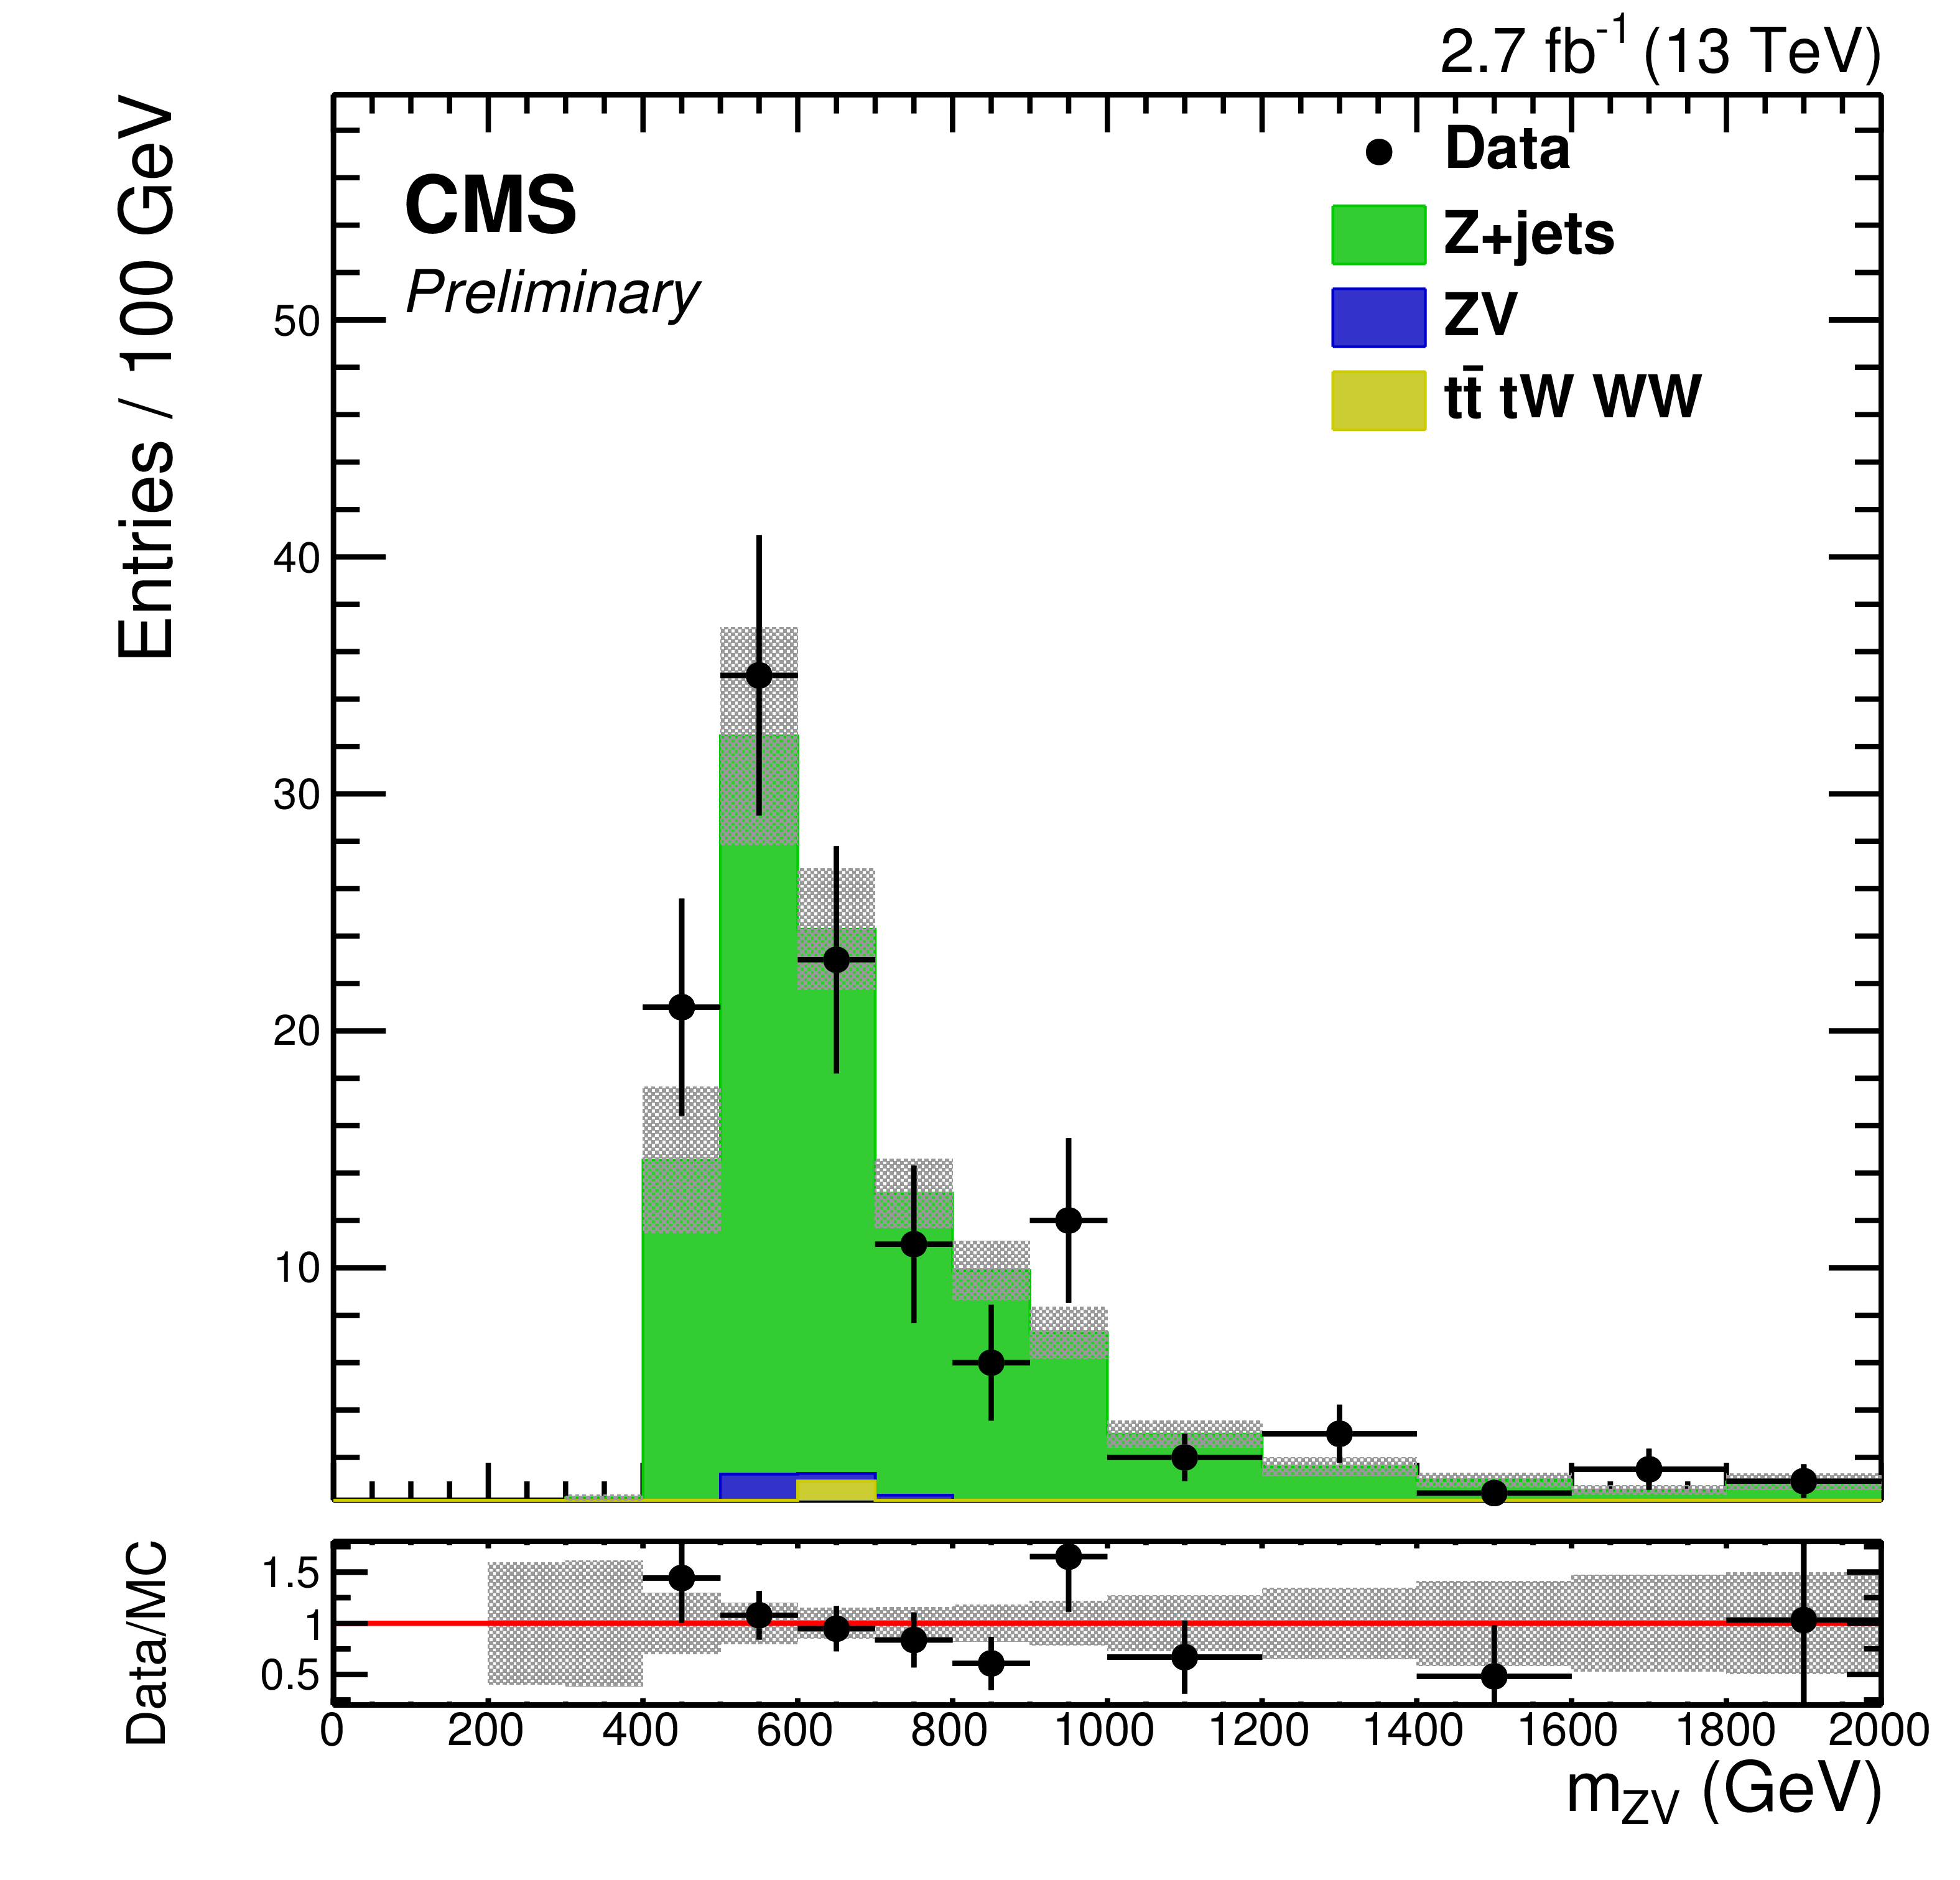
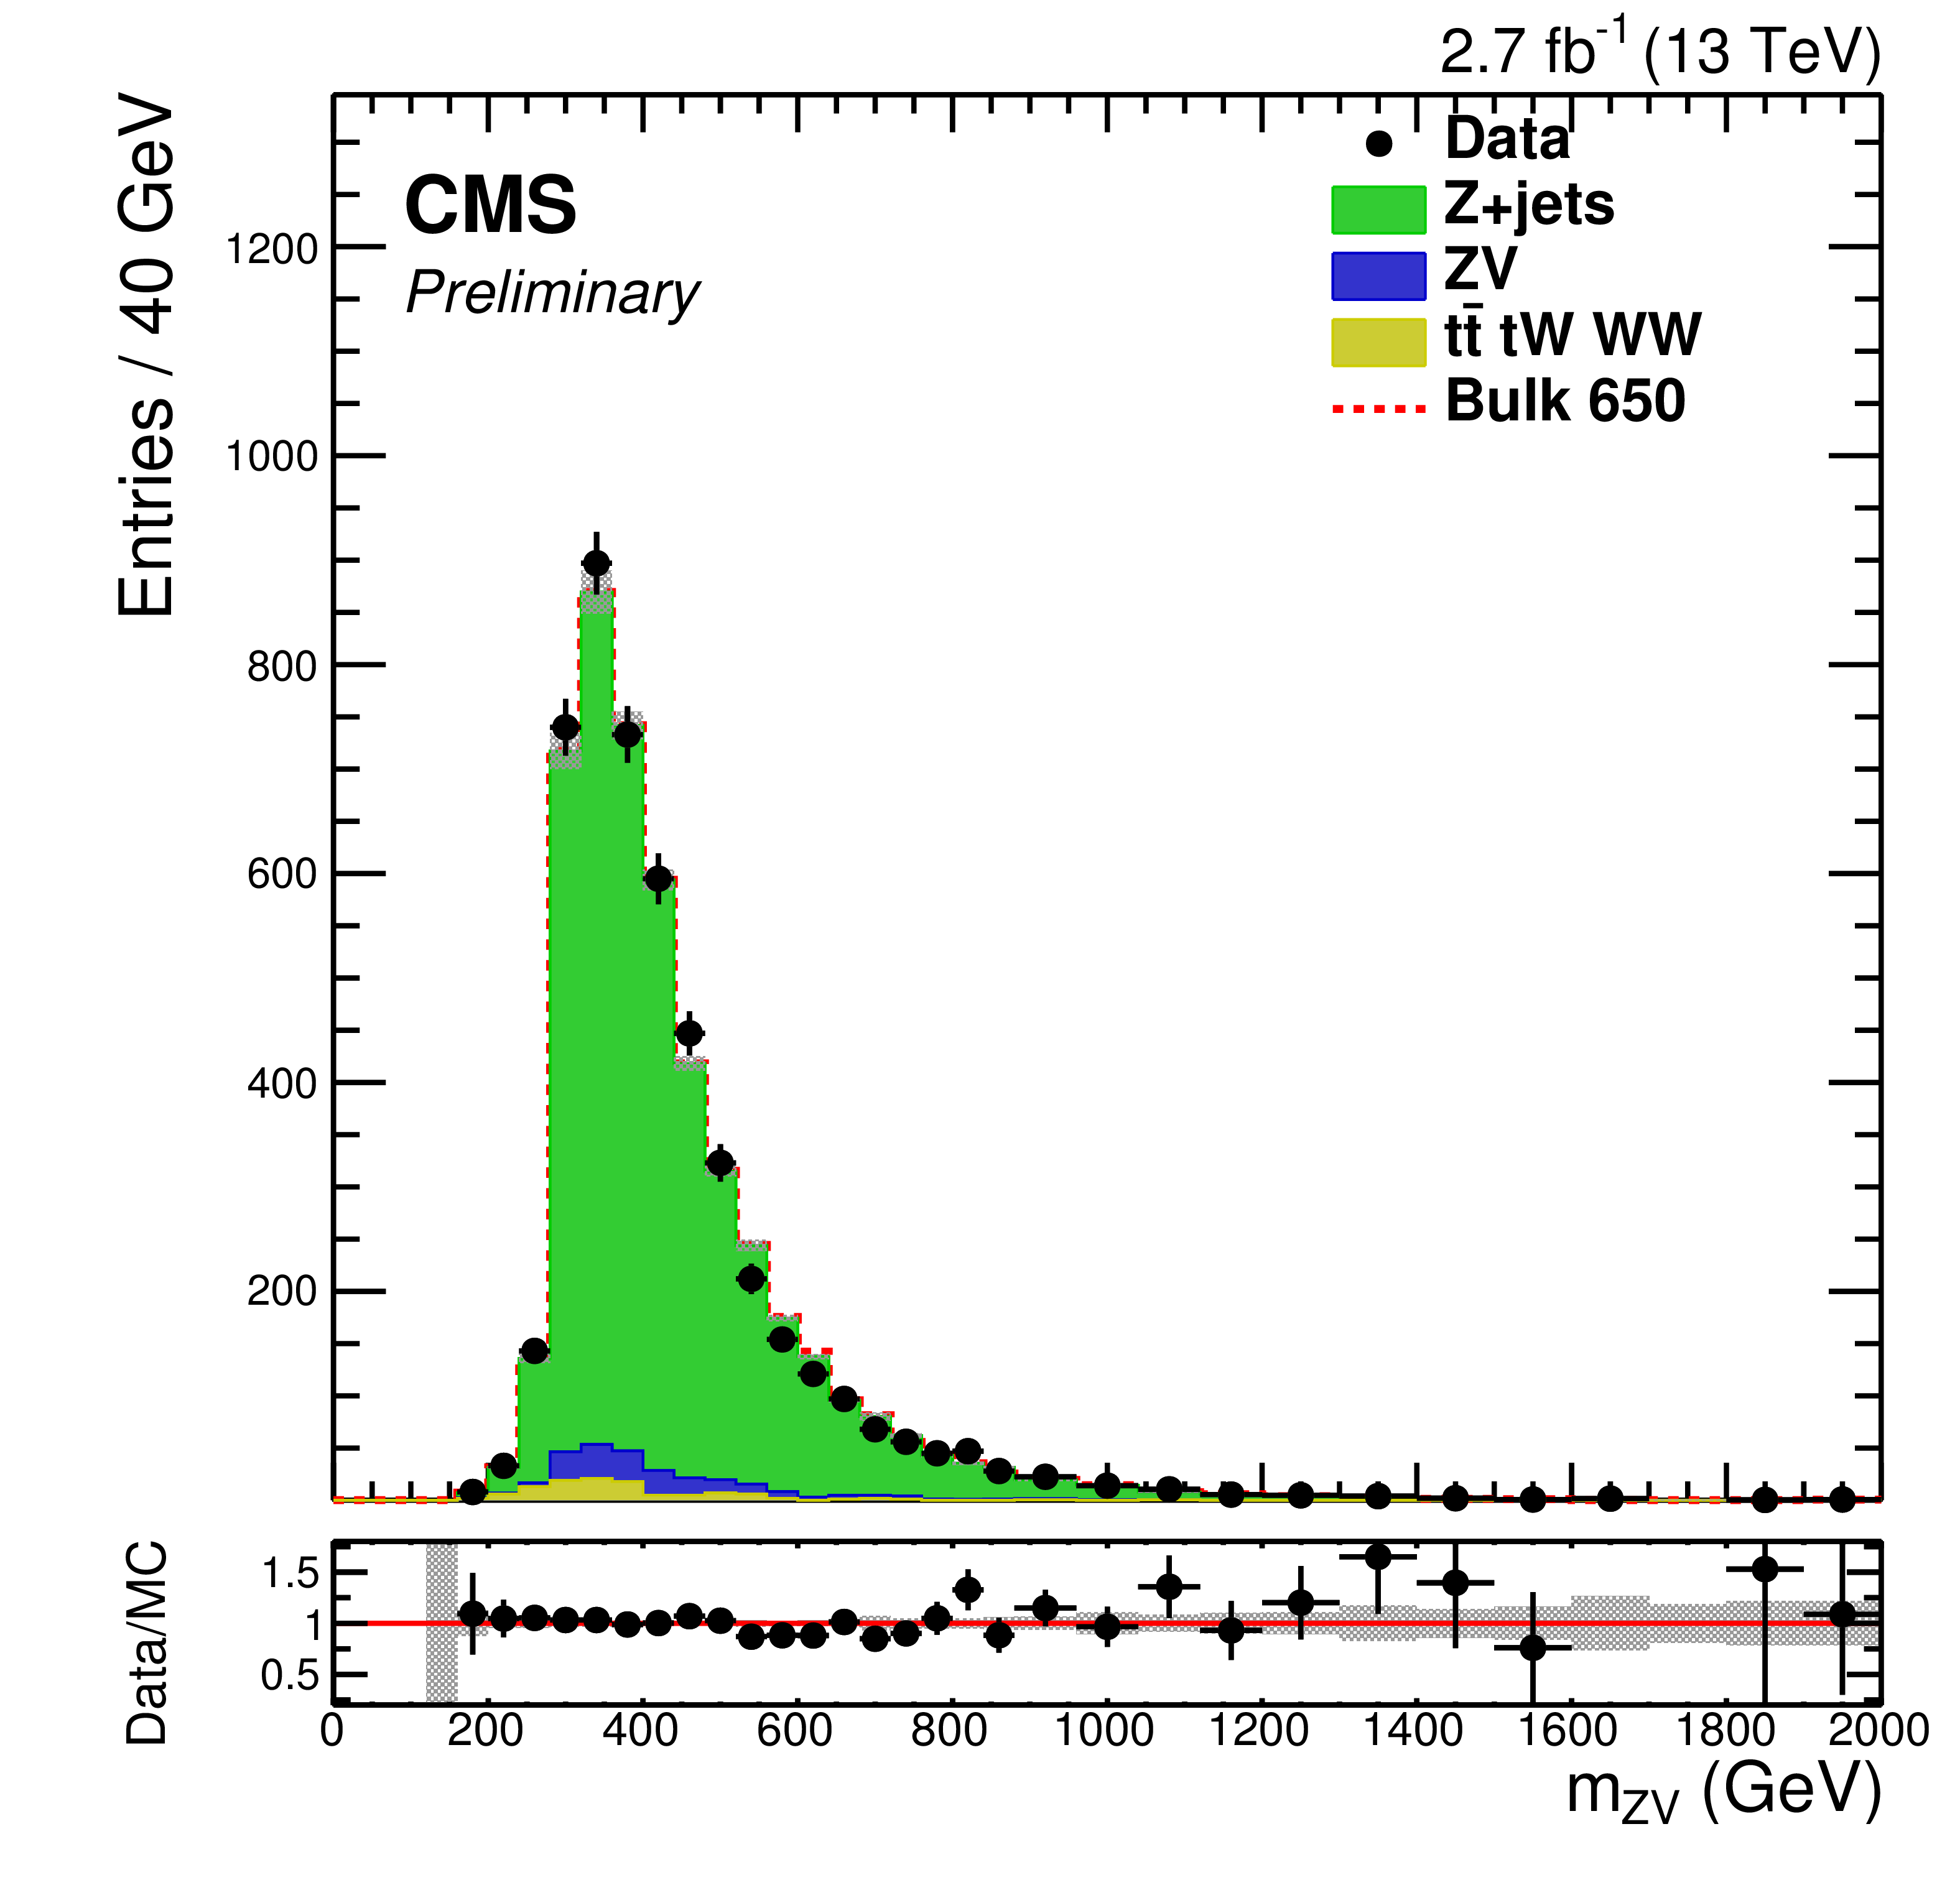
Figure 7-a:
The signal region $ {m_\mathrm {ZV}}$ distributions for the resolved V-untagged (a) and V-tagged (b) categories of the low mass search after fitting the signal and sideband regions using a signal plus background model. The points show the data while the histograms show the background contributions. The signal is represented by the red dashed histogram. The grey band indicates the statistical and systematic uncertainties on the normalization and shape of the background. |

png pdf |
Figure 7-b:
The signal region $ {m_\mathrm {ZV}}$ distributions for the resolved V-untagged (a) and V-tagged (b) categories of the low mass search after fitting the signal and sideband regions using a signal plus background model. The points show the data while the histograms show the background contributions. The signal is represented by the red dashed histogram. The grey band indicates the statistical and systematic uncertainties on the normalization and shape of the background. |

png pdf |
Figure 7-c:
The signal region $ {m_\mathrm {ZV}}$ distributions for the resolved V-untagged (a) and V-tagged (b) categories of the low mass search after fitting the signal and sideband regions using a signal plus background model. The points show the data while the histograms show the background contributions. The signal is represented by the red dashed histogram. The grey band indicates the statistical and systematic uncertainties on the normalization and shape of the background. |

png pdf |
Figure 7-d:
The signal region $ {m_\mathrm {ZV}}$ distributions for the resolved V-untagged (a) and V-tagged (b) categories of the low mass search after fitting the signal and sideband regions using a signal plus background model. The points show the data while the histograms show the background contributions. The signal is represented by the red dashed histogram. The grey band indicates the statistical and systematic uncertainties on the normalization and shape of the background. |
png pdf |
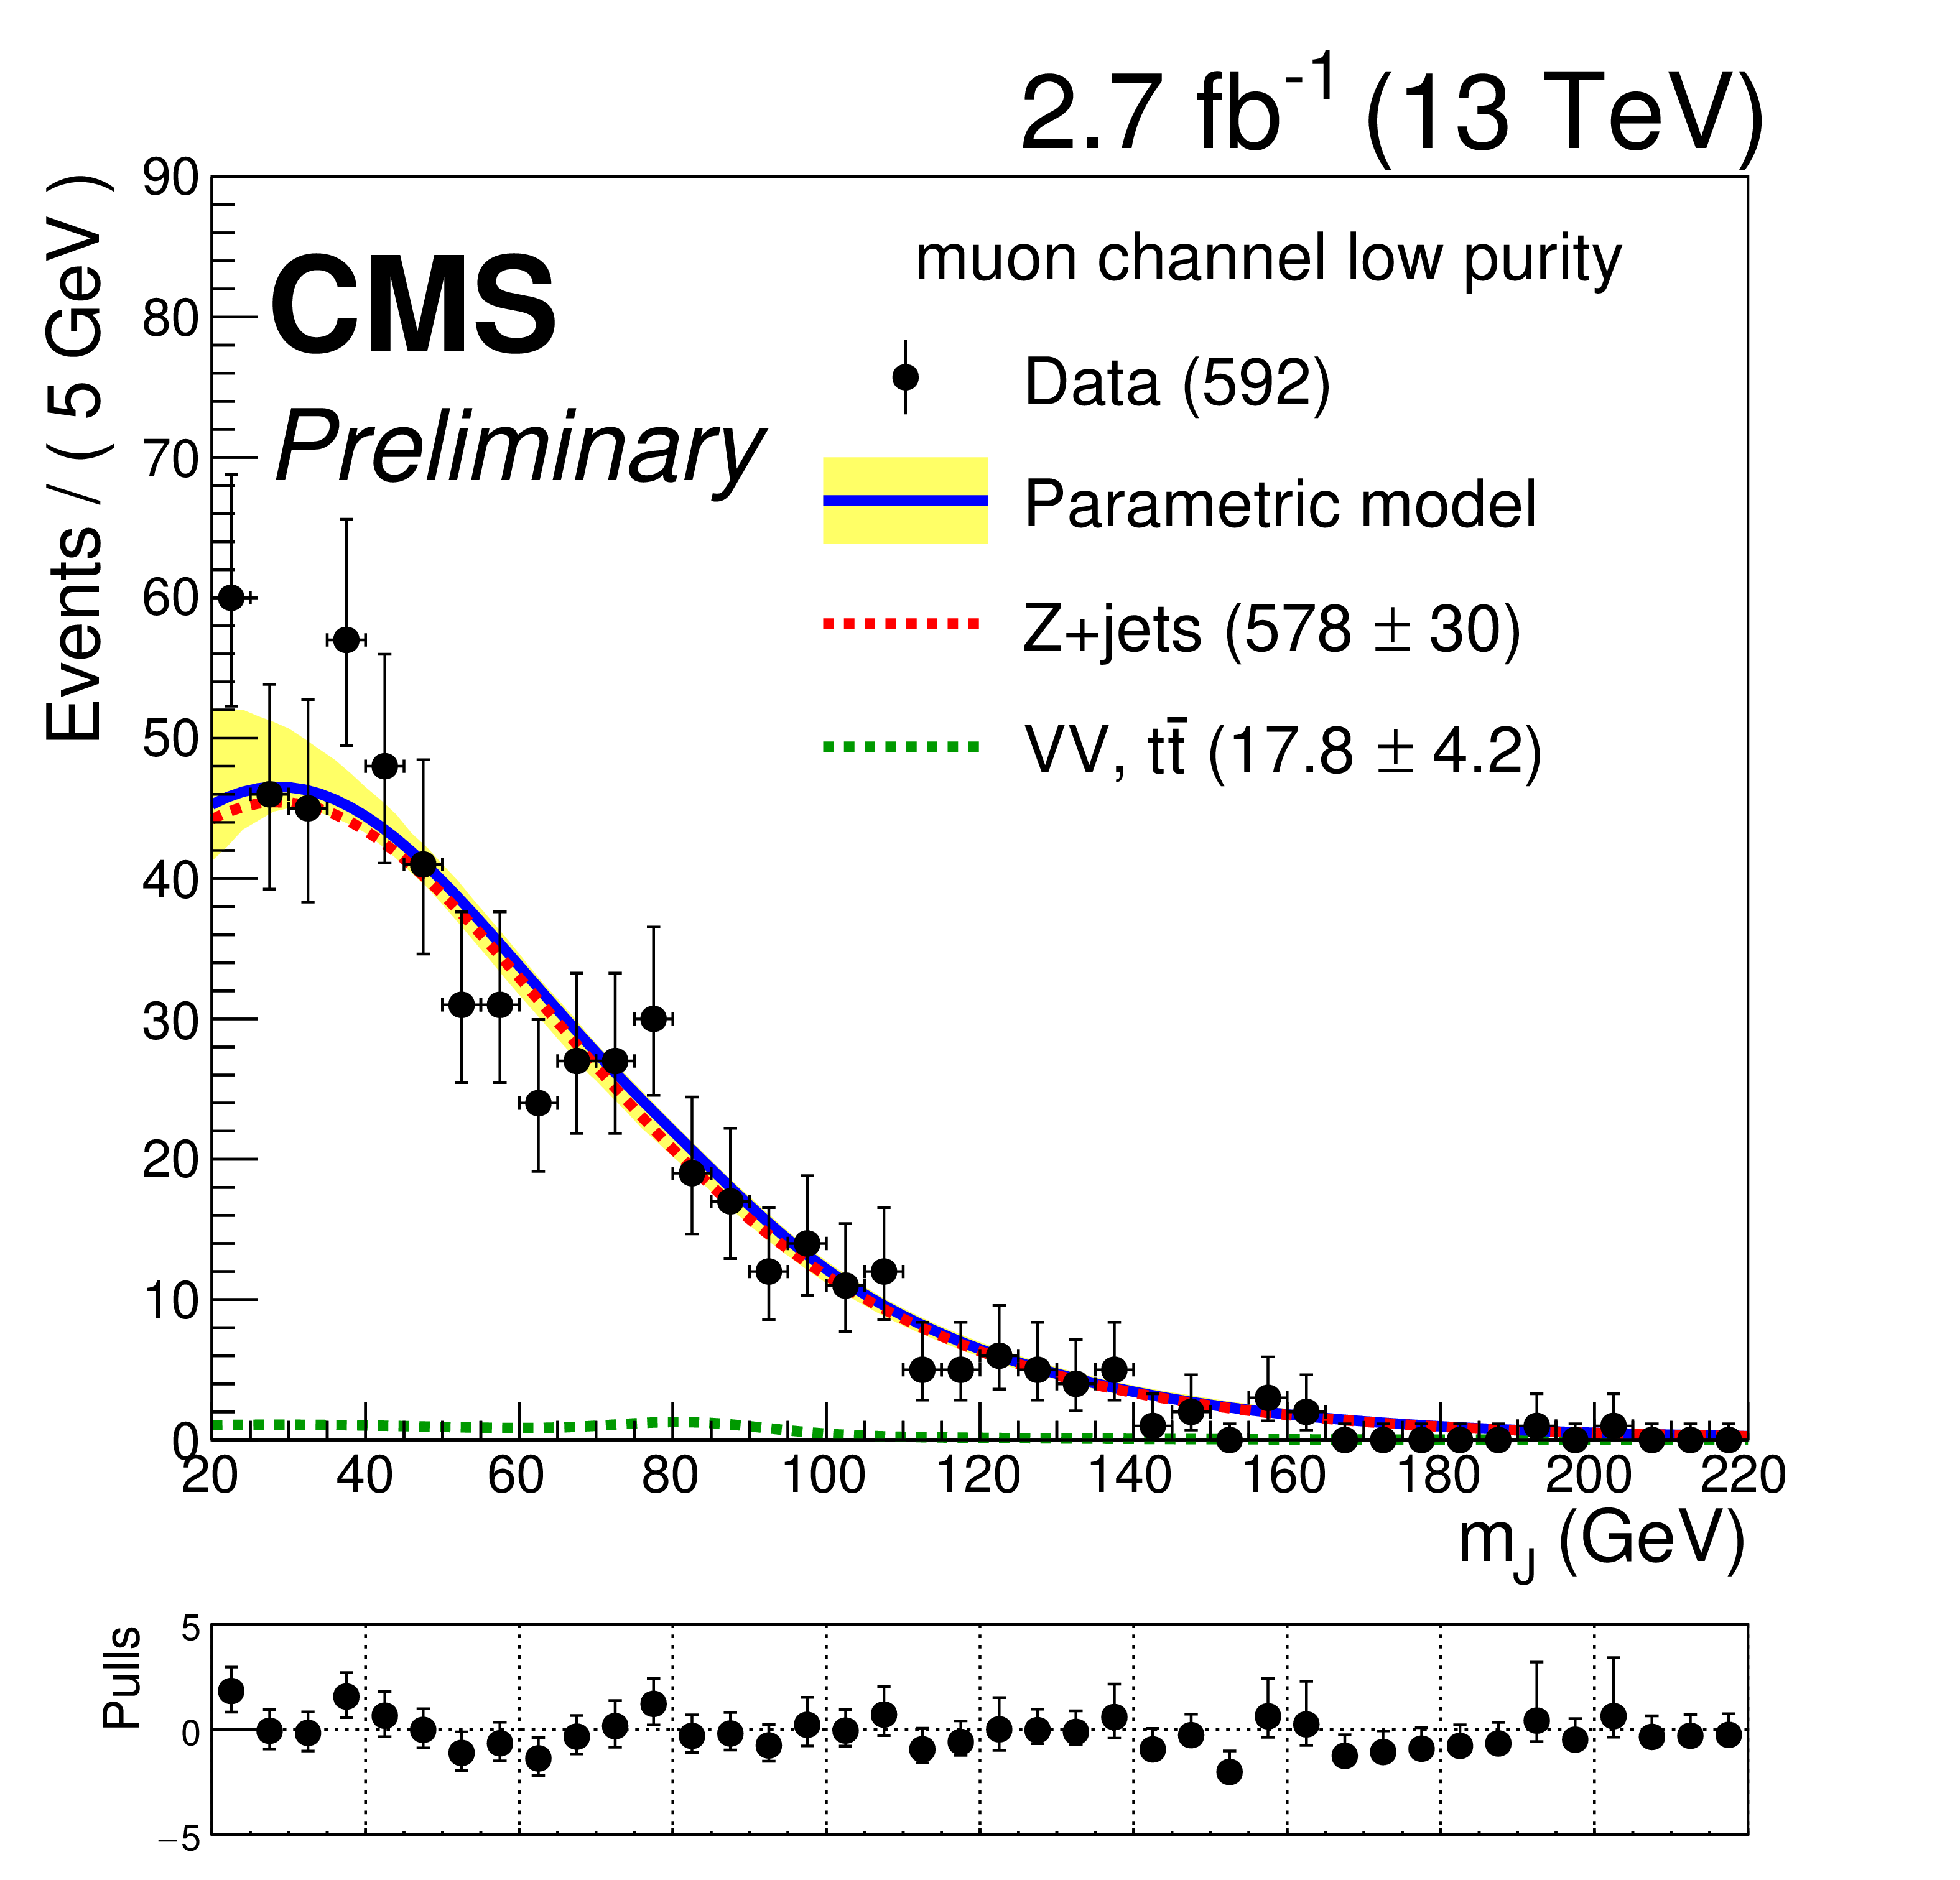
Figure 8-a:
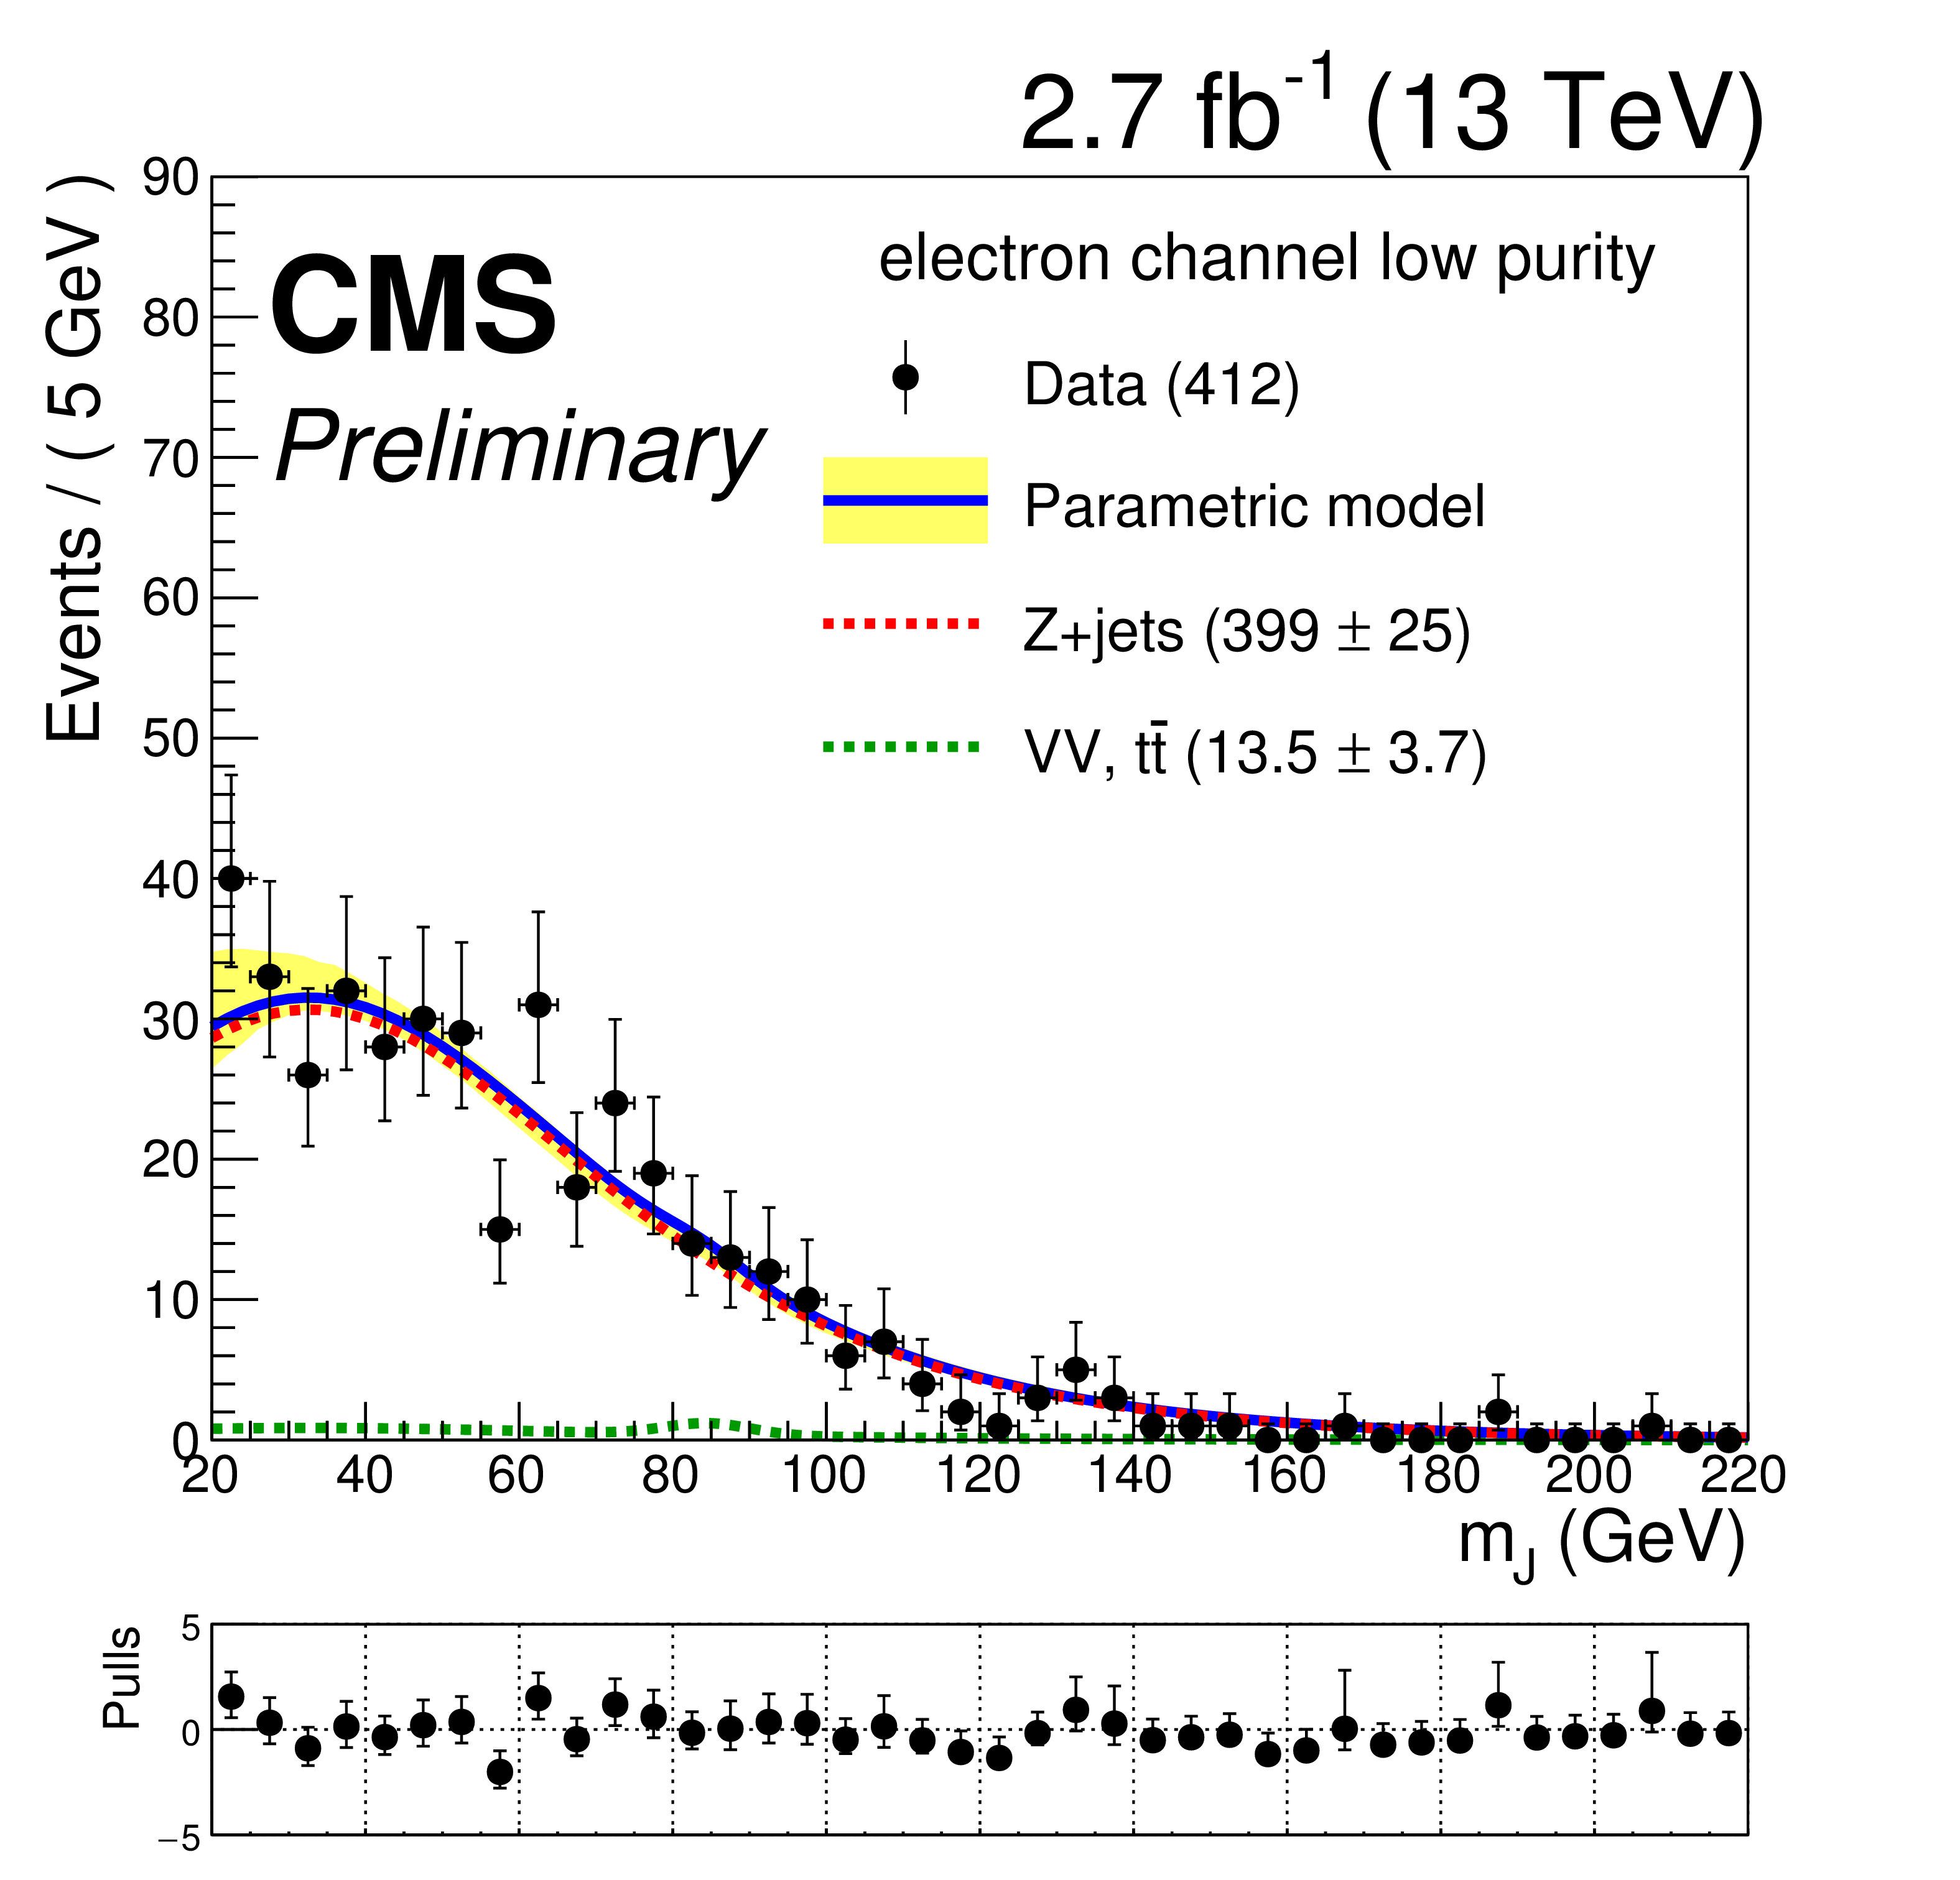
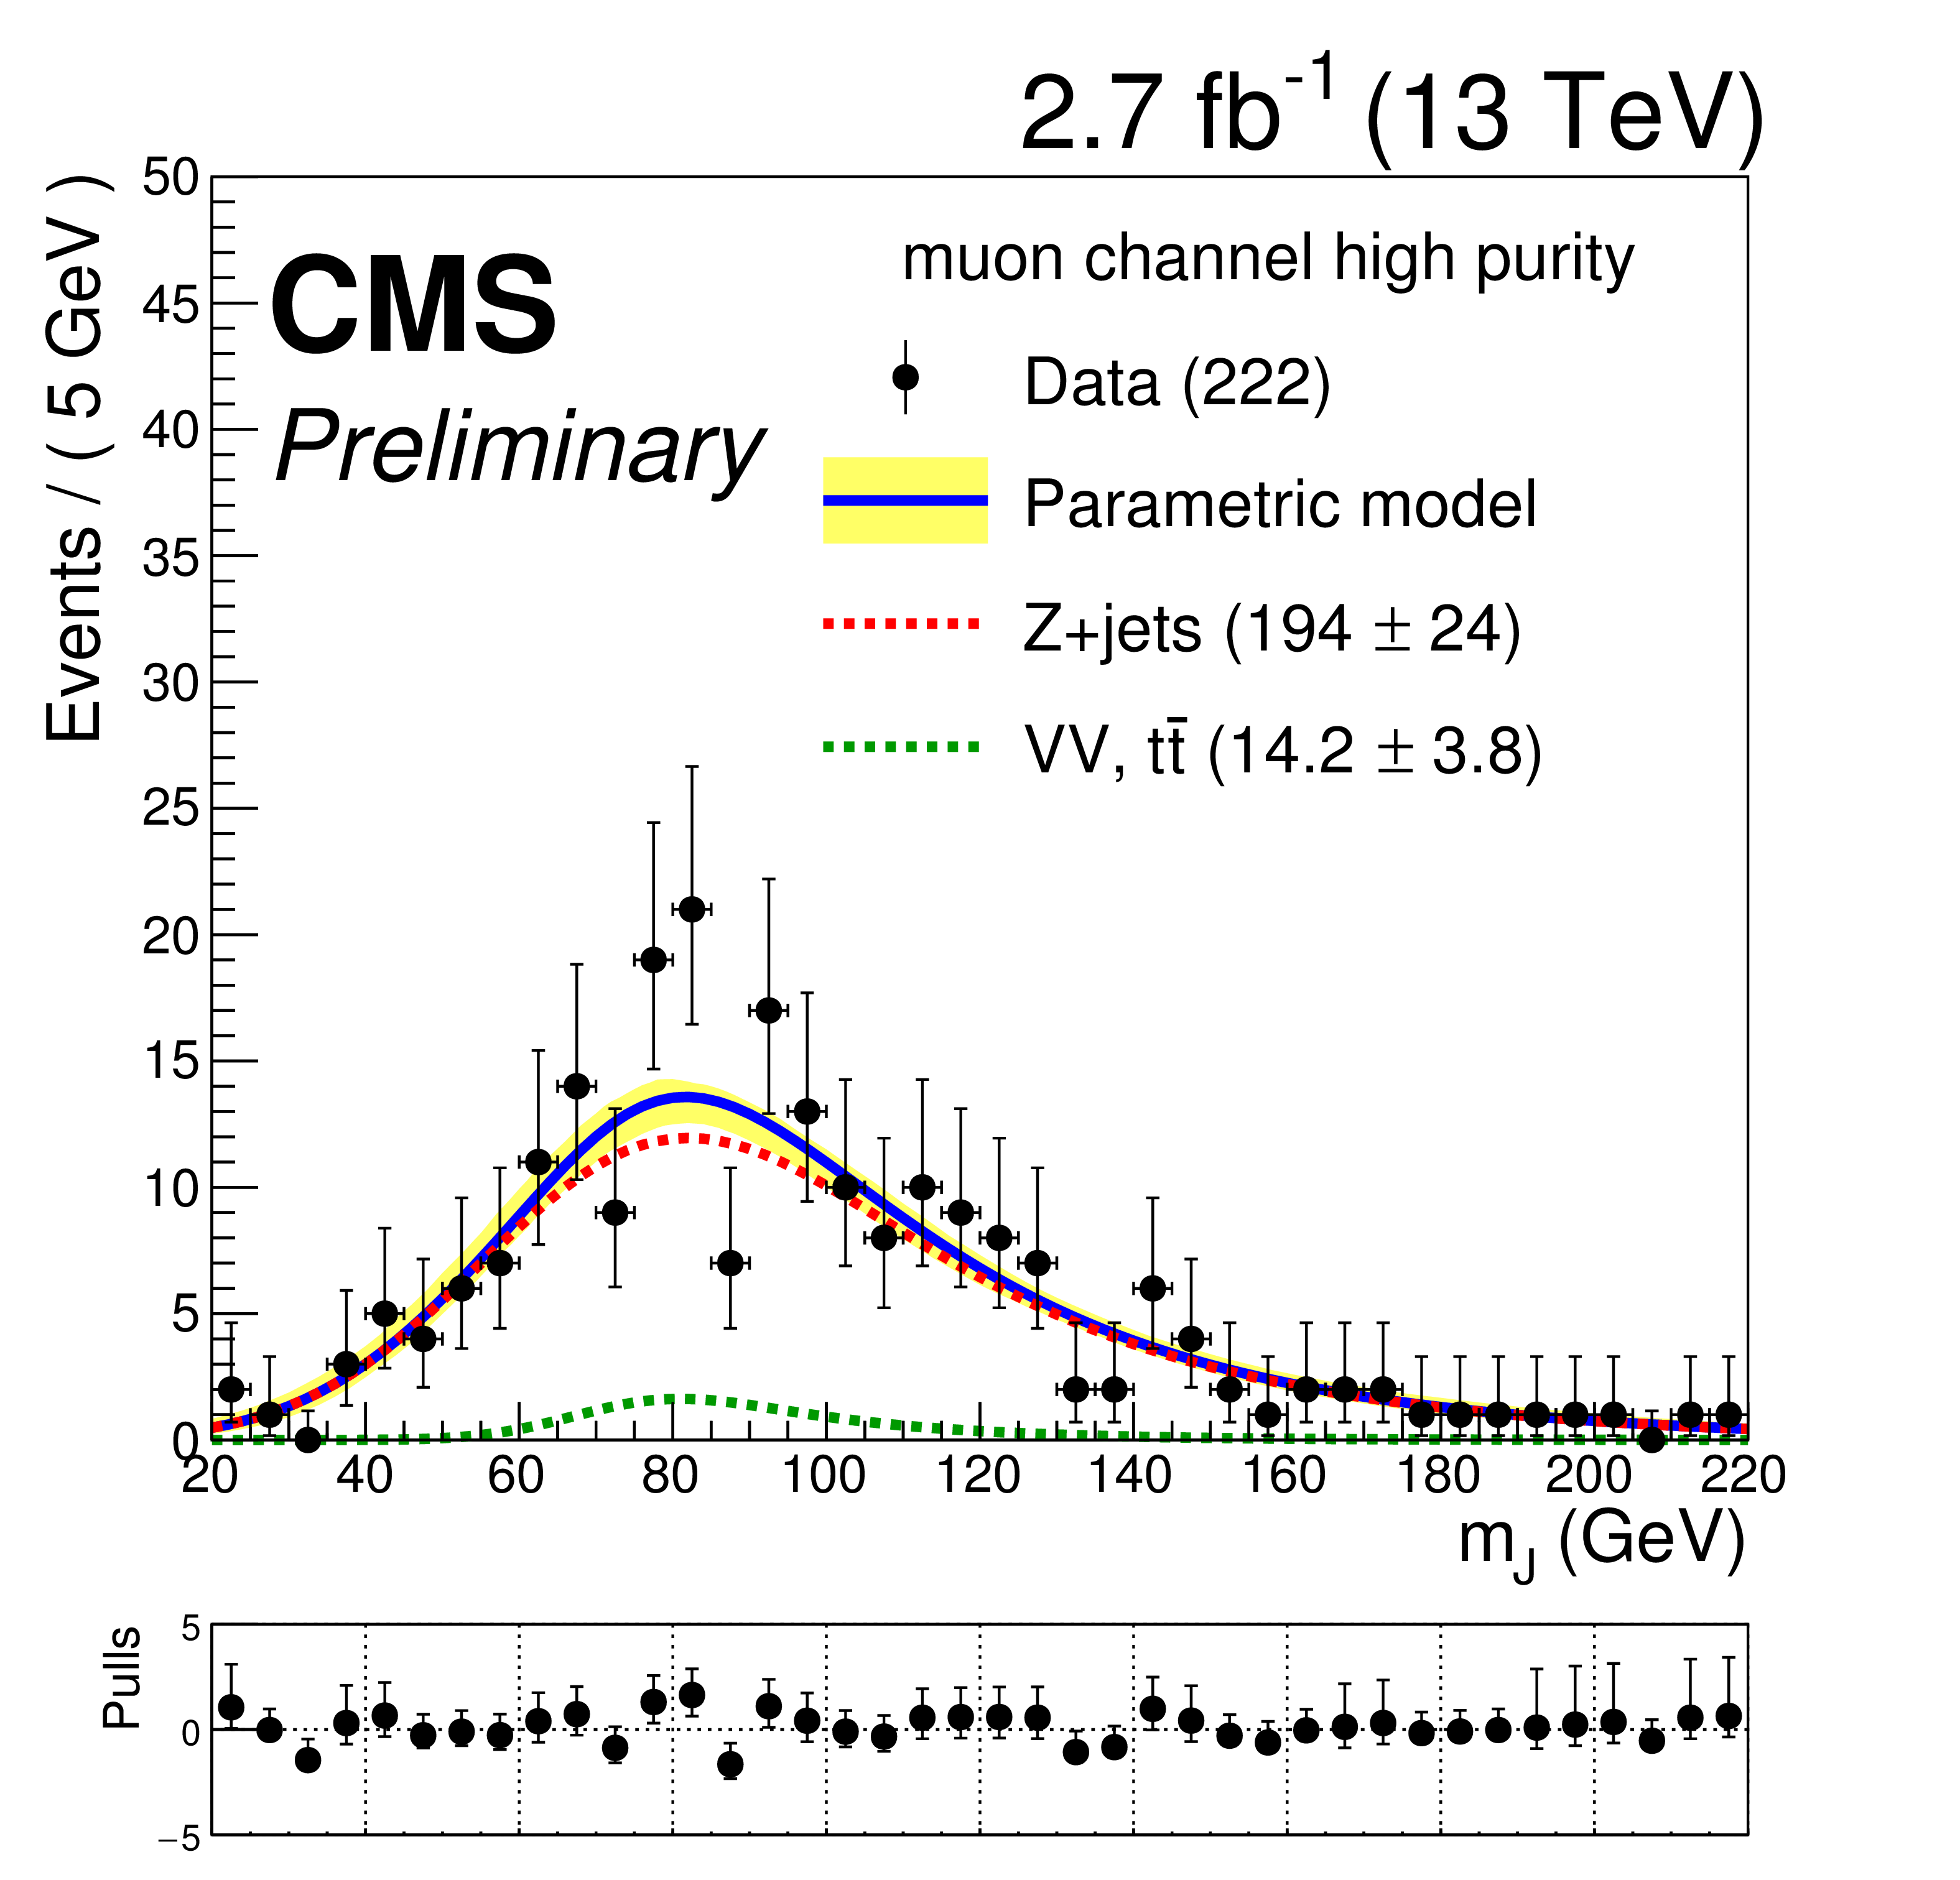
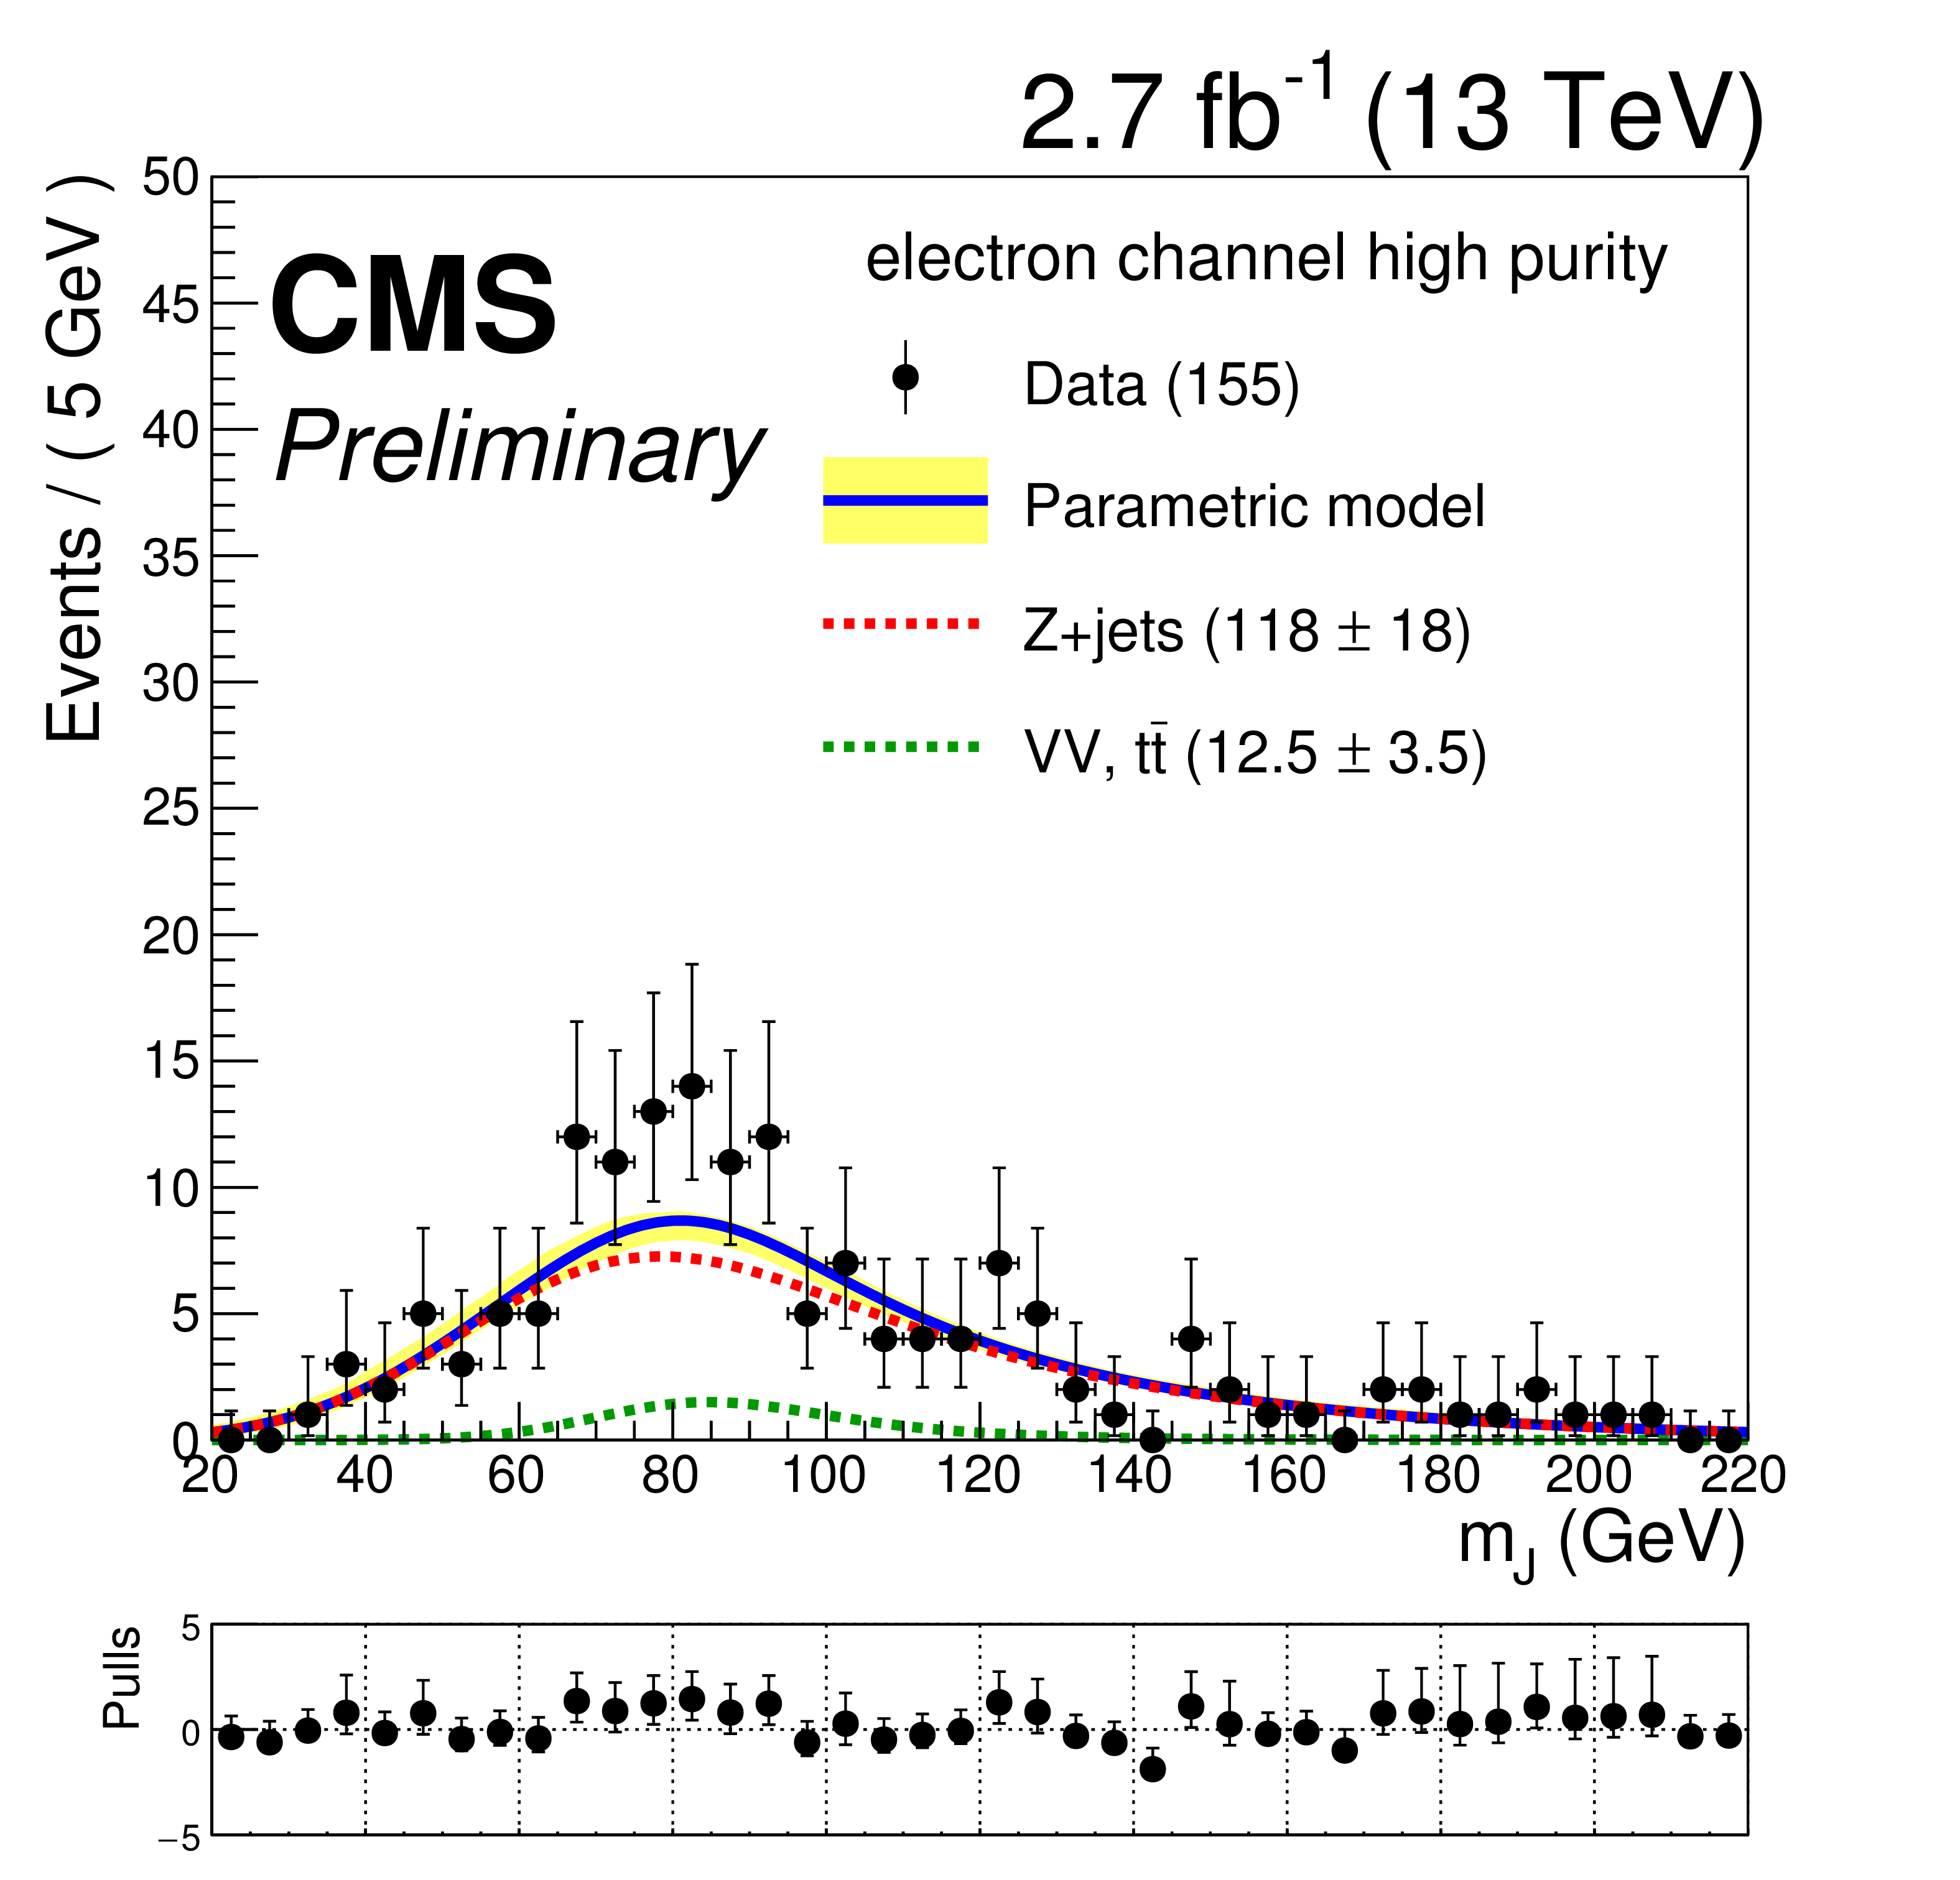
Pruned mass distribution in data and parametric model (blue line) for the high mass search. The dominant (red) and subdominant (green) components are also shown. The yield for each component in the full region (20 $ < {m_\mathrm {J}}< $ 220 GeV) is in the legend. |
png pdf |
Figure 8-b:
Pruned mass distribution in data and parametric model (blue line) for the high mass search. The dominant (red) and subdominant (green) components are also shown. The yield for each component in the full region (20 $ < {m_\mathrm {J}}< $ 220 GeV) is in the legend. |
png pdf |
Figure 8-c:
Pruned mass distribution in data and parametric model (blue line) for the high mass search. The dominant (red) and subdominant (green) components are also shown. The yield for each component in the full region (20 $ < {m_\mathrm {J}}< $ 220 GeV) is in the legend. |
png pdf |
Figure 8-d:
Pruned mass distribution in data and parametric model (blue line) for the high mass search. The dominant (red) and subdominant (green) components are also shown. The yield for each component in the full region (20 $ < {m_\mathrm {J}}< $ 220 GeV) is in the legend. |

png pdf |
Figure 9-a:
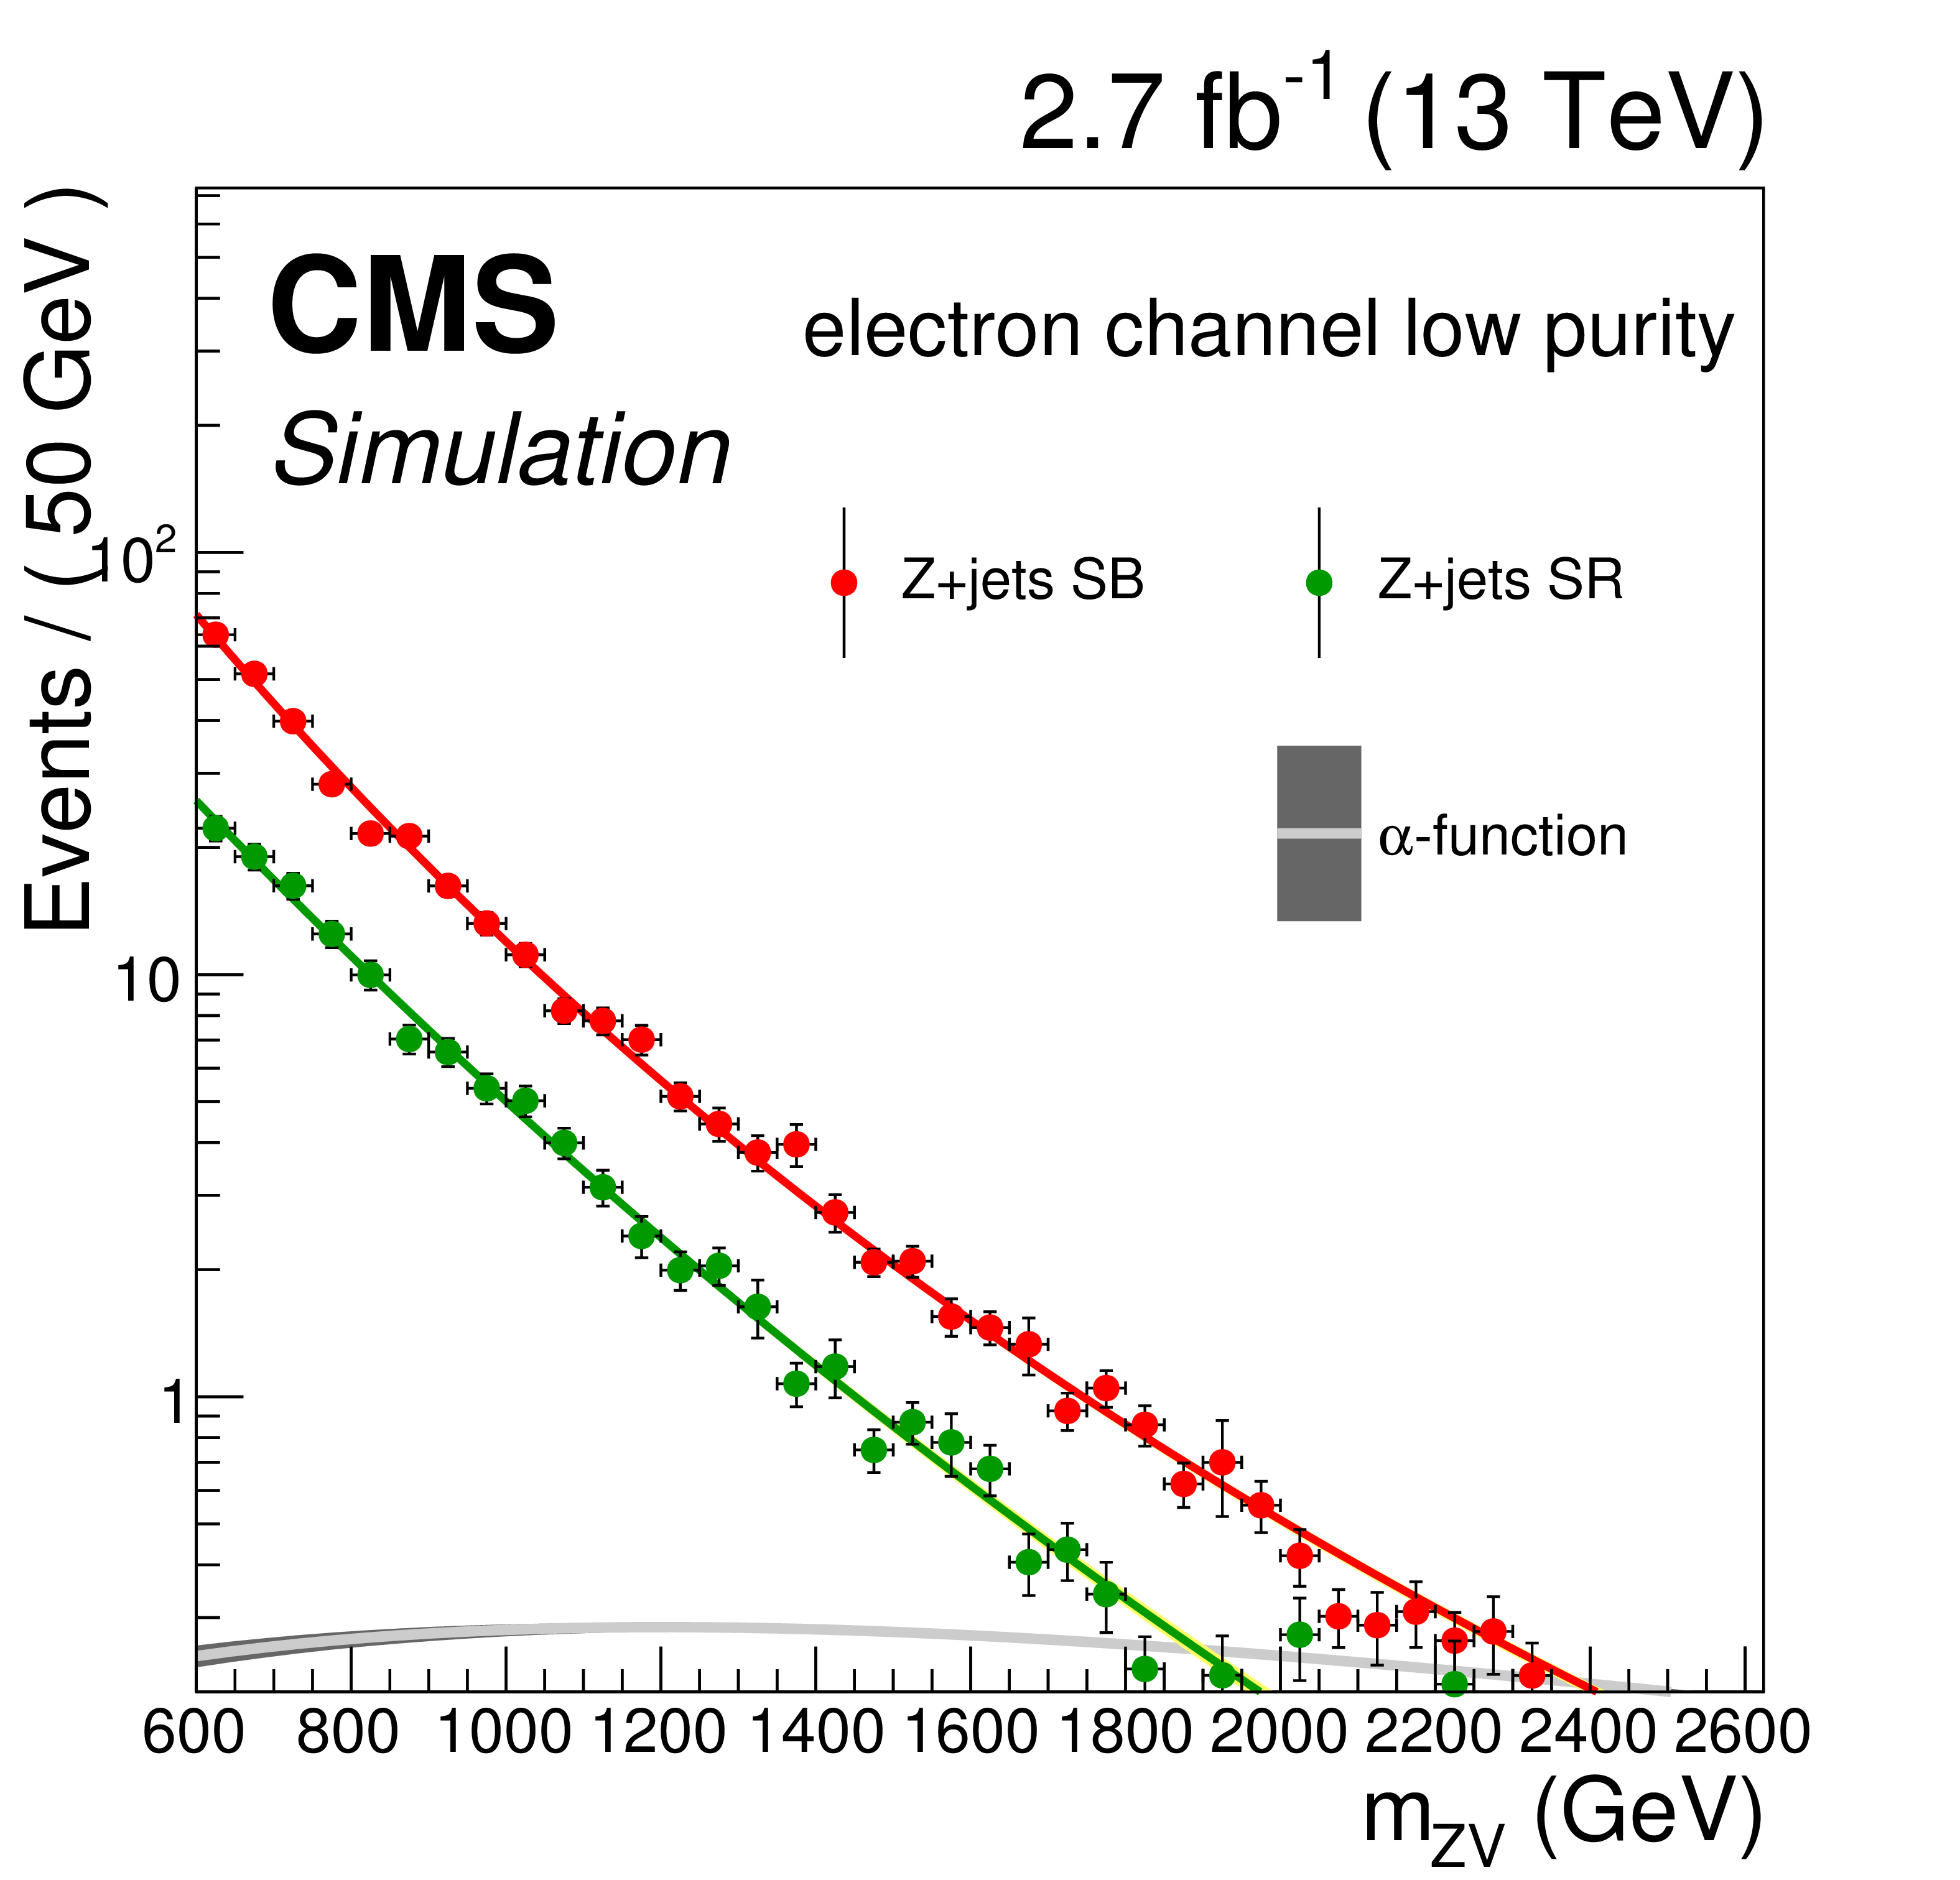
a,b: $ {m_\mathrm {ZV}}$ simulated distributions in the signal (green) and sideband (red) region for the low purity category of the high mass search, for muons (a) and electrons (b). c,d: $ {m_\mathrm {ZV}}$ simulated distributions in the signal (green) and sideband (red) region for the high purity category of the high mass search, for muons (c) and electrons (d). The transfer factor $\alpha ( {m_\mathrm {ZV}})$ is defined by the ratio (Z+jets SR) / (Z+jets SB). |
png pdf |
Figure 9-b:
a,b: $ {m_\mathrm {ZV}}$ simulated distributions in the signal (green) and sideband (red) region for the low purity category of the high mass search, for muons (a) and electrons (b). c,d: $ {m_\mathrm {ZV}}$ simulated distributions in the signal (green) and sideband (red) region for the high purity category of the high mass search, for muons (c) and electrons (d). The transfer factor $\alpha ( {m_\mathrm {ZV}})$ is defined by the ratio (Z+jets SR) / (Z+jets SB). |
png pdf |
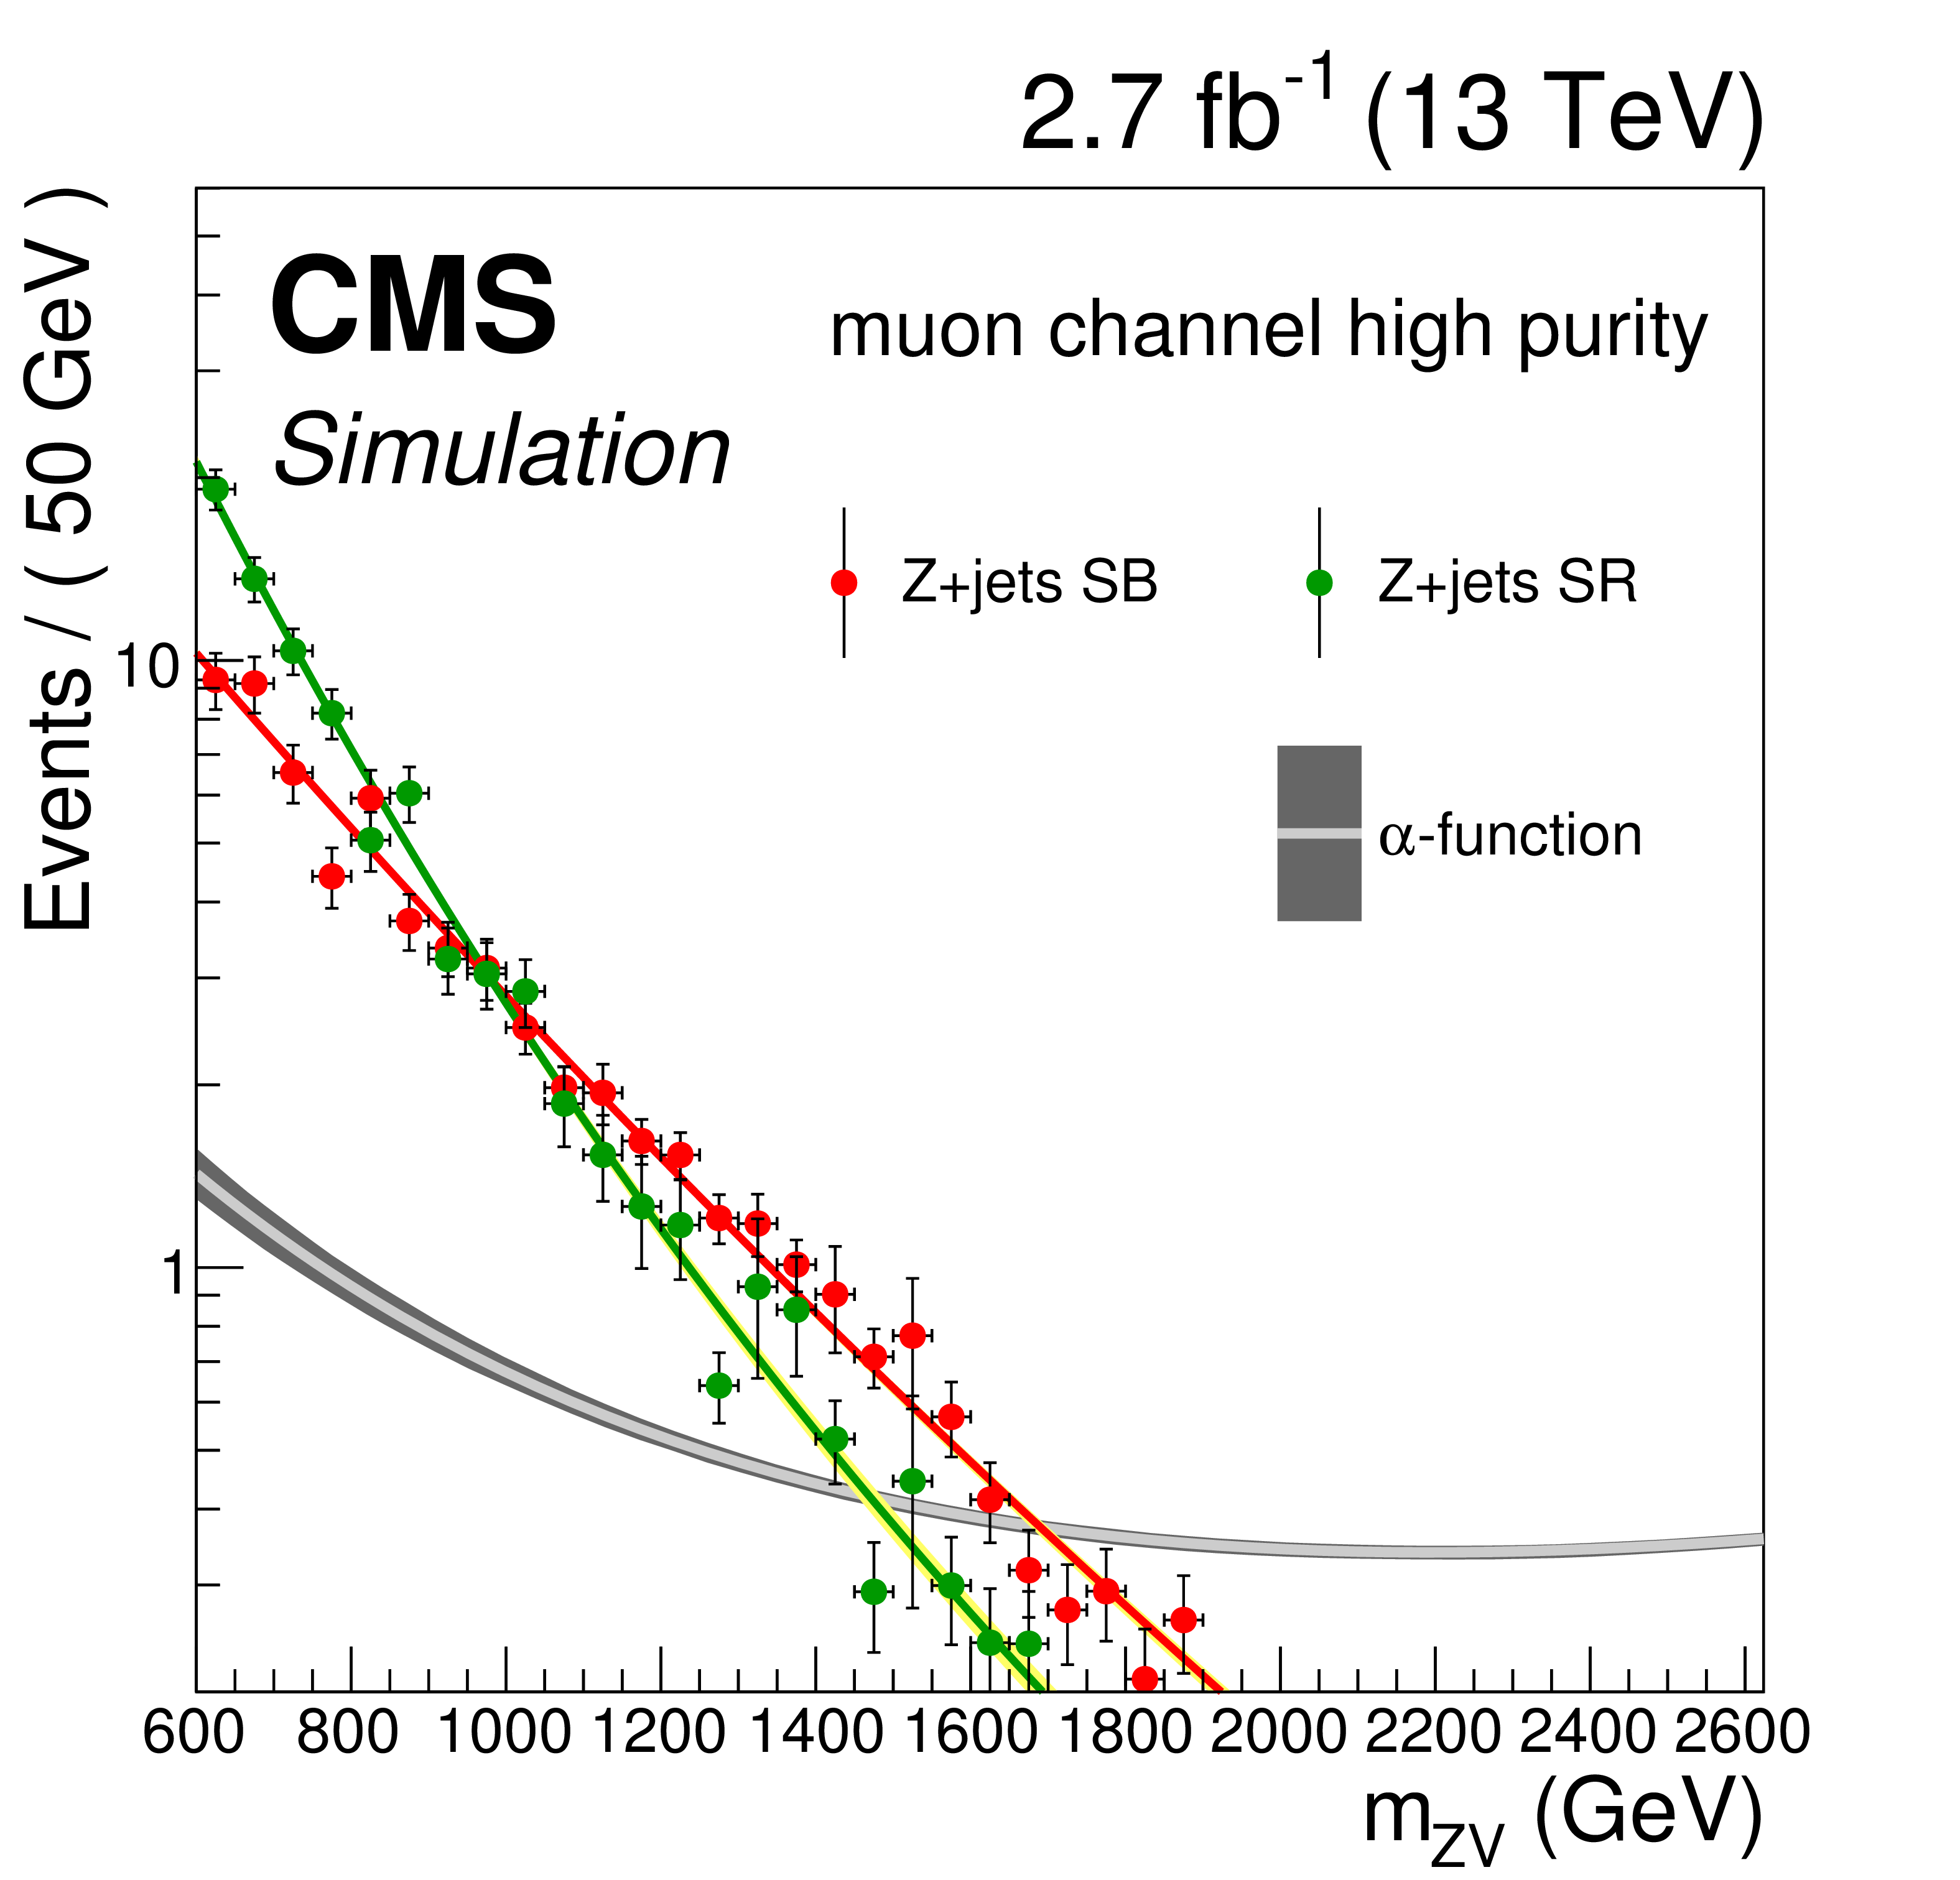
Figure 9-c:
a,b: $ {m_\mathrm {ZV}}$ simulated distributions in the signal (green) and sideband (red) region for the low purity category of the high mass search, for muons (a) and electrons (b). c,d: $ {m_\mathrm {ZV}}$ simulated distributions in the signal (green) and sideband (red) region for the high purity category of the high mass search, for muons (c) and electrons (d). The transfer factor $\alpha ( {m_\mathrm {ZV}})$ is defined by the ratio (Z+jets SR) / (Z+jets SB). |

png pdf |
Figure 9-d:
a,b: $ {m_\mathrm {ZV}}$ simulated distributions in the signal (green) and sideband (red) region for the low purity category of the high mass search, for muons (a) and electrons (b). c,d: $ {m_\mathrm {ZV}}$ simulated distributions in the signal (green) and sideband (red) region for the high purity category of the high mass search, for muons (c) and electrons (d). The transfer factor $\alpha ( {m_\mathrm {ZV}})$ is defined by the ratio (Z+jets SR) / (Z+jets SB). |
png pdf |
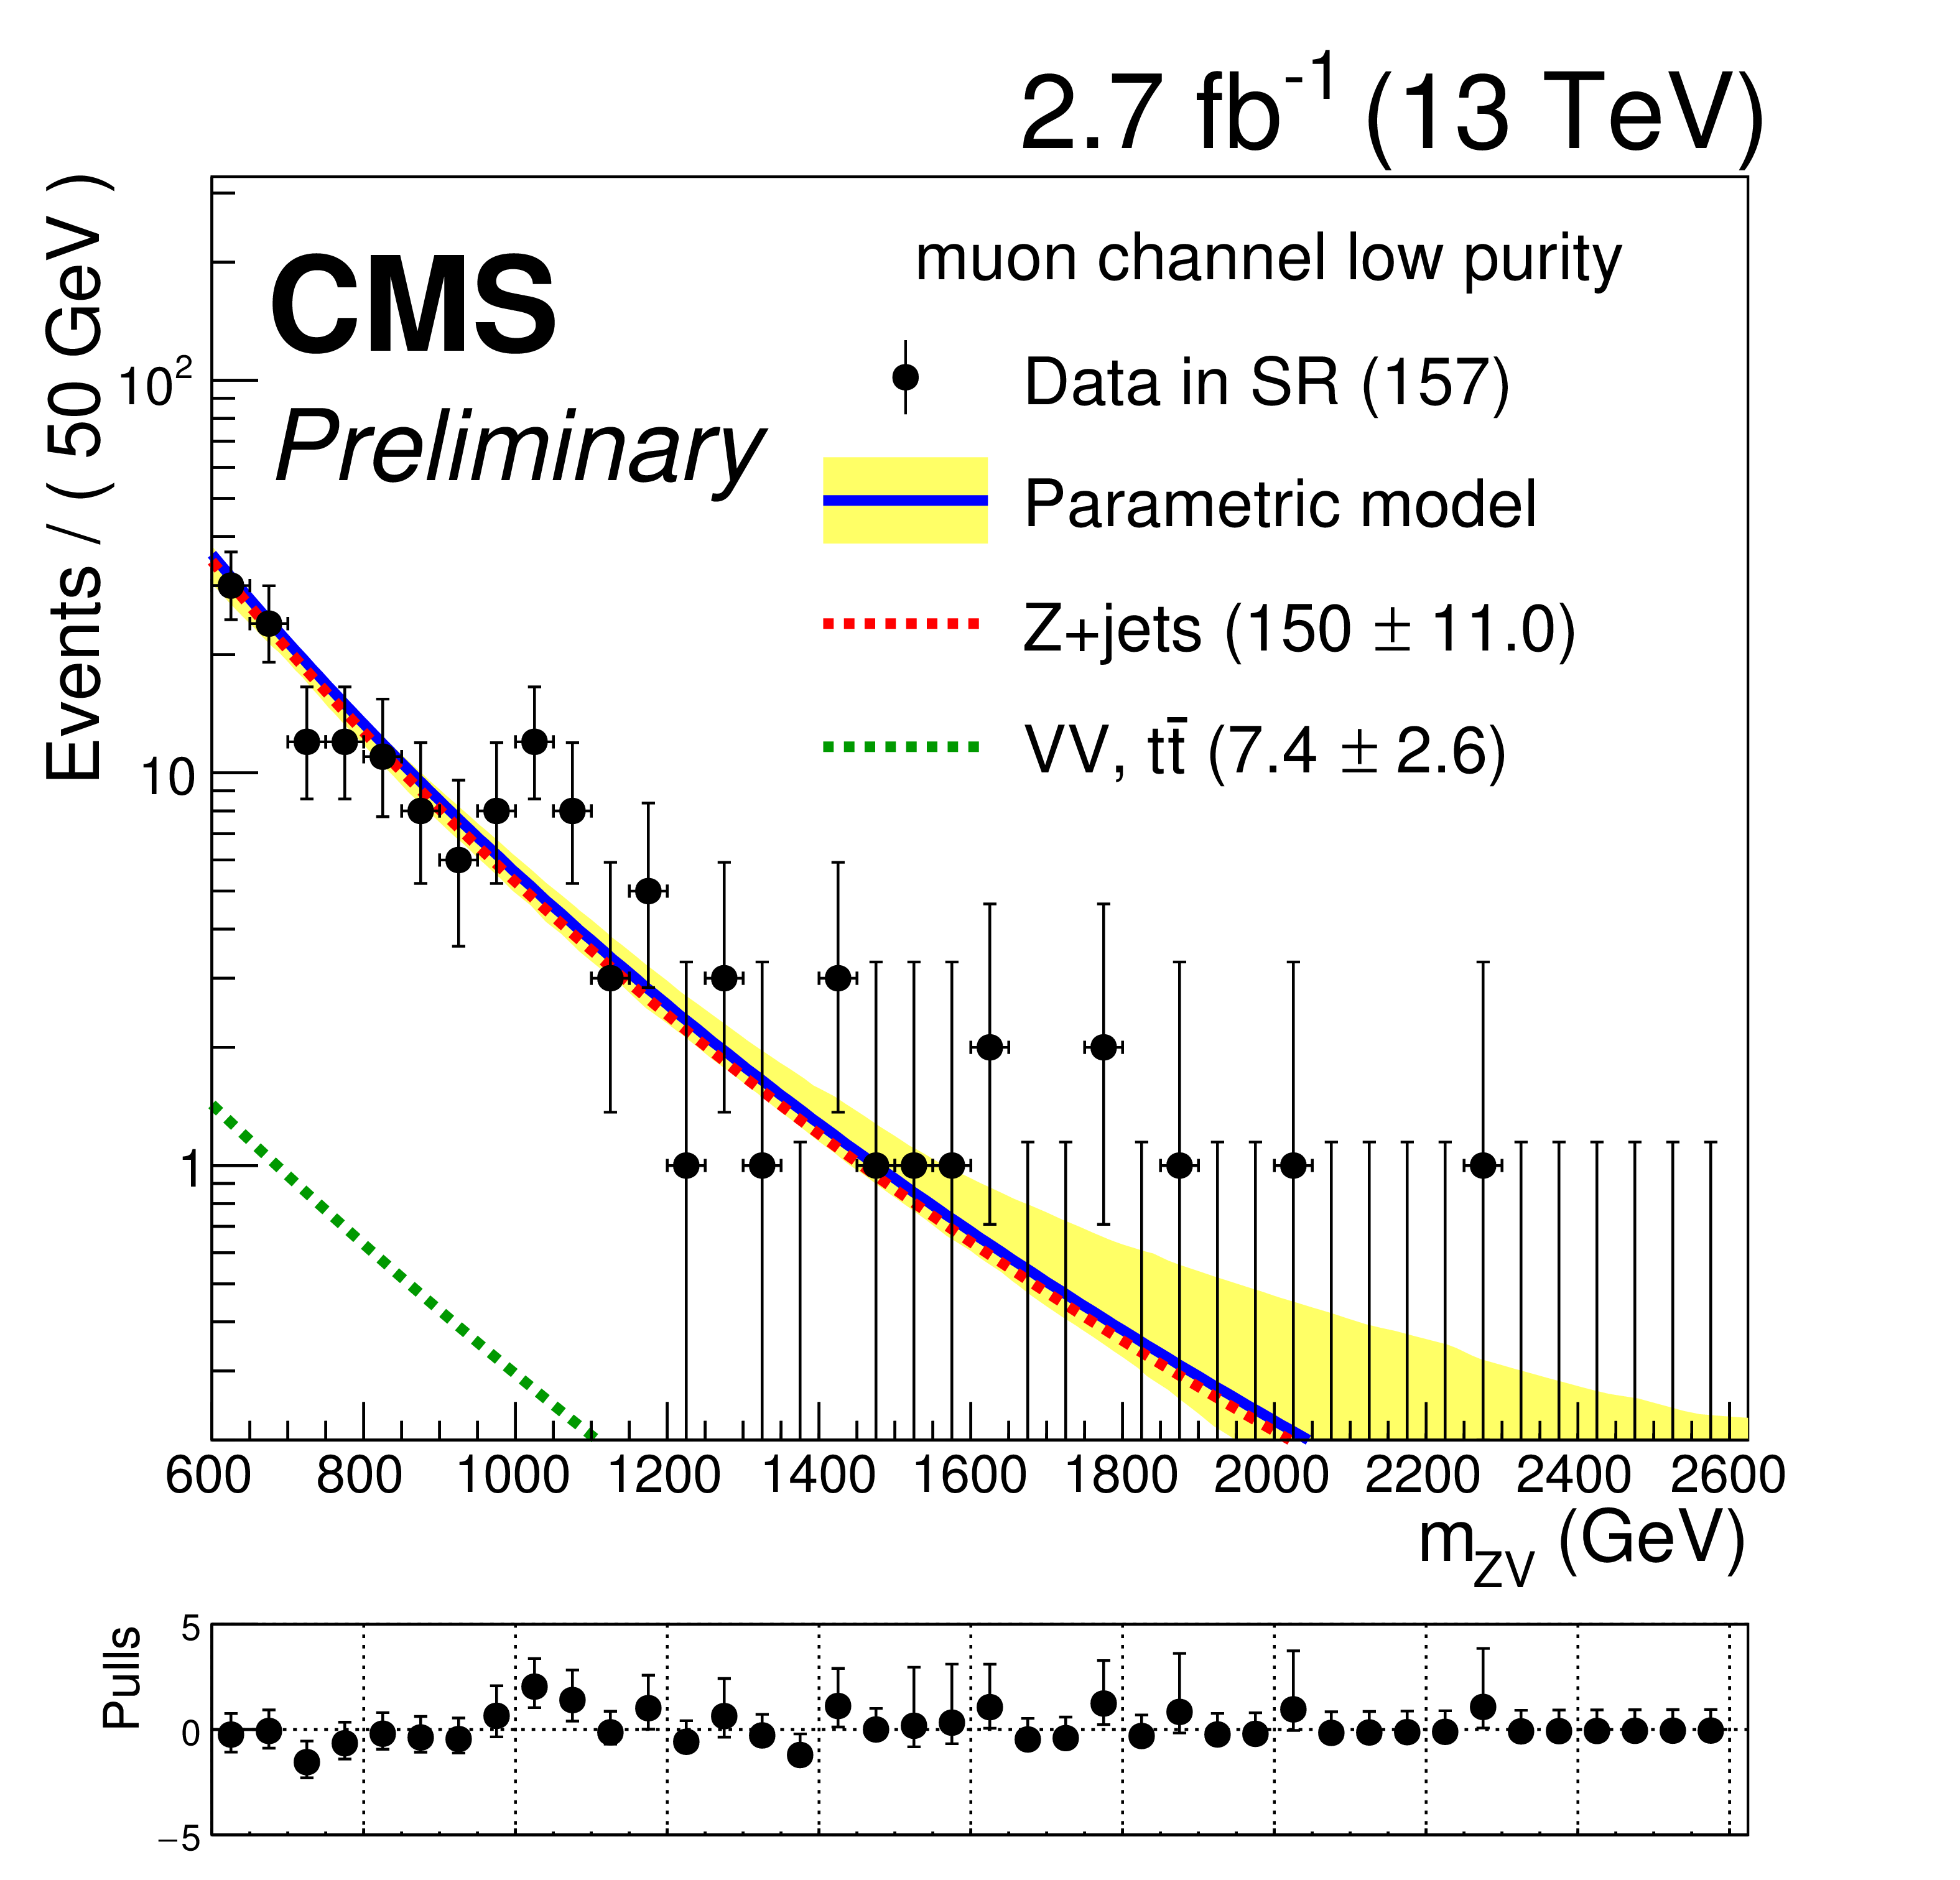
Figure 10-a:
a,b: $ {m_\mathrm {ZV}}$ distributions in the signal region for the low purity category of the high mass search, for muons (a) and electrons (b). c,d: $ {m_\mathrm {ZV}}$ distributions in the signal region for the high purity category of the high mass search, for muons (c) and electrons (d). |

png pdf |
Figure 10-b:
a,b: $ {m_\mathrm {ZV}}$ distributions in the signal region for the low purity category of the high mass search, for muons (a) and electrons (b). c,d: $ {m_\mathrm {ZV}}$ distributions in the signal region for the high purity category of the high mass search, for muons (c) and electrons (d). |

png pdf |
Figure 10-c:
a,b: $ {m_\mathrm {ZV}}$ distributions in the signal region for the low purity category of the high mass search, for muons (a) and electrons (b). c,d: $ {m_\mathrm {ZV}}$ distributions in the signal region for the high purity category of the high mass search, for muons (c) and electrons (d). |
png pdf |
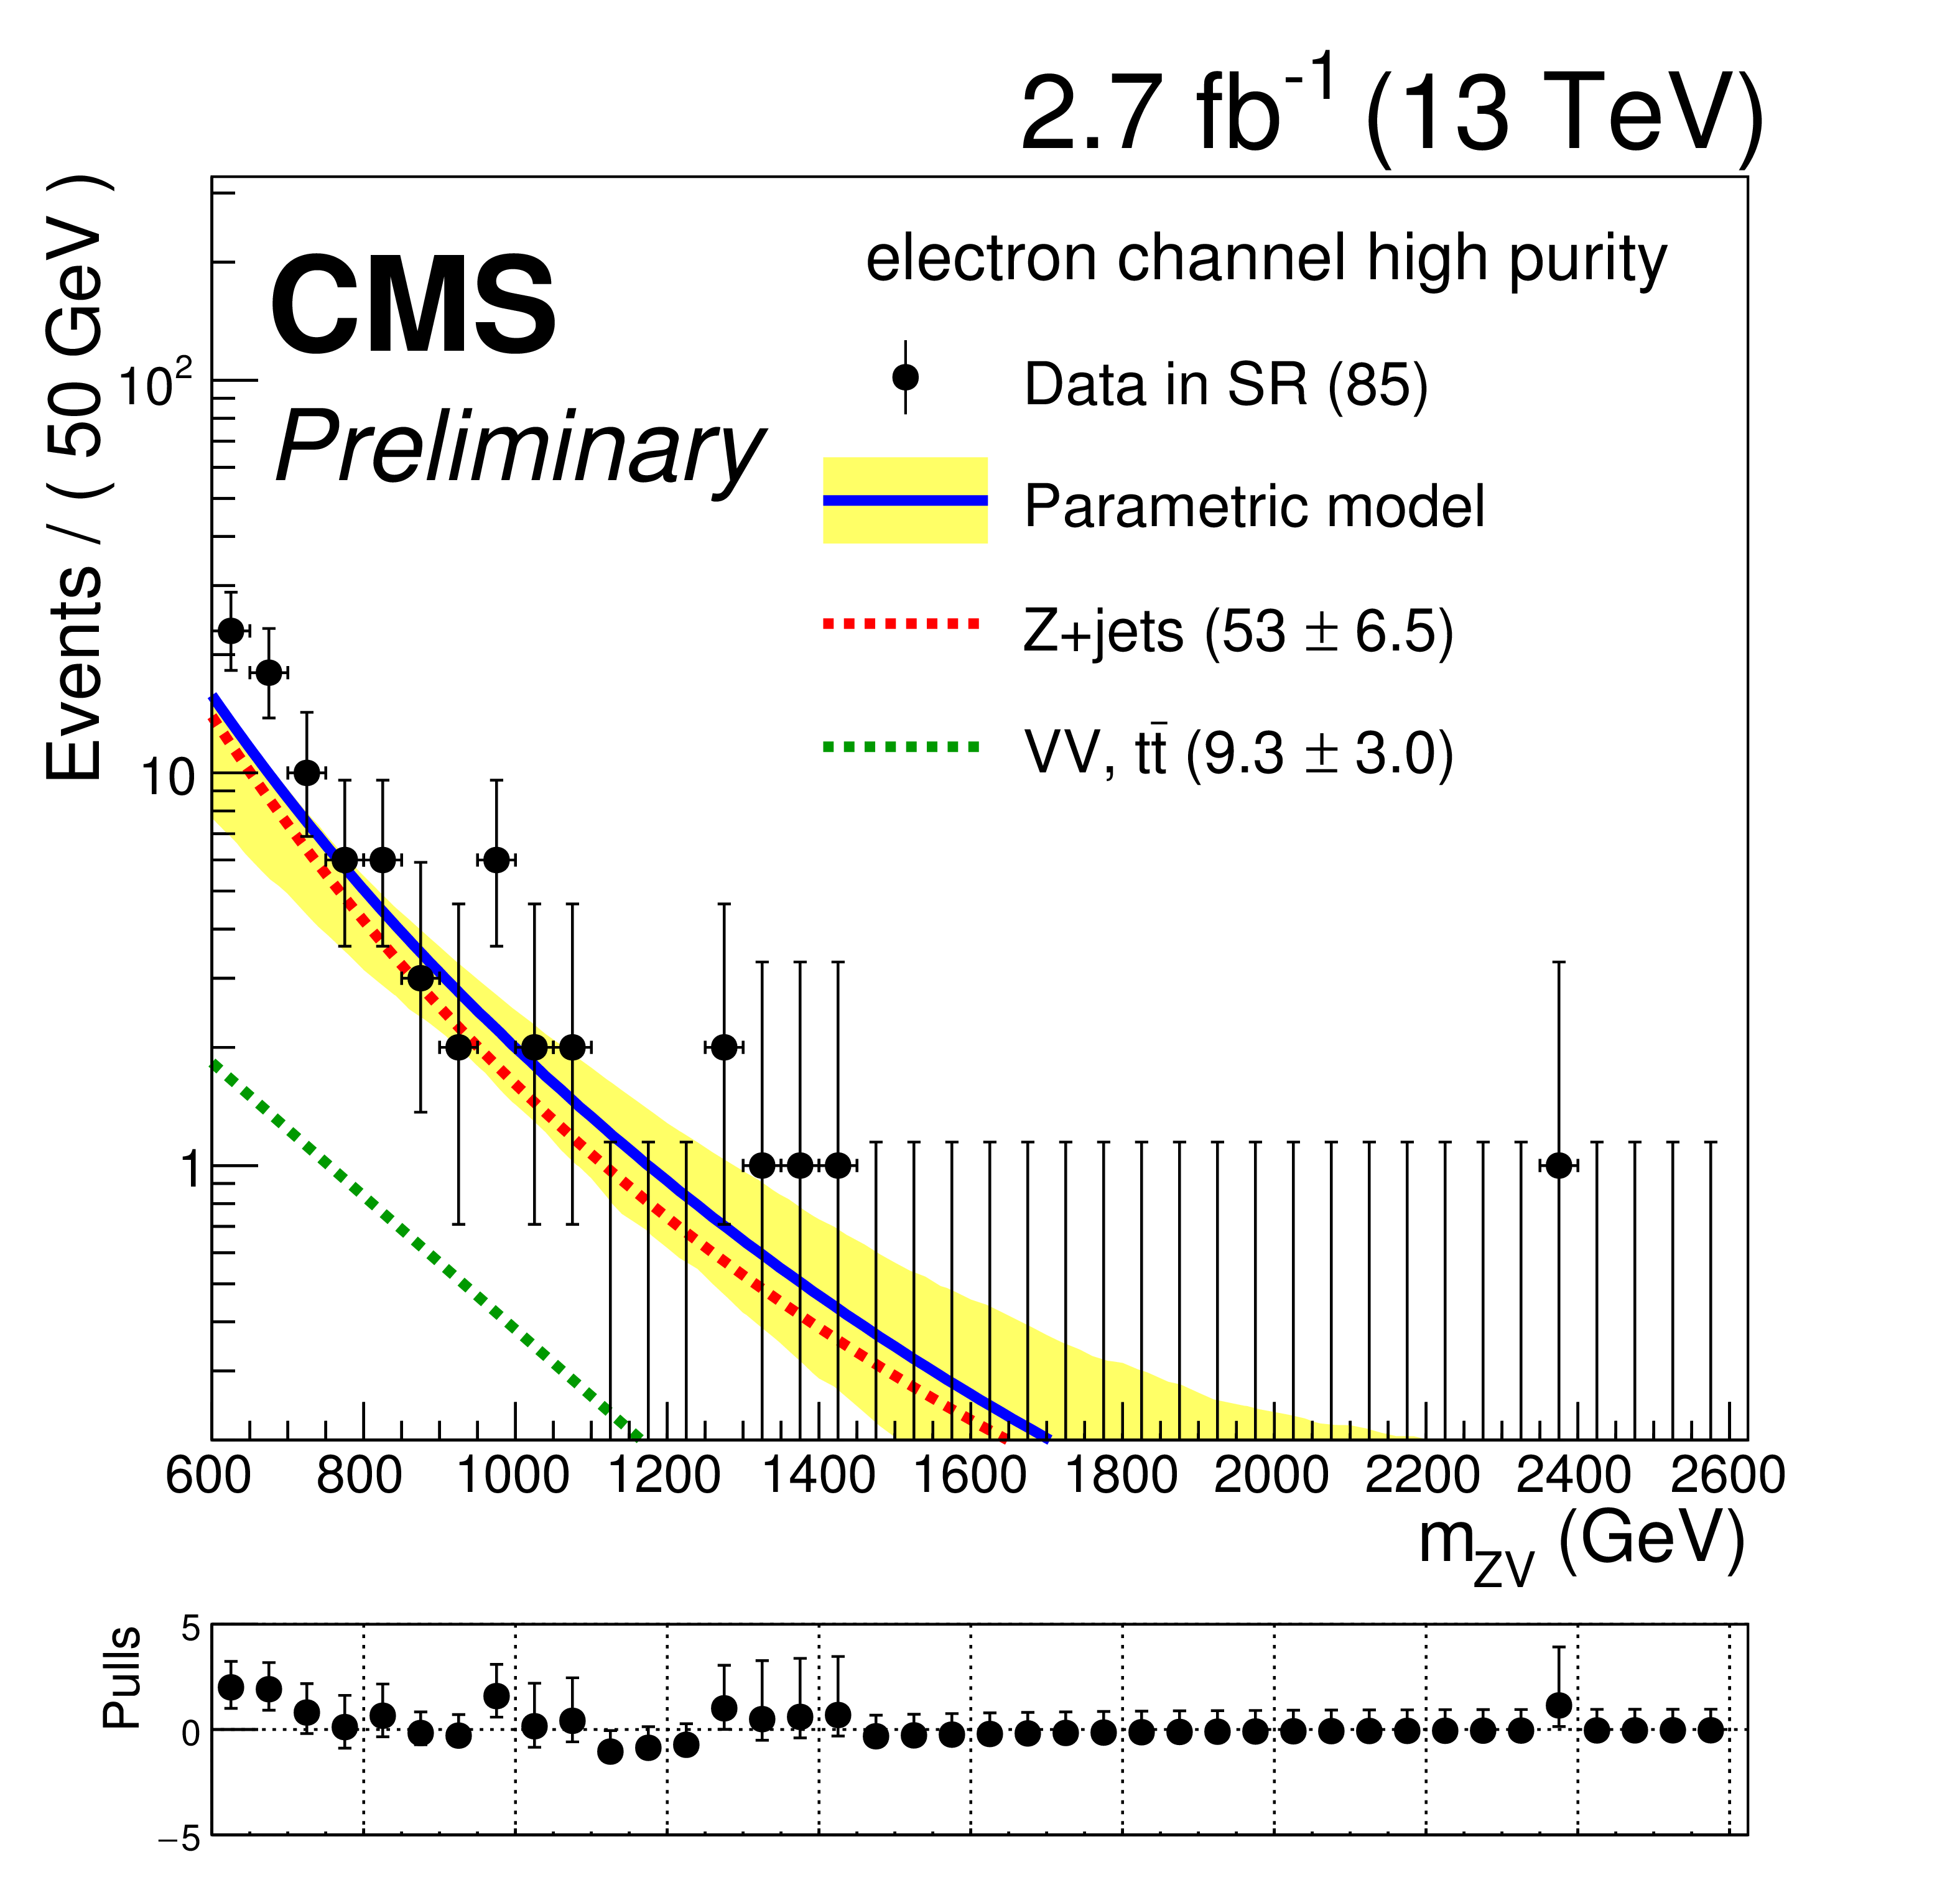
Figure 10-d:
a,b: $ {m_\mathrm {ZV}}$ distributions in the signal region for the low purity category of the high mass search, for muons (a) and electrons (b). c,d: $ {m_\mathrm {ZV}}$ distributions in the signal region for the high purity category of the high mass search, for muons (c) and electrons (d). |
png pdf |
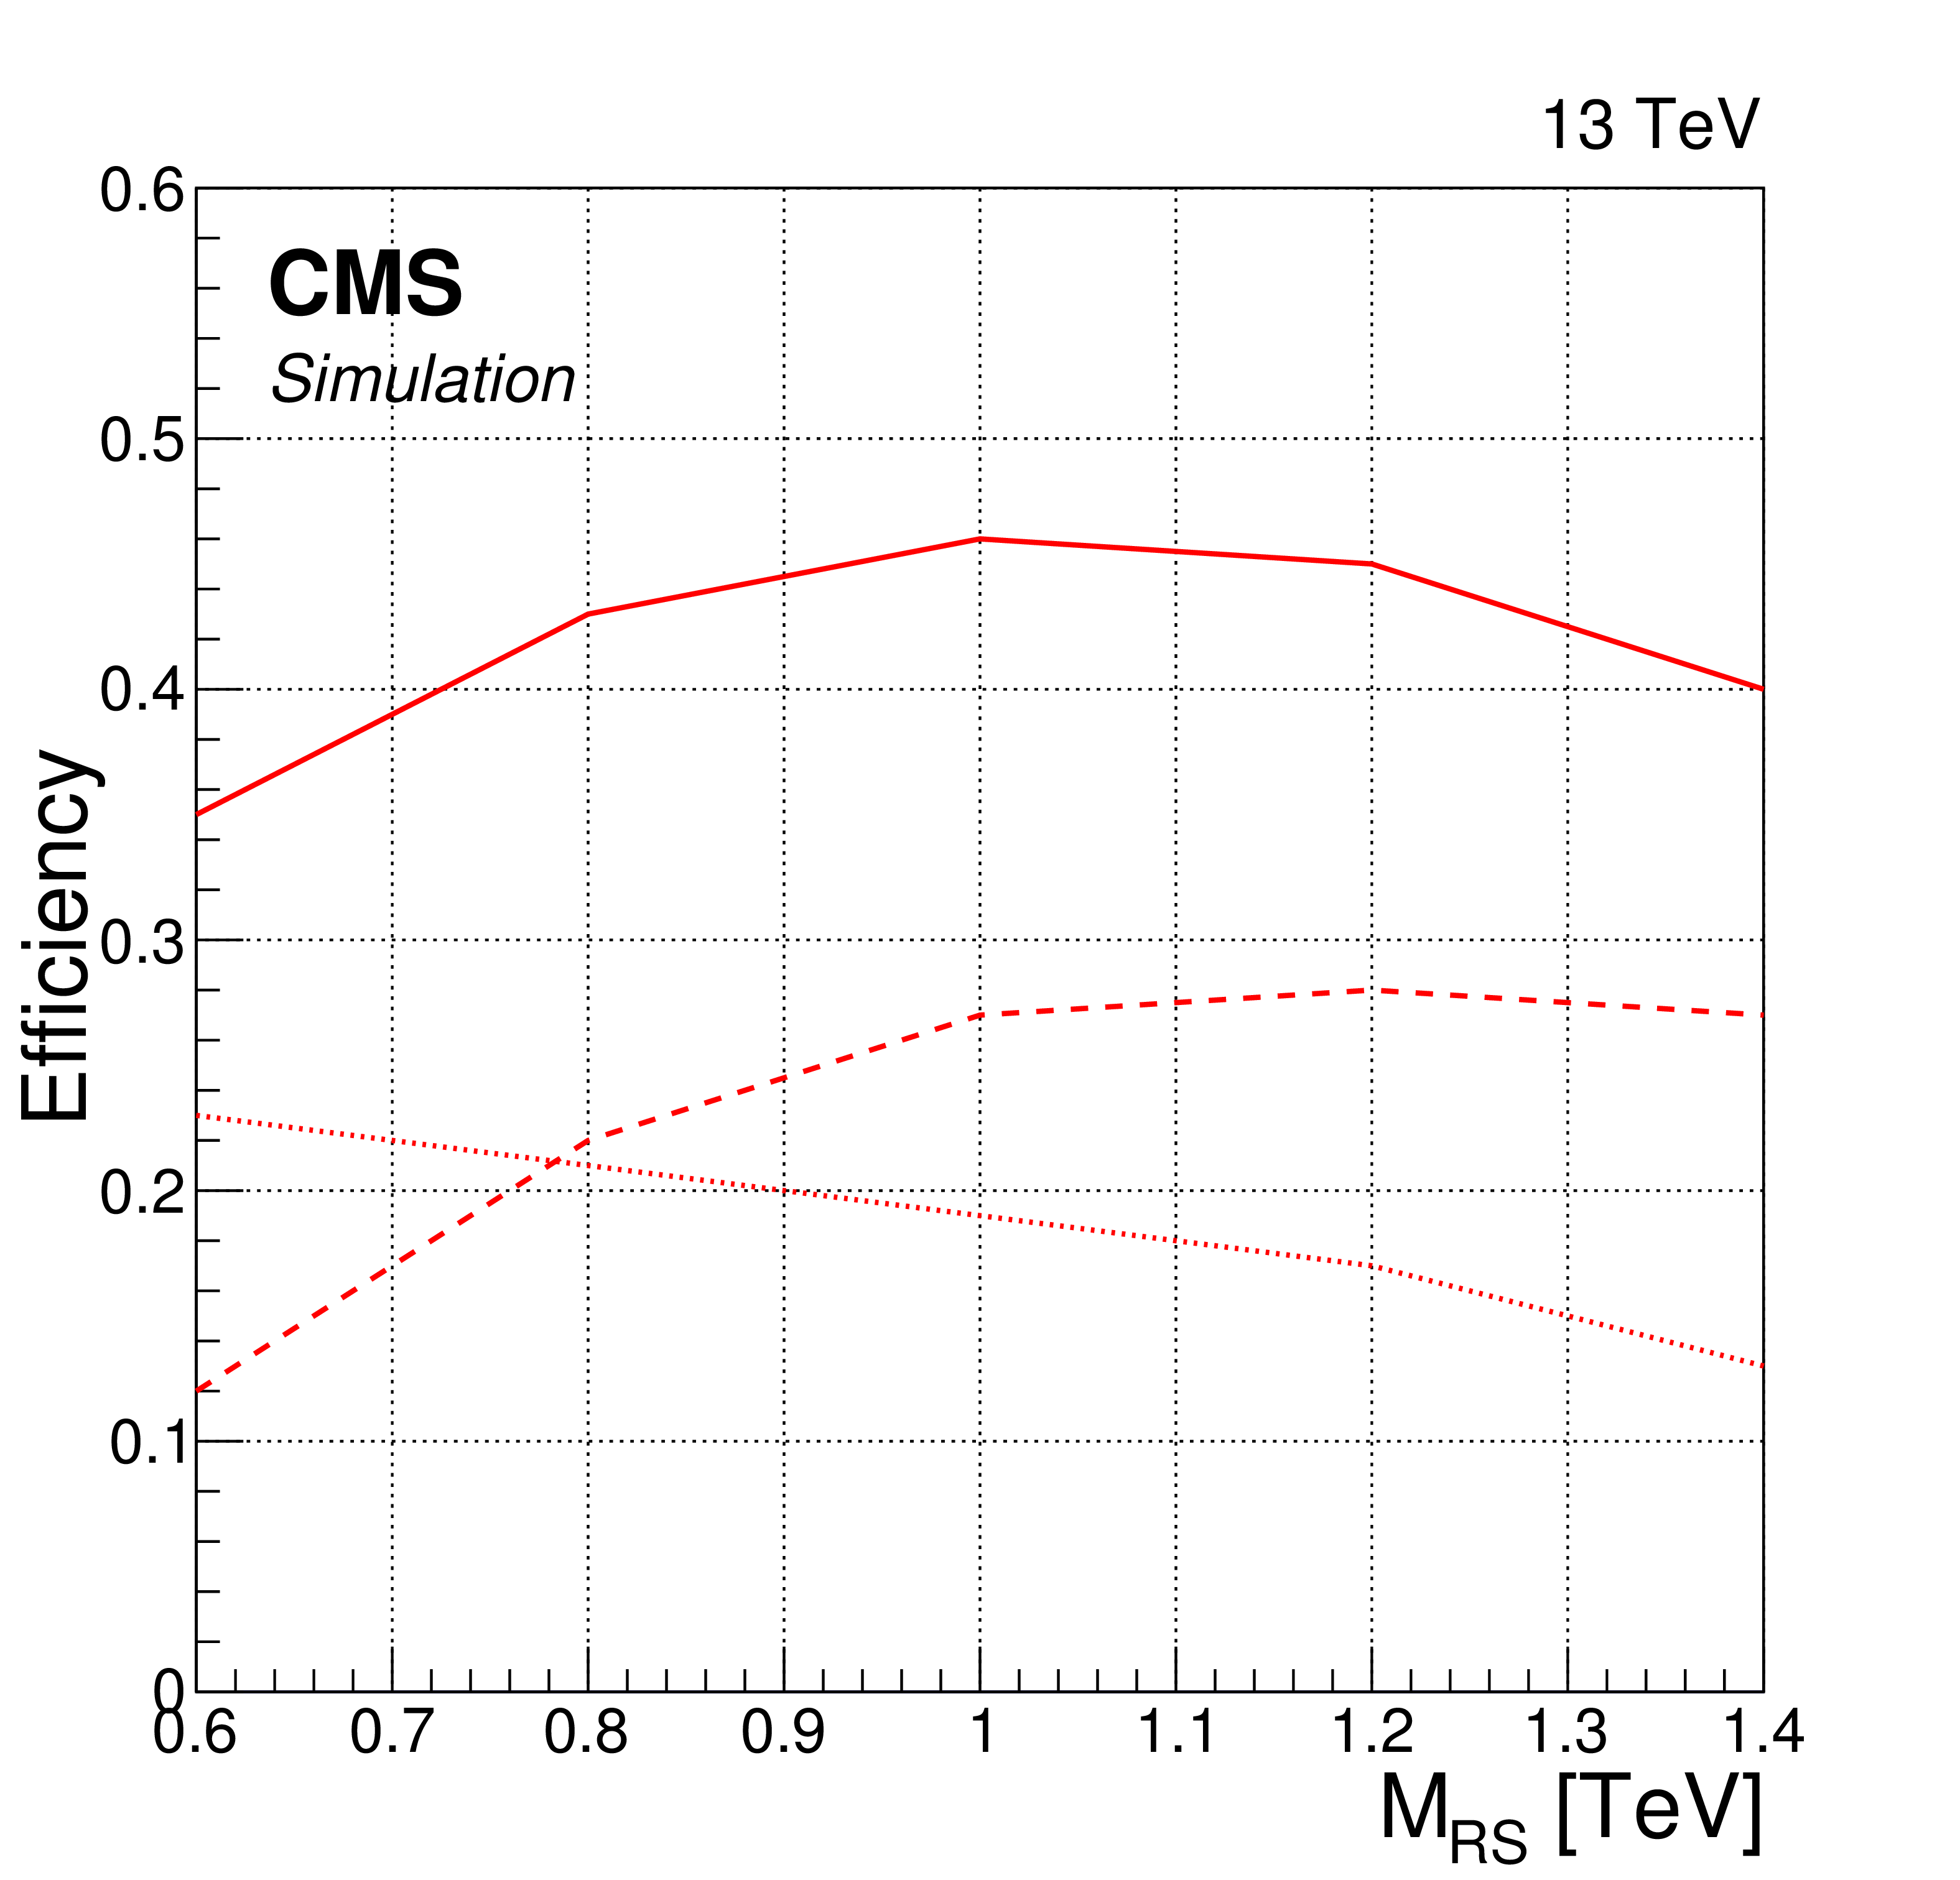
Figure 11-a:
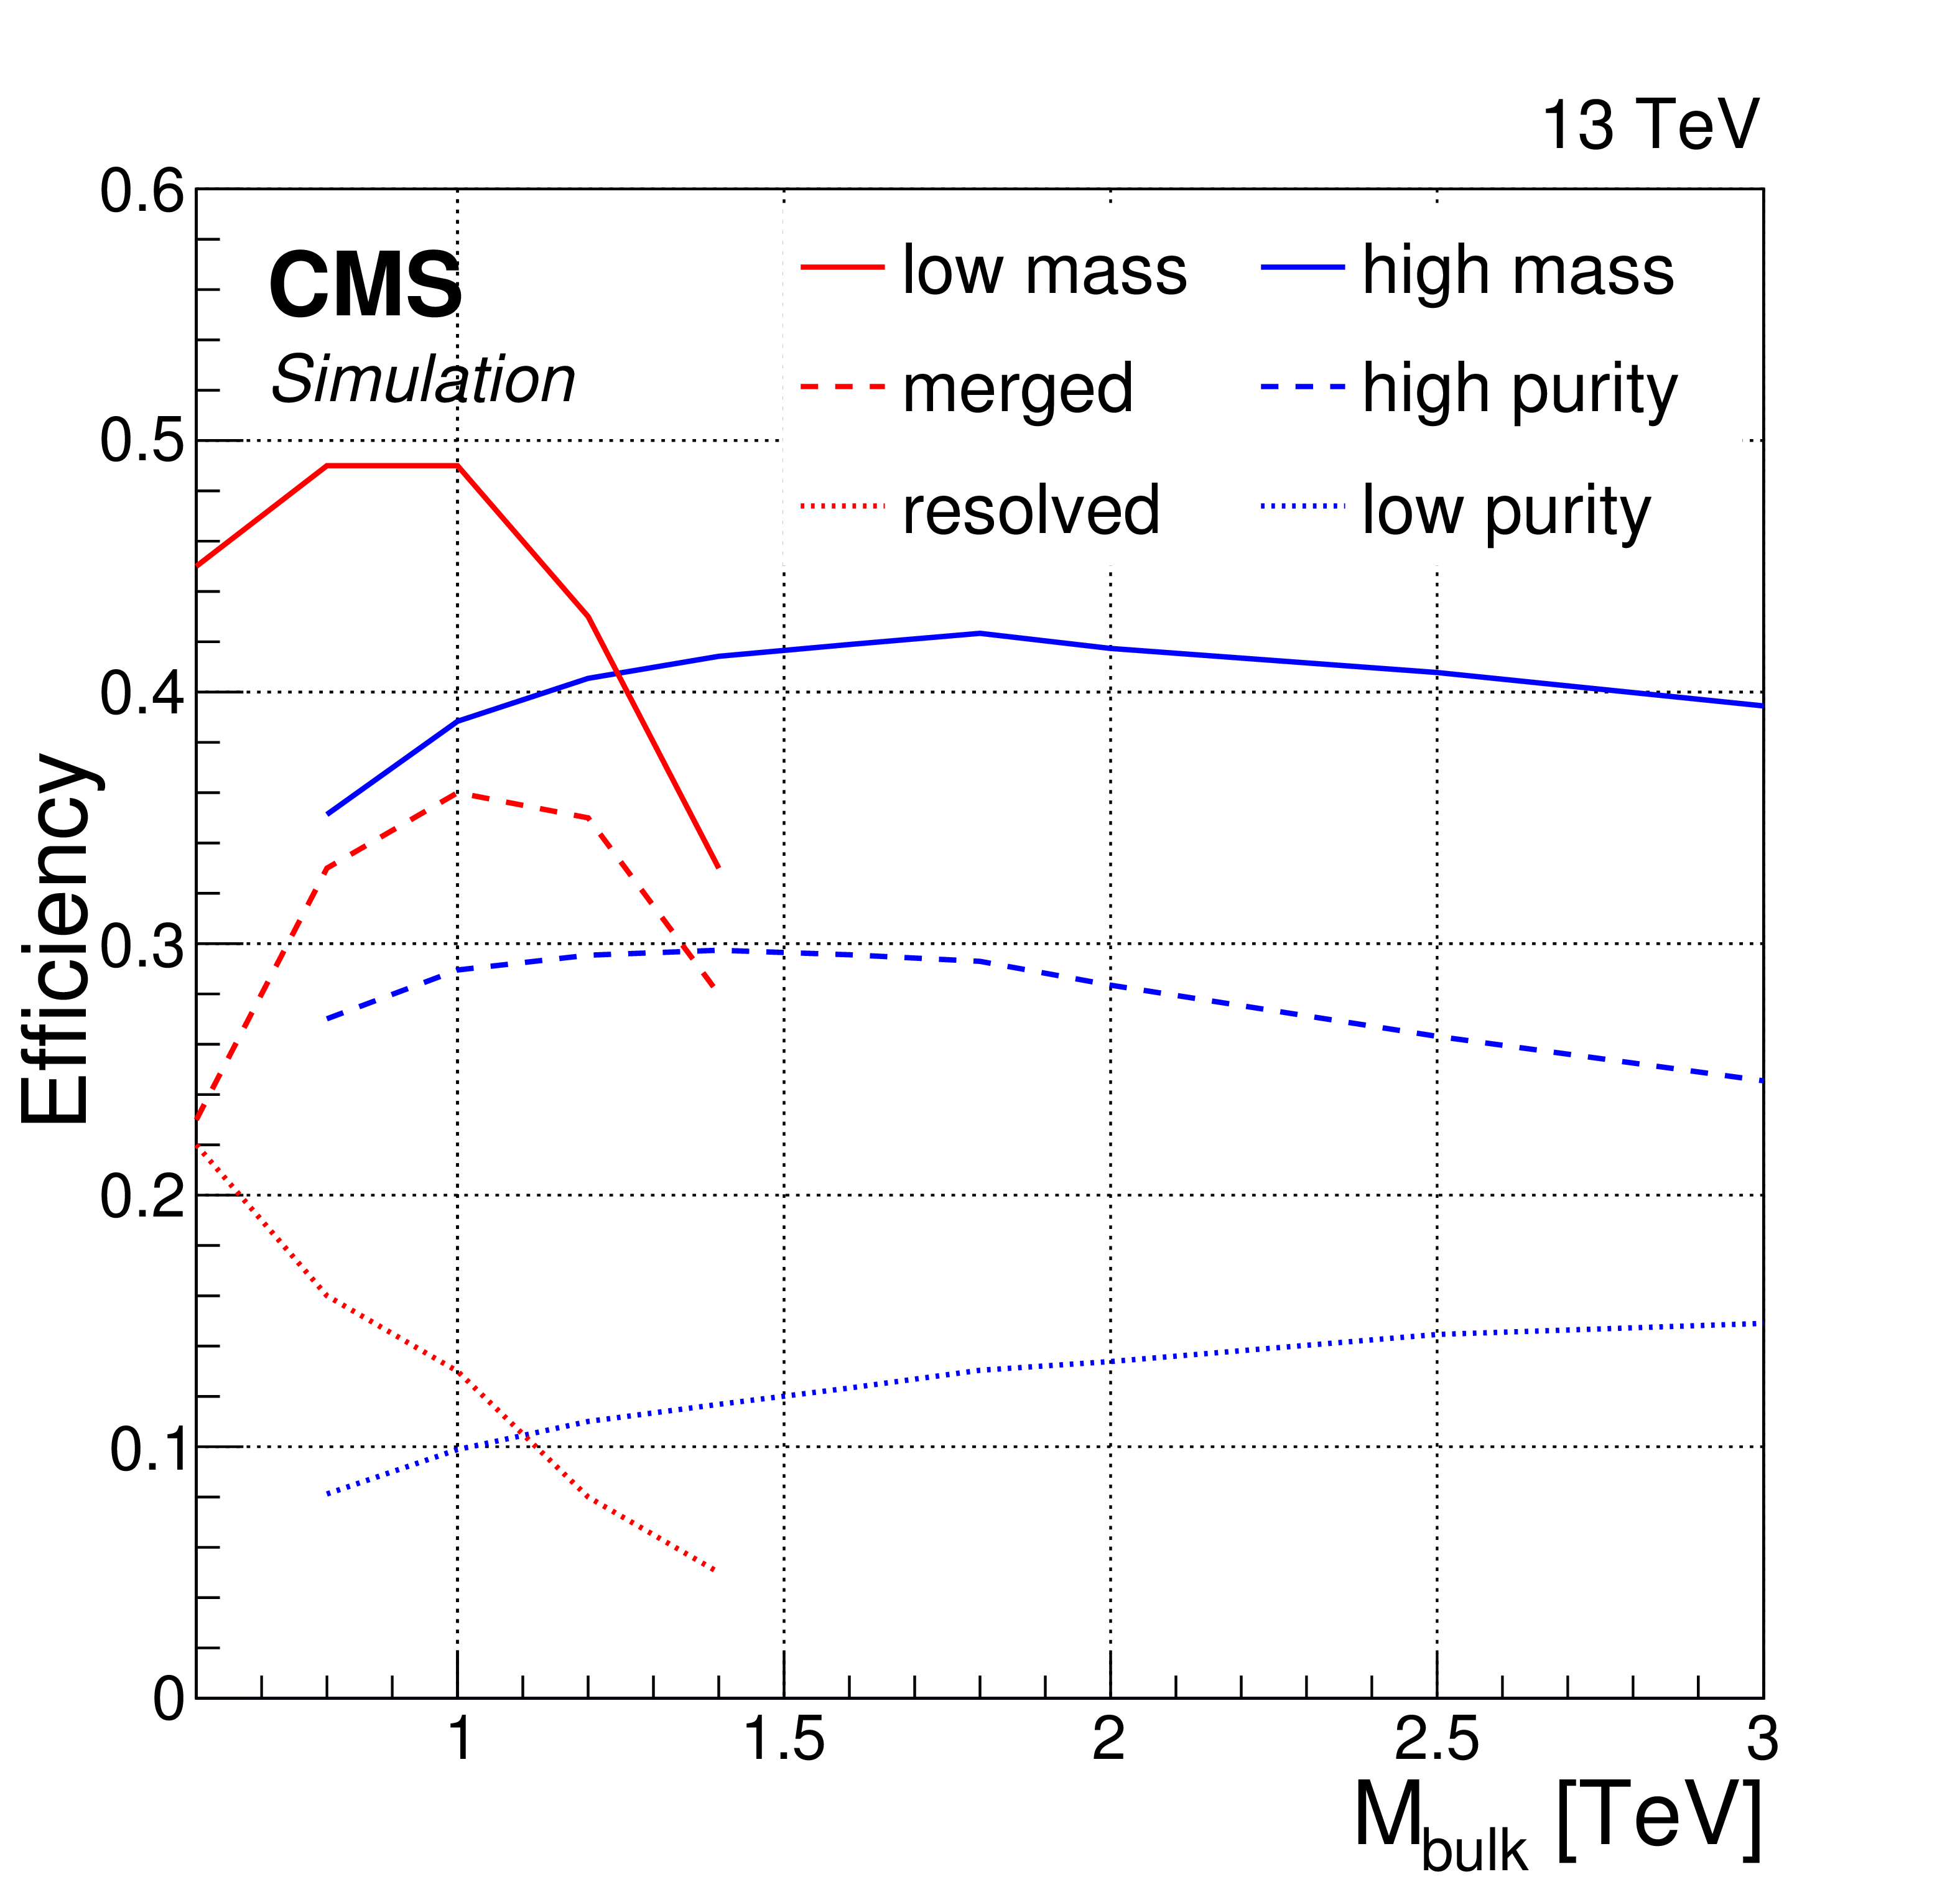
Selection efficiency as function of the RS (a) and bulk (b) graviton mass for the low mass (red solid line) and high mass (blue solid line) searches. The red dashed (dotted) line denotes the efficiency of the low mass search in the boosted (resolved) category; the blue dashed (dotted) line denotes the efficiency of the high mass search in the high purity (low purity) category. |
png pdf |
Figure 11-b:
Selection efficiency as function of the RS (a) and bulk (b) graviton mass for the low mass (red solid line) and high mass (blue solid line) searches. The red dashed (dotted) line denotes the efficiency of the low mass search in the boosted (resolved) category; the blue dashed (dotted) line denotes the efficiency of the high mass search in the high purity (low purity) category. |

png pdf |
Figure 12-a:
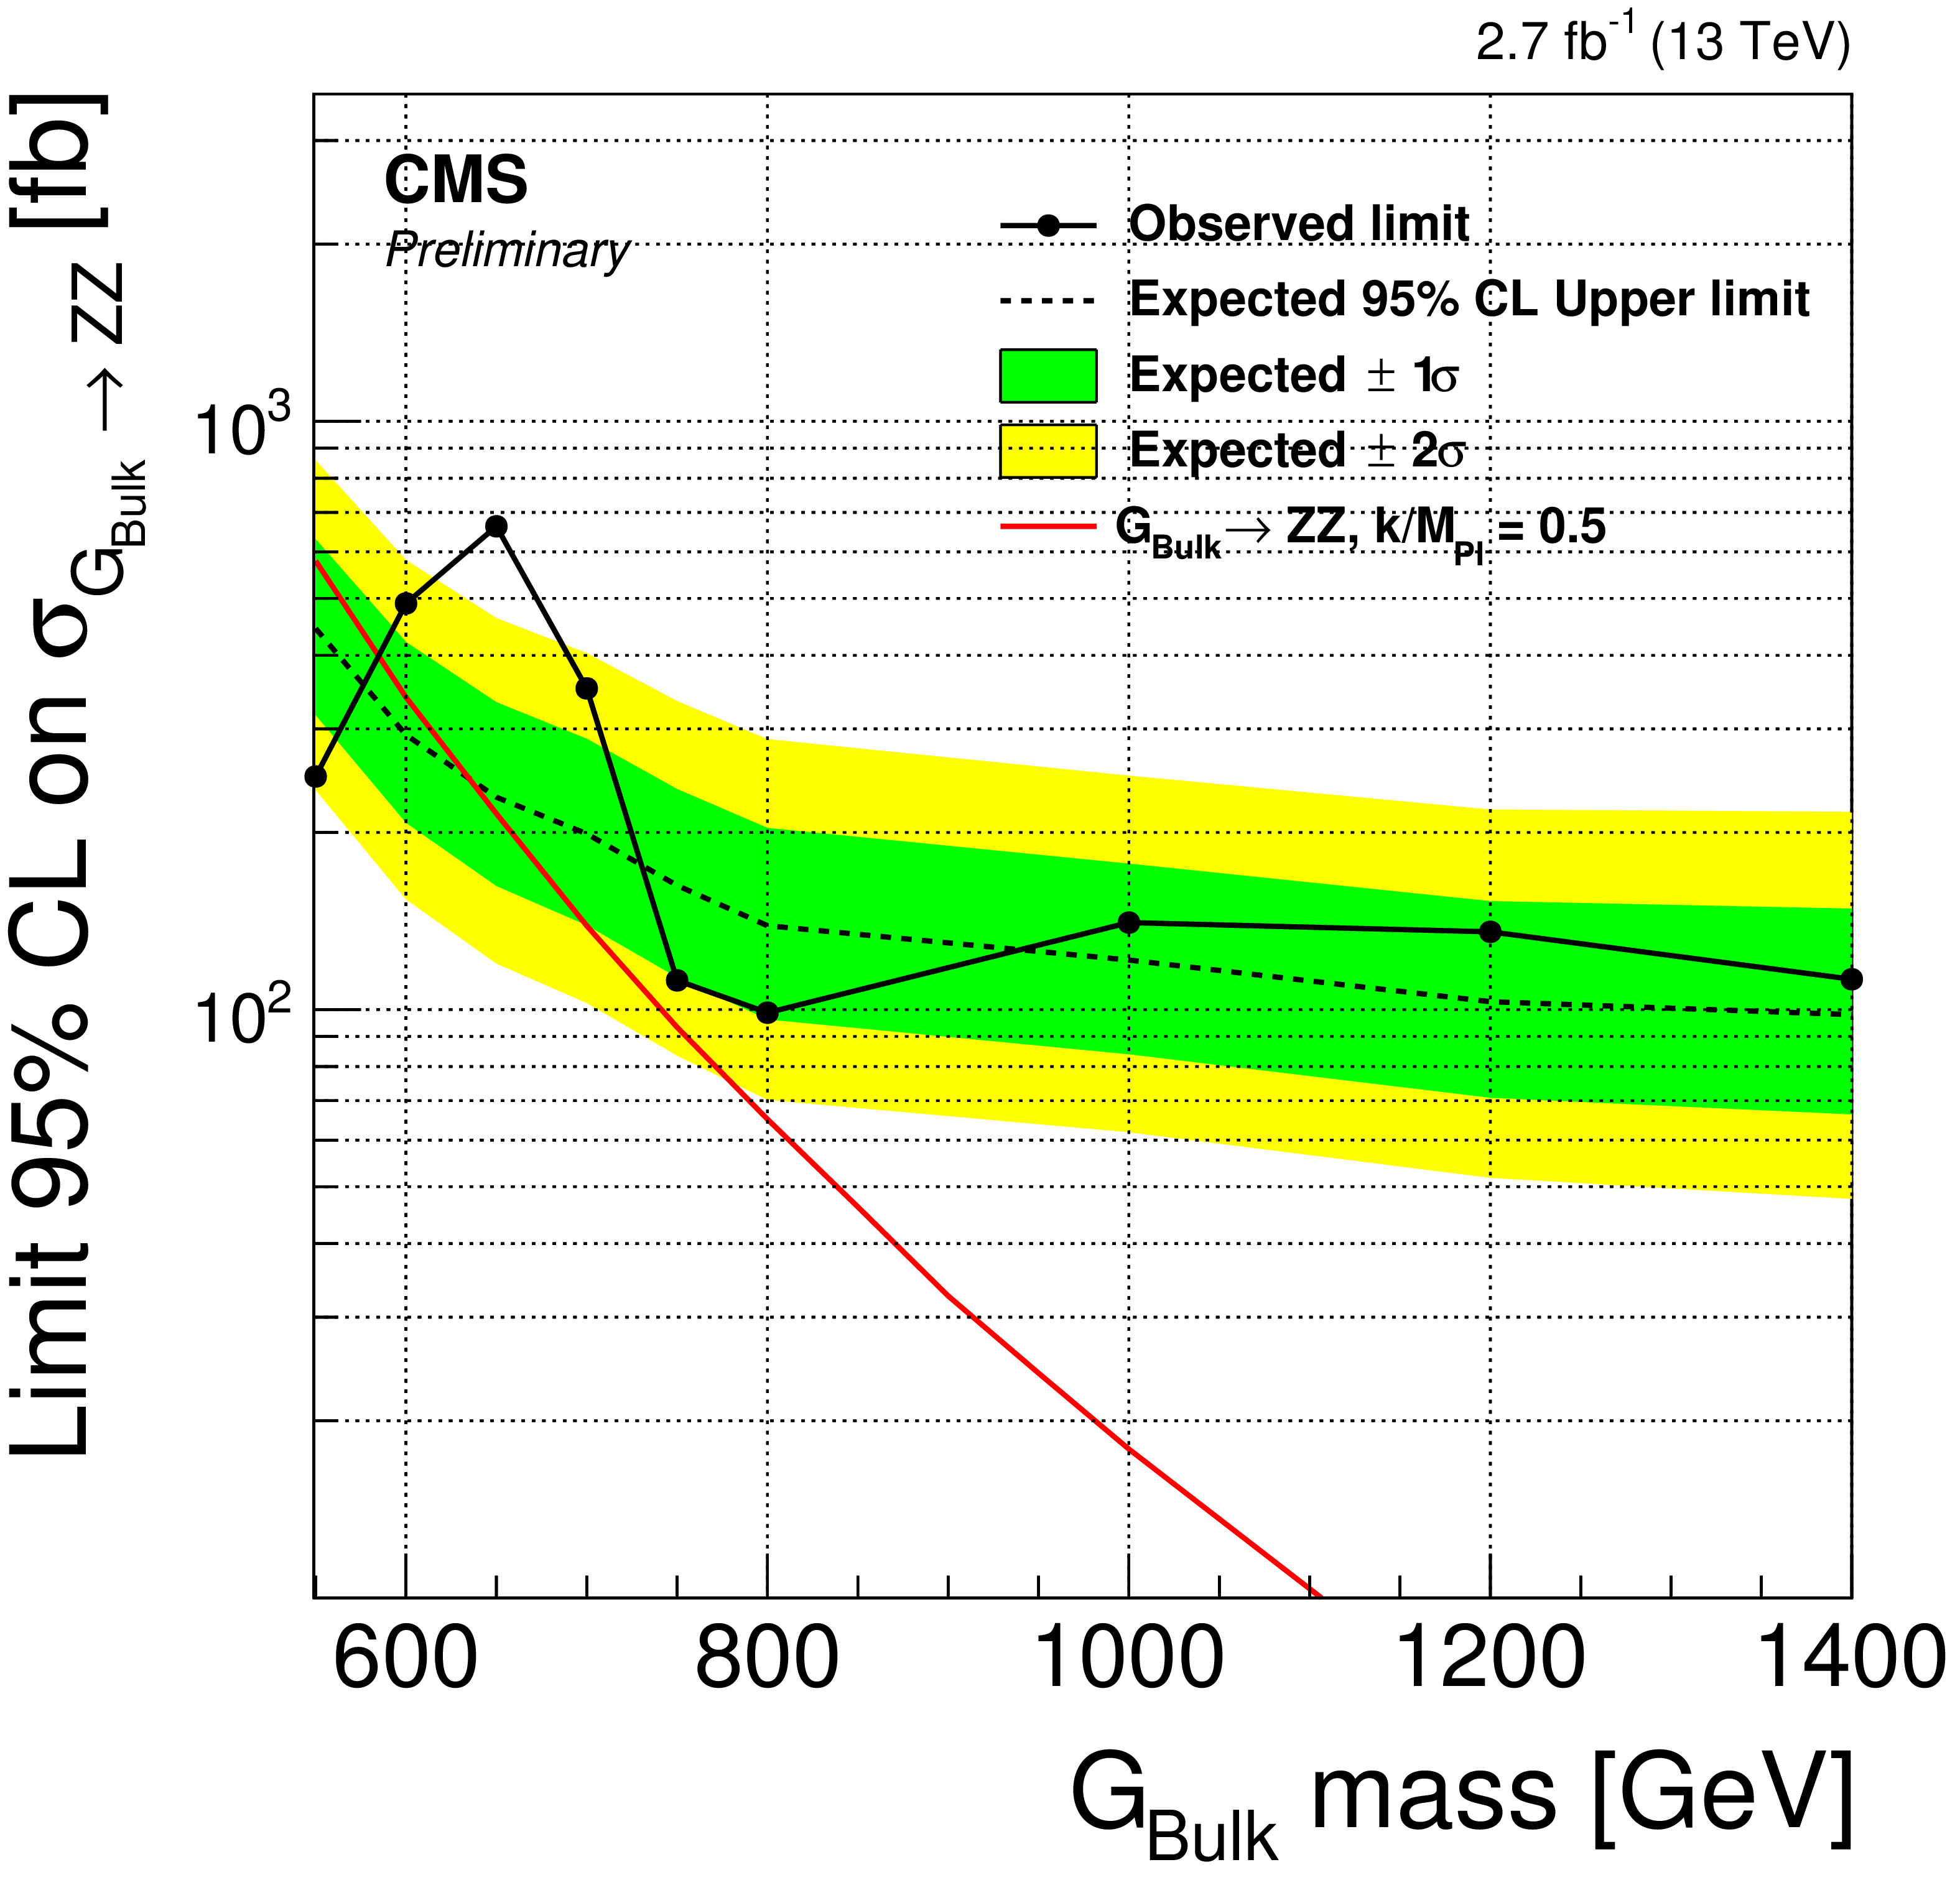
Observed and expected 95% CL upper limits on the RS (a) and bulk (b and c) graviton production cross section times branching fraction to ZZ obtained by the low mass search (a,b) and the low and high mass searches combined (c). The 68% and 95% ranges of expectation for the background-only model are also shown with green and yellow bands, respectively. The theoretical cross-section for the RS model has been multiplied by a factor of 0.2 for visibility. The blue line in the bottom plot sets the boundary at 800 GeV that separates the low mass and high mass searches. |
png pdf |
Figure 12-b:
Observed and expected 95% CL upper limits on the RS (a) and bulk (b and c) graviton production cross section times branching fraction to ZZ obtained by the low mass search (a,b) and the low and high mass searches combined (c). The 68% and 95% ranges of expectation for the background-only model are also shown with green and yellow bands, respectively. The theoretical cross-section for the RS model has been multiplied by a factor of 0.2 for visibility. The blue line in the bottom plot sets the boundary at 800 GeV that separates the low mass and high mass searches. |

png pdf |
Figure 12-c:
Observed and expected 95% CL upper limits on the RS (a) and bulk (b and c) graviton production cross section times branching fraction to ZZ obtained by the low mass search (a,b) and the low and high mass searches combined (c). The 68% and 95% ranges of expectation for the background-only model are also shown with green and yellow bands, respectively. The theoretical cross-section for the RS model has been multiplied by a factor of 0.2 for visibility. The blue line in the bottom plot sets the boundary at 800 GeV that separates the low mass and high mass searches. |
| Tables | |

png pdf |
Table 1:
Analysis strategies for bulk graviton search. |

png pdf |
Table 2:
Summary of selection requirements and categorisation. |
png pdf |
Table 3:
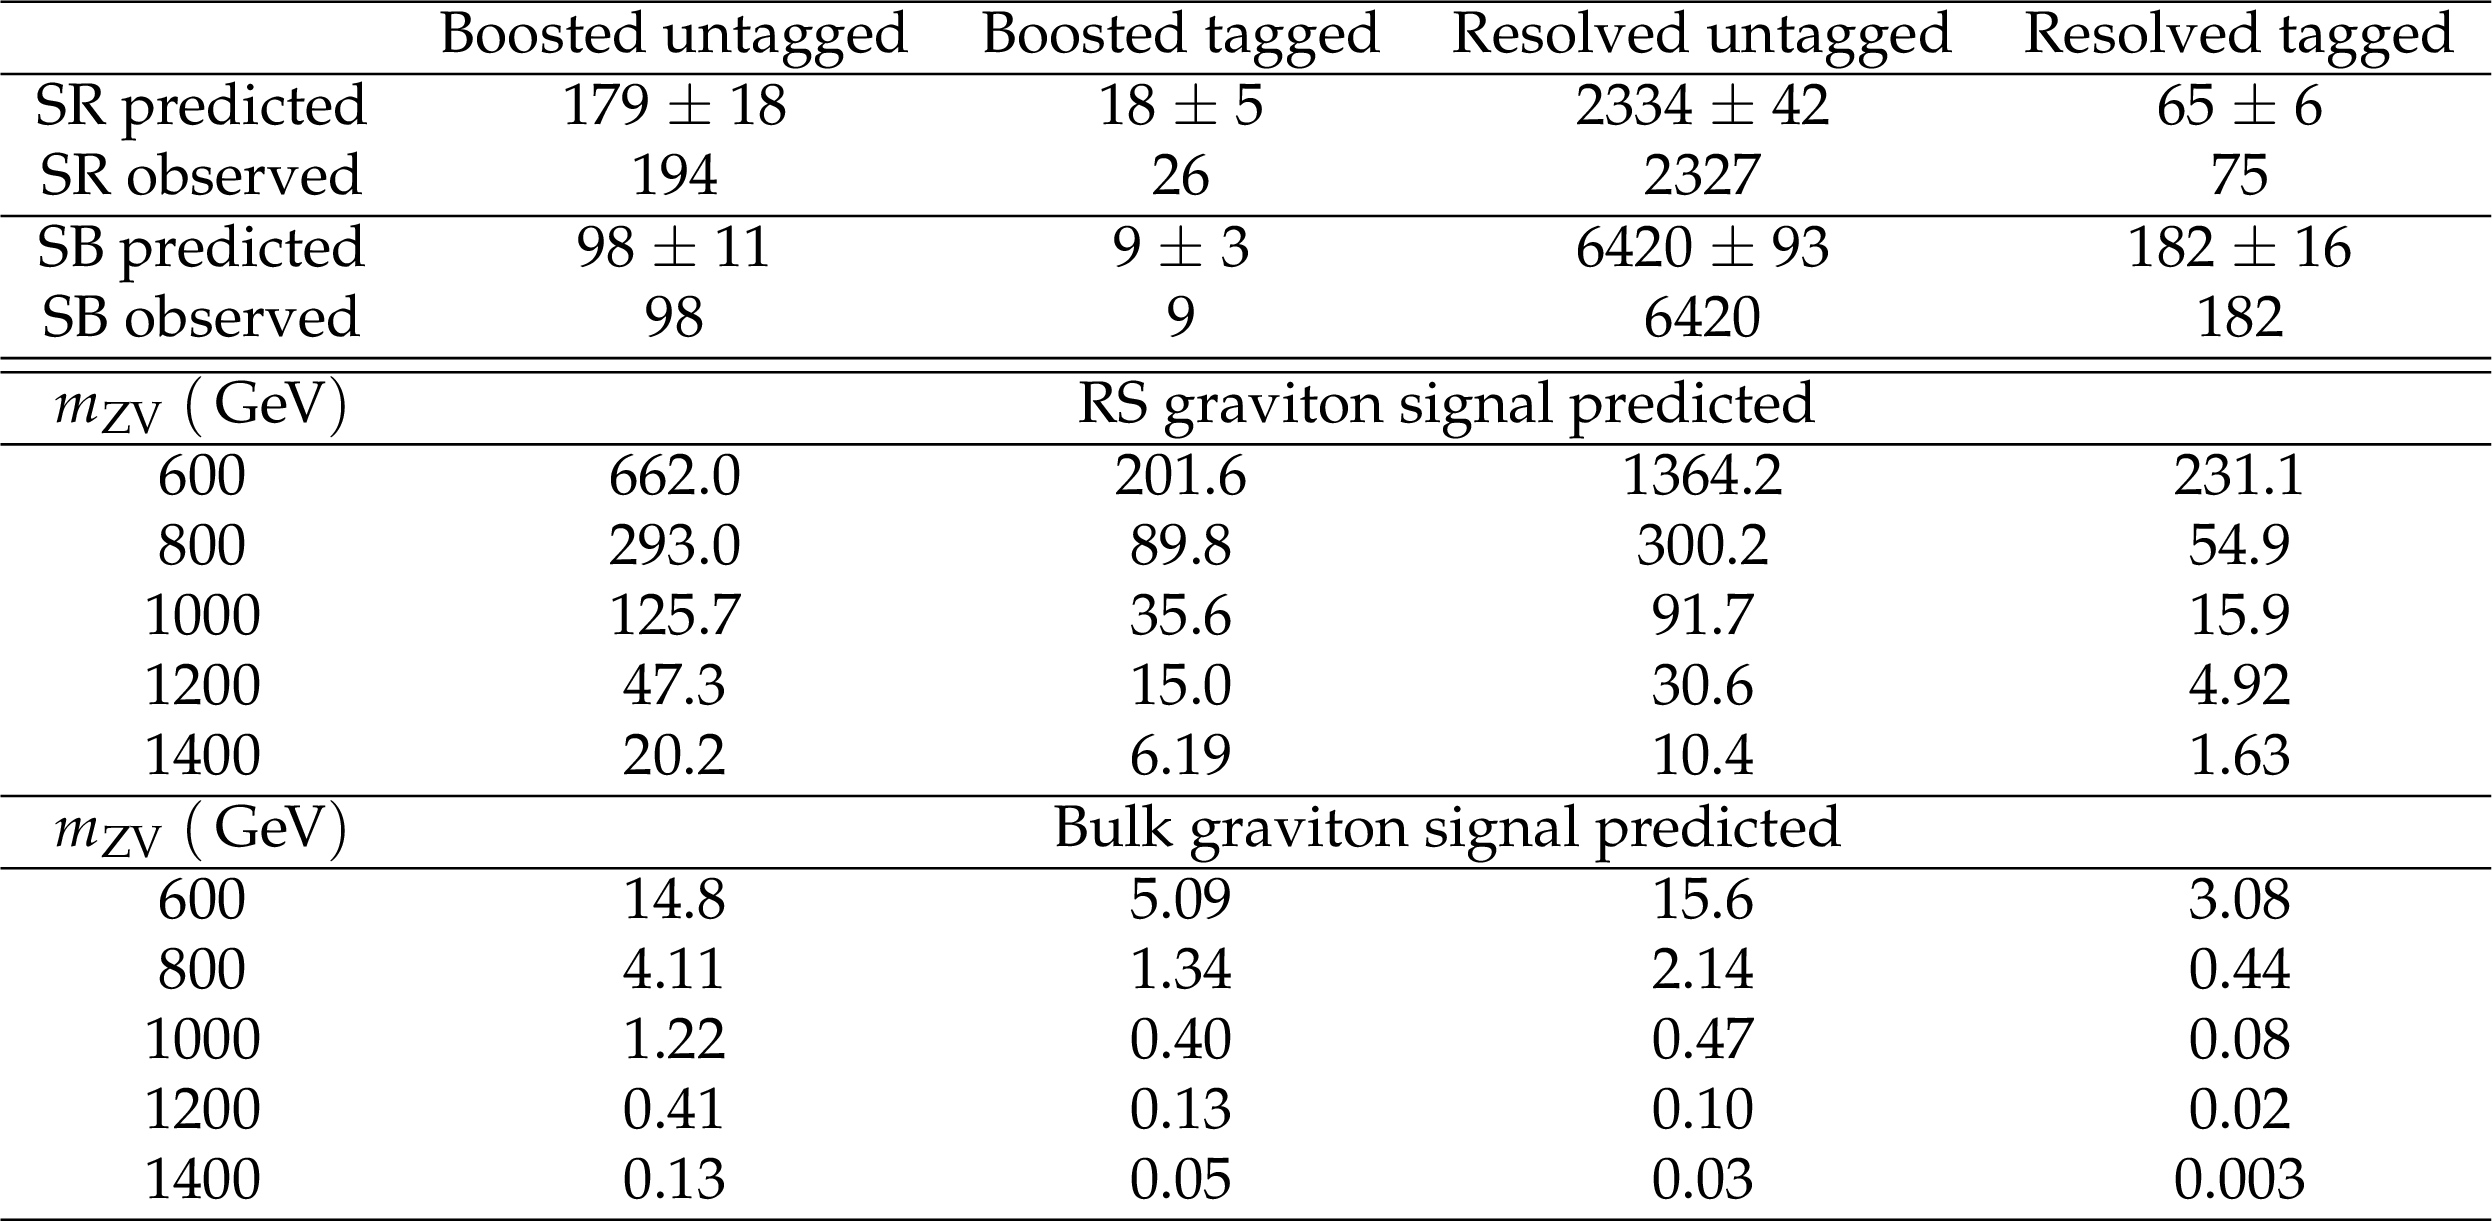
Predicted and observed yields with 2.7 fb$^{-1}$ of data for the resolved and boosted categories of the low mass search. The signal and sideband predicted numbers are derived from the fit to the sideband mass distributions alone. |

png pdf |
Table 4:
Background estimation for the high mass search obtained by the integral of the parametric model in the signal region (65 $ < {m_\mathrm {J}}< $ 105 GeV). The estimated background is reported in the format A $\oplus $ B, where A and B represent the dominant and subdominant components, respectively. The systematic uncertainty due to mismodelling of the pruned mass ranges between 28-42%. |
png pdf |
Table 5:
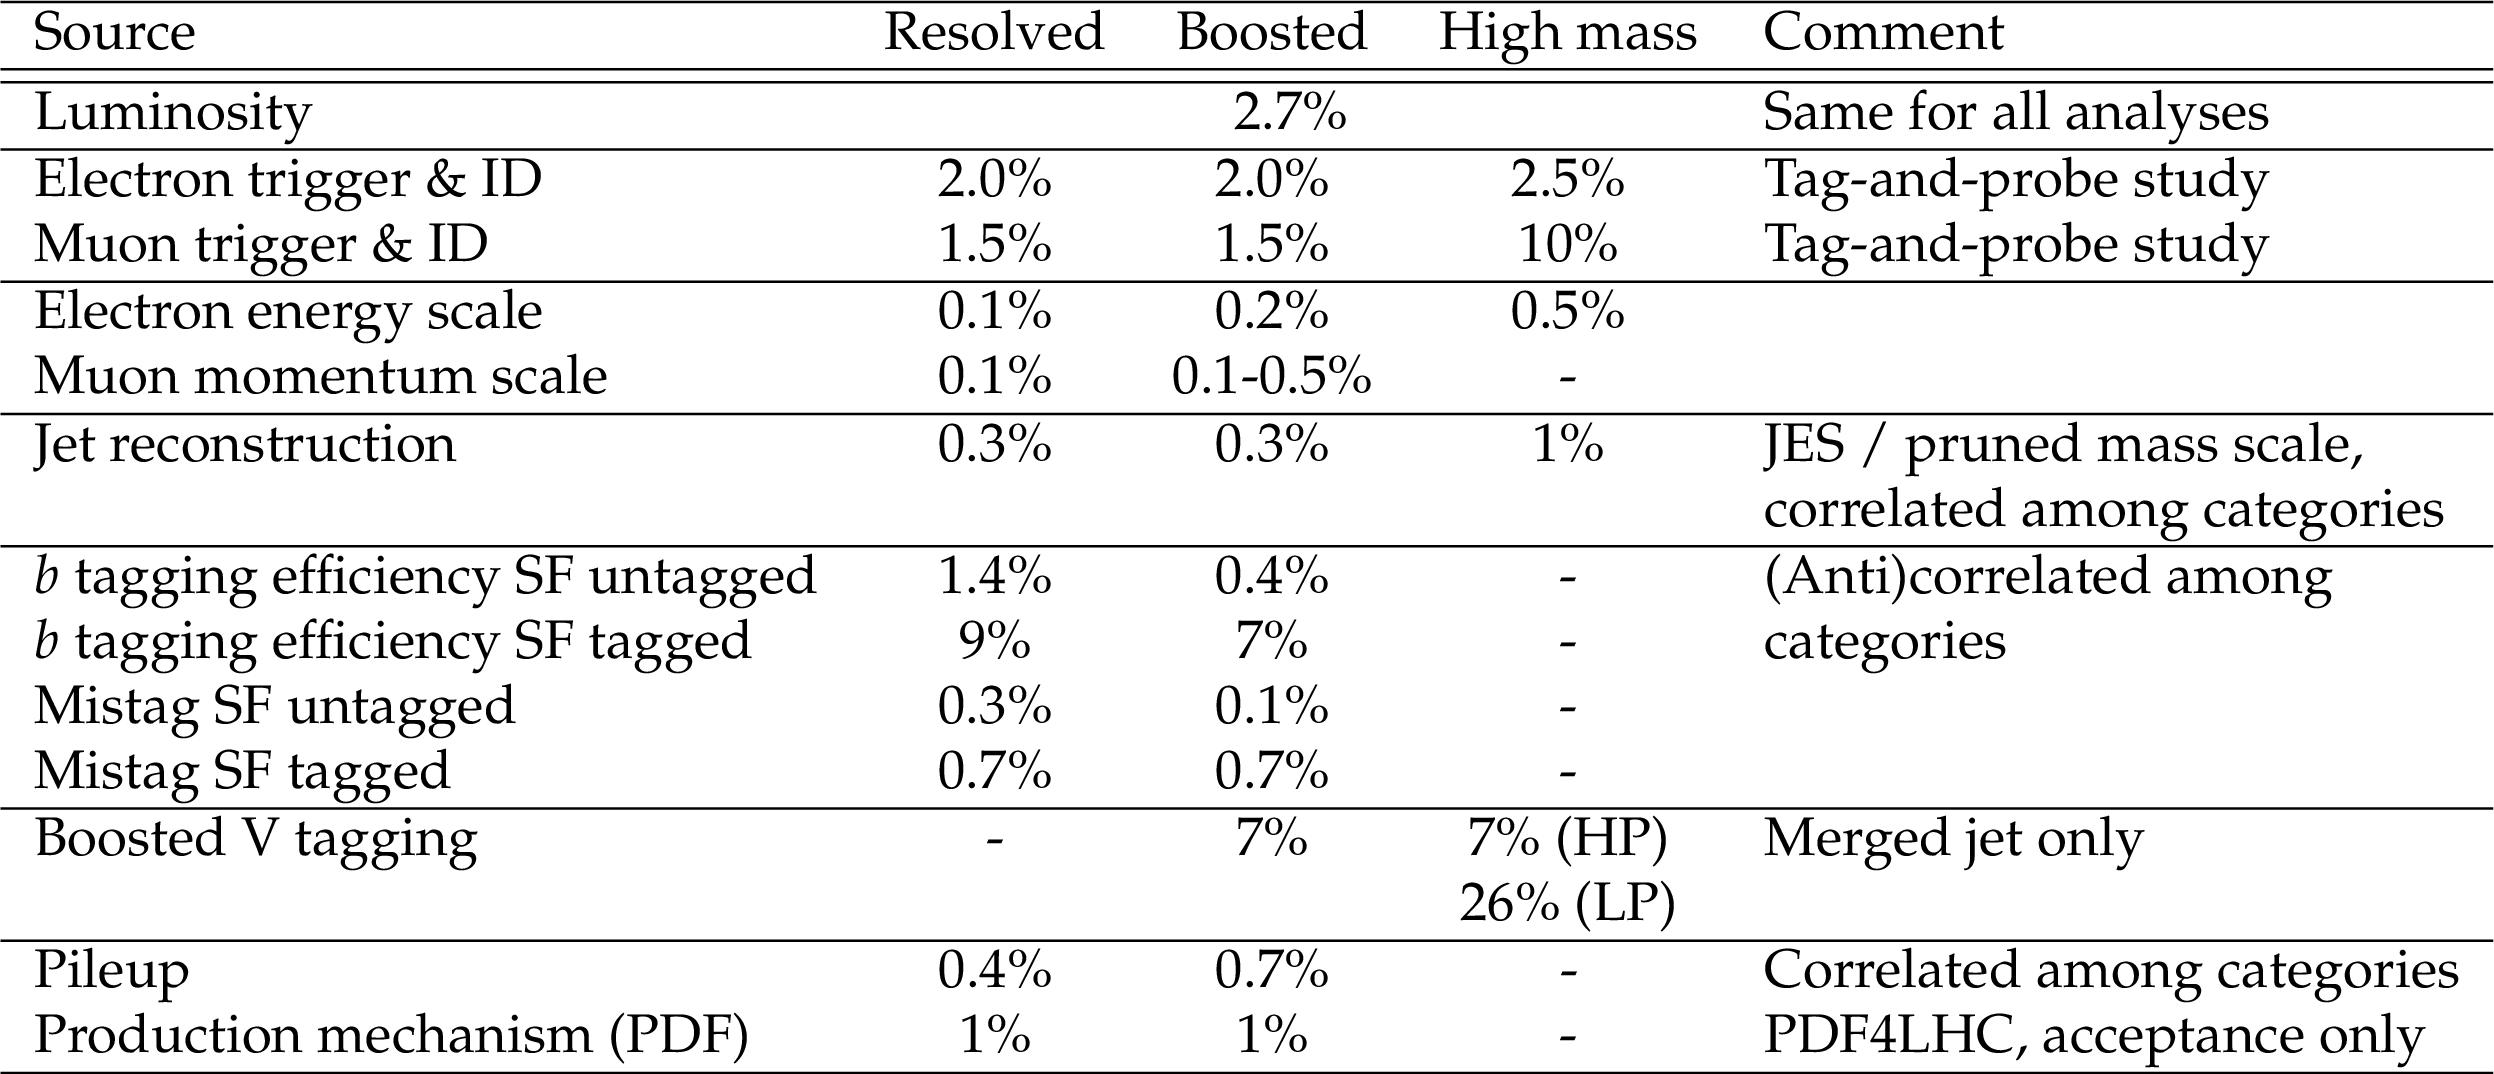
Summary of systematic uncertainties on the signal normalisation in the low mass resolved, low mass boosted, and high mass analyses. |

png pdf |
Table 6:
Summary of systematic uncertainties on the background normalisation in the low mass resolved and boosted analyses. |
| Summary |
|
A search for diboson resonances in the mass range 550 GeV to 2500 GeV in the semileptonic ${\mathrm{X}}\rightarrow \mathrm{Z} \mathrm{V} \rightarrow\ell^+\ell^- \mathrm{ q \bar{q} }$ final state, where one boson decays hadronically (V = W, Z) and the other, a Z boson, decays to two leptons, has been presented. The choice of analysis strategy for a particular signal hypothesis is based on the optimisation of the signal selection efficiency. Data corresponding to an integrated luminosity of 2.7 fb$^{-1}$ of proton-proton collisions at center-of-mass energy of 13 TeV{} have been analysed. In the high mass analysis, the results obtained are compatible with the standard model prediction in the explored mass range. Given the low number of events in data and the low cross section of the benchmark model (bulk graviton with $k/M_{Pl} =$ 0.5), the present analysis did not reach the sensitivity required to establish exclusion limits on the theoretical cross section of the model under study. In the low mass search, an excess consistent with the signal at a mass of 650 GeV is observed. The best fit signal strengths are 0.03 $\pm$ 0.01 times the RS graviton cross section for $k/M_{Pl} =$ 0.1, and 2.0 $\pm$ 0.6 times the bulk graviton cross section for $k/M_{Pl} =$ 0.5. The excess has a local p-value (the probability for background alone to give at least as large a signal strength at that mass) of $43.4 \times 10^{-4}$ (3.4$\sigma$) for the full low mass search (boosted and resolved categories) in the RS interpretation, and $4.0 \times 10^{-5}$ (3.9$ \sigma$) in the bulk graviton case. Taking into account the look-elsewhere effect [35] in the mass range 550 $< m_\mathrm{ZV} <$ 1400 GeV, the global p-value is 9.5 times higher in the RS analysis and 10.9 times higher in the bulk graviton analysis, decreasing the global significances to 2.9$\sigma$ and 3.5$\sigma$, respectively. |
| References | ||||
| 1 | CMS Collaboration | Search for a Higgs Boson in the Mass Range from 145 to 1000 GeV Decaying to a Pair of W or Z Bosons | JHEP 10 (2015) 144 | CMS-HIG-13-031 1504.00936 |
| 2 | L. Randall and R. Sundrum | A Large mass hierarchy from a small extra dimension | PRL 83 (1999) 3370 | hep-ph/9905221 |
| 3 | L. Randall and R. Sundrum | An Alternative to compactification | PRL 83 (1999) 4690 | hep-th/9906064 |
| 4 | K. Agashe, H. Davoudiasl, G. Perez, and A. Soni | Warped Gravitons at the LHC and Beyond | PRD76 (2007) 036006 | hep-ph/0701186 |
| 5 | A. L. Fitzpatrick, J. Kaplan, L. Randall, and L.-T. Wang | Searching for the Kaluza-Klein Graviton in Bulk RS Models | JHEP 09 (2007) 013 | hep-ph/0701150 |
| 6 | O. Antipin, D. Atwood, and A. Soni | Search for RS gravitons via W(L)W(L) decays | PLB666 (2008) 155 | 0711.3175 |
| 7 | CMS Collaboration | Search for massive resonances decaying into pairs of boosted bosons in semi-leptonic final states at $ \sqrt{s} = $ 8 TeV | JHEP 08 (2014) 174 | CMS-EXO-13-009 1405.3447 |
| 8 | CMS Collaboration | The CMS experiment at the CERN LHC | JINST 3 (2008) S08004 | CMS-00-001 |
| 9 | CMS Collaboration | Particle-Flow Event Reconstruction in CMS and Performance for Jets, Taus, and MET | CMS-PAS-PFT-09-001 | |
| 10 | CMS Collaboration | Commissioning of the Particle-Flow Reconstruction in Minimum-Bias and Jet Events from pp Collisions at 7 TeV | CMS-PAS-PFT-10-002 | |
| 11 | M. Cacciari, G. P. Salam, and G. Soyez | FastJet User Manual | EPJC72 (2012) 1896 | 1111.6097 |
| 12 | CMS Collaboration | Determination of Jet Energy Calibration and Transverse Momentum Resolution in CMS | JINST 6 (2011) P11002 | CMS-JME-10-011 1107.4277 |
| 13 | CMS Collaboration | Performance of CMS muon reconstruction in pp collision events at $ \sqrt{s} $ = 7 TeV | Journal of Instrumentation 7 (2012), no. 10, P10002 | |
| 14 | CMS Collaboration | Performance of Electron Reconstruction and Selection with the CMS Detector in Proton-Proton Collisions at √s = 8 TeV | JINST 10 (2015), no. 06, P06005 | CMS-EGM-13-001 1502.02701 |
| 15 | J. Alwall et al. | The automated computation of tree-level and next-to-leading order differential cross sections, and their matching to parton shower simulations | JHEP 07 (2014) 079 | 1405.0301 |
| 16 | P. Nason | A New Method for Combining NLO QCD with Shower Monte Carlo Algorithms | JHEP 11 (2004) 040,.arXiv:hep-ph/0409146 | |
| 17 | S. Frixione, P. Nason, and C. Oleari | Matching NLO QCD Computations with Parton Shower Simulations: the POWHEG method | JHEP 11 (2007) 070,.arXiv:0709.2092 | |
| 18 | S. Alioli, P. Nason, C. Oleari, and E. Re | NLO Vector-Boson Production Matched with Shower in POWHEG | JHEP 07 (2008) 06,.arXiv:0805.4802 | |
| 19 | T. Sj\"ostrand, S. Mrenna and P. Z. Skands | PYTHIA 6.4 Physics and Manual | JHEP 05 (2006) 026 | hep-ph/0603175 |
| 20 | T. Sj\"ostrand, S. Mrenna, and P. Z. Skands | A Brief Introduction to PYTHIA 8.1 | CPC 178 (2008) 852--867 | 0710.3820 |
| 21 | P. Skands, S. Carrazza, and J. Rojo | Tuning PYTHIA 8.1: the Monash 2013 Tune | EPJC74 (2014), no. 8 | 1404.5630 |
| 22 | NNPDF Collaboration | Parton distributions for the LHC Run II | JHEP 04 (2015) 040 | 1410.8849 |
| 23 | GEANT4 Collaboration | GEANT4: a simulation toolkit | NIMA506 (2003) 250 | |
| 24 | CMS Collaboration | Measurements of inclusive W and Z cross sections in pp collisions at $ \sqrt{s}=7 $~TeV | JHEP 01 (2011) 001 | CMS-EWK-10-002 1012.2466 |
| 25 | M. Wobisch and T. Wengler | Hadronization corrections to jet cross-sections in deep inelastic scattering | in Monte Carlo generators for HERA physics. Proceedings, Workshop, Hamburg, Germany, 1998-1999 | |
| 26 | S. D. Ellis, C. K. Vermilion, and J. R. Walsh | Techniques for improved heavy particle searches with jet substructure | PRD80 (2009) 051501 | 0903.5081 |
| 27 | J. Thaler and K. Van Tilburg | Maximizing Boosted Top Identification by Minimizing N-subjettiness | JHEP 02 (2012) 093 | 1108.2701 |
| 28 | CMS Collaboration | Combination of diboson resonance searches at 8 and 13 TeV | CMS-PAS-B2G-16-007 | CMS-PAS-B2G-16-007 |
| 29 | CMS Collaboration | Identification of b quark jets at the CMS xxperiment in the LHC Run 2 | CMS-PAS-BTV-15-001 | CMS-PAS-BTV-15-001 |
| 30 | CMS Collaboration | CMS Luminosity Measurement for the 2015 Data Taking Period | CMS-PAS-LUM-15-001 | CMS-PAS-LUM-15-001 |
| 31 | ATLAS and CMS Collaborations | Procedure for the LHC Higgs boson search combination in Summer 2011 | ATL-PHYS-PUB-2011-11, CMS NOTE-2011/005 (2011) | |
| 32 | T. Junk | Confidence level computation for combining searches with small statistics | Nucl.Instrum.Meth. A434 (1999) 435 | hep-ex/9902006 |
| 33 | A. L. Read | Presentation of search results: the CLs technique | JPG: Nucl. Part. Phys. 28 (2002) | |
| 34 | A. Oliveira | Gravity particles from Warped Extra Dimensions, a review. Part I - KK Graviton | 1404.0102 | |
| 35 | E. Gross and O. Vitells | Trial factors or the look elsewhere effect in high energy physics | EPJC70 (2010) 525 | 1005.1891 |
|
|
Compact Muon Solenoid LHC, CERN |
|

|

|

|

|

|