

Compact Muon Solenoid
LHC, CERN
| CMS-PAS-BPH-16-002 | ||
| Search for the $\mathrm{X}(5568)$ state in $\mathrm{B}^0_\mathrm{s}\pi^\pm$ decays | ||
| CMS Collaboration | ||
| August 2016 | ||
| Abstract: A search for resonance-like structures in the $\mathrm{B}^0_\mathrm{s} \pi^\pm$ invariant mass spectrum is performed using an integrated luminosity of 19.7 fb$^{-1}$ of pp collisions at $\sqrt{s} =$ 8 TeV collected by the CMS experiment. The $\mathrm{B}^0_\mathrm{s}$ candidates are reconstructed in the decay chain $\mathrm{B}^0_\mathrm{s} \rightarrow \mathrm{J}/\psi \phi$, $\mathrm{J}/\psi \rightarrow \mu^+ \mu^-$, $\phi \rightarrow \mathrm{K}^+ \mathrm{K^-}$. With about 48,000 $\mathrm{B}^0_\mathrm{s}$-mesons reconstructed, the $\mathrm{B}^0_\mathrm{s}\pi^\pm$ invariant mass distributions do not show any unexpected structures for different kinematic requirements imposed to the $\pi^\pm$, $\mathrm{B}^0_\mathrm{s}$ and $\mathrm{B}^0_\mathrm{s} \pi^\pm$ candidates. An upper limit on the relative production of $\mathrm{X}(5568)$ and $\mathrm{B}^0_\mathrm{s}$ multiplied by the branching fraction of the decay $\mathrm{X}(5568) \to \mathrm{B}^0_\mathrm{s} \pi^\pm$ is estimated to be 3.9% at 95% CL in the most conservative case. | ||
|
Links:
CDS record (PDF) ;
inSPIRE record ;
CADI line (restricted) ;
These preliminary results are superseded in this paper, PRL 120 (2018) 202005. The superseded preliminary plots can be found here. |
||
| Figures | |

png pdf |
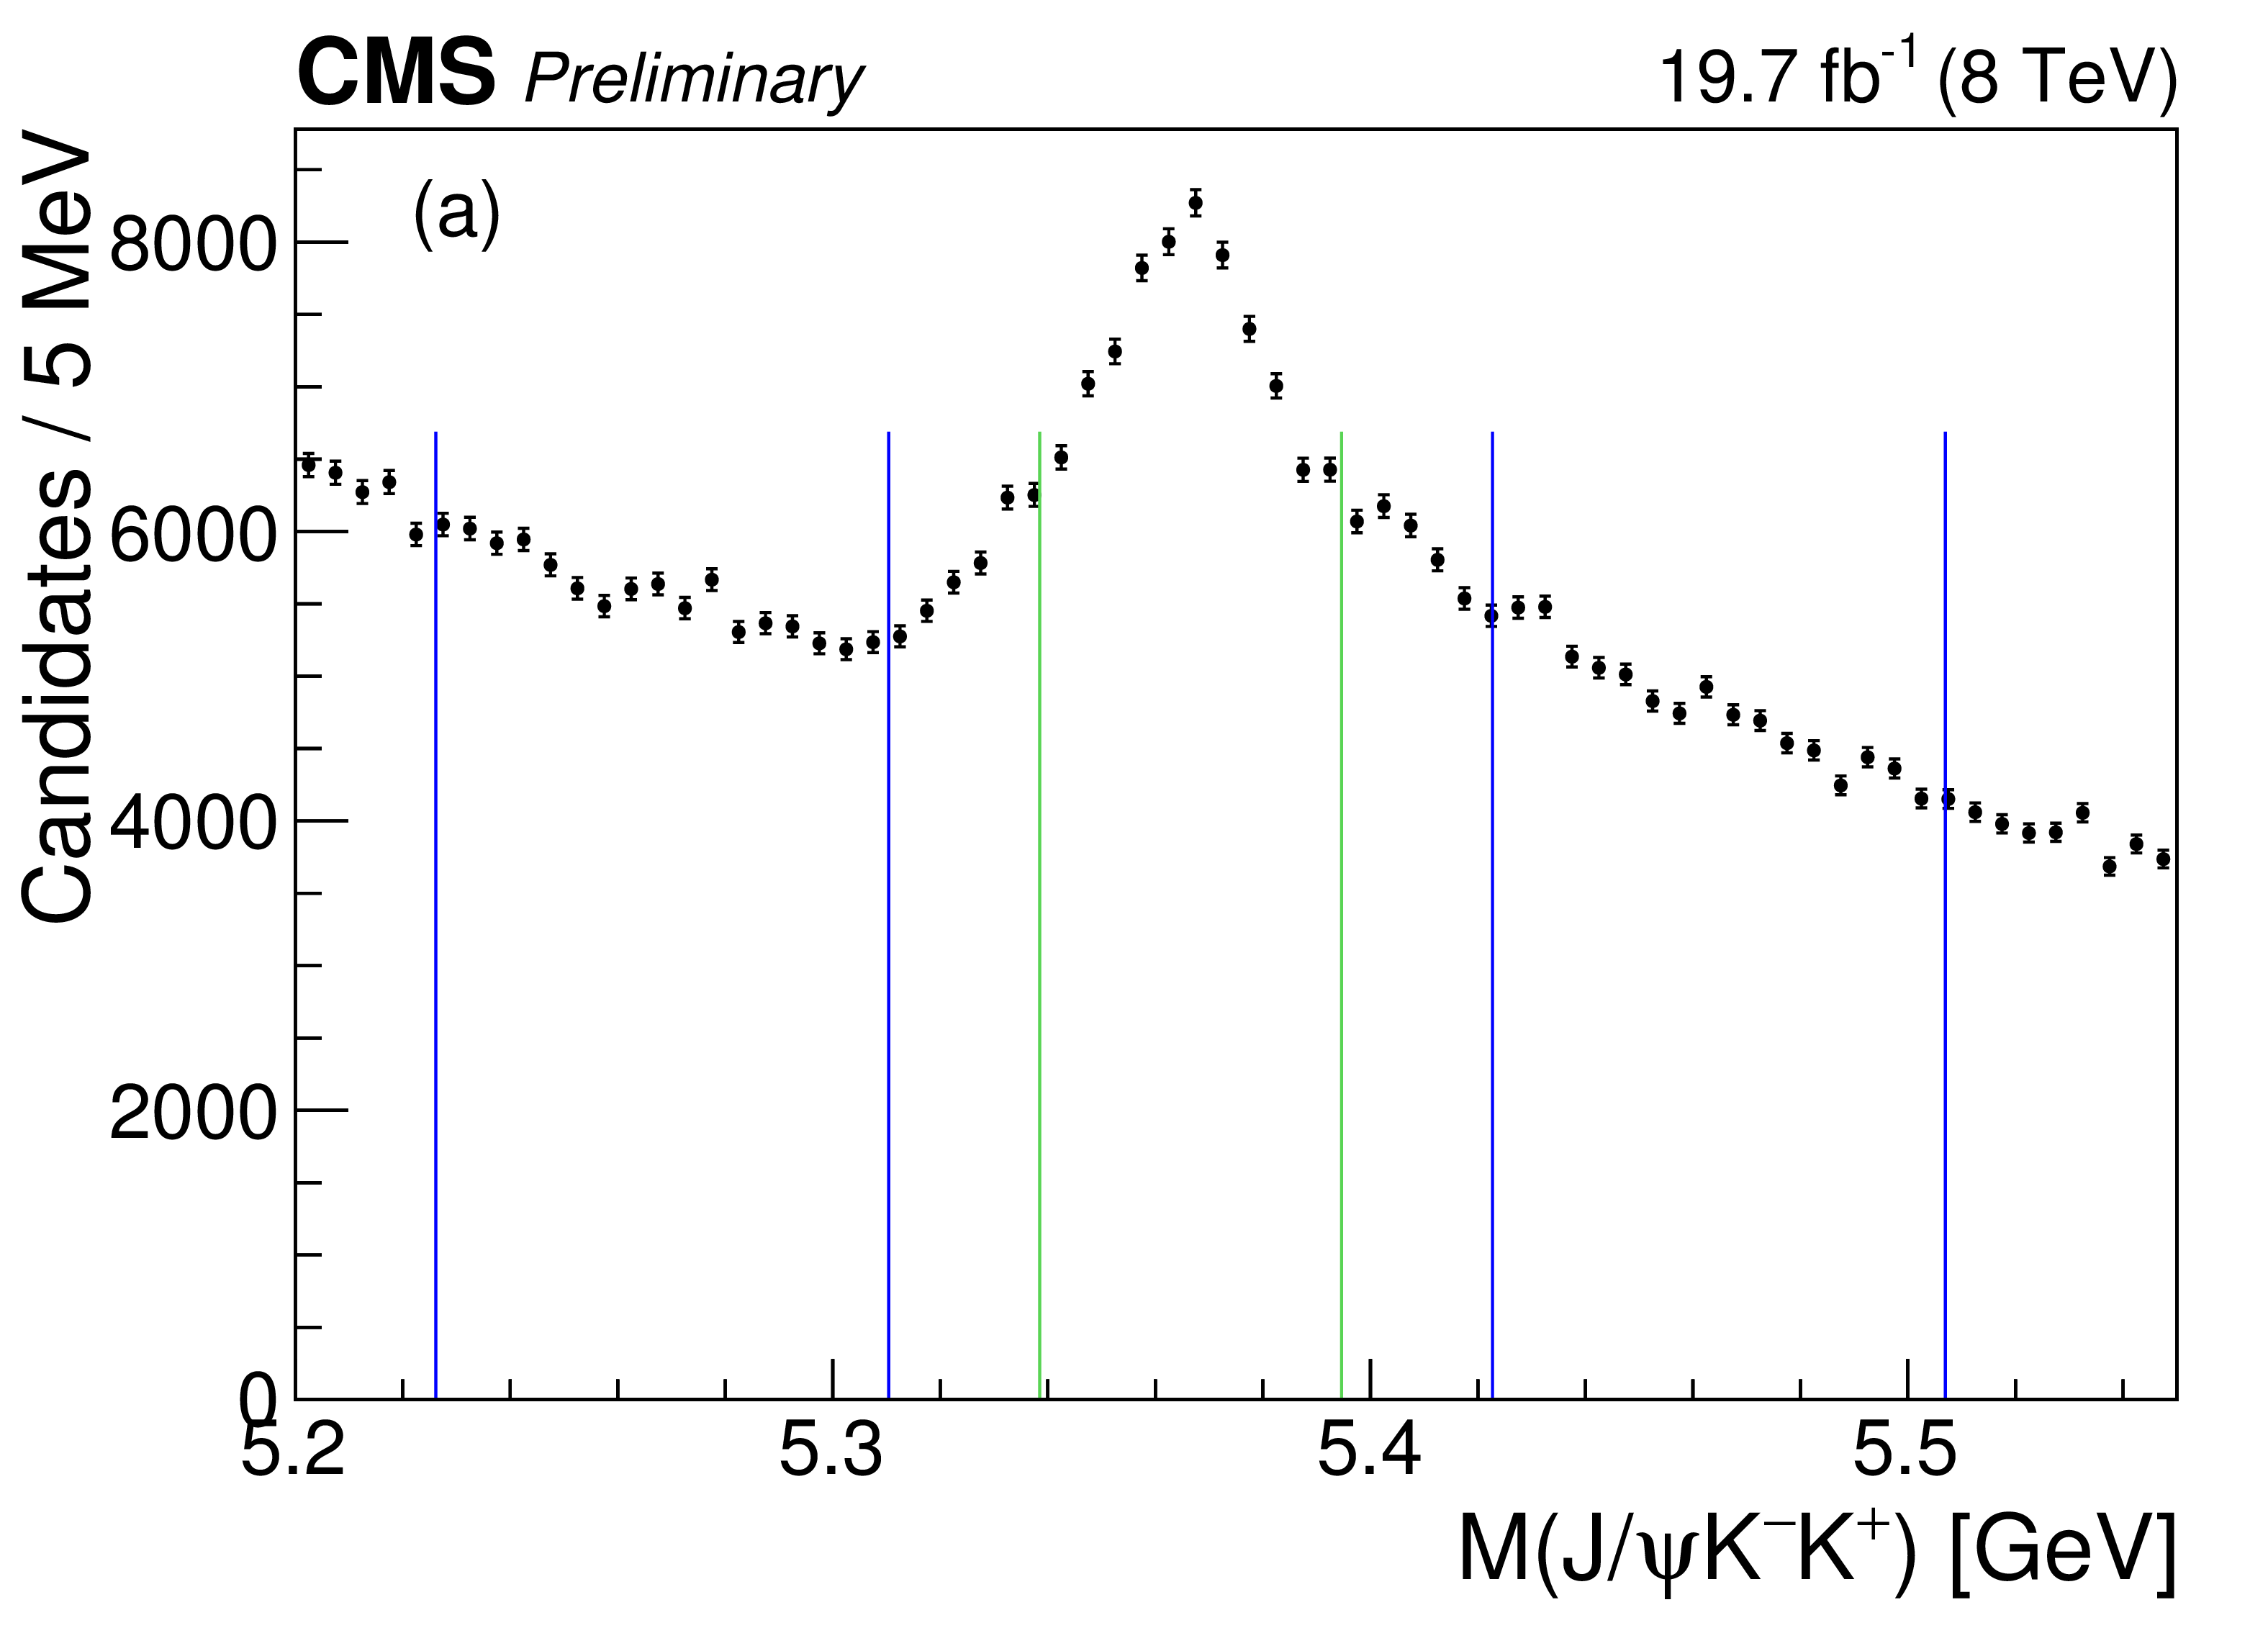
Figure 1:
Invariant mass distribution of the $ { {\mathrm {B}} ^0_ {\mathrm {s}} } $ candidates showing the data (black points with error bars), the total fit function (continuous thick red line), the signal functions (thin green curves), and the combinatorial background contribution (dashed blue line). The outermost vertical (blue) lines define the left and right $ { {\mathrm {B}} ^0_ {\mathrm {s}} } $ sidebands, while the innermost vertical (green) lines delimit the signal region. |

png pdf |
Figure 2:
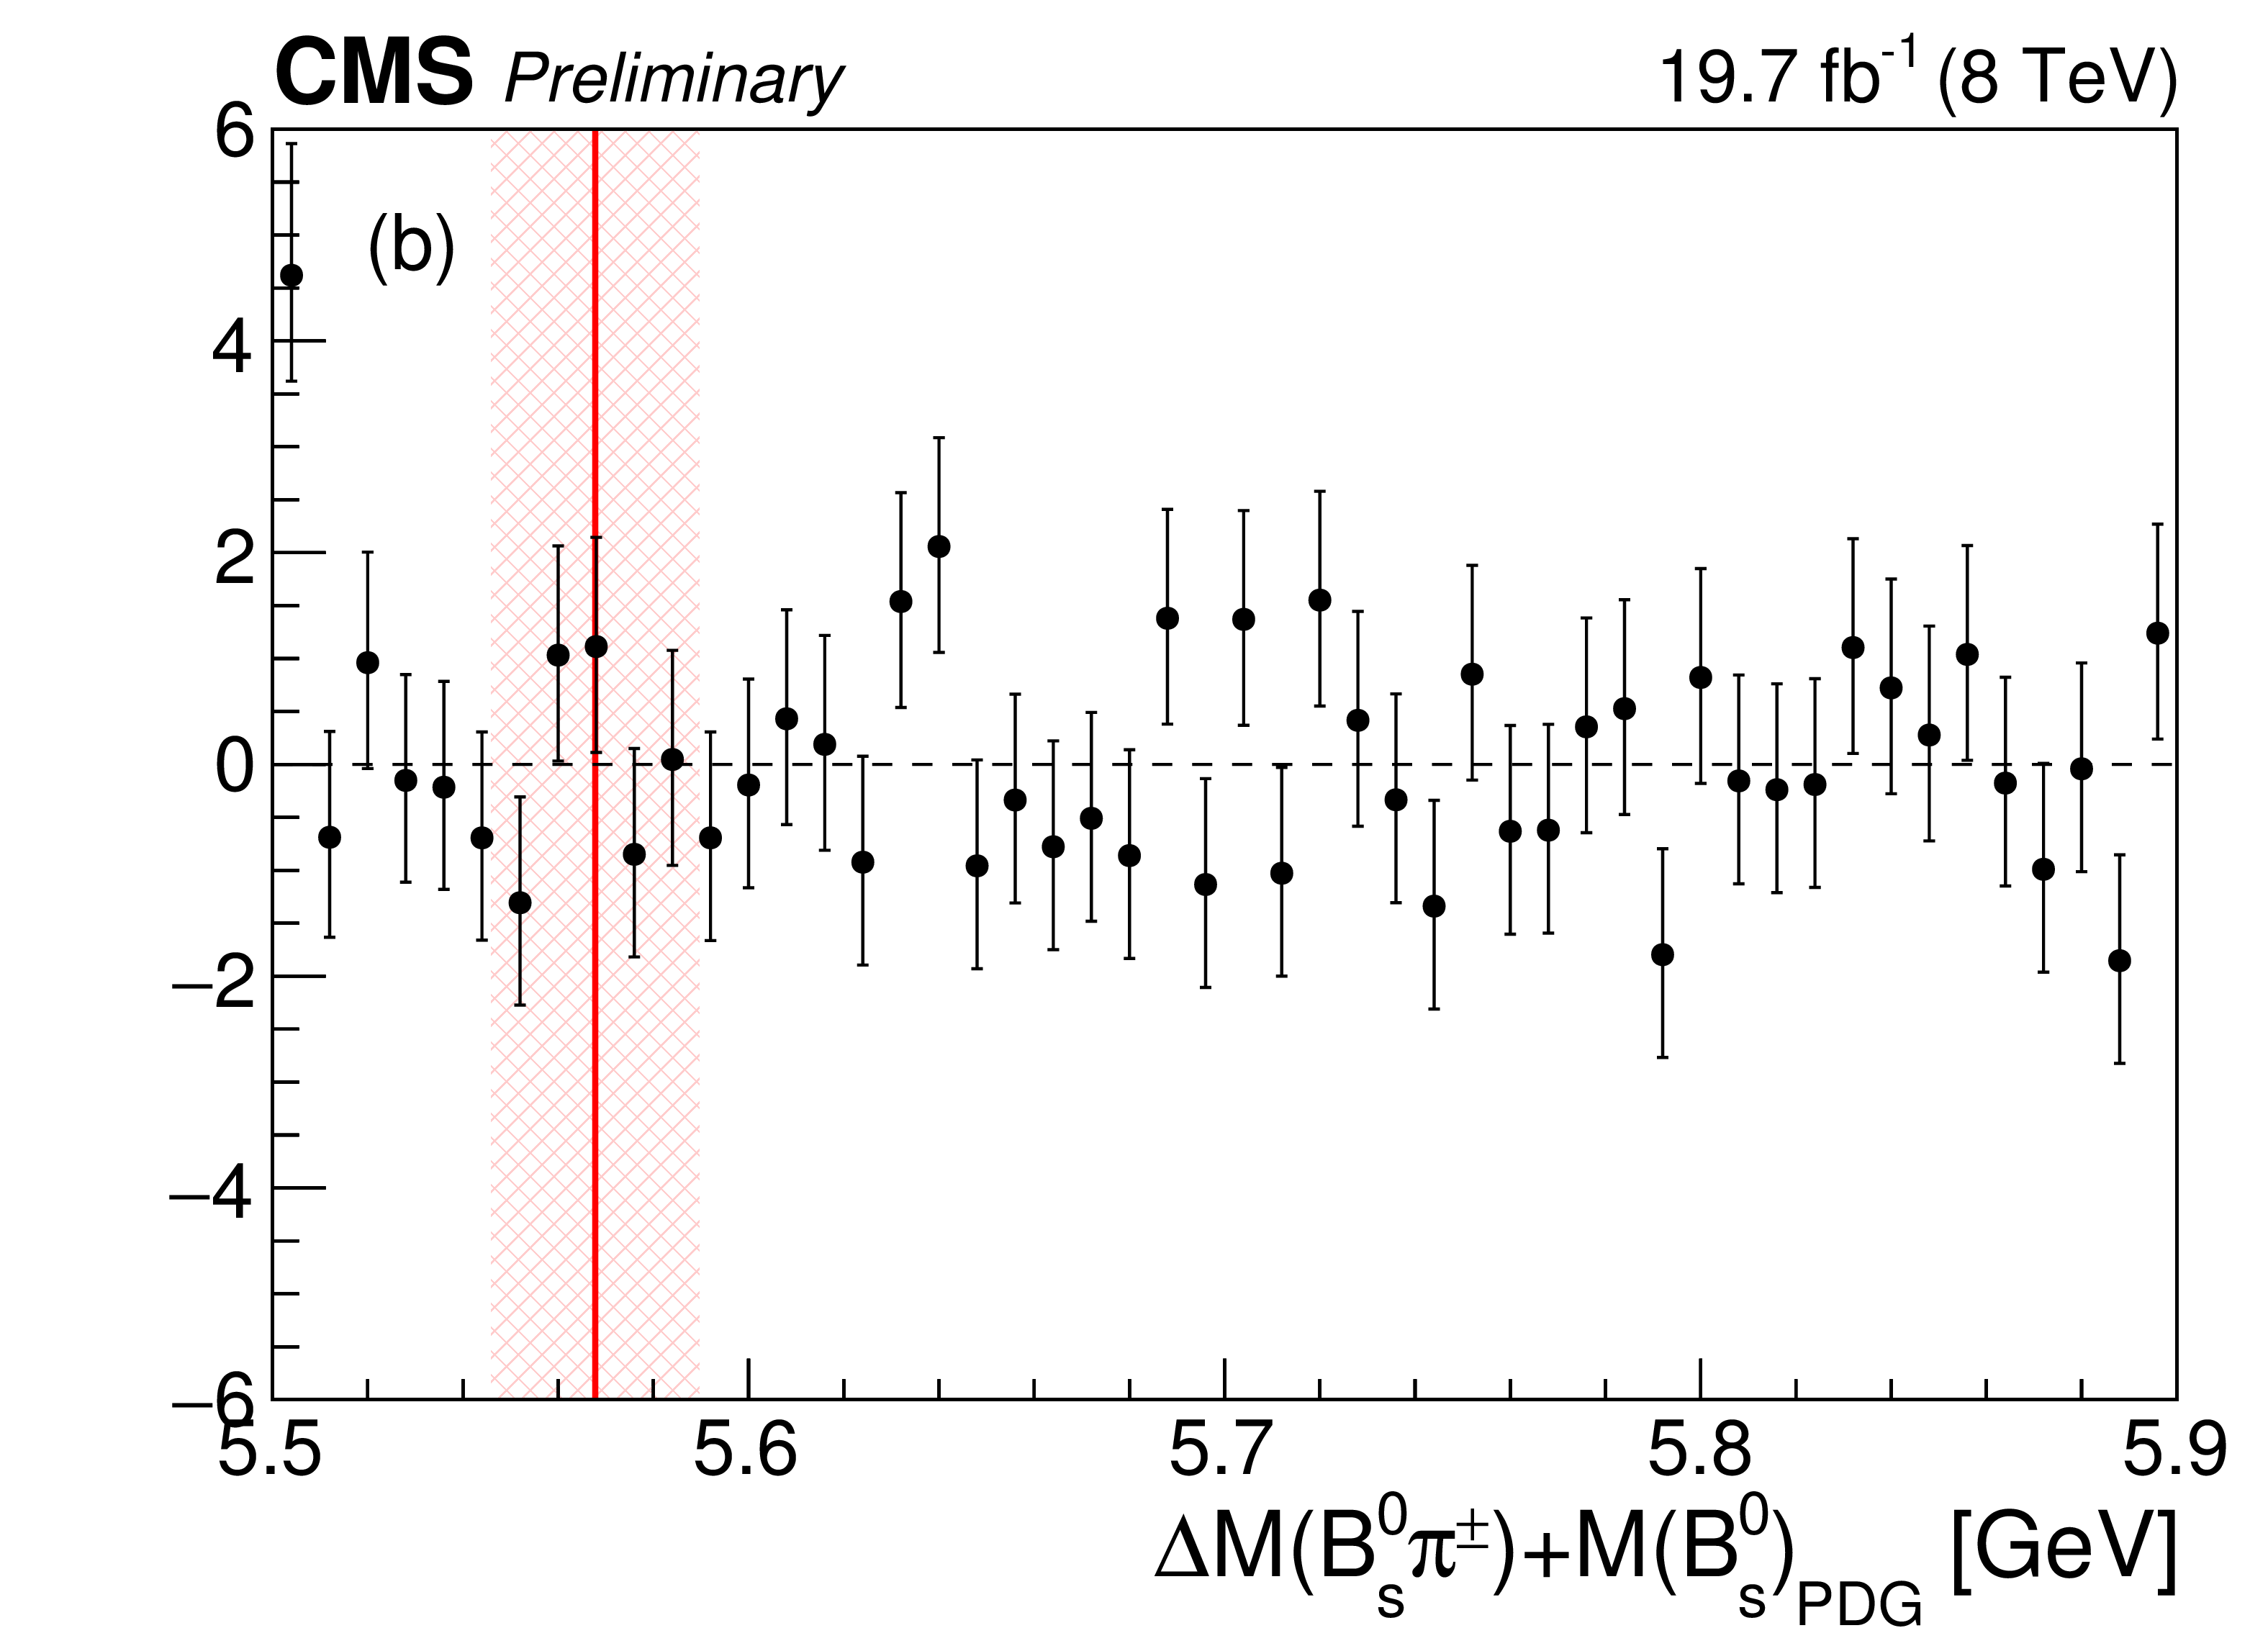
$ {M^{\Delta }( { { {\mathrm {B}} ^0_ {\mathrm {s}} } { {\pi } ^\pm } } )} $ distribution of events in the ${ {\mathrm {B}} ^0_ {\mathrm {s}} }$ signal (black points with error bars) and sidebands (continuous blue band) regions, where the second distribution is normalized to the first. The (red) vertical band indicates the region $M_X\pm \Gamma _X$ around the mass of the claimed $ {\mathrm{X}(5568)} $ state. |

png pdf |
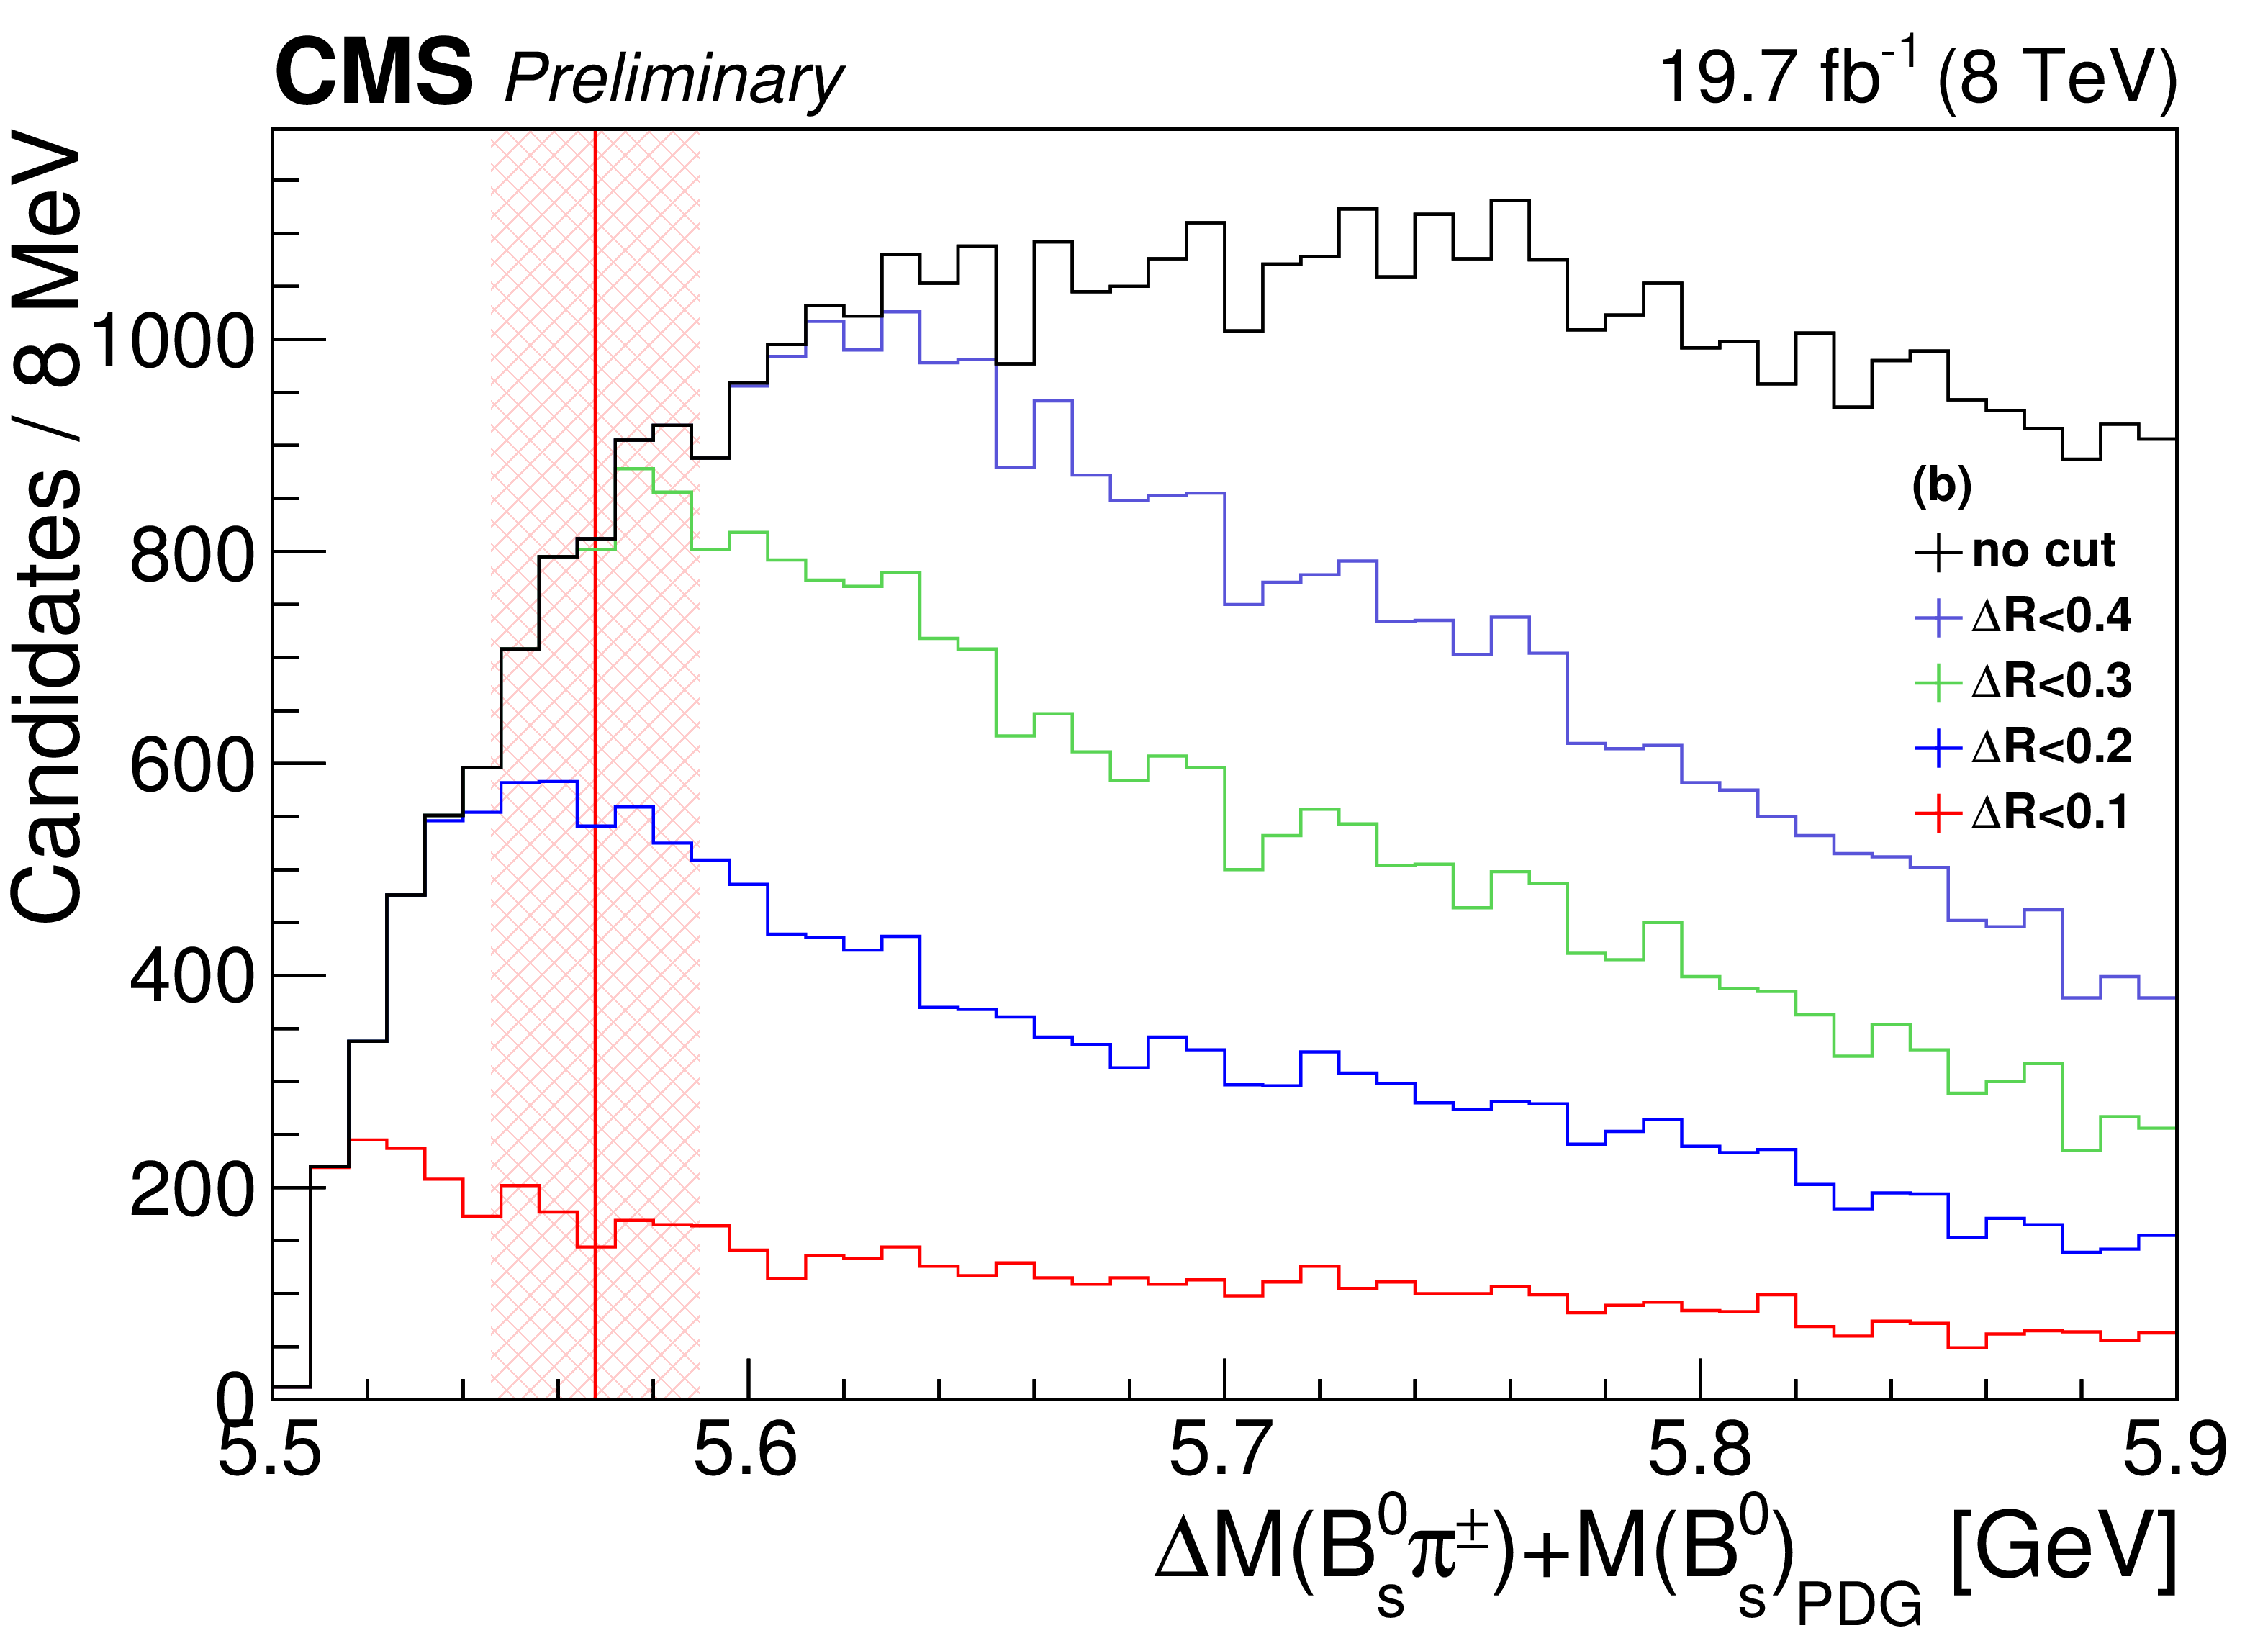
Figure 3-a:
$ {M^{\Delta }( { { {\mathrm {B}} ^0_ {\mathrm {s}} } { {\pi } ^\pm } } )} $ distribution of events in (a) the ${ {\mathrm {B}} ^0_ {\mathrm {s}} }$ signal region and (b) ${ {\mathrm {B}} ^0_ {\mathrm {s}} }$ sidebands with different $\Delta R$ (cone cut) requirements: no cut (black), $\Delta R < $ 0.4 (violet), $\Delta R <$ 0.3 (green), $\Delta R <$ 0.2 (blue) and $\Delta R < $ 0.1 (red). The uncertainties are not shown for the sake of clarity. The (red) vertical band indicates the region $M_{\mathrm{X}}\pm \Gamma _{\mathrm{X}}$ around the mass of the claimed $ {\mathrm{X}(5568)} $ state. |
png pdf |
Figure 3-b:
$ {M^{\Delta }( { { {\mathrm {B}} ^0_ {\mathrm {s}} } { {\pi } ^\pm } } )} $ distribution of events in (a) the ${ {\mathrm {B}} ^0_ {\mathrm {s}} }$ signal region and (b) ${ {\mathrm {B}} ^0_ {\mathrm {s}} }$ sidebands with different $\Delta R$ (cone cut) requirements: no cut (black), $\Delta R < $ 0.4 (violet), $\Delta R <$ 0.3 (green), $\Delta R <$ 0.2 (blue) and $\Delta R < $ 0.1 (red). The uncertainties are not shown for the sake of clarity. The (red) vertical band indicates the region $M_{\mathrm{X}}\pm \Gamma _{\mathrm{X}}$ around the mass of the claimed $ {\mathrm{X}(5568)} $ state. |
png pdf |
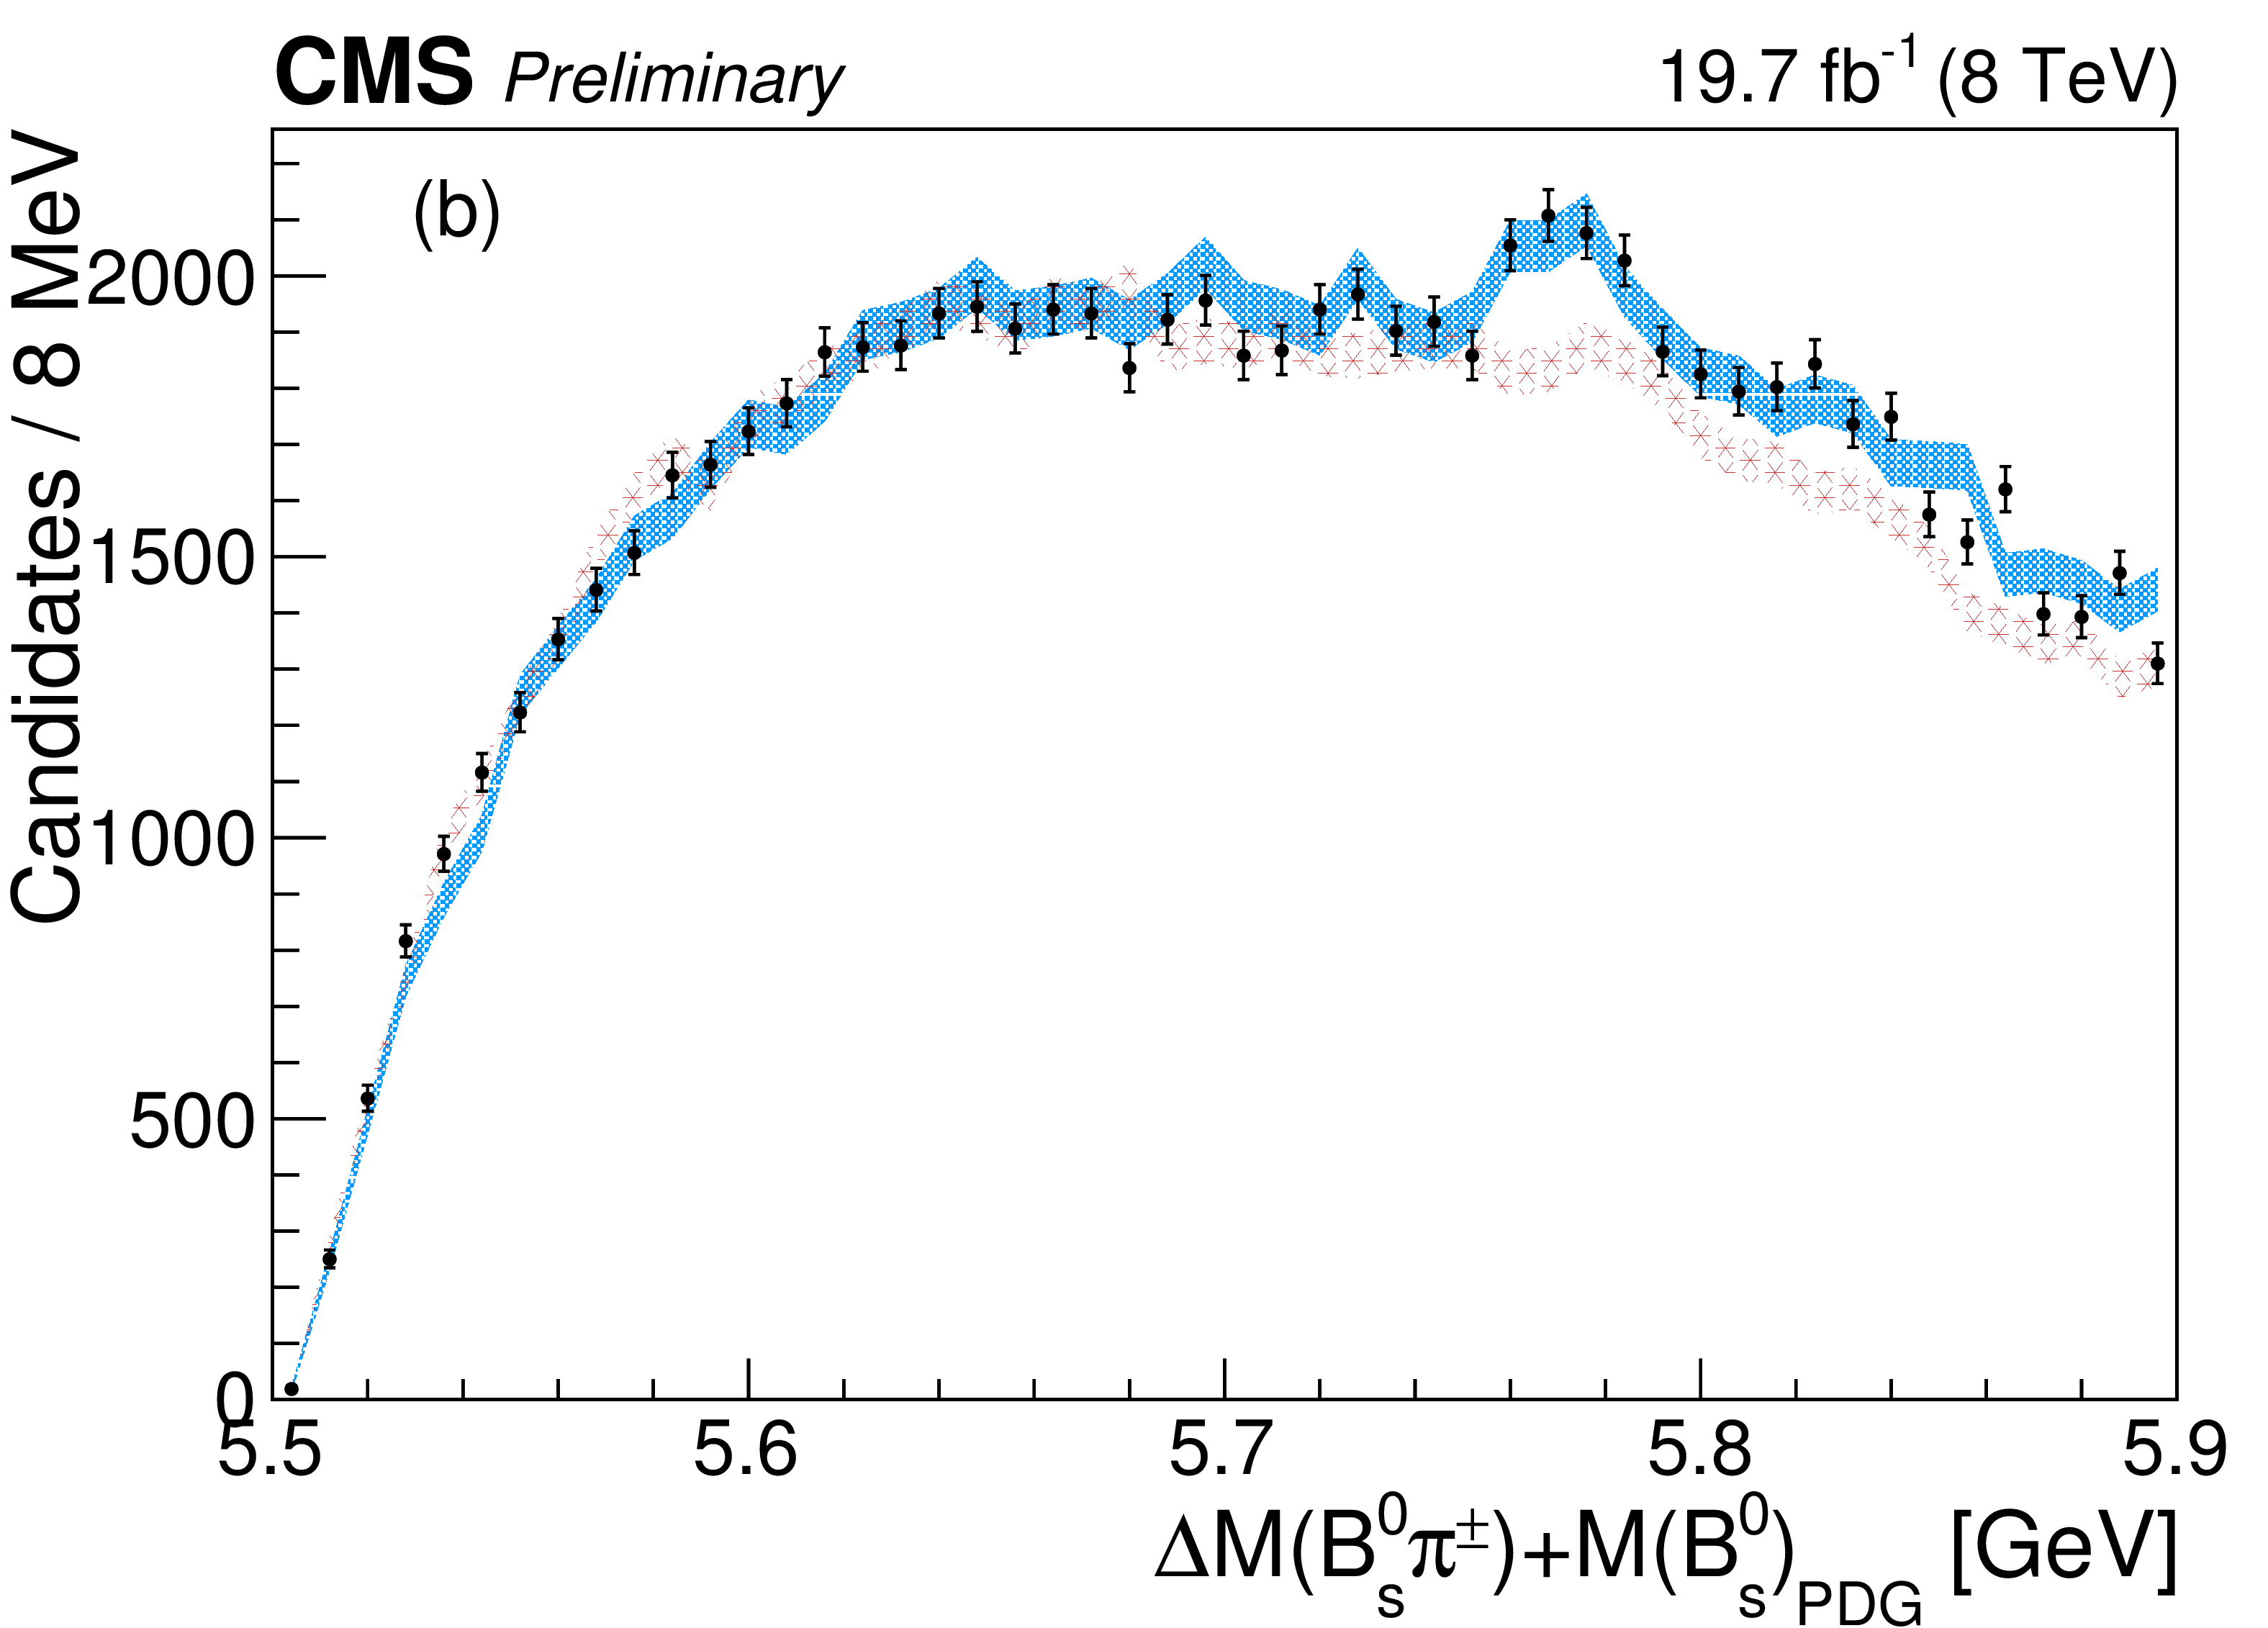
Figure 4-a:
(a) $ { {\mathrm {J}/\psi } { { {\mathrm {K}}} ^+} { { {\mathrm {K}}} ^-} } $ invariant mass distribution for events with the $ { { {\mathrm {K}}} ^+} { { {\mathrm {K}}} ^-} $ invariant mass window removed and $ { {p_{\mathrm {T}}} ( { {\mathrm {B}} ^0_ {\mathrm {s}} } )} >$ 25 GeV, $ { {p_{\mathrm {T}}} ( { {\pi } ^\pm } )} > $ 1 GeV, $ {p_{\mathrm {T}}} ( { { {\mathrm {K}}} ^\pm } )>$ 1 GeV. The $ { { {\mathrm {B}} ^0} \to {\mathrm {J}/\psi } { { {\mathrm {K}}} ^+} { {\pi } ^-} } $ decay contaminates the signal and the right sideband regions. (b) The corresponding $ {M^{\Delta }( { { {\mathrm {B}} ^0_ {\mathrm {s}} } { {\pi } ^\pm } } )} $ distributions for the ${ {\mathrm {B}} ^0_ {\mathrm {s}} }$ signal (black points with error bars), ${ {\mathrm {B}} ^0_ {\mathrm {s}} }$ left sideband (red band, made of stars) and ${ {\mathrm {B}} ^0_ {\mathrm {s}} }$ right sideband (blue dotted band) regions. All distributions are equally normalized from the mass threshold up to 5.74 GeV. Contributions from $ { {\mathrm {B}} ^{(*)}_{1,2}{}^+} \to { {\mathrm {B}} ^{(*)0}} { {\pi } ^+} $ decays (and charge-conjugates) are seen around $ {M^{\Delta }( { { {\mathrm {B}} ^0_ {\mathrm {s}} } { {\pi } ^\pm } } )} \sim $ 5.77 GeV and higher masses coming only from the ${ {\mathrm {B}} ^0_ {\mathrm {s}} }$ signal and right sideband regions. |
png pdf |
Figure 4-b:
(a) $ { {\mathrm {J}/\psi } { { {\mathrm {K}}} ^+} { { {\mathrm {K}}} ^-} } $ invariant mass distribution for events with the $ { { {\mathrm {K}}} ^+} { { {\mathrm {K}}} ^-} $ invariant mass window removed and $ { {p_{\mathrm {T}}} ( { {\mathrm {B}} ^0_ {\mathrm {s}} } )} >$ 25 GeV, $ { {p_{\mathrm {T}}} ( { {\pi } ^\pm } )} > $ 1 GeV, $ {p_{\mathrm {T}}} ( { { {\mathrm {K}}} ^\pm } )>$ 1 GeV. The $ { { {\mathrm {B}} ^0} \to {\mathrm {J}/\psi } { { {\mathrm {K}}} ^+} { {\pi } ^-} } $ decay contaminates the signal and the right sideband regions. (b) The corresponding $ {M^{\Delta }( { { {\mathrm {B}} ^0_ {\mathrm {s}} } { {\pi } ^\pm } } )} $ distributions for the ${ {\mathrm {B}} ^0_ {\mathrm {s}} }$ signal (black points with error bars), ${ {\mathrm {B}} ^0_ {\mathrm {s}} }$ left sideband (red band, made of stars) and ${ {\mathrm {B}} ^0_ {\mathrm {s}} }$ right sideband (blue dotted band) regions. All distributions are equally normalized from the mass threshold up to 5.74 GeV. Contributions from $ { {\mathrm {B}} ^{(*)}_{1,2}{}^+} \to { {\mathrm {B}} ^{(*)0}} { {\pi } ^+} $ decays (and charge-conjugates) are seen around $ {M^{\Delta }( { { {\mathrm {B}} ^0_ {\mathrm {s}} } { {\pi } ^\pm } } )} \sim $ 5.77 GeV and higher masses coming only from the ${ {\mathrm {B}} ^0_ {\mathrm {s}} }$ signal and right sideband regions. |
png pdf |
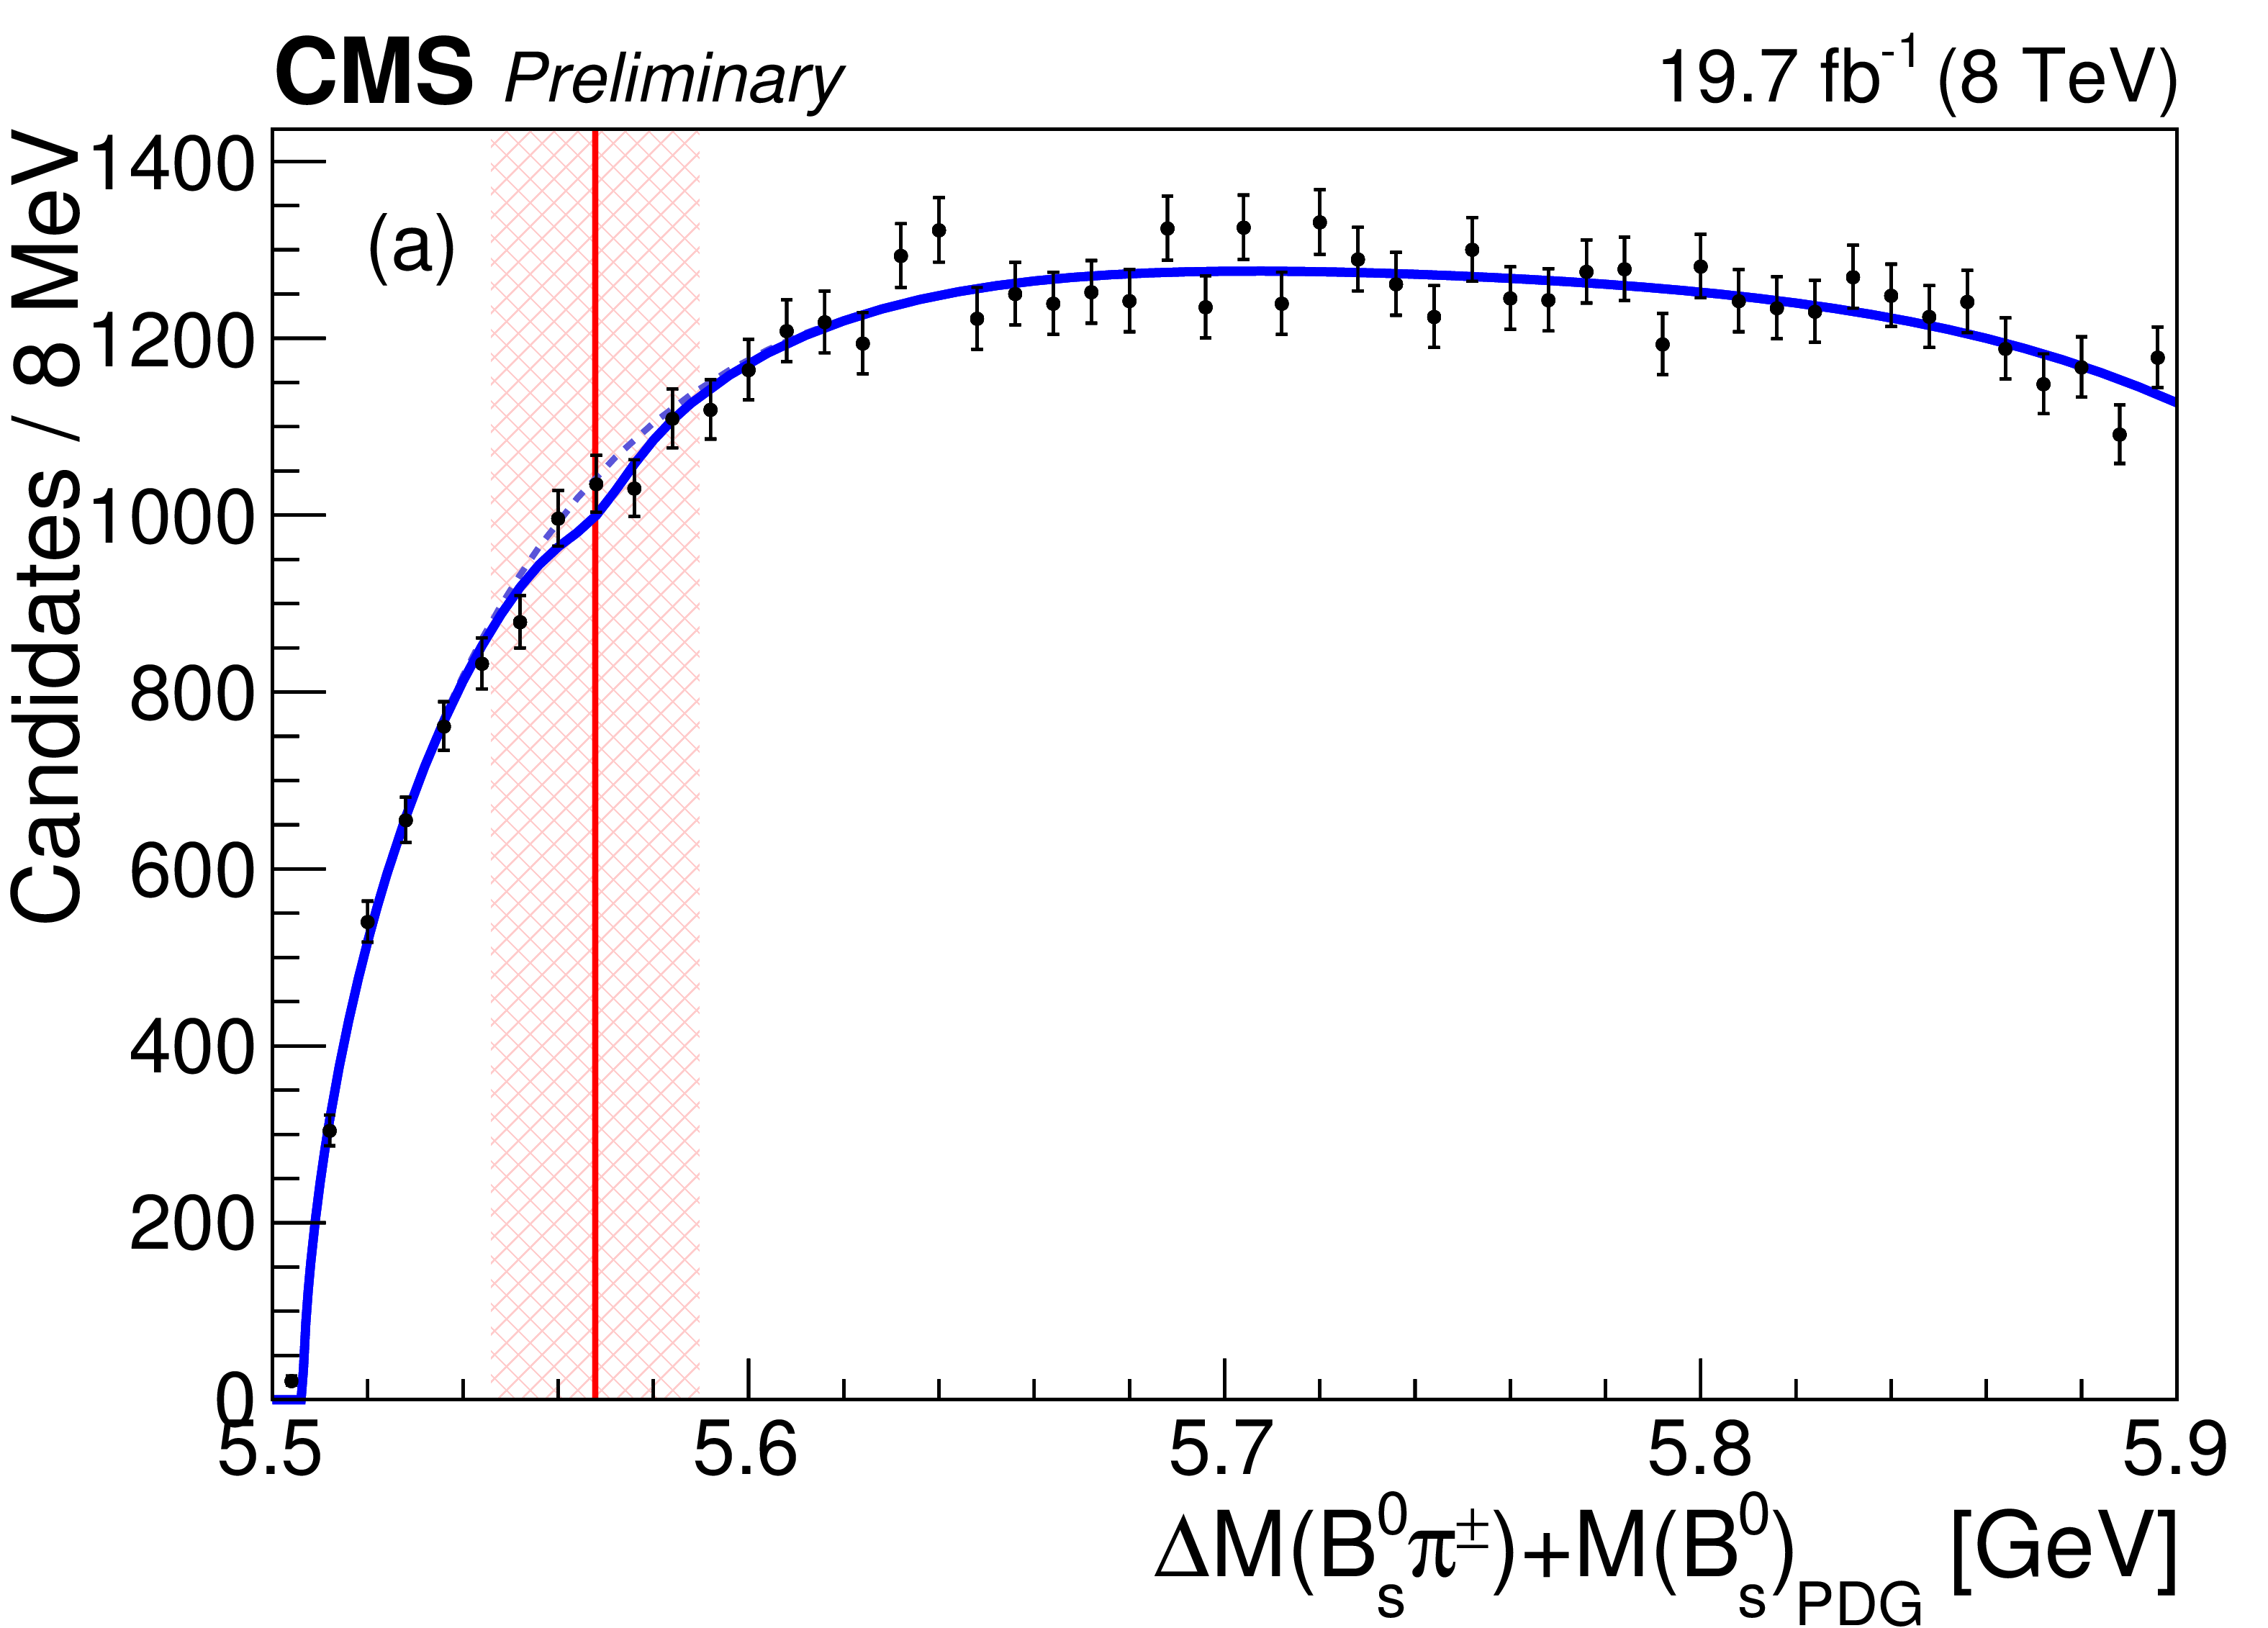
Figure 5-a:
(a) $ {M^{\Delta }( { { {\mathrm {B}} ^0_ {\mathrm {s}} } { {\pi } ^\pm } } )} $ distribution of events in the ${ {\mathrm {B}} ^0_ {\mathrm {s}} }$ 4 signal region (black points with error bars) with fit results superimposed (blue line). (b) The pull distribution for (a). The (red) vertical band indicates the region $ M_{\mathrm{X}} \pm \Gamma _{\mathrm{X}} $ around the mass of the claimed $ {\mathrm{X}(5568)} $ state. |
png pdf |
Figure 5-b:
(a) $ {M^{\Delta }( { { {\mathrm {B}} ^0_ {\mathrm {s}} } { {\pi } ^\pm } } )} $ distribution of events in the ${ {\mathrm {B}} ^0_ {\mathrm {s}} }$ 4 signal region (black points with error bars) with fit results superimposed (blue line). (b) The pull distribution for (a). The (red) vertical band indicates the region $ M_{\mathrm{X}} \pm \Gamma _{\mathrm{X}} $ around the mass of the claimed $ {\mathrm{X}(5568)} $ state. |
| Summary |
|
A search for the $\mathrm{X}(5568)$ state was performed by the CMS collaboration using 19.7 fb$^{-1}$ of pp collision data, collected at $\sqrt{s} =$ 8 TeV. Using a sample of about 48,000 $\mathrm{B}^0_\mathrm{s}$ signal candidates, the $\mathrm{B}^0_\mathrm{s} \pi^+$ invariant mass spectrum is investigated. No significant structure is found around the mass claimed by the D0 Collaboration. The reconstruction procedure of the $\mathrm{X}(5568) \to \mathrm{B}^0_\mathrm{s} \pi^\pm$ candidates is verified using the decay channels $\mathrm{B}^{(*)+}_{1,2} \to\mathrm{B}^{(*)0}\pi^+$, which share a similar decay topology with $\mathrm{X}(5568) \to \mathrm{B}^0_\mathrm{s} \pi^\pm$ and are prominent in data. The absence of a peak is supported by the direct comparison with the events in the $\mathrm{B}^0_\mathrm{s}$ sidebands, and by fits to the $\mathrm{B}^0_\mathrm{s} \pi^+$ invariant mass distribution with an $\mathrm{X}(5568)$ component included, using different kinematic selection requirements as well as variants of the background modeling, fit regions, and quality criteria. In every case the obtained yield of $\mathrm{X}(5568)$ is consistent with zero. An estimation of the upper limit on an $\mathrm{X}(5568)$ signal event yield was carried out, resulting in at most 198 at 95% CL. The evaluation of an upper limit on $\rho_{\mathrm{X}}$, which is the relative production rate of $\mathrm{X}(5568)$ with respect to $\mathrm{B}^0_\mathrm{s}$ multiplied by the unknown branching fraction of the $\mathrm{X}(5568)^{\pm} \to \mathrm{B}^0_\mathrm{s} \pi^{\pm}$ decay, is carried out using the formula |
| References | ||||
| 1 | D0 Collaboration | Evidence for a $ B_s^0 \pi^\pm $ state | PRL (2016) , [PRLett.117,022003(2016)] | 1602.07588 |
| 2 | F.-K. Guo, U.-G. Mei$\beta$ner, and B.-S. Zou | How the X(5568) challenges our understanding of QCD | Commun. Theor. Phys. 65 (2016), no. 5, 593--595 | 1603.06316 |
| 3 | T. J. Burns and E. S. Swanson | Interpreting the $ X(5568) $ | 1603.04366 | |
| 4 | Karliner, Marek | Doubly Heavy Tetraquarks and Baryons | EPJ Web of Conferences 71 (2014) 00065 | |
| 5 | LHCb Collaboration | Search for structure in the $ B_s^0\pi^\pm $ invariant mass spectrum | LHCb-CONF-2016-004 | |
| 6 | CMS Collaboration | Description and performance of track and primary-vertex reconstruction with the CMS tracker | JINST 9 (2014) P10009 | CMS-TRK-11-001 1405.6569 |
| 7 | CMS Collaboration | Performance of CMS muon reconstruction in $ pp $ collision events at $ \sqrt{s} = 7 $$ TeV $ | JINST 7 (2012) P10002 | CMS-MUO-10-004 1206.4071 |
| 8 | CMS Collaboration | The CMS experiment at the CERN LHC | JINST 3 (2008) S08004 | CMS-00-001 |
| 9 | CMS Collaboration | Measurement of the CP-violating weak phase $ \phi_s $ and the decay width difference $ \Delta \Gamma_s $ using the B$ _s^0 \to J/\psi\phi $(1020) decay channel in pp collisions at $ \sqrt{s}= $ 8 TeV | PLB757 (2016) 97--120 | CMS-BPH-13-012 1507.07527 |
| 10 | Particle Data Group Collaboration | Review of Particle Physics | CPC38 (2014) 090001 | |
| 11 | The ATLAS Collaboration, The CMS Collaboration, The LHC Higgs Combination Group Collaboration | Procedure for the LHC Higgs boson search combination in Summer 2011 | CMS-NOTE-2011-005 | |
| 12 | A. L. Read | Presentation of search results: The CL$ _{S} $ technique | JPG28 (2002) 2693--2704, .[,11(2002)] | |
| 13 | T. Junk | Confidence level computation for combining searches with small statistics | Nuclear Instruments and Methods in Physics Research Section A: Accelerators, Spectrometers, Detectors and Associated Equipment 434 (1999), no. 2, 435 -- 443 | |
|
|
Compact Muon Solenoid LHC, CERN |
|

|

|

|

|

|