

Compact Muon Solenoid
LHC, CERN
| CMS-PAS-EXO-16-005 | ||
| Search for dark matter in association with a top quark pair at $\sqrt{s} = $ 13 TeV | ||
| CMS Collaboration | ||
| August 2016 | ||
| Abstract: A search is presented for an excess of events with large missing transverse momentum produced in association with top quarks in a data sample of proton-proton interactions at centre-of-mass energy of 13 TeV. The data correspond to an integrated luminosity of 2.2 fb$^{-1}$ collected by the CMS detector at the LHC in 2015. Results are interpreted in the context of dark matter production, and constraints are placed on the parameter space of simplified models. | ||
|
Links:
CDS record (PDF) ;
inSPIRE record ;
CADI line (restricted) ;
These preliminary results are superseded in this paper, EPJC 77 (2017) 845. The superseded preliminary plots can be found here. |
||
| Figures & Tables | Summary | Additional Figures | References | CMS Publications |
|---|
| Figures | |
png |
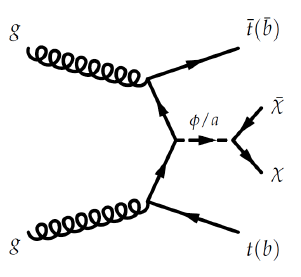
Figure 1:
The dominant contribution to the $\mathrm{ t \bar{t} }+\textrm {DM}$ process with a spin-0 mediator in the simplified model scheme. |
png pdf |
Figure 2-a:
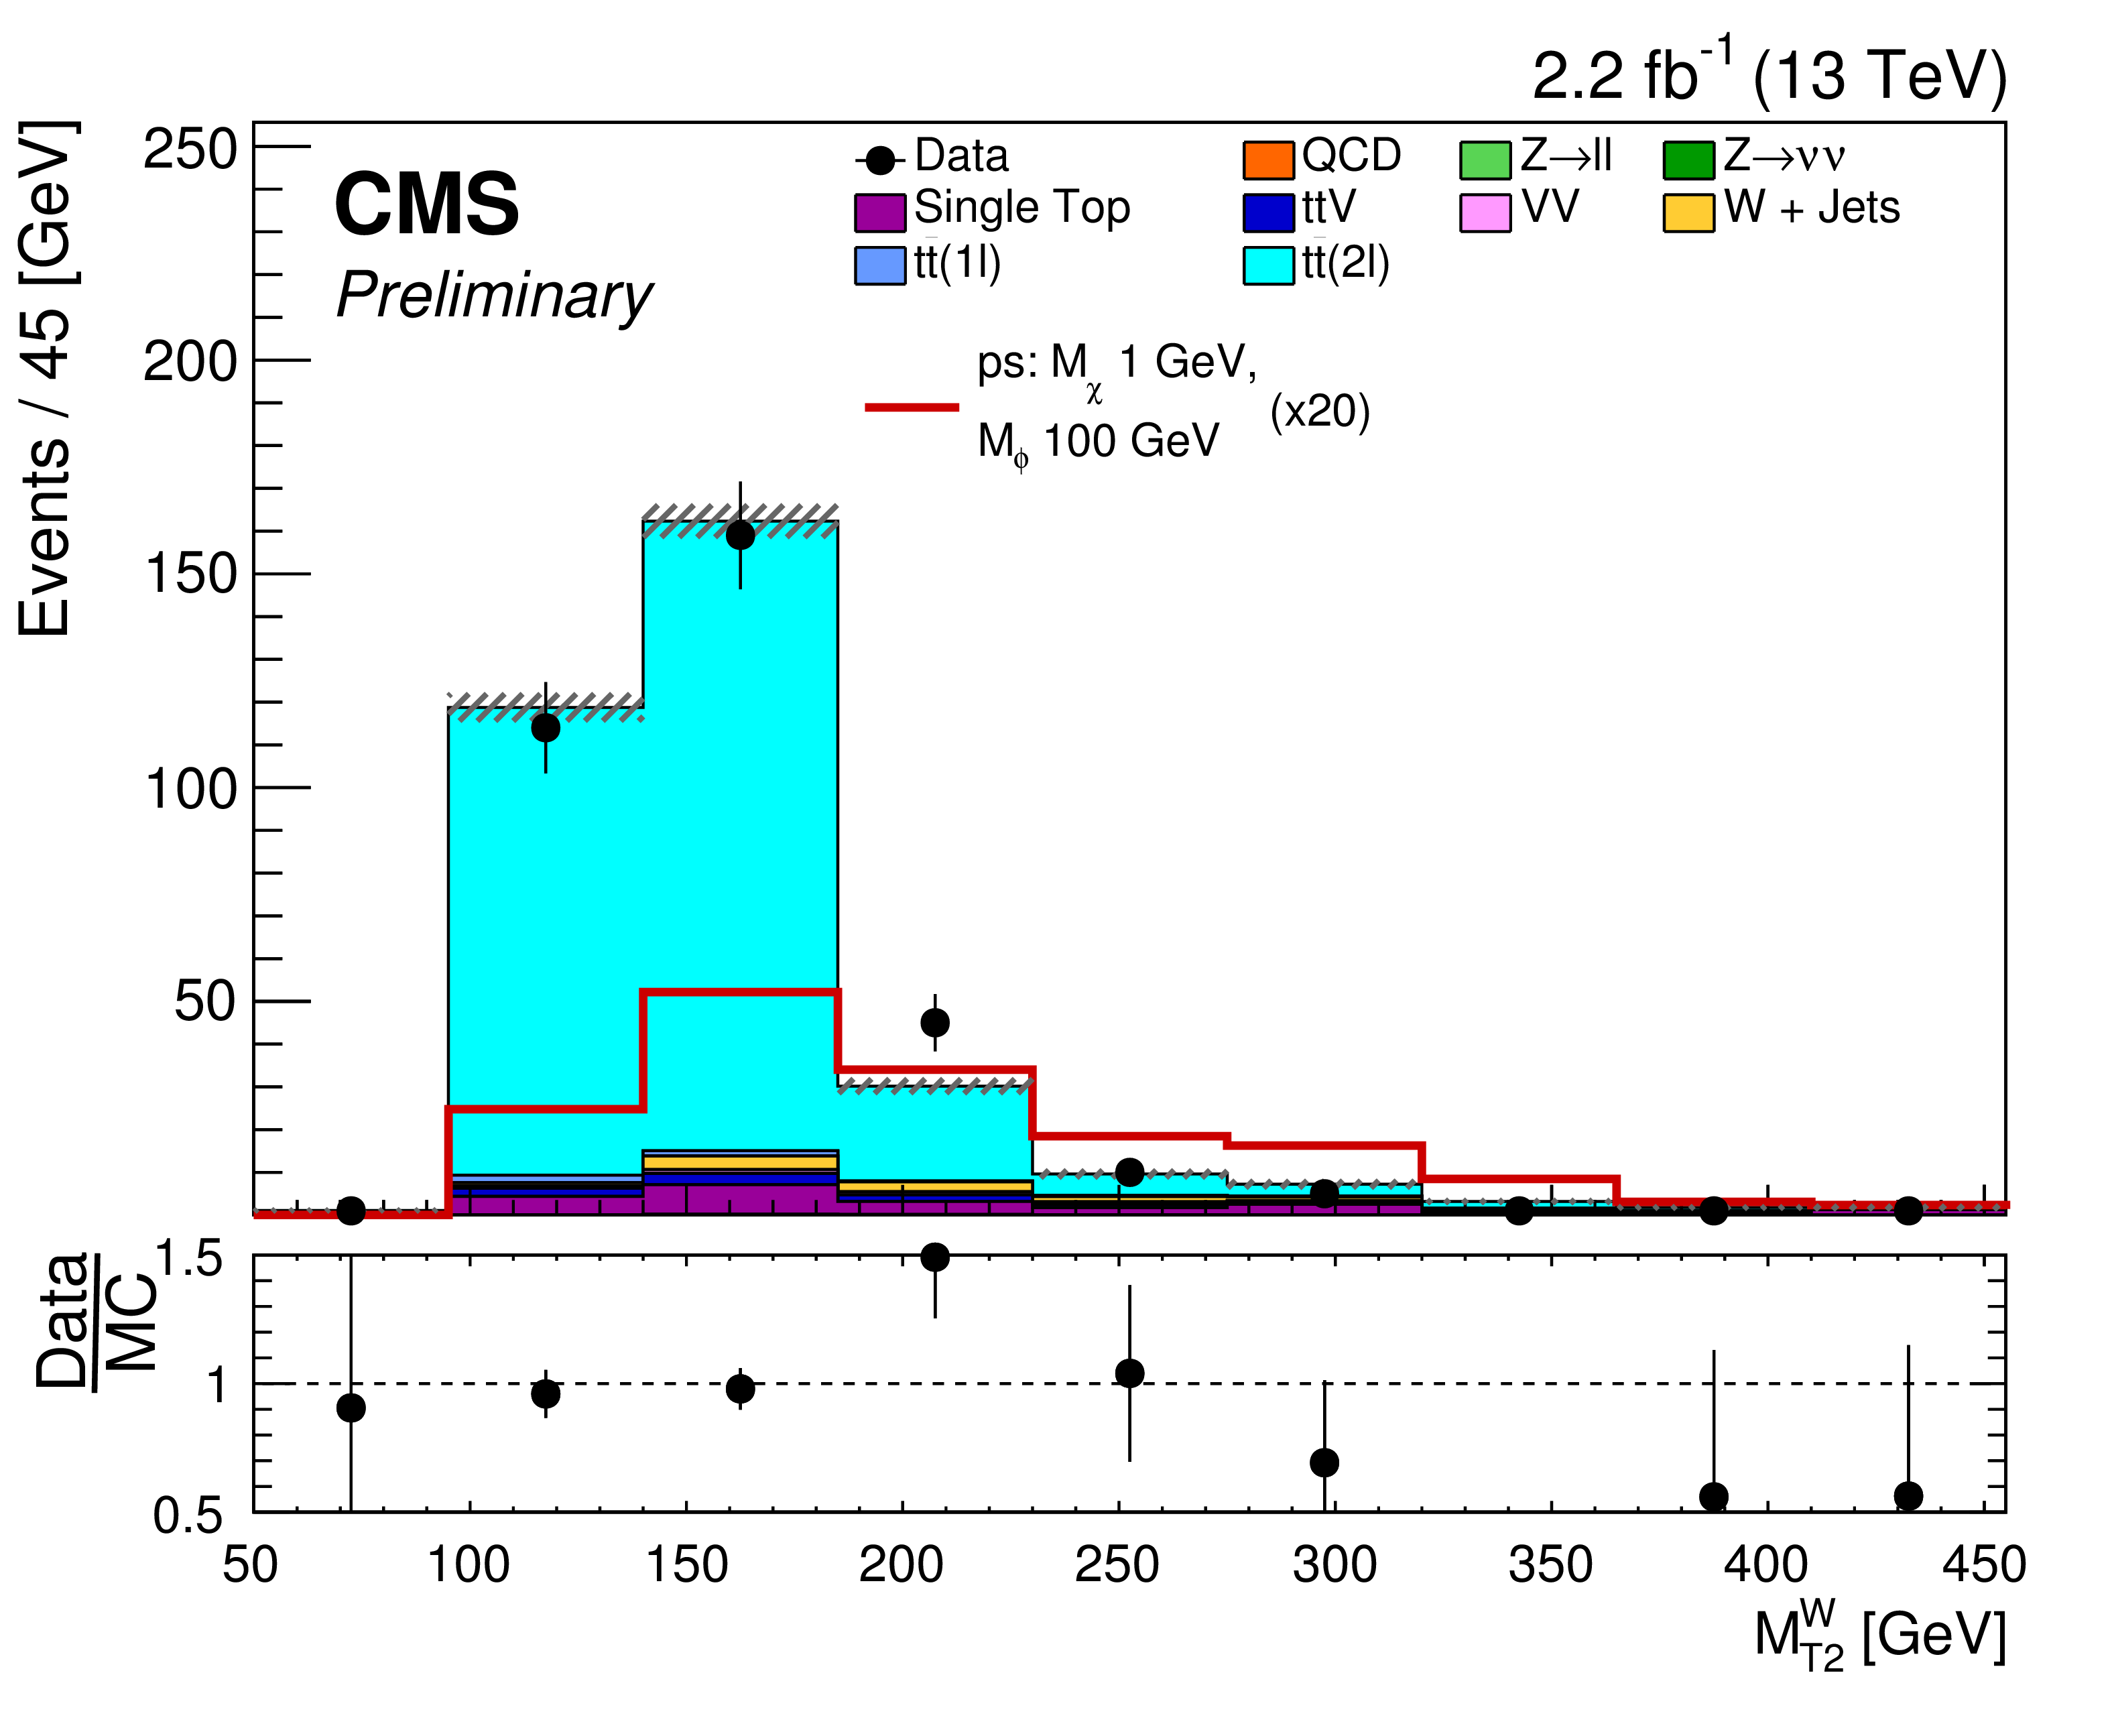
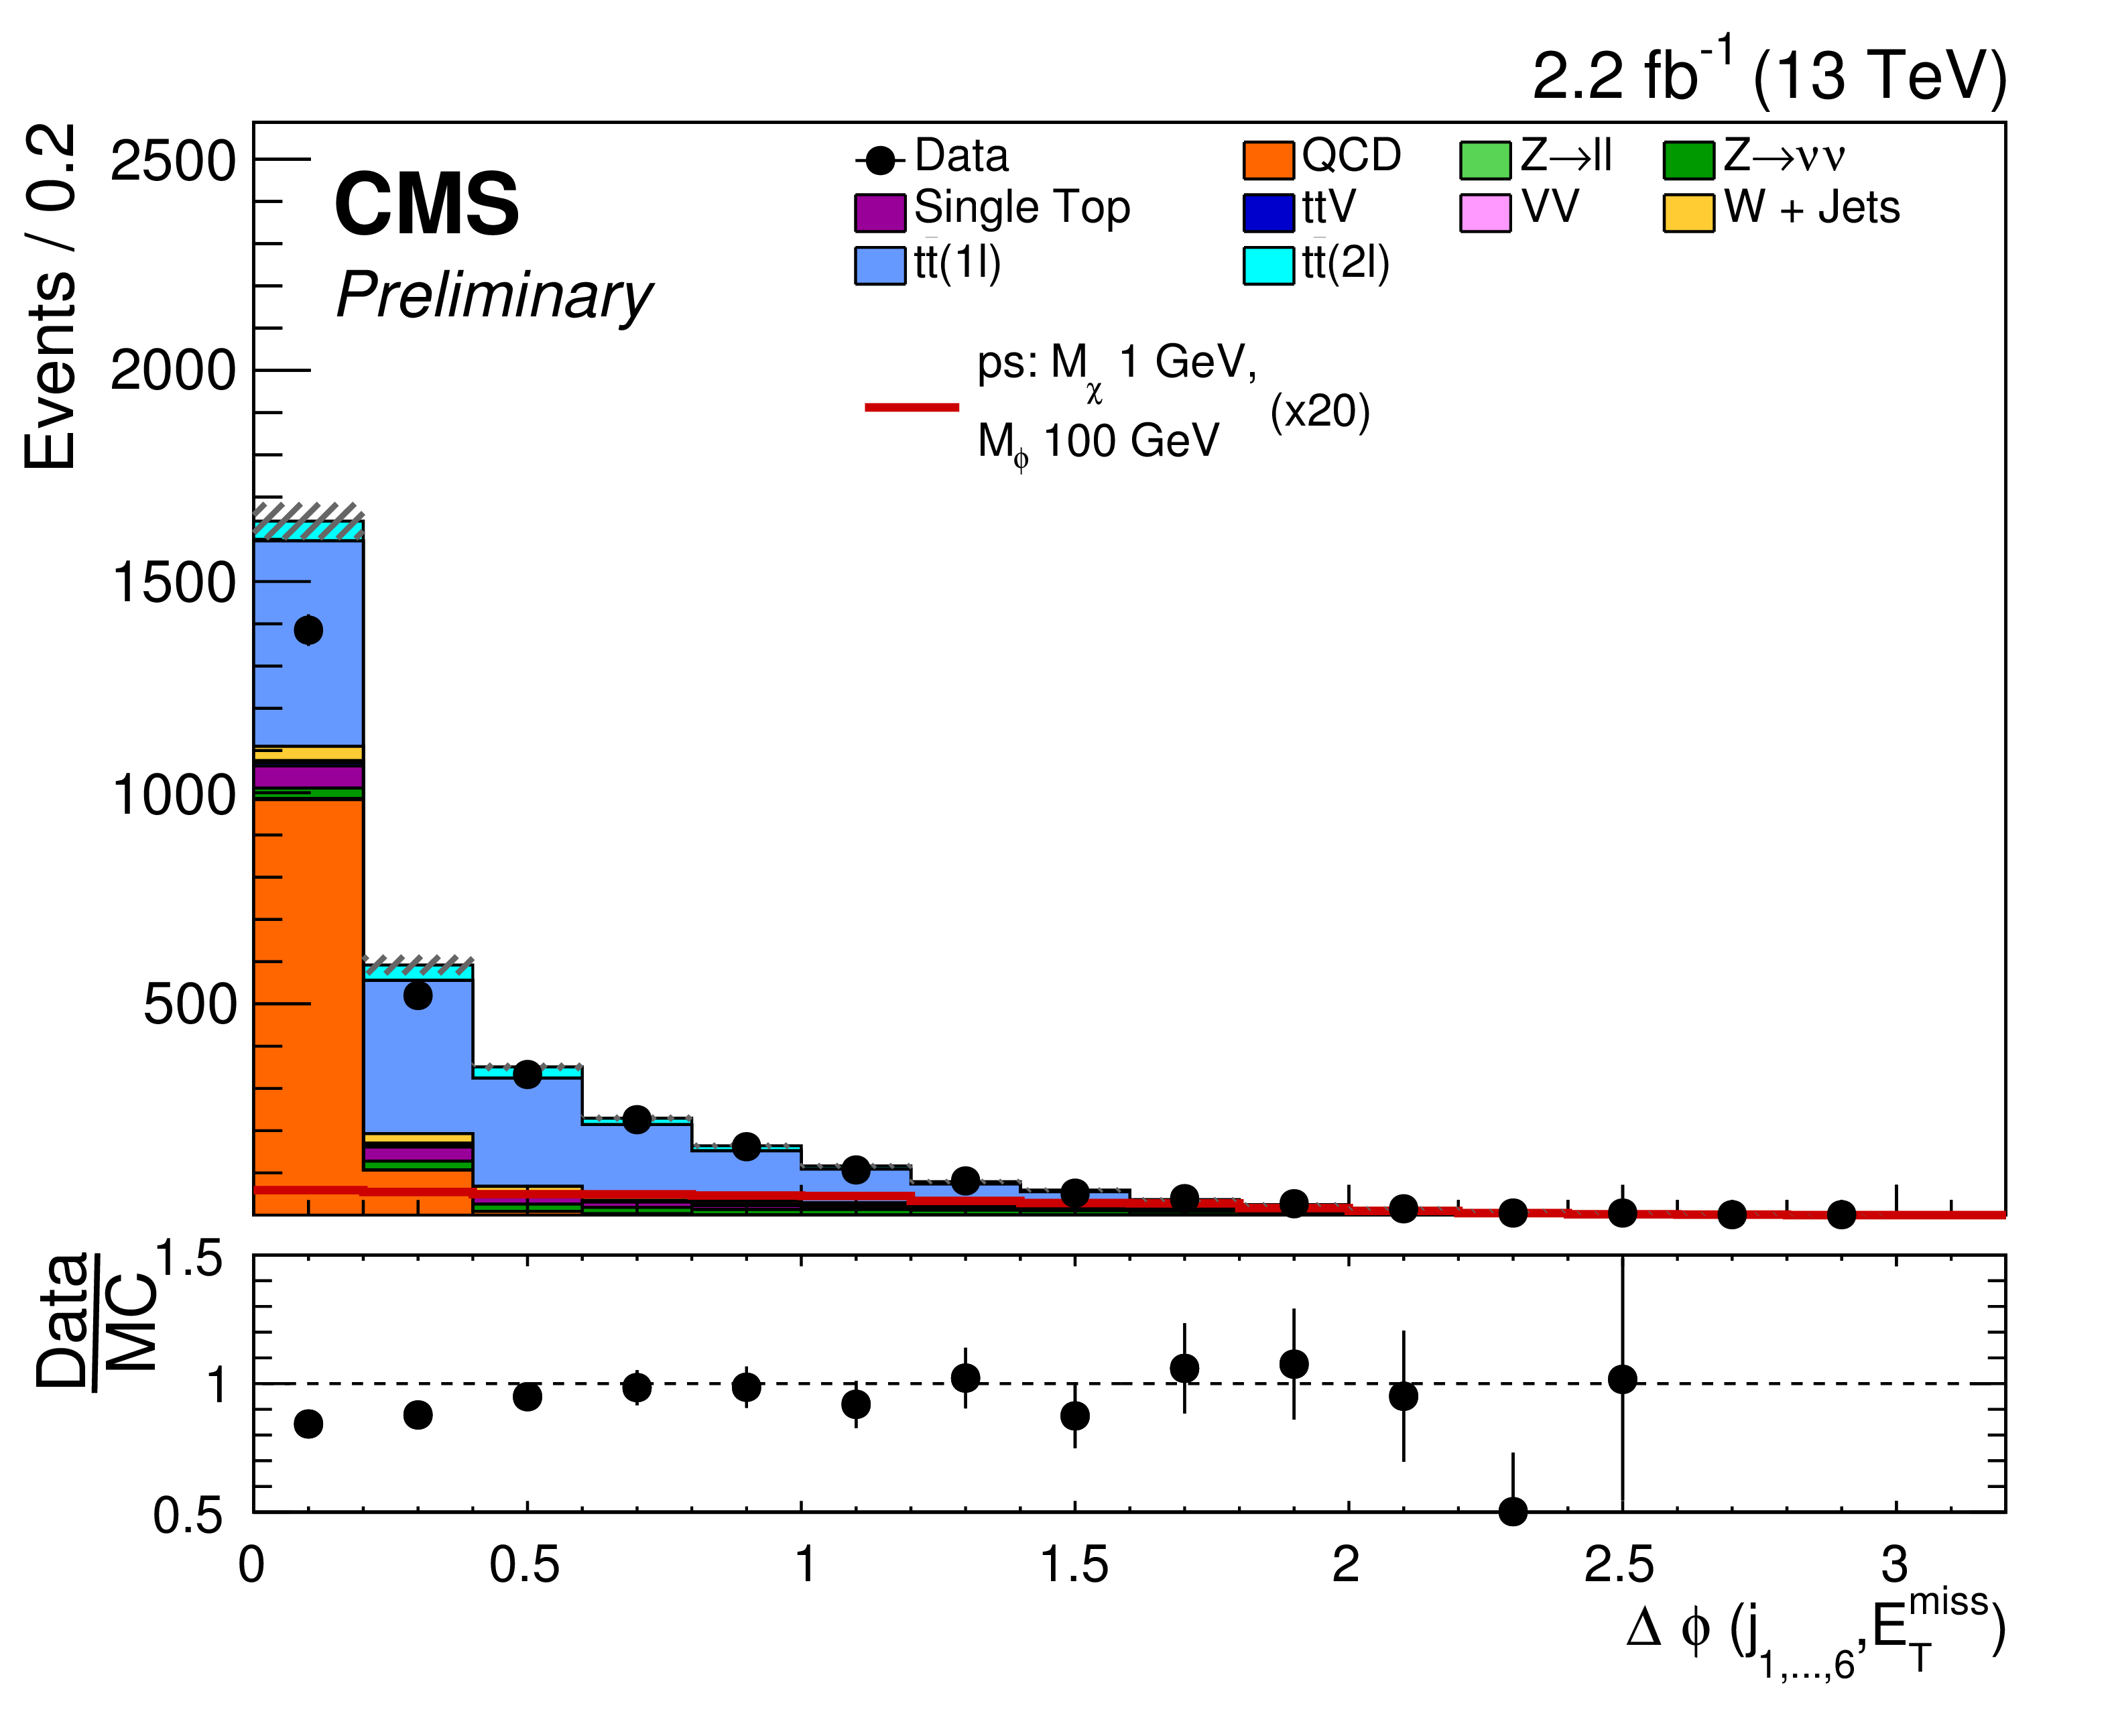
(a) Distribution of the $M^{W}_{T2}$ variable in the semileptonic search after all other selection requirements are applied. (b) Distribution of $\text{min}_{i}\Delta \phi (\textrm {jet}_{i}, {E_{\mathrm {T}}^{\text {miss}}} )$ in the inclusive hadronic channel after all other selection requirements are applied. The gray dashed band indicates the statistical uncertainty on the predicted background. A model for DM production with pseudoscalar $m_{\mathrm {MED}}=$ 100 GeV and $m_{\mathrm {DM}}=$ 1 GeV is also shown. Note that the signal expectation is scaled by a factor of 100 in the plots. |
png pdf |
Figure 2-b:
(a) Distribution of the $M^{W}_{T2}$ variable in the semileptonic search after all other selection requirements are applied. (b) Distribution of $\text{min}_{i}\Delta \phi (\textrm {jet}_{i}, {E_{\mathrm {T}}^{\text {miss}}} )$ in the inclusive hadronic channel after all other selection requirements are applied. The gray dashed band indicates the statistical uncertainty on the predicted background. A model for DM production with pseudoscalar $m_{\mathrm {MED}}=$ 100 GeV and $m_{\mathrm {DM}}=$ 1 GeV is also shown. Note that the signal expectation is scaled by a factor of 100 in the plots. |
png pdf |
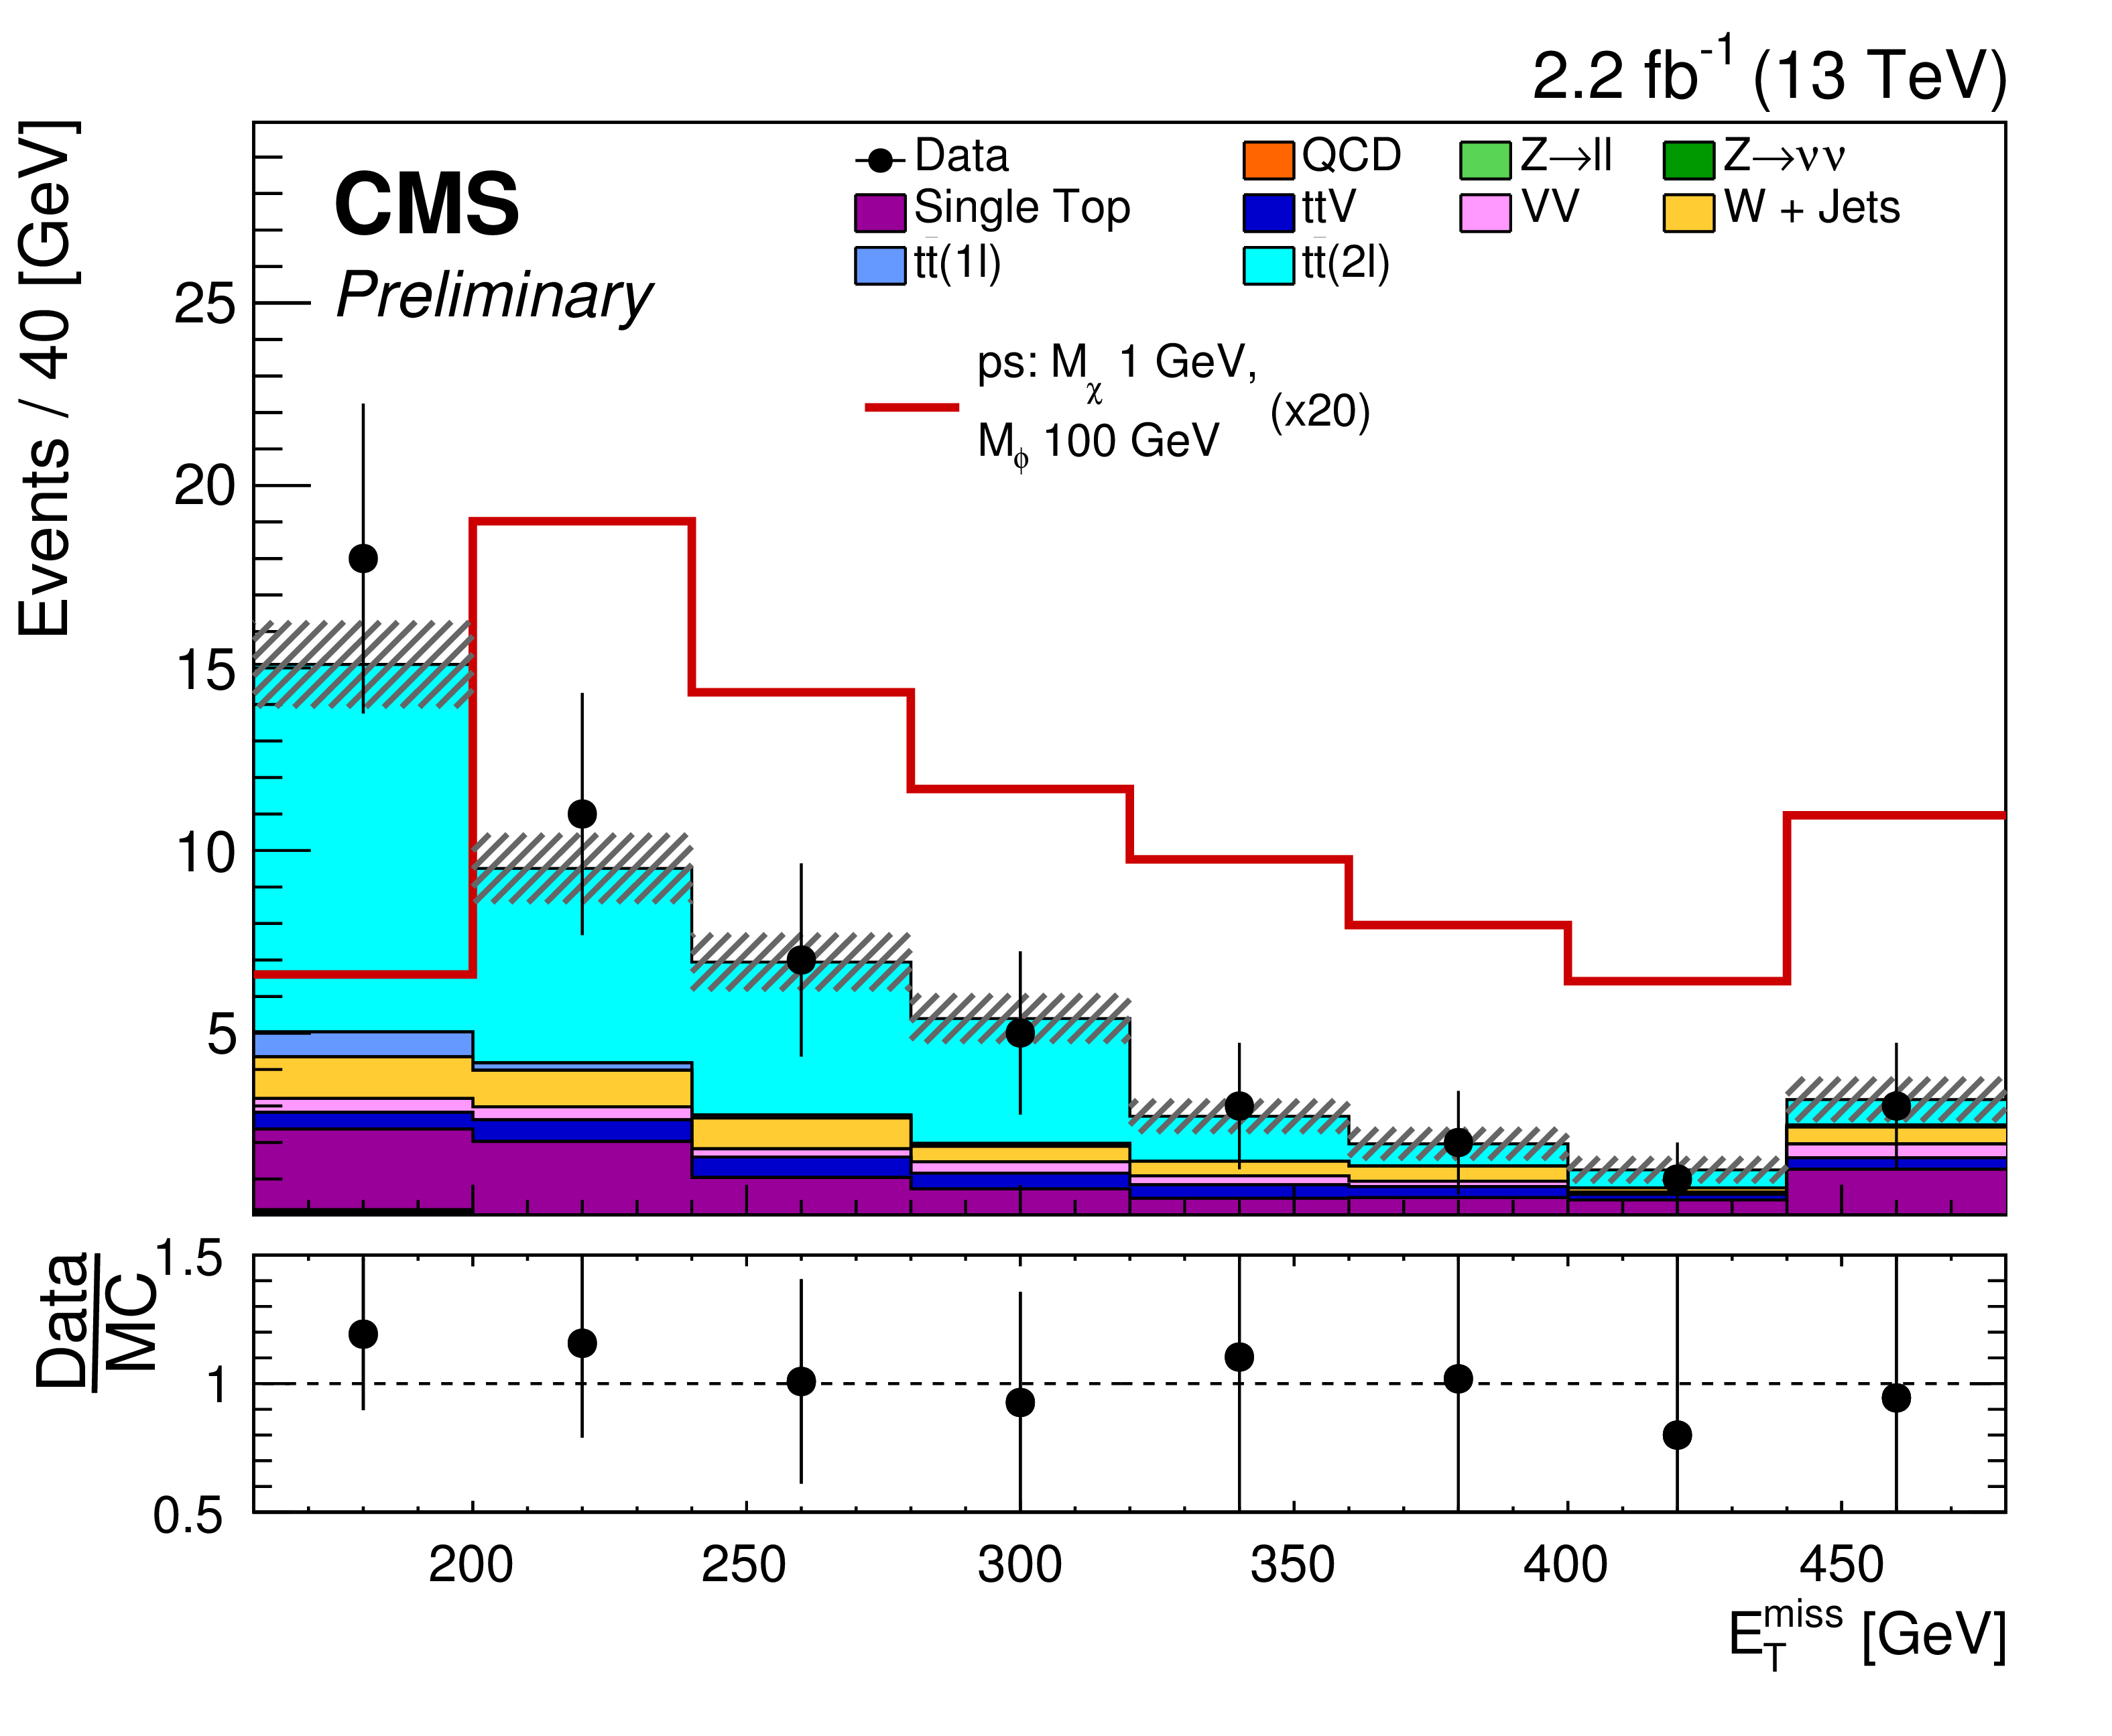
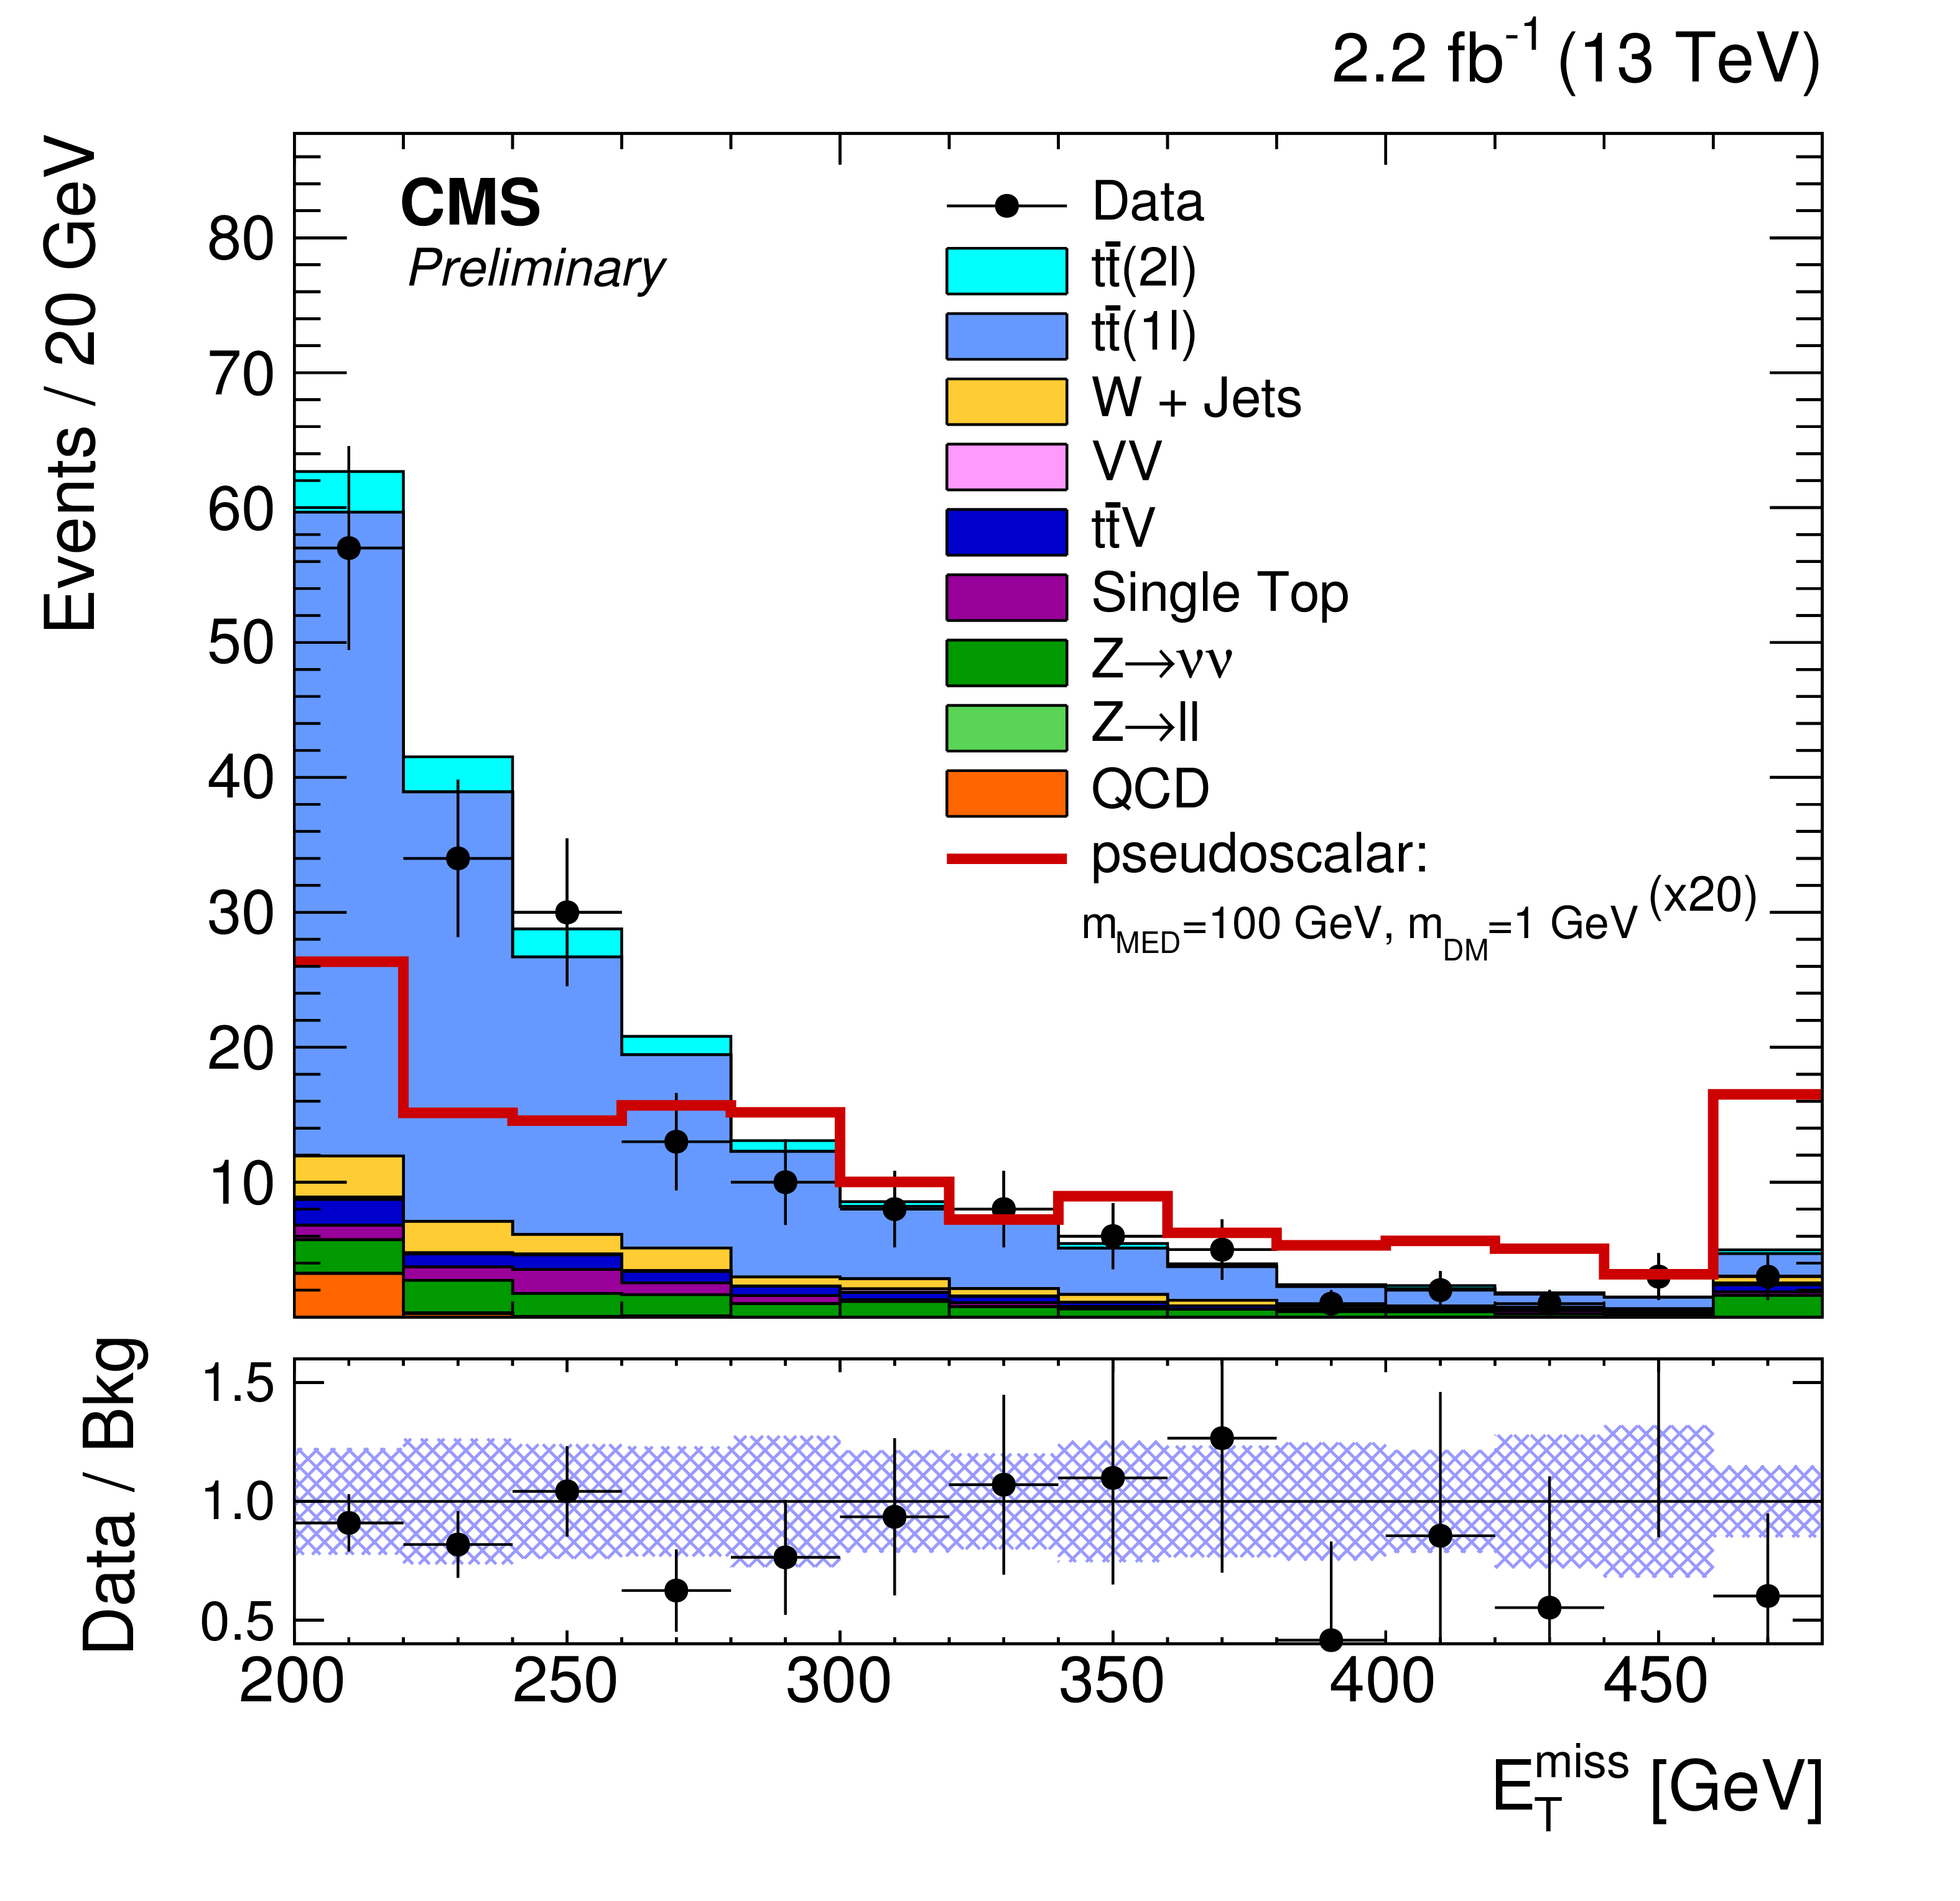
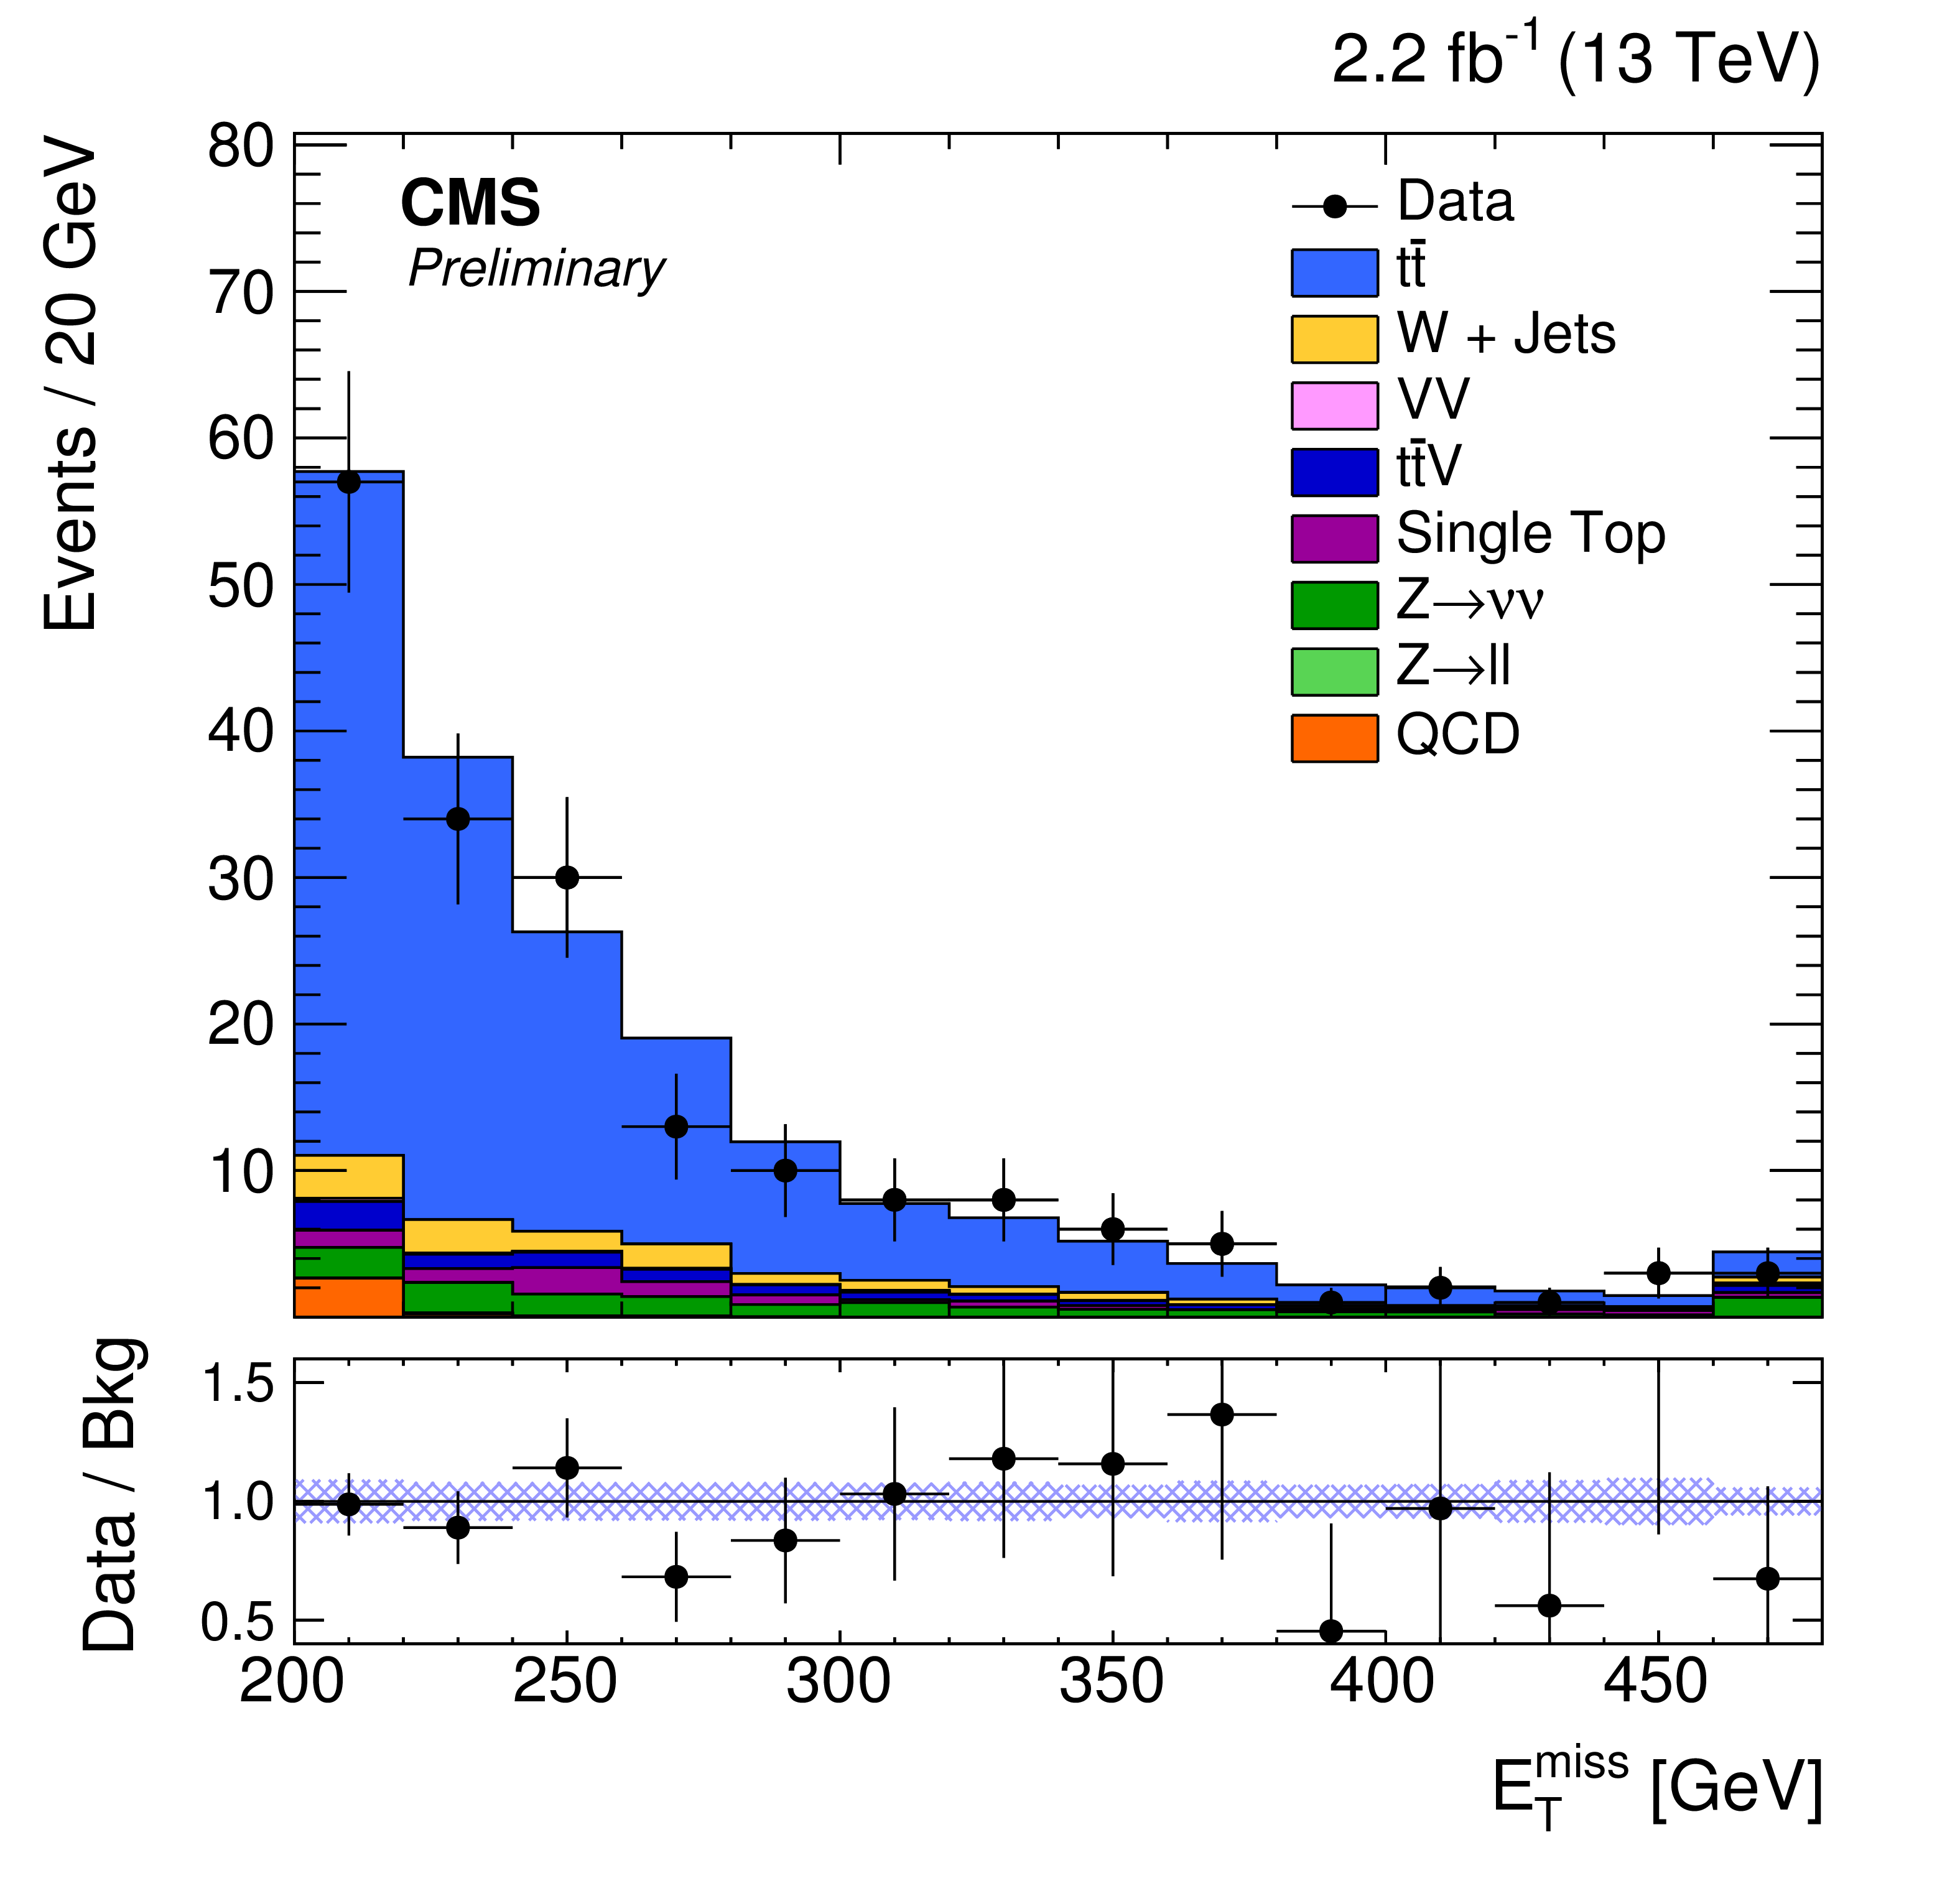
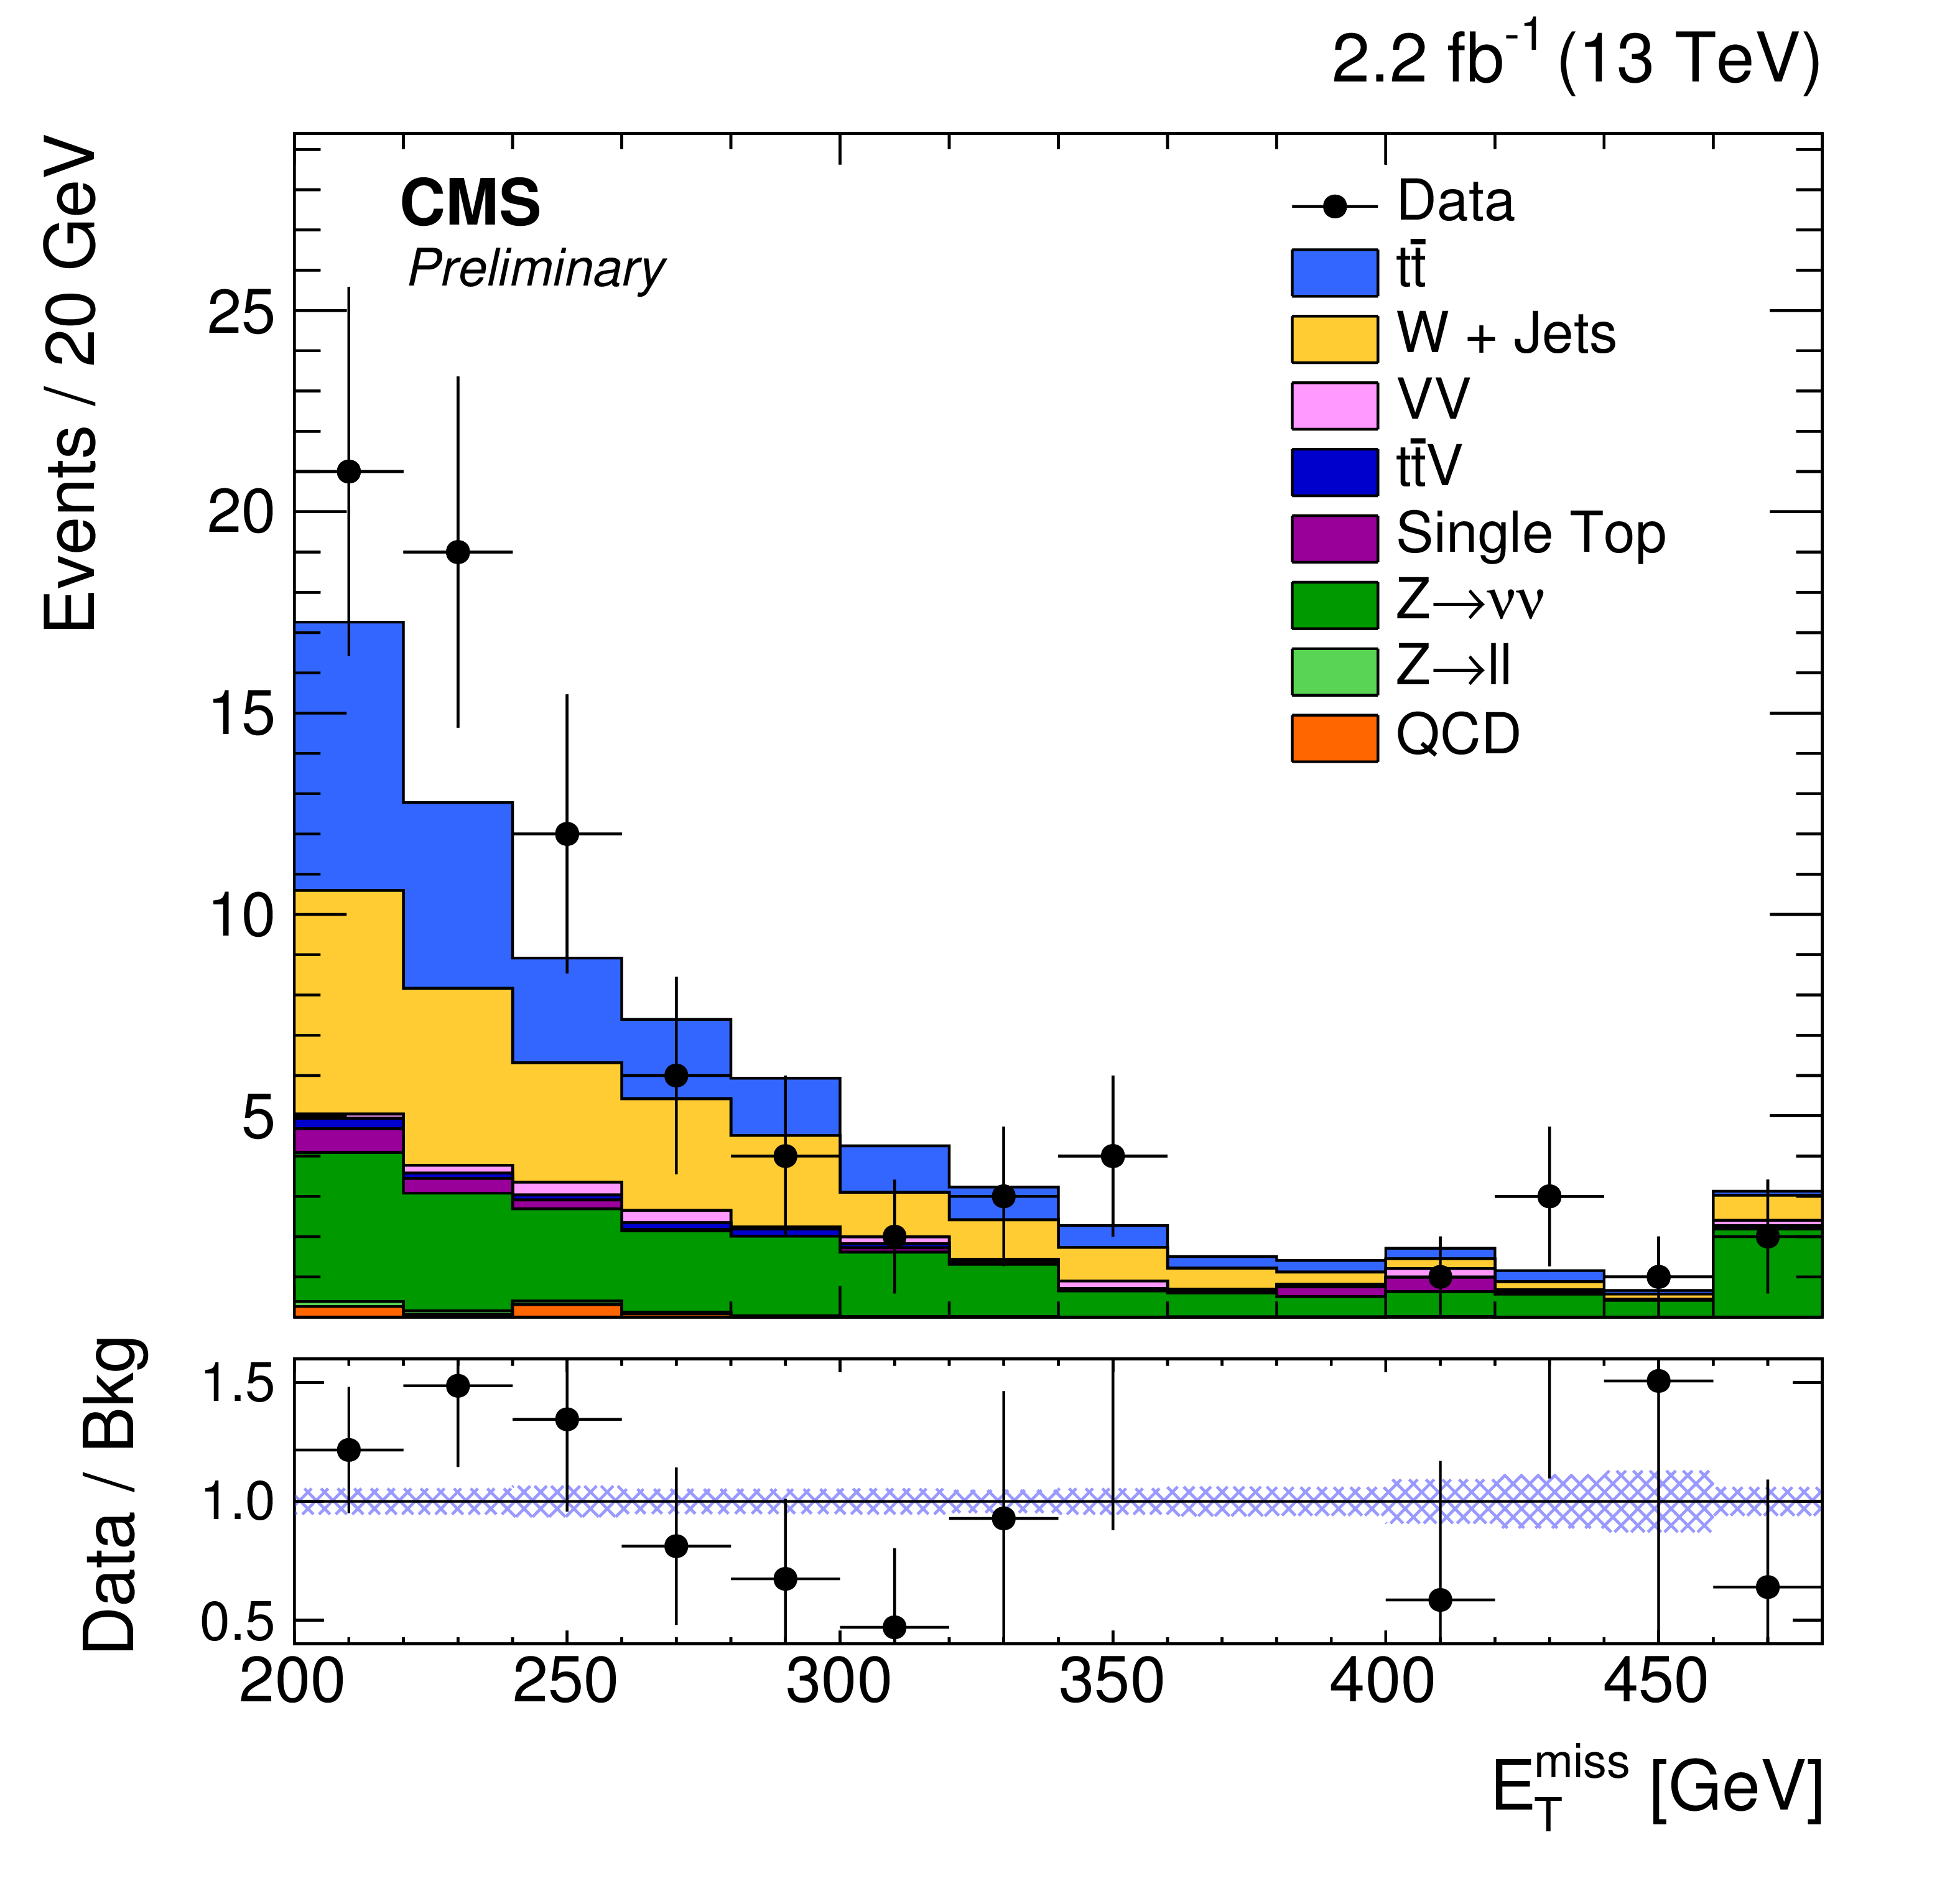
Figure 3-a:
Distributions of ${E_{\mathrm {T}}^{\text {miss}}}$ in the (a) semileptonic and (b) inclusive hadronic signal regions prior to the combined control/signal region fit. The gray dashed band indicates the statistical uncertainty on the background prediction. A model for DM production with pseudoscalar $m_{\mathrm {MED}}=$ 100 GeV and $m_{\mathrm {MED}}=$ 1 GeV is also shown. Note that the signal expectation is scaled by a factor of 20 in the plots. |

png pdf |
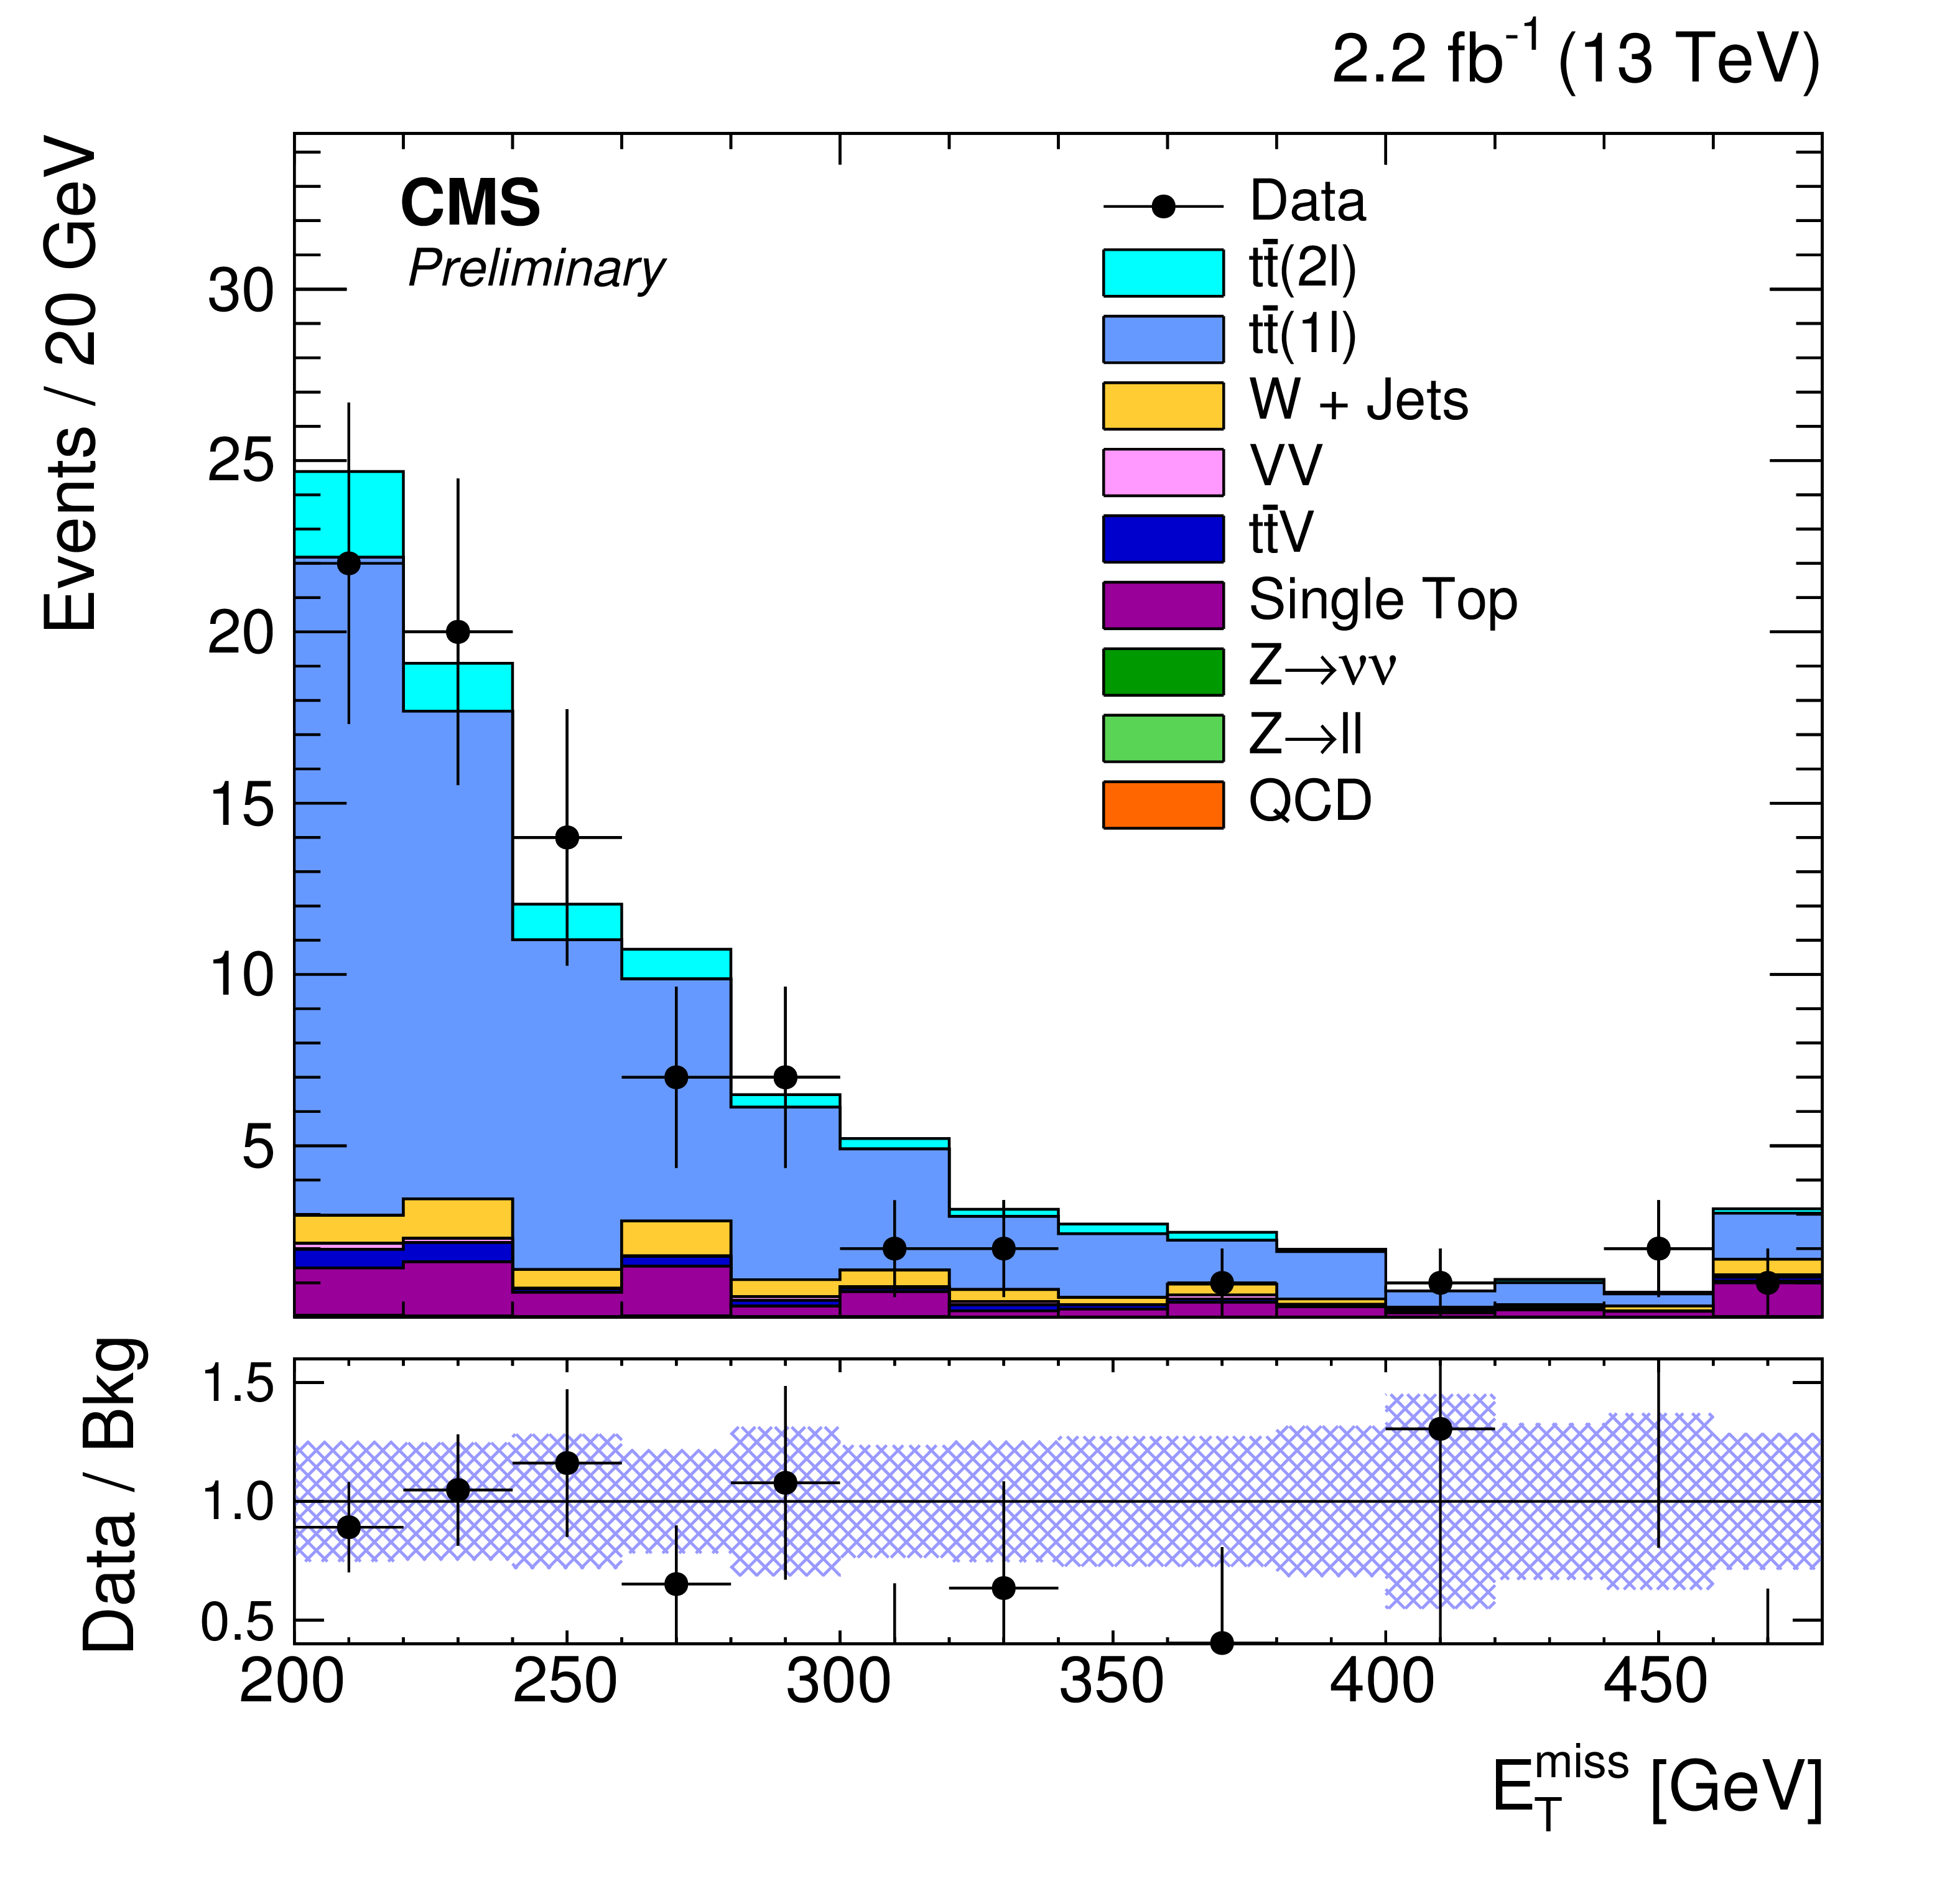
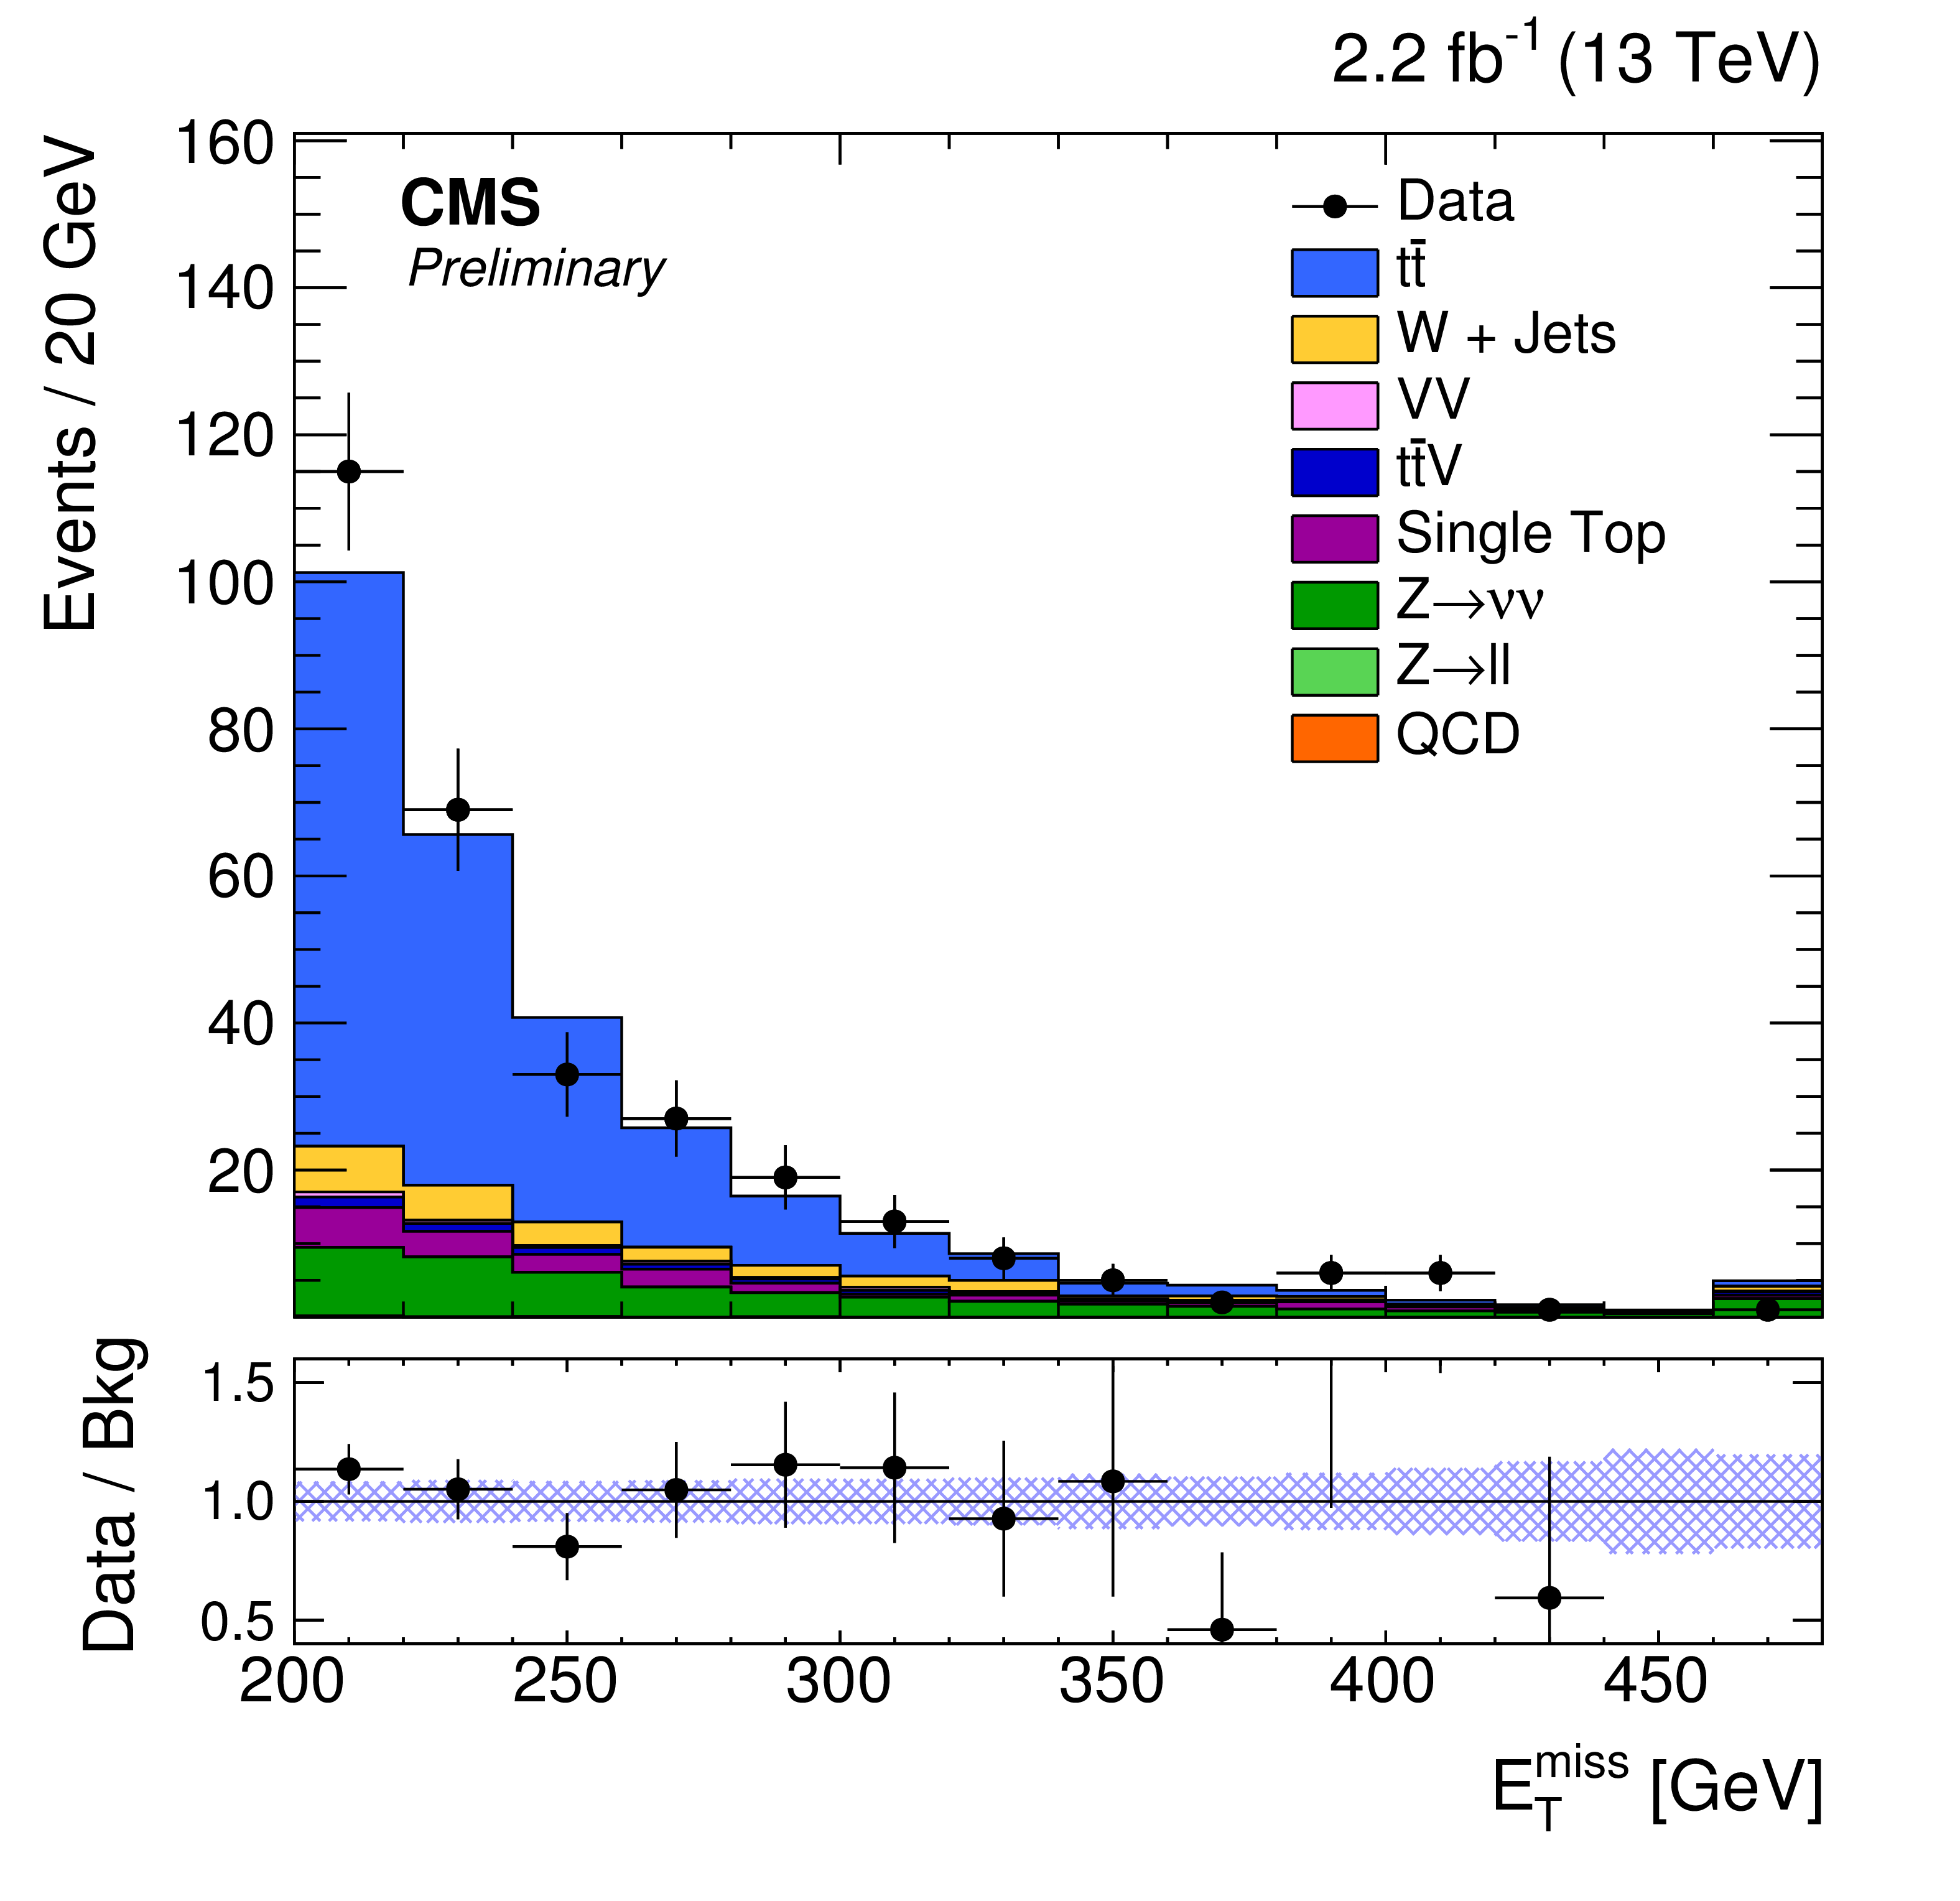
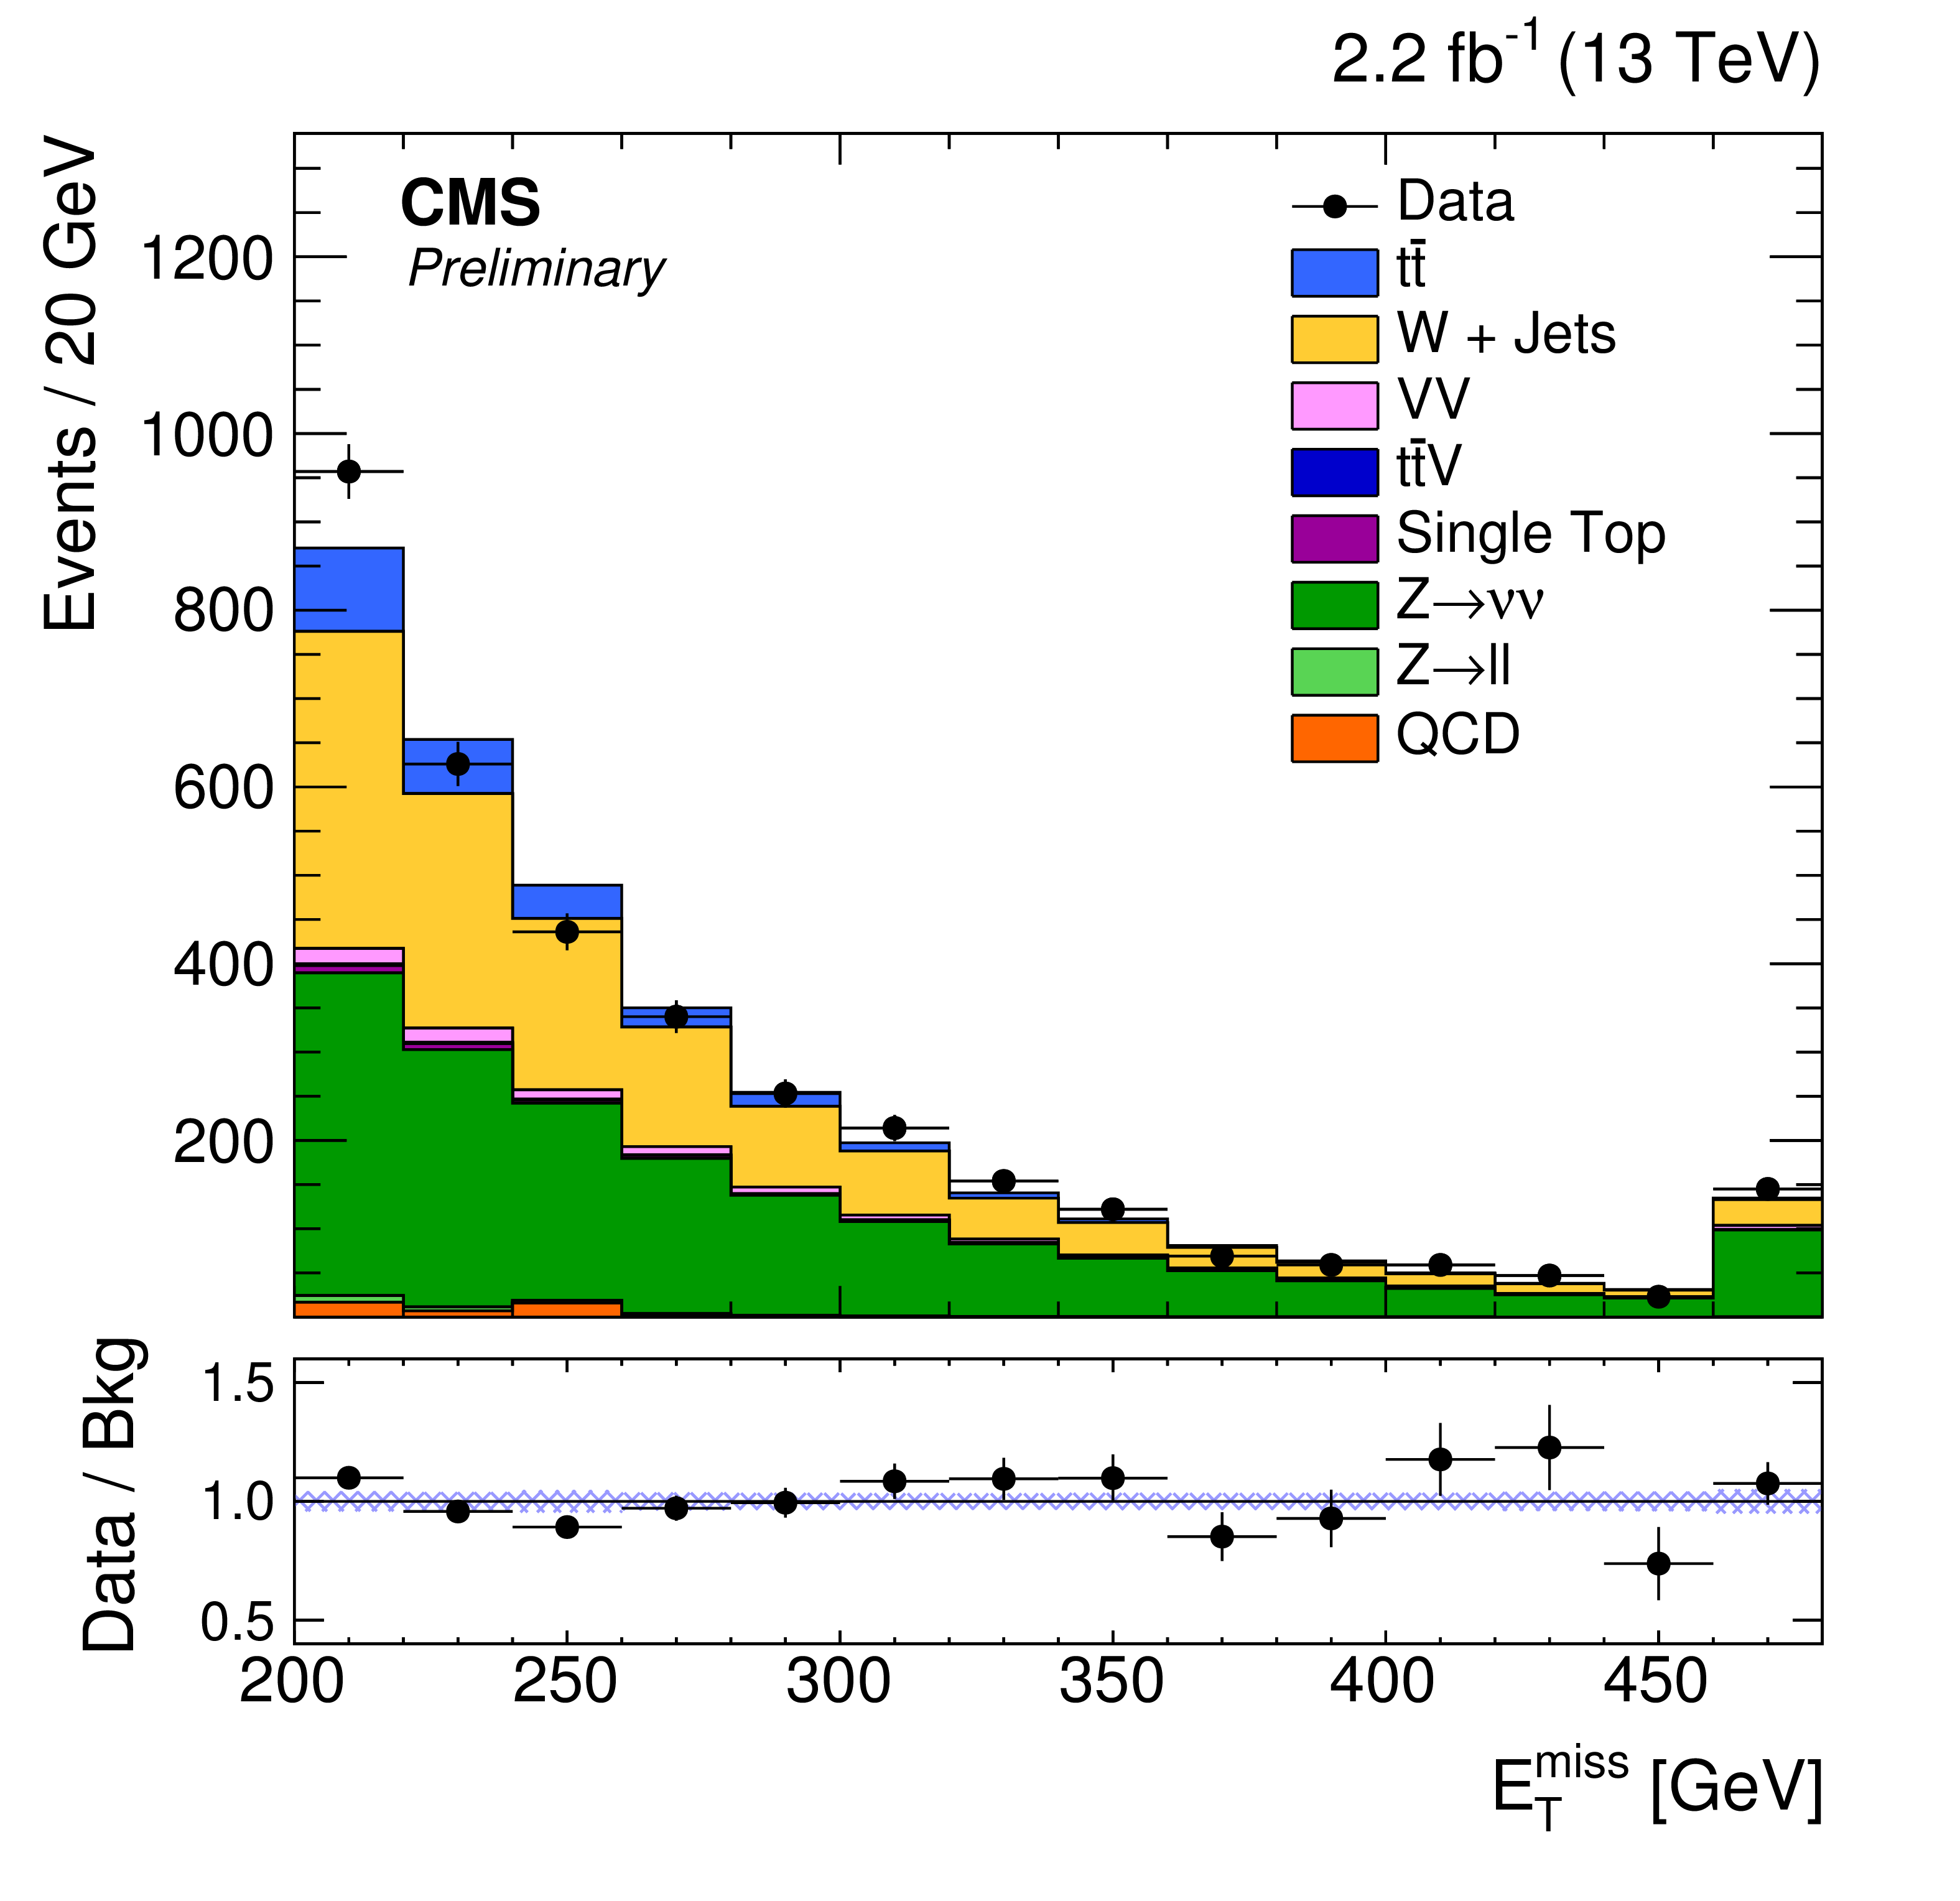
Figure 3-b:
Distributions of ${E_{\mathrm {T}}^{\text {miss}}}$ in the (a) semileptonic and (b) inclusive hadronic signal regions prior to the combined control/signal region fit. The gray dashed band indicates the statistical uncertainty on the background prediction. A model for DM production with pseudoscalar $m_{\mathrm {MED}}=$ 100 GeV and $m_{\mathrm {MED}}=$ 1 GeV is also shown. Note that the signal expectation is scaled by a factor of 20 in the plots. |

png pdf |
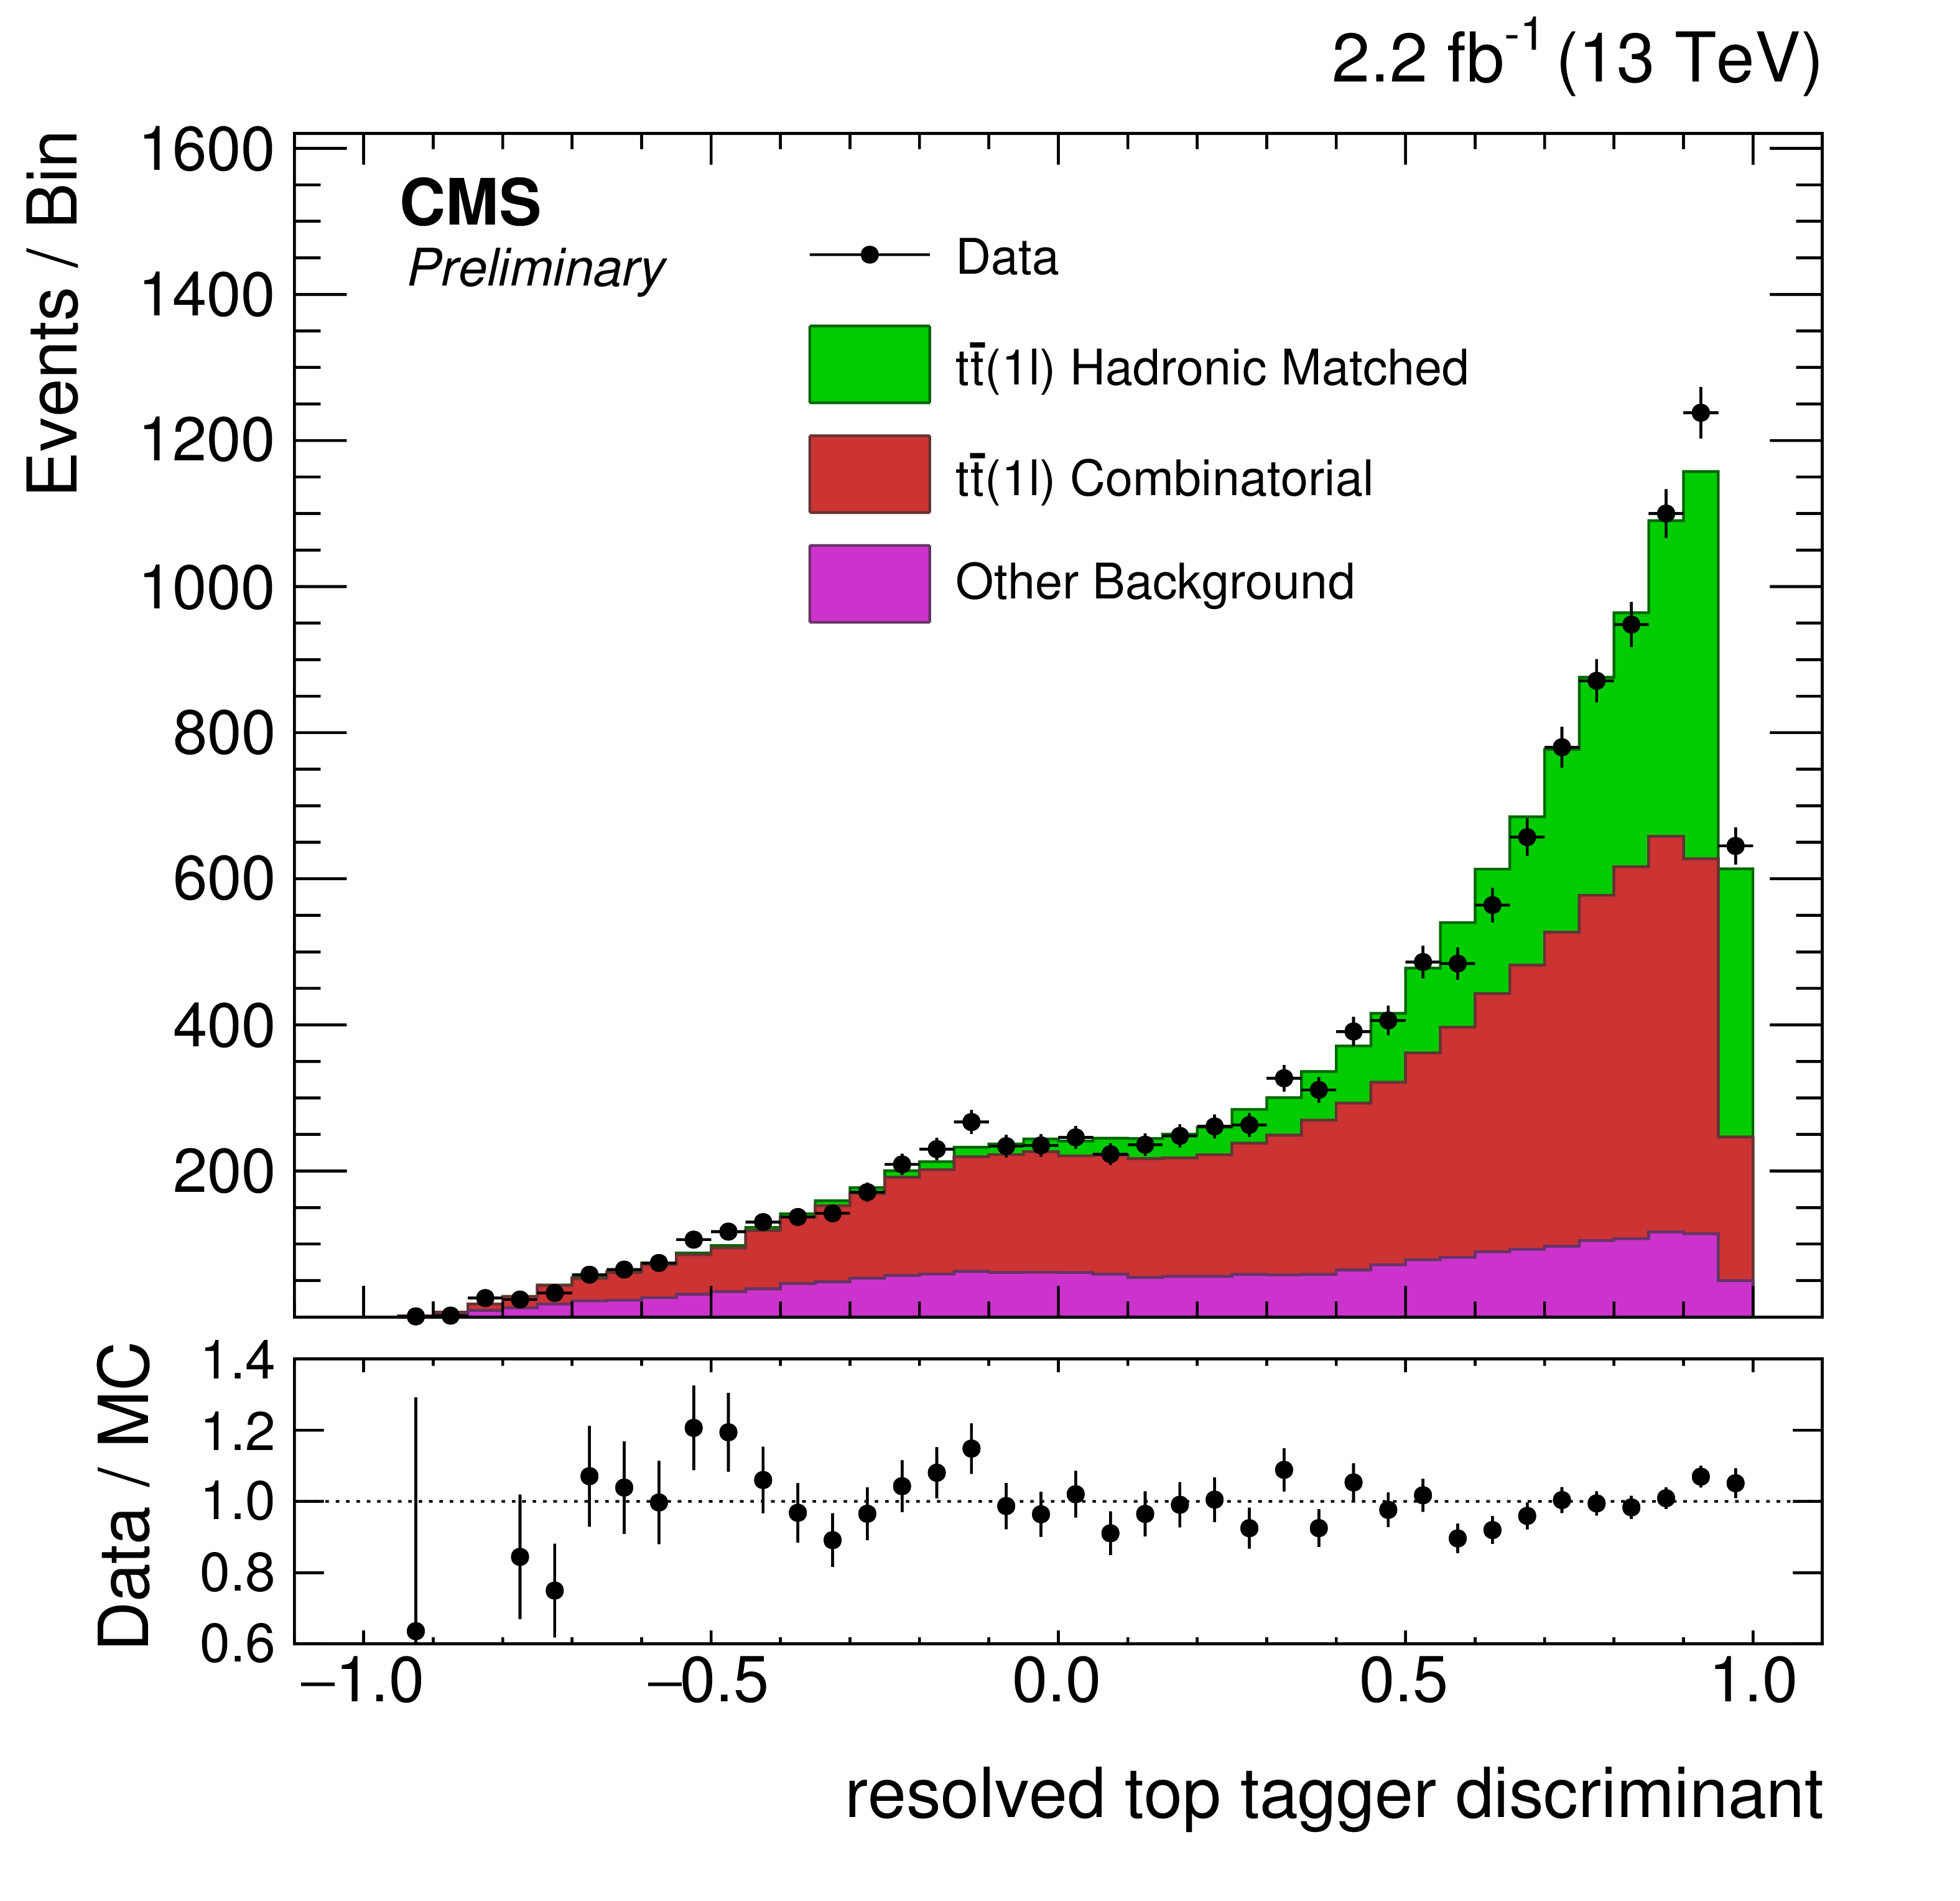
Figure 4:
Distribution of the resolved top tagger discriminant in semileptonic $\mathrm{ t \bar{t} }$ events. The simulation is split by whether the correct jets from the hadronically decaying top quark is chosen (events with the correct jets are labelled ``$ {\mathrm {t}\overline {\mathrm {t}}} (1\ell )$ Hadronic Matched'', events from semileptonic ${\mathrm {t}\overline {\mathrm {t}}}$ but the wrong combination of jets are chosen are labelled ``$ {\mathrm {t}\overline {\mathrm {t}}} (1\ell )$ Combinatorial'', and events from processes without a hadronic top quark are labelled ``Other Background''). Uncertainties on the ratio of data to simulation are statistical. |
png pdf |
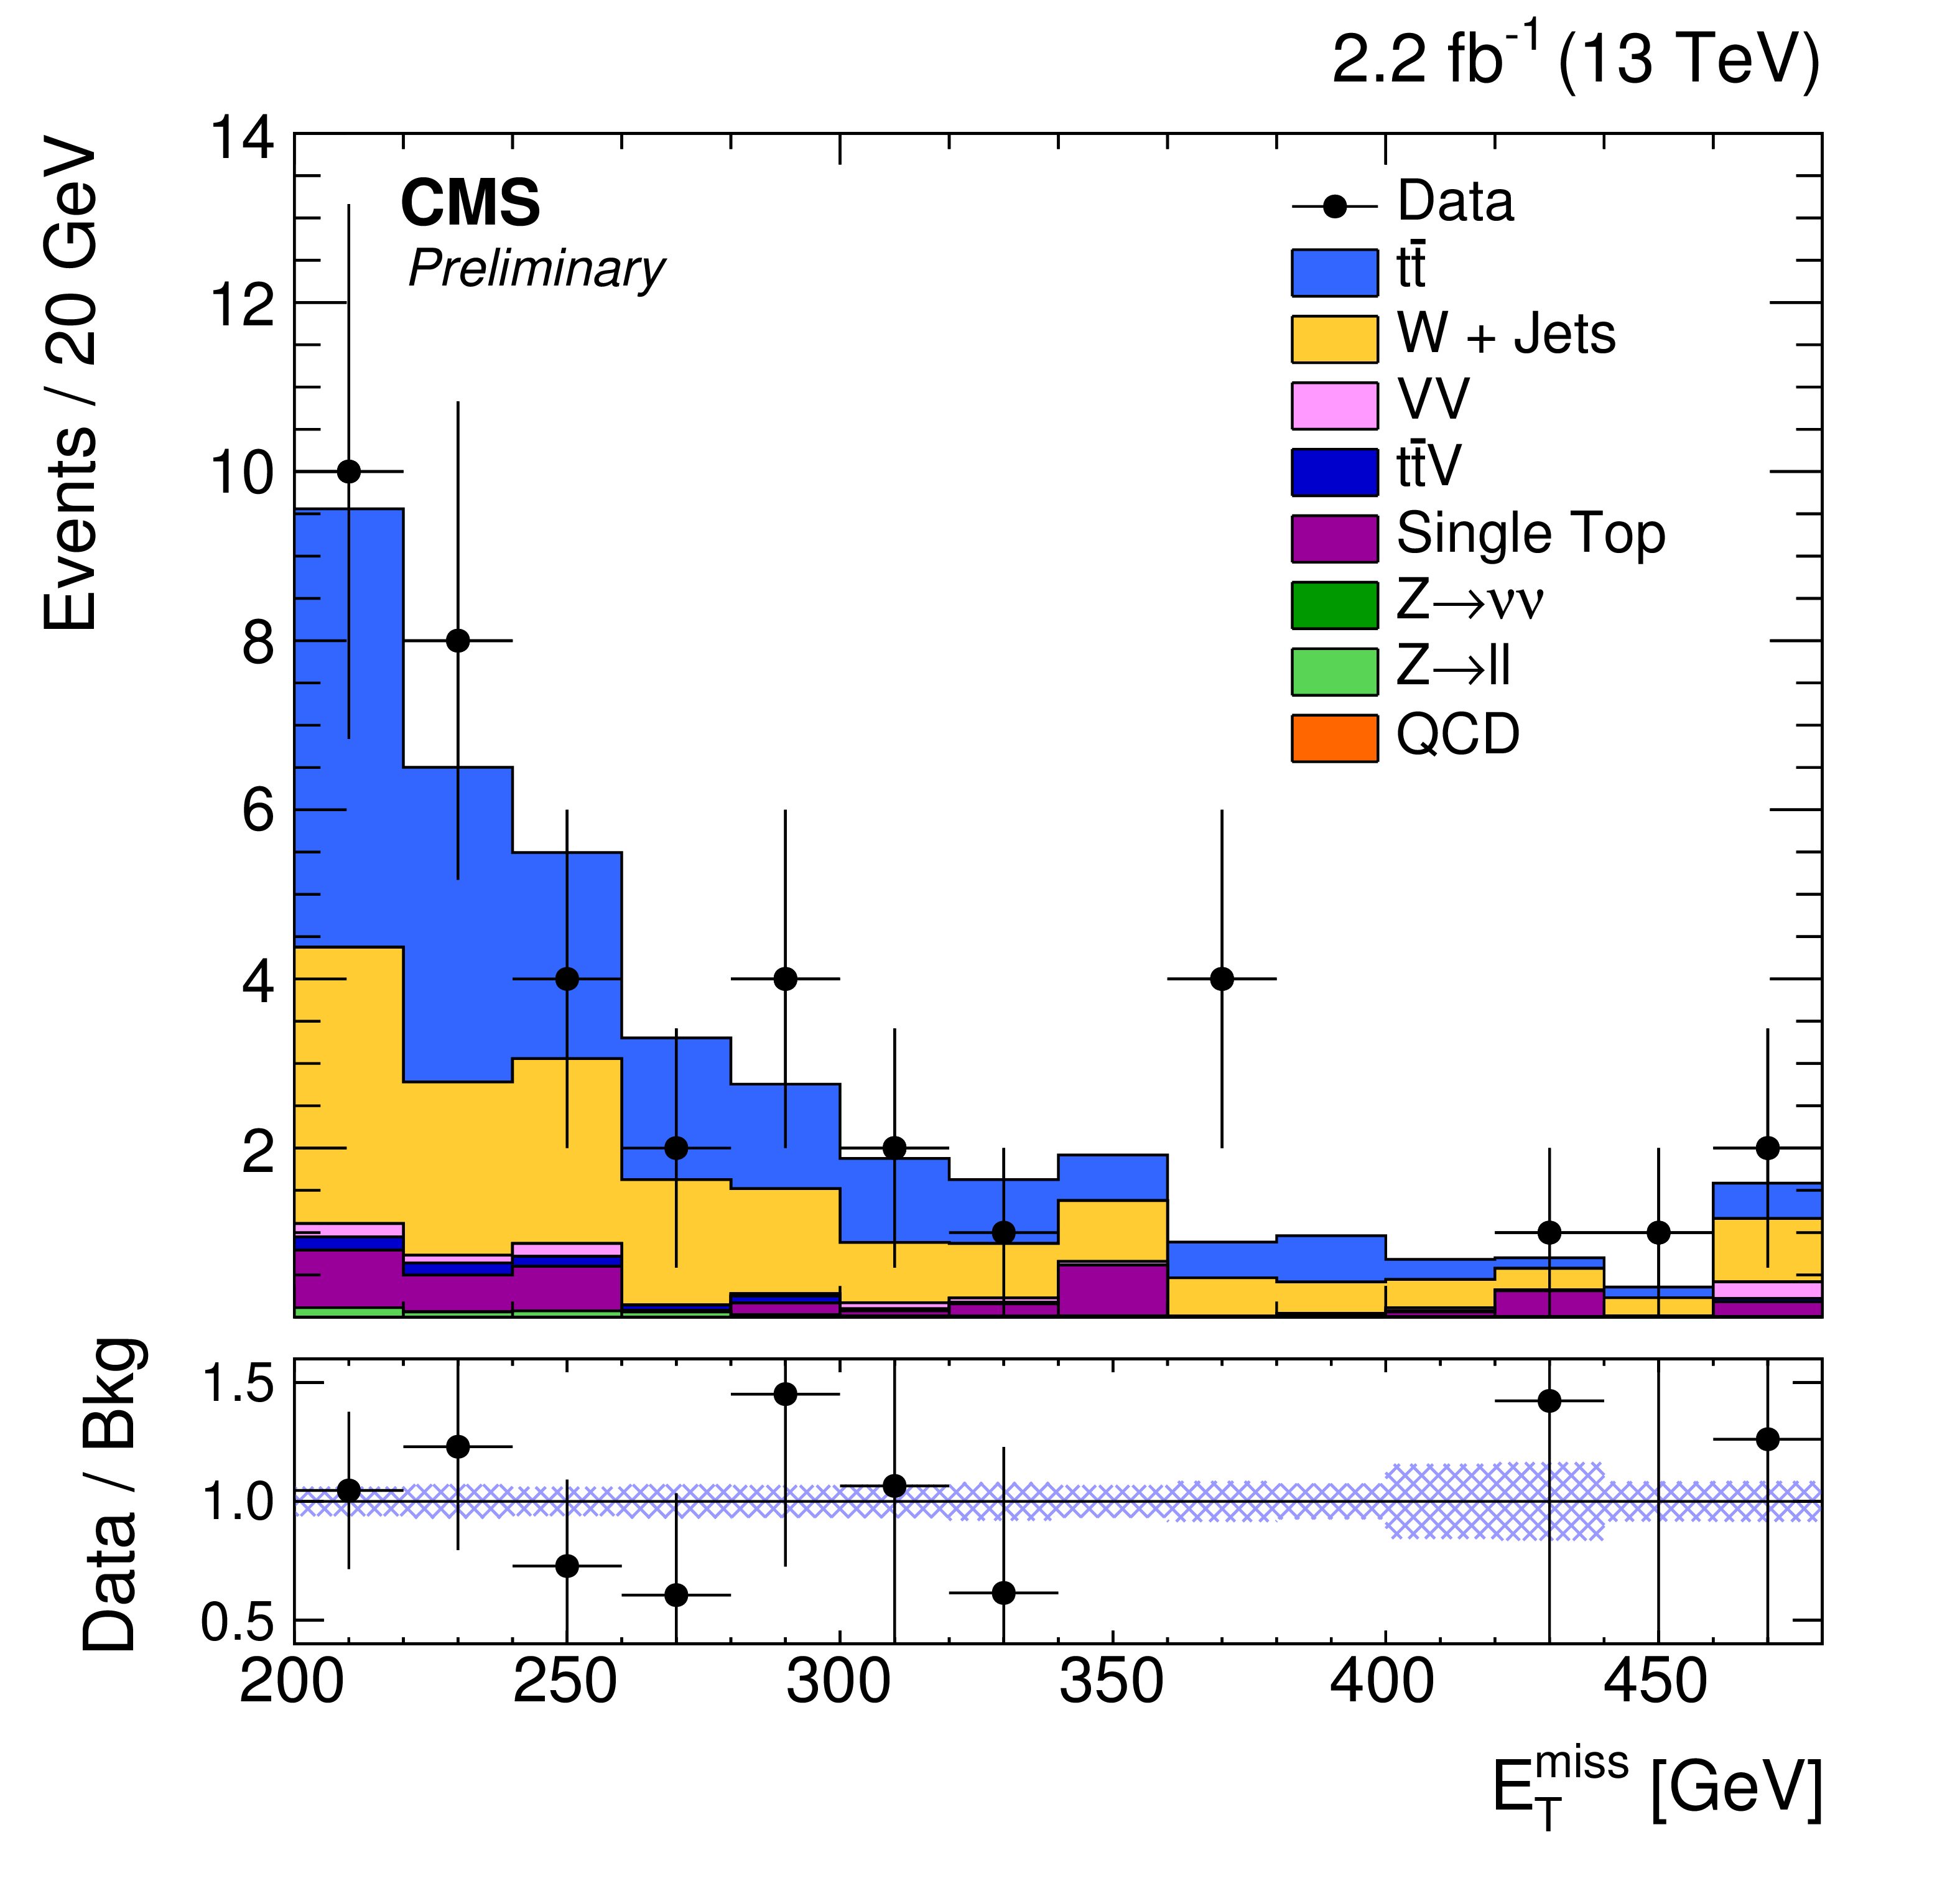
Figure 5-a:
Distributions of ${E_{\mathrm {T}}^{\text {miss}}}$ for the categorised hadronic selection in (a) the two top tags category, and (b) the less than two top tags category. The pseudoscalar model with $m_{\mathrm {MED}}=$ 100 GeV and $m_{\mathrm {DM}}=$ 1 GeV is shown. Note that the signal expectation is scaled by a factor of 20 in the plots. Statistical and systematic uncertainties on the background prediction are included in the blue band on the lower panel. |

png pdf |
Figure 5-b:
Distributions of ${E_{\mathrm {T}}^{\text {miss}}}$ for the categorised hadronic selection in (a) the two top tags category, and (b) the less than two top tags category. The pseudoscalar model with $m_{\mathrm {MED}}=$ 100 GeV and $m_{\mathrm {DM}}=$ 1 GeV is shown. Note that the signal expectation is scaled by a factor of 20 in the plots. Statistical and systematic uncertainties on the background prediction are included in the blue band on the lower panel. |
png pdf |
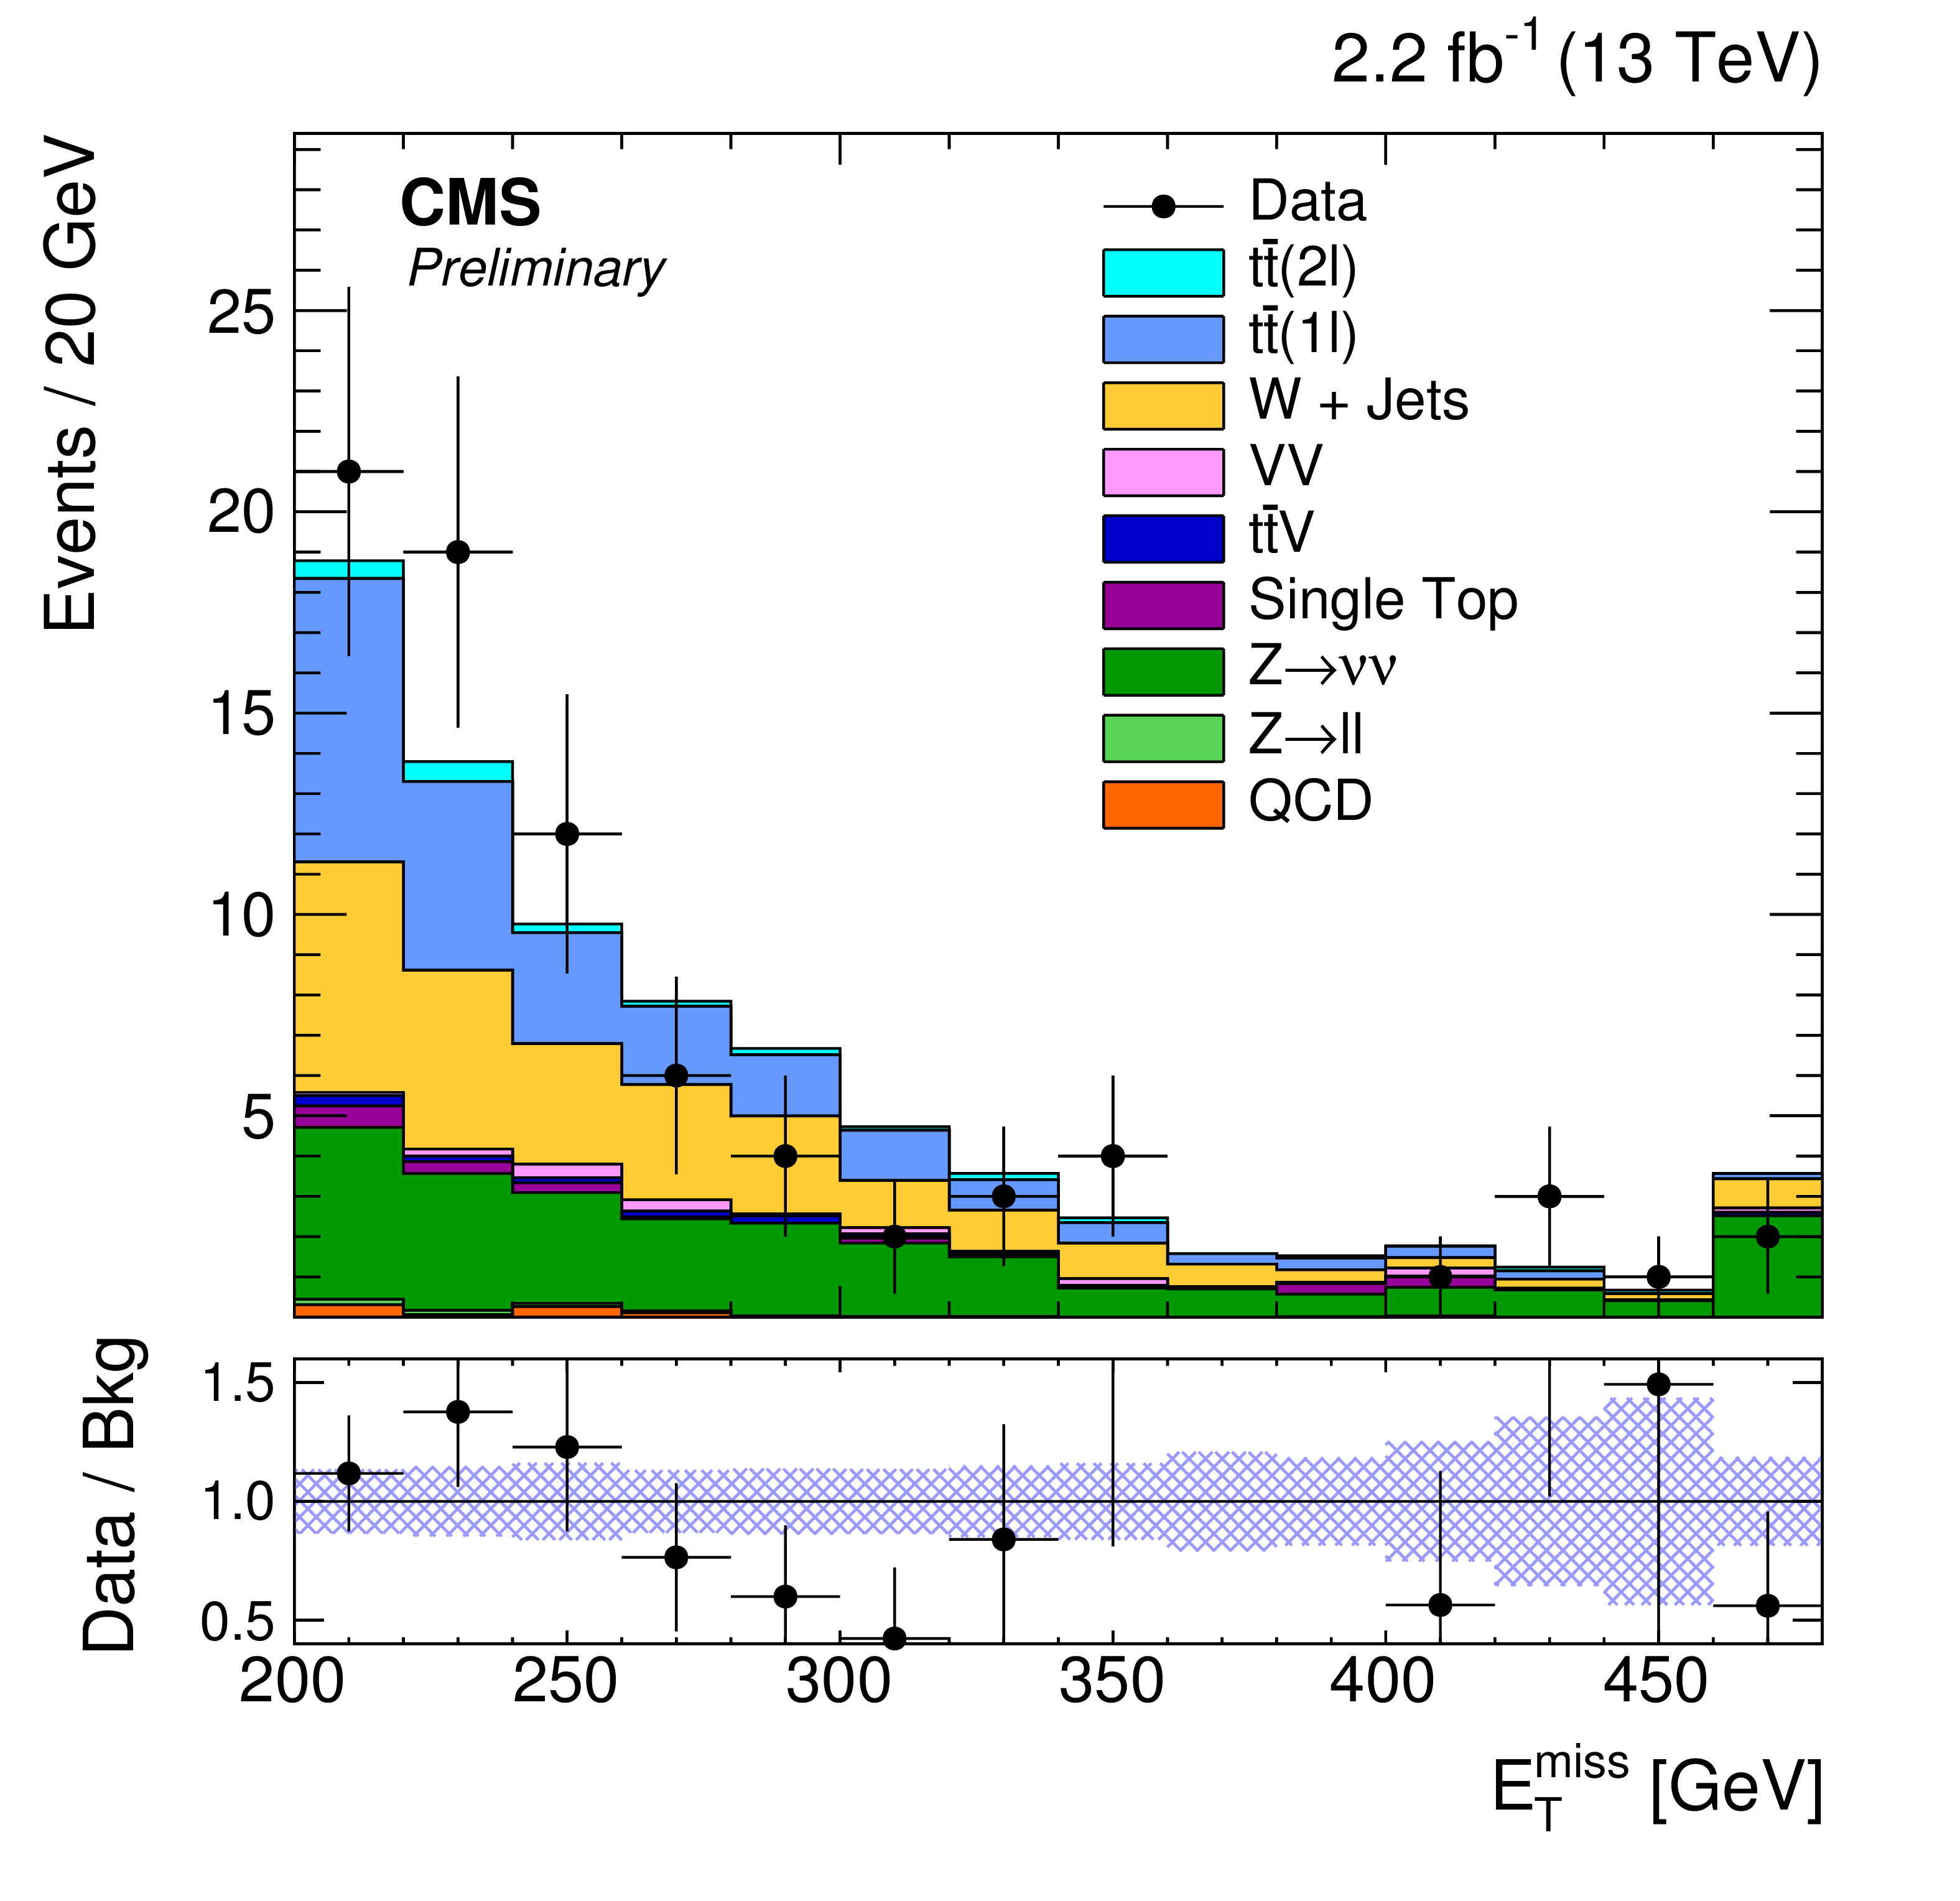
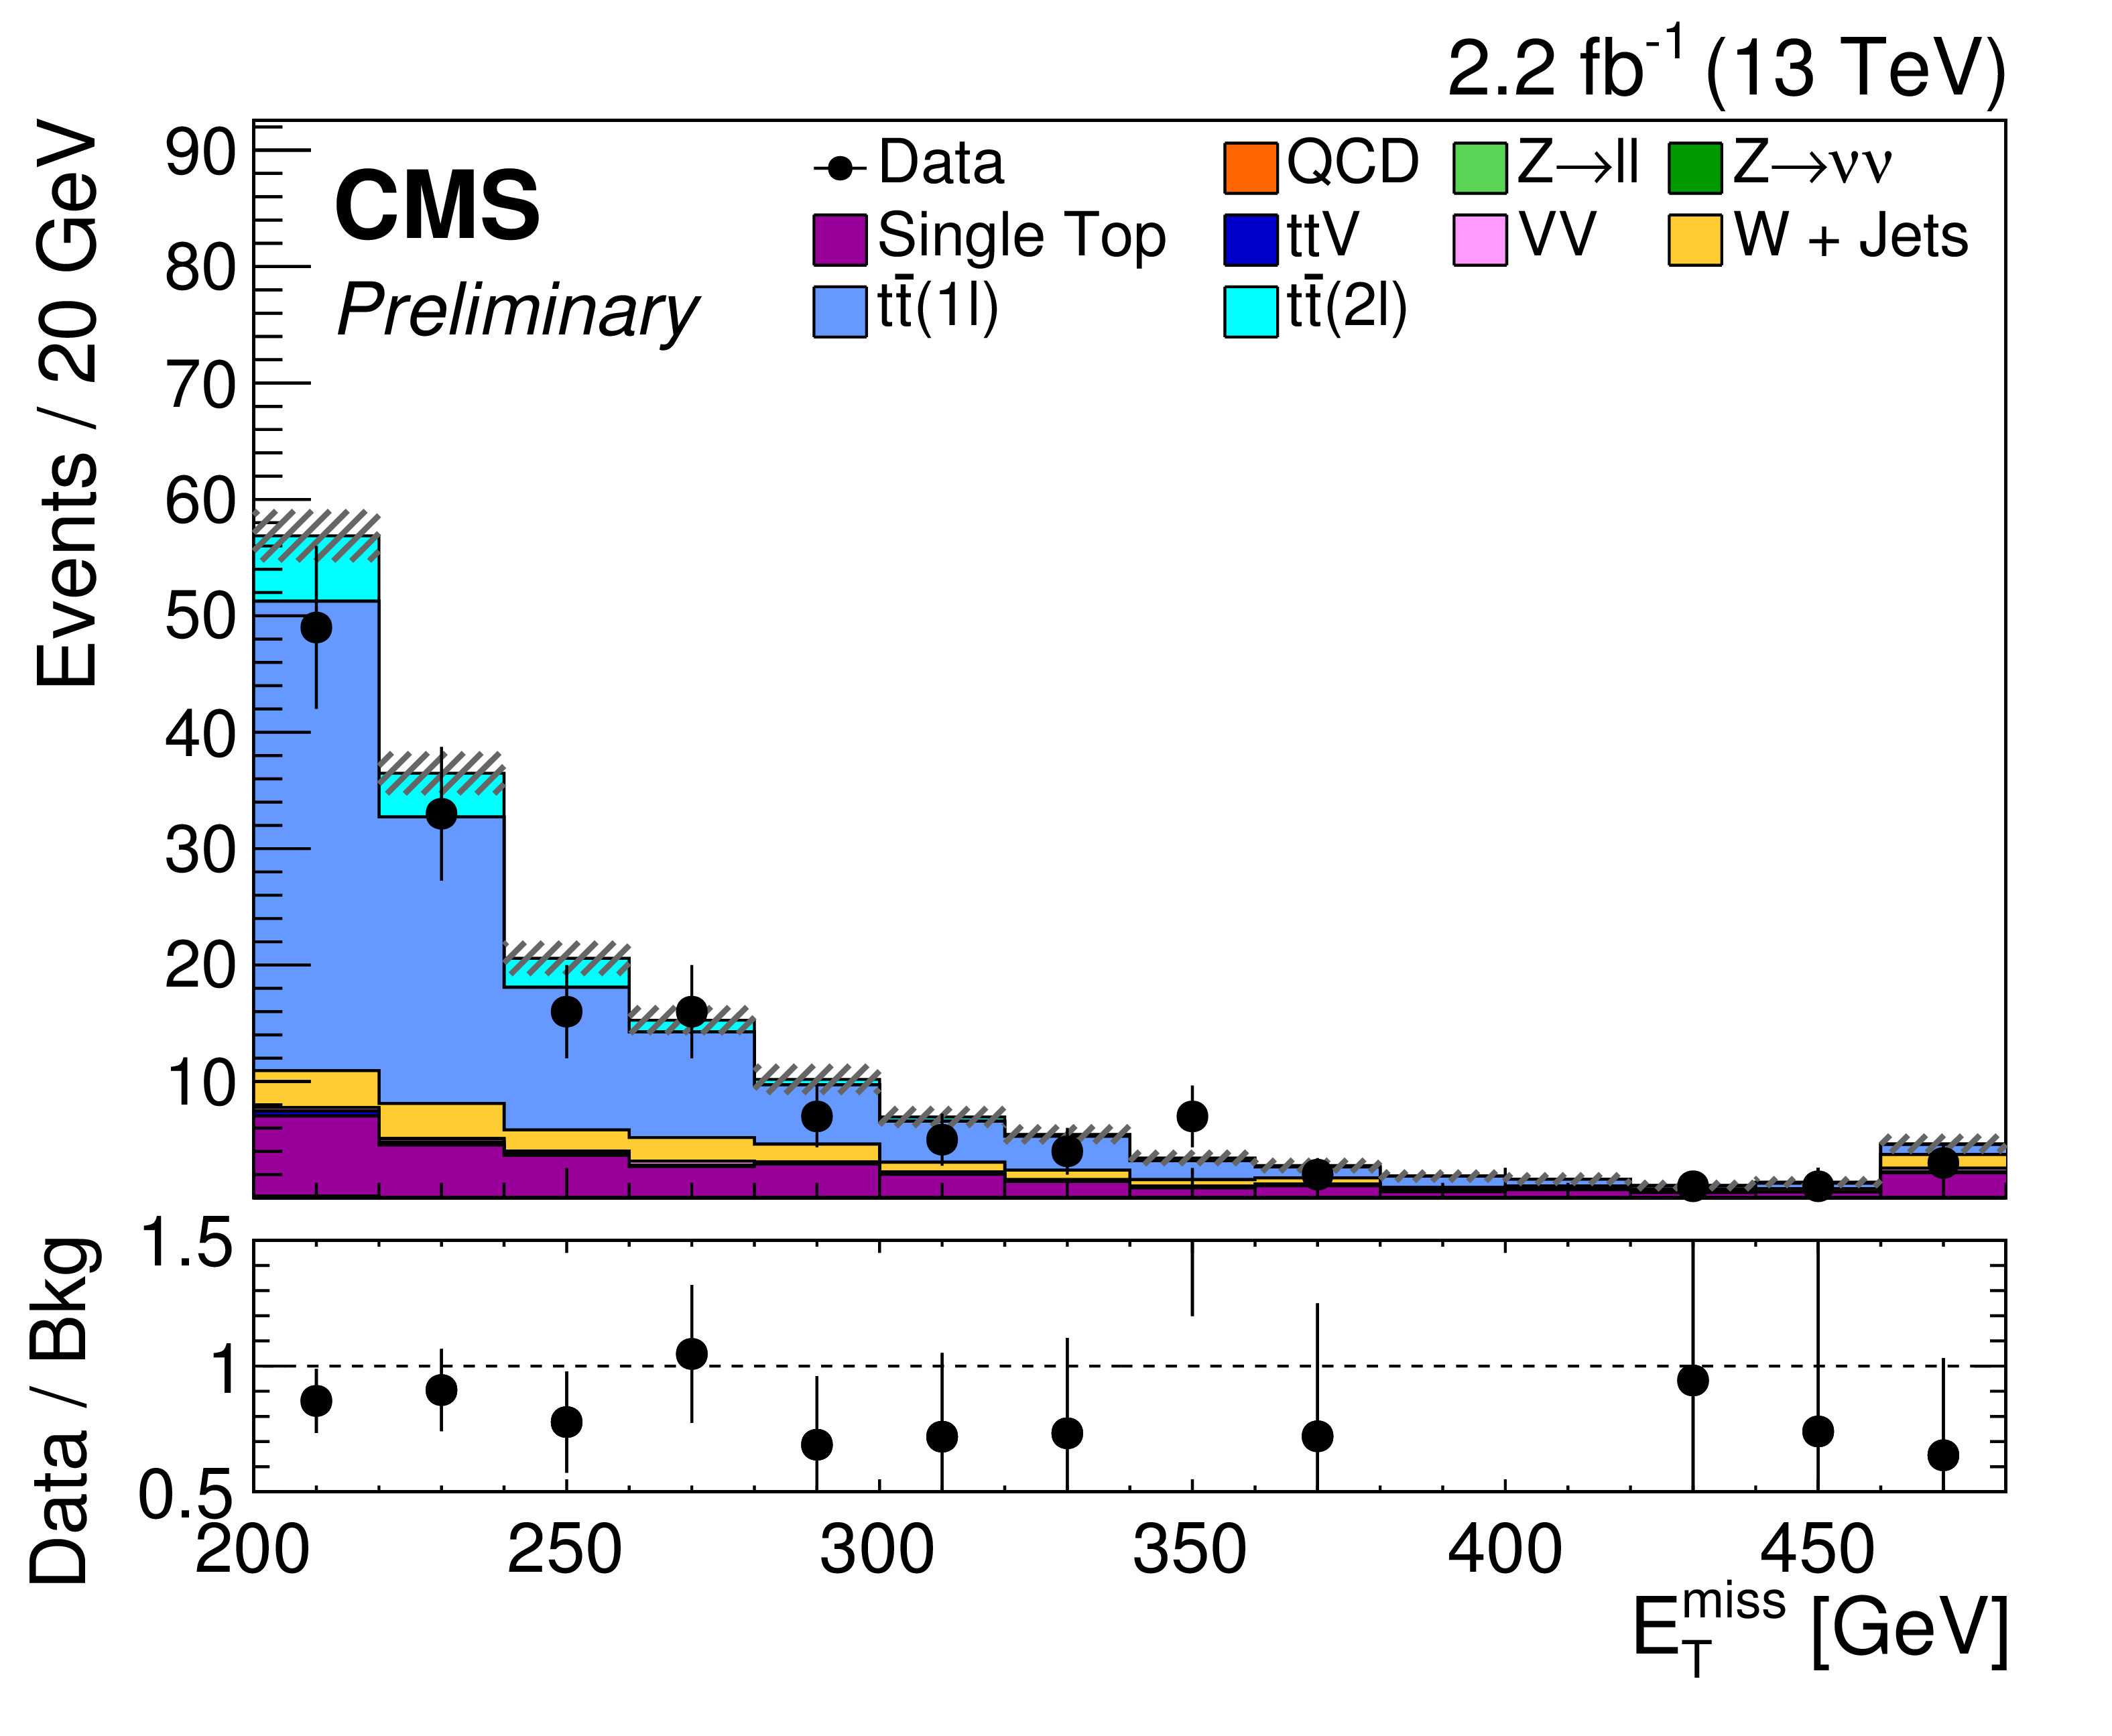
Figure 6-a:
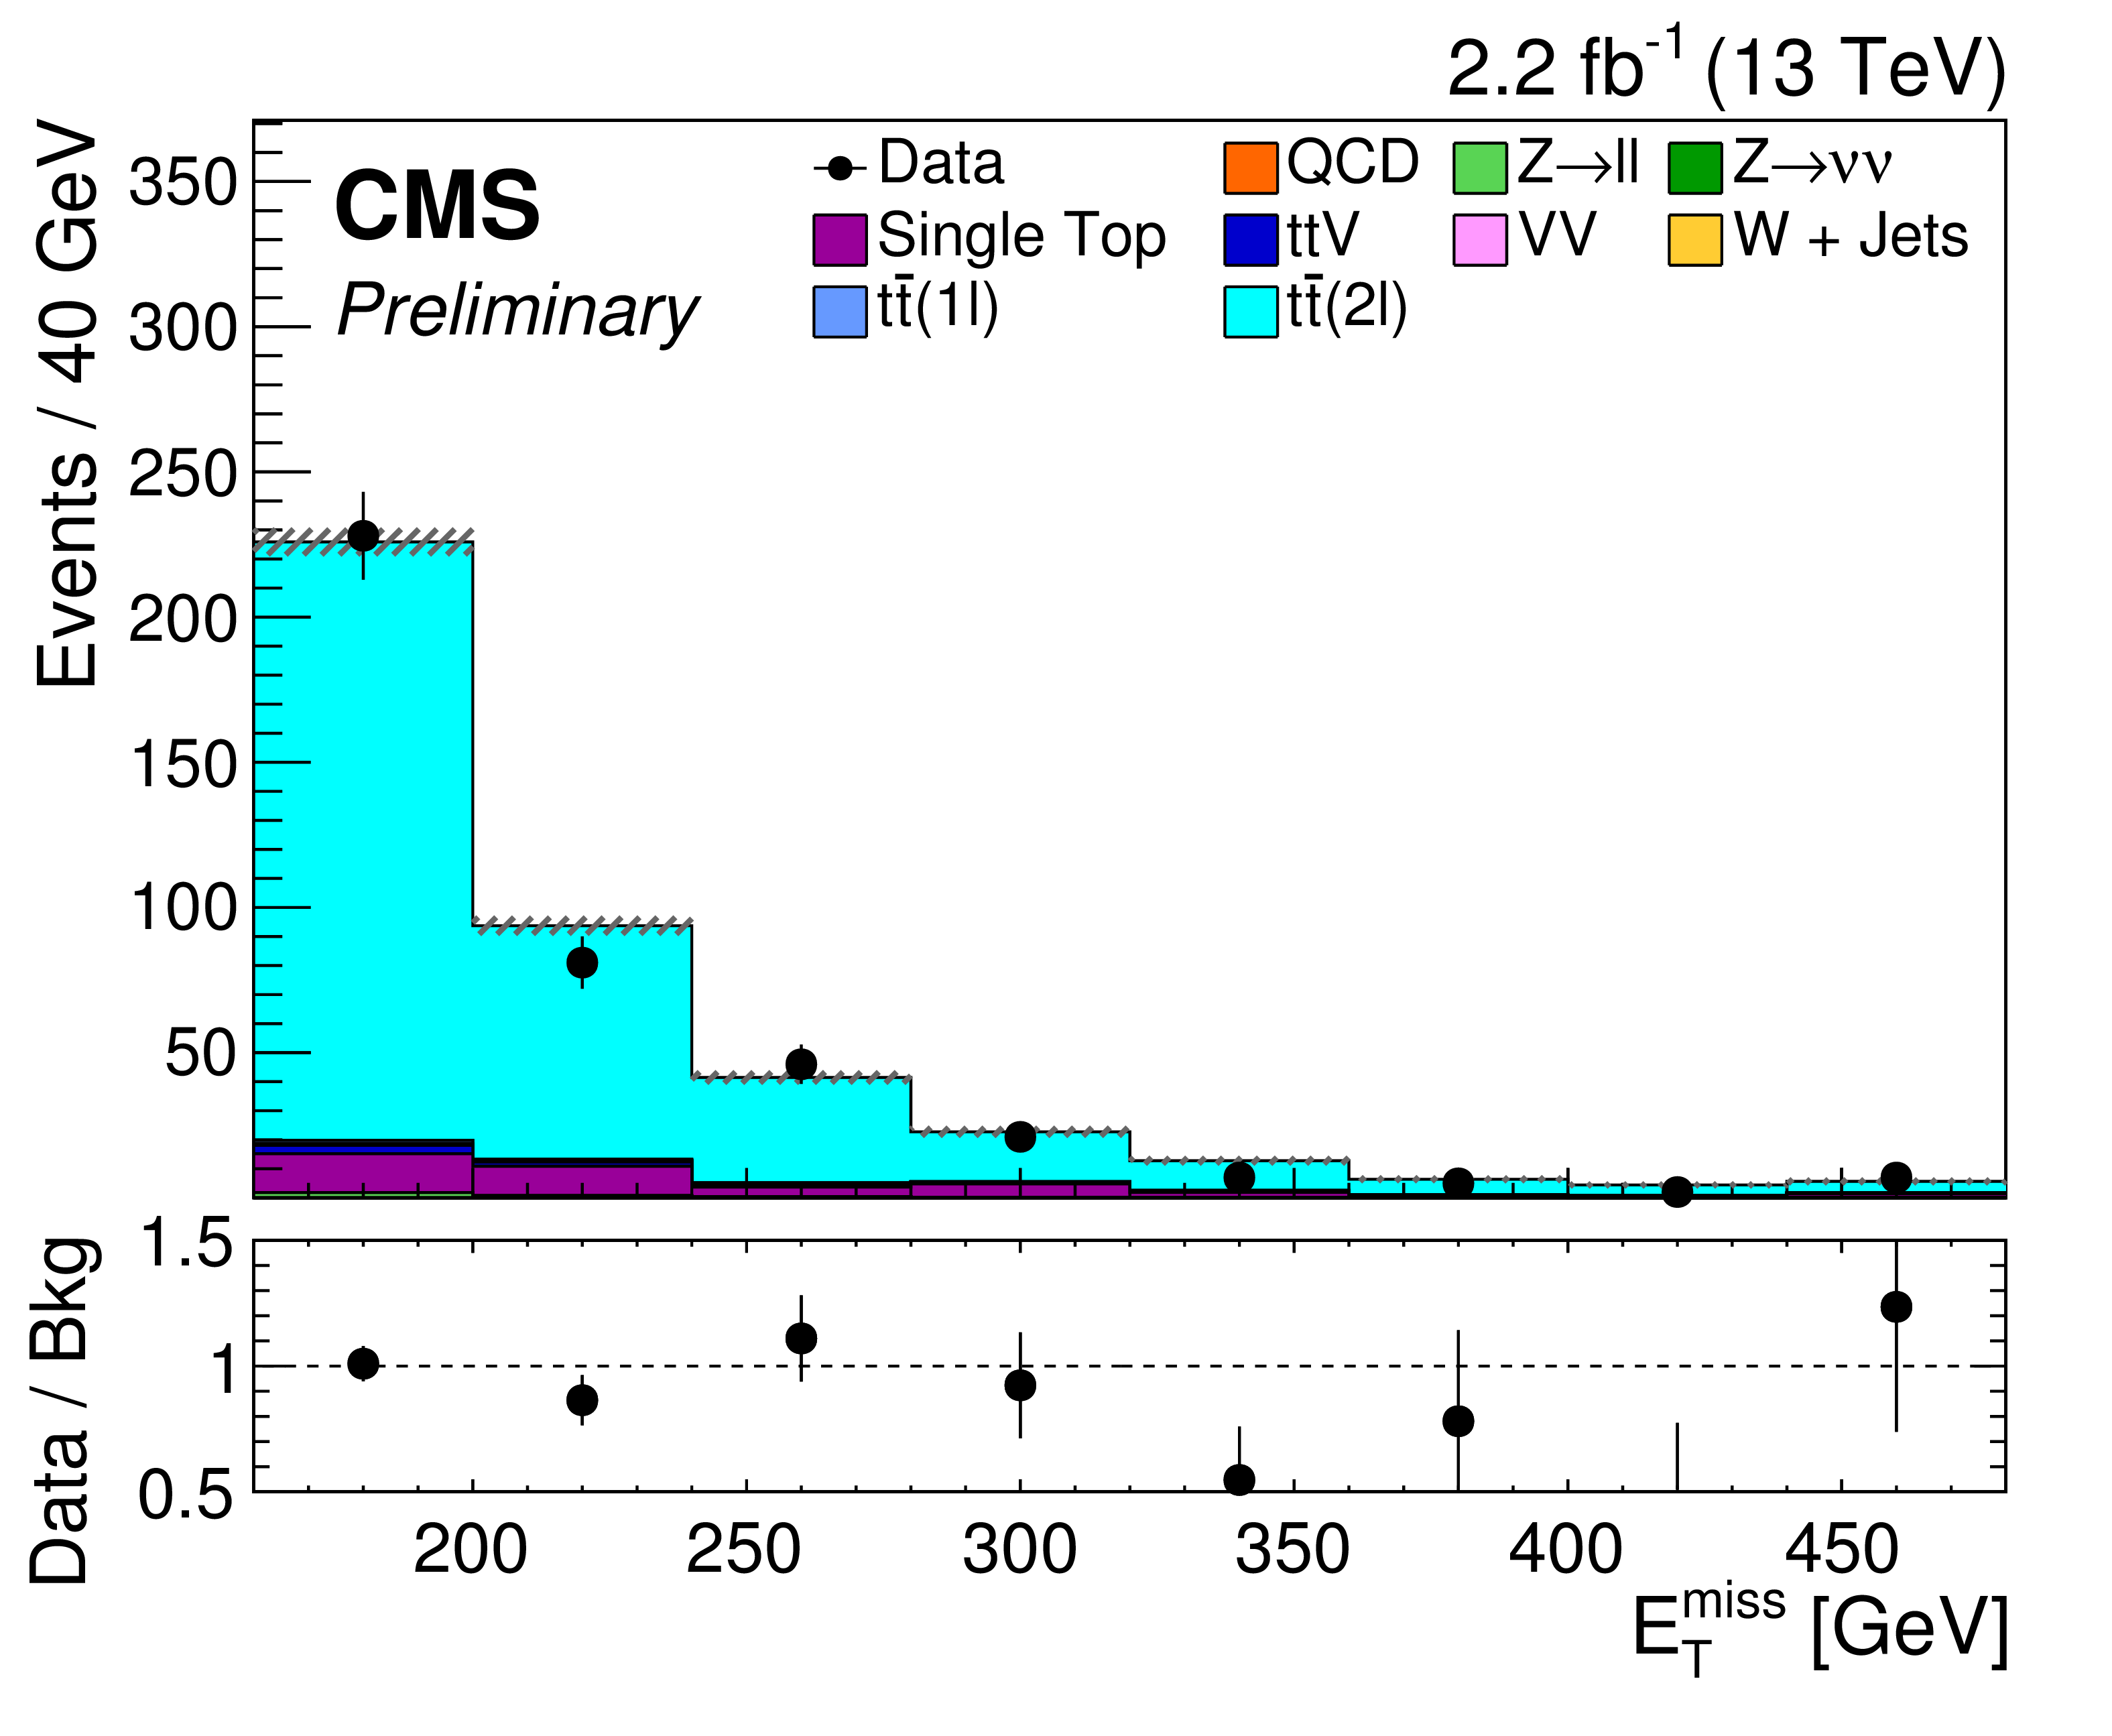
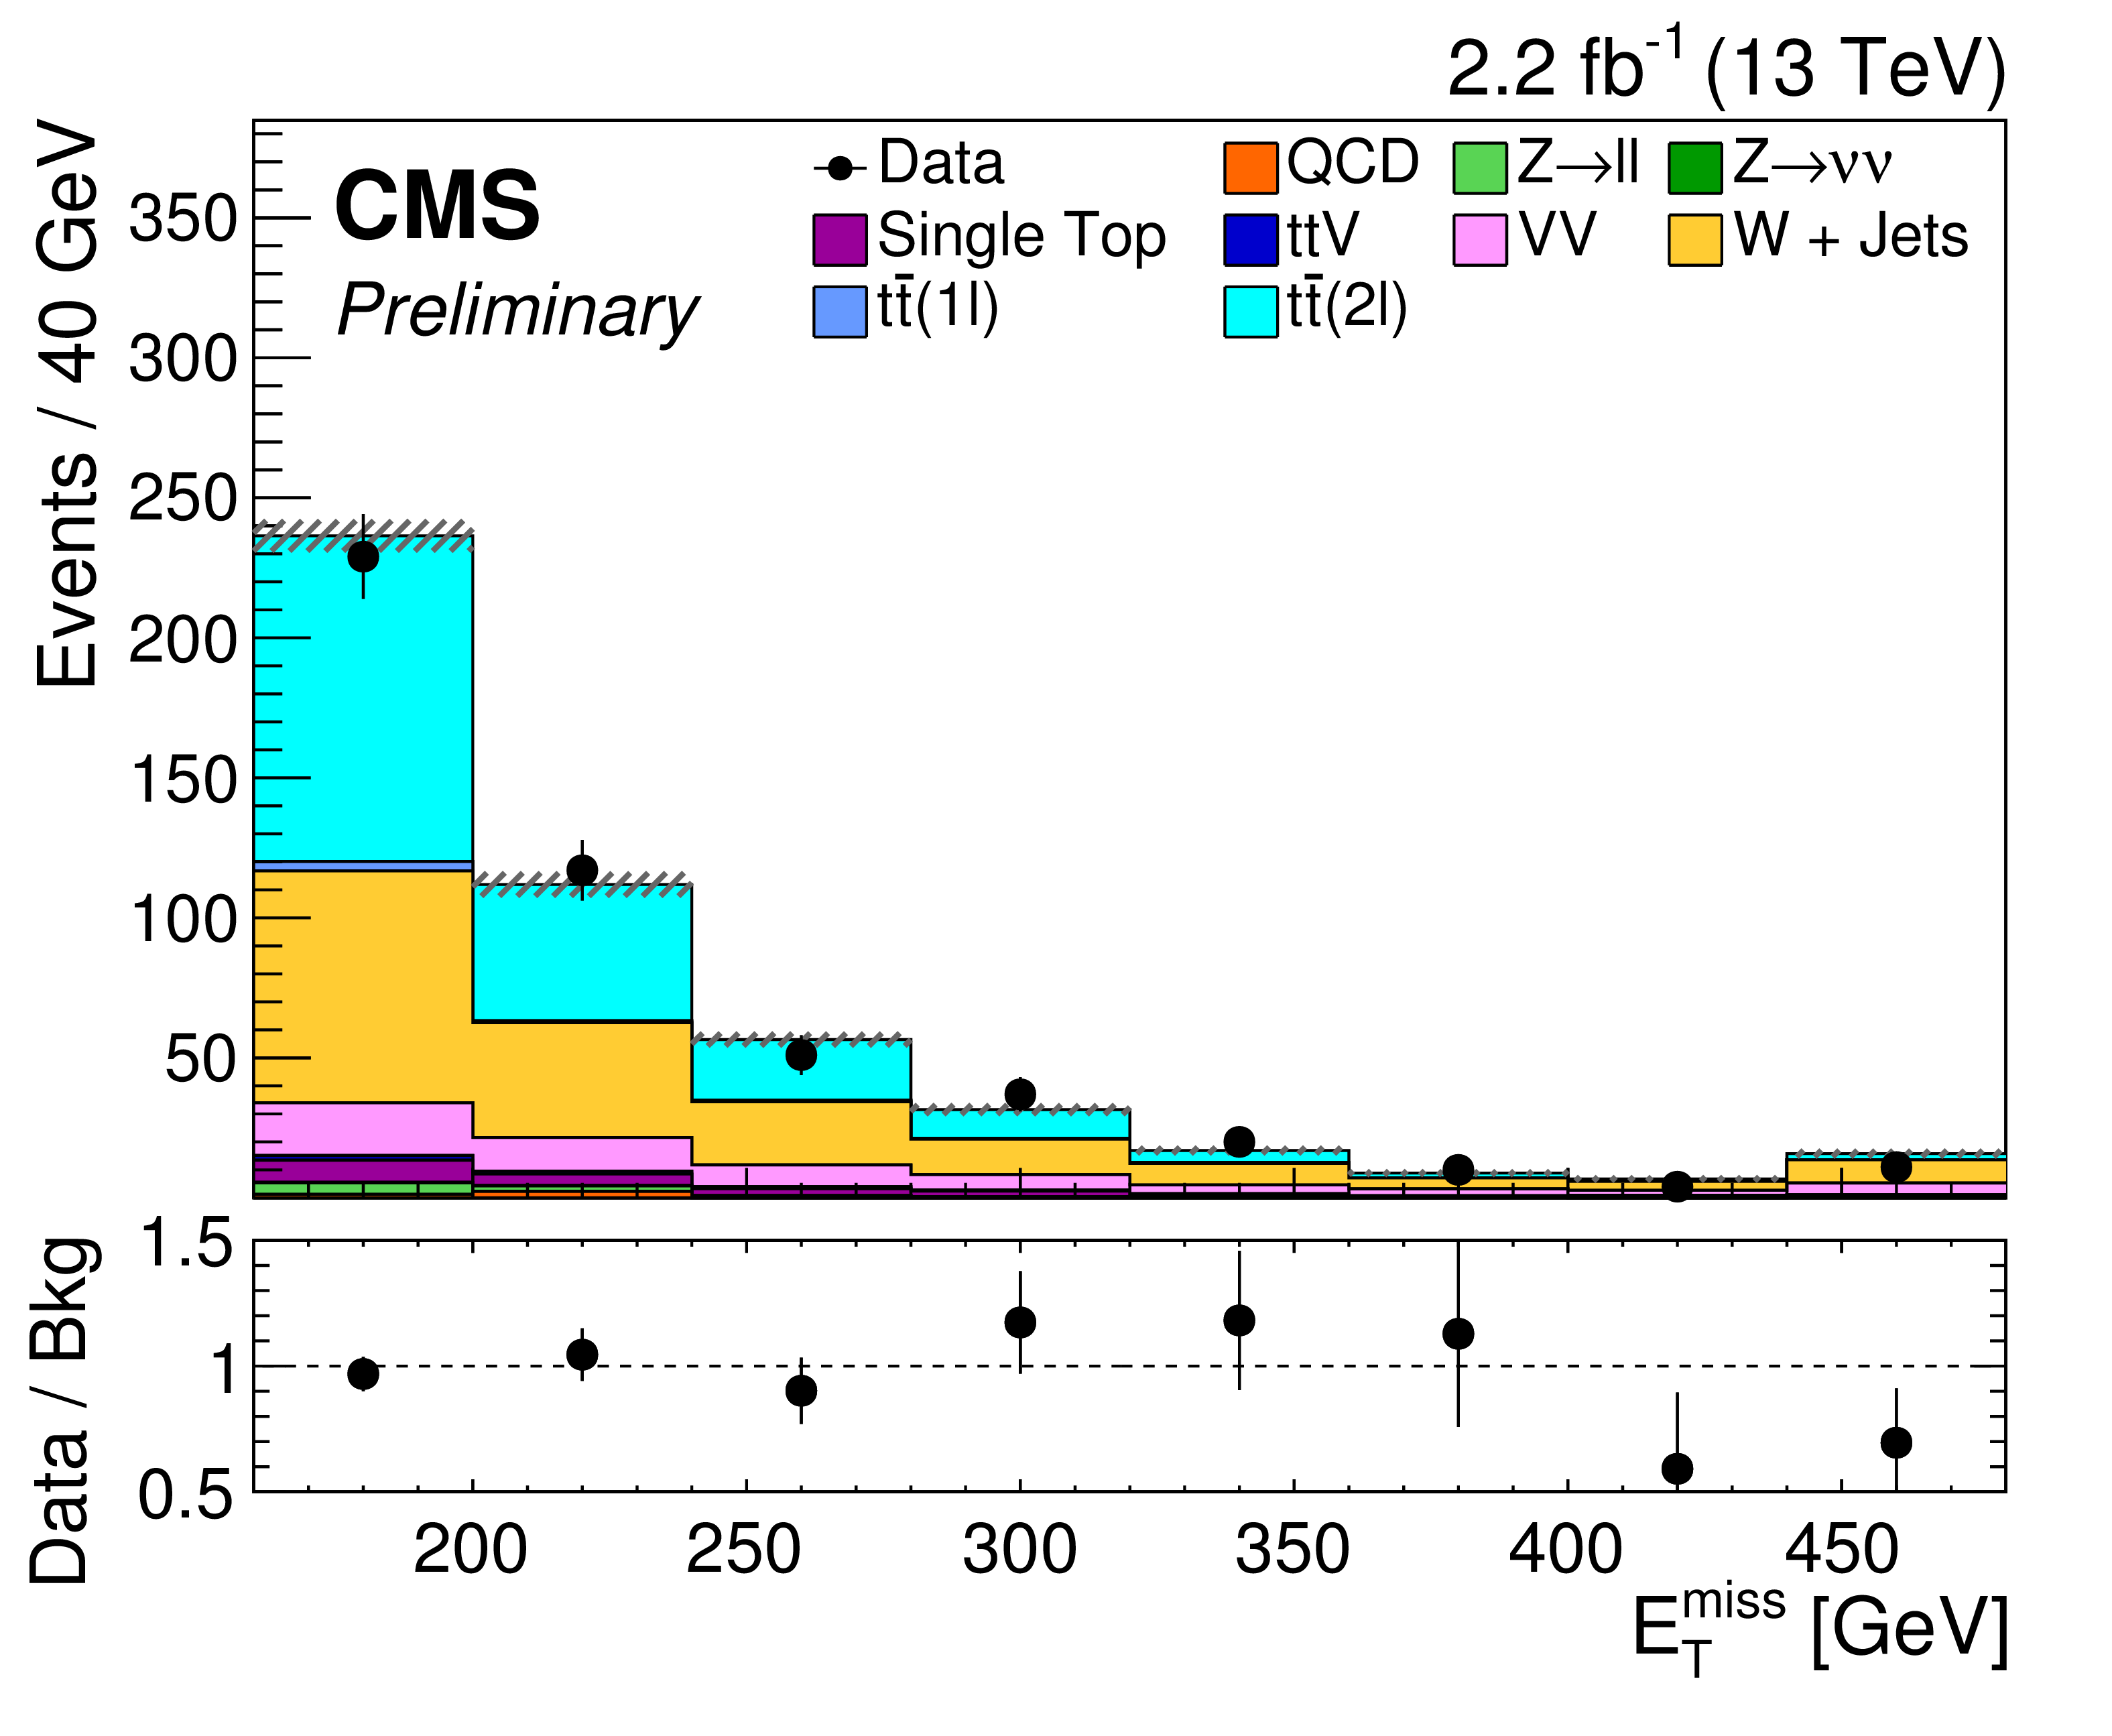
${E_{\mathrm {T}}^{\text {miss}}}$ distributions in semileptonic channel control regions enriched in (a) dileptonic $\mathrm{ t \bar{t} }$, (b) $ {W+\textrm {jets}}$ events. Data (black dots) and simulated backgrounds (filled histograms) are compared for an integrated luminosity of 2.2 fb$^{-1}$. The gray dashed band indicates the statistical uncertainty on the predicted background. |
png pdf |
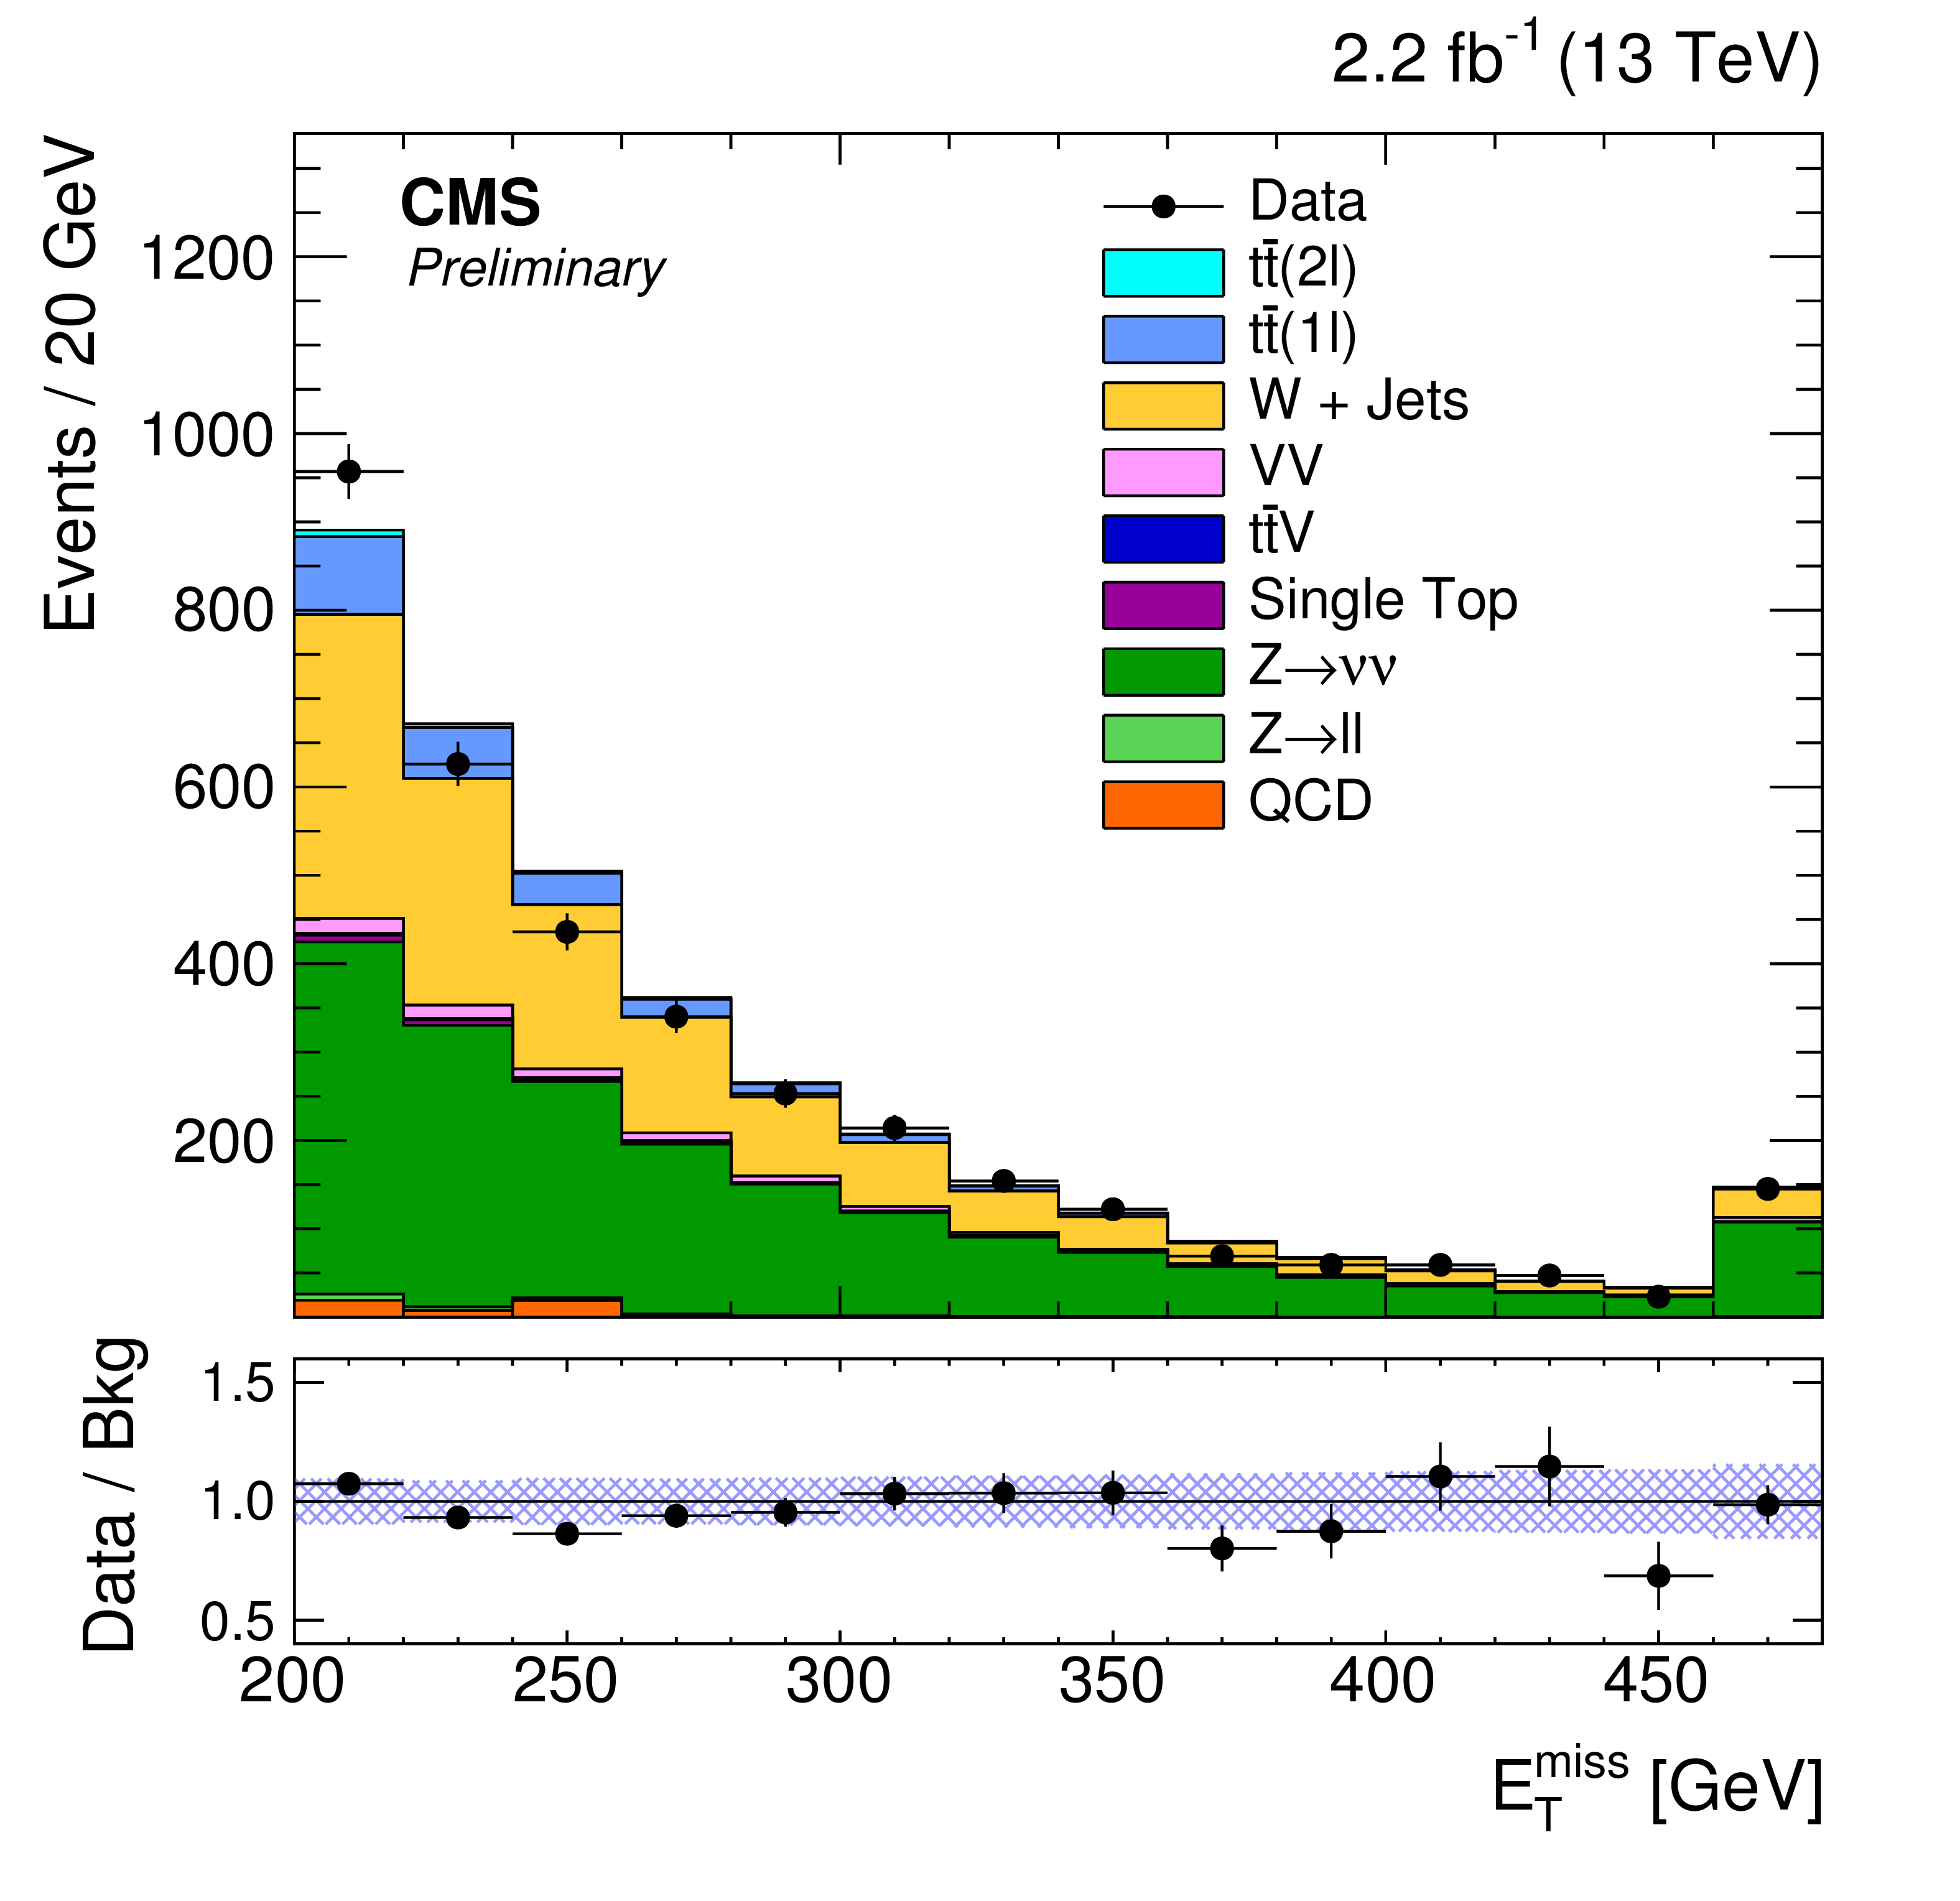
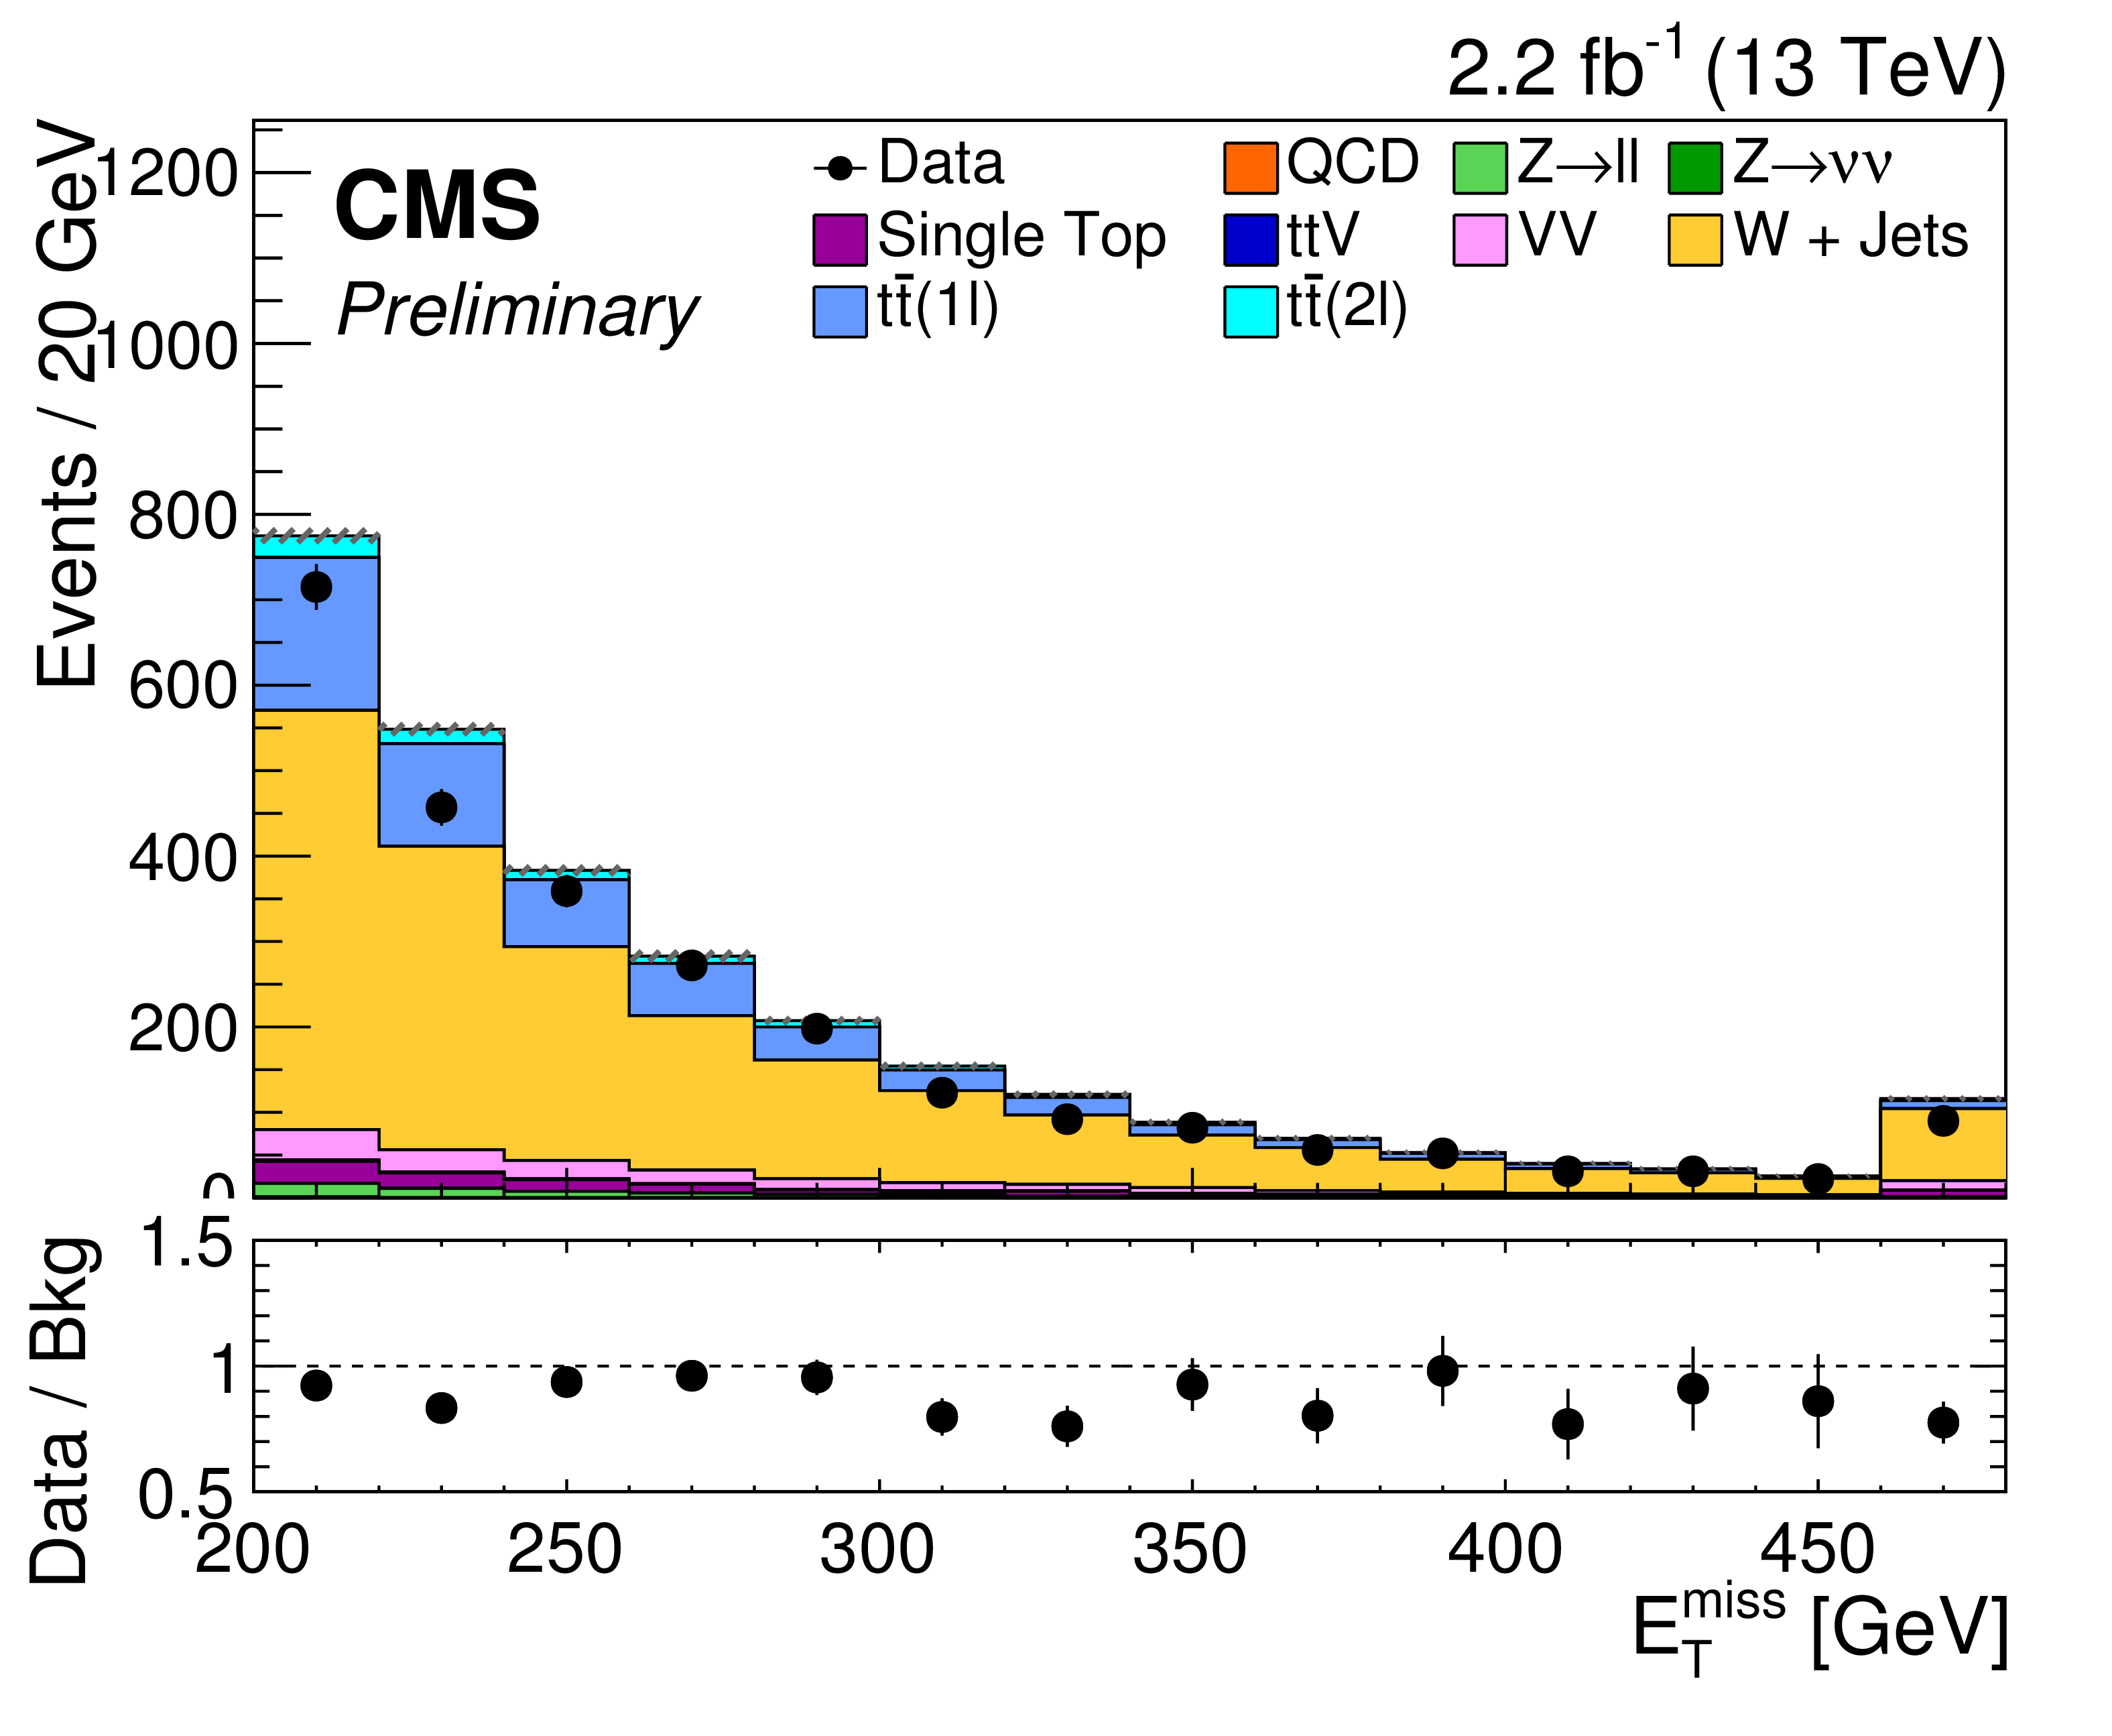
Figure 6-b:
${E_{\mathrm {T}}^{\text {miss}}}$ distributions in semileptonic channel control regions enriched in (a) dileptonic $\mathrm{ t \bar{t} }$, (b) $ {W+\textrm {jets}}$ events. Data (black dots) and simulated backgrounds (filled histograms) are compared for an integrated luminosity of 2.2 fb$^{-1}$. The gray dashed band indicates the statistical uncertainty on the predicted background. |
png pdf |
Figure 7-a:
${E_{\mathrm {T}}^{\text {miss}}}$ distributions for the categorised hadronic channel control regions enriched in semileptonic $\mathrm{ t \bar{t} }$ events ((a) and (b)) and enriched in $W/Z+\textrm {jets}$ events ((c) and (d)). Statistical and systematic uncertainties on the background prediction are included in the blue band on the lower panel. |

png pdf |
Figure 7-b:
${E_{\mathrm {T}}^{\text {miss}}}$ distributions for the categorised hadronic channel control regions enriched in semileptonic $\mathrm{ t \bar{t} }$ events ((a) and (b)) and enriched in $W/Z+\textrm {jets}$ events ((c) and (d)). Statistical and systematic uncertainties on the background prediction are included in the blue band on the lower panel. |
png pdf |
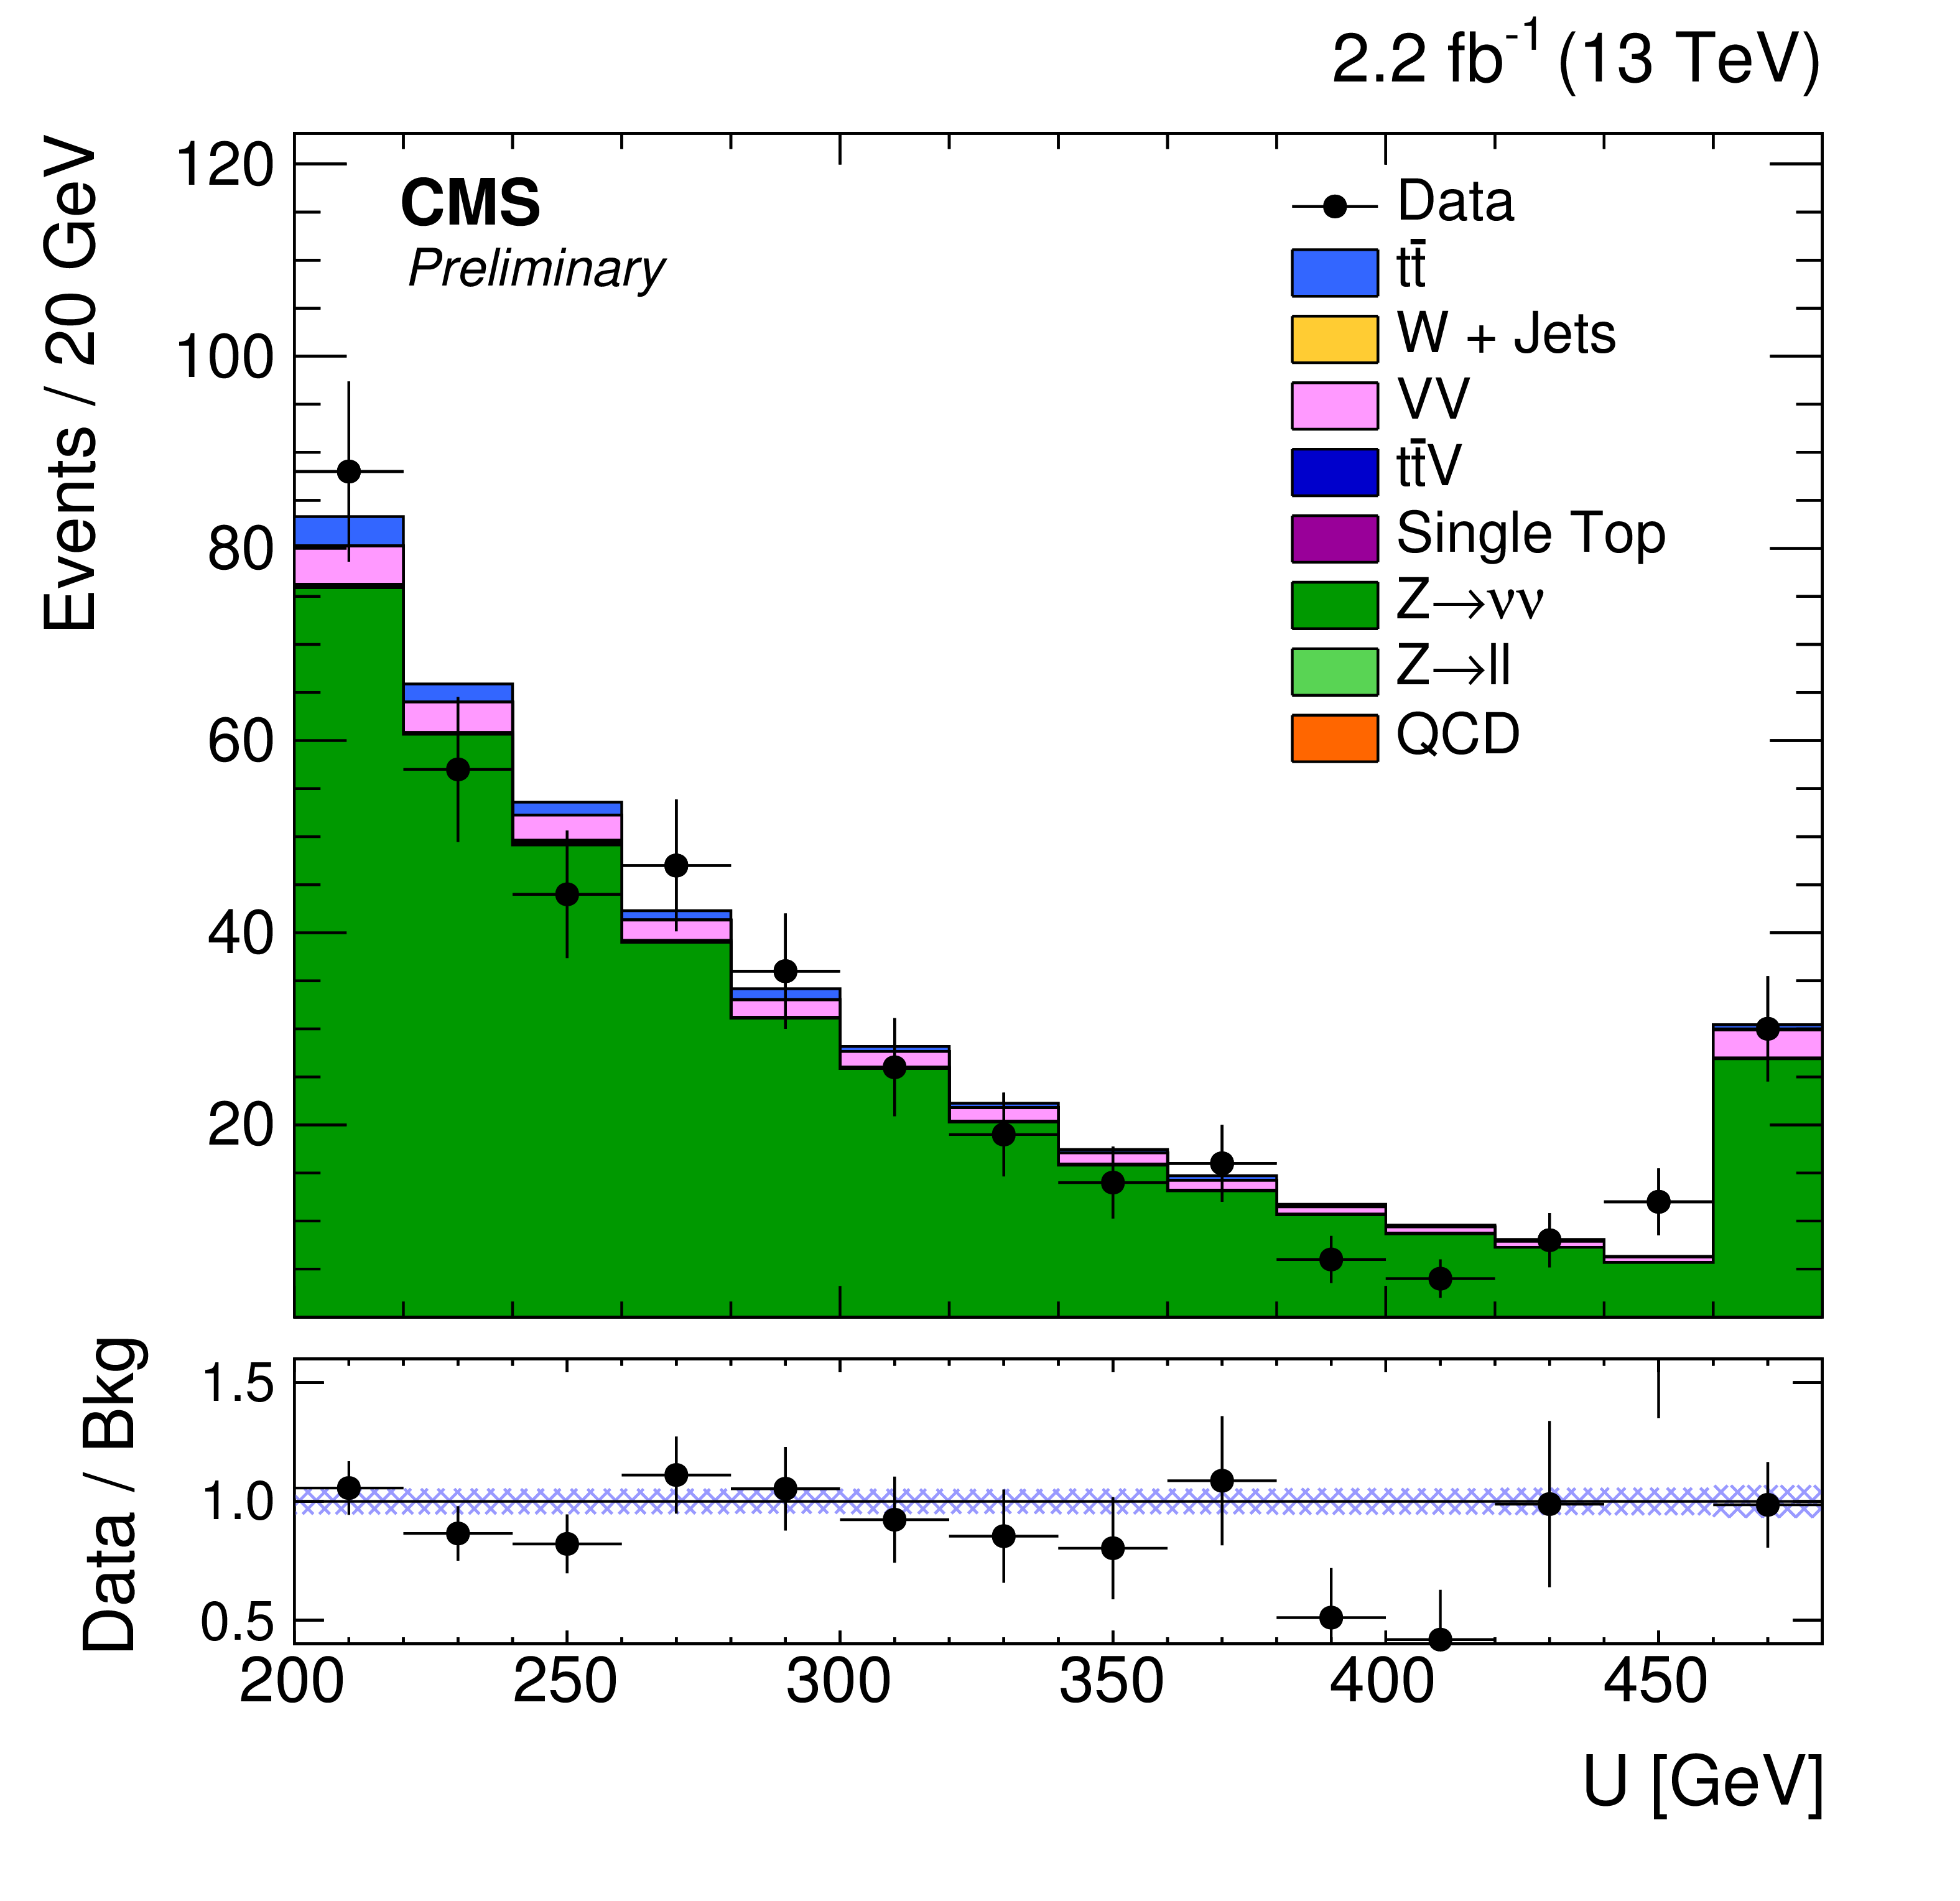
Figure 7-c:
${E_{\mathrm {T}}^{\text {miss}}}$ distributions for the categorised hadronic channel control regions enriched in semileptonic $\mathrm{ t \bar{t} }$ events ((a) and (b)) and enriched in $W/Z+\textrm {jets}$ events ((c) and (d)). Statistical and systematic uncertainties on the background prediction are included in the blue band on the lower panel. |
png pdf |
Figure 7-d:
${E_{\mathrm {T}}^{\text {miss}}}$ distributions for the categorised hadronic channel control regions enriched in semileptonic $\mathrm{ t \bar{t} }$ events ((a) and (b)) and enriched in $W/Z+\textrm {jets}$ events ((c) and (d)). Statistical and systematic uncertainties on the background prediction are included in the blue band on the lower panel. |

png pdf |
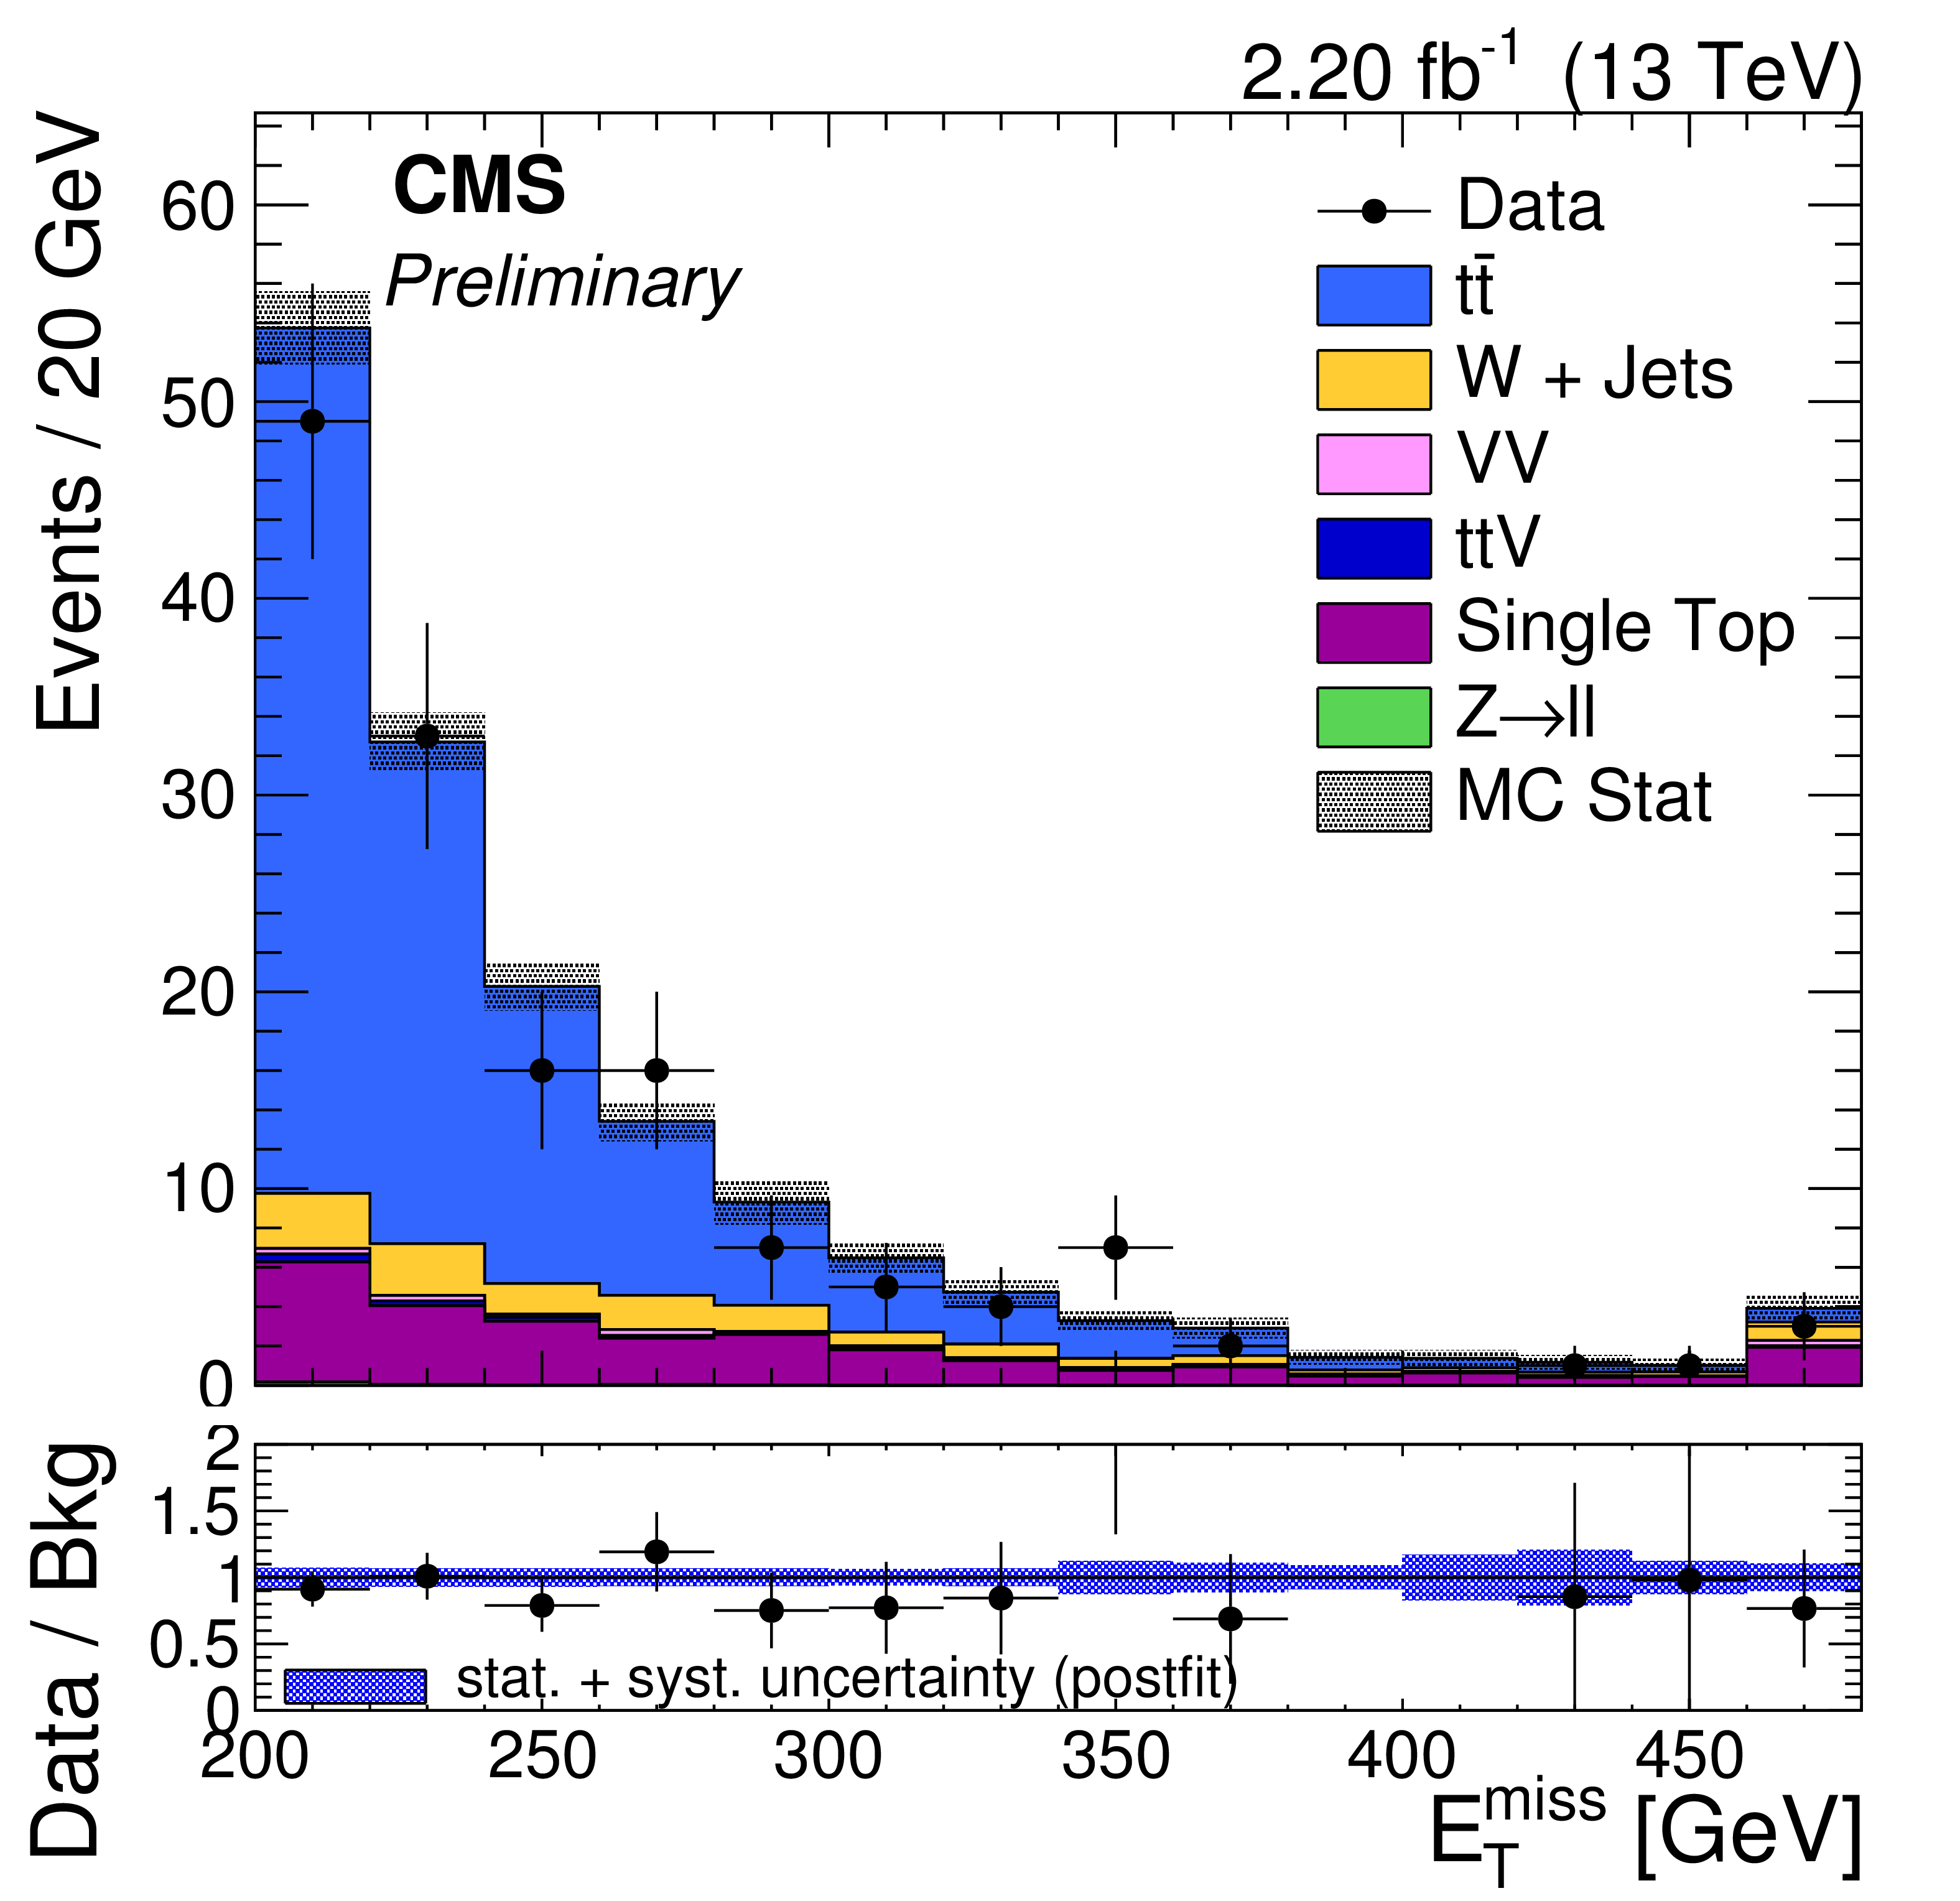
Figure 8-a:
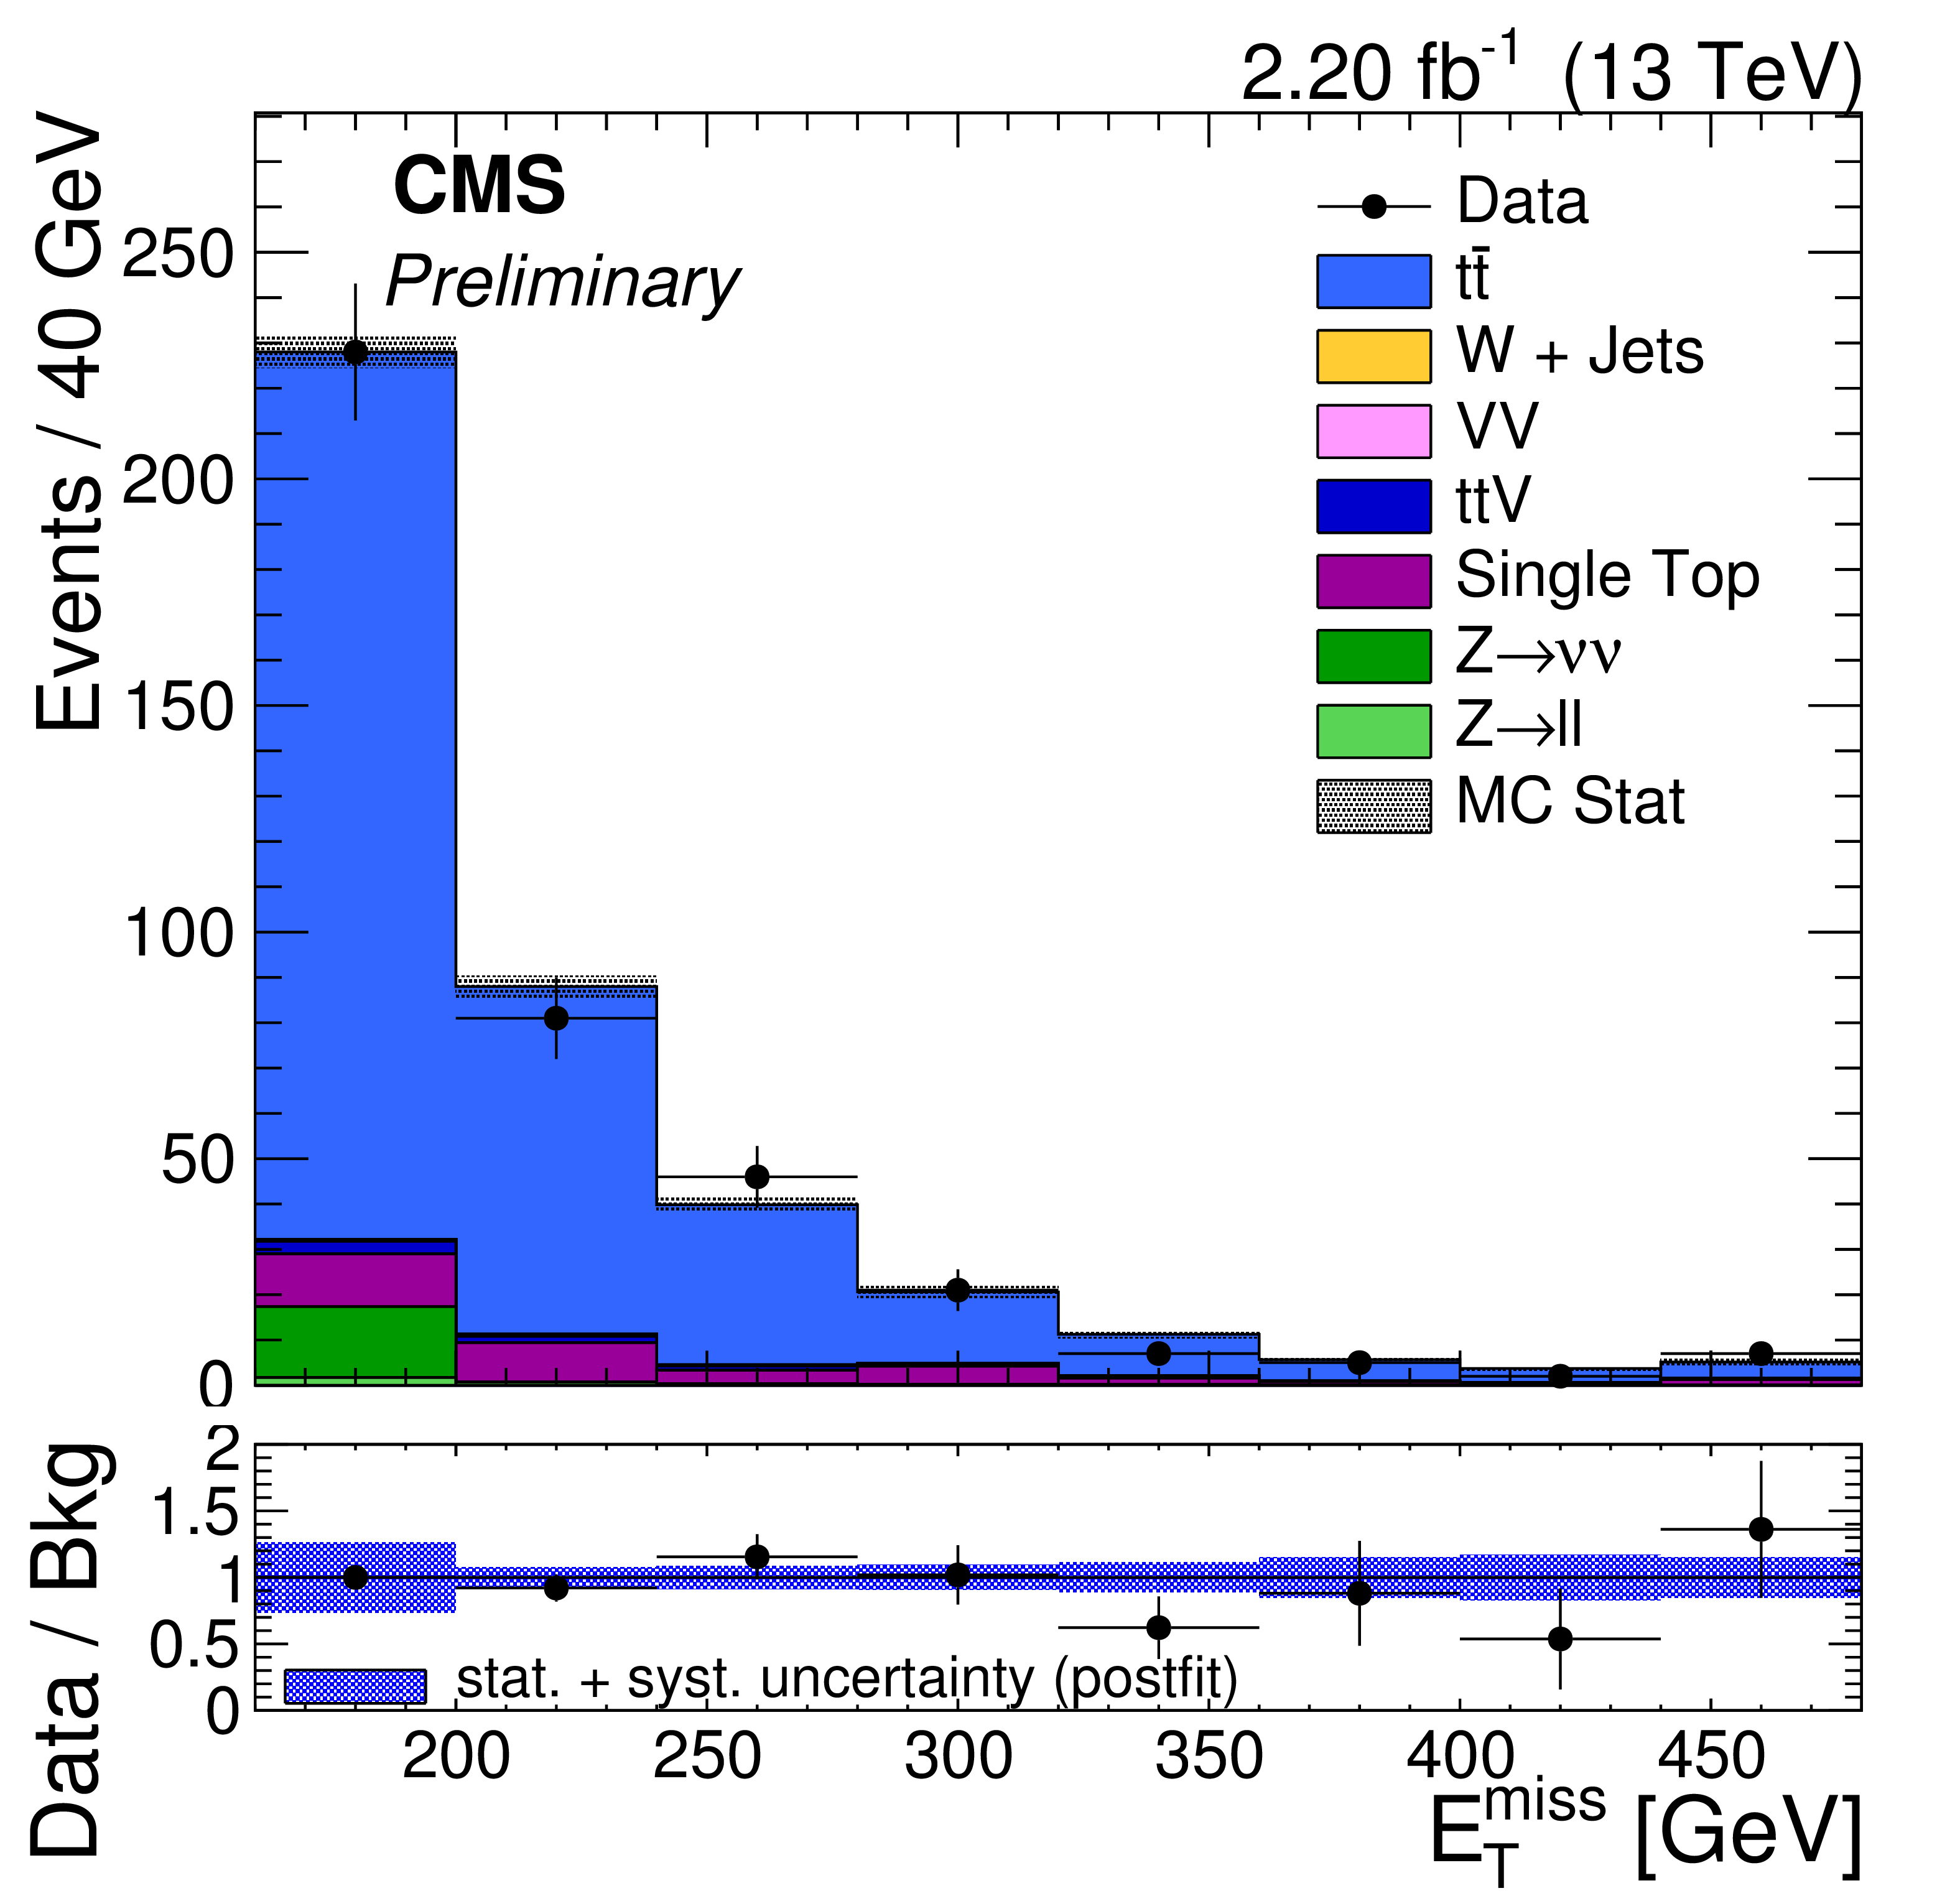
Post-fit distributions of ${E_{\mathrm {T}}^{\text {miss}}}$ expected from SM backgrounds and observed in data in the signal regions for the (a) semileptonic, (b) inclusive hadronic, (c) two top tags hadronic category and (c) less than two top tags hadronic category. The expected distributions are shown after fitting to the observed data simultaneously across signal and control regions with an assumption of zero signal contribution. The overall post-fit uncertainties are shown in the blue band on the lower panel. |

png pdf |
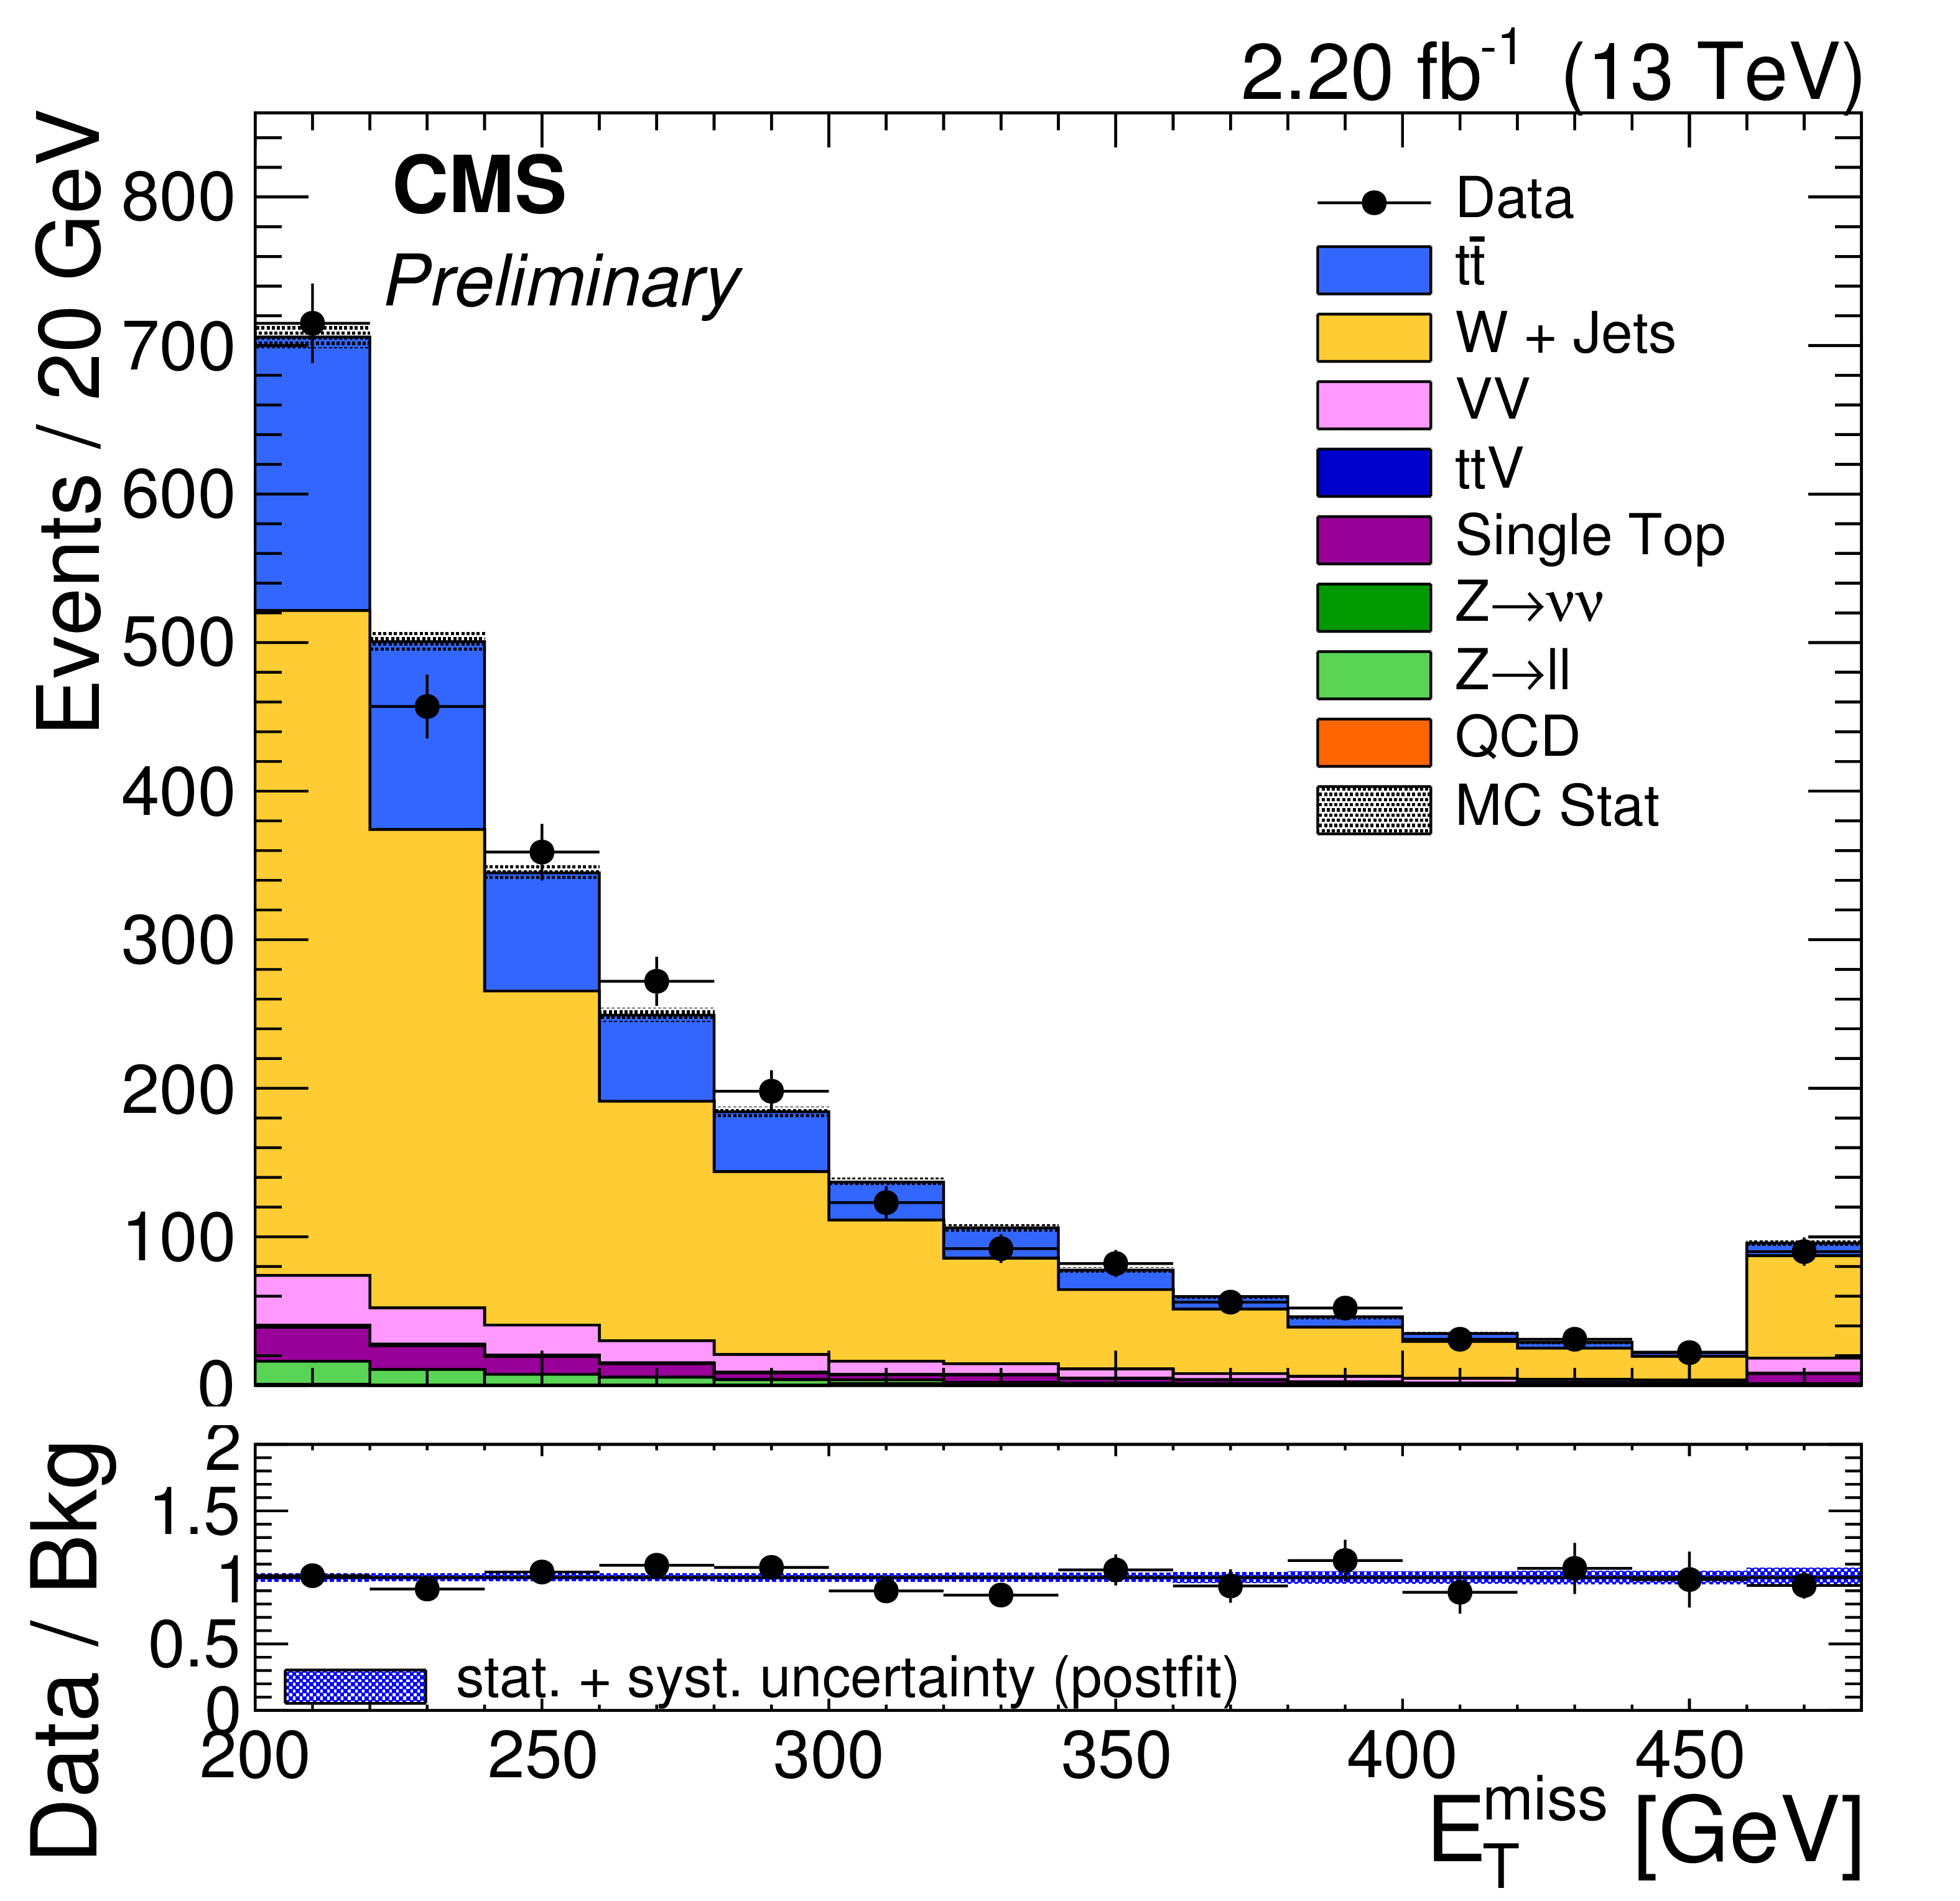
Figure 8-b:
Post-fit distributions of ${E_{\mathrm {T}}^{\text {miss}}}$ expected from SM backgrounds and observed in data in the signal regions for the (a) semileptonic, (b) inclusive hadronic, (c) two top tags hadronic category and (c) less than two top tags hadronic category. The expected distributions are shown after fitting to the observed data simultaneously across signal and control regions with an assumption of zero signal contribution. The overall post-fit uncertainties are shown in the blue band on the lower panel. |
png pdf |
Figure 8-c:
Post-fit distributions of ${E_{\mathrm {T}}^{\text {miss}}}$ expected from SM backgrounds and observed in data in the signal regions for the (a) semileptonic, (b) inclusive hadronic, (c) two top tags hadronic category and (c) less than two top tags hadronic category. The expected distributions are shown after fitting to the observed data simultaneously across signal and control regions with an assumption of zero signal contribution. The overall post-fit uncertainties are shown in the blue band on the lower panel. |
png pdf |
Figure 8-d:
Post-fit distributions of ${E_{\mathrm {T}}^{\text {miss}}}$ expected from SM backgrounds and observed in data in the signal regions for the (a) semileptonic, (b) inclusive hadronic, (c) two top tags hadronic category and (c) less than two top tags hadronic category. The expected distributions are shown after fitting to the observed data simultaneously across signal and control regions with an assumption of zero signal contribution. The overall post-fit uncertainties are shown in the blue band on the lower panel. |
png pdf |
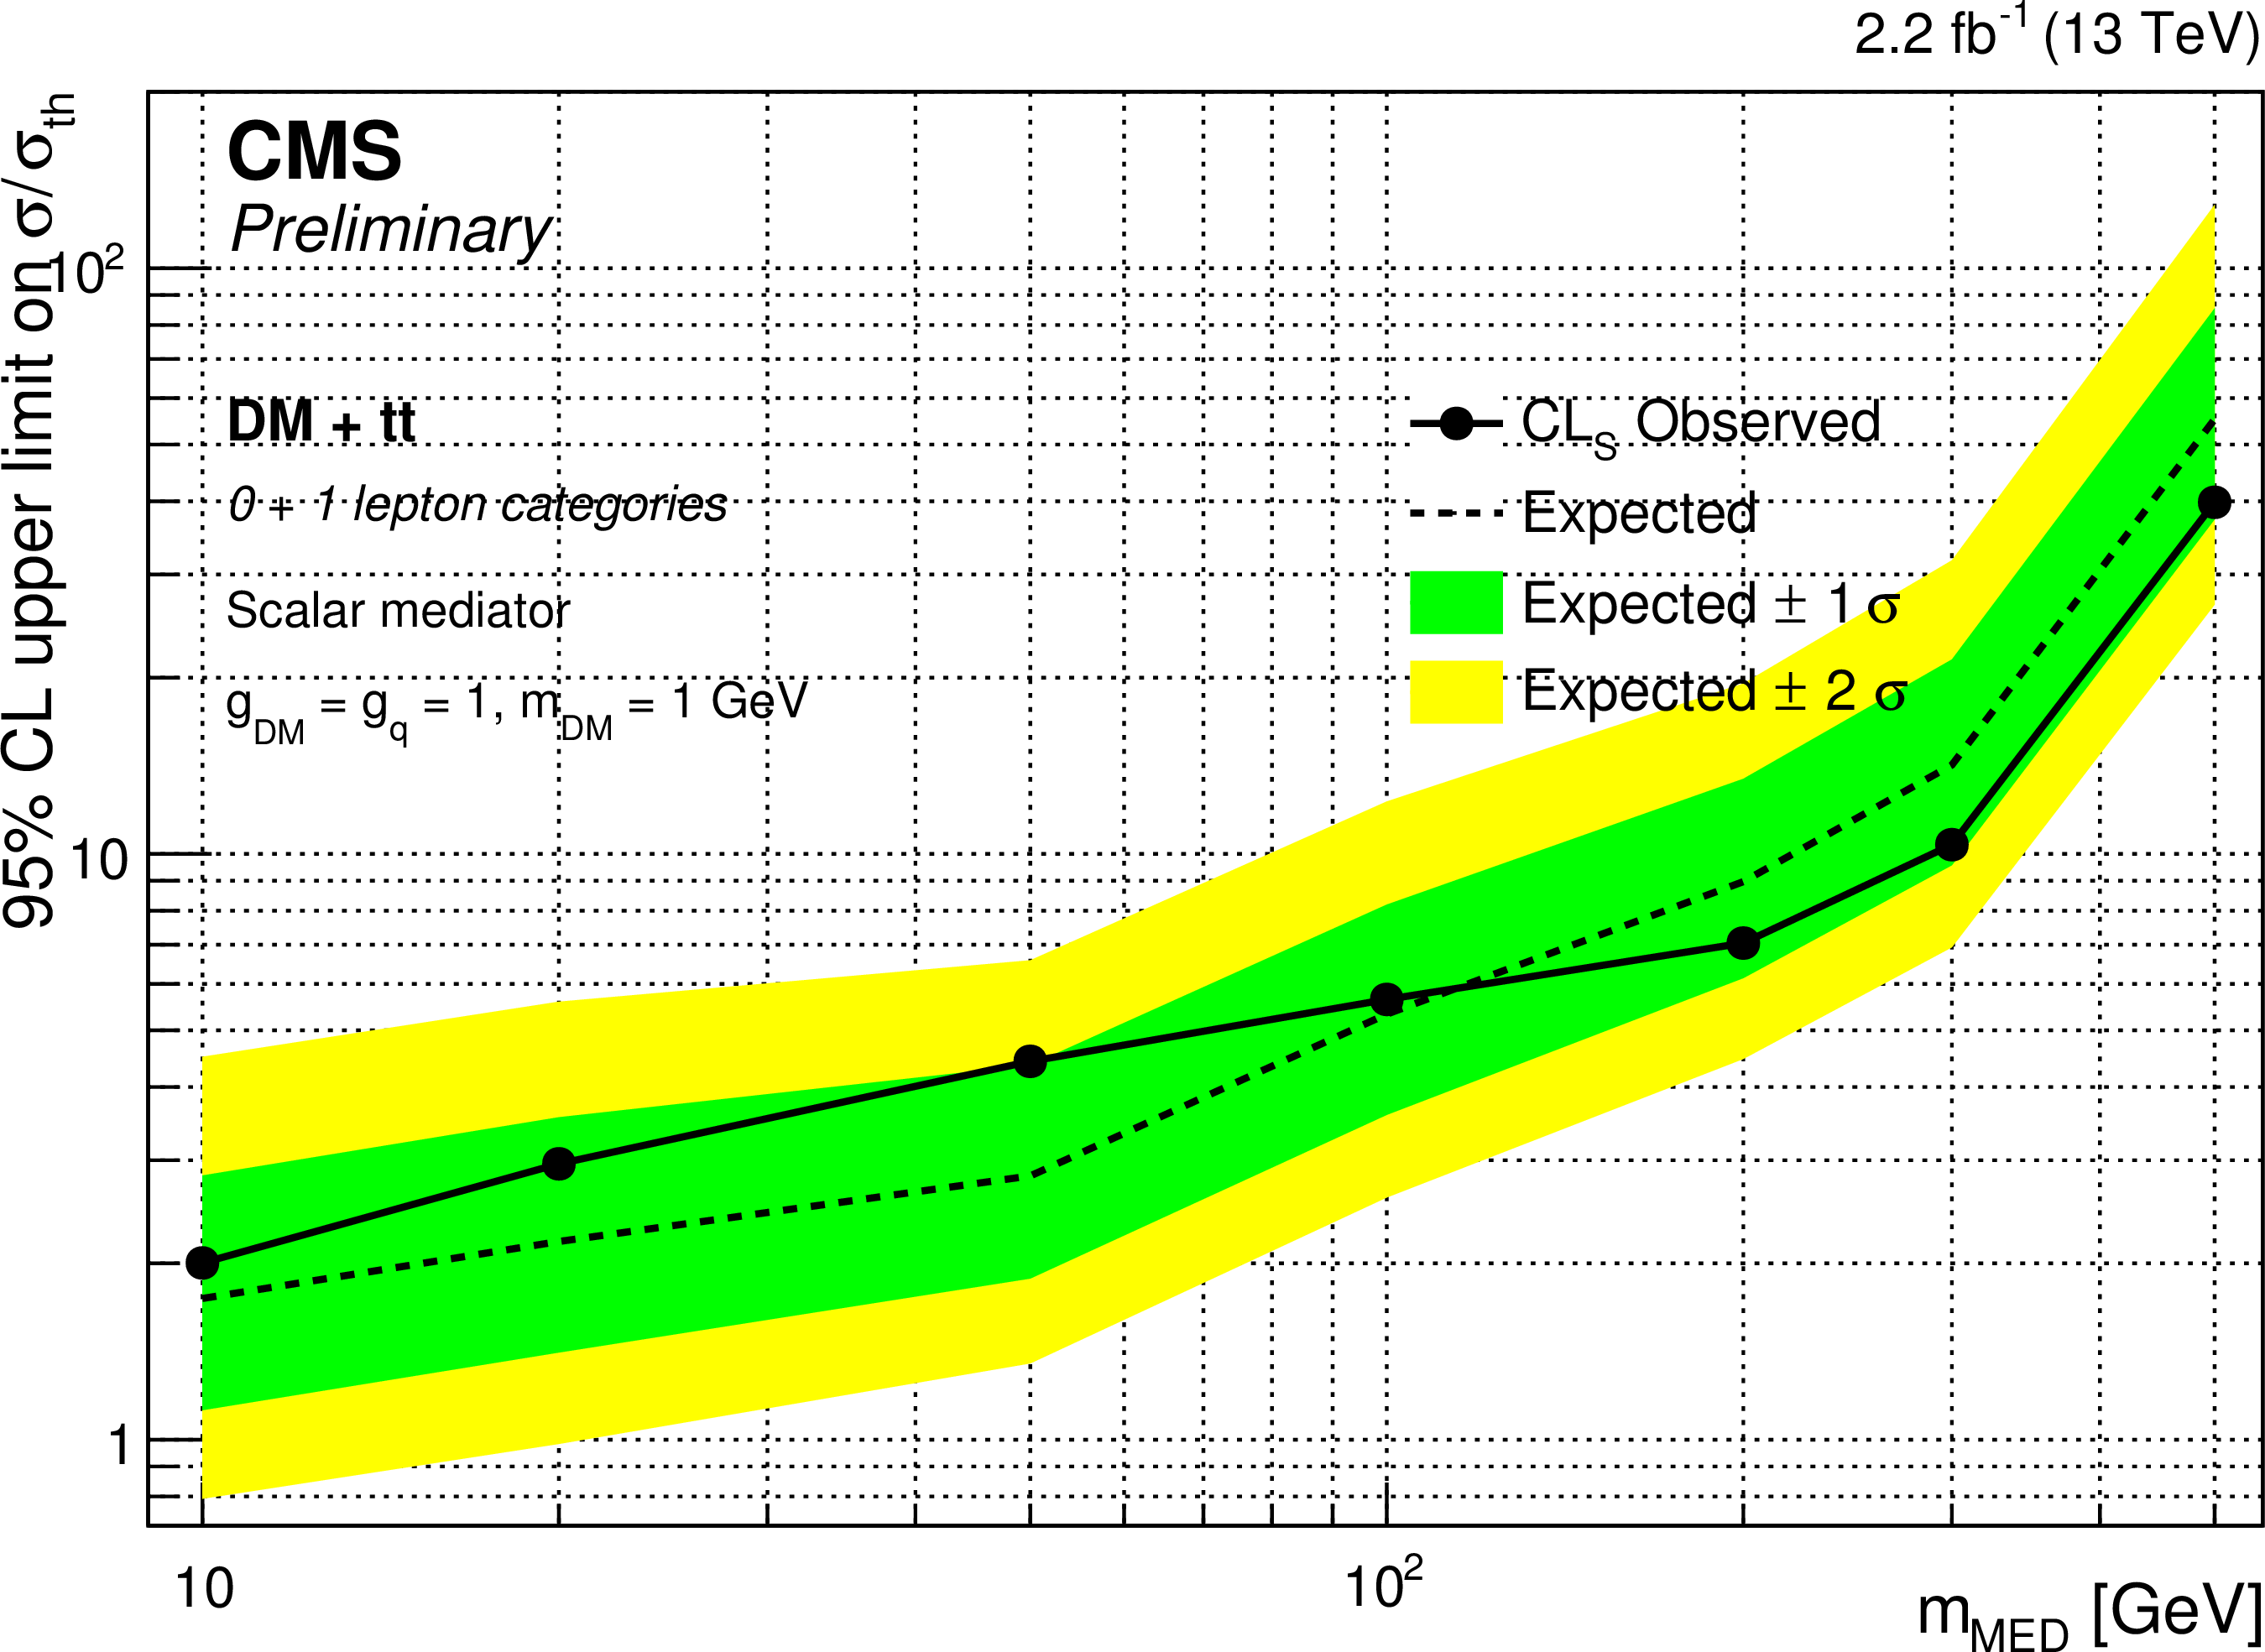
Figure 9-a:
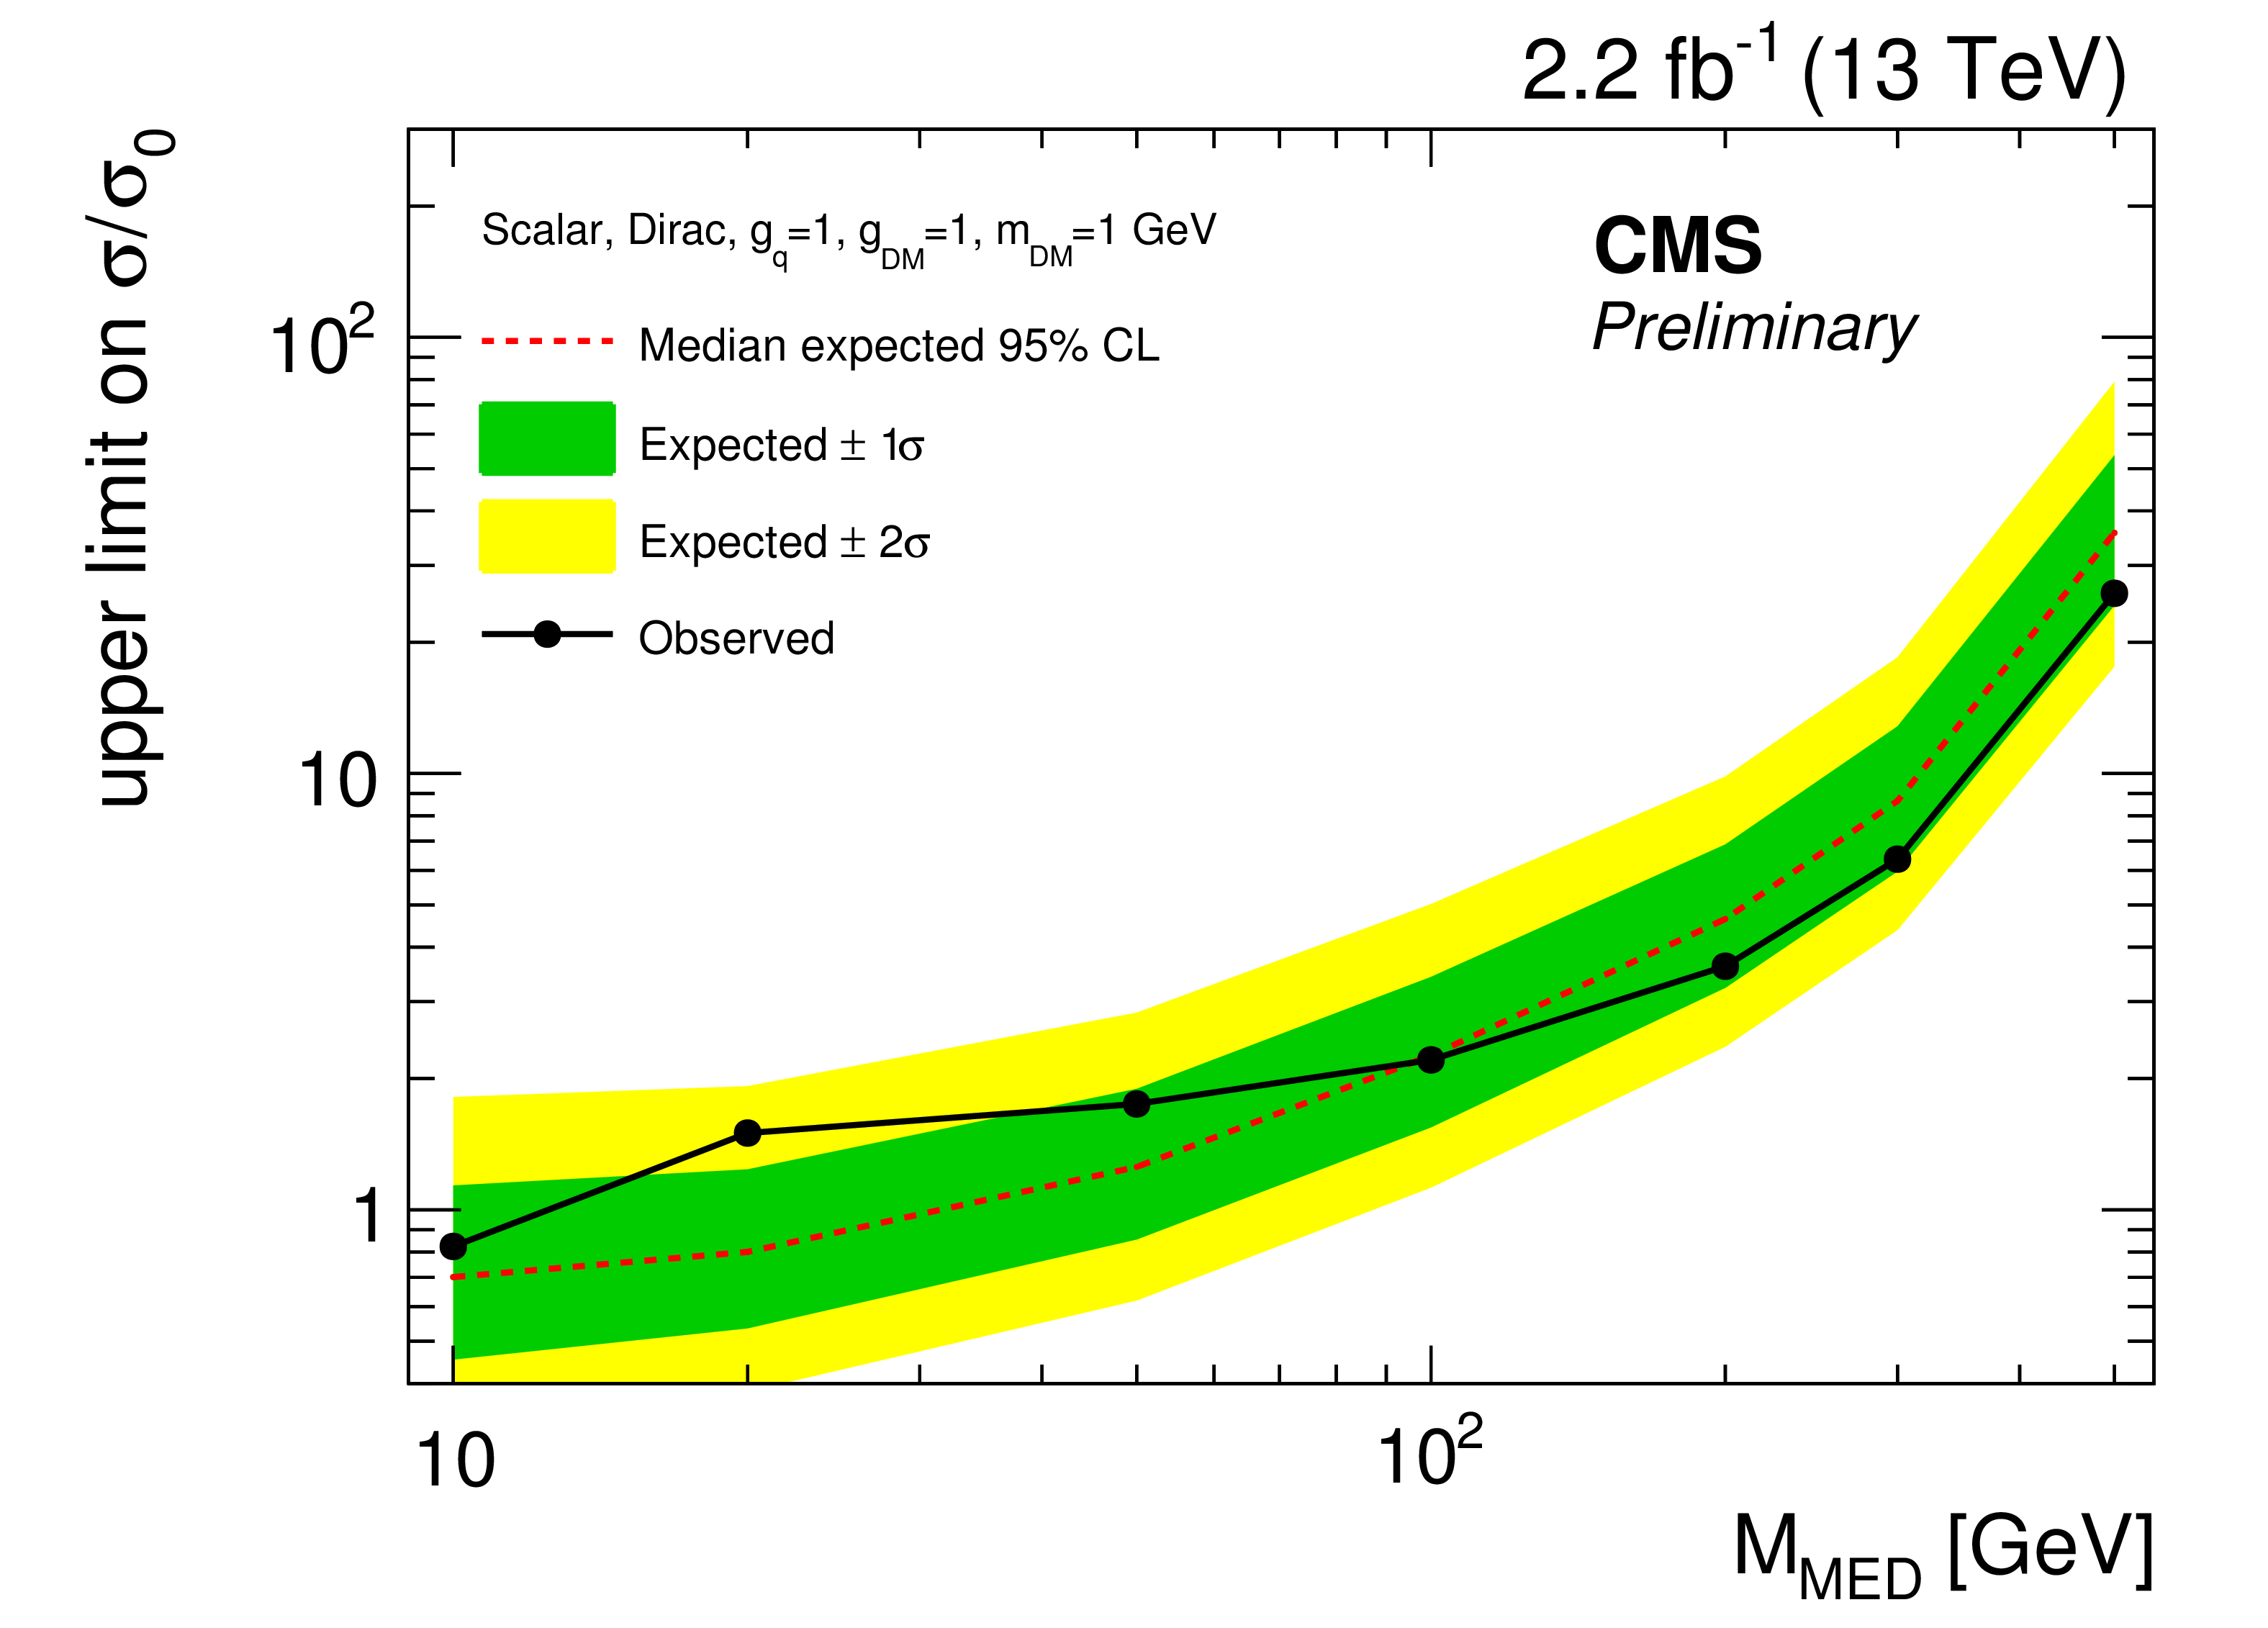
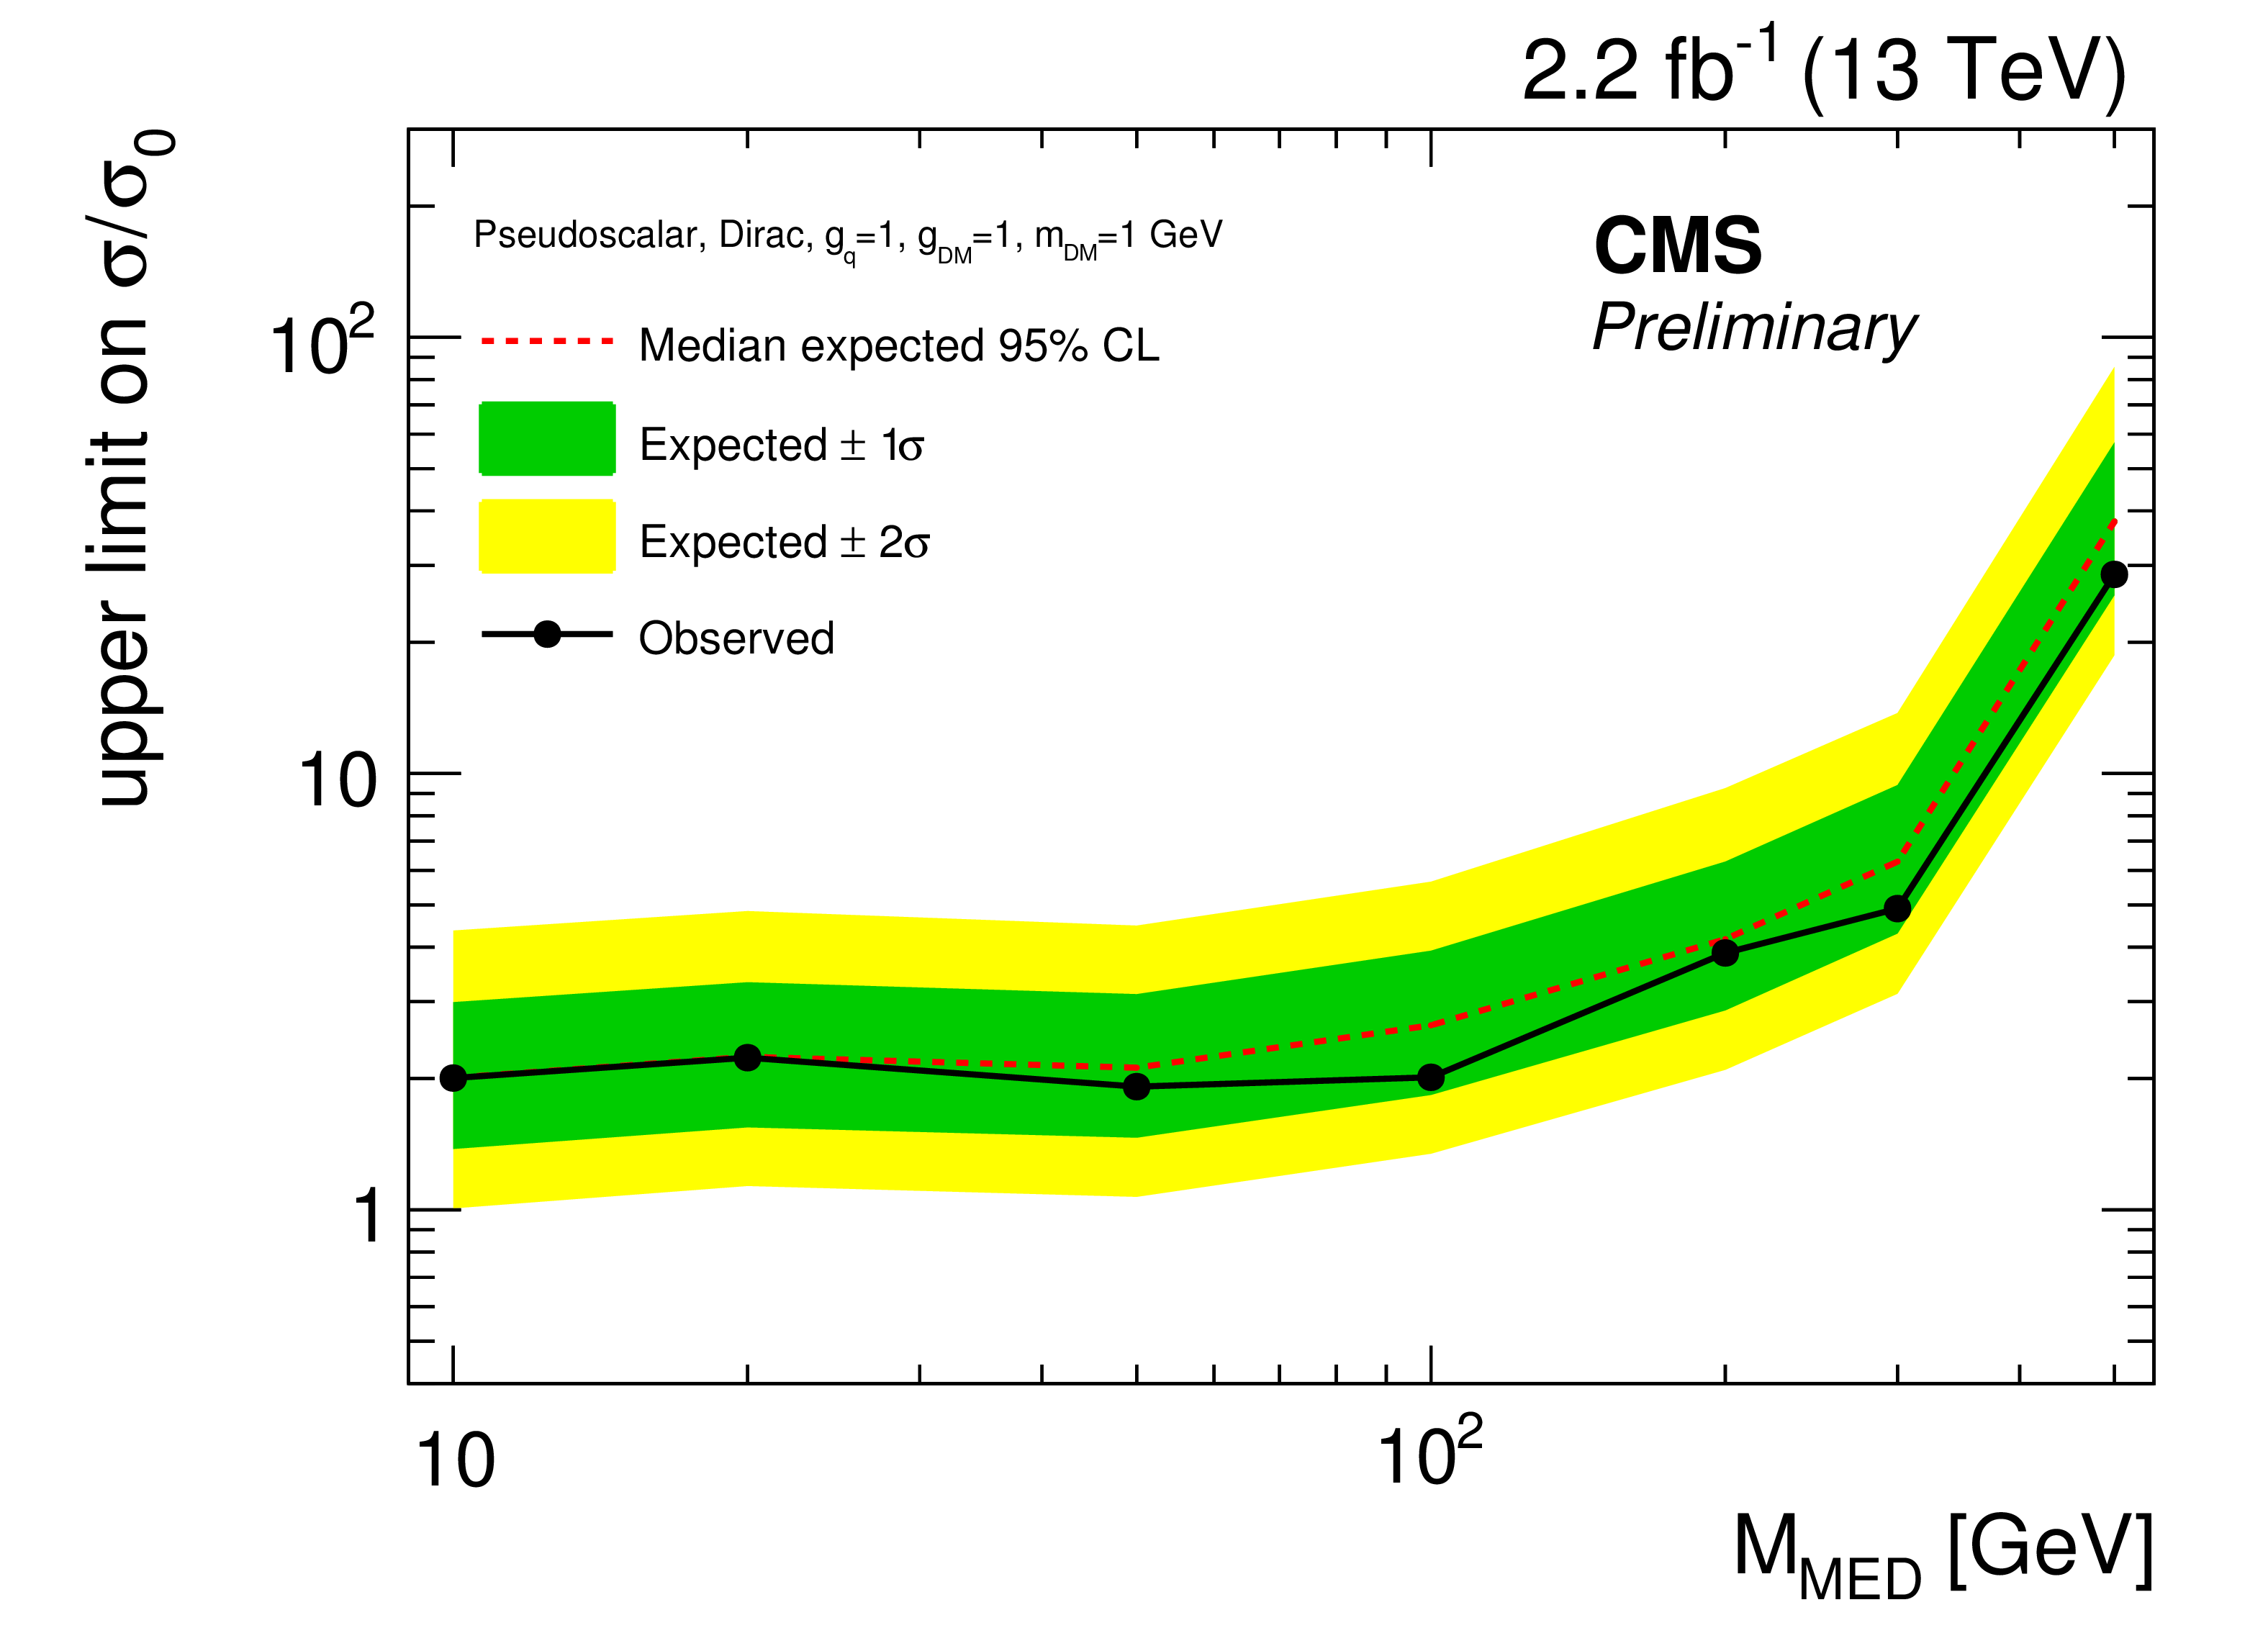
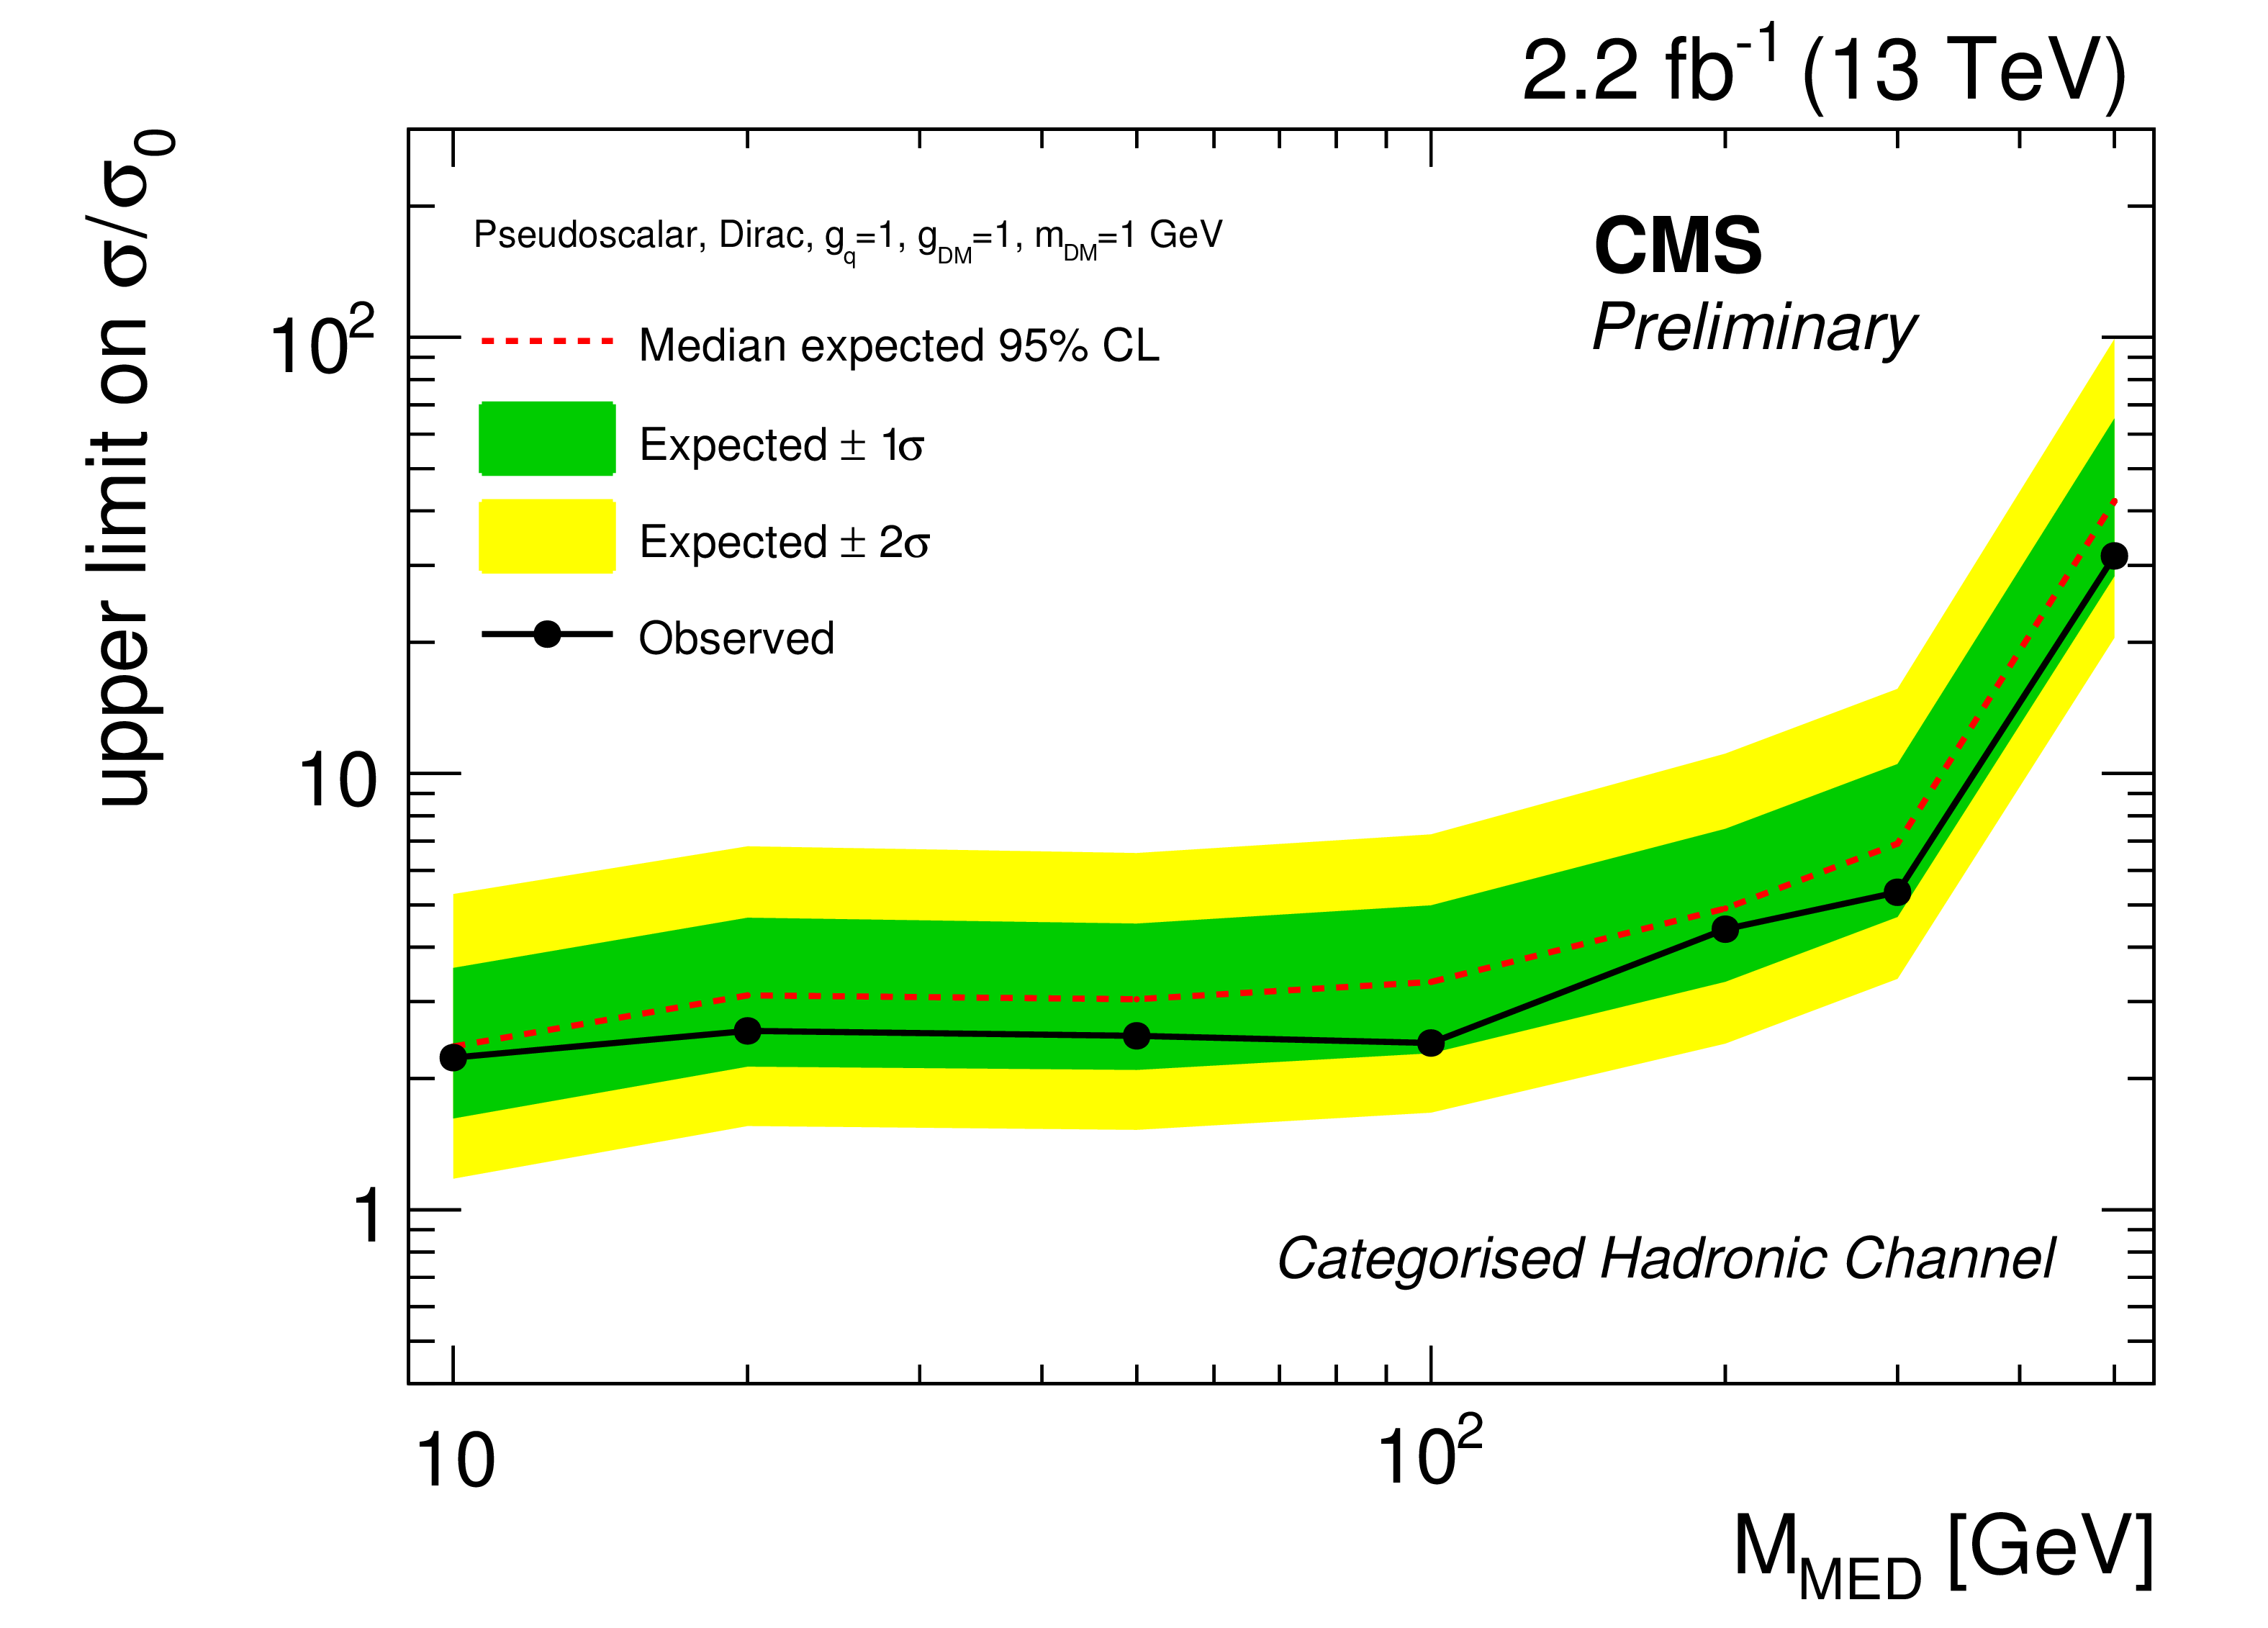
95% CL upper limit on the ratio of the DM production cross section to the simplified model expectation as a function of scalar (a) and pseudoscalar (b) mediator mass with semileptonic and categorised hadronic channels combined. The hypothesis of a DM candidate of mass equal to 1 GeV is considered. |
png pdf |
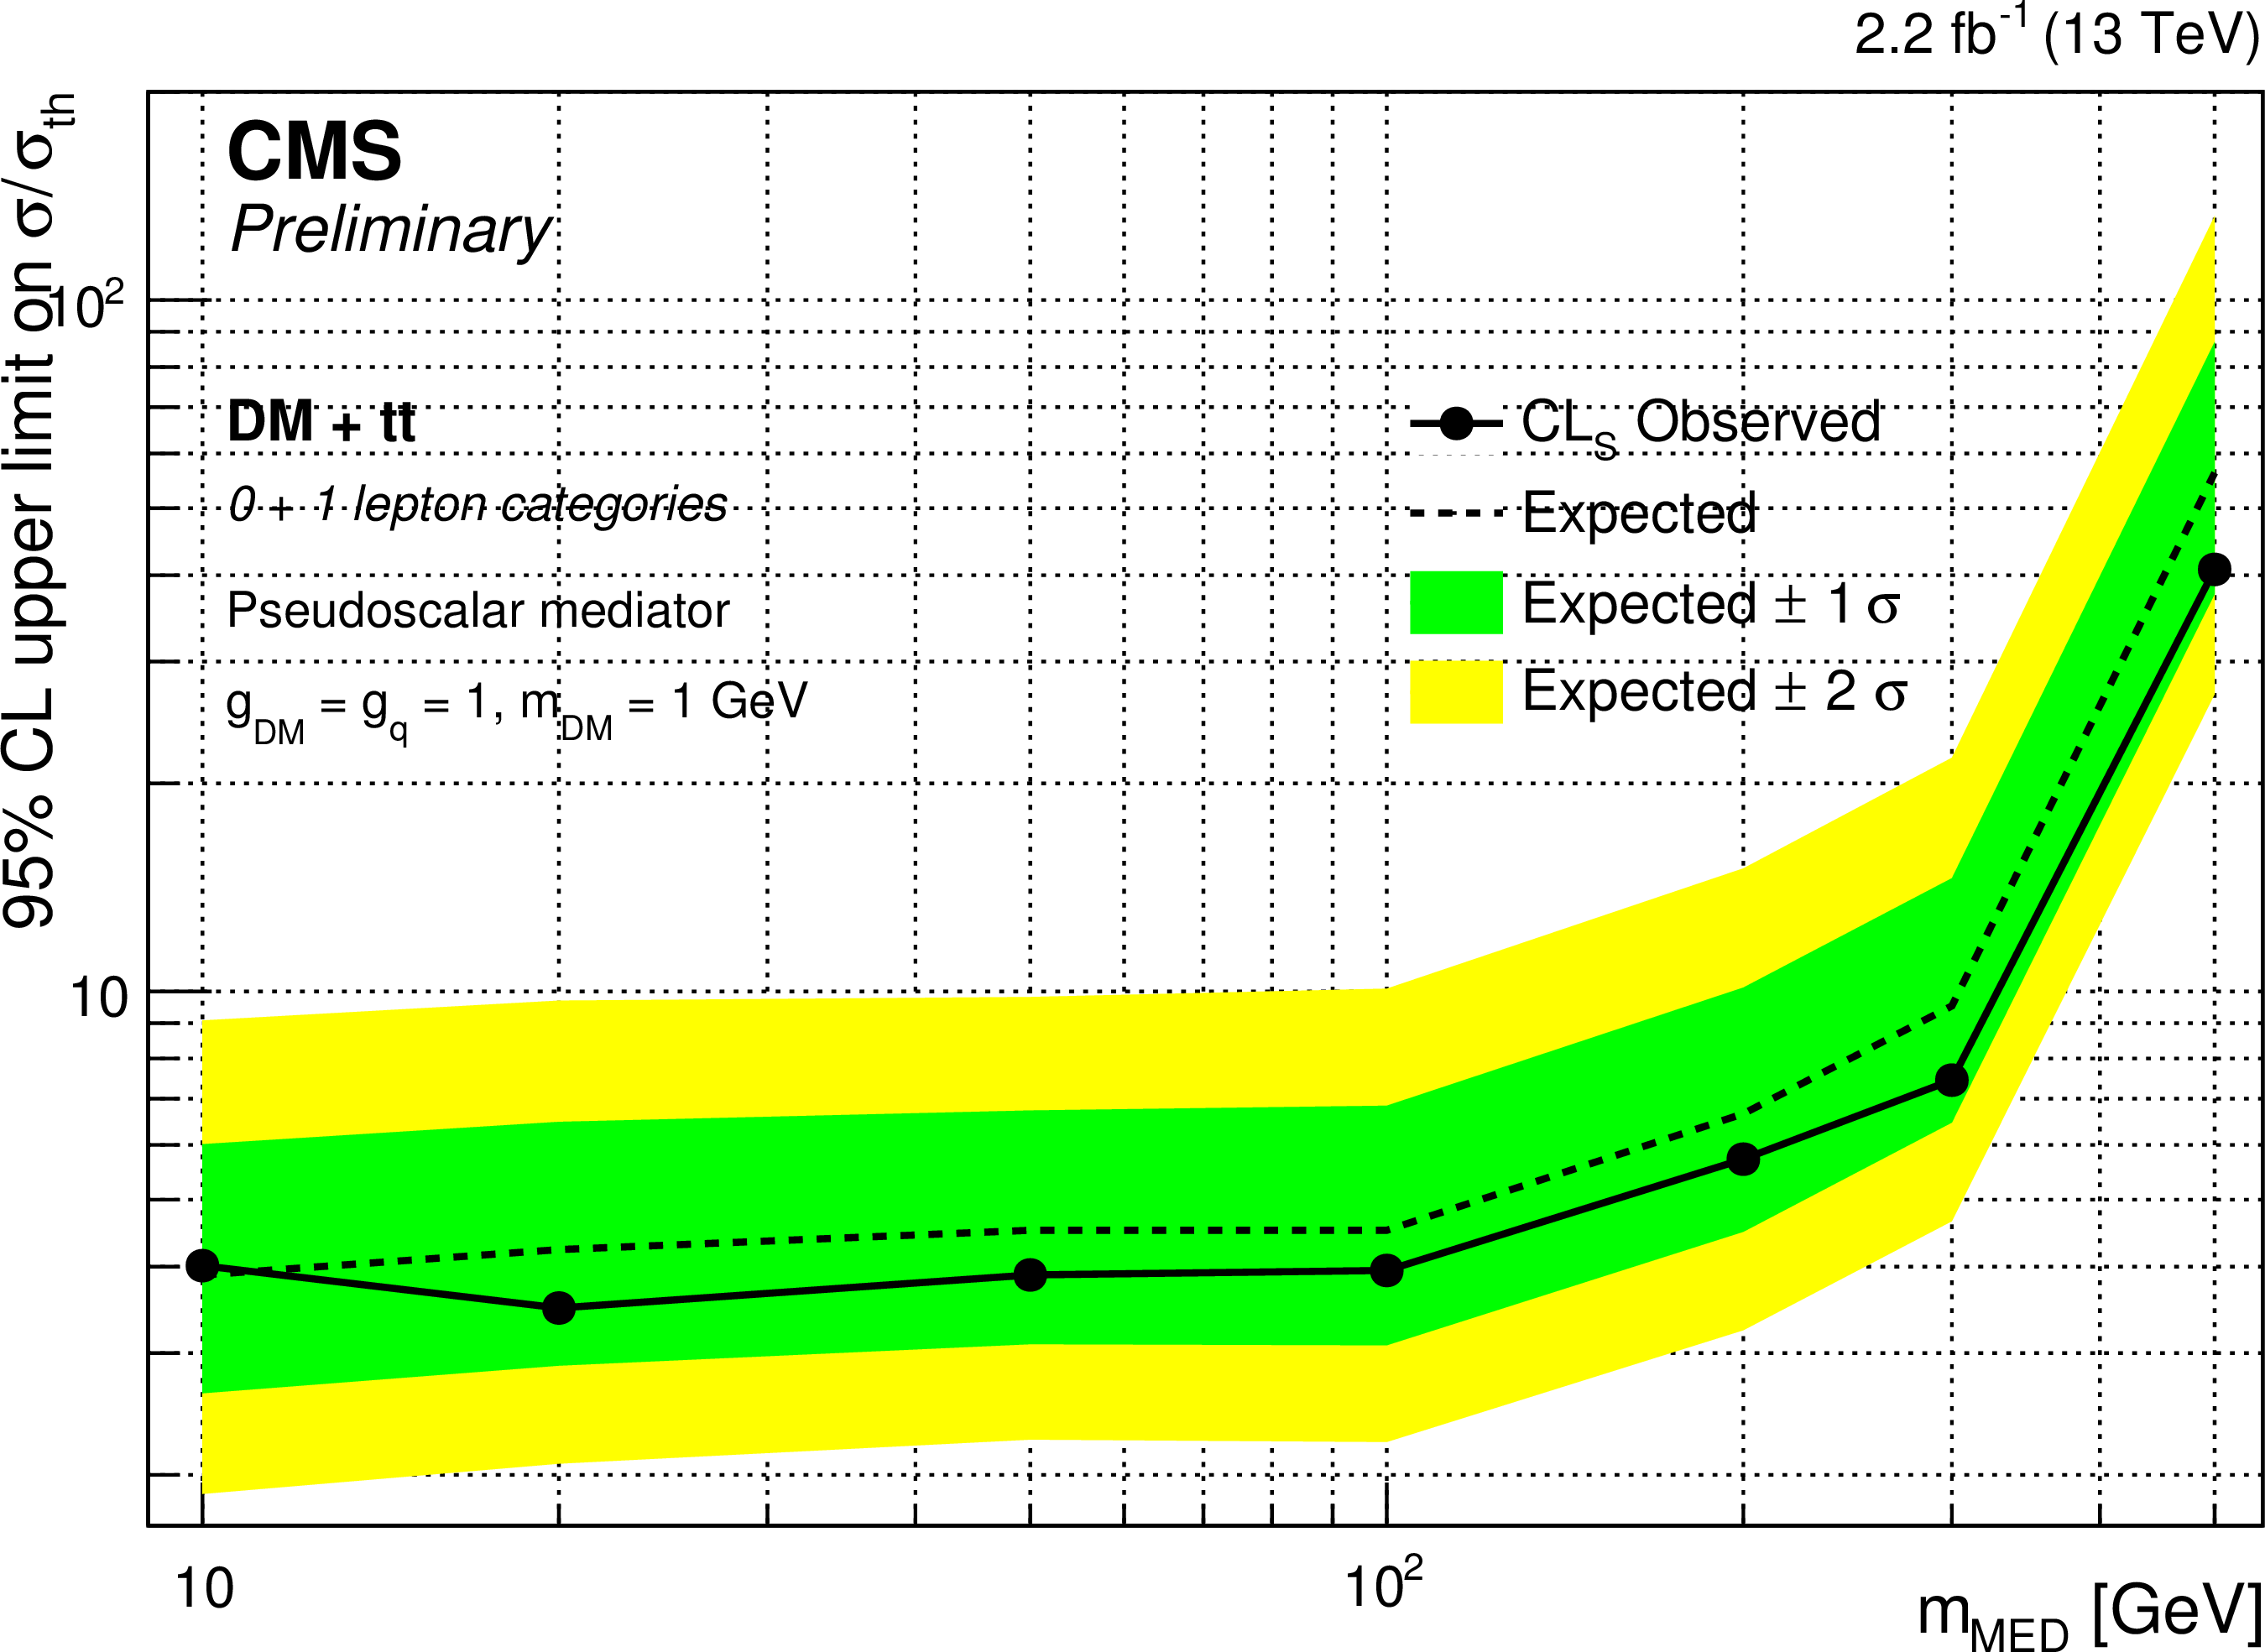
Figure 9-b:
95% CL upper limit on the ratio of the DM production cross section to the simplified model expectation as a function of scalar (a) and pseudoscalar (b) mediator mass with semileptonic and categorised hadronic channels combined. The hypothesis of a DM candidate of mass equal to 1 GeV is considered. |
| Tables | |

png pdf |
Table 1:
Observed and expected post-fit event yields with 2.2 fb$^{-1}$ of data in the signal region of the semileptonic channel. A-priori expected signal yields for the a few model points are listed. The uncertainties on the signal expectations are statistical only. |
png pdf |
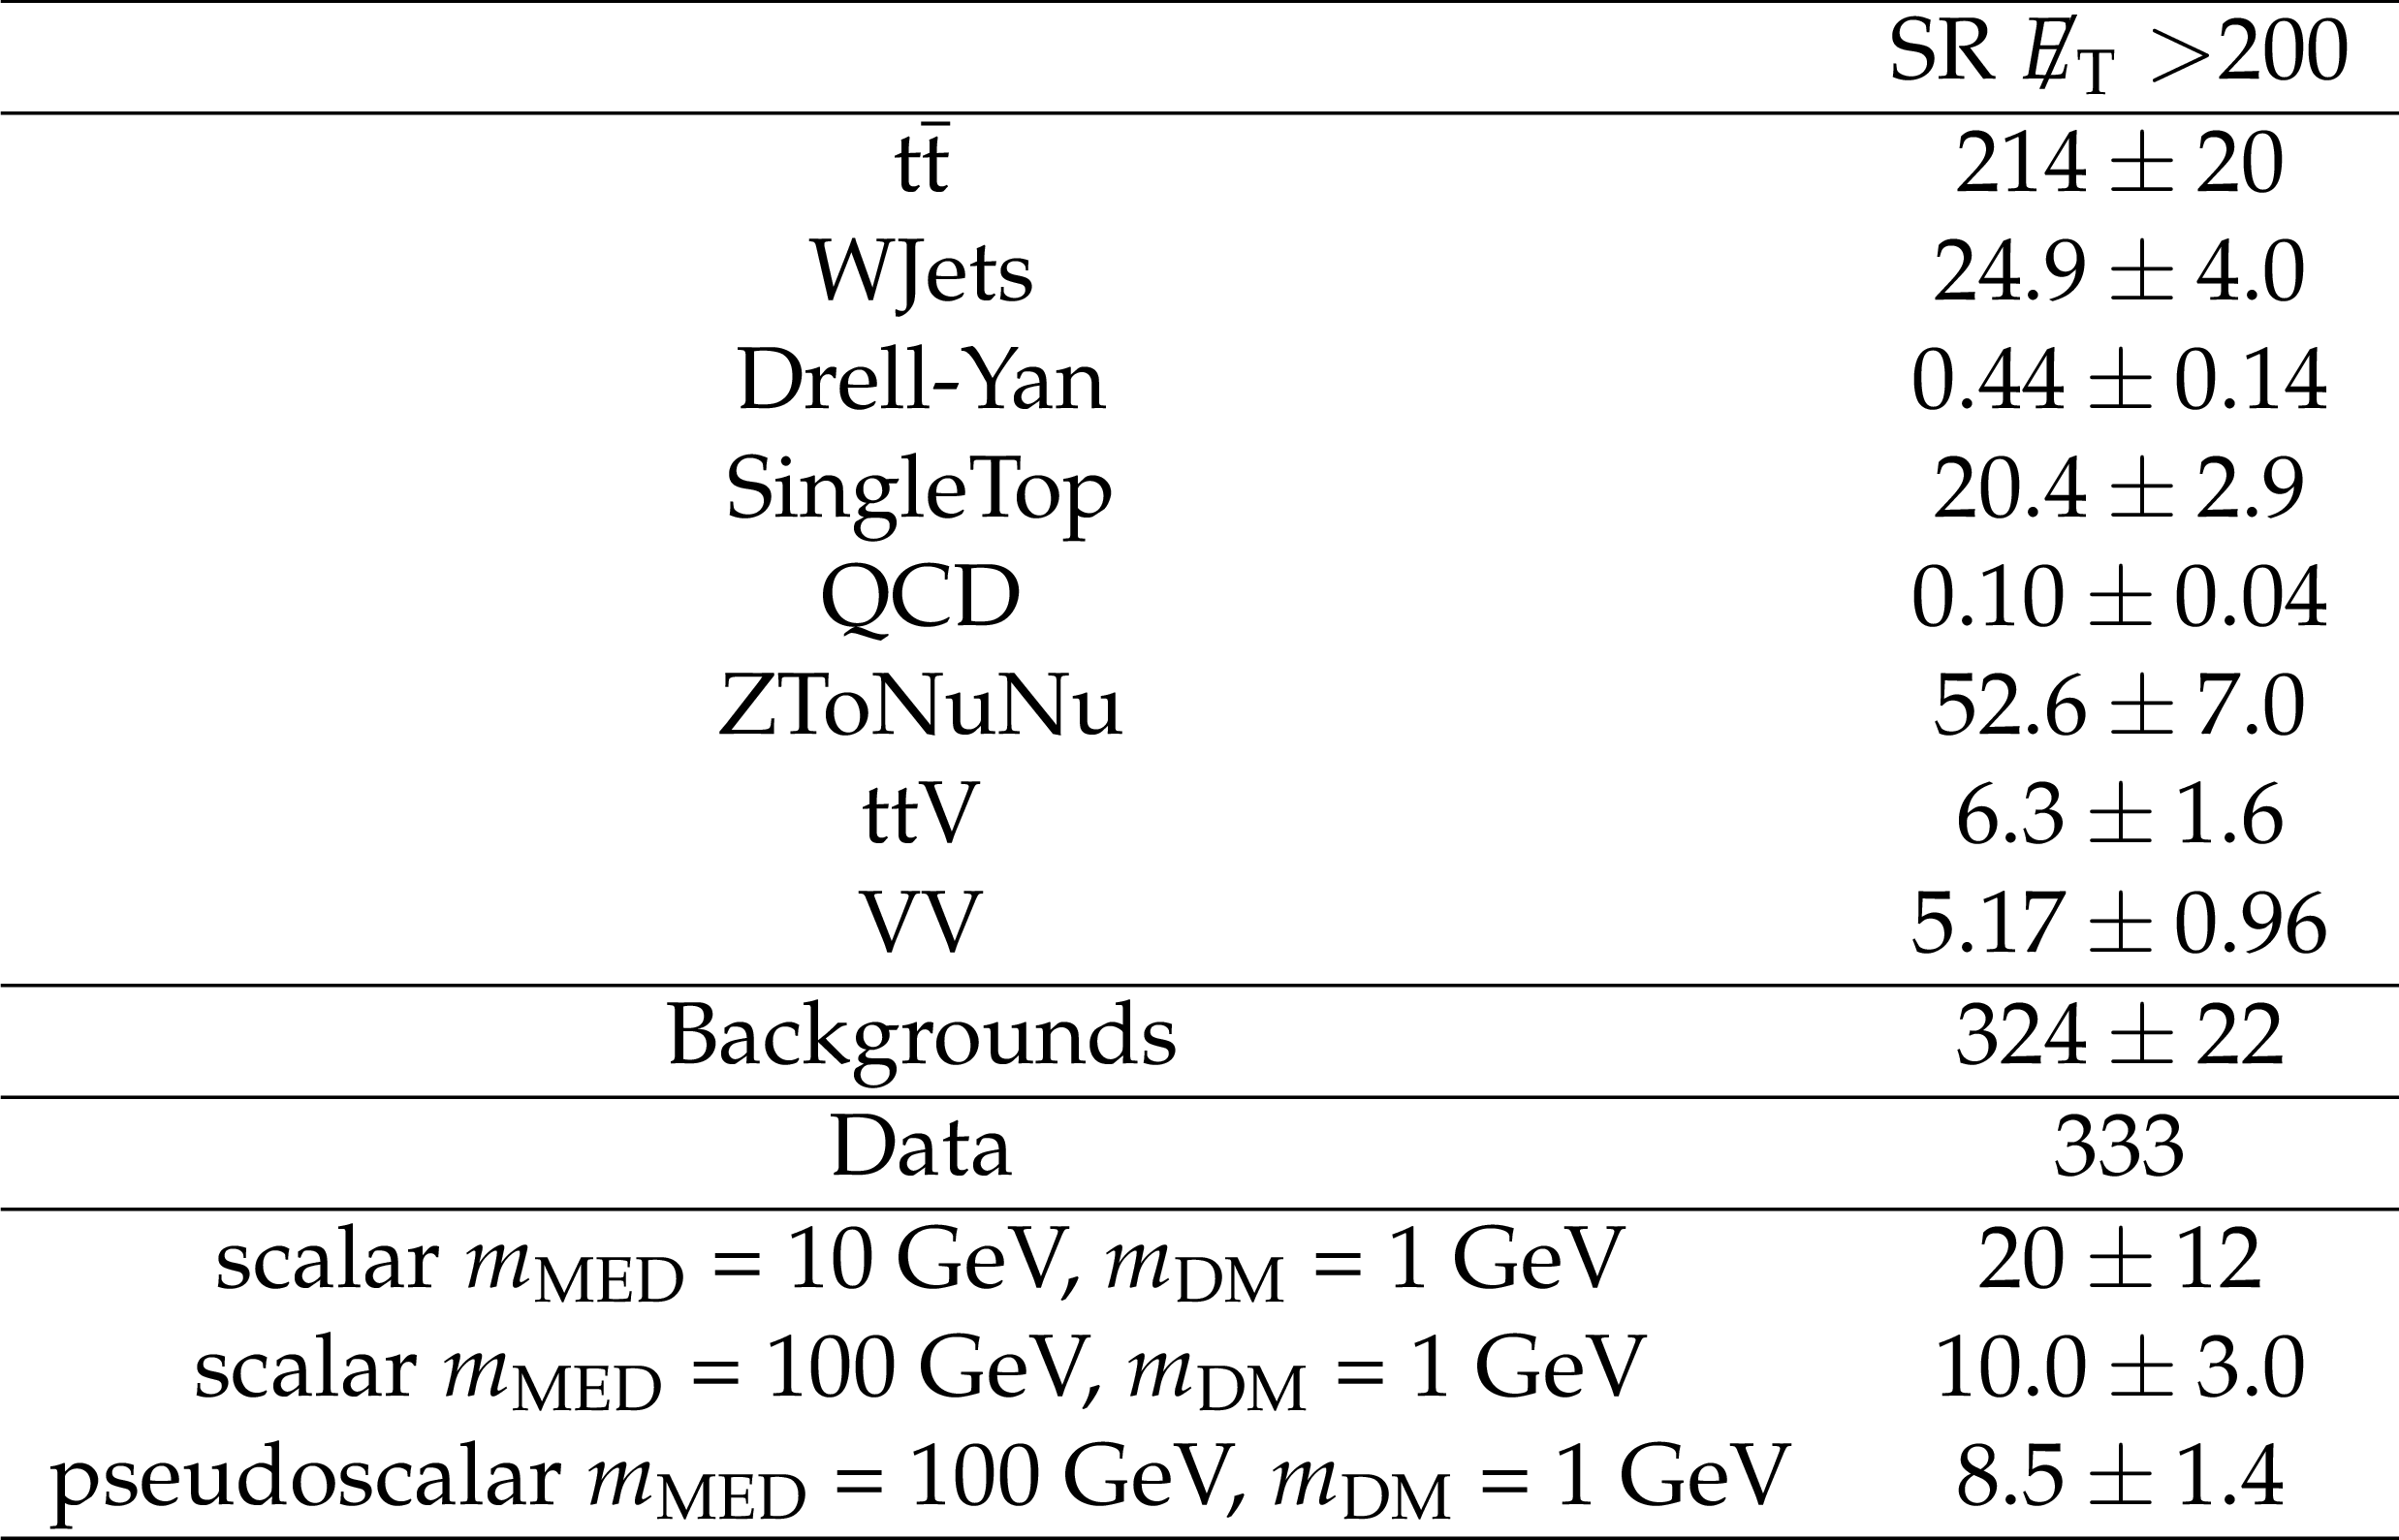
Table 2:
Observed and expected post-fit event yields with 2.2 fb$^{-1}$ of data in the signal region of the inclusive hadronic channel. A-priori expected signal yields for the a few model points are listed. The uncertainties on the signal expectations are statistical only. |
png pdf |
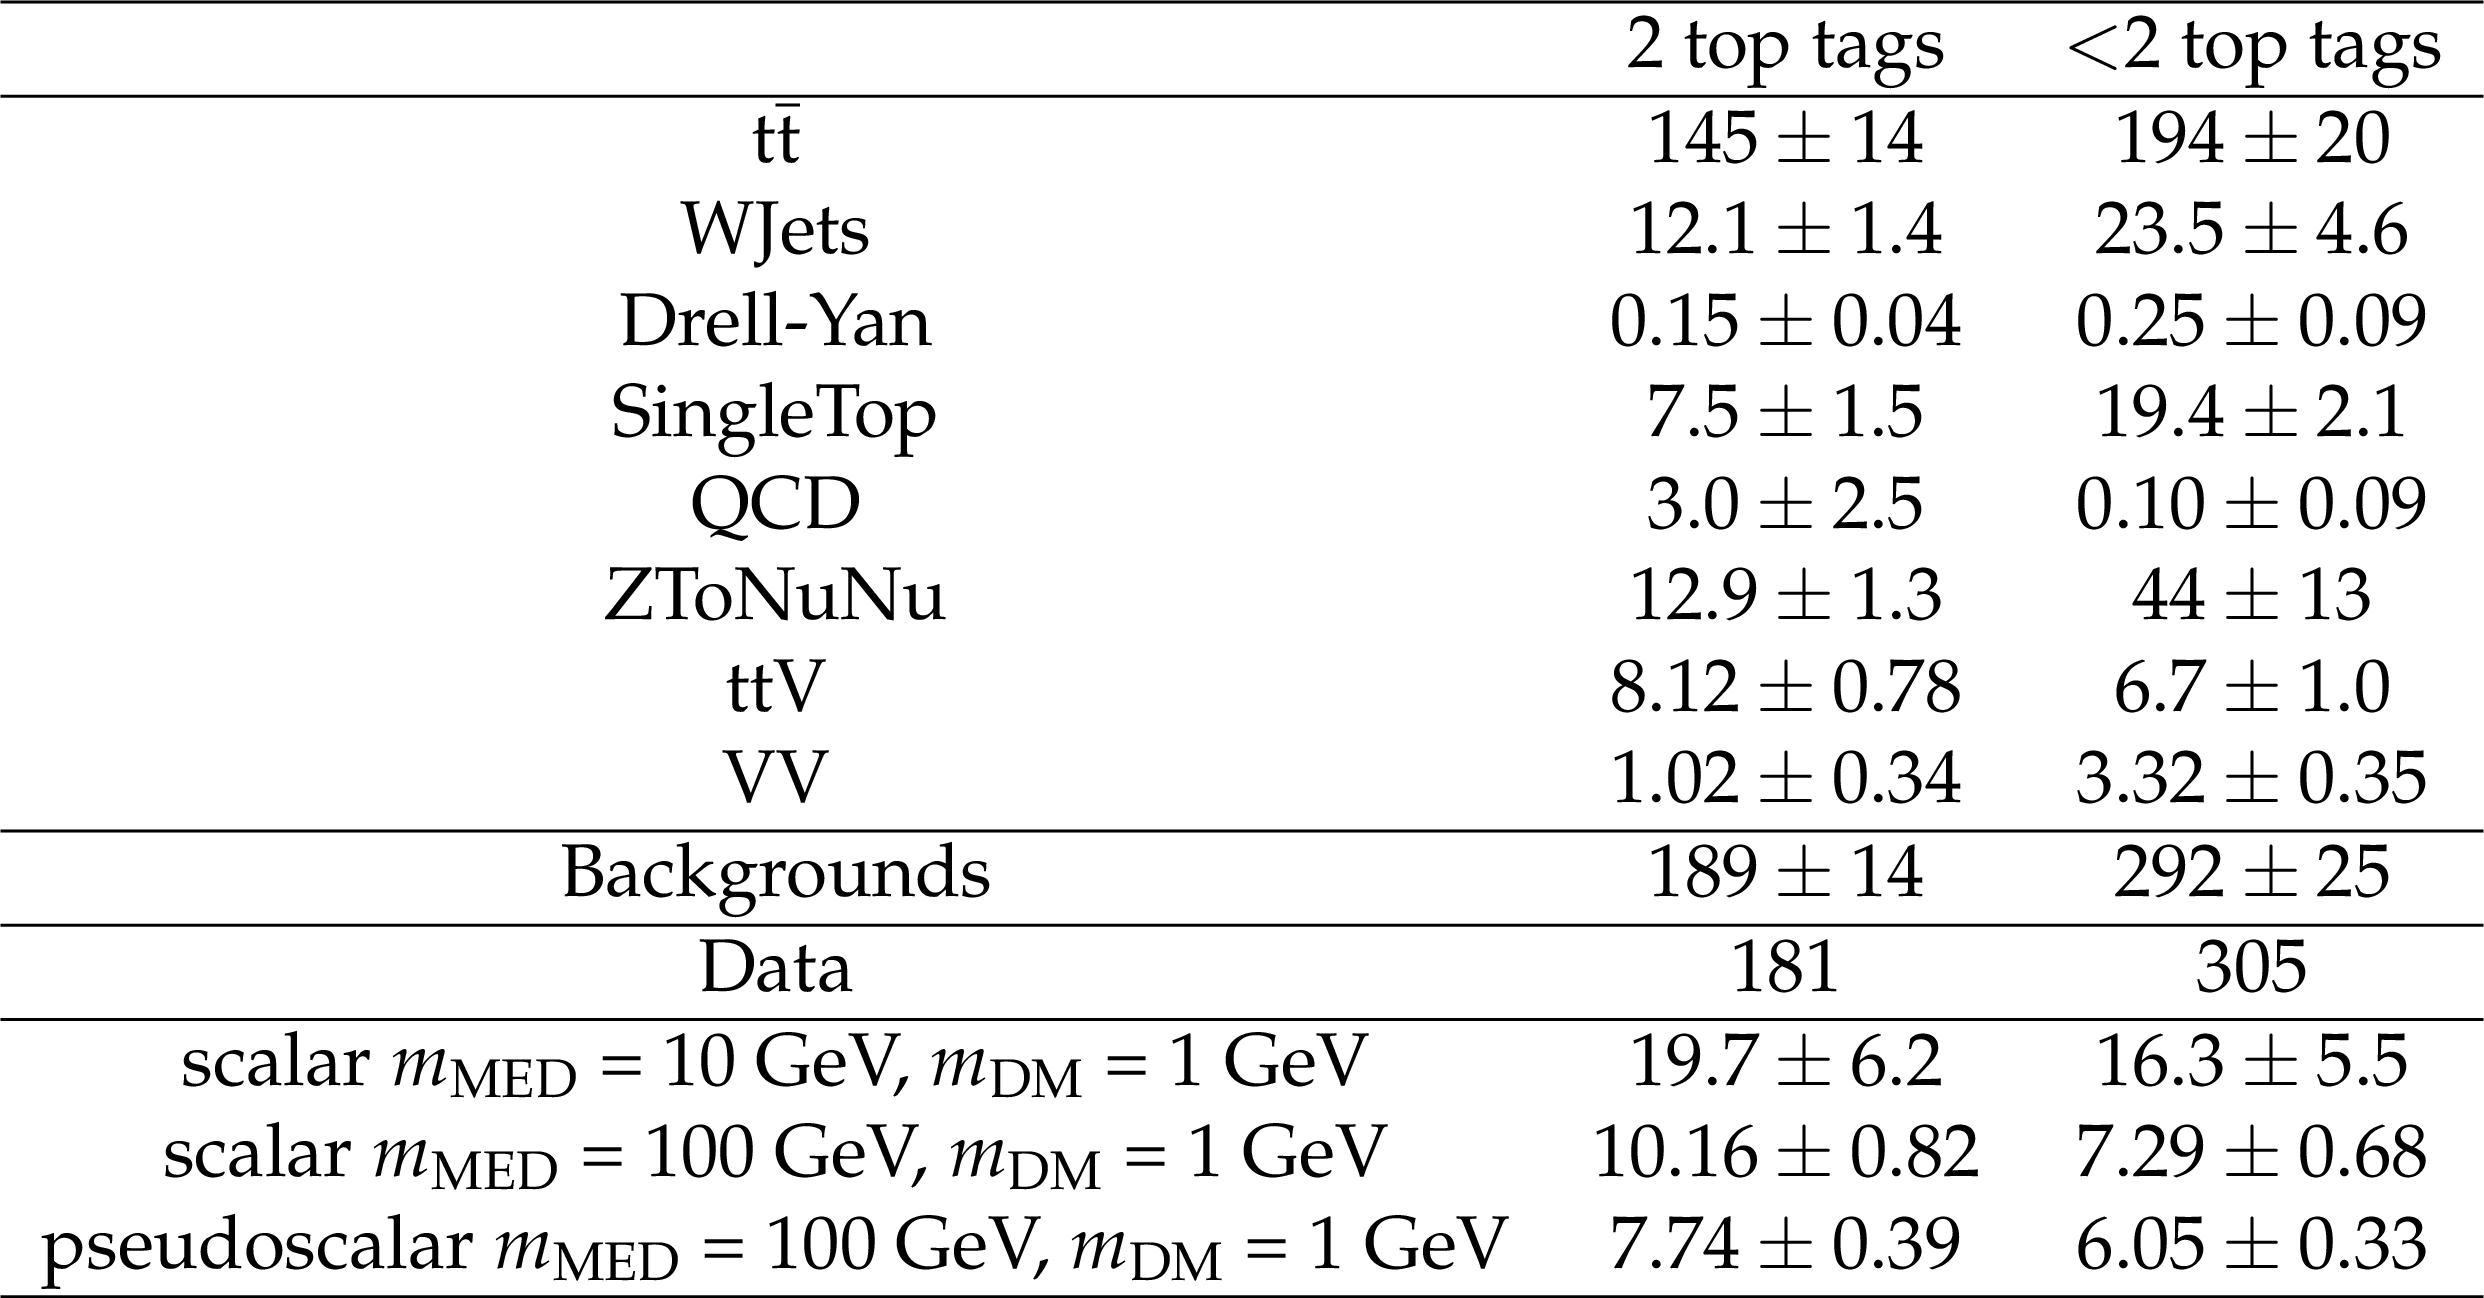
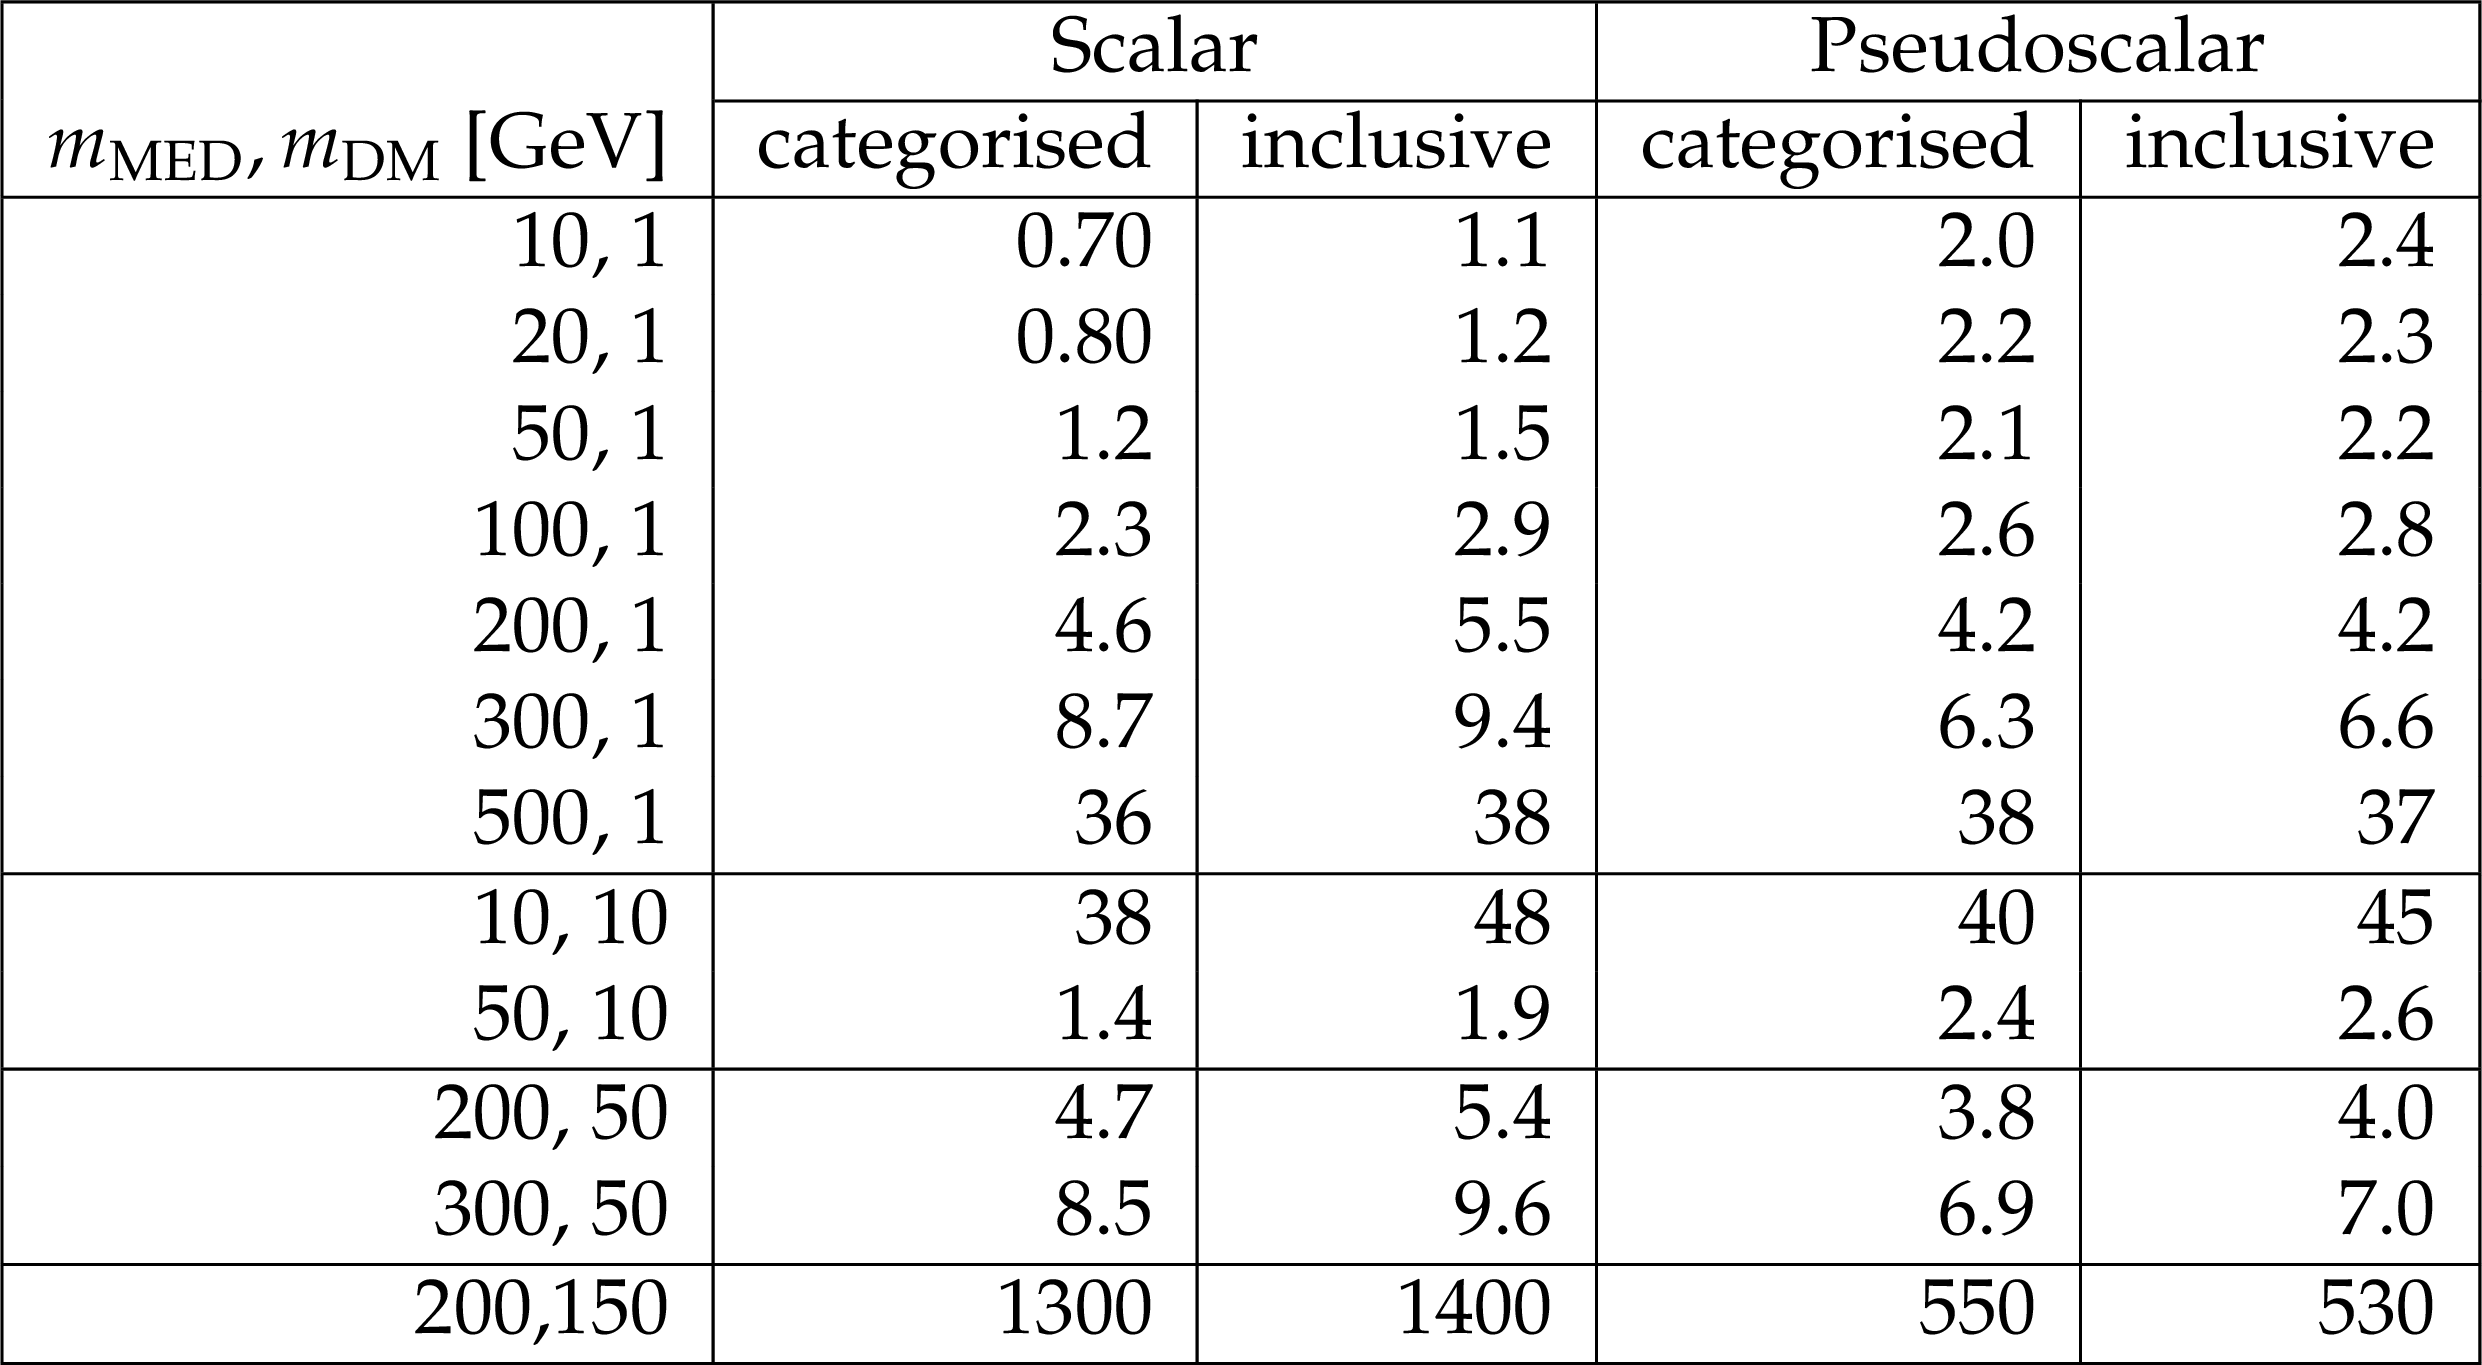
Table 3:
Observed and expected post-fit yields with 2.2 fb$^{-1}$ of data in the signal regions of the categorised hadronic channel. A-priori expected signal yields for the a few model points are listed. The uncertainties on the signal expectations are statistical only. |
png pdf |
Table 4:
Expected limits on $\mu $ for scalar and pseudoscalar models in the combined categorised search and the combined inclusive search. |
png pdf |
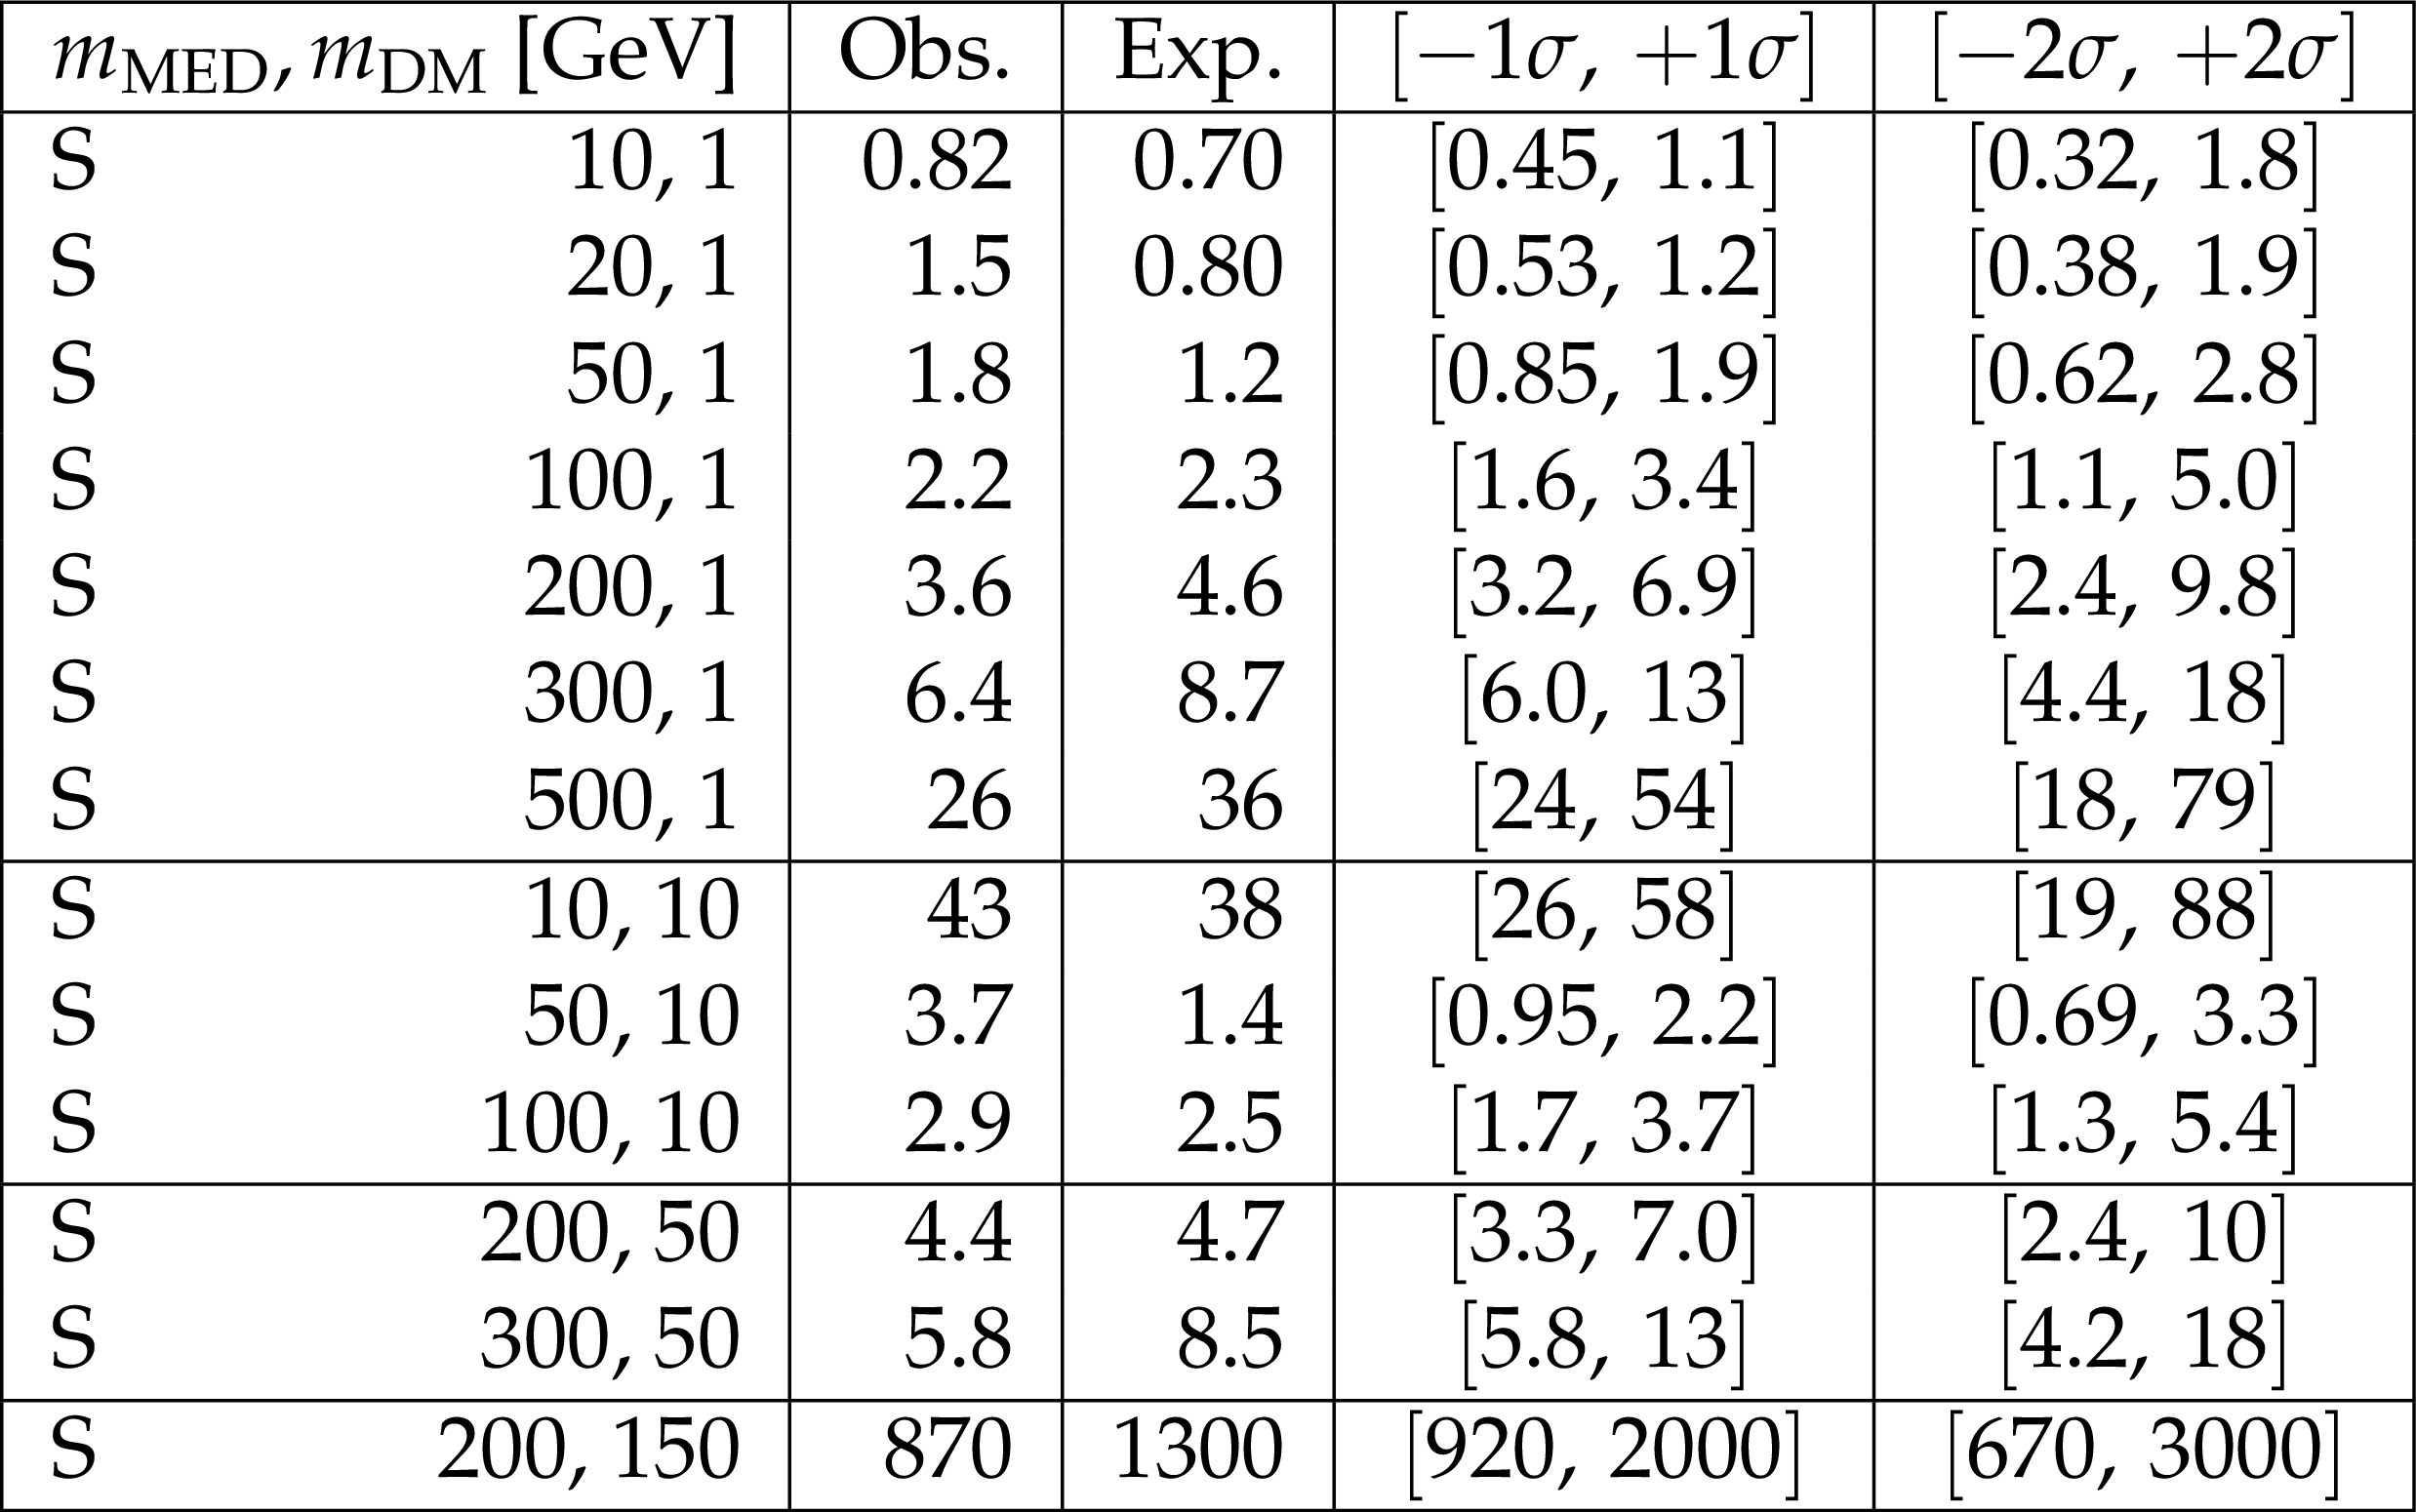
Table 5:
Observed and expected limits on $\mu $ for scalar models with the semileptonic and categorised hadronic channels combined. |
png pdf |
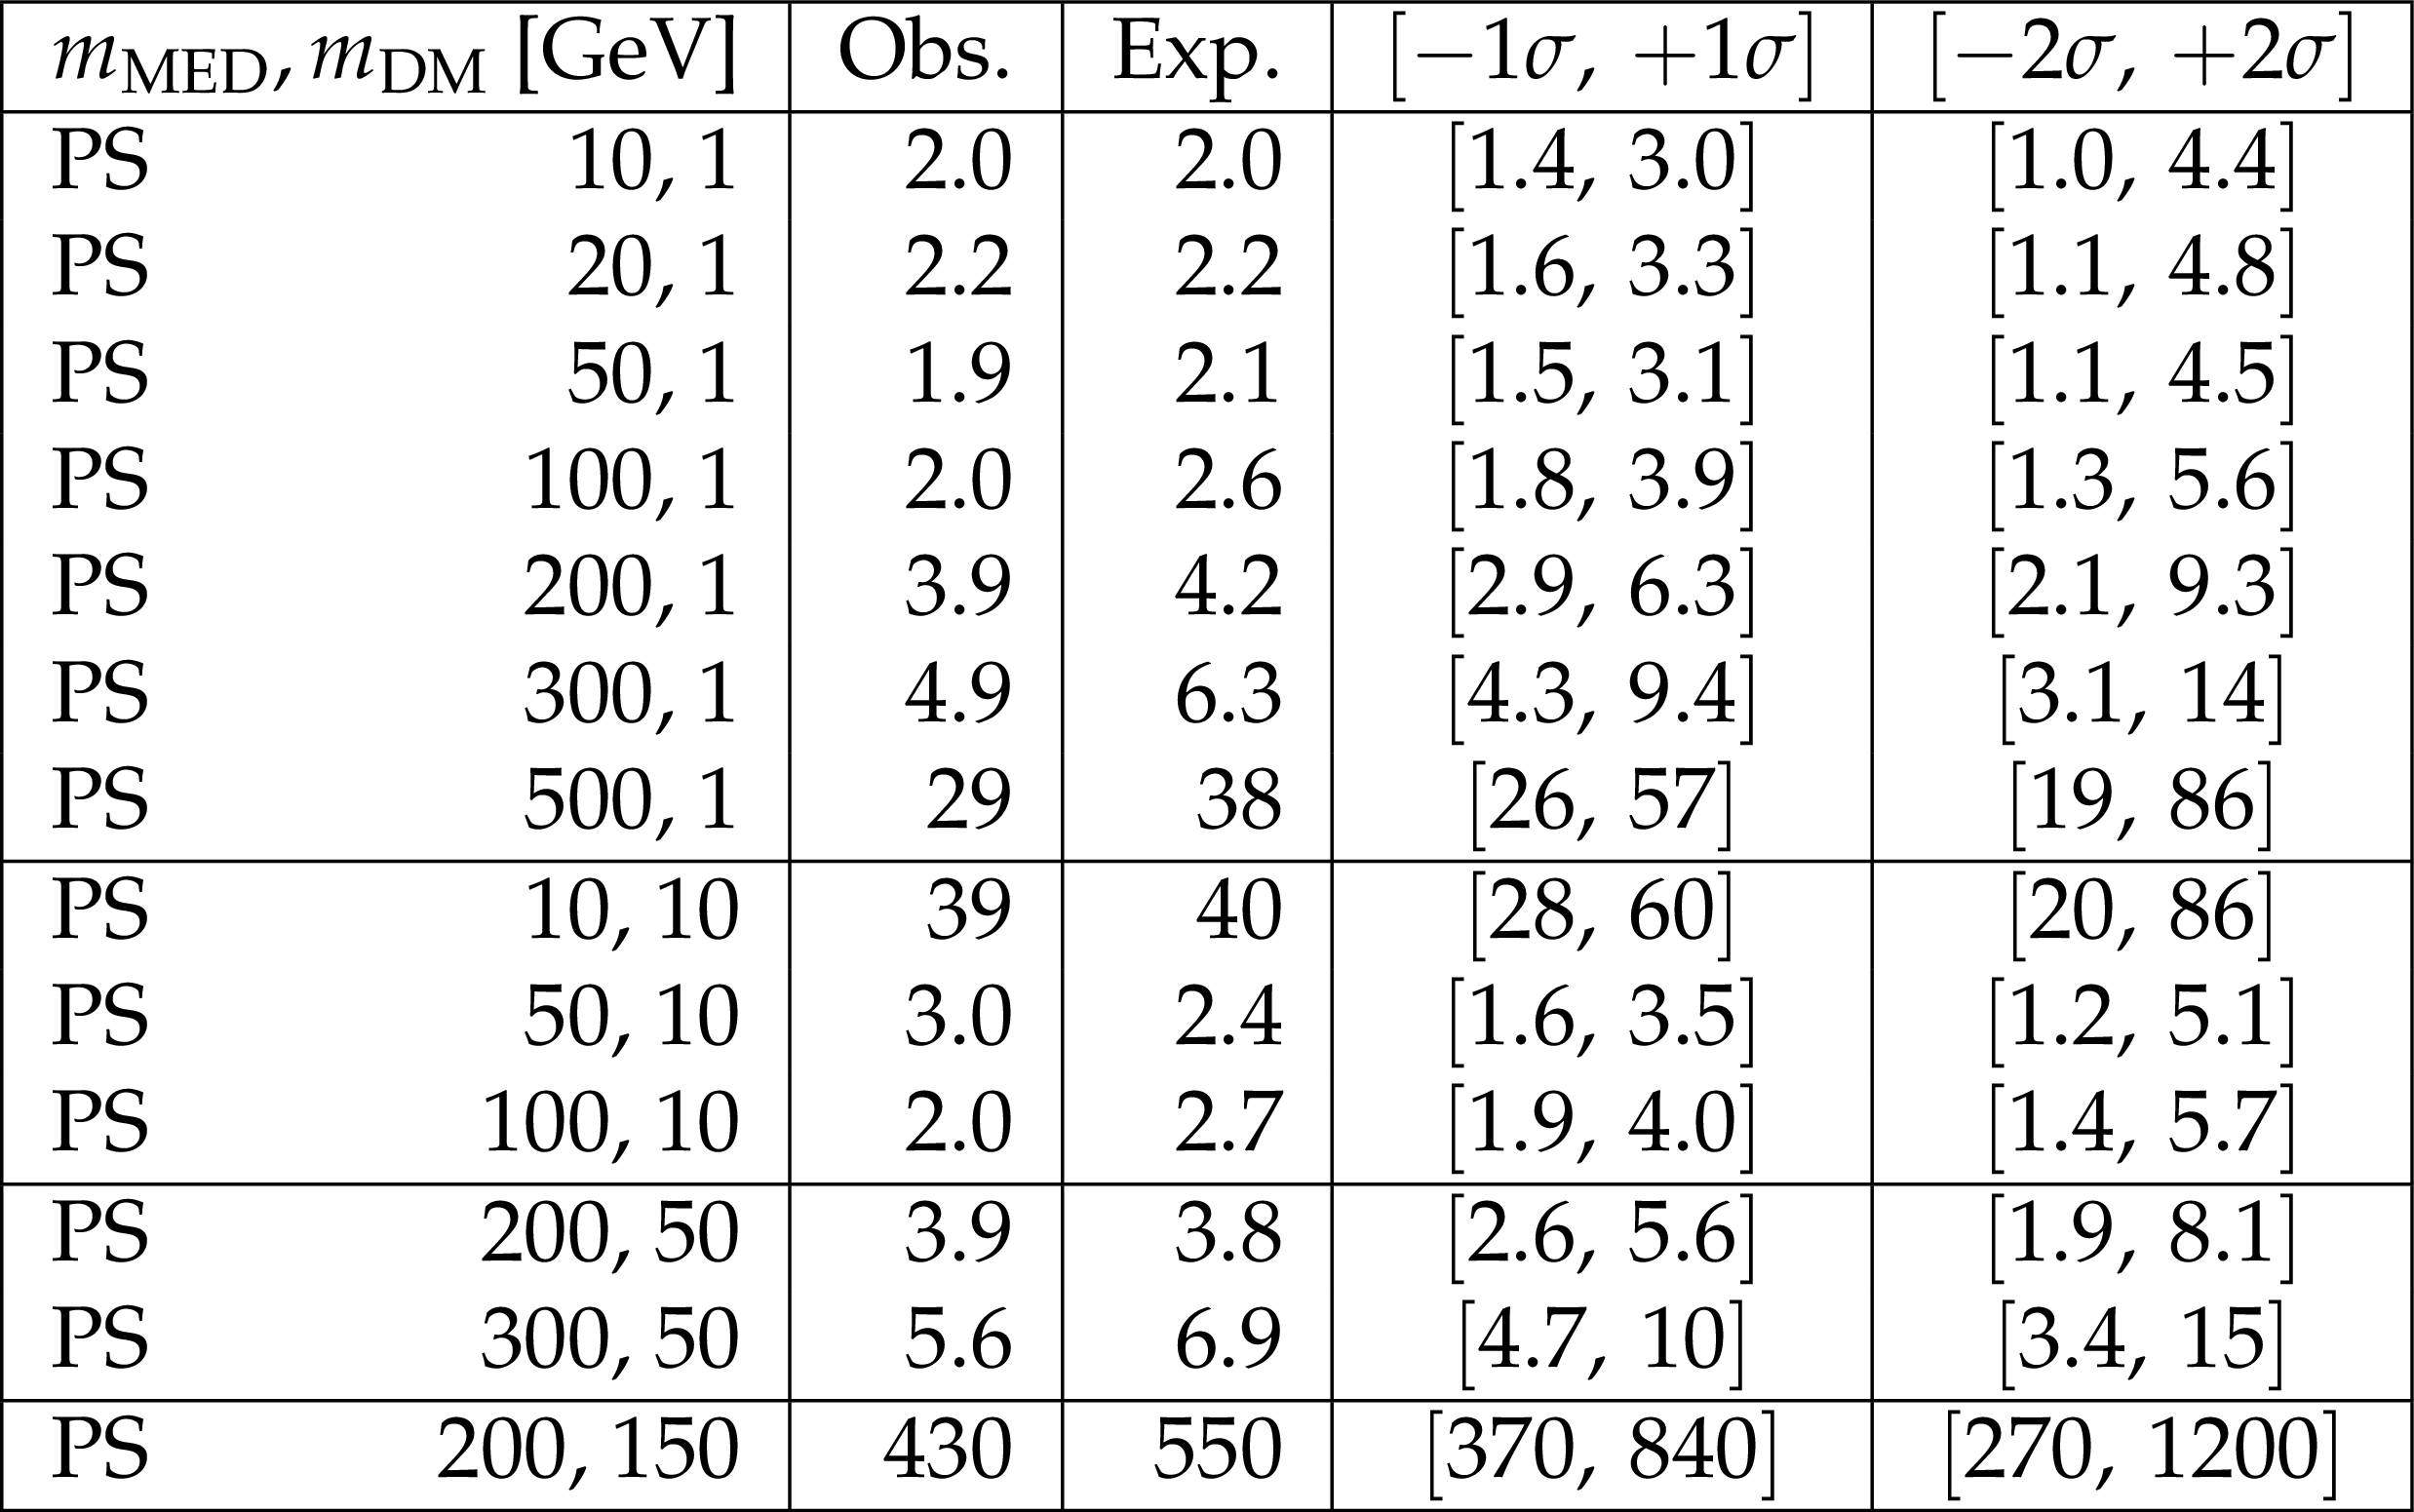
Table 6:
Observed and expected limits on $\mu $ for pseudoscalar models with the semileptonic and categorised hadronic channels combined. |
| Summary |
| A search has been presented for an excess of events with large missing transverse momentum produced in association with top quarks in a data sample of proton-proton interactions at center-of-mass energy of 13 TeV. The data correspond to an integrated luminosity of 2.2 fb$^{-1}$ collected by the CMS detector at the LHC in 2015. No significant deviation from SM background predictions is observed. The search is interpreted in terms of DM production to place constraints on the parameter space of simplified models with spin-0 mediators. |
| Additional Figures | |
png pdf |
Additional Figure 1:
Post-fit $E_{\mathrm{T}}^{\text{miss}}$ in semileptonic channel control regions enriched in dileptonic $ \mathrm{ t \bar{t} } $ events. The blue band in the lower panel shows the overall post-fit uncertainties on the background prediction. |

png pdf |
Additional Figure 2:
Post-fit $E_{\mathrm{T}}^{\text{miss}}$ in semileptonic channel control regions enriched in dileptonic W+jet events. The blue band in the lower panel shows the overall post-fit uncertainties on the background prediction. |

png pdf |
Additional Figure 3:
Observed and expected limits over mediator mass for scalar models with dark matter fermion mass of 1 GeV and couplings $g_q=g_{\mathrm {DM}}=1$ in the semileptonic channel. |

png pdf |
Additional Figure 4:
Observed and expected limits over mediator mass for pseudoscalar models with dark matter fermion mass of 1 GeV and couplings $g_q=g_{\mathrm {DM}}=1$ in the semileptonic channel. |

png pdf |
Additional Figure 5:
Expected and observed upper limits for various $M_{\chi }-M_{\phi }$ hypotheses in the semileptonic channel for scalar mediator simplified models. The couplings are taken to be $g_q=g_{\mathrm {DM}}=1$. |

png pdf |
Additional Figure 6:
Expected and observed upper limits for various $M_{\chi }-M_{\phi }$ hypotheses in the semileptonic channel for pseudoscalar mediator simplified models. The couplings are taken to be $g_q=g_{\mathrm {DM}}=1$. |
png pdf |
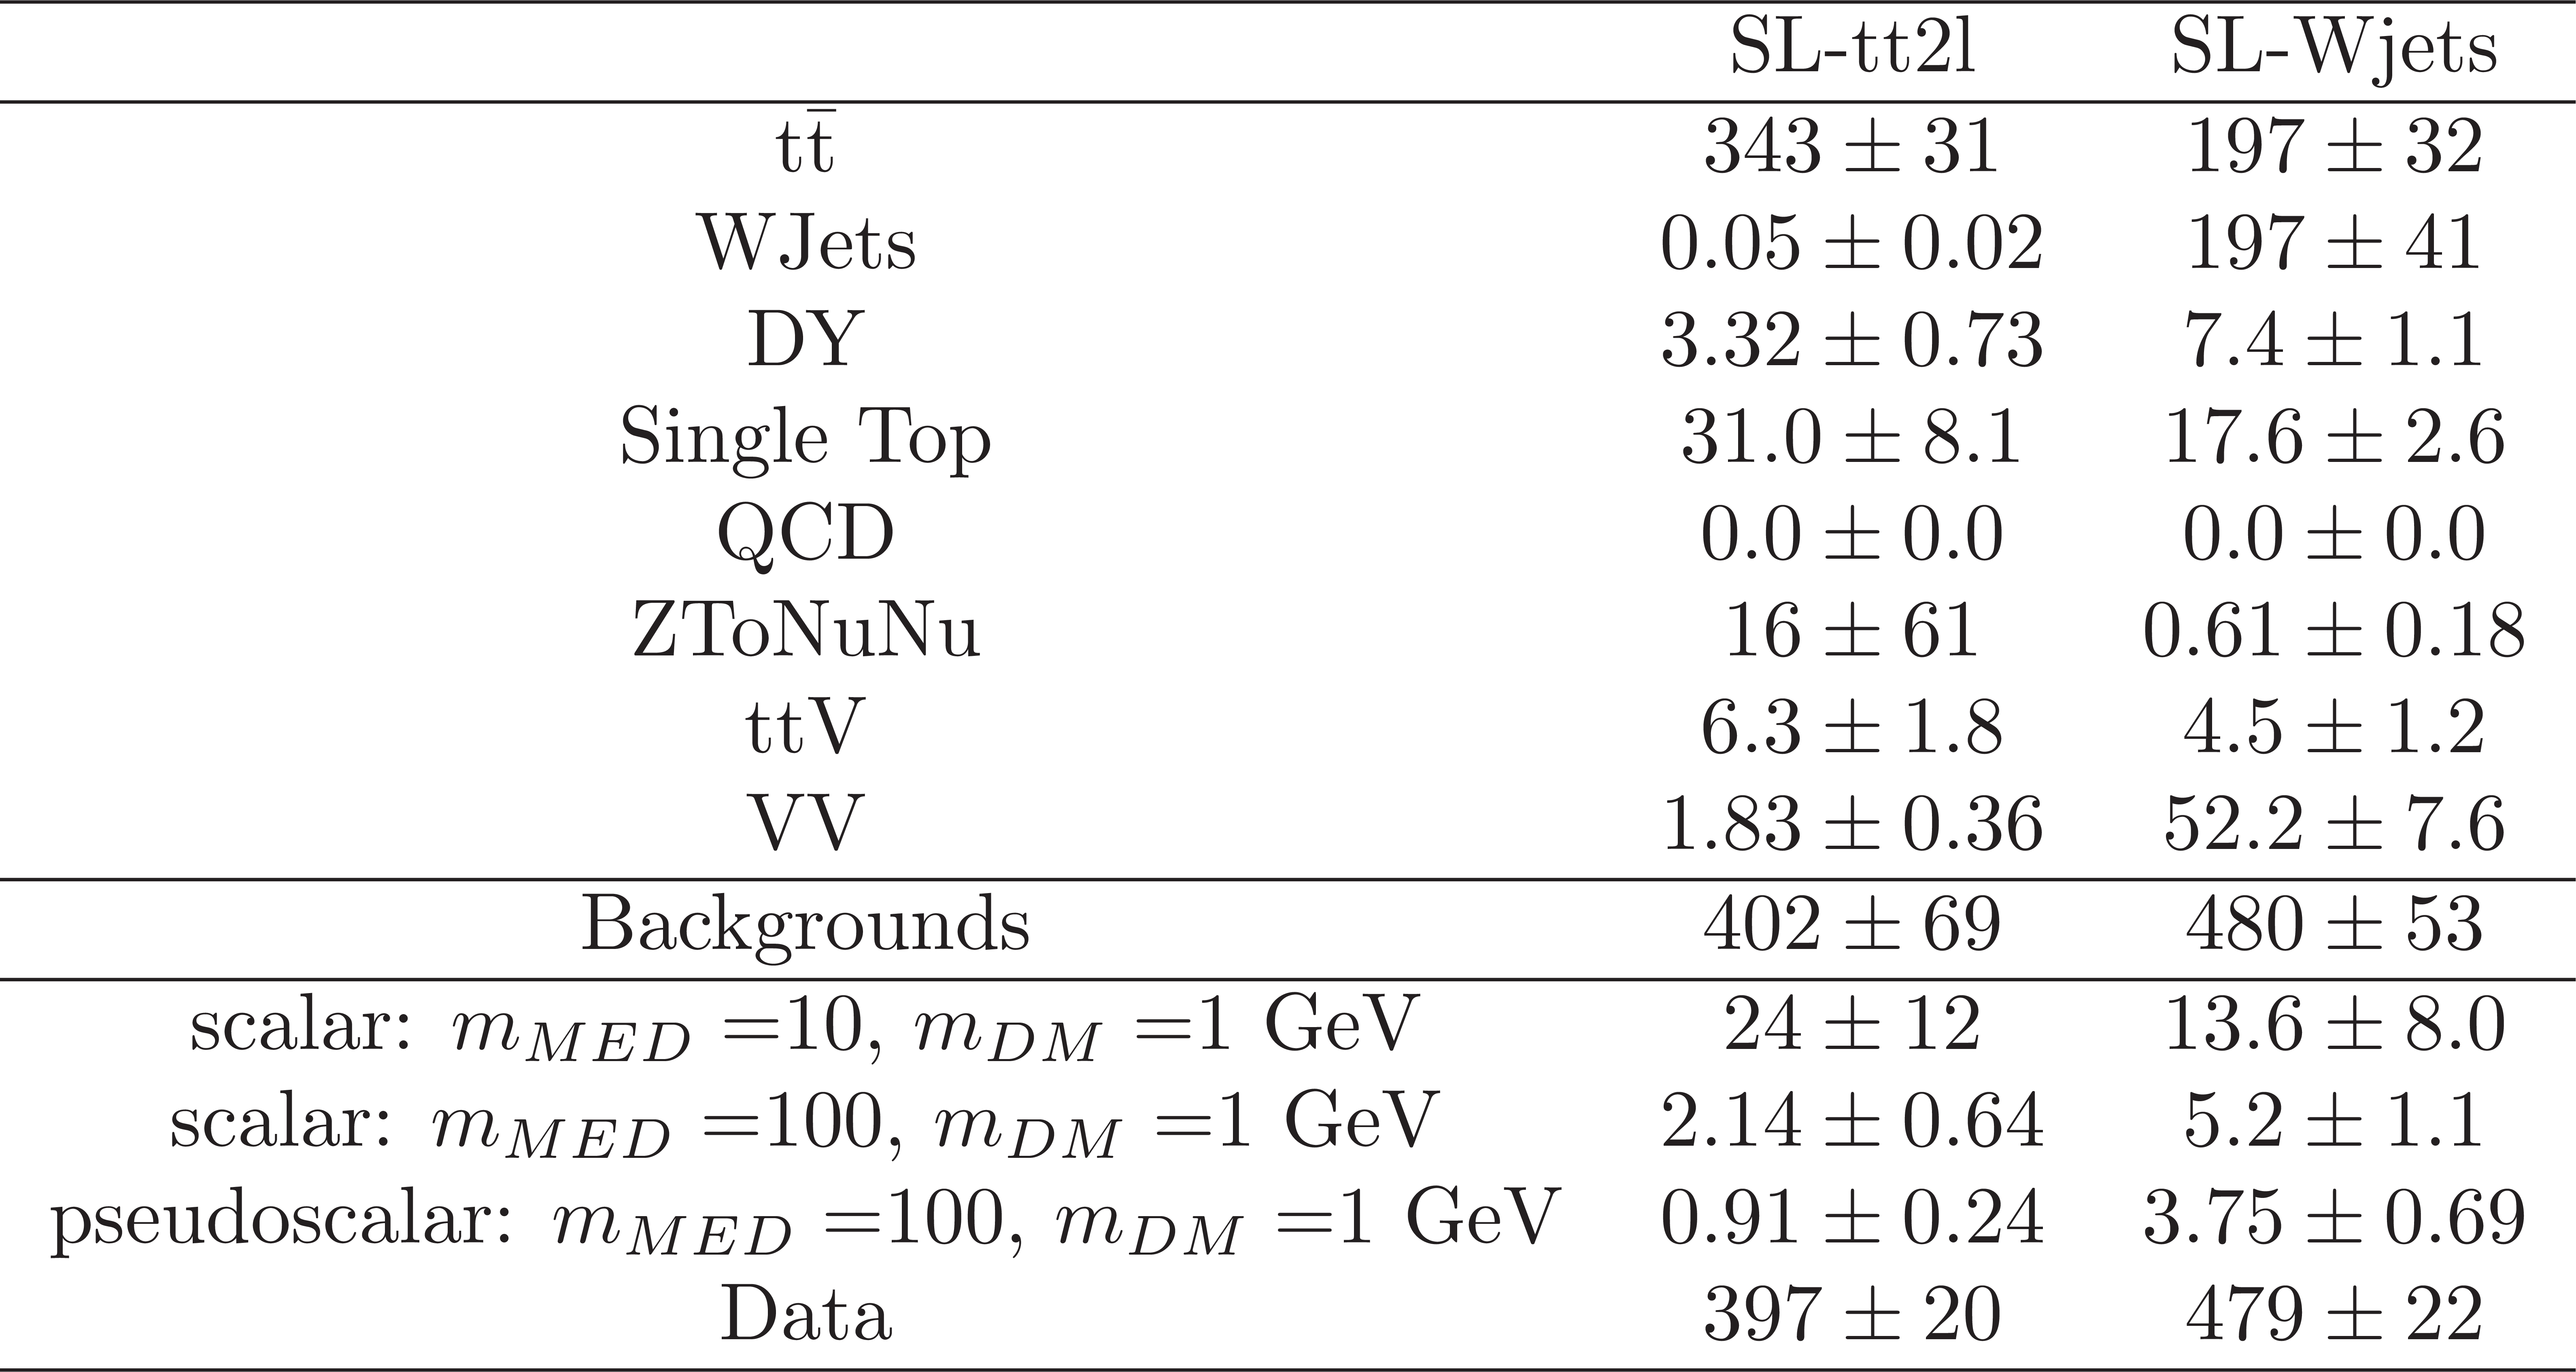
Additional Figure 7:
Observed and post-fit expected event yields with 2.2 fb$^{-1}$ of data in the dileptonic $ \mathrm{ t \bar{t} } $ control region (SL-tt2l) and the W+jets control region (SL-Wjets) of the semileptonic channel. |
png pdf |
Additional Figure 8:
$E_{\mathrm{T}}^{\text{miss}}$ distribution for the inclusive hadronic channel control region enriched in $ \mathrm{ t \bar{t} } (1\ell) $ events. The gray dashed band indicates the statistical uncertainty on the predicted background. |

png pdf |
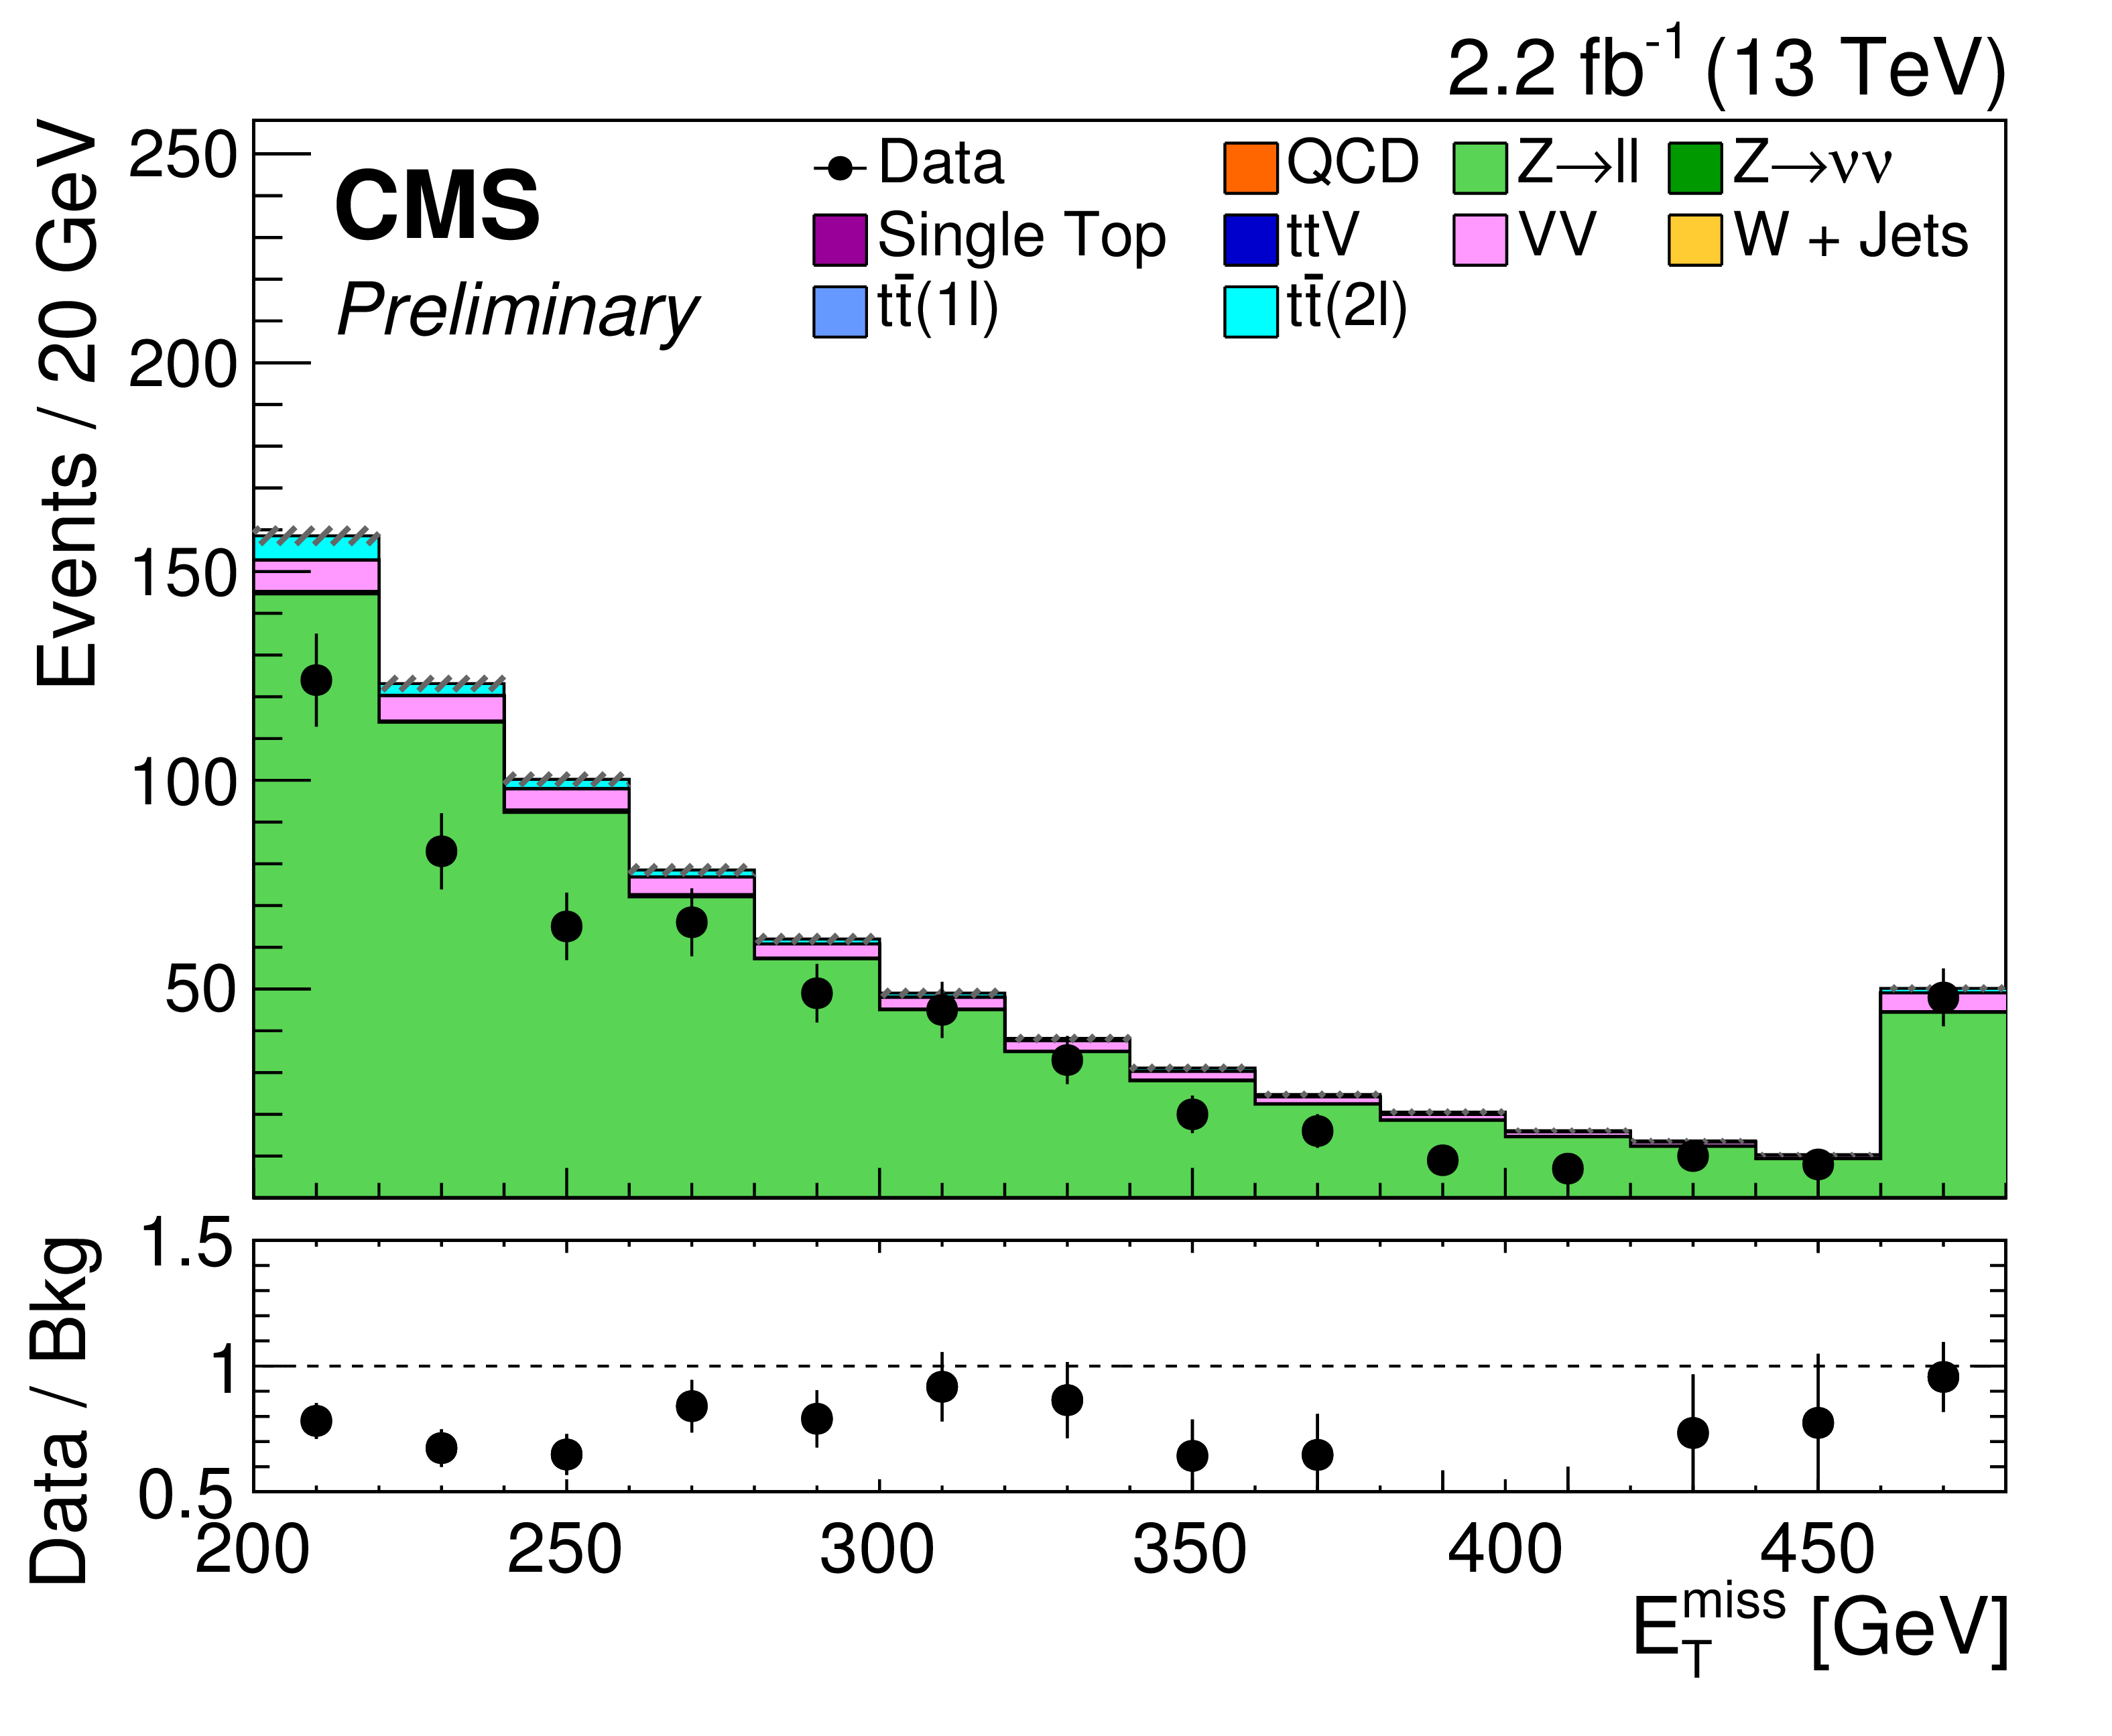
Additional Figure 9:
$E_{\mathrm{T}}^{\text{miss}}$ distribution for the inclusive hadronic channel control region enriched in V+jets events. The gray dashed band indicates the statistical uncertainty on the predicted background. |
png pdf |
Additional Figure 10:
$E_{\mathrm{T}}^{\text{miss}}$ distribution for the inclusive hadronic channel control region enriched in W+jet events. The gray dashed band indicates the statistical uncertainty on the predicted background. |
png pdf |
Additional Figure 11:
$E_{\mathrm{T}}^{\text{miss}}$ distribution for the inclusive hadronic channel control region enriched in Z+jets events. The gray dashed band indicates the statistical uncertainty on the predicted background. |
png pdf |
Additional Figure 12:
Post-fit $E_{\mathrm{T}}^{\text{miss}}$ distribution for the inclusive hadronic channel control region enriched in $ \mathrm{ t \bar{t} } (1\ell) $ events. The overall post-fit uncertainties are shown in the blue band on the lower panel. |

png pdf |
Additional Figure 13:
Post-fit $E_{\mathrm{T}}^{\text{miss}}$ distribution for the inclusive hadronic channel control region enriched in V+jets events. The overall post-fit uncertainties are shown in the blue band on the lower panel. |
png pdf |
Additional Figure 14:
Post-fit $E_{\mathrm{T}}^{\text{miss}}$ distribution for the inclusive hadronic channel control region enriched in W+jet events. The overall post-fit uncertainties are shown in the blue band on the lower panel. |

png pdf |
Additional Figure 15:
Post-fit $E_{\mathrm{T}}^{\text{miss}}$ distribution for the inclusive hadronic channel control region enriched in Z+jets events. The overall post-fit uncertainties are shown in the blue band on the lower panel. |
png pdf |
Additional Figure 16:
Observed and expected limits over mediator mass for scalar models with dark matter fermion mass of 1 GeV and couplings $g_q=g_{\mathrm {DM}}=$ 1 in the inclusive hadronic channel. |
png pdf |
Additional Figure 17:
Observed and expected limits over mediator mass for pseudoscalar models with dark matter fermion mass of 1 GeV and and couplings $g_q=g_{\mathrm {DM}}=$ 1 in the inclusive hadronic channel. |
png pdf |
Additional Figure 18:
Expected and observed upper limits for various $M_{\chi }-M_{\phi }$ hypotheses in the inslusive hadronic channel for scalar mediator simplified models. The couplings are taken to be $g_q=g_{\mathrm {DM}}=$ 1. |
png pdf |
Additional Figure 19:
Expected and observed upper limits for various $M_{\chi }-M_{\phi }$ hypotheses in the inclusive hadronic channel for pseudoscalar mediator simplified models. The couplings are taken to be $g_q=g_{\mathrm {DM}}=$ 1. |
png pdf |
Additional Figure 20:
Observed and post-fit expected event yields with 2.2 fb$^{-1}$ of data in the control regions of the inclusive hadronic channel: the semileptonic $ \mathrm{ t \bar{t} } $ CR (HAD-tt1l), the V+jets CR (HAD-Vjets), the W+jets CR (HAD-Wjets), and the Z+jets CR (HAD-Zll). |
png pdf |
Additional Figure 21-a:
Post-fit $E_{\mathrm{T}}^{\text{miss}}$ distribution in the semileptonic $ \mathrm{ t \bar{t} } $ control region for the category of two top tags (left) and the category of less than two top tags. The blue band in the lower panel shows the overall uncertainties on the background prediction. |

png pdf |
Additional Figure 21-b:
Post-fit $E_{\mathrm{T}}^{\text{miss}}$ distribution in the semileptonic $ \mathrm{ t \bar{t} } $ control region for the category of two top tags (left) and the category of less than two top tags. The blue band in the lower panel shows the overall uncertainties on the background prediction. |
png pdf |
Additional Figure 22-a:
Post-fit $E_{\mathrm{T}}^{\text{miss}}$ distribution in the V+jets control region for the category of two top tags (left) and the category of less than two top tags. The blue band in the lower panel shows the overall uncertainties on the background prediction. |
png pdf |
Additional Figure 22-b:
Post-fit $E_{\mathrm{T}}^{\text{miss}}$ distribution in the V+jets control region for the category of two top tags (left) and the category of less than two top tags. The blue band in the lower panel shows the overall uncertainties on the background prediction. |
png pdf |
Additional Figure 23-a:
Post-fit $E_{\mathrm{T}}^{\text{miss}}$ distribution in the V+jets control region for the category of two top tags (left) and the category of less than two top tags. The blue band in the lower panel shows the overall uncertainties on the background prediction. |

png pdf |
Additional Figure 23-b:
Post-fit $E_{\mathrm{T}}^{\text{miss}}$ distribution in the V+jets control region for the category of two top tags (left) and the category of less than two top tags. The blue band in the lower panel shows the overall uncertainties on the background prediction. |
png pdf |
Additional Figure 24:
Post-fit hadronic recoil distribution (i.e. dilepton momentum subtracted from ${E_{\mathrm {T}}^{\text {miss}}} $) in the Z+jets control region. This control region is not split into categories because there are very few events passing two top tags. The blue band in the lower panel shows the overall uncertainties on the background prediction. |

png pdf |
Additional Figure 25:
Observed and expected limits over mediator mass for scalar models with dark matter fermion mass of 1 GeV and couplings $g_q=g_{\mathrm {DM}}=$ 1 in the categorised hadronic channel. |
png pdf |
Additional Figure 26:
Observed and expected limits over mediator mass for pseudoscalar models with dark matter fermion mass of 1 GeV and couplings $g_q=g_{\mathrm {DM}}=$ 1 in the categorised hadronic channel. |

png pdf |
Additional Figure 27:
Performance curves of the resolved top tagging efficiency versus mis-tag rate in simulation. The signal is tri-jets from hadronically decaying top quarks in semileptonic $ \mathrm{ t \bar{t} } $ events. The solid purple curve shows the performance versus combinatorial tri-jets (not all three jets come from hadronic top quark decays) in semileptonic $ \mathrm{ t \bar{t} } $ events. The dashed blue curve shows the performance versus Z$(\nu \nu )$+jets with at least one b-tag. |
png pdf |
Additional Figure 28:
Resolved top tagger discriminant for tri-jet top candidates in a semileptonic $ \mathrm{ t \bar{t} } $ enriched sample. The simulated events are split by tri-jets from hadronic tops ($ \mathrm{ t \bar{t} } (1\ell) $ Hardronic Matched), from combinatorics in semileptonic $ \mathrm{ t \bar{t} } $ ($ \mathrm{ t \bar{t} } (1\ell) $ Combinatorial), and from other backgrounds. Uncertainties on the data/MC ratio are statistical. |
png pdf |
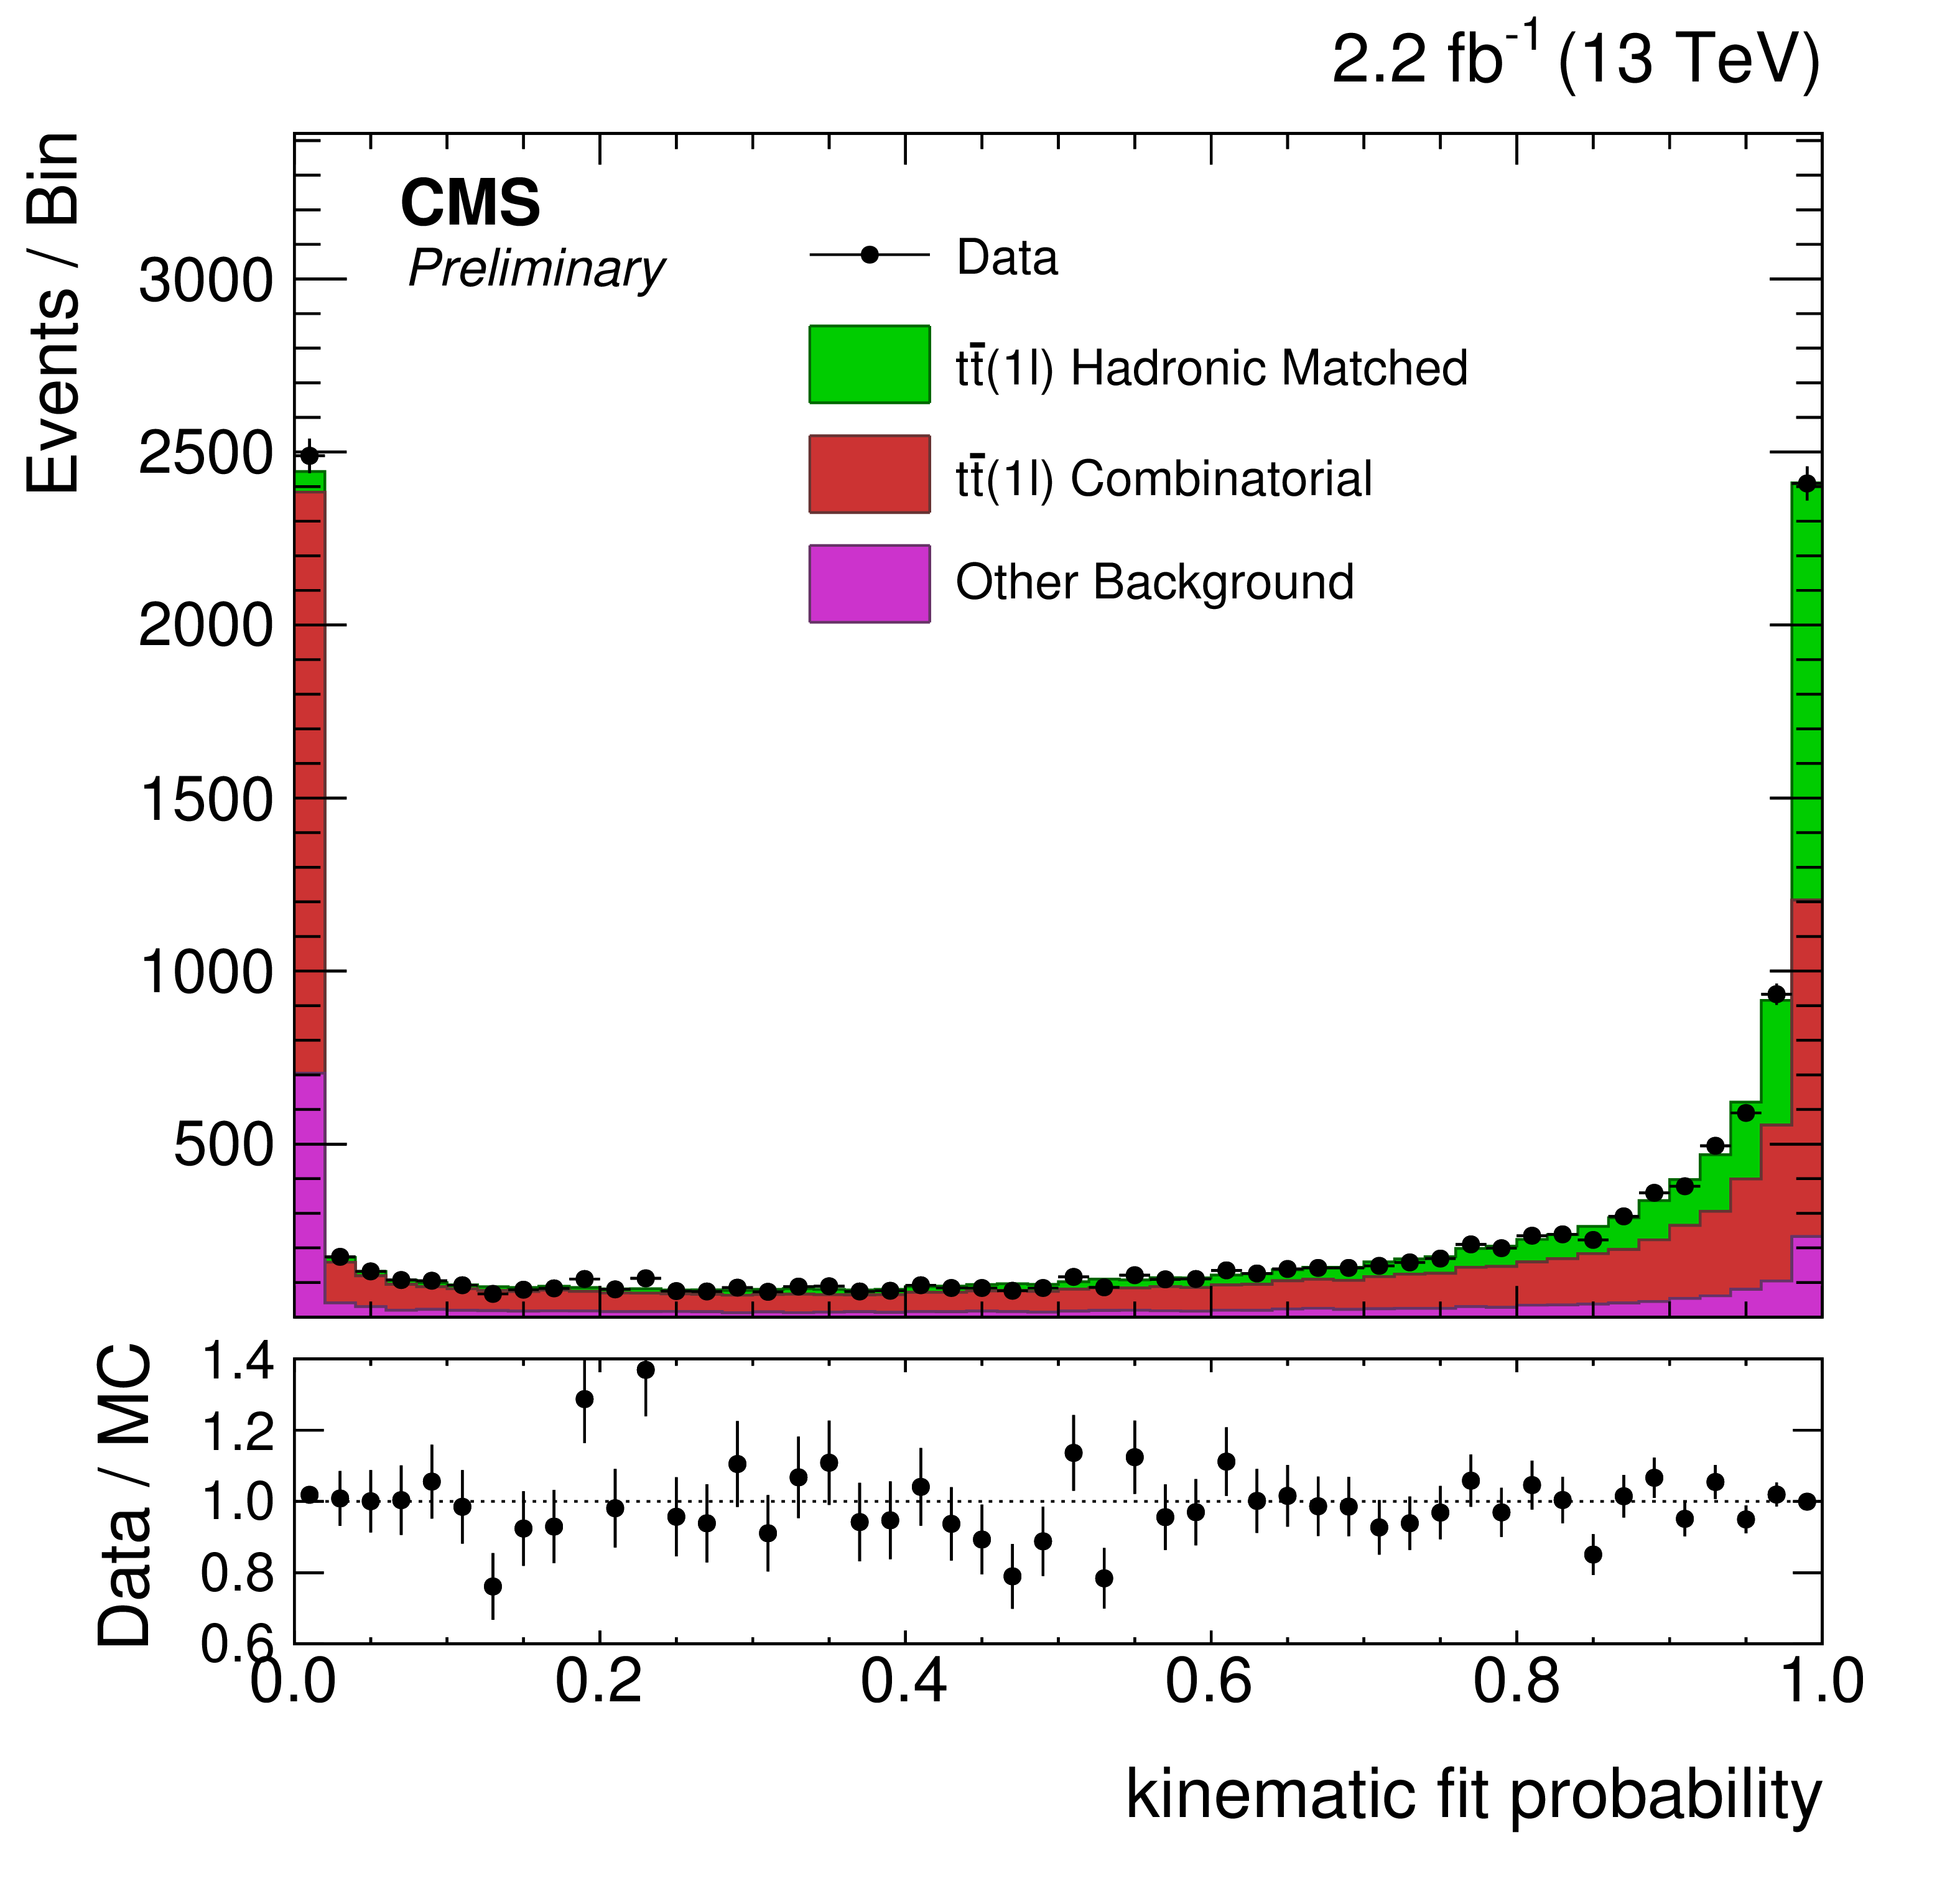
Additional Figure 29:
Kinematic fit probability for tri-jet top candidates in a semileptonic $ \mathrm{ t \bar{t} } $ enriched sample. The simulated events are split by tri-jets from hadronic tops ($ \mathrm{ t \bar{t} } (1\ell) $ Hadronic Matched), from combinatorics in semileptonic $ \mathrm{ t \bar{t} } $ ($ \mathrm{ t \bar{t} } (1\ell) $ Combinatorial), and from other backgrounds. Uncertainties on the data/MC ratio are statistical. |
png pdf |
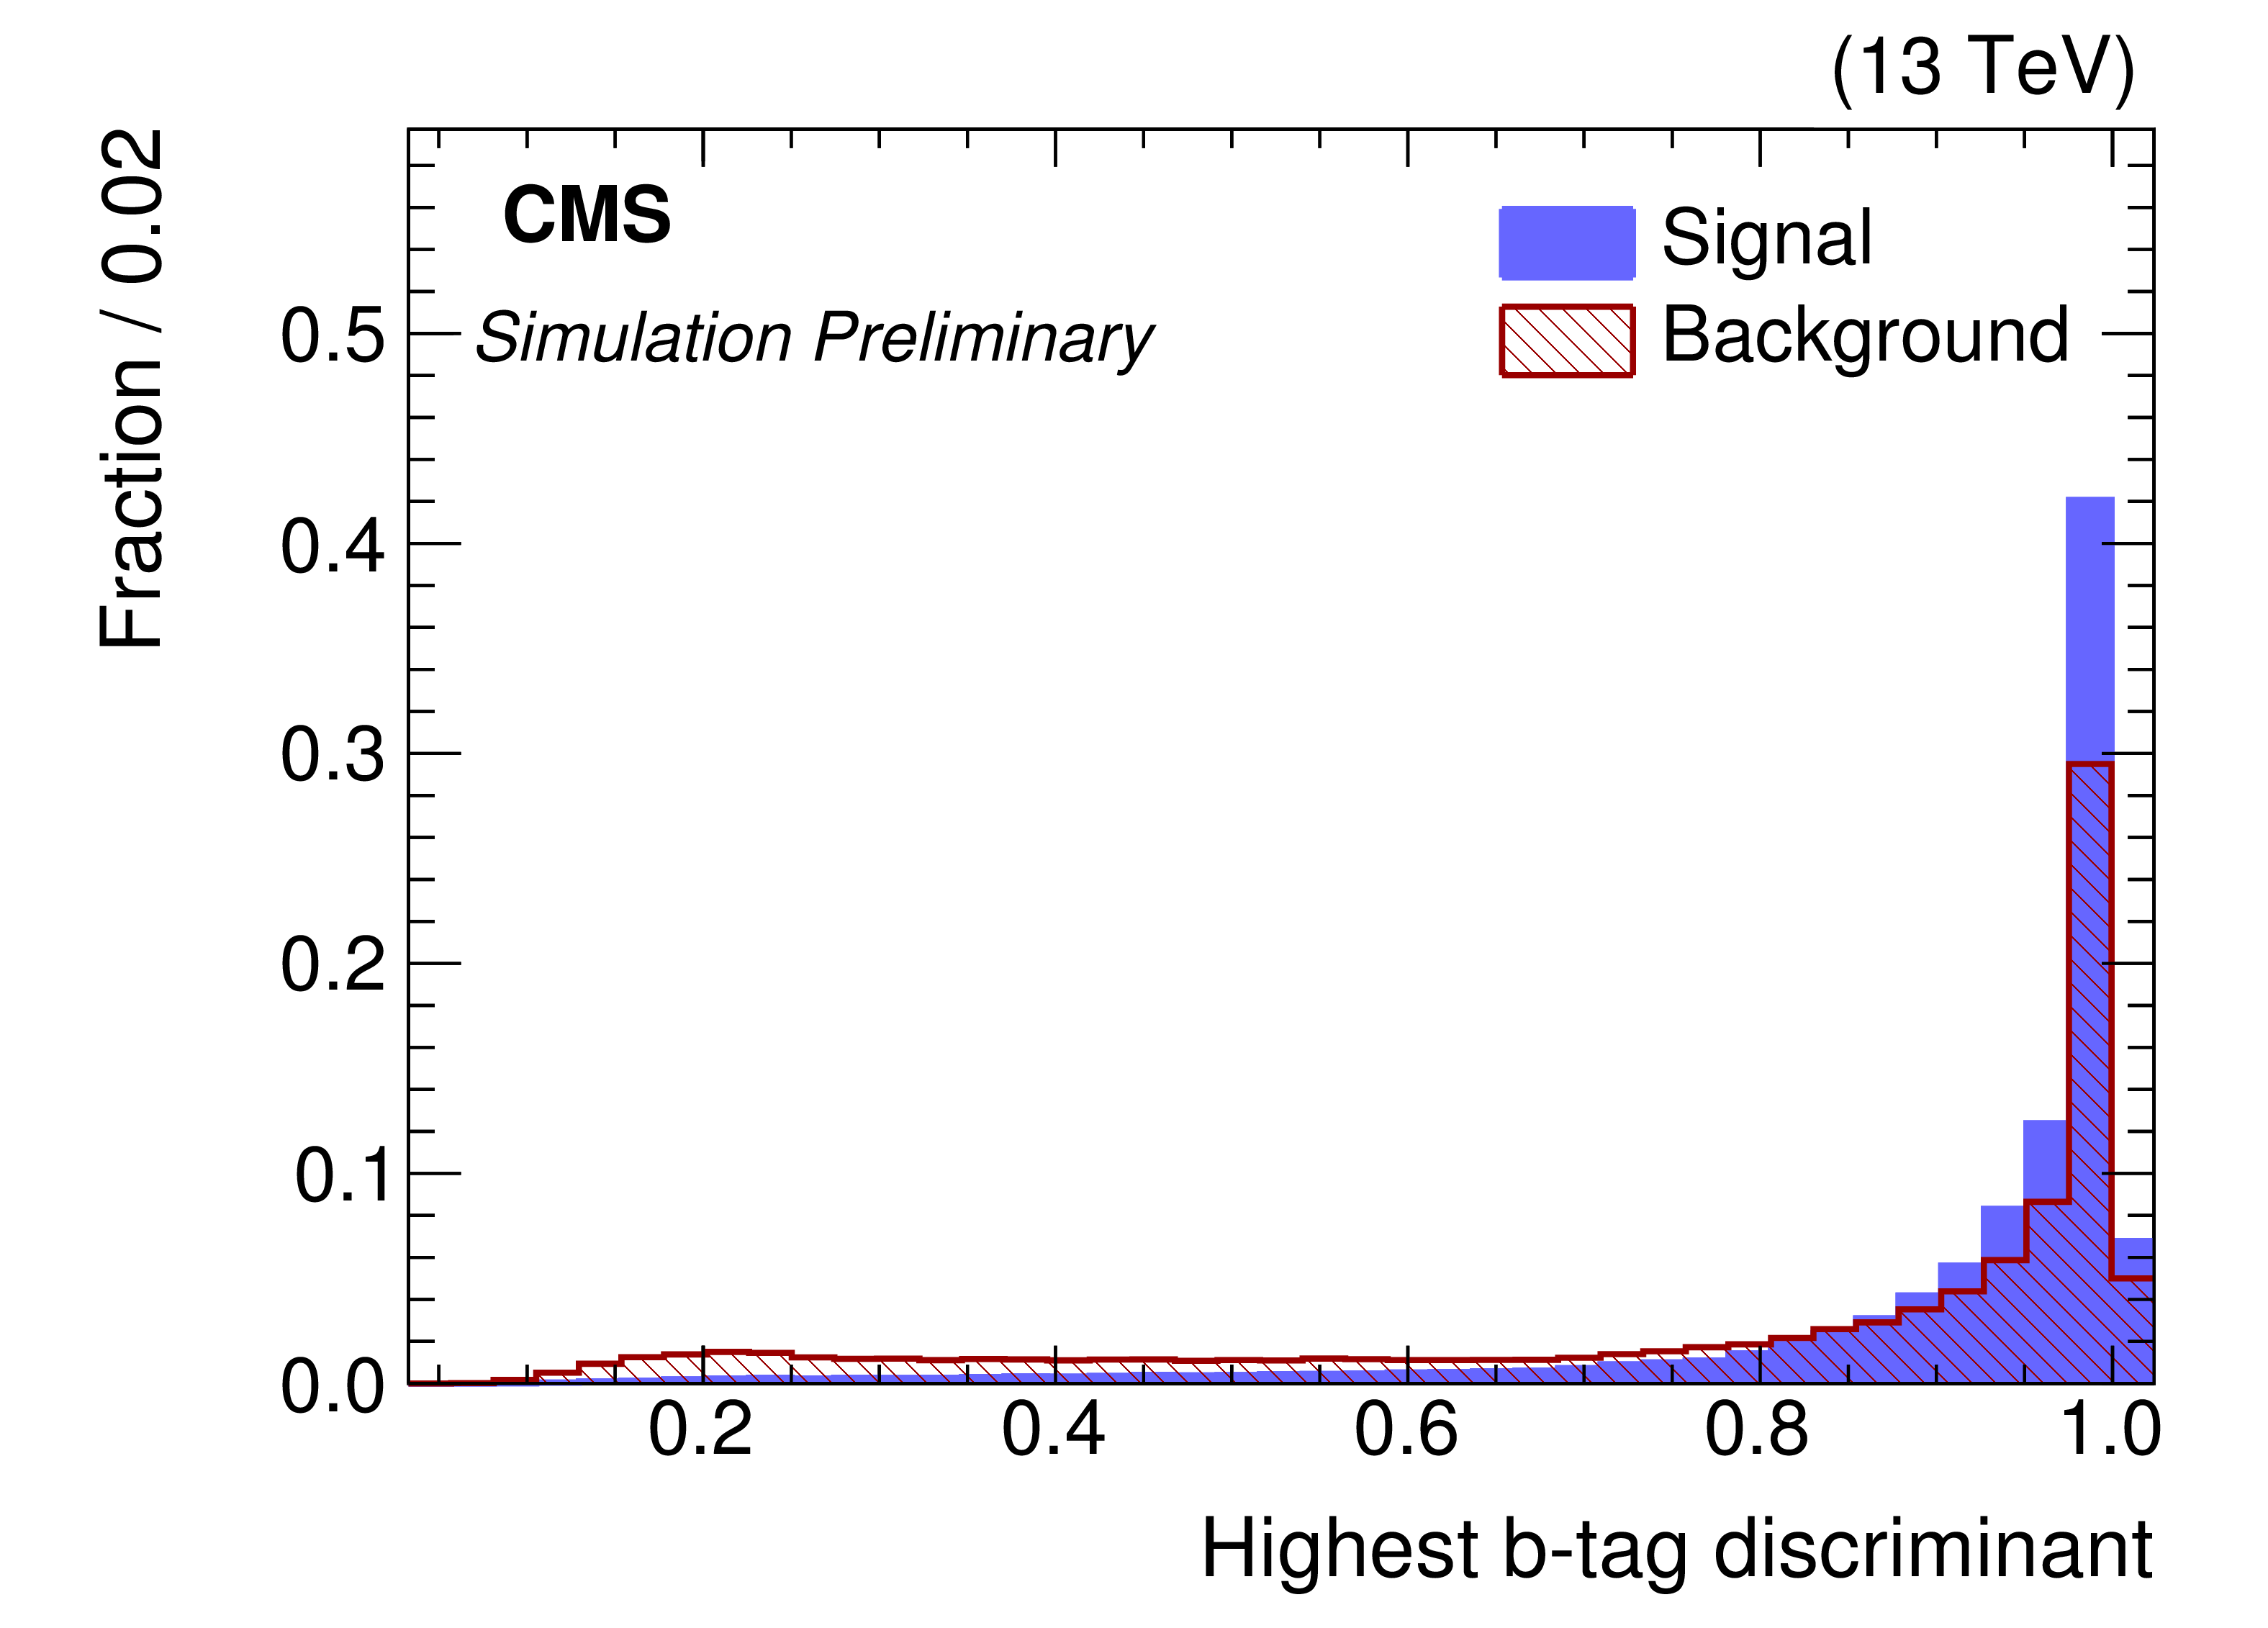
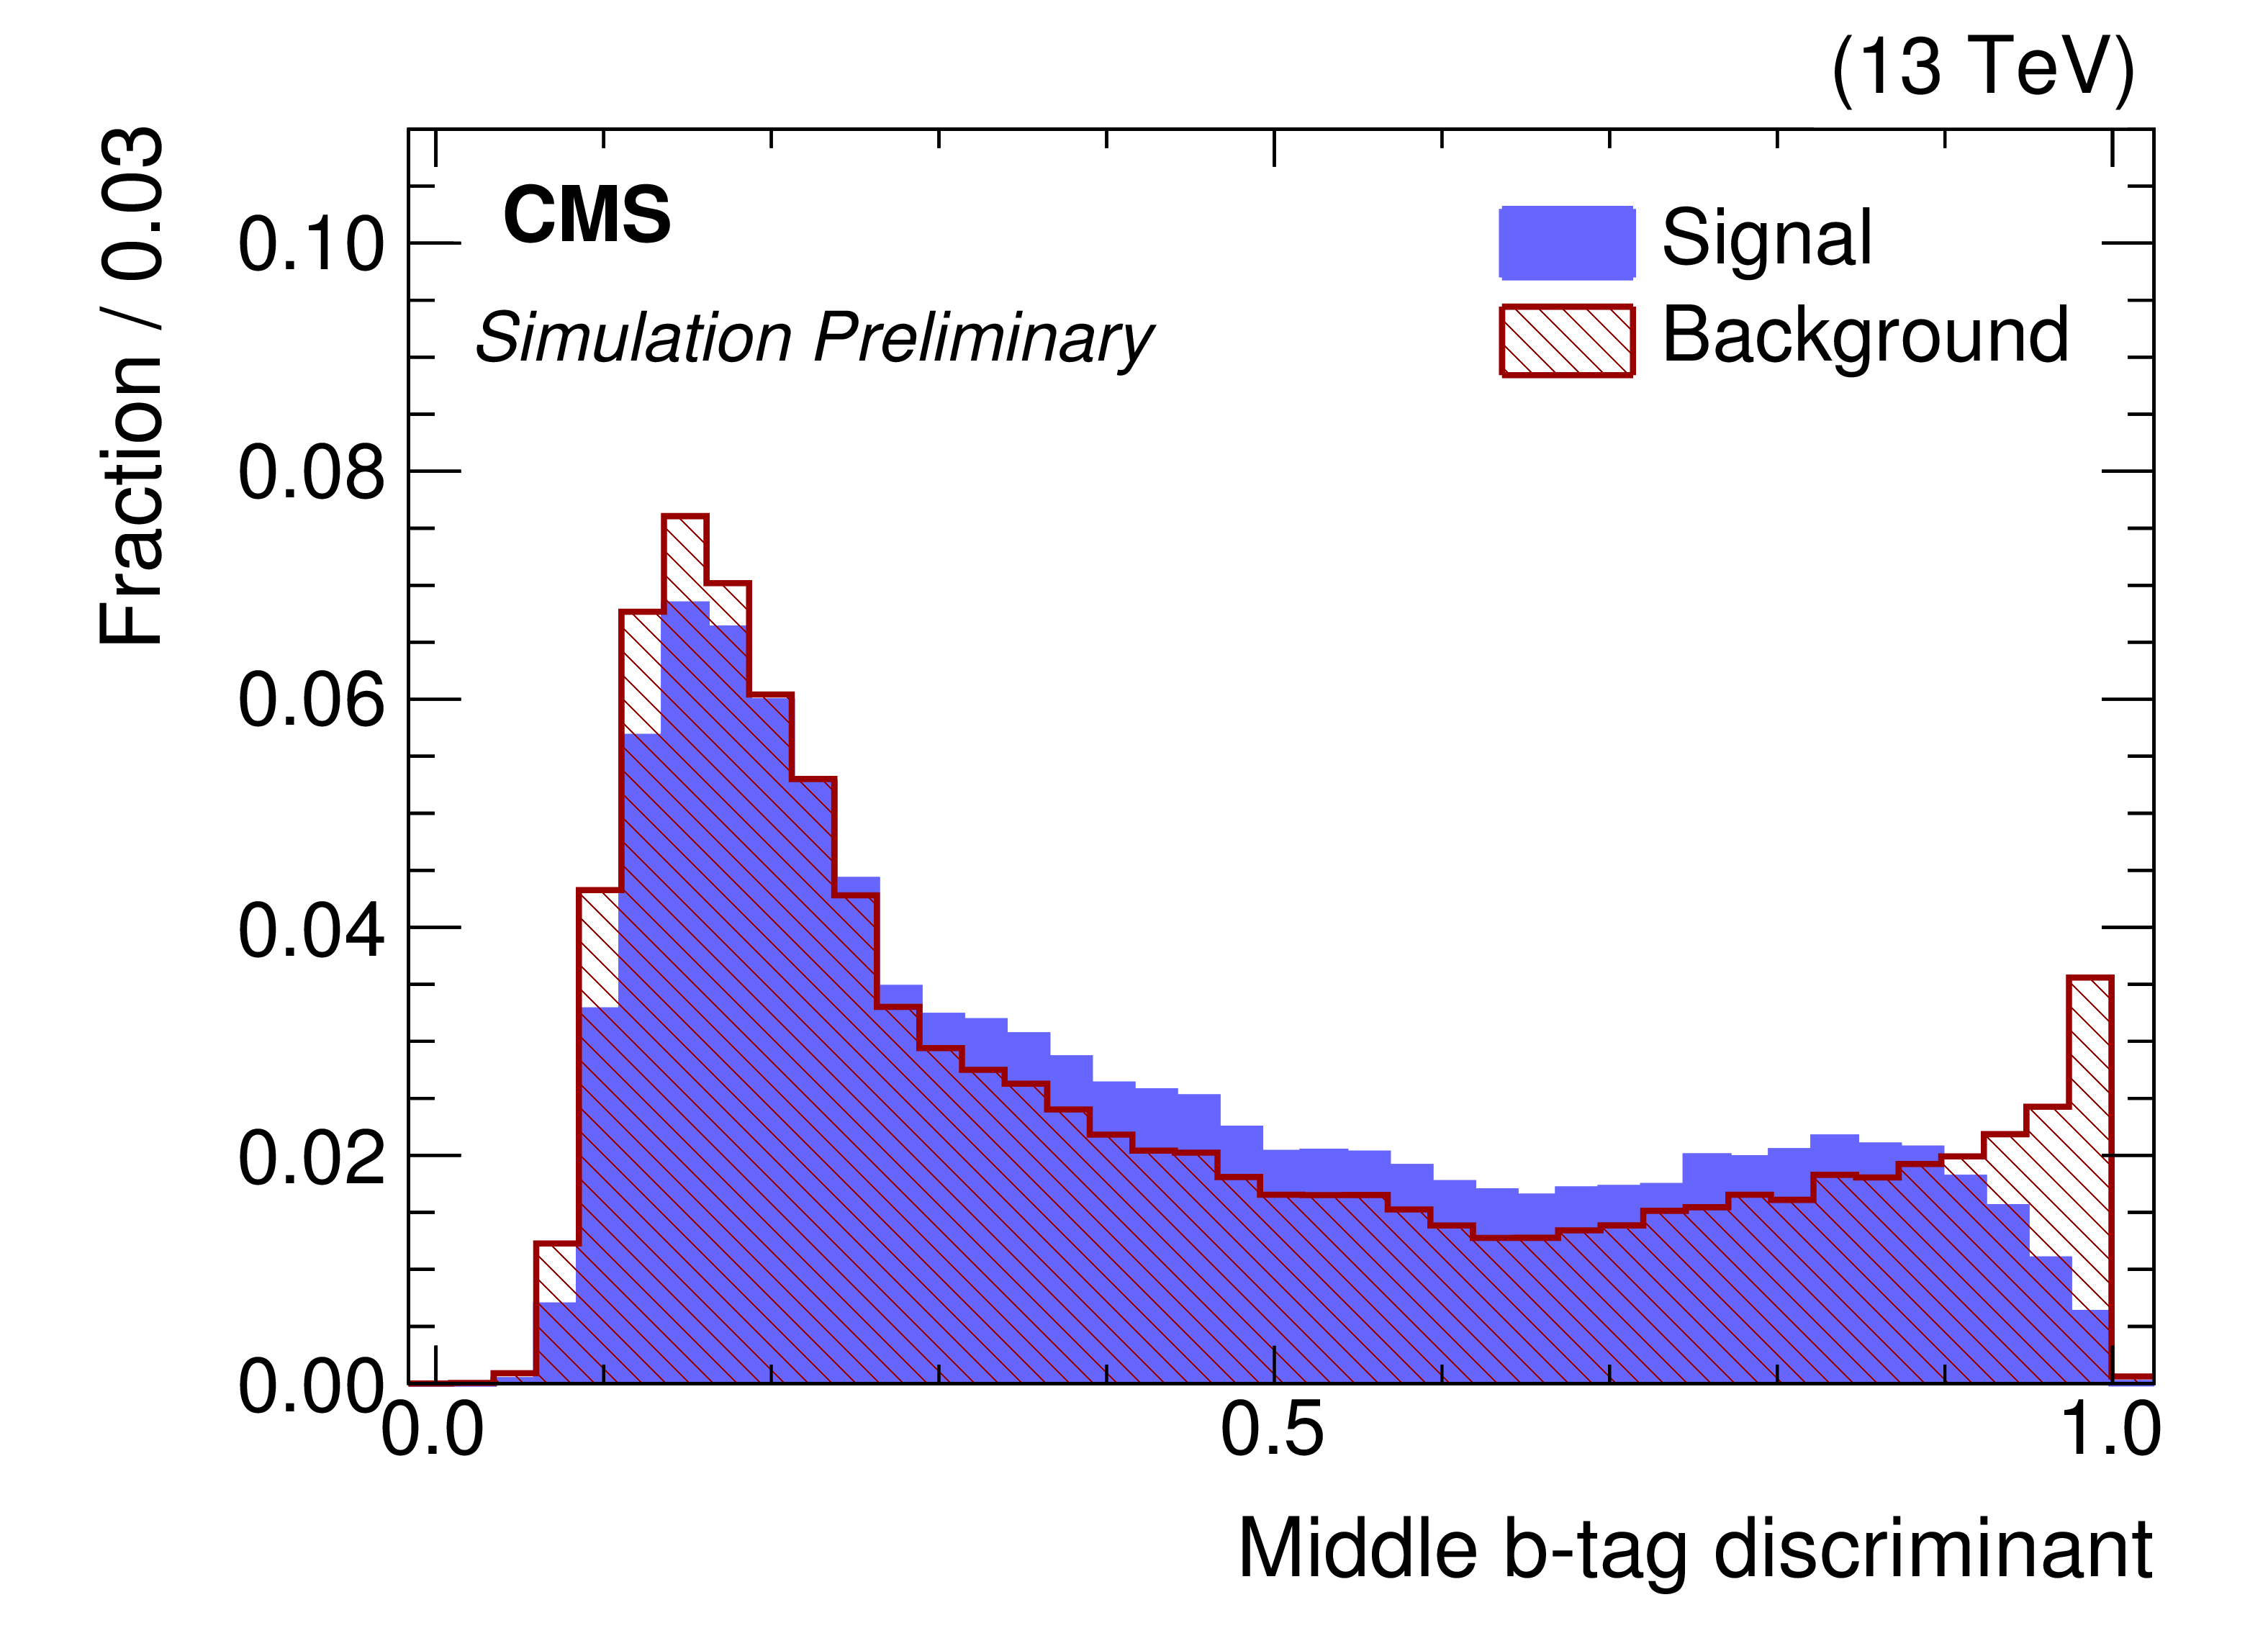
Additional Figure 30-a:
MVA training distributions for the leading (top), middle (bottom-left), and lowest (bottom-right) b-tag discriminant value in a tri-jet combination. Training events come from semileptonic $ \mathrm{ t \bar{t} } $ simulation. The signal is hadronically decaying tops matched to the tri-jet, while the background is tri-jet combinations that are not fully matched to the three daughter quarks from the top decay. Signal and background distributions are normalised to unit area. |
png pdf |
Additional Figure 30-b:
MVA training distributions for the leading (top), middle (bottom-left), and lowest (bottom-right) b-tag discriminant value in a tri-jet combination. Training events come from semileptonic $ \mathrm{ t \bar{t} } $ simulation. The signal is hadronically decaying tops matched to the tri-jet, while the background is tri-jet combinations that are not fully matched to the three daughter quarks from the top decay. Signal and background distributions are normalised to unit area. |

png pdf |
Additional Figure 30-c:
MVA training distributions for the leading (top), middle (bottom-left), and lowest (bottom-right) b-tag discriminant value in a tri-jet combination. Training events come from semileptonic $ \mathrm{ t \bar{t} } $ simulation. The signal is hadronically decaying tops matched to the tri-jet, while the background is tri-jet combinations that are not fully matched to the three daughter quarks from the top decay. Signal and background distributions are normalised to unit area. |

png pdf |
Additional Figure 31:
MVA training distributions for kinematic fit probability. Training events come from semileptonic $ \mathrm{ t \bar{t} } $ simulation. The signal is hadronically decaying tops matched to the tri-jet, while the background is tri-jet combinations that are not fully matched to the three daughter quarks from the top decay. Signal and background distributions are normalised to unit area. |

png pdf |
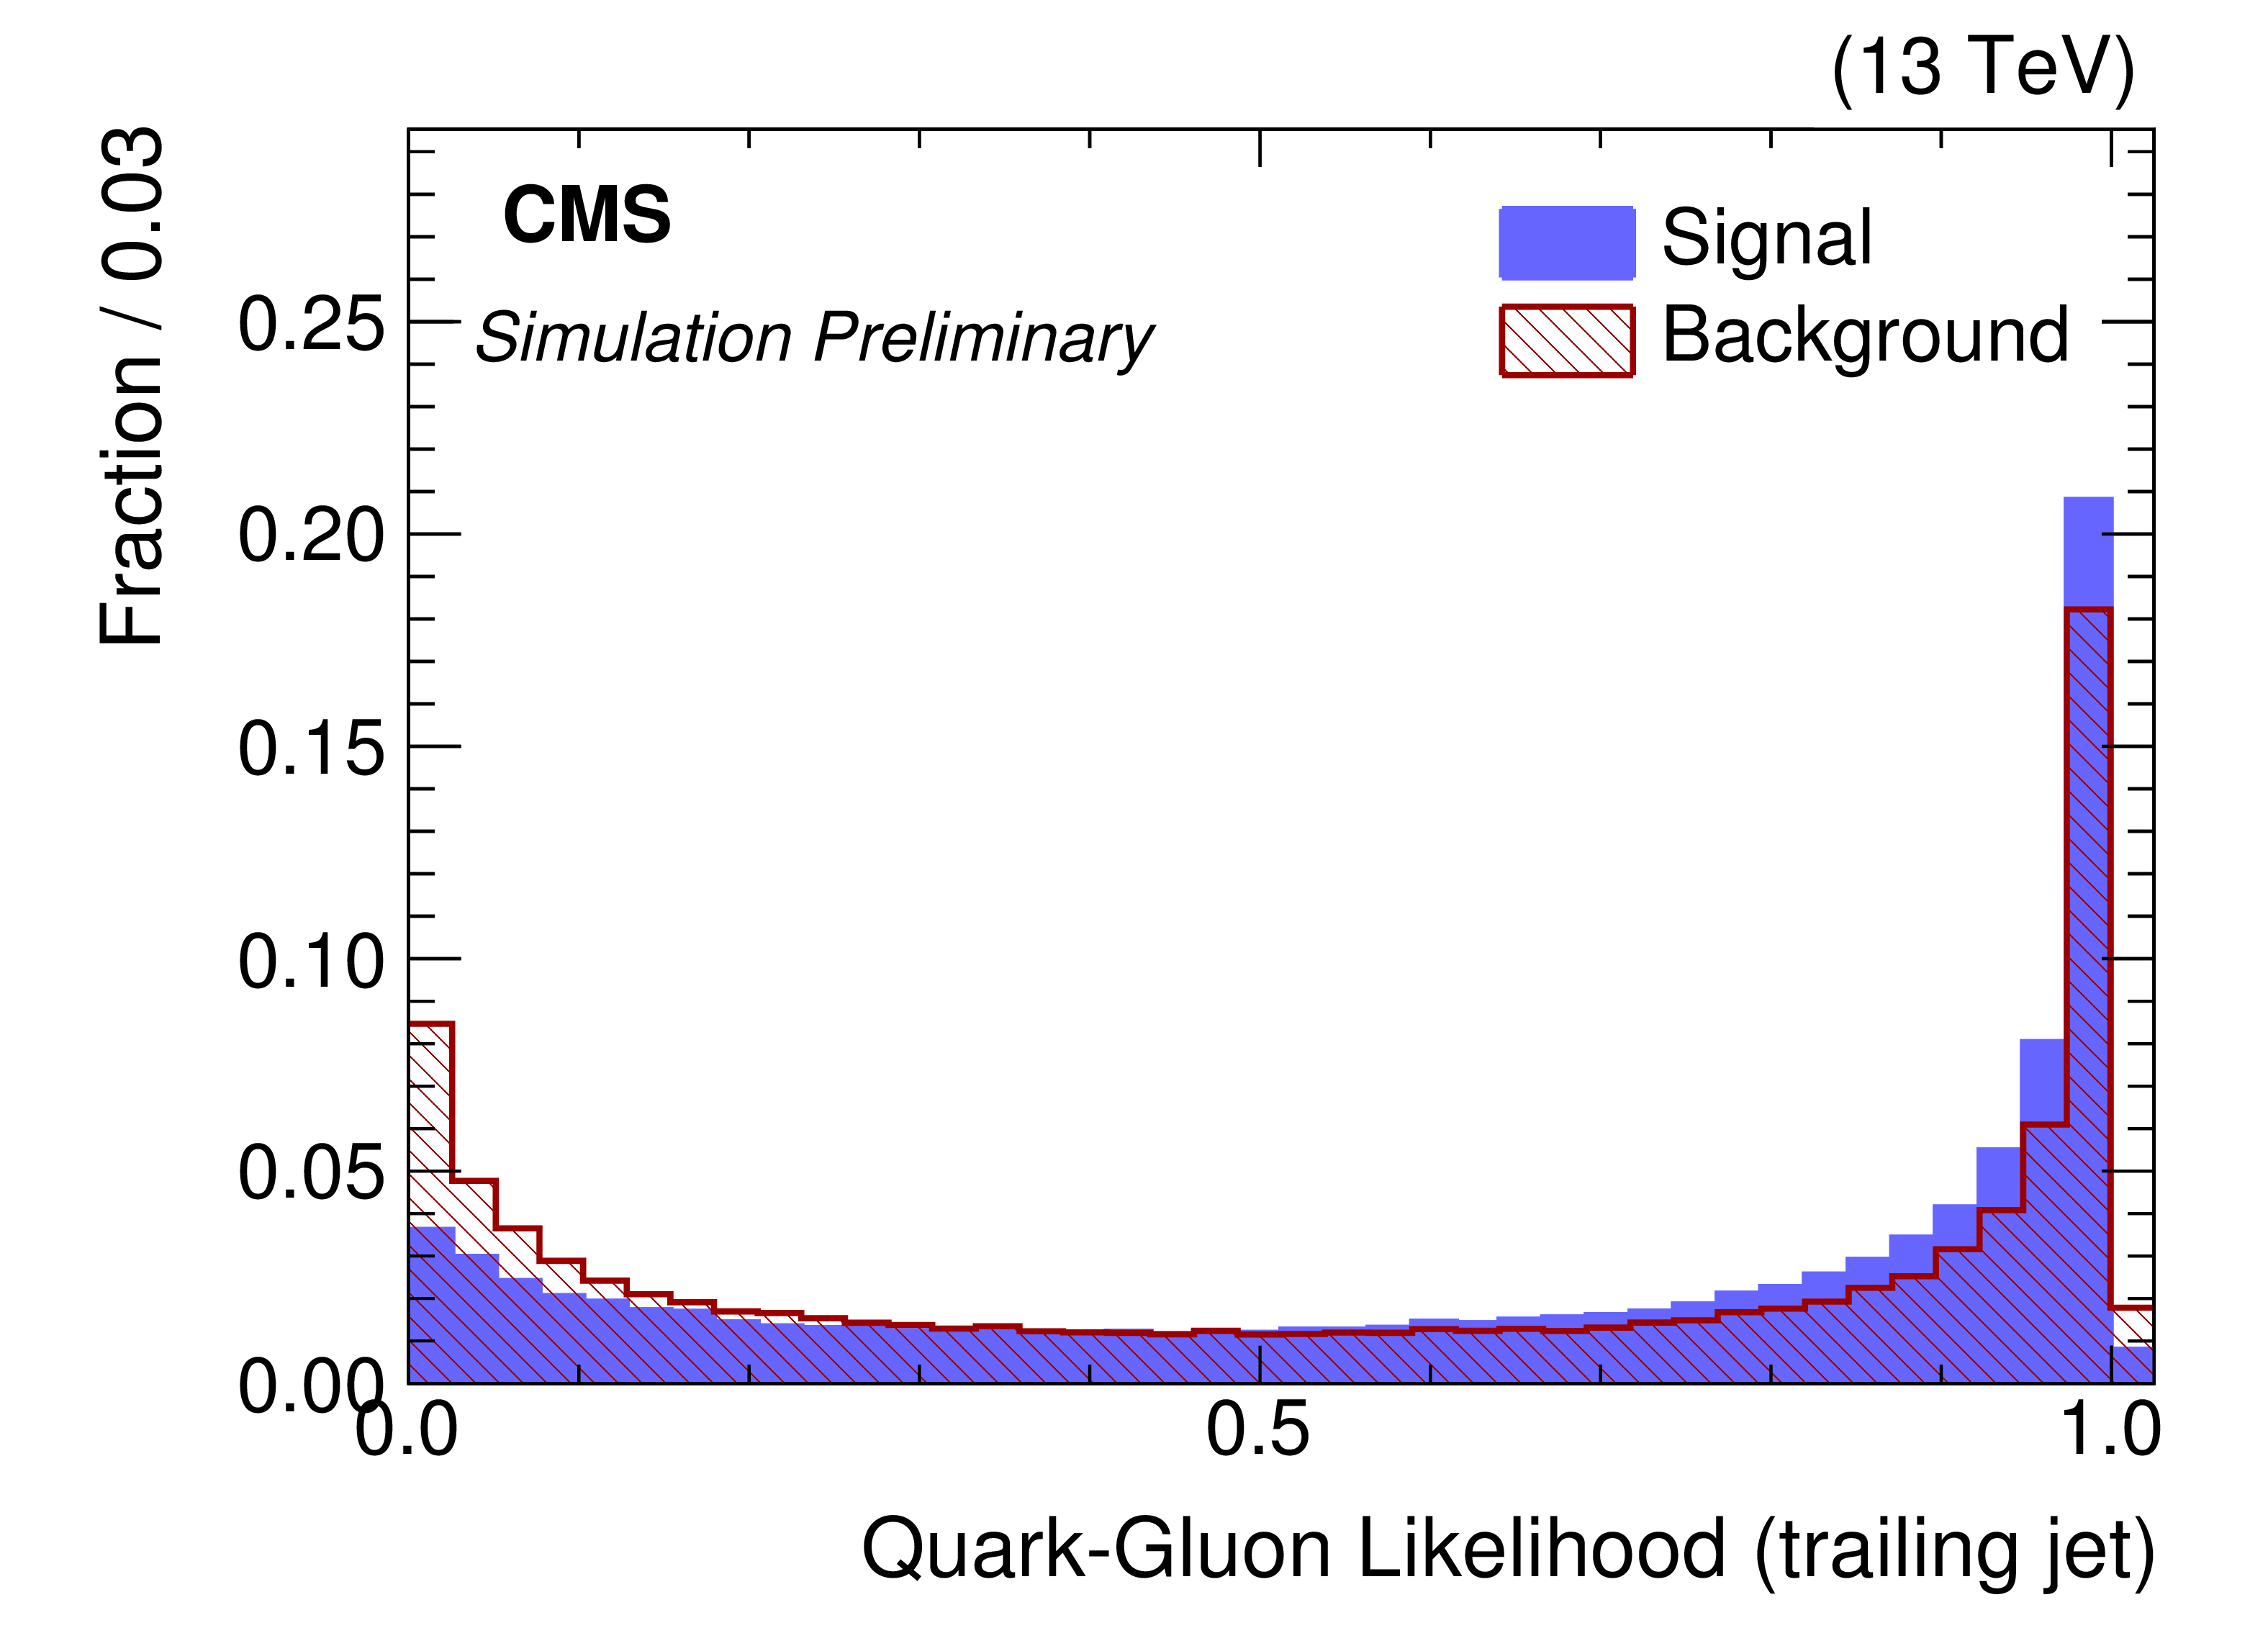
Additional Figure 32-a:
MVA training distributions for the quark/gluon likelihood of the leading (left) and the trailing (right) "W-jet". The "W-jets" are the two jets with middle and lowest b-tag discrimant values, representing candidates for hadronic W decay. Training events come from semileptonic $ \mathrm{ t \bar{t} } $ simulation. The signal is hadronically decaying tops matched to the tri-jet, while the background is tri-jet combinations that are not fully matched to the three daughter quarks from the top decay. Signal and background distributions are normalised to unit area. |
png pdf |
Additional Figure 32-b:
MVA training distributions for the quark/gluon likelihood of the leading (left) and the trailing (right) "W-jet". The "W-jets" are the two jets with middle and lowest b-tag discrimant values, representing candidates for hadronic W decay. Training events come from semileptonic $ \mathrm{ t \bar{t} } $ simulation. The signal is hadronically decaying tops matched to the tri-jet, while the background is tri-jet combinations that are not fully matched to the three daughter quarks from the top decay. Signal and background distributions are normalised to unit area. |
png pdf |
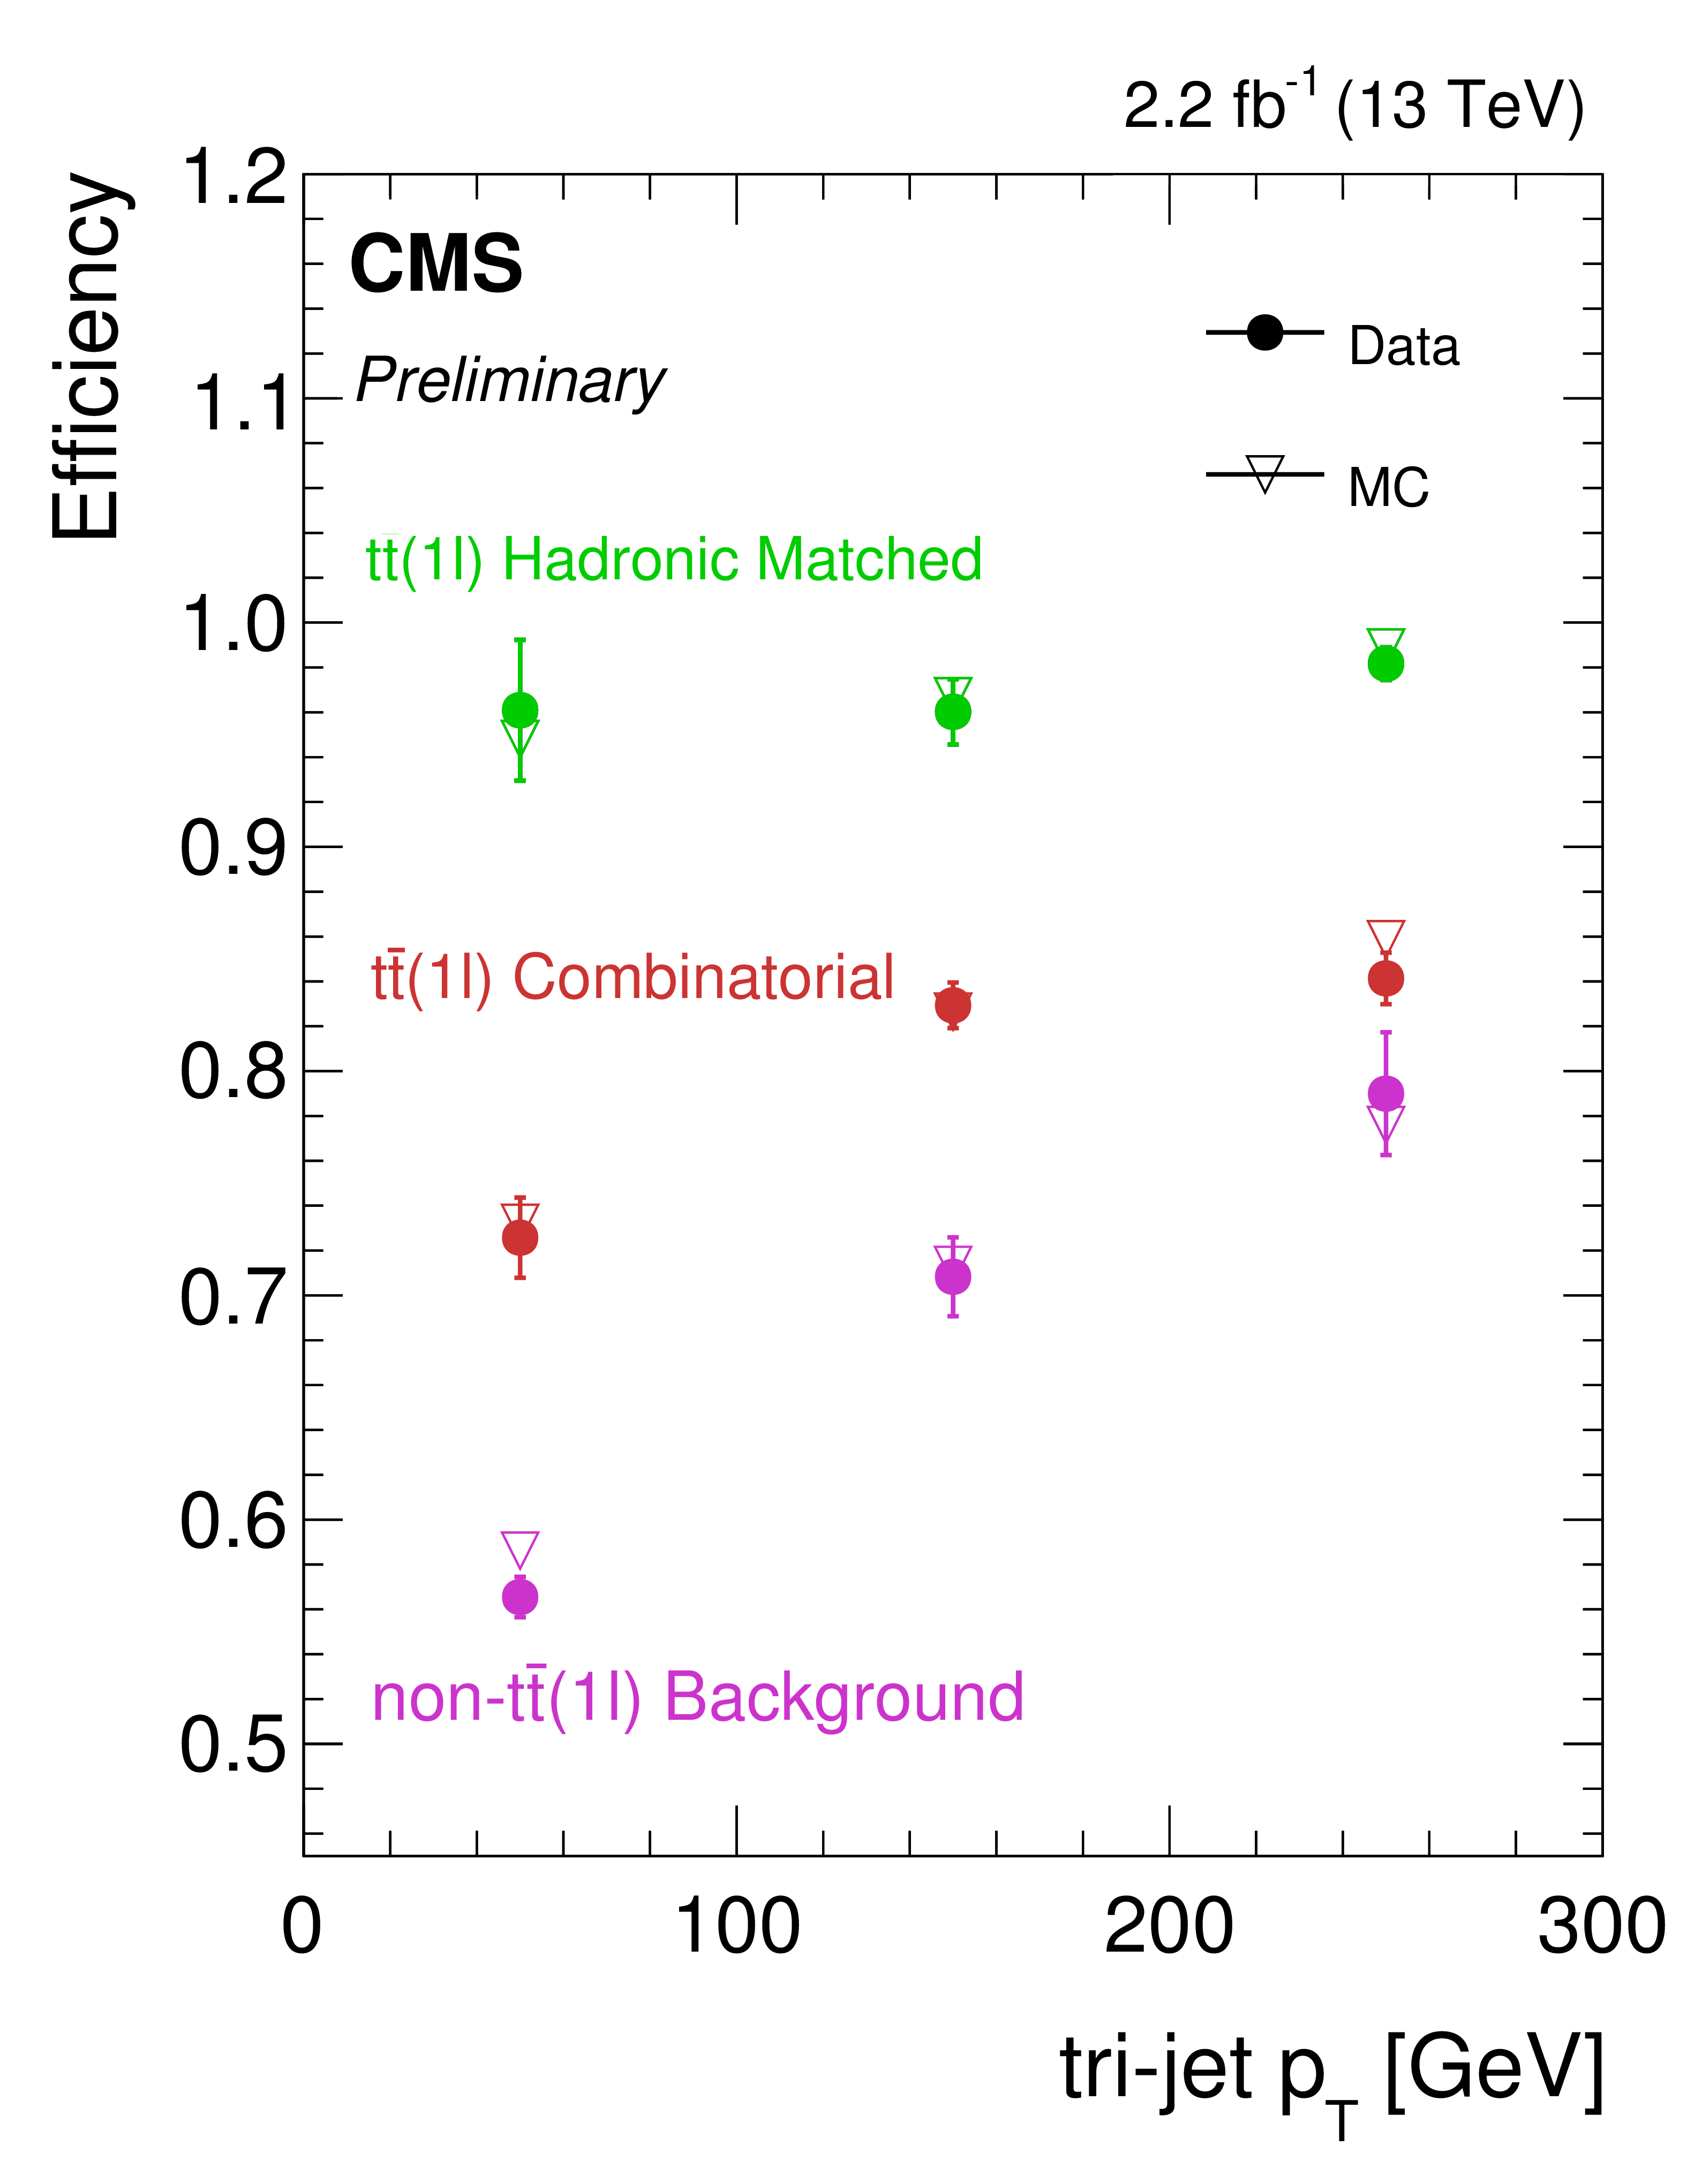
Additional Figure 33:
Resolved top tagger efficiencies in data and MC for the hadronic top signal (green), the combinatorial background in semileptonic $ \mathrm{ t \bar{t} } $ (red), and the background in processes without a hadronic top (magenta). Efficiencies are binned in $p_{\mathrm{T}}$: $p_{\mathrm{T}} < $ 100 GeV, 100 GeV $ < p_{\mathrm{T}} < $ 200 GeV, and $p_{\mathrm{T}} > $ 200 GeV. Efficiencies are measured with the tag-and-probe method using $ \mathrm{ t \bar{t} } $ events. The first two efficiency terms are measured in semileptonic $ \mathrm{ t \bar{t} } $ dominated events via a single muon plus jets with b-tags selection. The third efficiency term is measured in dileptonic $ \mathrm{ t \bar{t} } $ dominated events via a dilepton plus jets with b-tags selection. In each event, the tri-jet combination with the highest resolved top tagger discriminant value (the ``probe'') is used to compute the efficiency. |
png pdf |
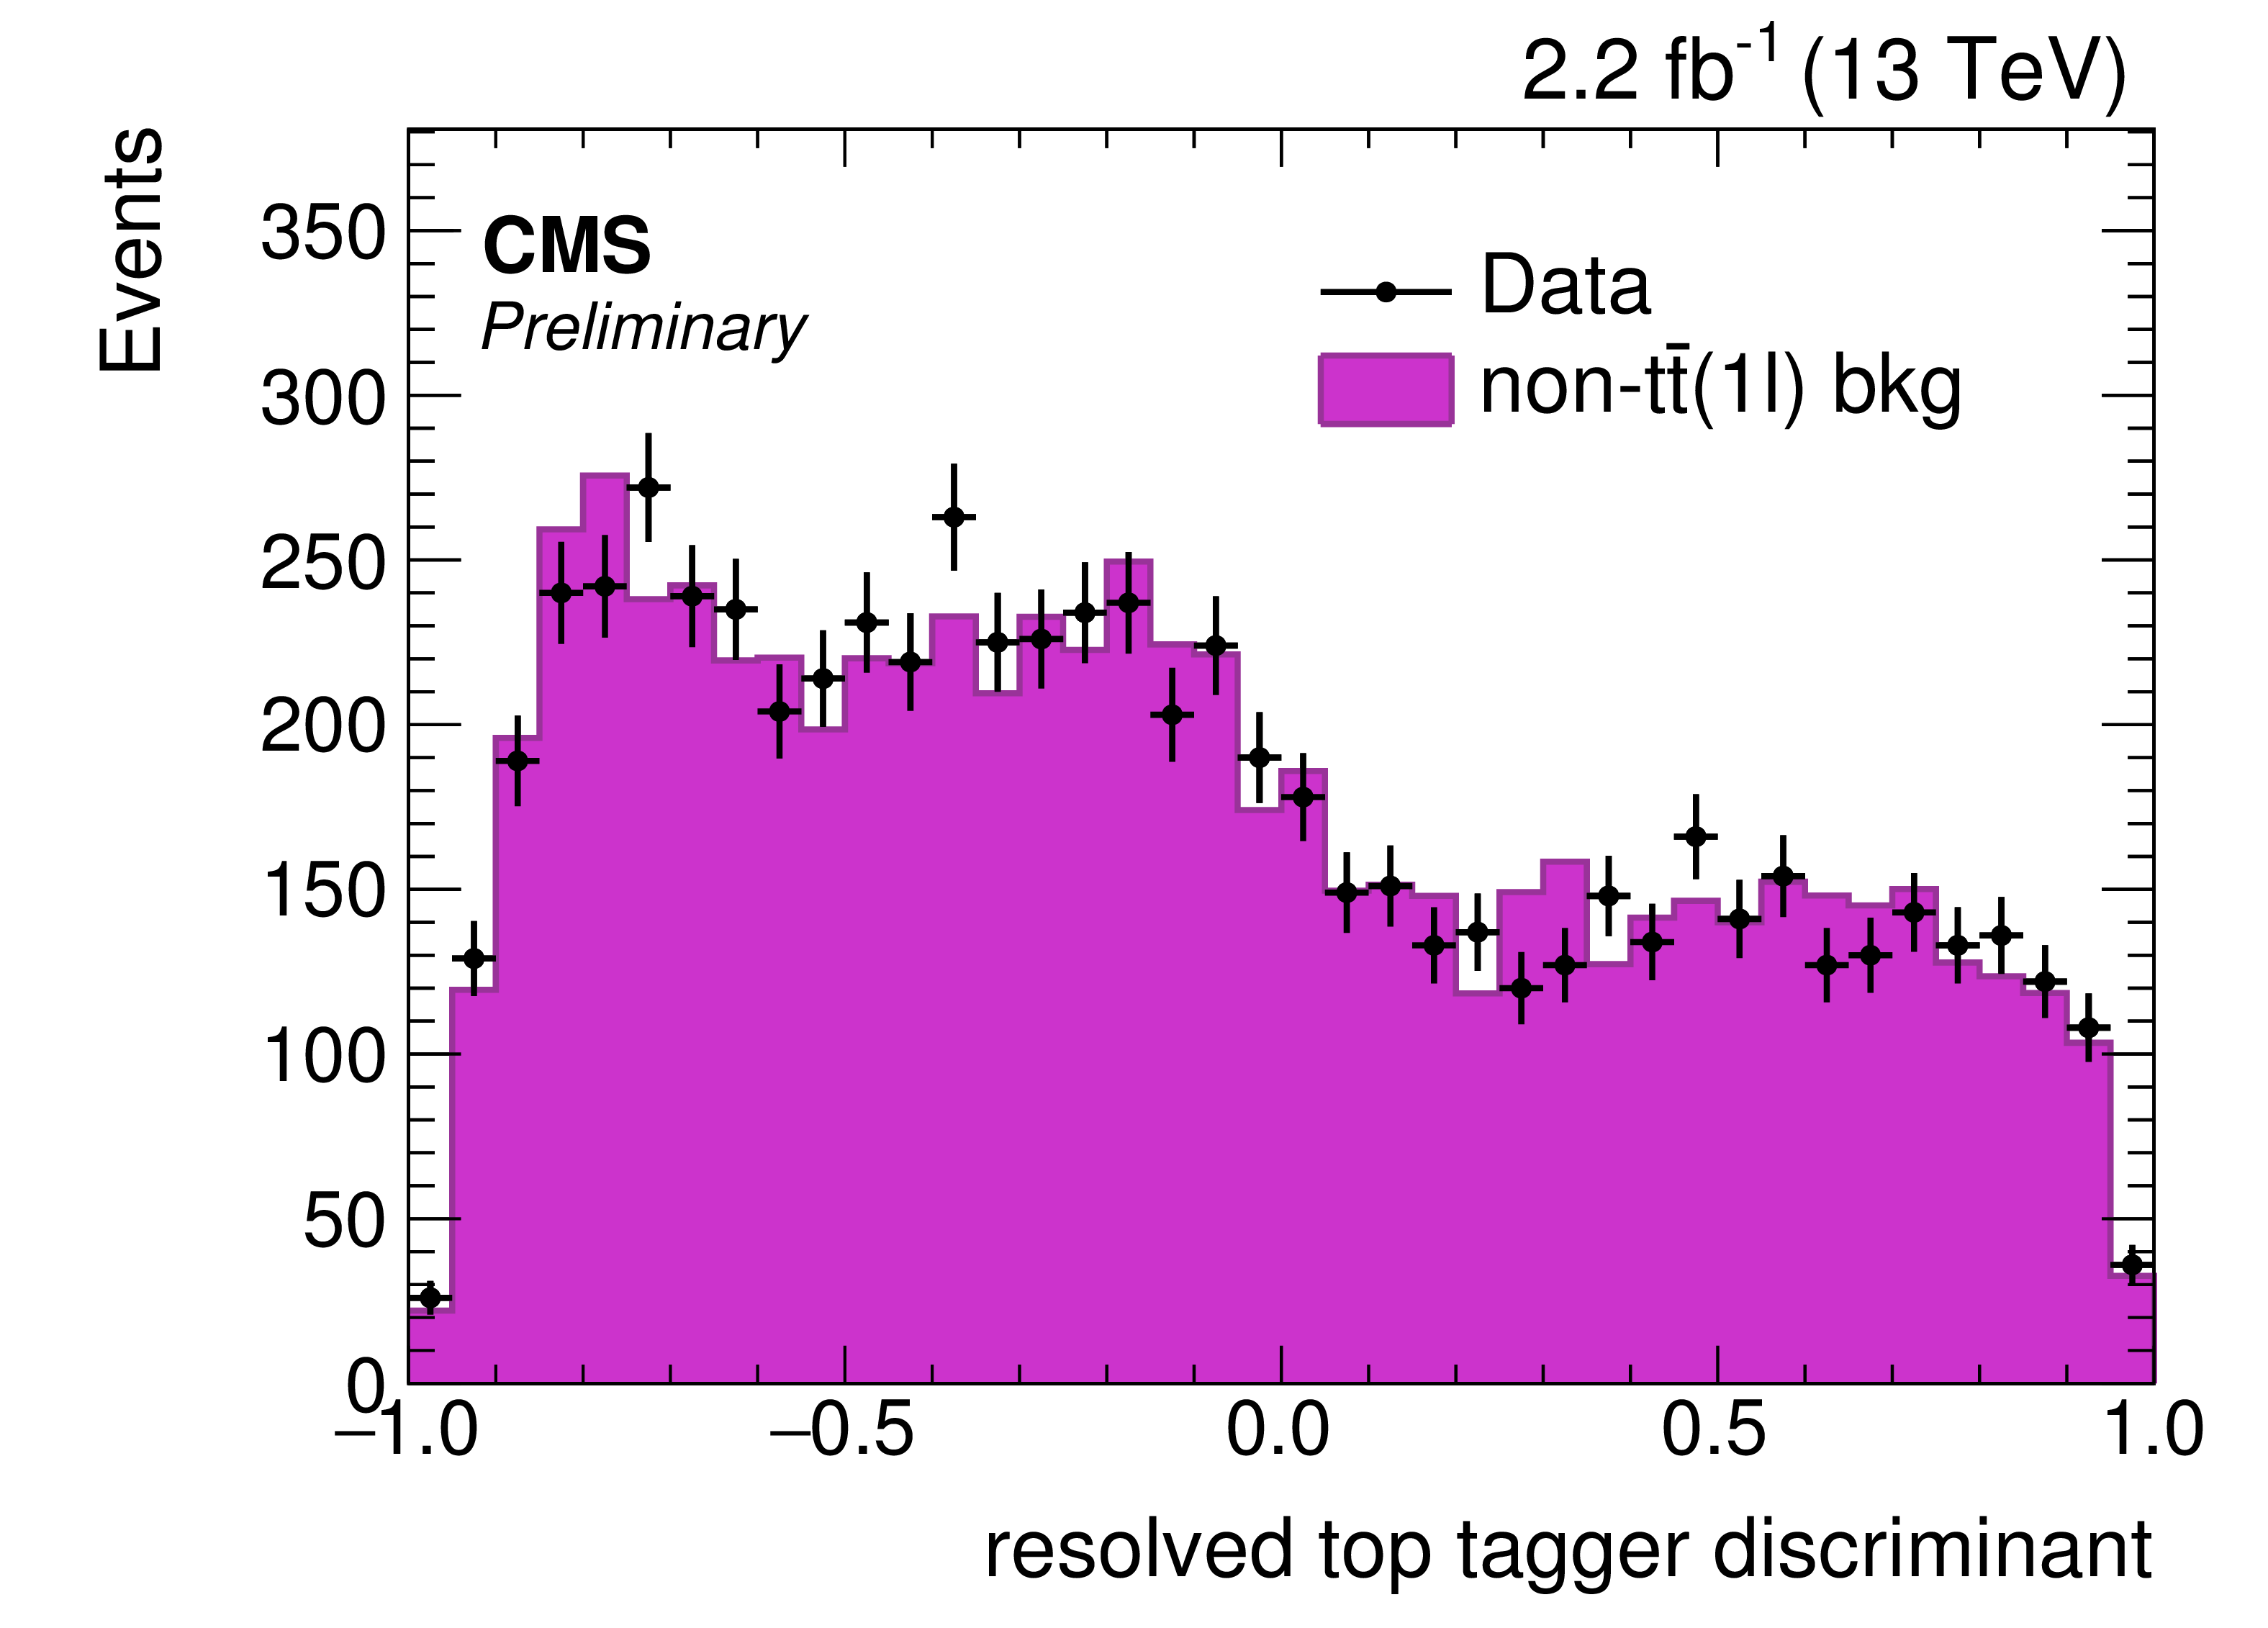
Additional Figure 34:
Distribution of the resolved top tagger discriminant in the dilepton sample used to measure the efficiency for non-$ \mathrm{ t \bar{t} } (1\ell) $ background. Contributions from hadronic tops and $ \mathrm{ t \bar{t} } (1\ell) $ combinatorial bkg are negligible. The sample is dominated by dileptonic ttbar events, with some contribution from $Z(\ell \ell )$+jets. The efficiency for any working point is computed by counting the fraction of events above the cut threshold. |
png pdf |
Additional Figure 35-a:
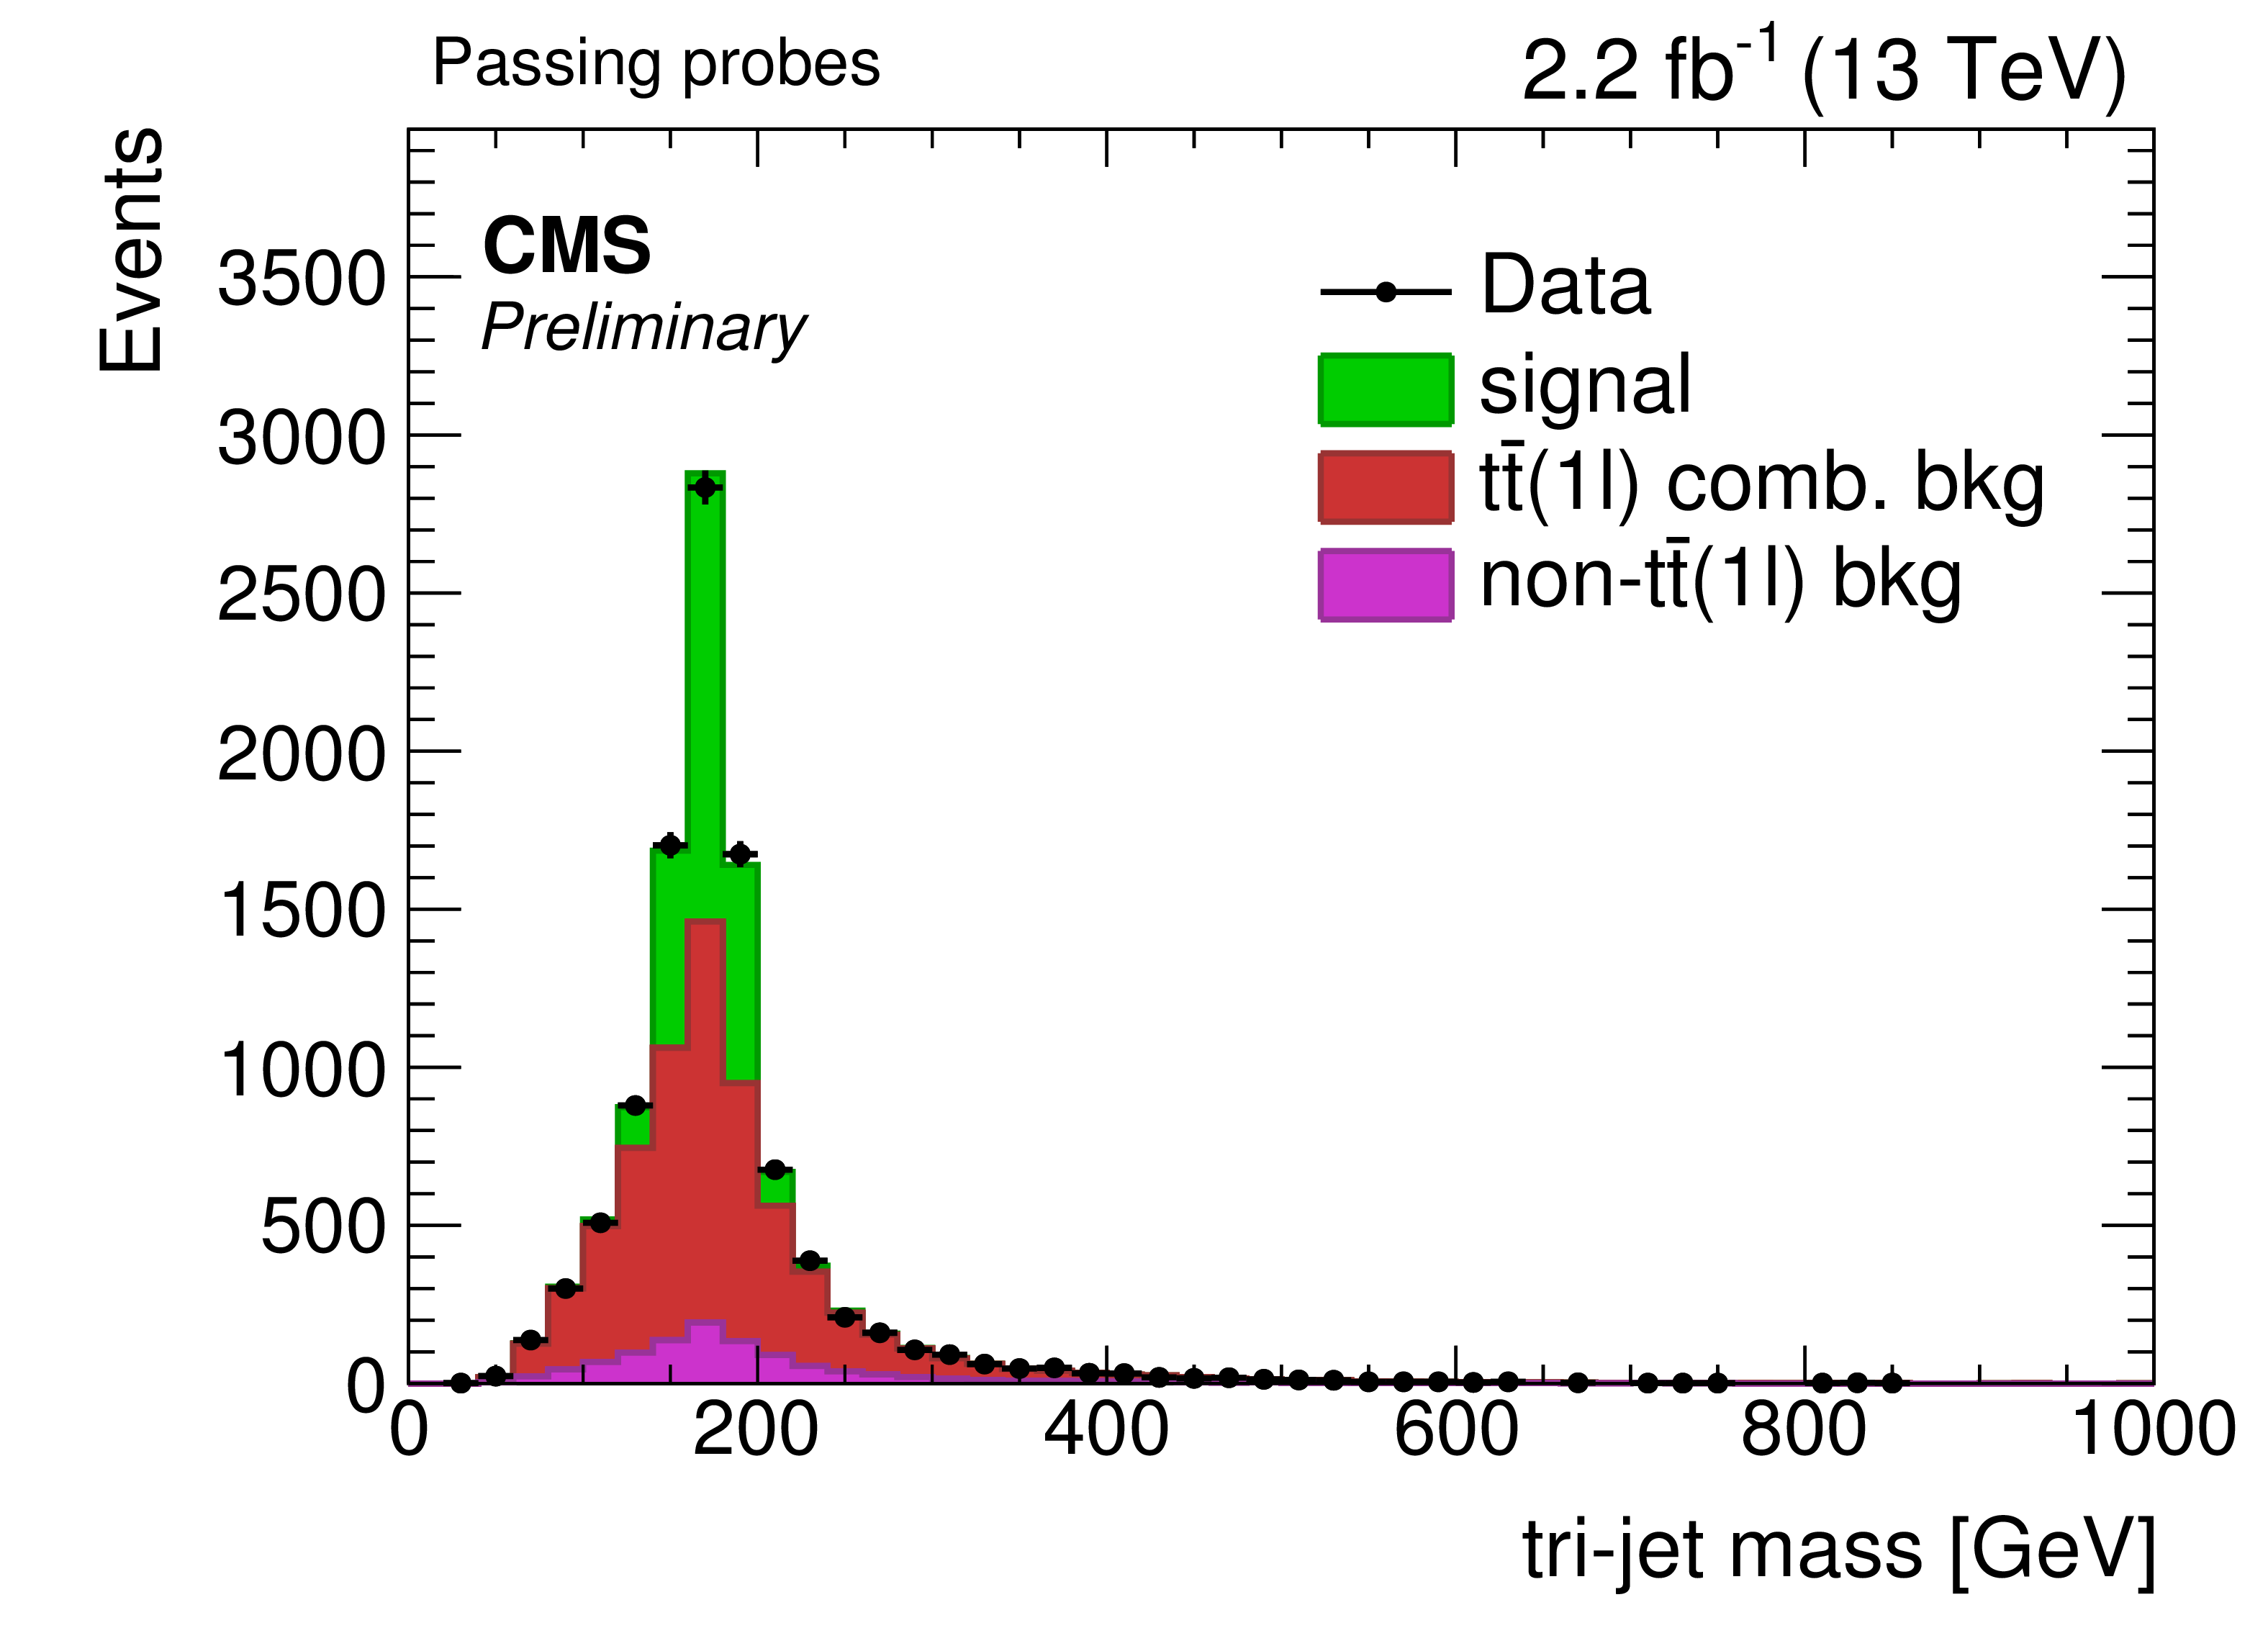
Fit to the tri-jet mass distribution for passing (right) and failing (left) ``probes'' for the efficiency measurement using the tag-and-probe method. The data is fitted to three templates: tri-jets from hadronic tops (signal), tri-jets from combinatorics in semileptonic $ \mathrm{ t \bar{t} } $ ($ \mathrm{ t \bar{t} } (1\ell) $ comb. bkg), and tri-jets from other processes (non-$ \mathrm{ t \bar{t} } (1\ell) $ bkg). Events are tagged by requirements of exactly one good muon, four or more jets with at least two b-tags, and $E_{\mathrm{T}}^{\text{miss}} > $ 40 GeV. This produces a sample dominated by $ \mathrm{ t \bar{t} } (1\ell) $. The ``probe'' is the tri-jet combination with the highest resolved top tagger discriminant value in the event. |
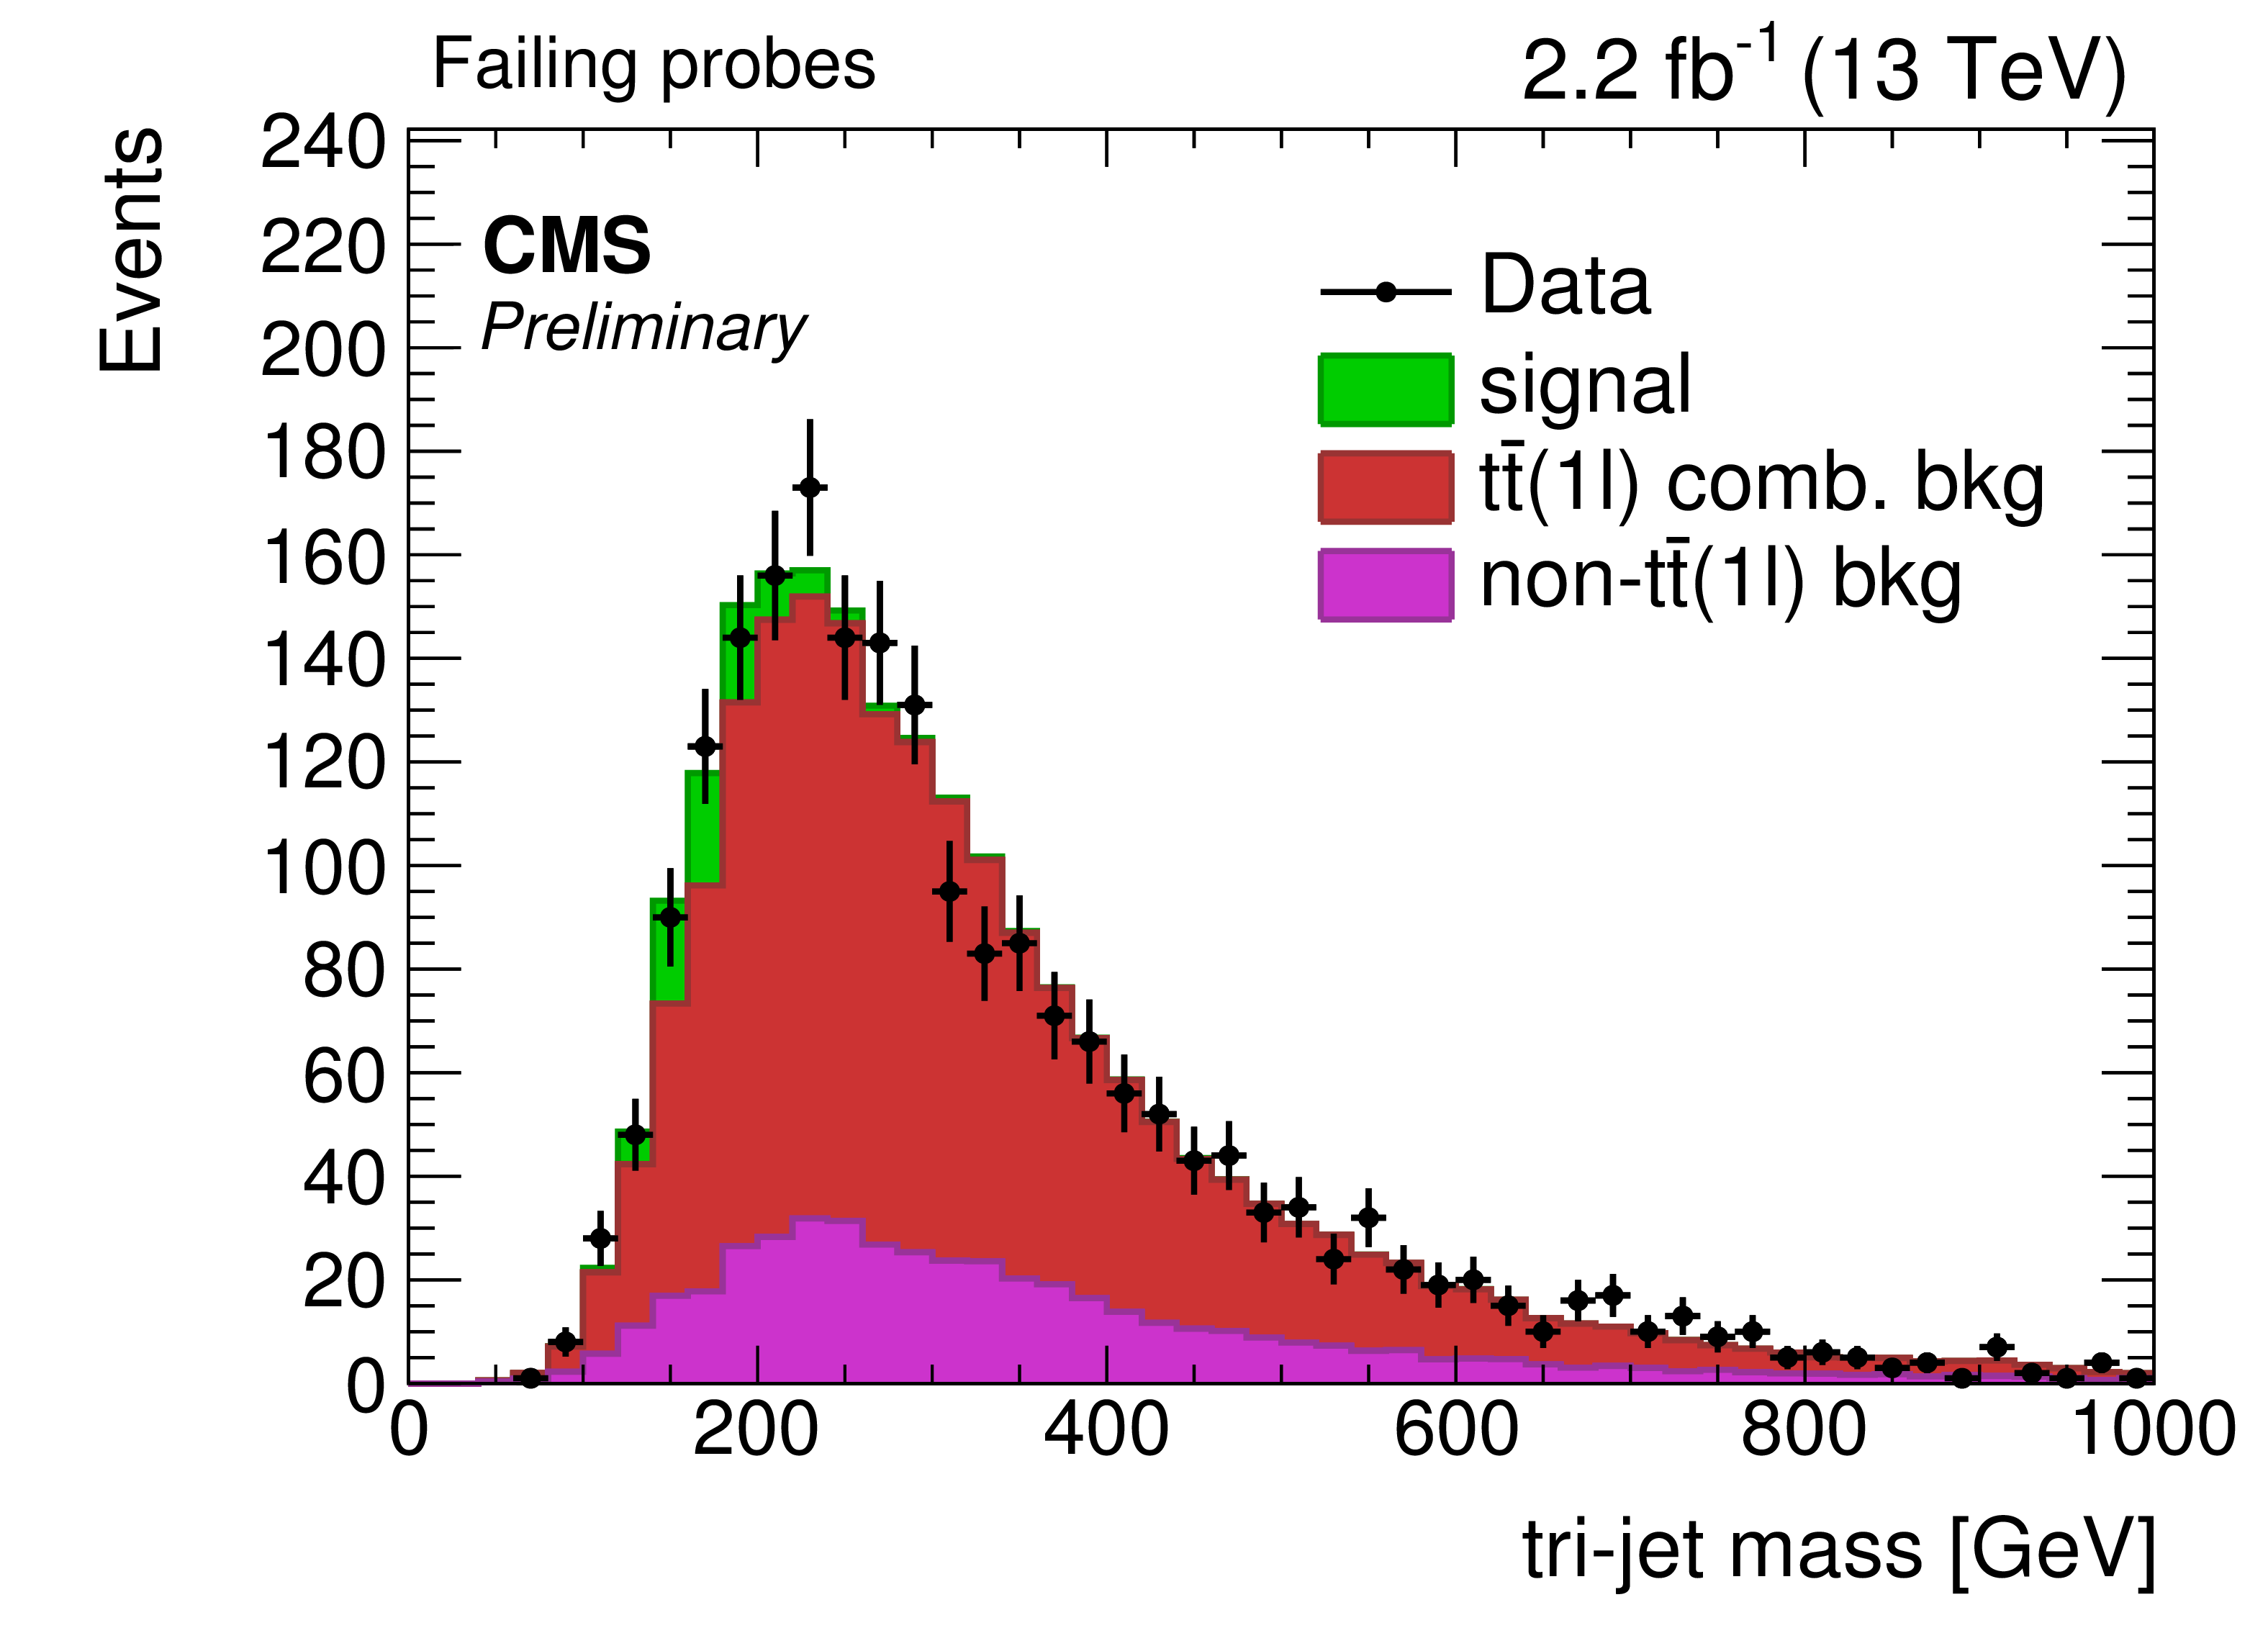
png pdf |
Additional Figure 35-b:
Fit to the tri-jet mass distribution for passing (right) and failing (left) ``probes'' for the efficiency measurement using the tag-and-probe method. The data is fitted to three templates: tri-jets from hadronic tops (signal), tri-jets from combinatorics in semileptonic $ \mathrm{ t \bar{t} } $ ($ \mathrm{ t \bar{t} } (1\ell) $ comb. bkg), and tri-jets from other processes (non-$ \mathrm{ t \bar{t} } (1\ell) $ bkg). Events are tagged by requirements of exactly one good muon, four or more jets with at least two b-tags, and $E_{\mathrm{T}}^{\text{miss}} > $ 40 GeV. This produces a sample dominated by $ \mathrm{ t \bar{t} } (1\ell) $. The ``probe'' is the tri-jet combination with the highest resolved top tagger discriminant value in the event. |
png pdf |
Additional Figure 36:
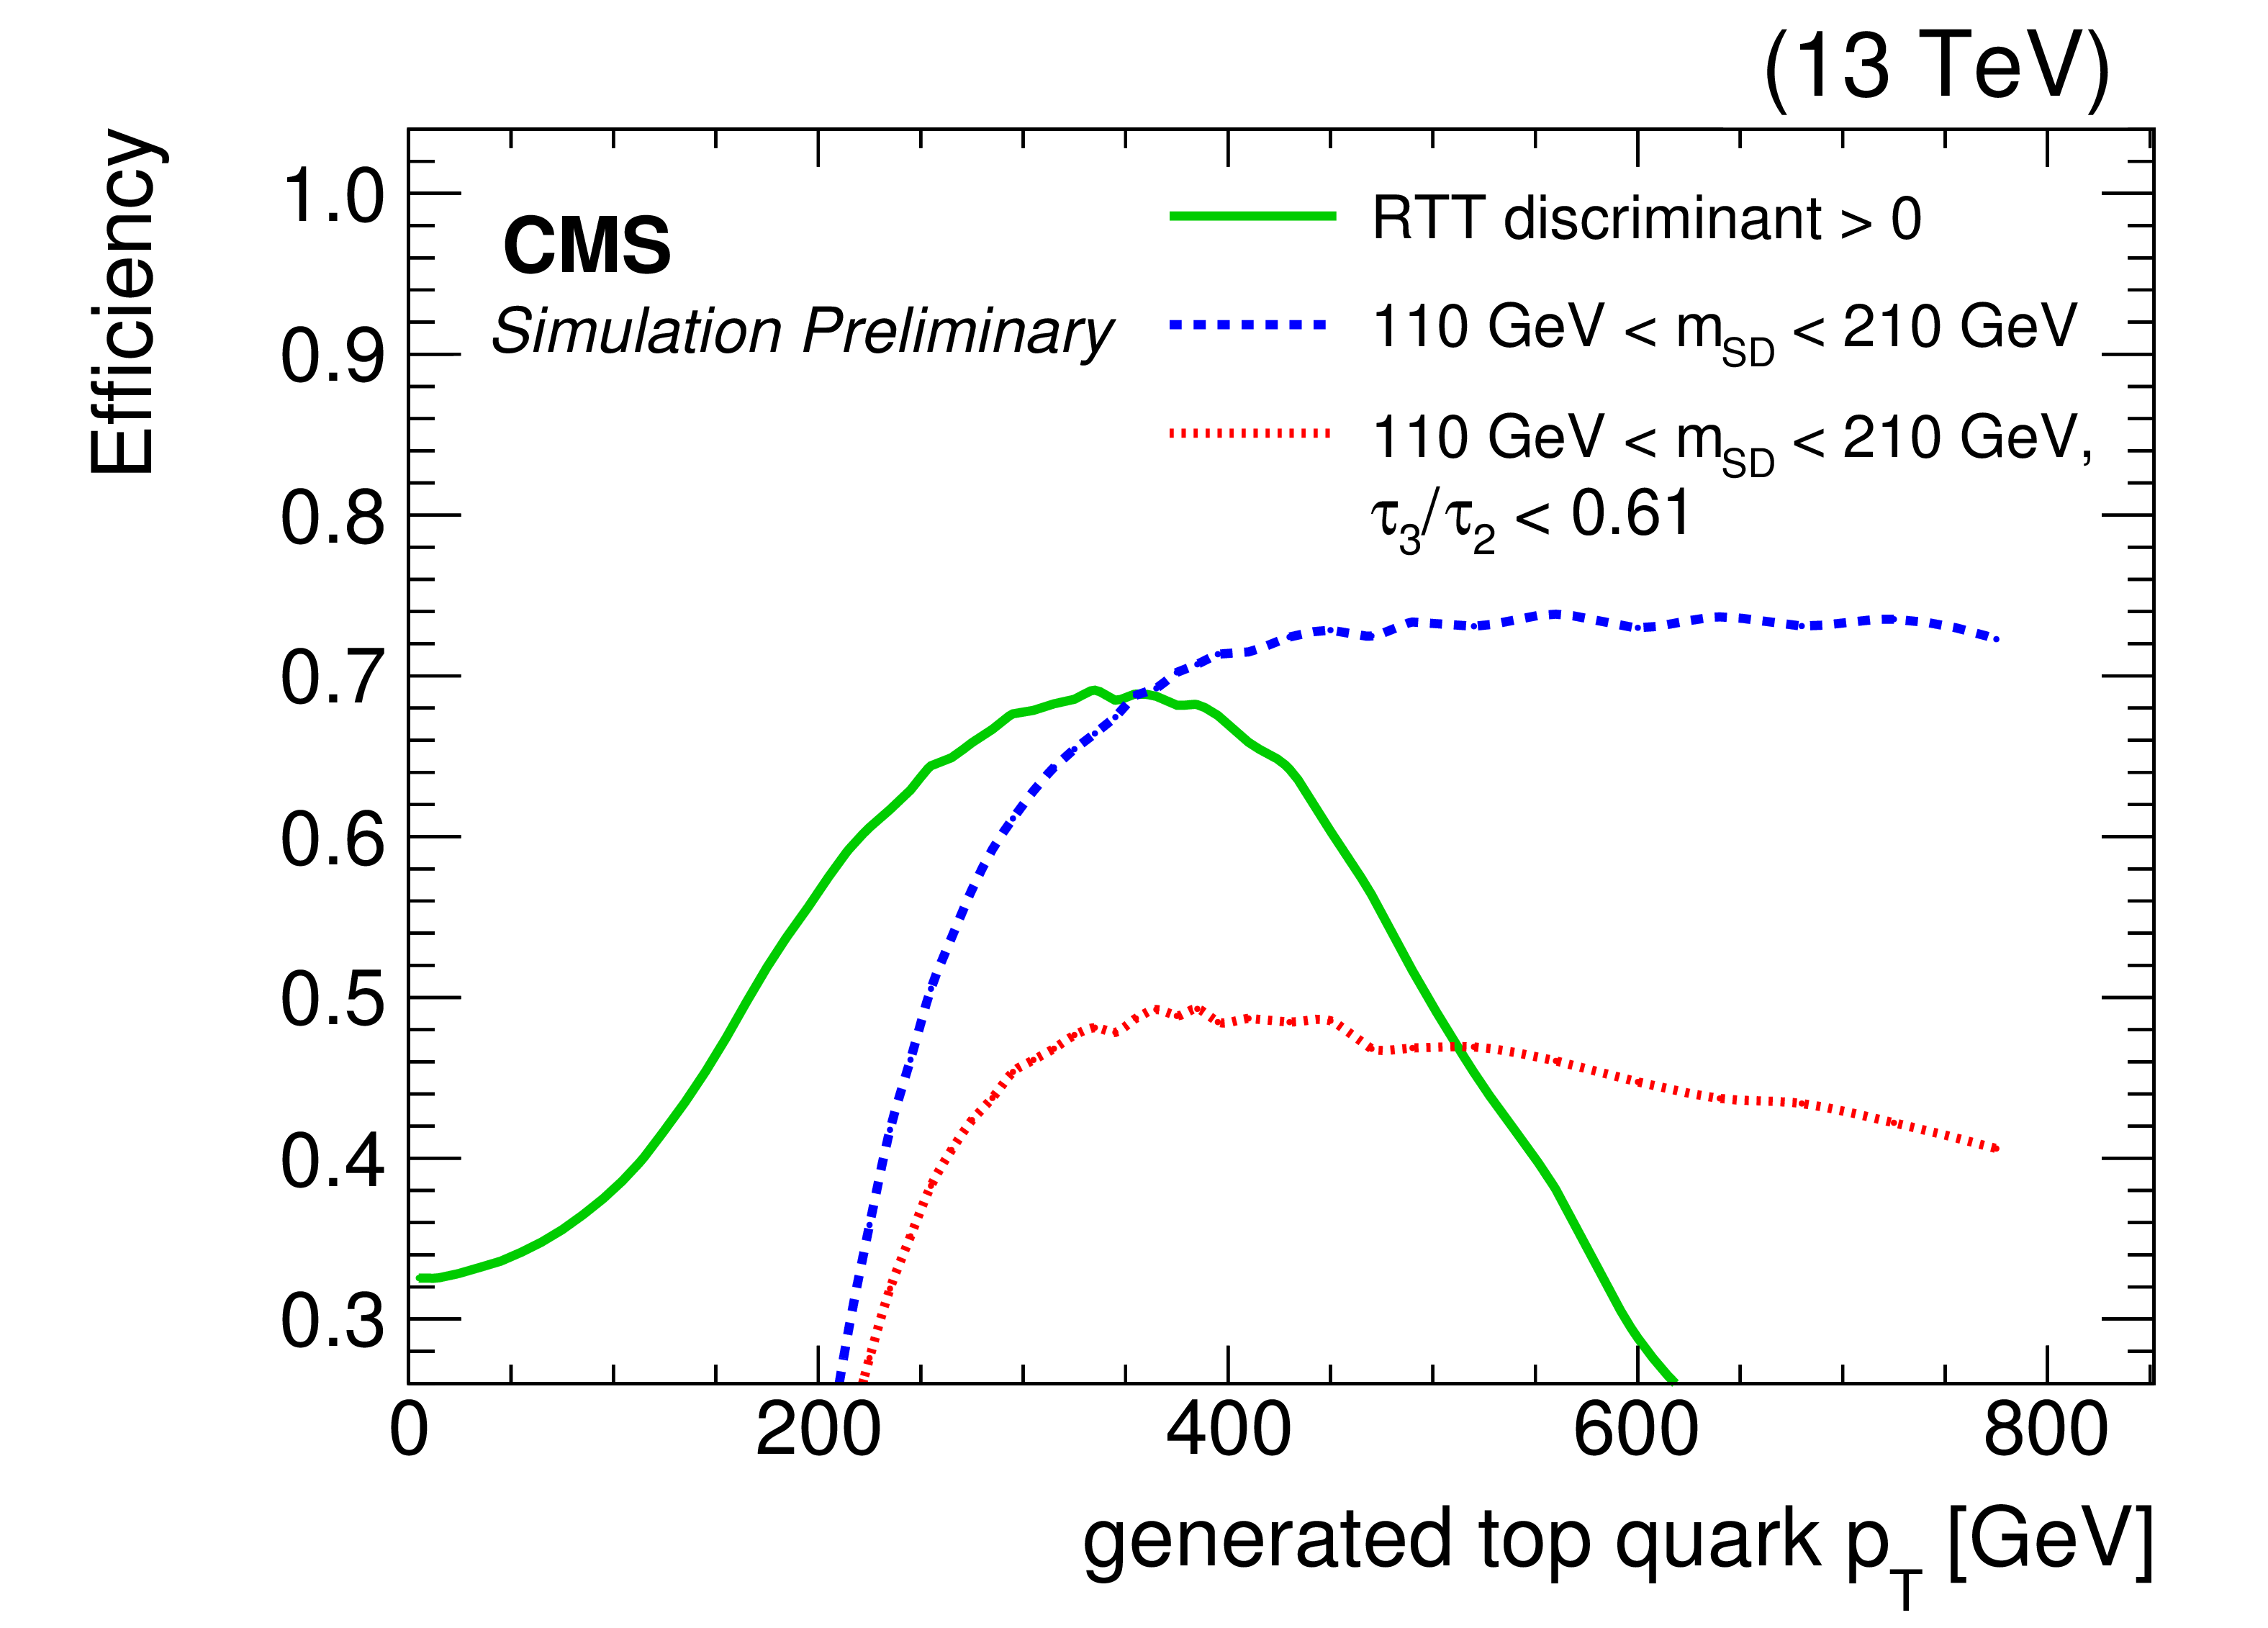
Efficiency in simulation to tag hadronically decaying top quarks as a function of generated top quark $p_{\mathrm{T}}$ for the resolved top tagger discriminant $ > $ 0 (green), for Cambridge Aachen (CA) R=1.5 PUPPI jets with $p_{\mathrm{T}} > $ 180 GeV and soft drop mass 110 GeV - 210 GeV (blue), and for CA R=1.5 PUPPI jets with $p_{\mathrm{T}} > $ 180 GeV and soft drop mass 110 GeV - 210 GeV and N-subjettiness $\tau _3/\tau _2 < $ 0.61. The working points for soft drop mass and N-subjettiness are the ones used in EXO-16-017. For the soft drop algorithm, $\beta =$ 1 and $z_{cut}=$ 0.15 are used. |

png pdf |
Additional Figure 37:
Top quark $p_{\mathrm{T}}$ distributions for a few $ \mathrm{ t \bar{t} } $+DM signal models: 200 GeV Pseudoscalar mediator decaying to 1 GeV fermion pair (moderate mediator), 1000 GeV Pseudoscalar mediator decaying to 150 GeV fermion pair (heavy mediator), and 500 GeV Pseudoscalar mediator decaying to 500 GeV fermion pair (off-shell production). The events have $E_{\mathrm{T}}^{\text{miss}} > $ 200 GeV and at least four jets with $p_{\mathrm{T}}> $ 30 GeV and $|\eta |< $ 4. Distributions are normalised to unit area. |
| References | ||||
| 1 | U. Haisch, F. Kahlhoefer, and J. Unwin | The impact of heavy-quark loops on LHC dark matter searches | JHEP 07 (2013) 125 | 1208.4605 |
| 2 | T. Lin, E. W. K. Kolb, and L.-T. Wang | Probing dark matter couplings to top and bottom at the LHC | PRD 88 (2013) 063510 | |
| 3 | M. R. Buckley, D. Feld, and D. Gon\ifmmode \mbox\cc\else \cc\fialves | Scalar simplified models for dark matter | PRD 91 (Jan, 2015) 015017 | |
| 4 | U. Haisch and E. Re | Simplified dark matter-top quark interactions at the LHC | Technical Report PH-TH-2015-201, CERN | |
| 5 | J. Goodman et al. | Constraints on Dark Matter from Colliders | PRD82 (2010) 116010 | 1008.1783 |
| 6 | M. Beltran et al. | Maverick dark matter at colliders | JHEP 09 (2010) 037 | 1002.4137 |
| 7 | C. Arina et al. | A comprehensive approach to dark matter studies: exploration of simplified top-philic models | 1605.09242 | |
| 8 | CMS Collaboration | Search for the Production of Dark Matter in Association with Top Quark Pairs in the Di-lepton Final State in pp collisions at $ \sqrt{s} $=8~TeV | CMS PAS B2G-13-004, CERN | |
| 9 | CMS Collaboration | Search for the production of dark matter in association with top-quark pairs in the single-lepton final state in proton-proton collisions at $ \sqrt{s} $ = 8~TeV | JHEP 06 (2015) 121 | CMS-B2G-14-004 1504.03198 |
| 10 | G. Busoni et al. | On the Validity of the Effective Field Theory for Dark Matter Searches at the LHC | PLB 728C (2014) 412--421 | |
| 11 | O. Buchmueller, M. J. Dolan, and C. McCabe | Beyond Effective Field Theory for Dark Matter Searches at the LHC | JHEP 1401 (2014) 025 | 1308.6799 |
| 12 | D. Abercrombie et al. | Dark Matter Benchmark Models for Early LHC Run-2 Searches: Report of the ATLAS/CMS Dark Matter Forum | 1507.00966 | |
| 13 | CMS Collaboration | The CMS experiment at the CERN LHC | JINST 3 (2008) S08004 | |
| 14 | CMS Collaboration | Particle-Flow Event Reconstruction in CMS and Performance for Jets, Taus, and MET | Technical Report CMS-PAS-PFT-09-001, CERN, 2009. Geneva, Apr | |
| 15 | M. Cacciari, G. P. Salam, and G. Soyez | The Anti-k(t) jet clustering algorithm | JHEP 04 (2008) 063 | 0802.1189 |
| 16 | M. Cacciari, G. P. Salam, and G. Soyez | The Catchment Area of Jets | JHEP 04 (2008) 005 | 0802.1188 |
| 17 | CMS Collaboration | Determination of jet energy calibration and transverse momentum resolution in CMS | Journal of Instrumentation 6 (November, 2011) 11002 | CMS-JME-10-011 1107.4277 |
| 18 | CMS Collaboration | Identification of b quark jets at the CMS Experiment in the LHC Run 2 | CMS-PAS-BTV-15-001 | CMS-PAS-BTV-15-001 |
| 19 | C. Oleari | The POWHEG BOX | Nuclear Physics B Proceedings Supplements 205 (August, 2010) 36--41 | 1007.3893 |
| 20 | T. Sj\"ostrand, S. Mrenna, and P. Skands | PYTHIA 6.4 physics and manual | JHEP 05 (2006) 026 | hep-ph/0603175 |
| 21 | J. Alwall et al. | The automated computation of tree-level and next-to-leading order differential cross sections, and their matching to parton shower simulations | JHEP 07 (2014) 079 | 1405.0301 |
| 22 | M. L. Mangano, M. Moretti, F. Piccinini, and M. Treccani | Matching matrix elements and shower evolution for top-quark production in hadronic collisions | JHEP 0701 (2007) 013 | hep-ph/0611129 |
| 23 | R. Frederix and S. Frixione | Merging meets matching in MC@NLO | JHEP 12 (2012) 061 | 1209.6215 |
| 24 | P. Harris, V. V. Khoze, M. Spannowsky, and C. Williams | Constraining dark sectors at colliders: Beyond the effective theory approach | PRD 91 (Mar, 2015) 055009 | |
| 25 | NNPDF Collaboration | Parton distributions for the LHC Run II | JHEP 04 (2015) 040 | 1410.8849 |
| 26 | S. Agostinelli, J. Allison, K. Amako et al. | Geant4 - a simulation toolkit | Nuclear Instruments and Methods in Physics Research Section A: Accelerators, Spectrometers, Detectors and Associated Equipment 506 (2003), no. 3, 250 -- 303 | |
| 27 | CMS Collaboration | Description and performance of track and primary-vertex reconstruction with the CMS tracker | JINST 9 (2014), no. 10, P10009 | CMS-TRK-11-001 1405.6569 |
| 28 | Y. Bai et al. | Stop the Top Background of the Stop Search | JHEP 1207 (2012) 110 | 1203.4813 |
| 29 | CMS Collaboration | V Tagging Observables and Correlations | ||
| 30 | J. D'Hondt et al. | Fitting of Event Topologies with External Kinematic Constraints in CMS | CMS-NOTE-2006-023 | |
| 31 | A. Hoecker et al. | TMVA: Toolkit for Multivariate Data Analysis | PoS ACAT (2007) 040 | physics/0703039 |
| 32 | M. Bahr et al. | Herwig++ Physics and Manual | EPJC58 (2008) 639--707 | 0803.0883 |
| 33 | J. S. Conway | Nuisance Parameters in Likelihoods for Multisource Spectra | Proceedings of PHYSTAT 2011 Workshop on Statistical Issues Related to Discovery Claims in Search Experiments and Unfolding, CERN, Geneva, Switzerland, 17-20 January 2011, edited by H.B. Propser and L. Lyons CERN-2011-006 115 | |
| 34 | CMS Collaboration | CMS Luminosity Measurement for the 2015 Data Taking Period | CMS-PAS-LUM-15-001 | CMS-PAS-LUM-15-001 |
| 35 | J. Butterworth et al. | PDF4LHC recommendations for LHC Run II | JPG43 (2016) 023001 | 1510.03865 |
| 36 | CMS Collaboration | Differential cross section measurements for the production of a W boson in association with jets in proton–proton collisions at $ \sqrt{s}=7 $ TeV | PLB741 (2015) 12--37 | CMS-SMP-12-023 1406.7533 |
| 37 | CMS Collaboration | Measurement of the production cross section for a W boson and two b jets in pp collisions at $ \sqrt{s} $ = 7 TeV | Physics Letters B 735 (2014) 204 -- 225 | |
| 38 | CMS Collaboration | Measurements of jet multiplicity and differential production cross sections of $ Z + $ jets events in proton-proton collisions at $ \sqrt{s} = $ 7 TeV | PRD91 (2015), no. 5, 052008 | CMS-SMP-12-017 1408.3104 |
| 39 | CMS Collaboration | Measurement of the production cross sections for a Z boson and one or more b jets in pp collisions at $ \sqrt{s} $ = 7 TeV | Journal of High Energy Physics 2014 (2014), no. 6, 1--39 | |
| 40 | CMS Collaboration | Measurement of differential top-quark-pair production cross sections in pp collisions at $ \sqrt{s} $ = 7 TeV | The European Physical Journal C 73 (2013), no. 3, 1--29 | |
| 41 | CMS Collaboration | Measurement of differential top-quark pair production cross sections in the lepton+jets channel in pp collisions at 8 TeV | CDS | |
| 42 | CMS Collaboration | Measurement of the differential ttbar cross section in the dilepton channel at 8 TeV | CMS-PAS-TOP-12-028 | CMS-PAS-TOP-12-028 |
| 43 | K. Hahn | Scalar and Pseudoscalar $ t\bar{t}\rm + DM $ Madgraph model files | technical report | |
| 44 | J. Abdallah et al. | Simplified Models for Dark Matter and Missing Energy Searches at the LHC | 1409.2893 | |
| 45 | S. A. Malik et al. | Interplay and Characterization of Dark Matter Searches at Colliders and in Direct Detection Experiments | Phys. Dark Univ. 9-10 (2015) 51--58 | 1409.4075 |
| 46 | O. Buchmueller, M. J. Dolan, S. A. Malik, and C. McCabe | Characterising dark matter searches at colliders and direct detection experiments: Vector mediators | JHEP 01 (2015) 037 | 1407.8257 |
| 47 | The ATLAS Collaboration, The CMS Collaboration, The LHC Higgs Combination Group Collaboration | Procedure for the LHC Higgs boson search combination in Summer 2011 | CMS-NOTE-2011-005 | |
| 48 | A. L. Read | Presentation of search results: the CLs technique | Journal of Physics G: Nuclear and Particle Physics 28 (2002), no. 10 | |
|
|
Compact Muon Solenoid LHC, CERN |
|

|

|

|

|

|