

Compact Muon Solenoid
LHC, CERN
| CMS-PAS-EXO-16-040 | ||
| Search for new physics in a boosted hadronic monotop final state using 12.9 fb$^{-1}$ of $ \sqrt{s} = $ 13 TeV data | ||
| CMS Collaboration | ||
| August 2016 | ||
| Abstract: A search for dark matter is conducted in events with large missing transverse energy and a hadronically decaying, boosted top quark. This study is performed using proton-proton collision data collected by the CMS detector, corresponding to an integrated luminosity of 12.9 fb$^{-1}$. No significant deviations from standard model predictions are observed, and limits are placed on the production of new heavy bosons coupling to dark matter particles. | ||
| Links: CDS record (PDF) ; inSPIRE record ; CADI line (restricted) ; | ||
| Figures | |
png pdf |
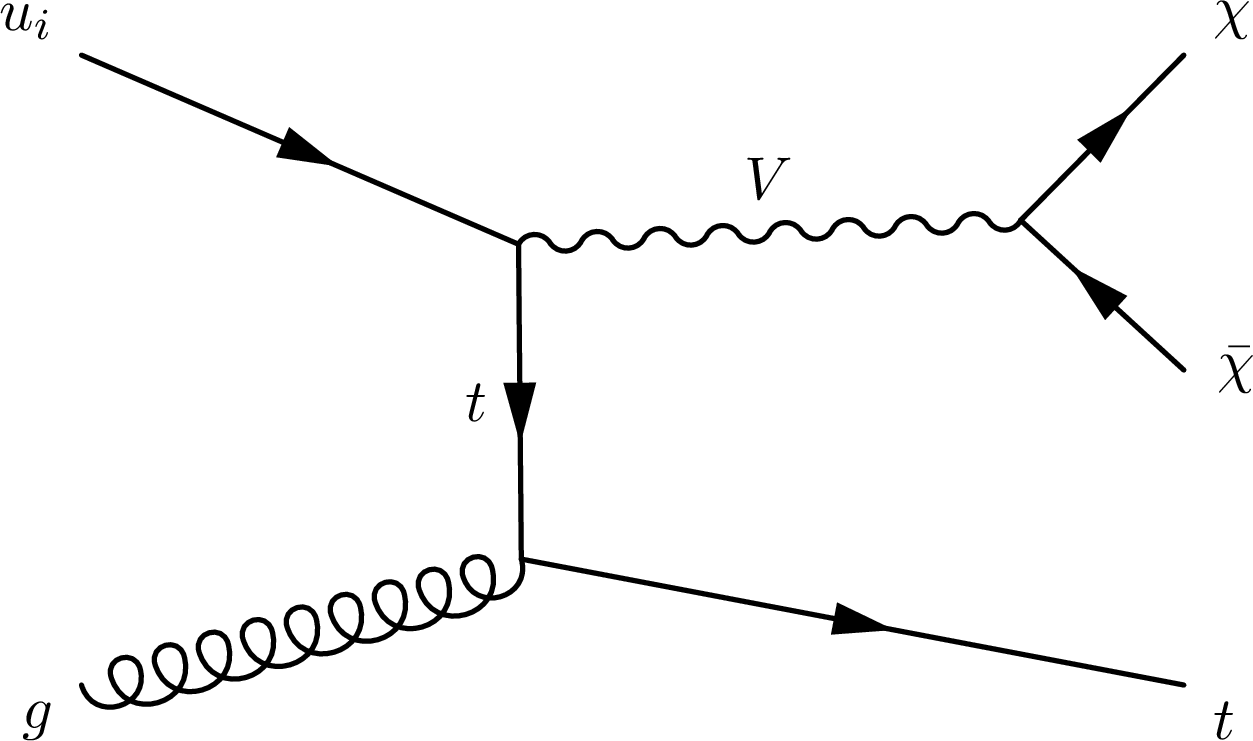
Figure 1-a:
Example of monotop production via a neutral flavor-changing current (a) and a heavy scalar (b). |
png pdf |
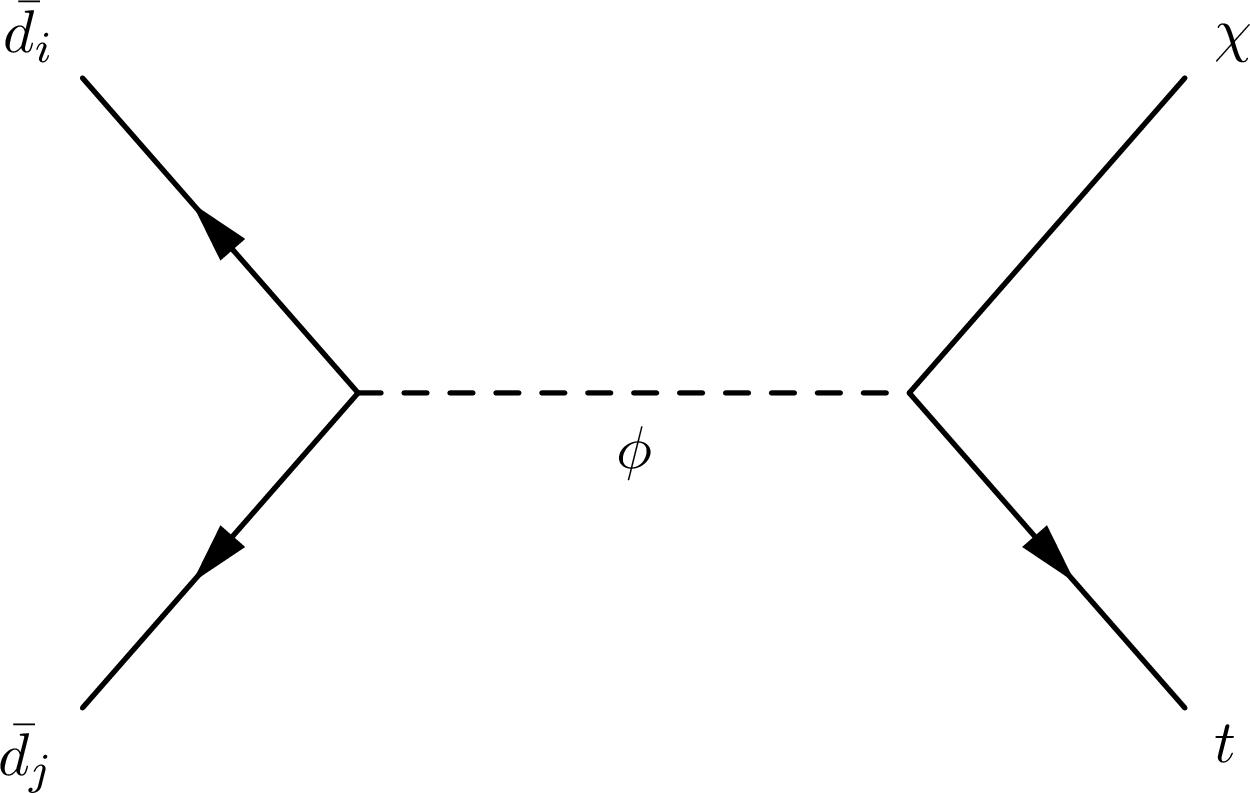
Figure 1-b:
Example of monotop production via a neutral flavor-changing current (a) and a heavy scalar (b). |
png pdf |
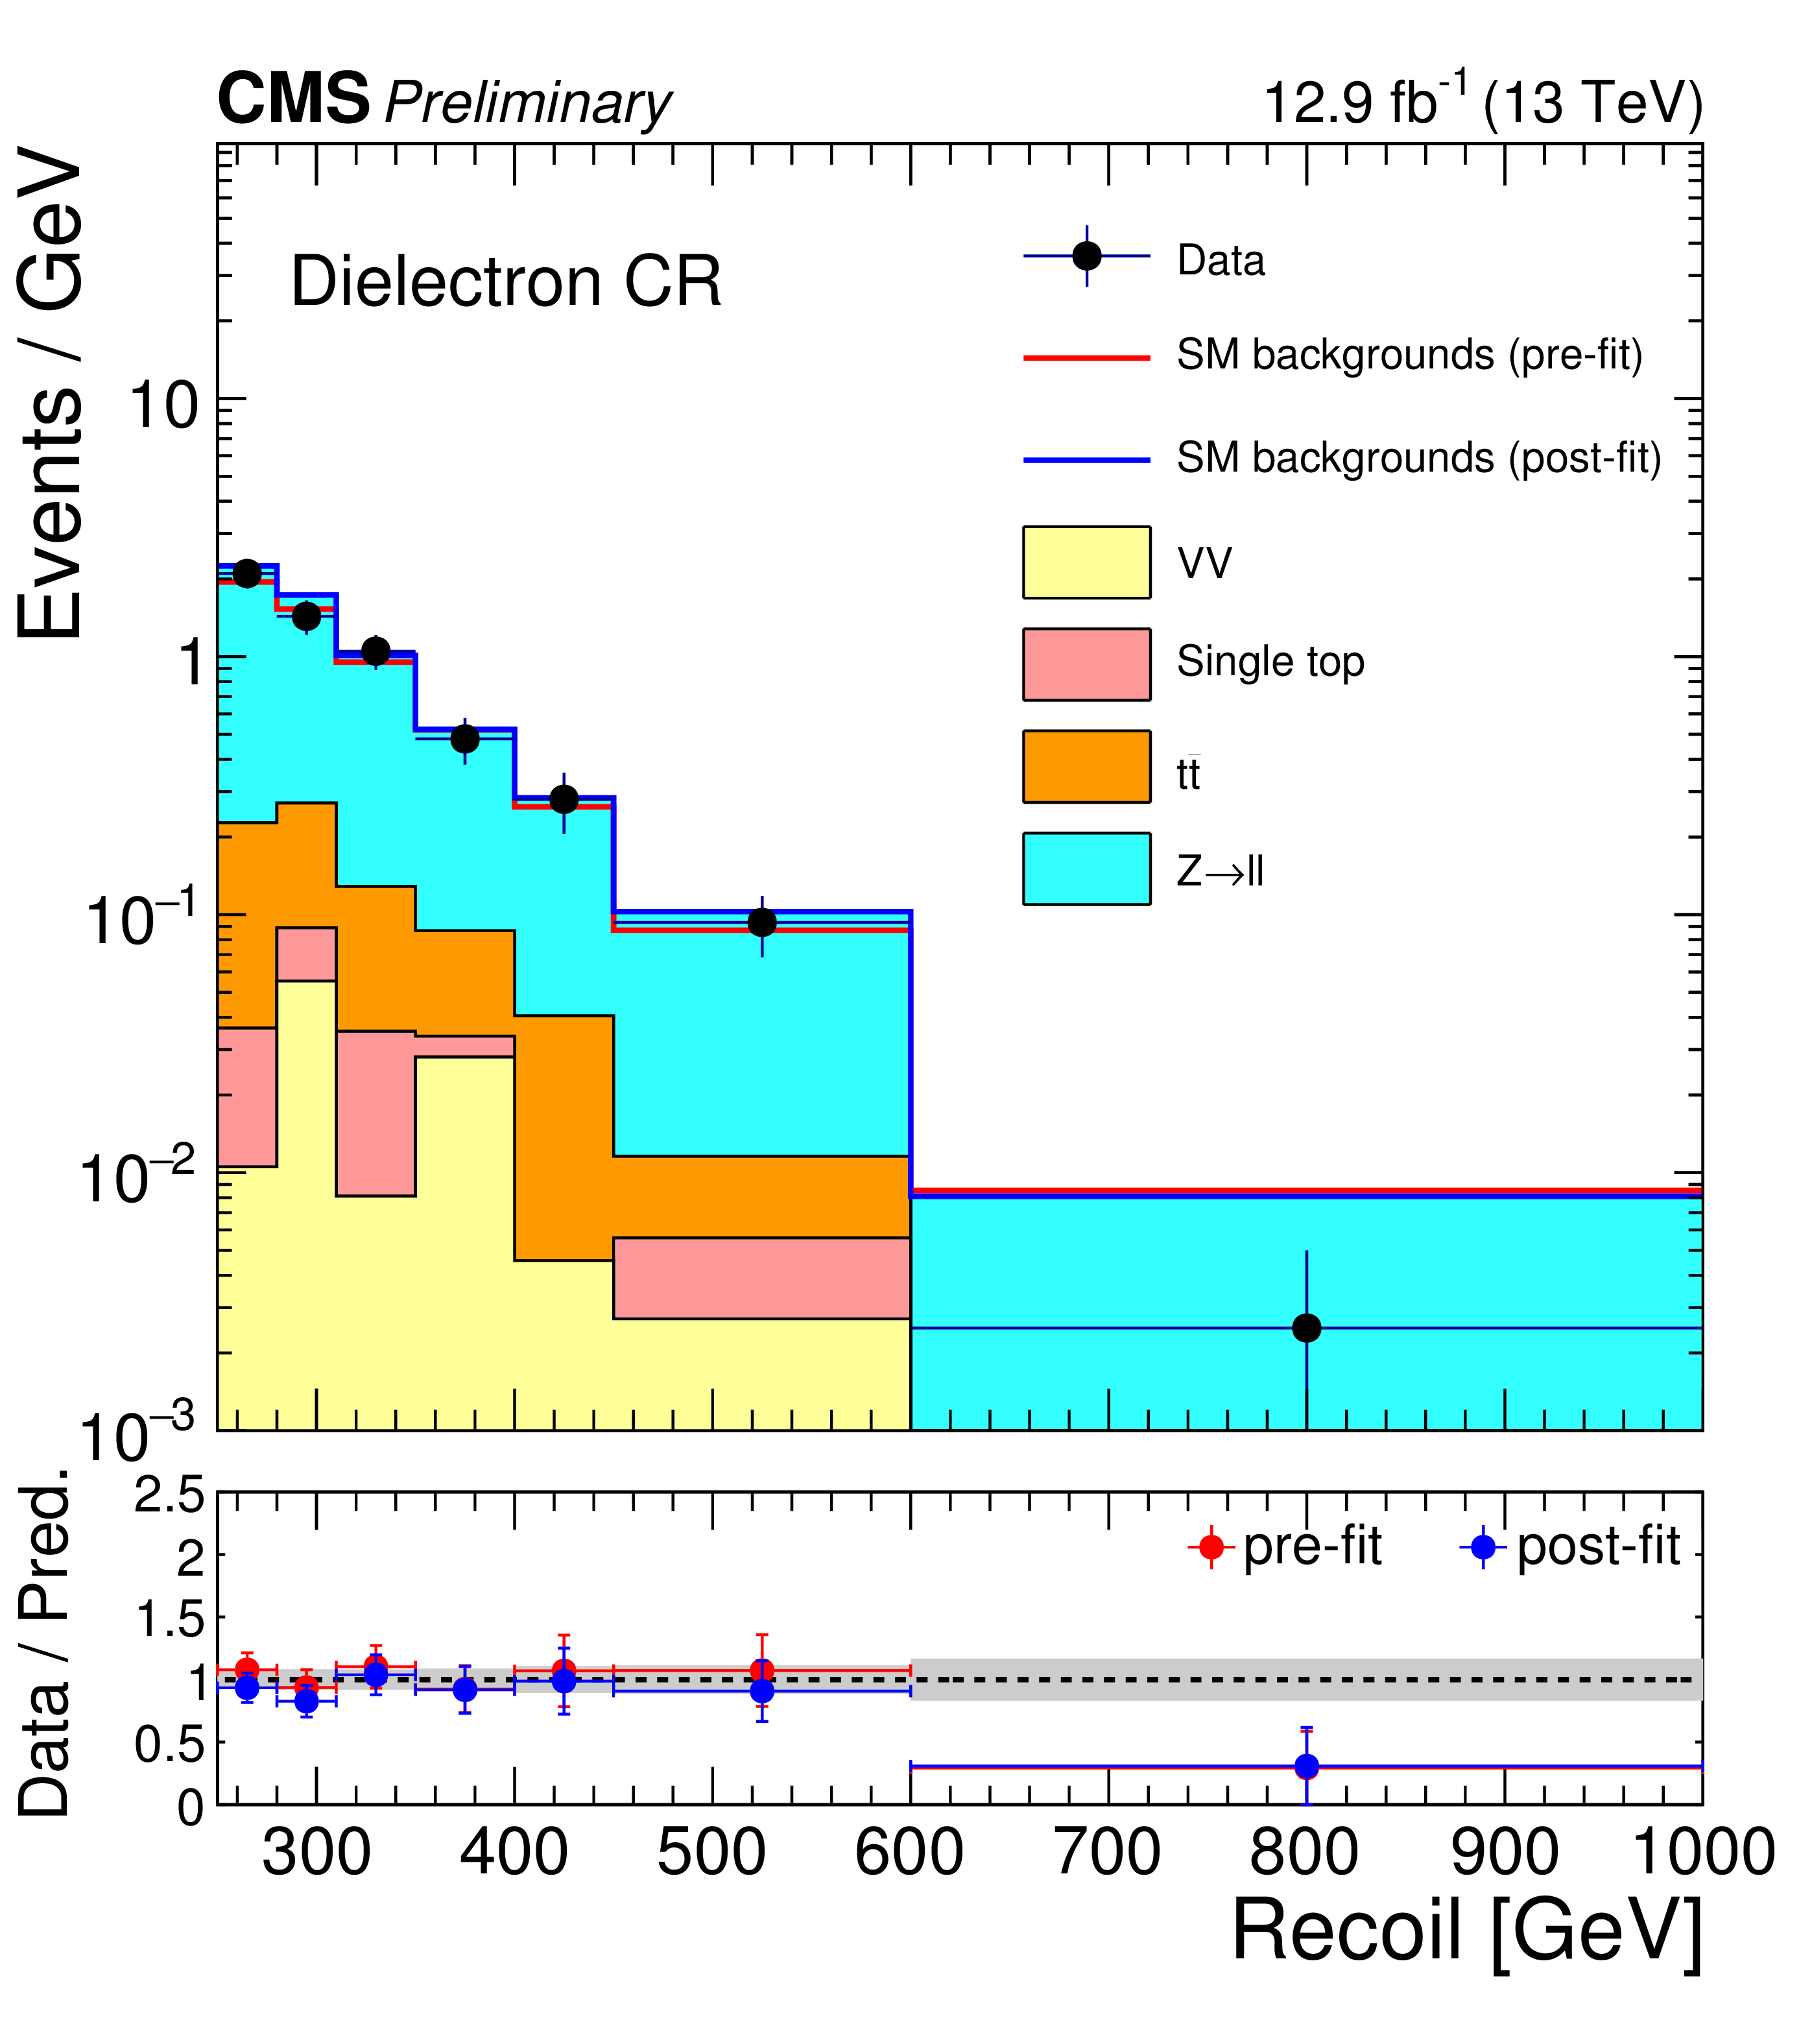
Figure 2-a:
Comparison between data and Monte Carlo simulation in the control regions before and after performing the simultaneous fit to the different control regions and signal region. Plot (a) corresponds to the dielectron control region, and plot (b) corresponds to the dimuon control region. Plot (c) corresponds to the photon control region. The blue solid line represents the sum of the SM background contributions normalized to the post-fit yield. The red solid line represents the sum of the SM background contributions normalized to the theoretical prediction. The stacked histograms show the individual SM background distributions after the fit is performed. The gray band indicates the post-fit uncertainty after propagating all the systematic uncertainties in the fit. |
png pdf |
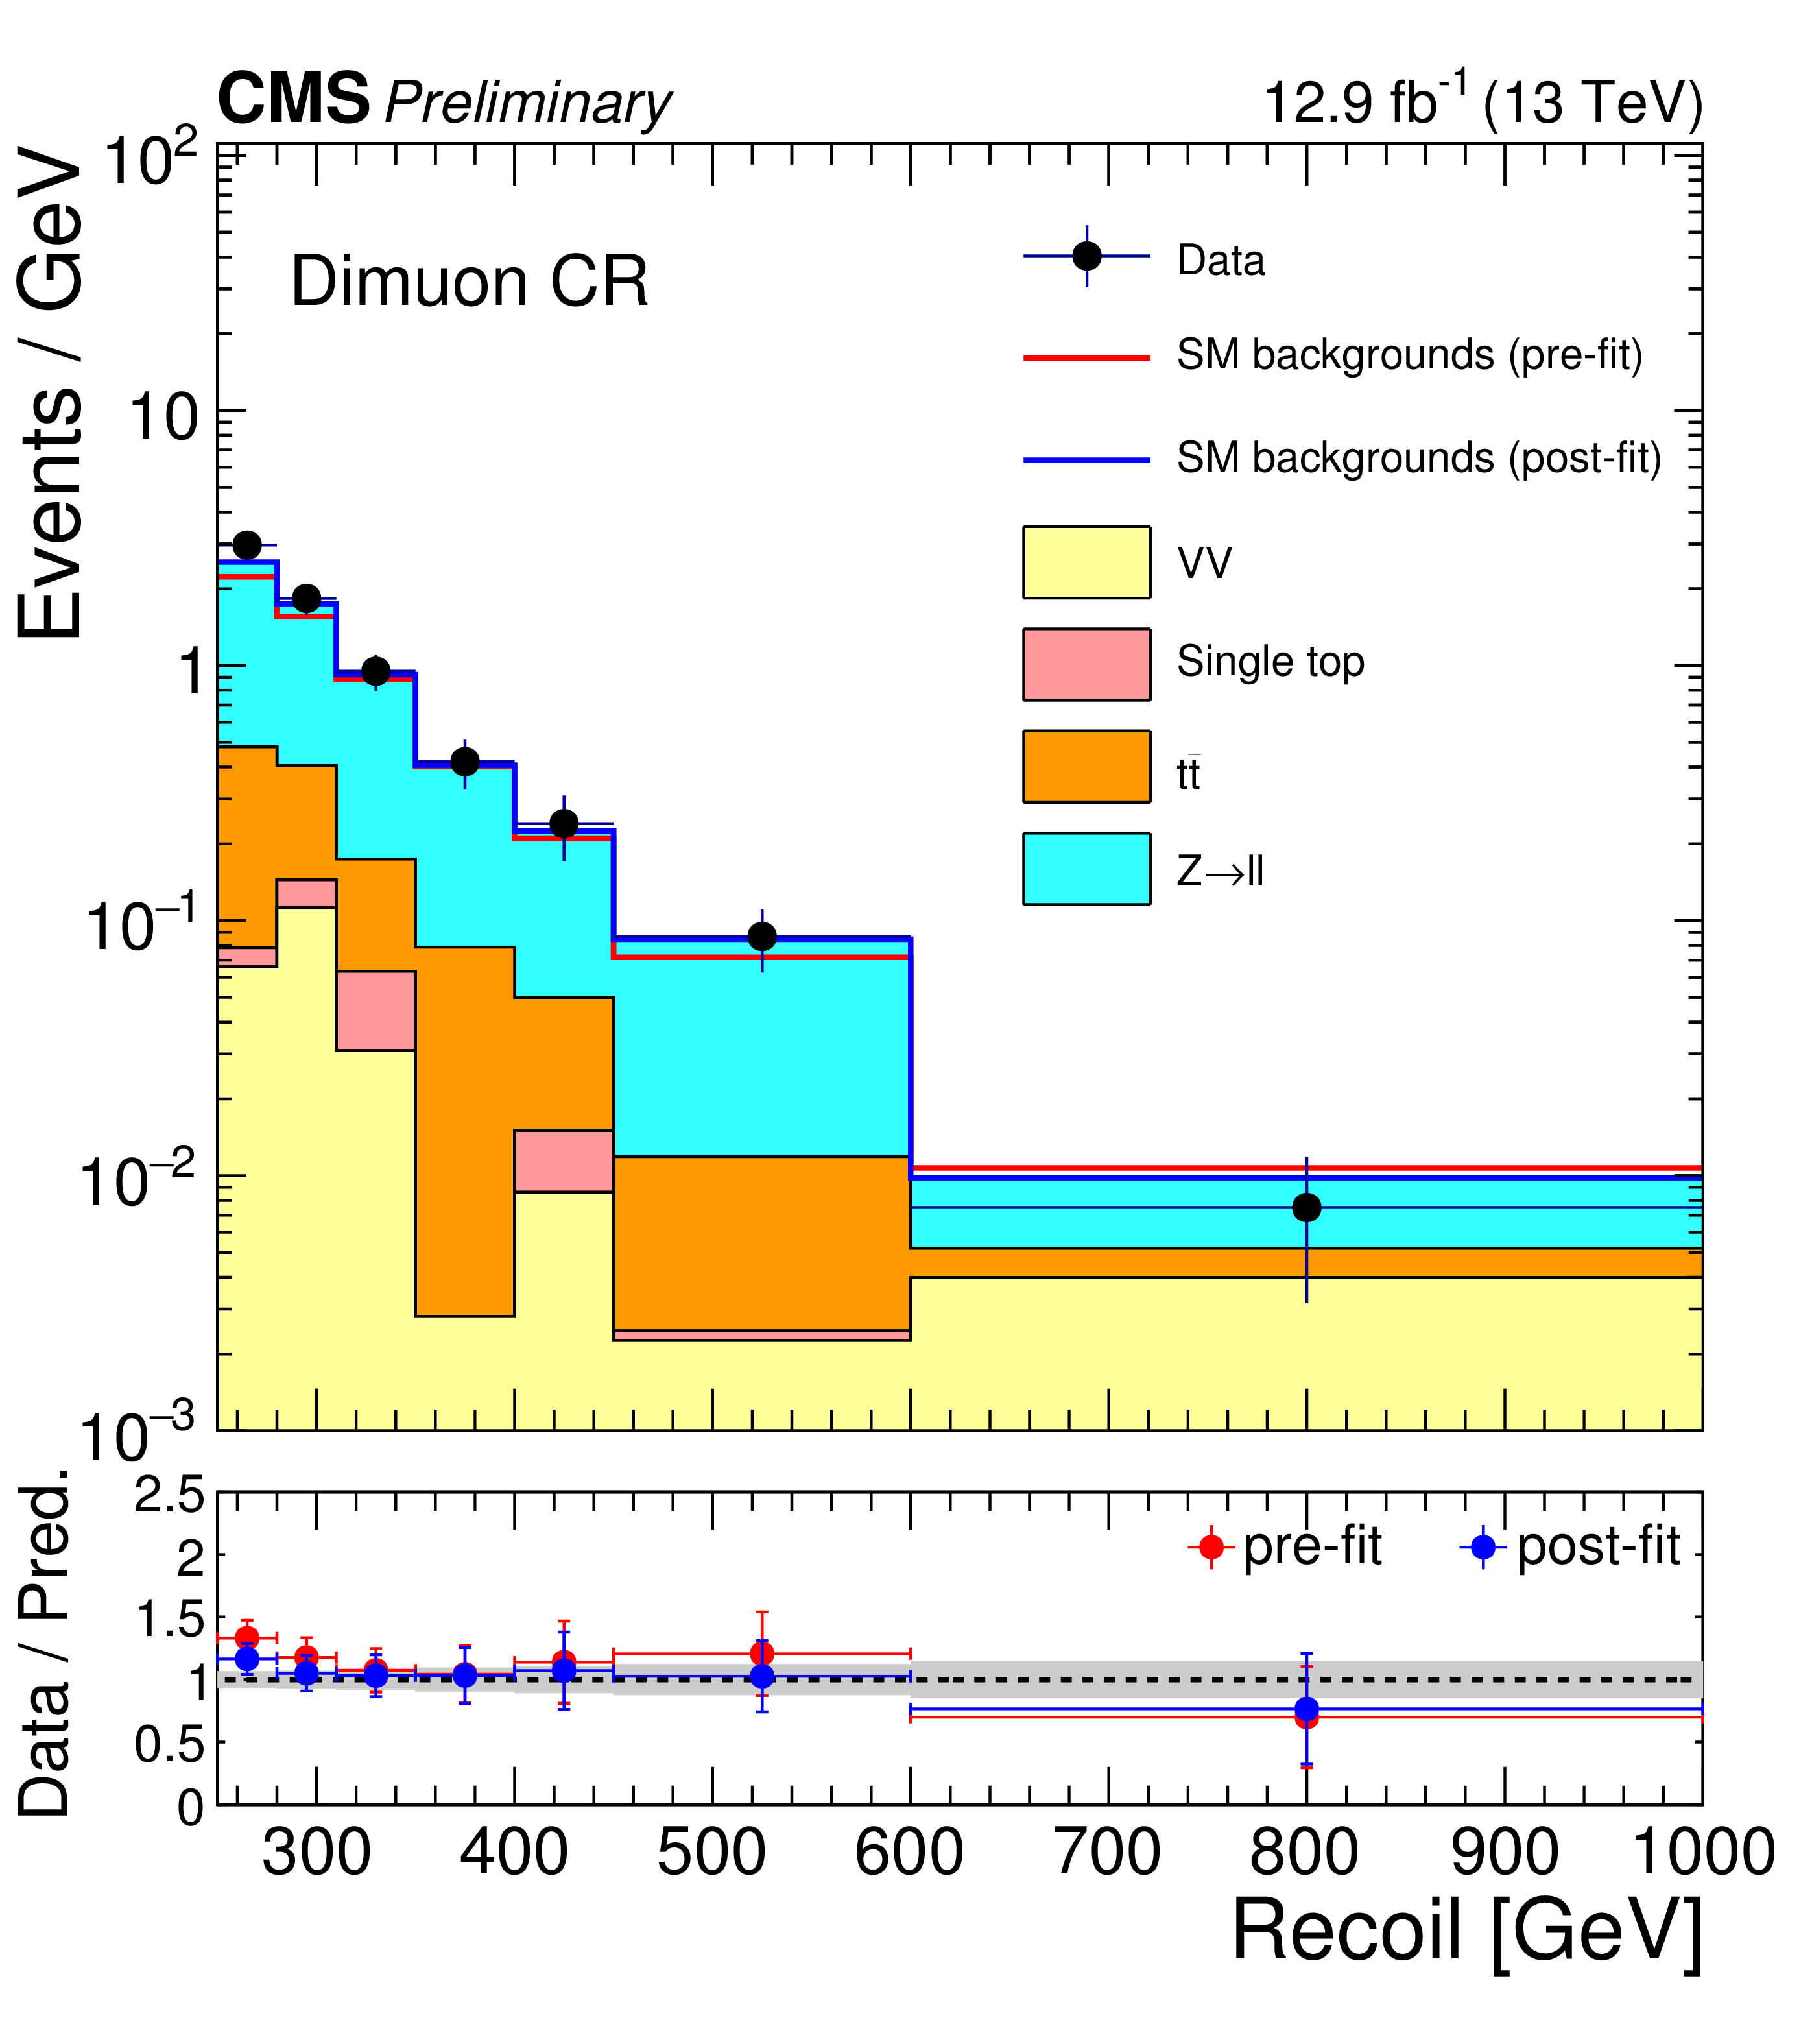
Figure 2-b:
Comparison between data and Monte Carlo simulation in the control regions before and after performing the simultaneous fit to the different control regions and signal region. Plot (a) corresponds to the dielectron control region, and plot (b) corresponds to the dimuon control region. Plot (c) corresponds to the photon control region. The blue solid line represents the sum of the SM background contributions normalized to the post-fit yield. The red solid line represents the sum of the SM background contributions normalized to the theoretical prediction. The stacked histograms show the individual SM background distributions after the fit is performed. The gray band indicates the post-fit uncertainty after propagating all the systematic uncertainties in the fit. |
png pdf |
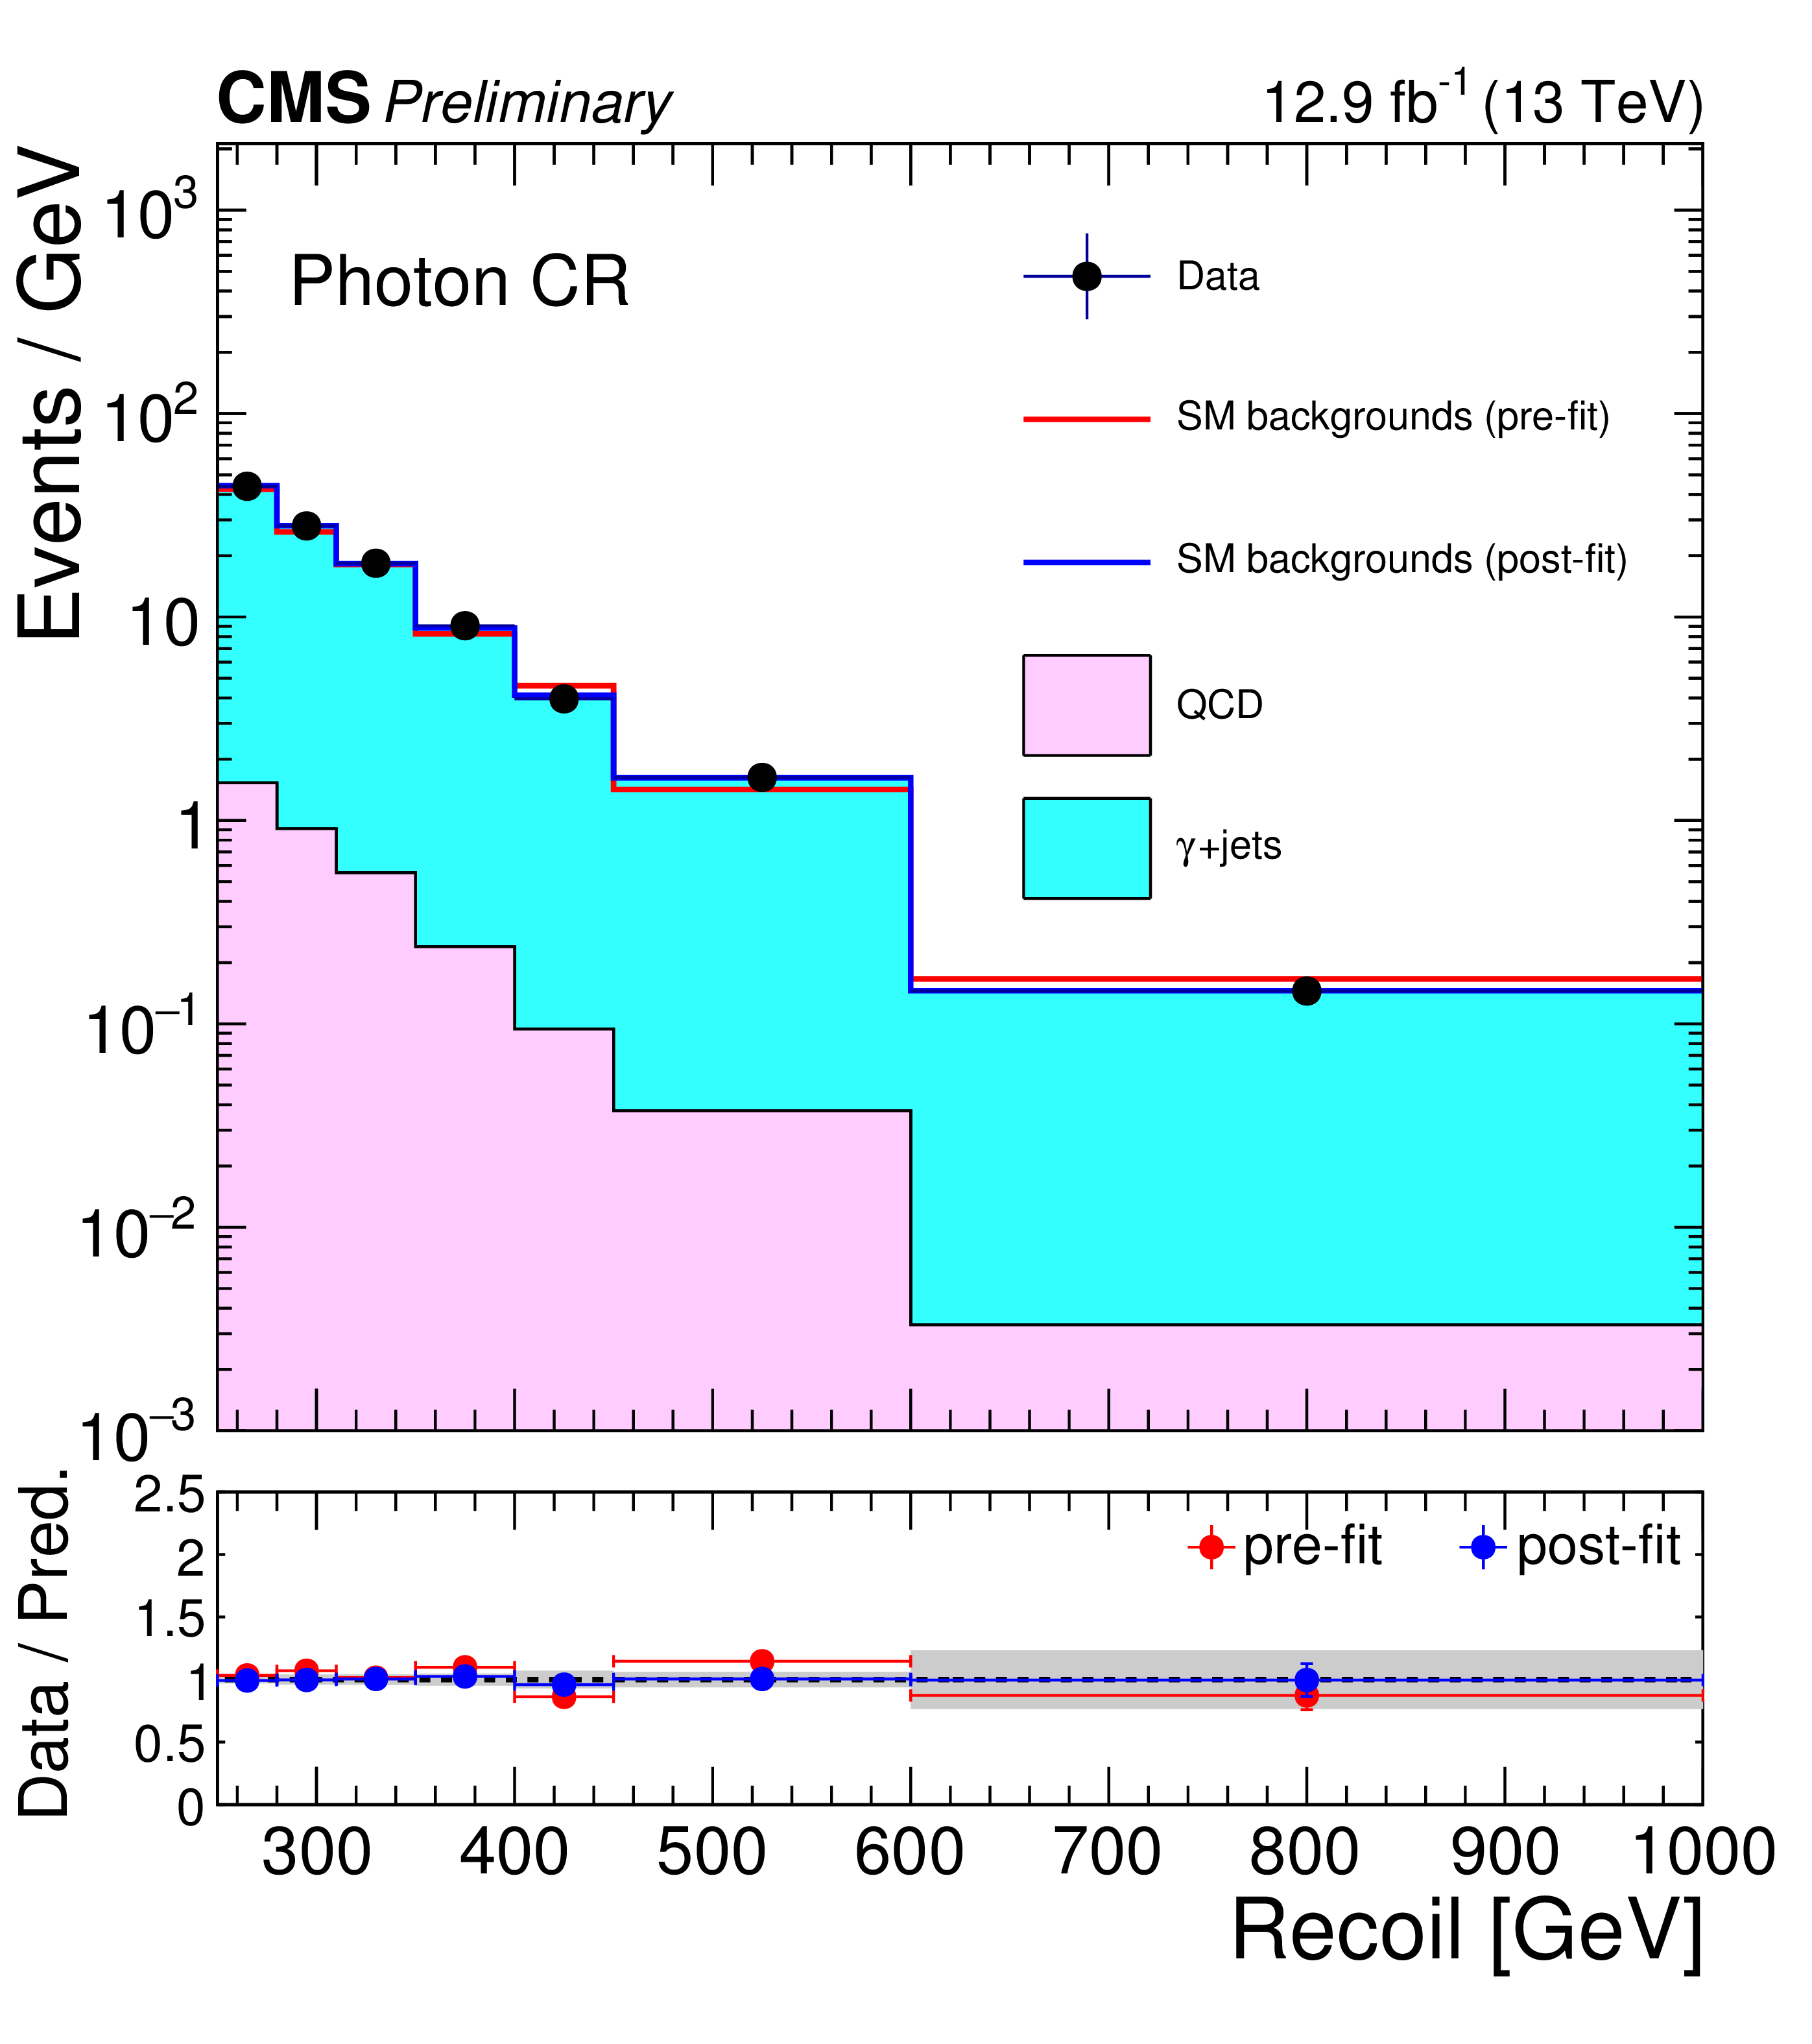
Figure 2-c:
Comparison between data and Monte Carlo simulation in the control regions before and after performing the simultaneous fit to the different control regions and signal region. Plot (a) corresponds to the dielectron control region, and plot (b) corresponds to the dimuon control region. Plot (c) corresponds to the photon control region. The blue solid line represents the sum of the SM background contributions normalized to the post-fit yield. The red solid line represents the sum of the SM background contributions normalized to the theoretical prediction. The stacked histograms show the individual SM background distributions after the fit is performed. The gray band indicates the post-fit uncertainty after propagating all the systematic uncertainties in the fit. |
png pdf |
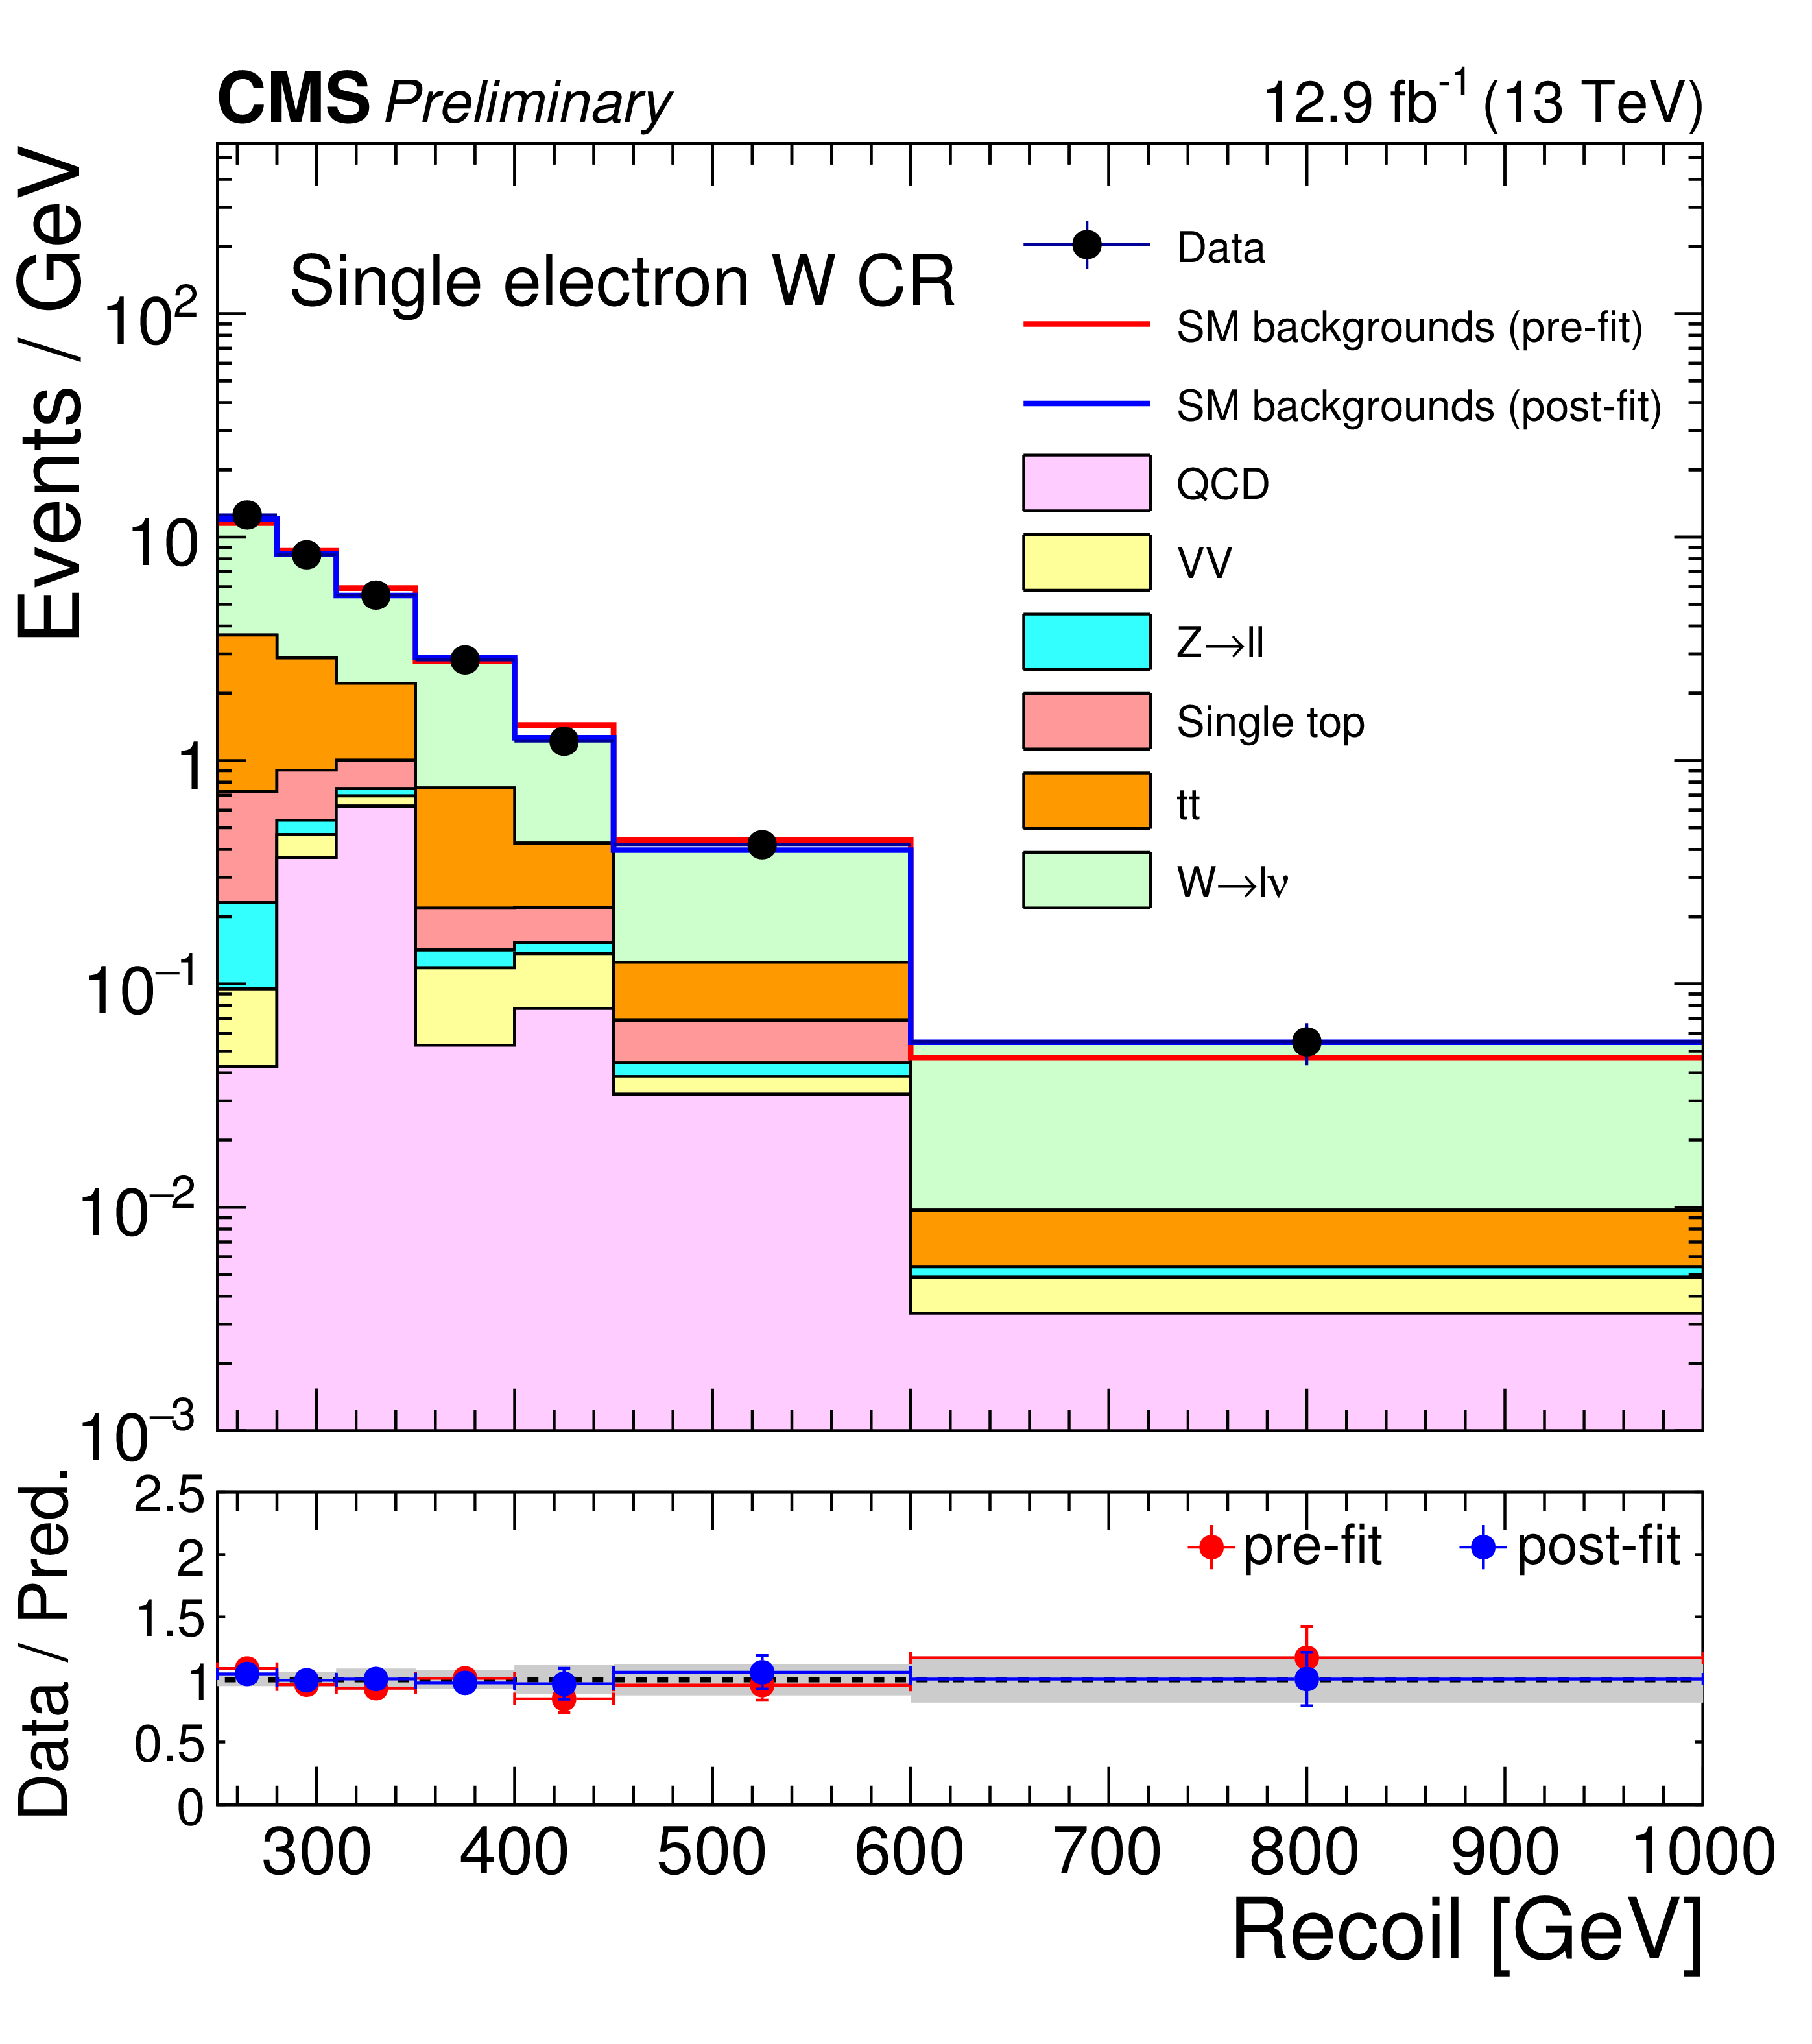
Figure 3-a:
Comparison between data and Monte Carlo simulation in the control regions before and after performing the simultaneous fit to the different control regions and signal region. Plot (a) corresponds to the single electron anti-$b$-tagged control region and plot (b) corresponds to the single muon anti-$b$-tagged control region. The blue solid line represents the sum of the SM background contributions normalized to the post-fit yield. The red solid line represents the sum of the SM background contributions normalized to the theoretical prediction. The stacked histograms show the individual SM background distributions after the fit is performed. The gray band represents the post-fit uncertainty propagating all systematic uncertainties through. |
png pdf |
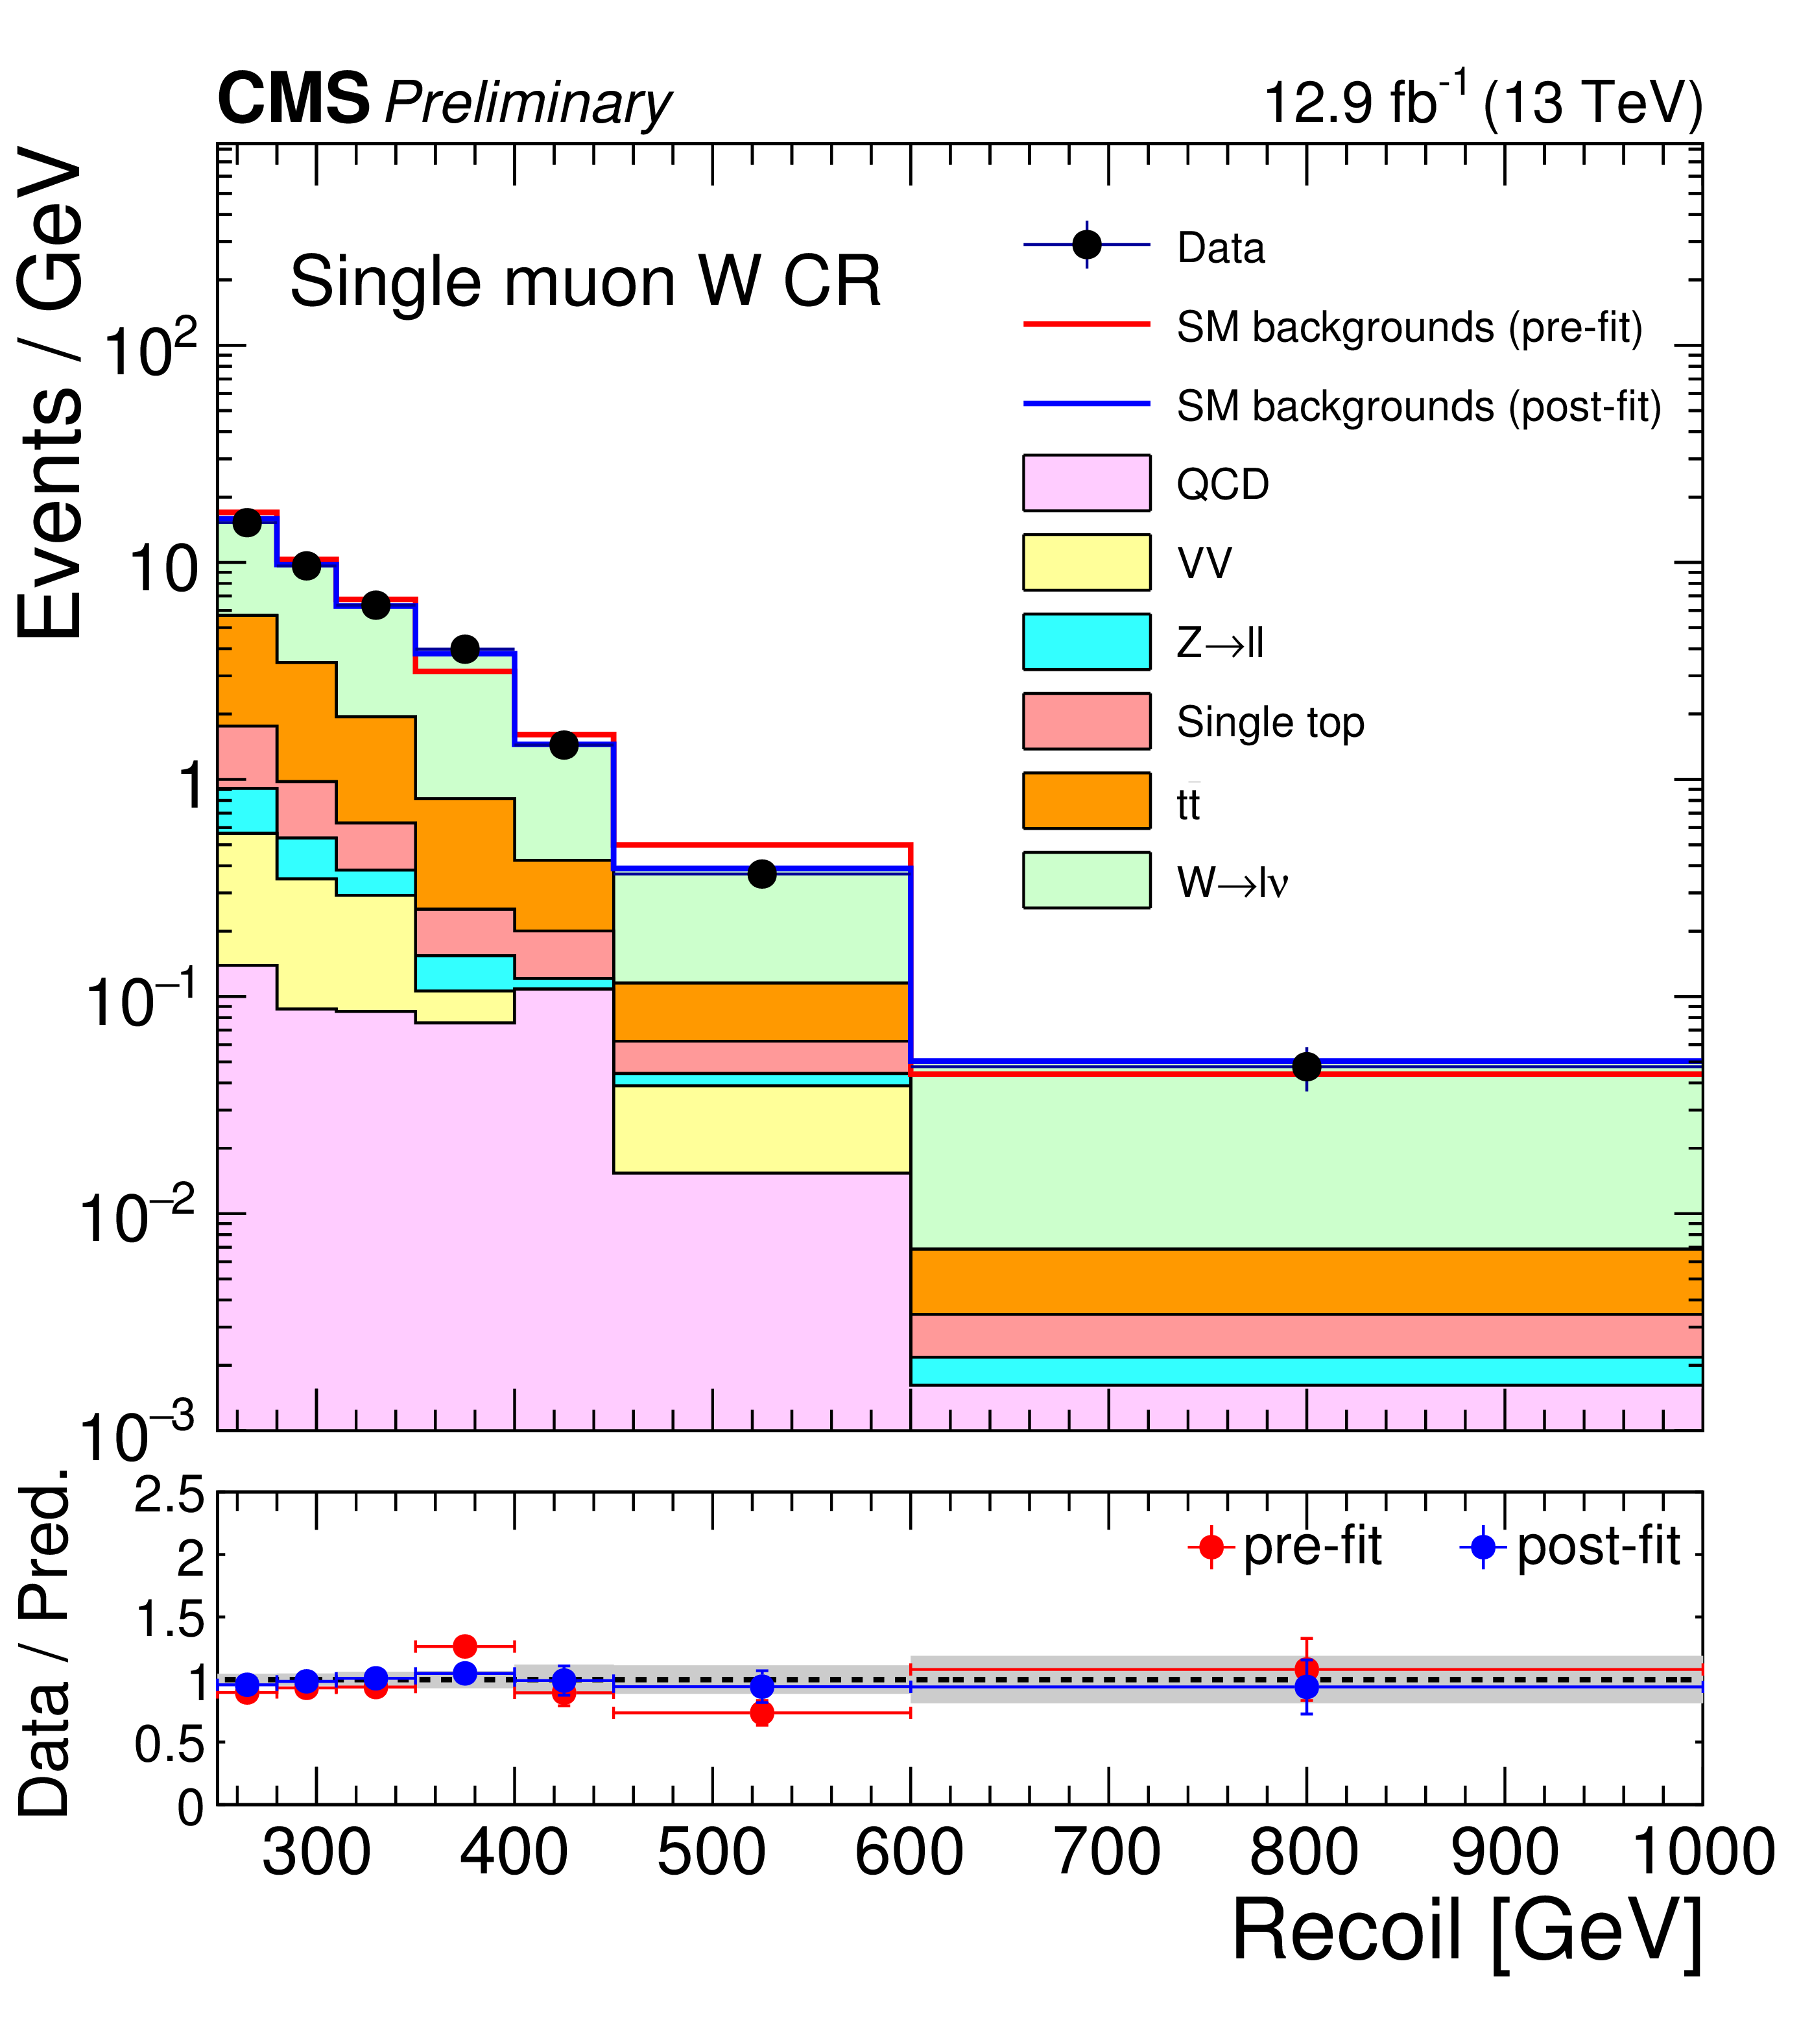
Figure 3-b:
Comparison between data and Monte Carlo simulation in the control regions before and after performing the simultaneous fit to the different control regions and signal region. Plot (a) corresponds to the single electron anti-$b$-tagged control region and plot (b) corresponds to the single muon anti-$b$-tagged control region. The blue solid line represents the sum of the SM background contributions normalized to the post-fit yield. The red solid line represents the sum of the SM background contributions normalized to the theoretical prediction. The stacked histograms show the individual SM background distributions after the fit is performed. The gray band represents the post-fit uncertainty propagating all systematic uncertainties through. |
png pdf |
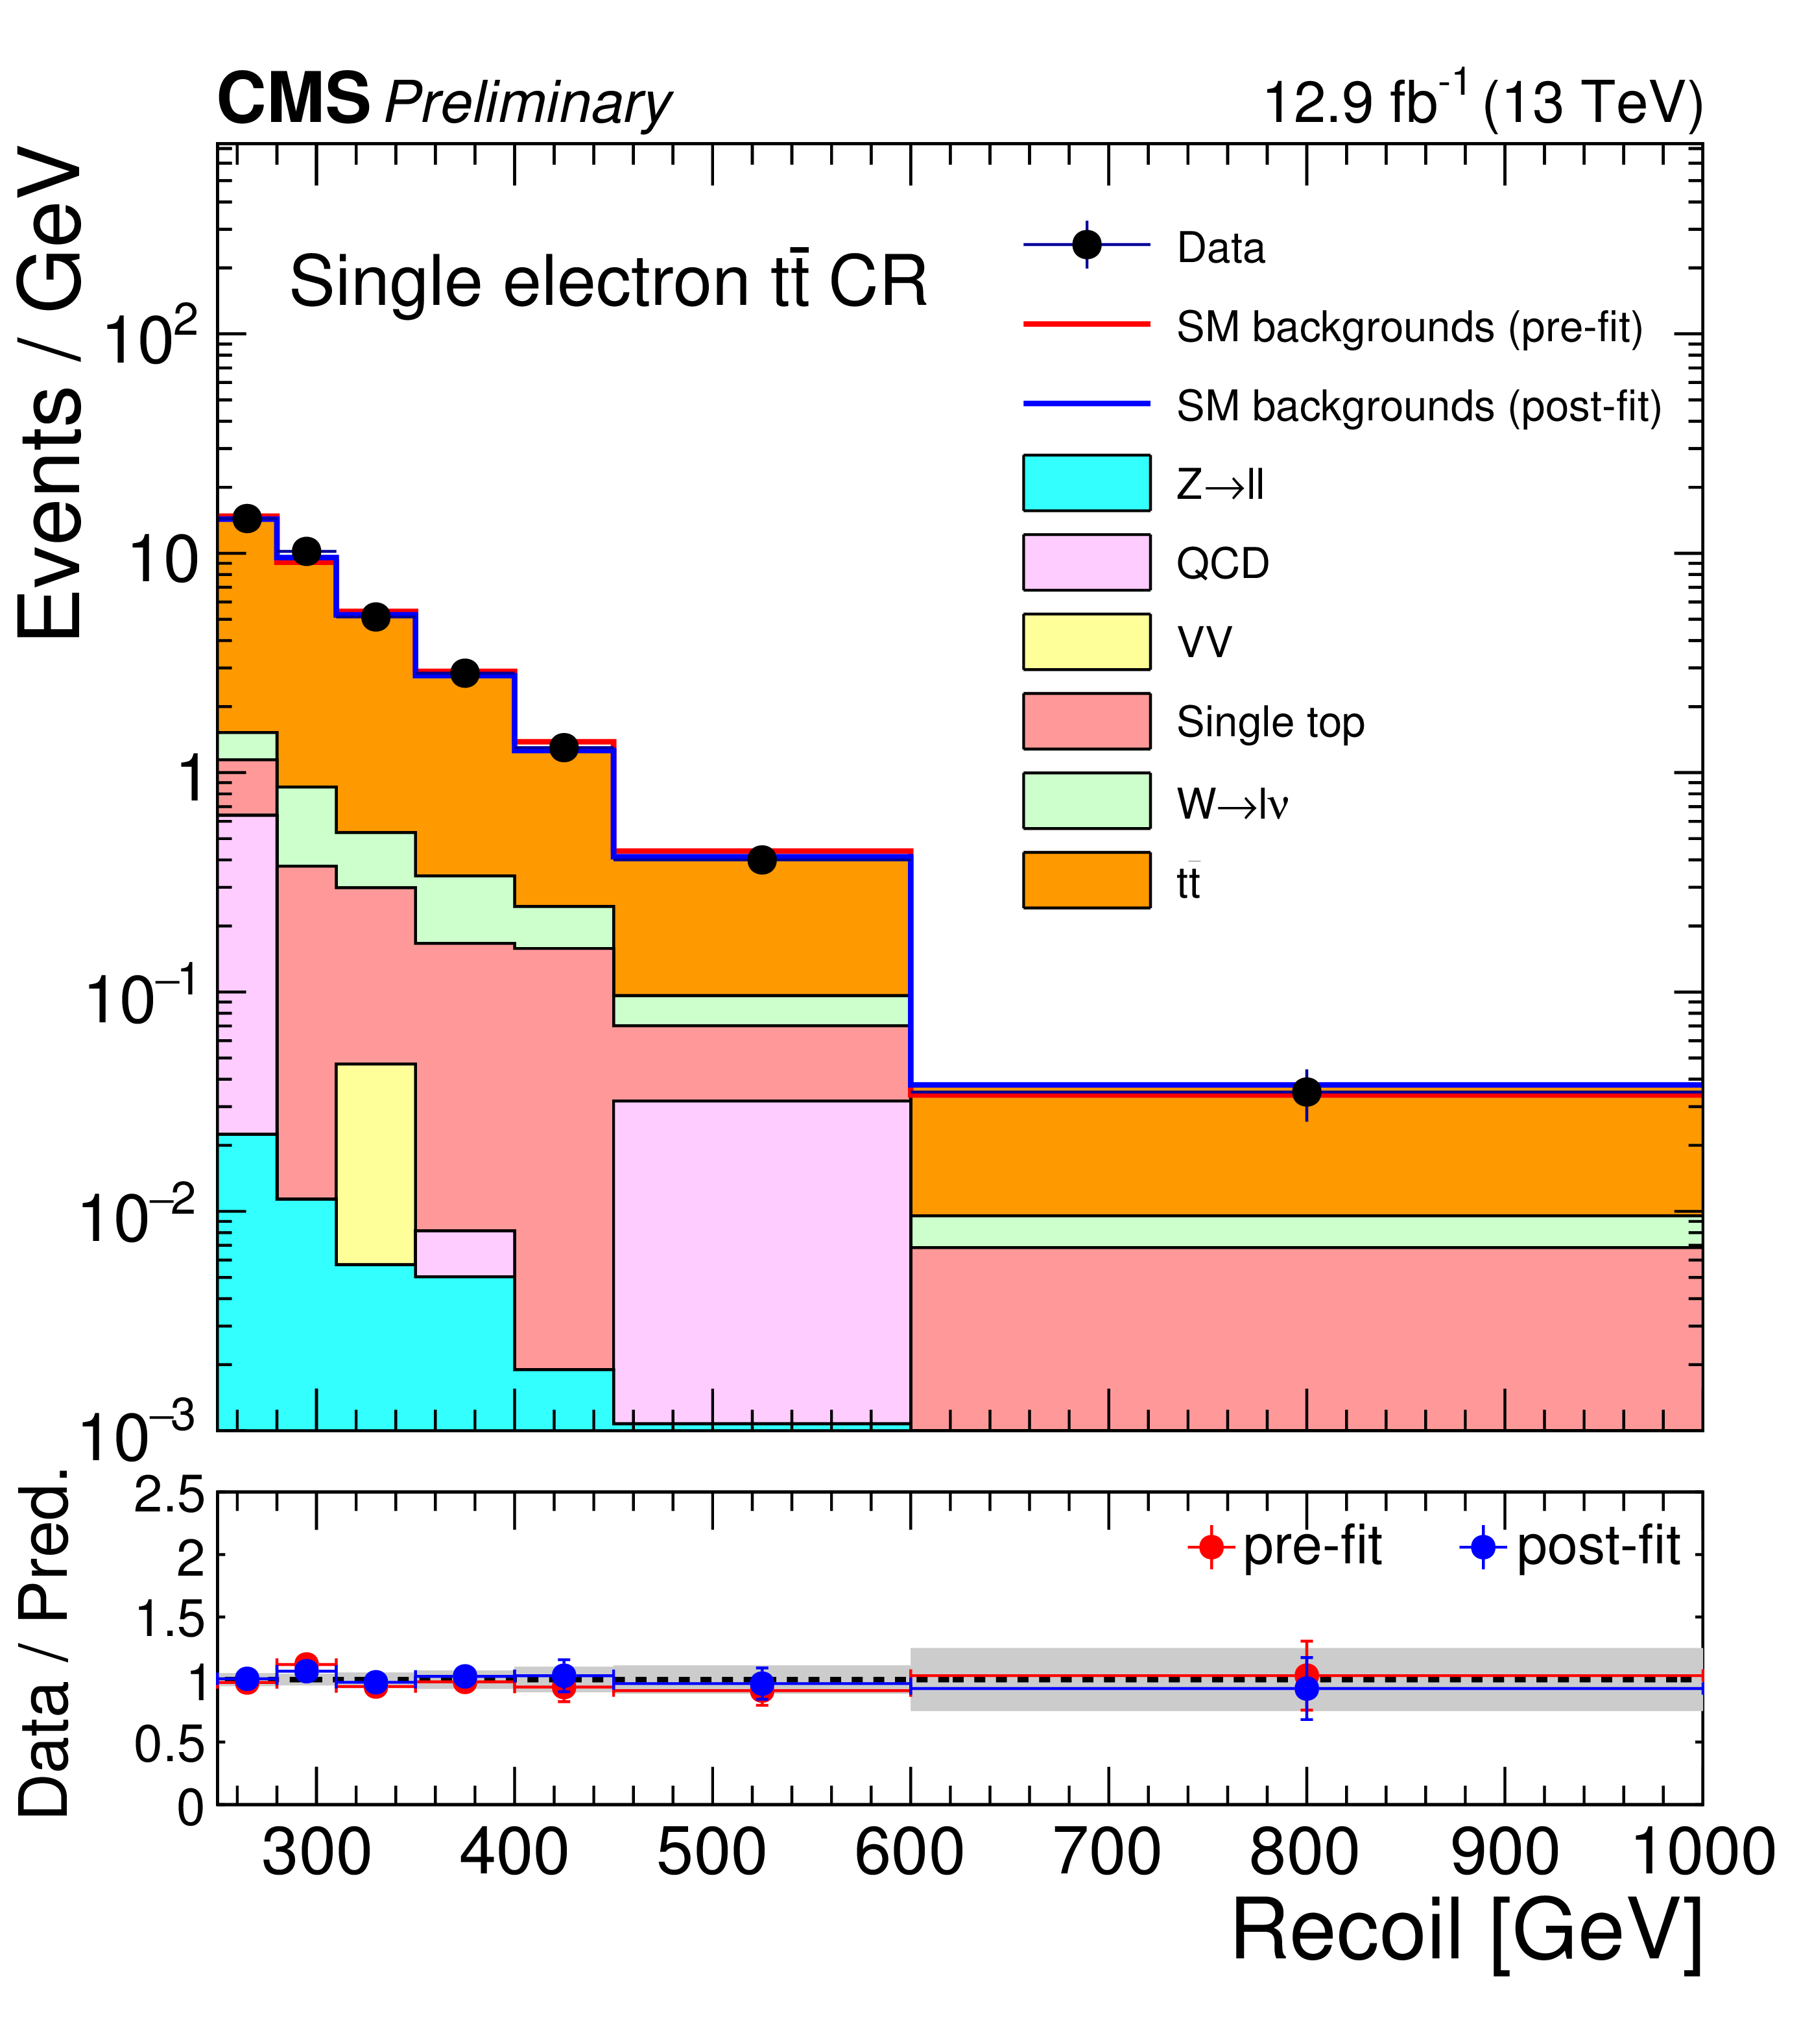
Figure 4-a:
Comparison between data and Monte Carlo simulation in the control regions before and after performing the simultaneous fit to the different control regions and signal region. Plot (a) corresponds to the single electron $b$-tagged control region and plot (b) corresponds to the single muon $b$-tagged control region. The blue solid line represents the sum of the SM background contributions normalized to the post-fit yield. The red solid line represents the sum of the SM background contributions normalized to the theoretical prediction. The stacked histograms show the individual SM background distributions after the fit is performed. The gray band represents the post-fit uncertainty propagating all systematic uncertainties through. |
png pdf |
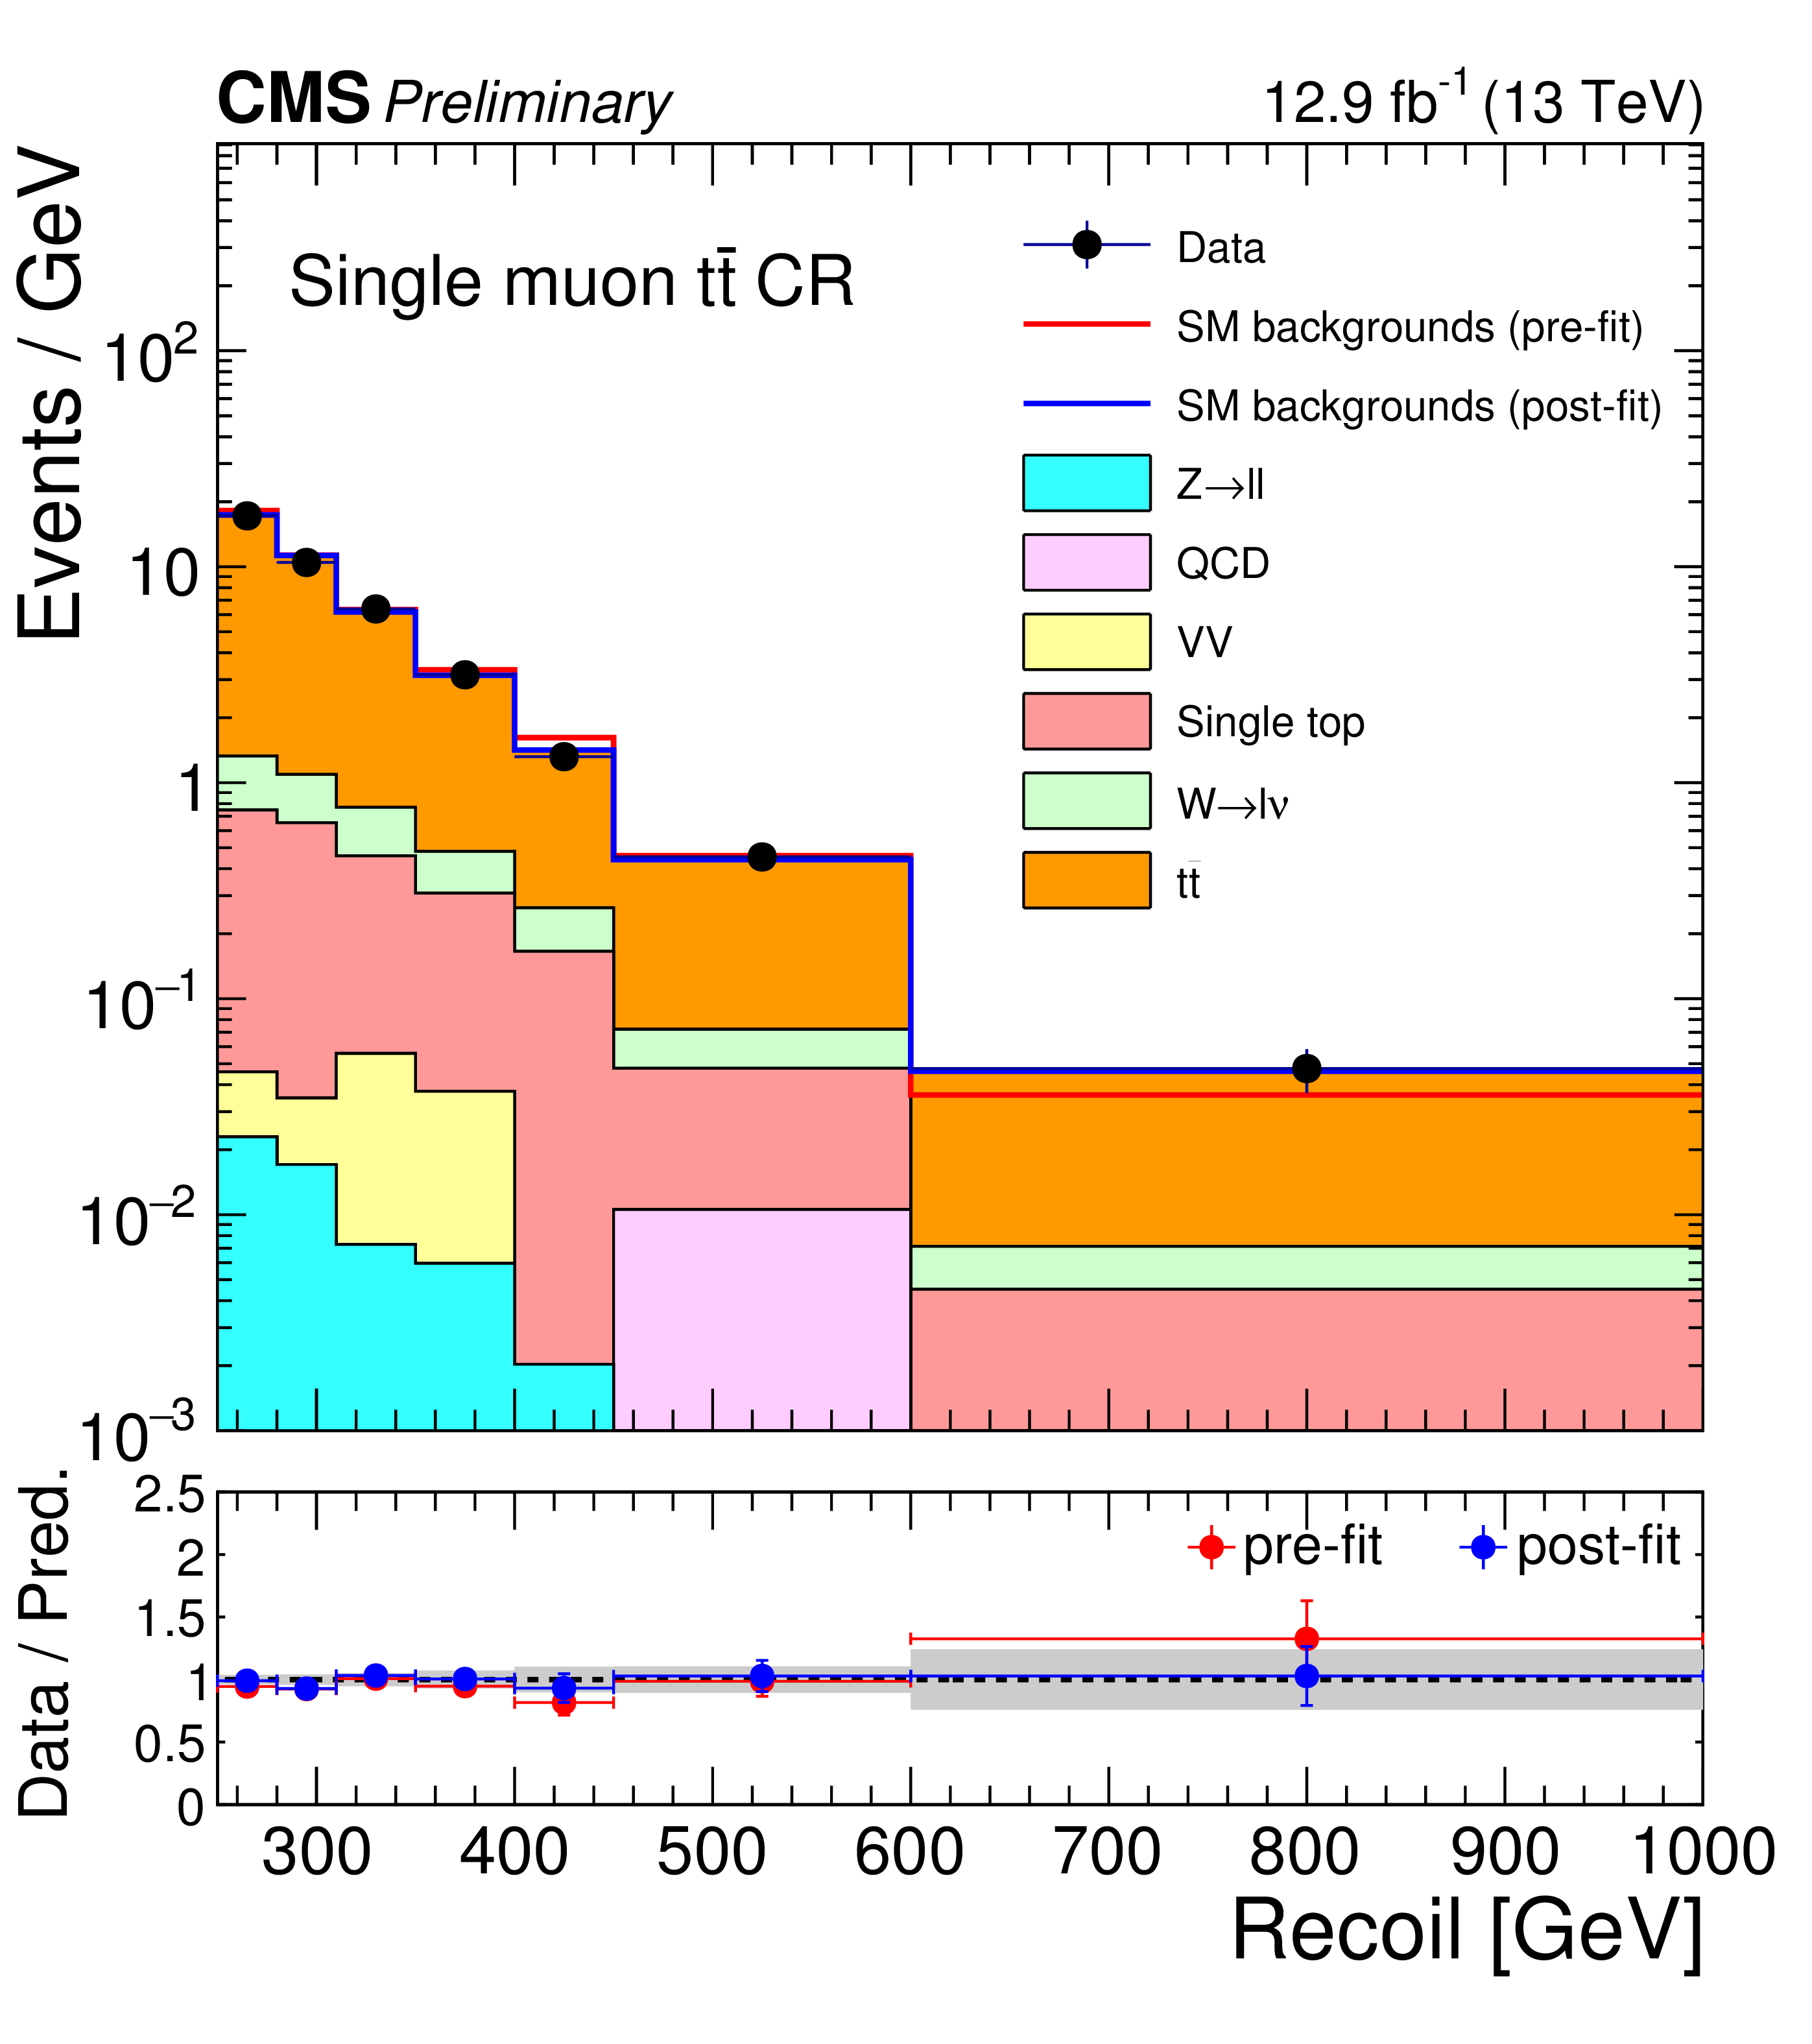
Figure 4-b:
Comparison between data and Monte Carlo simulation in the control regions before and after performing the simultaneous fit to the different control regions and signal region. Plot (a) corresponds to the single electron $b$-tagged control region and plot (b) corresponds to the single muon $b$-tagged control region. The blue solid line represents the sum of the SM background contributions normalized to the post-fit yield. The red solid line represents the sum of the SM background contributions normalized to the theoretical prediction. The stacked histograms show the individual SM background distributions after the fit is performed. The gray band represents the post-fit uncertainty propagating all systematic uncertainties through. |
png pdf |
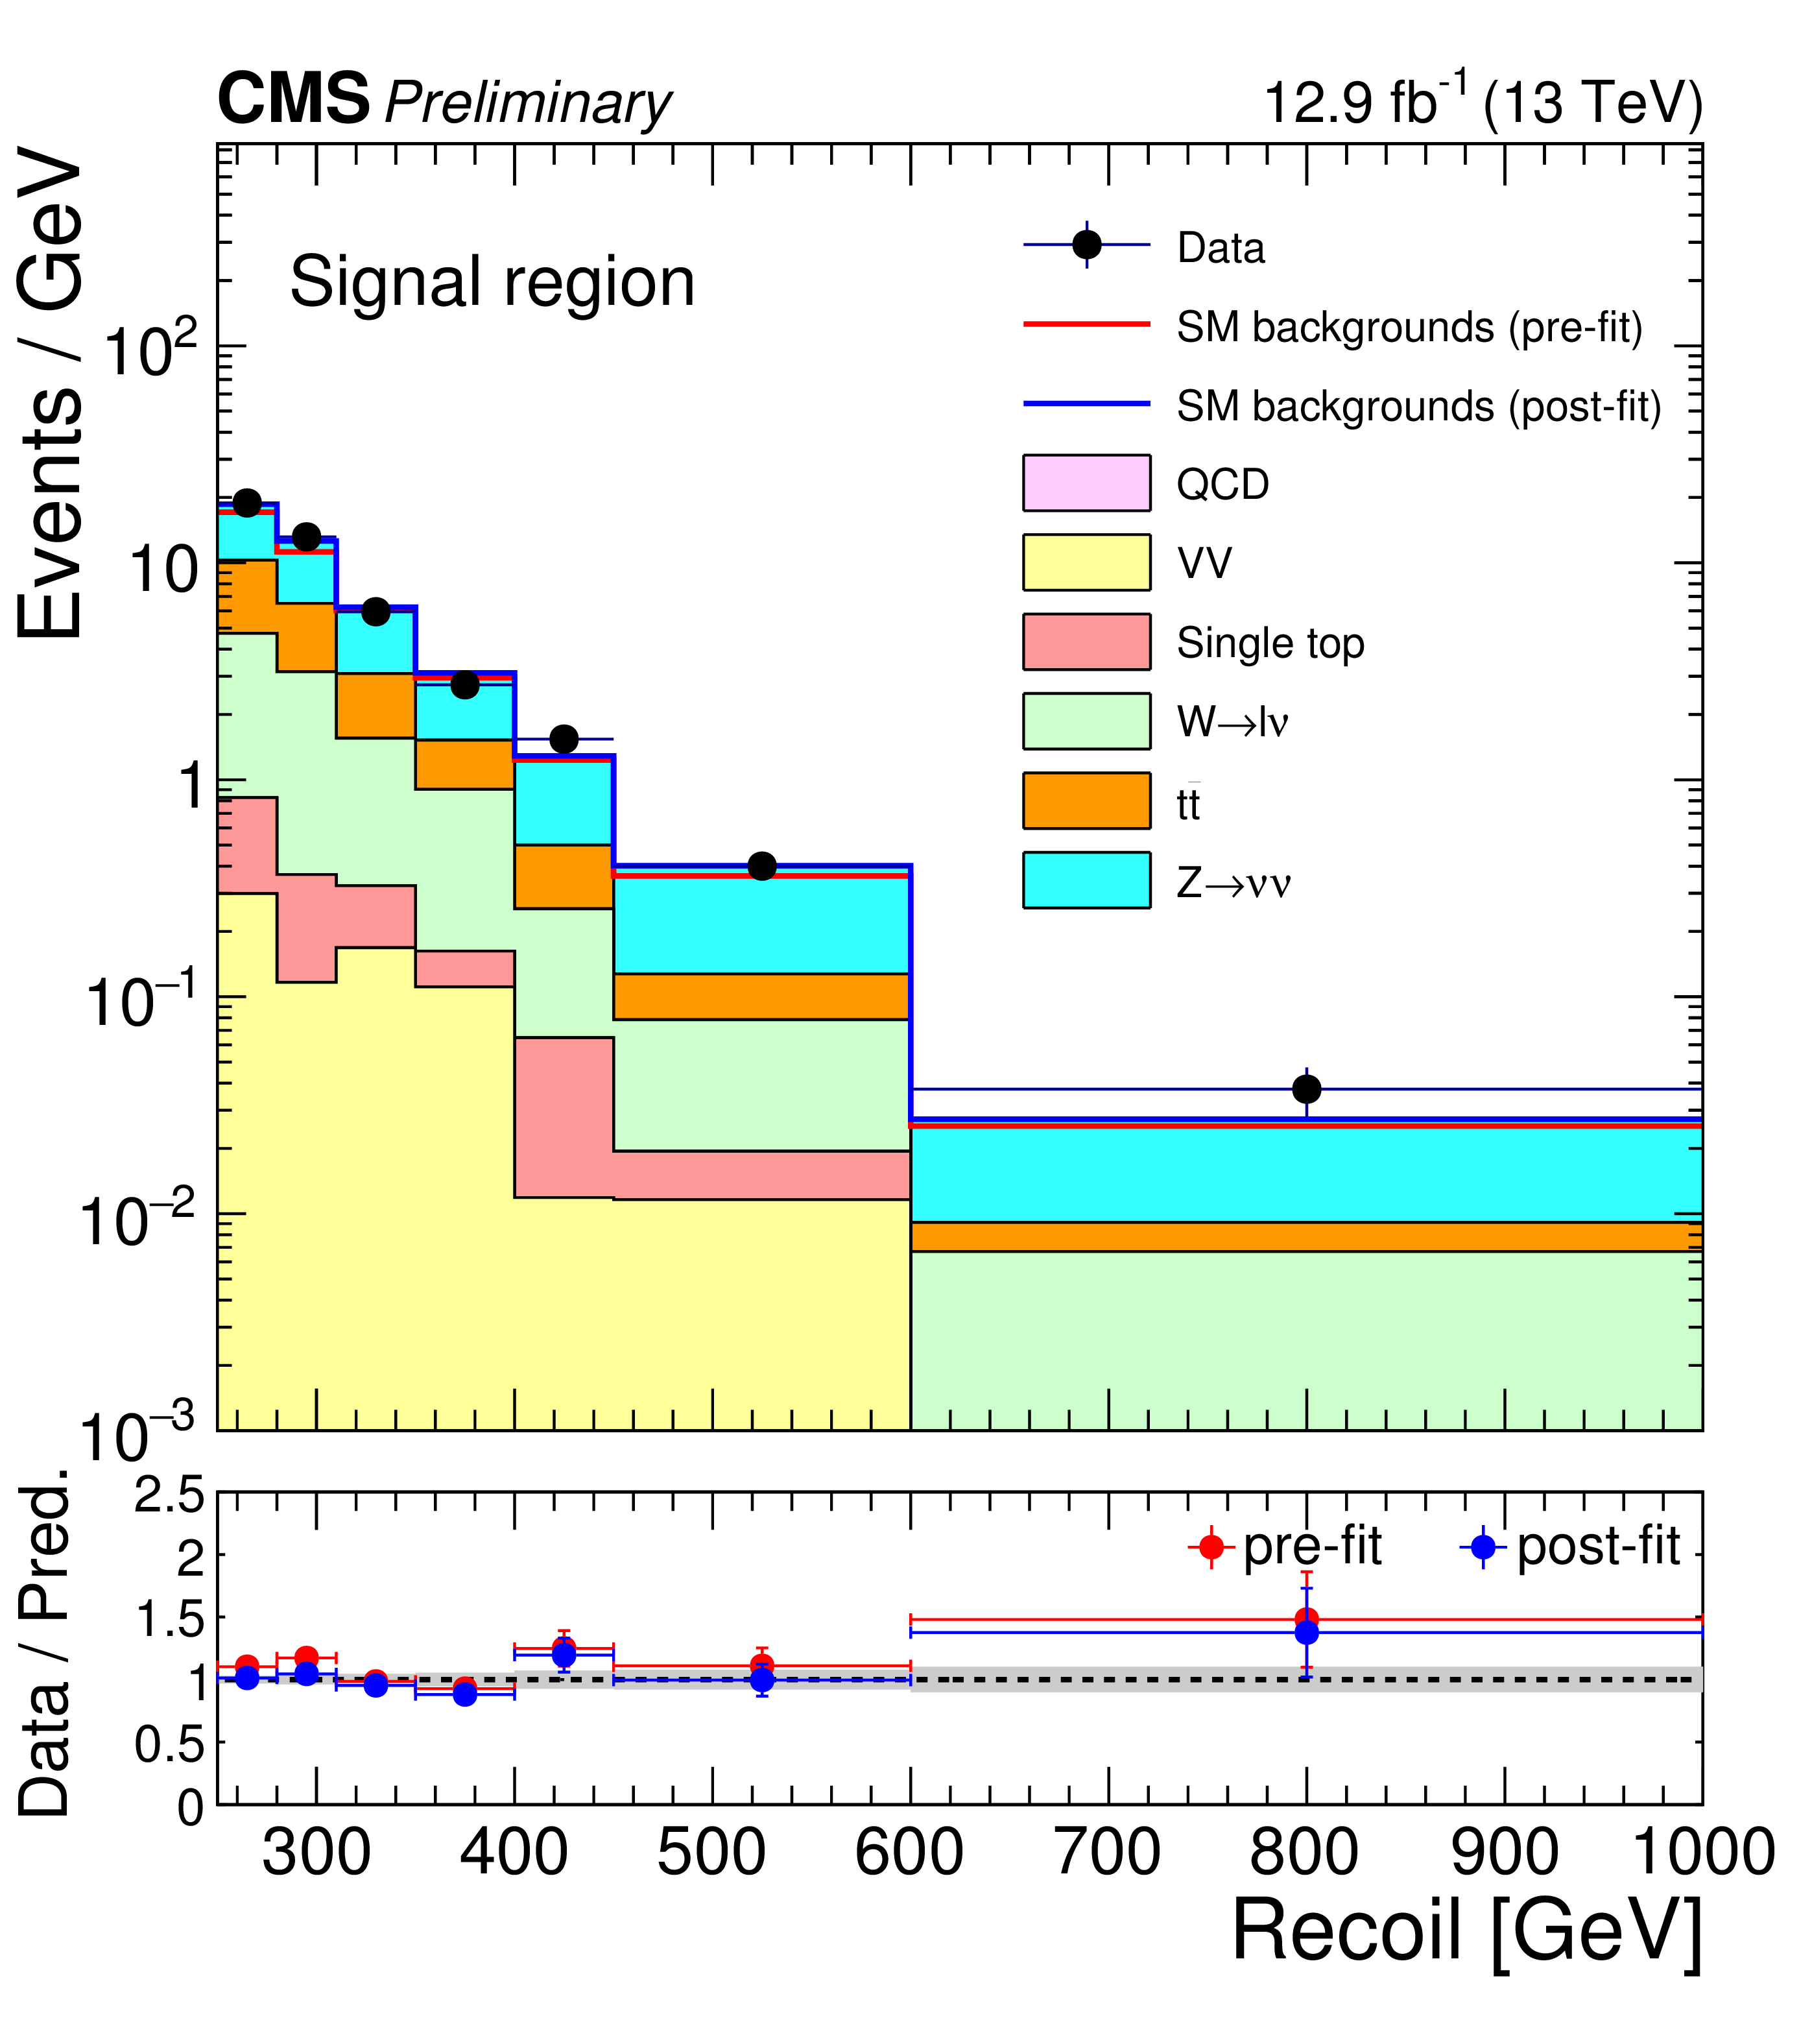
Figure 5:
Distribution of ${E_{\mathrm {T}}^{\text {miss}}}$ from SM backgrounds and data in the signal region after simultaneously fitting in the signal region and all control regions. The stacked histograms show the individual SM background distributions after the fit is performed. The blue solid line represents the sum of the SM background contributions normalized to the post-fit yield. The red solid line represents the sum of the SM background contributions normalized to the theoretical prediction. The gray bands indicate the post-fit uncertainty on the background, assuming no signal. |
png pdf |
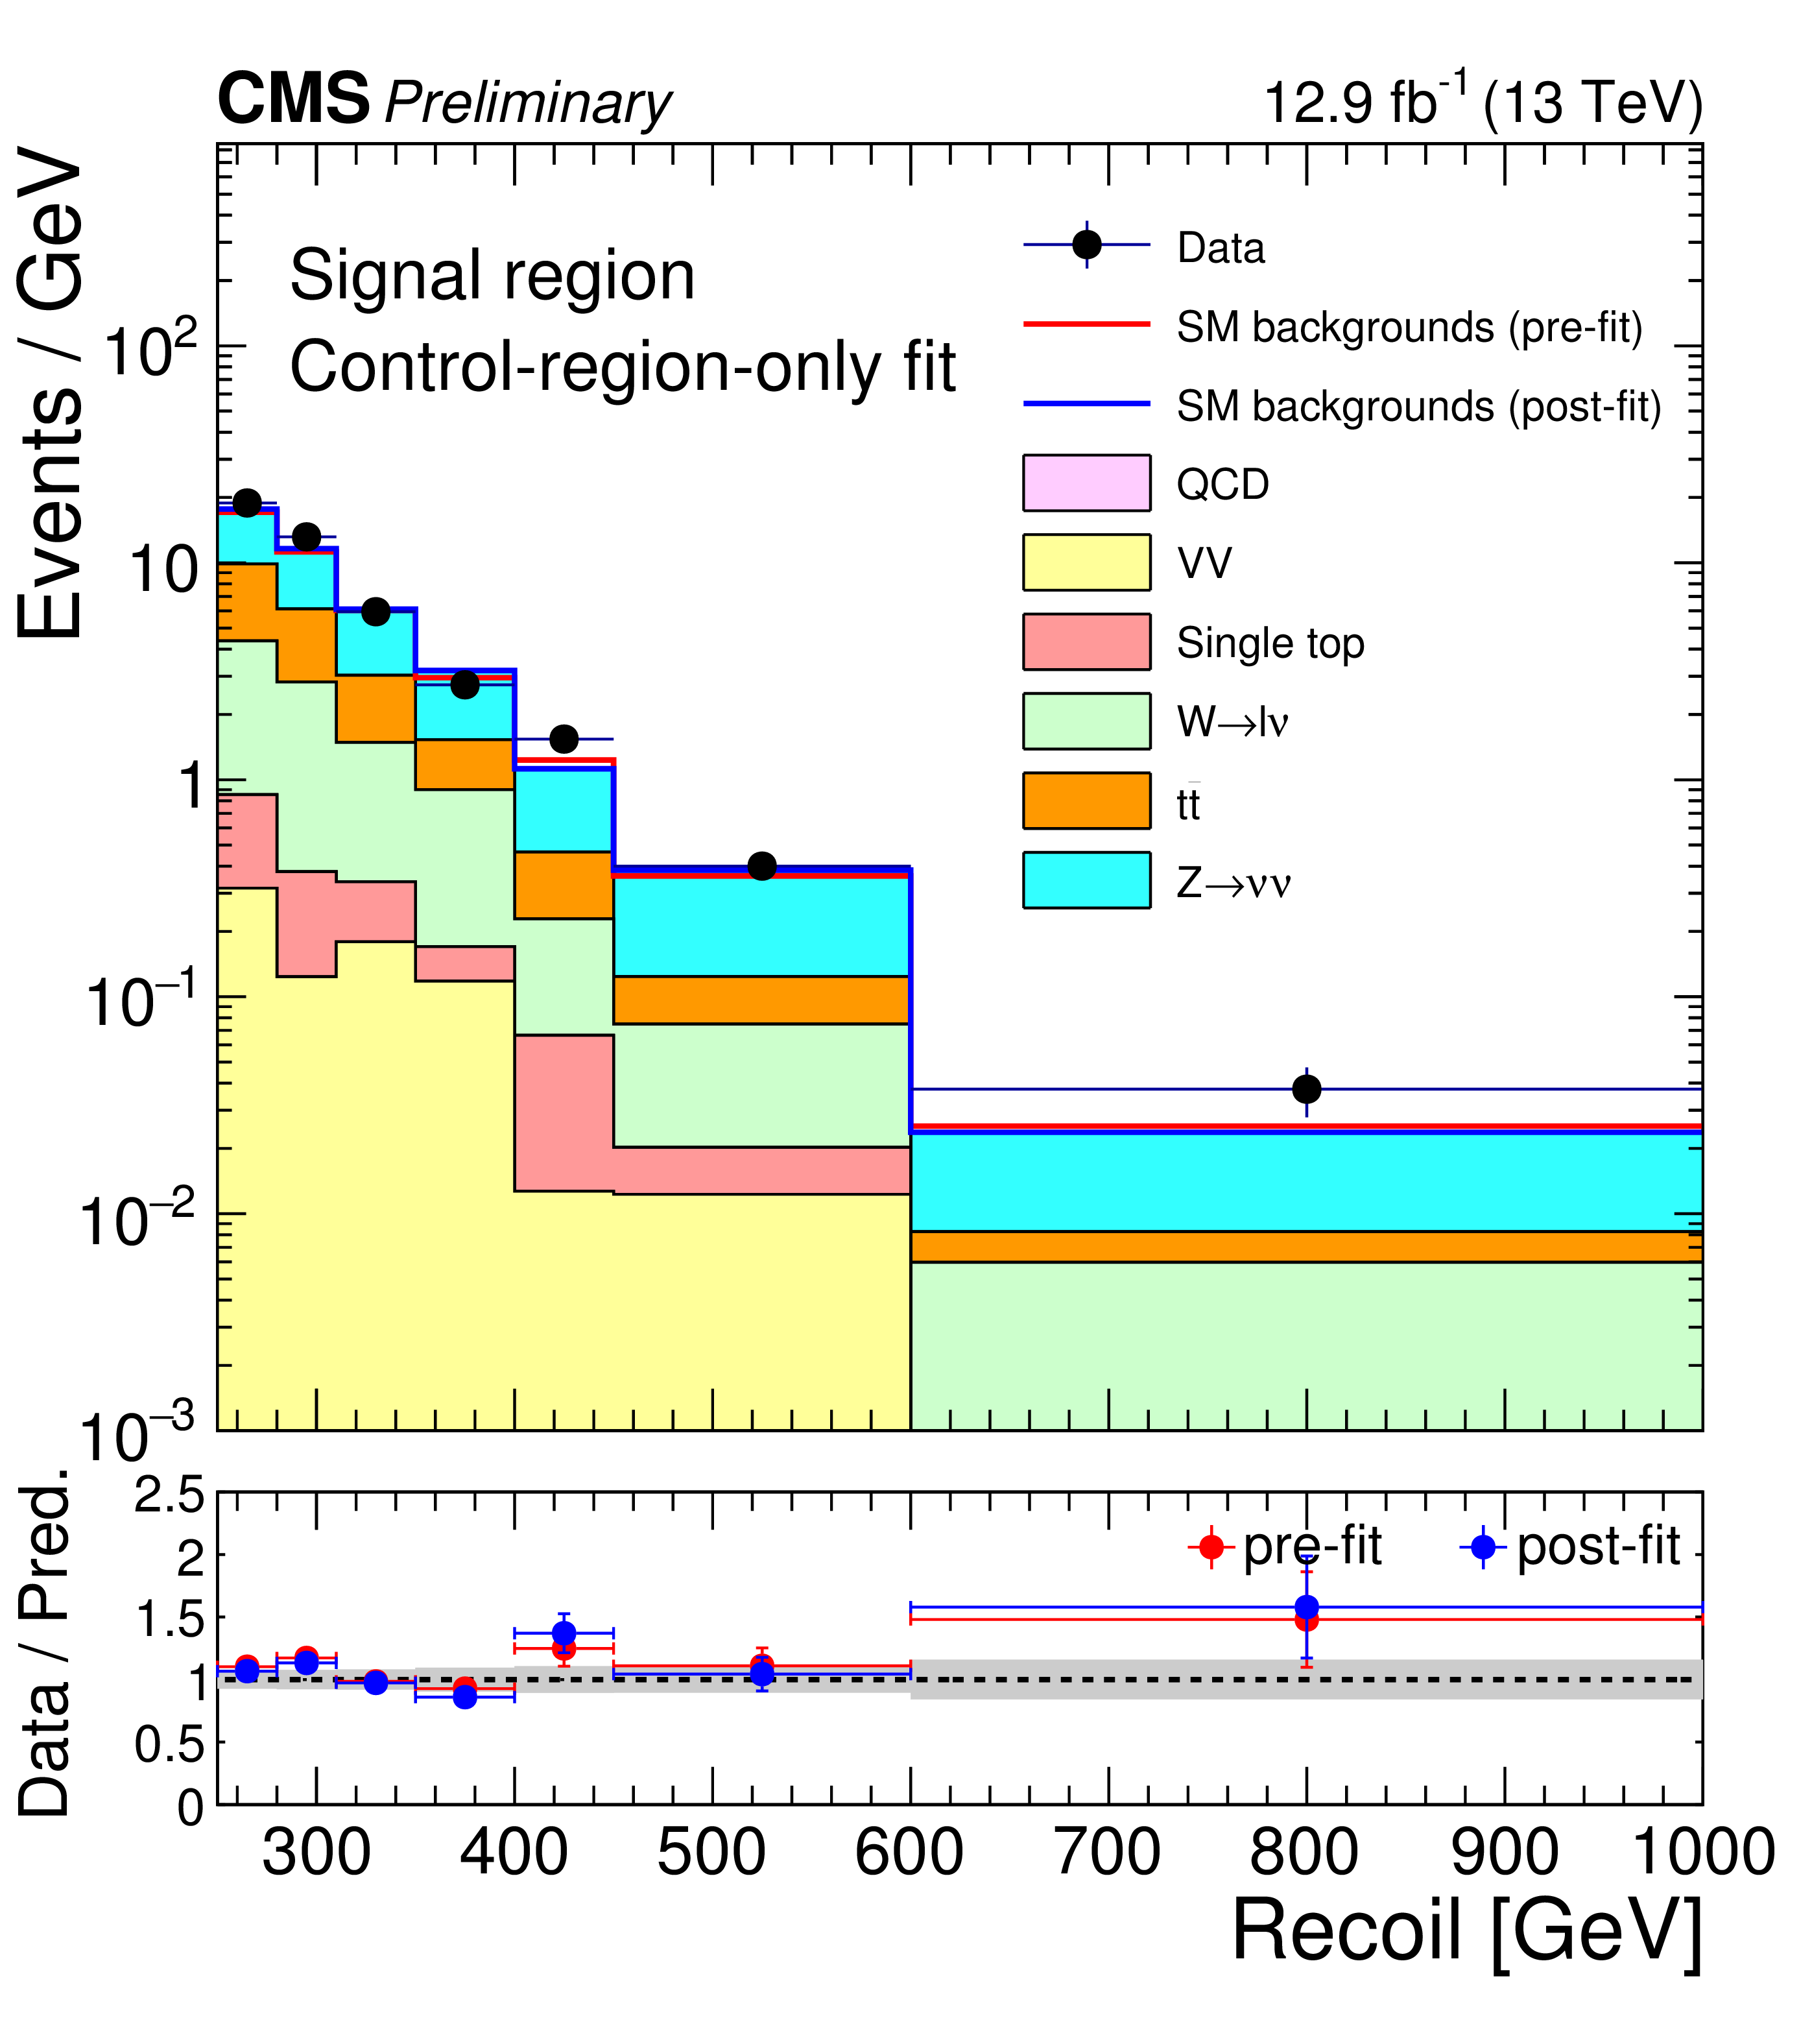
Figure 6:
Distribution of ${E_{\mathrm {T}}^{\text {miss}}}$ from SM backgrounds and data in the signal region after fitting only in the control regions and propagating the background estimates to the signal region. The stacked histograms show the individual SM background distributions after the fit is performed. The blue solid line represents the sum of the SM background contributions normalized to the post-fit yield. The red solid line represents the sum of the SM background contributions normalized to the theoretical prediction. The gray bands indicate the post-fit uncertainty on the background, assuming no signal. |
png pdf |
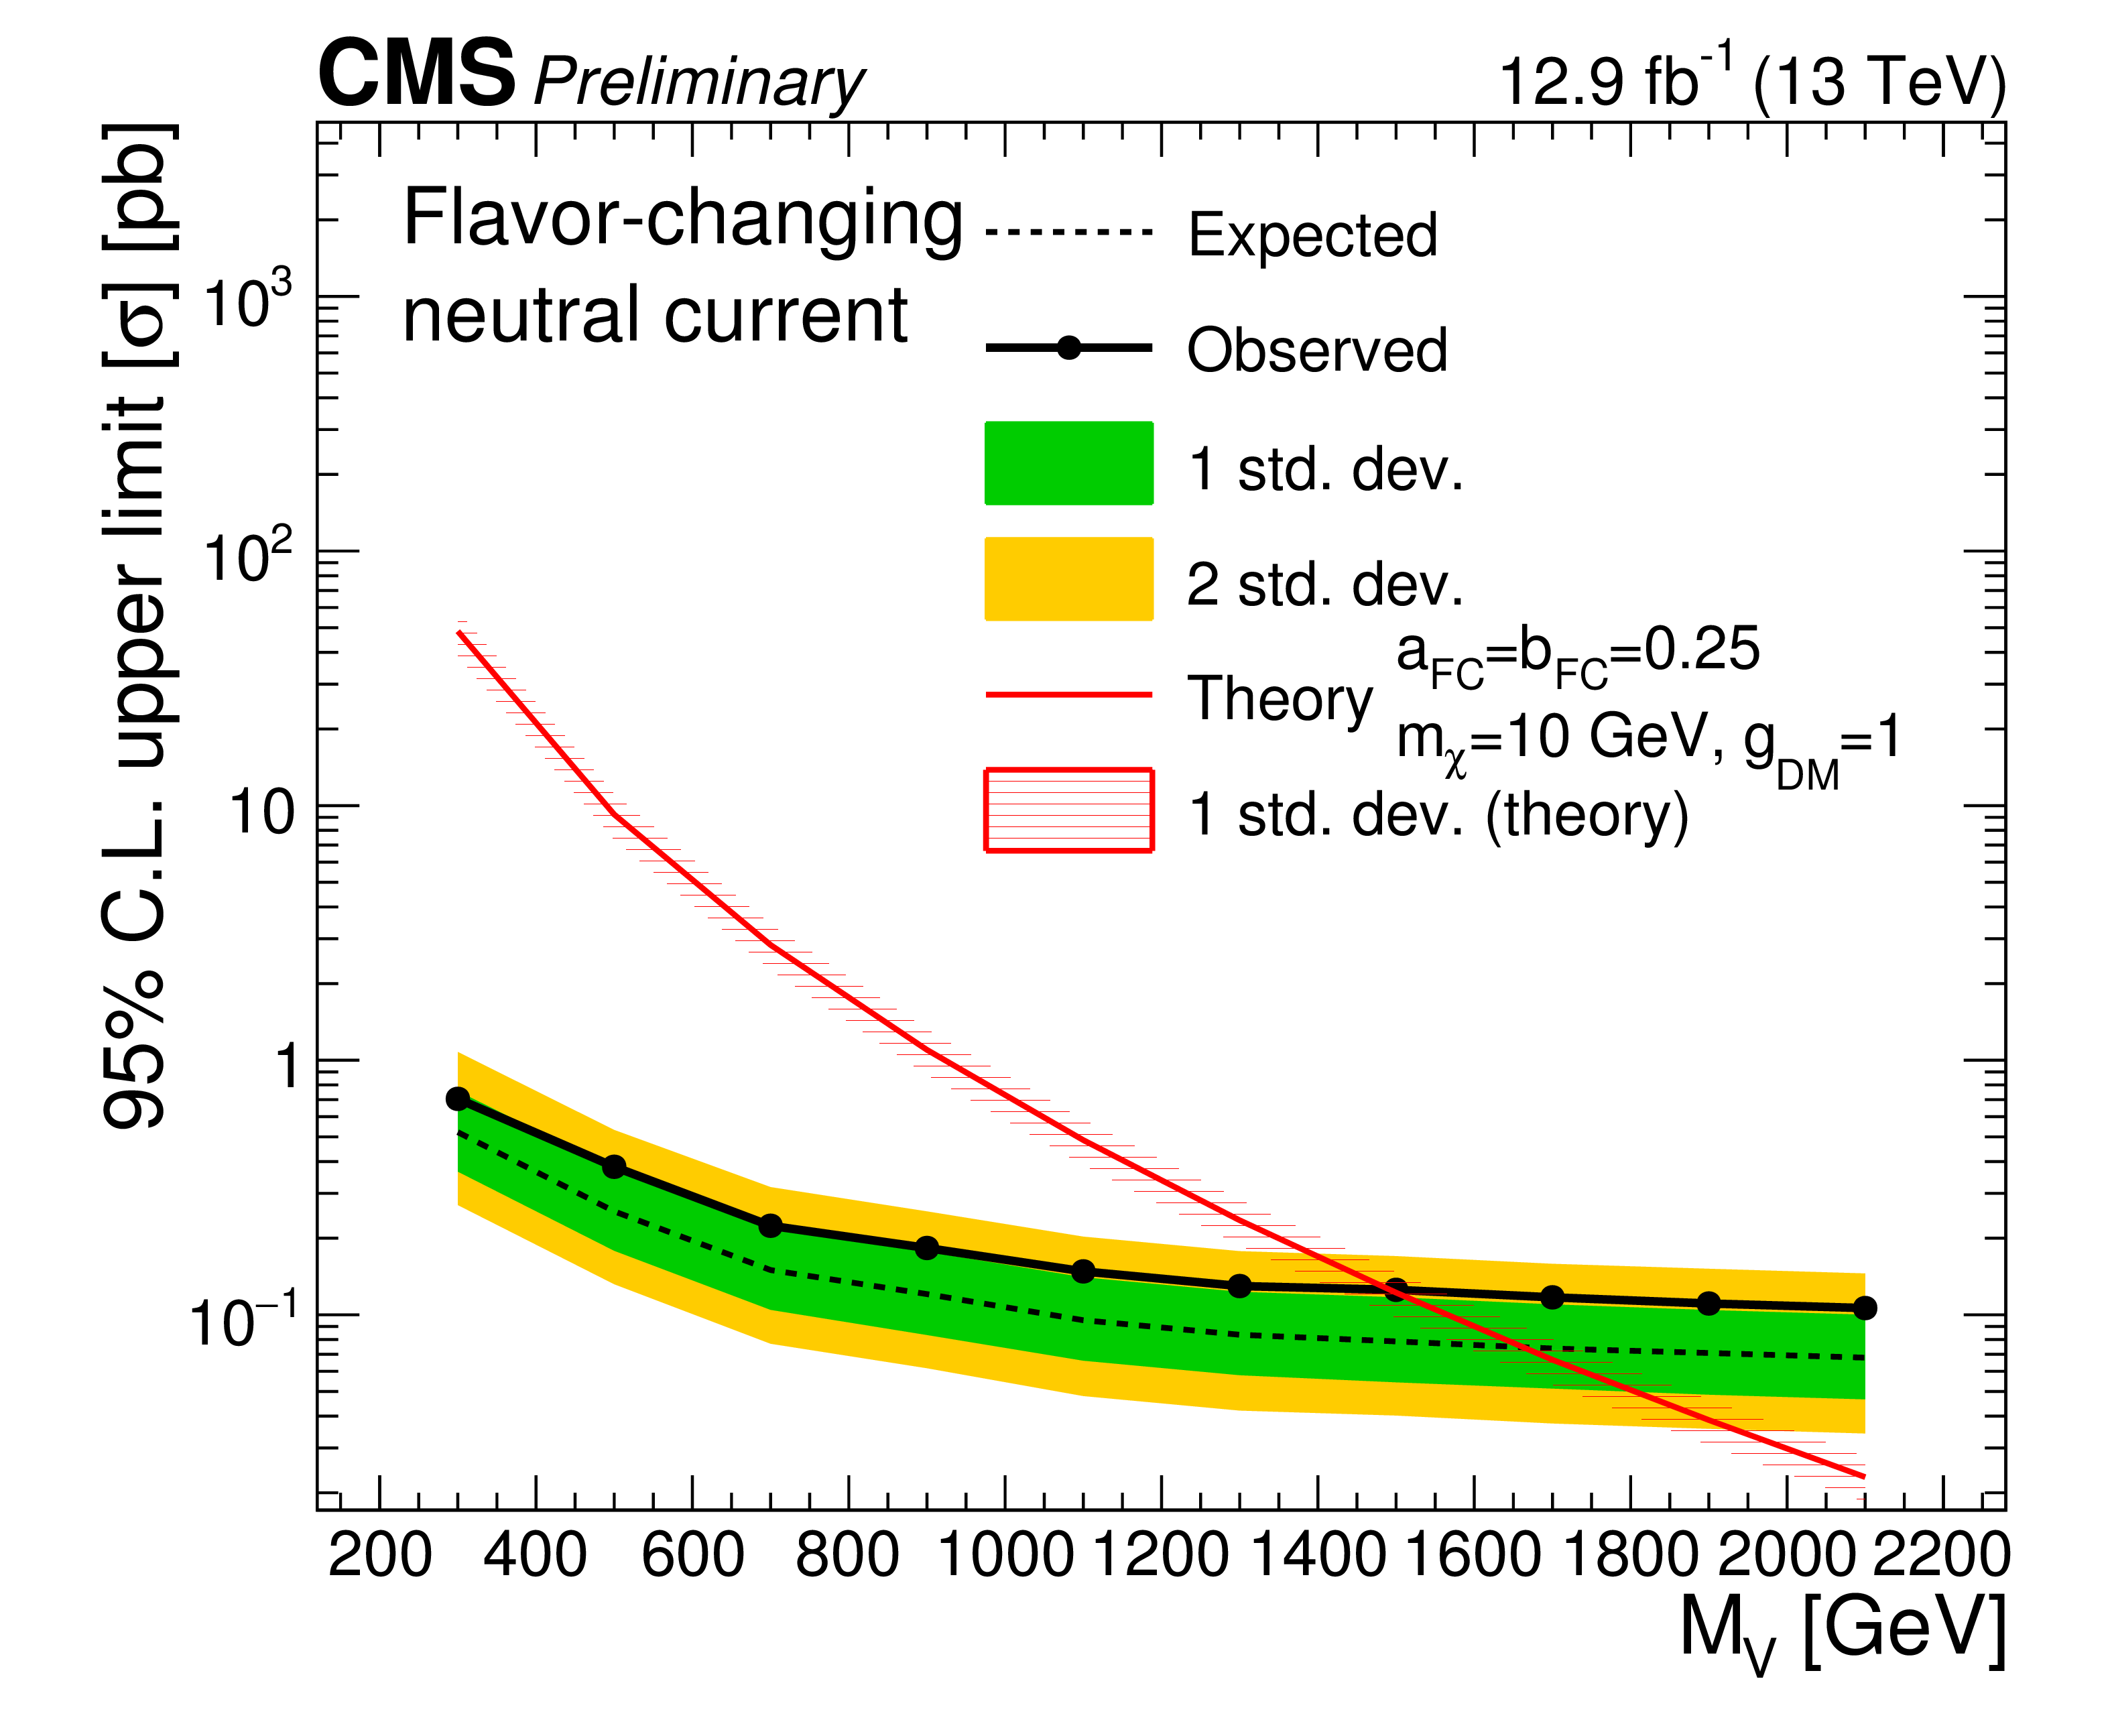
Figure 7-a:
Results assuming a FCNC interpretation of the monotop signature. Shown are upper limits as a function of the mass of the vector field $V$, assuming fixed $a_\text {FC} = b_\text {FC}=$ 0.25 and a dark matter mass of $M_\chi =$ 10 GeV. The limits are placed at a confidence level of 95%. a: limits on the inclusive cross section for monotop production; b: limits on $\sigma /\sigma _\text {theory}$. The green and yellow bands represent 1 and 2 standard deviations of experimental uncertainties, respectively. The red shaded band represents the 20% signal cross-section uncertainty. |

png pdf |
Figure 7-b:
Results assuming a FCNC interpretation of the monotop signature. Shown are upper limits as a function of the mass of the vector field $V$, assuming fixed $a_\text {FC} = b_\text {FC}=$ 0.25 and a dark matter mass of $M_\chi =$ 10 GeV. The limits are placed at a confidence level of 95%. a: limits on the inclusive cross section for monotop production; b: limits on $\sigma /\sigma _\text {theory}$. The green and yellow bands represent 1 and 2 standard deviations of experimental uncertainties, respectively. The red shaded band represents the 20% signal cross-section uncertainty. |
png pdf |
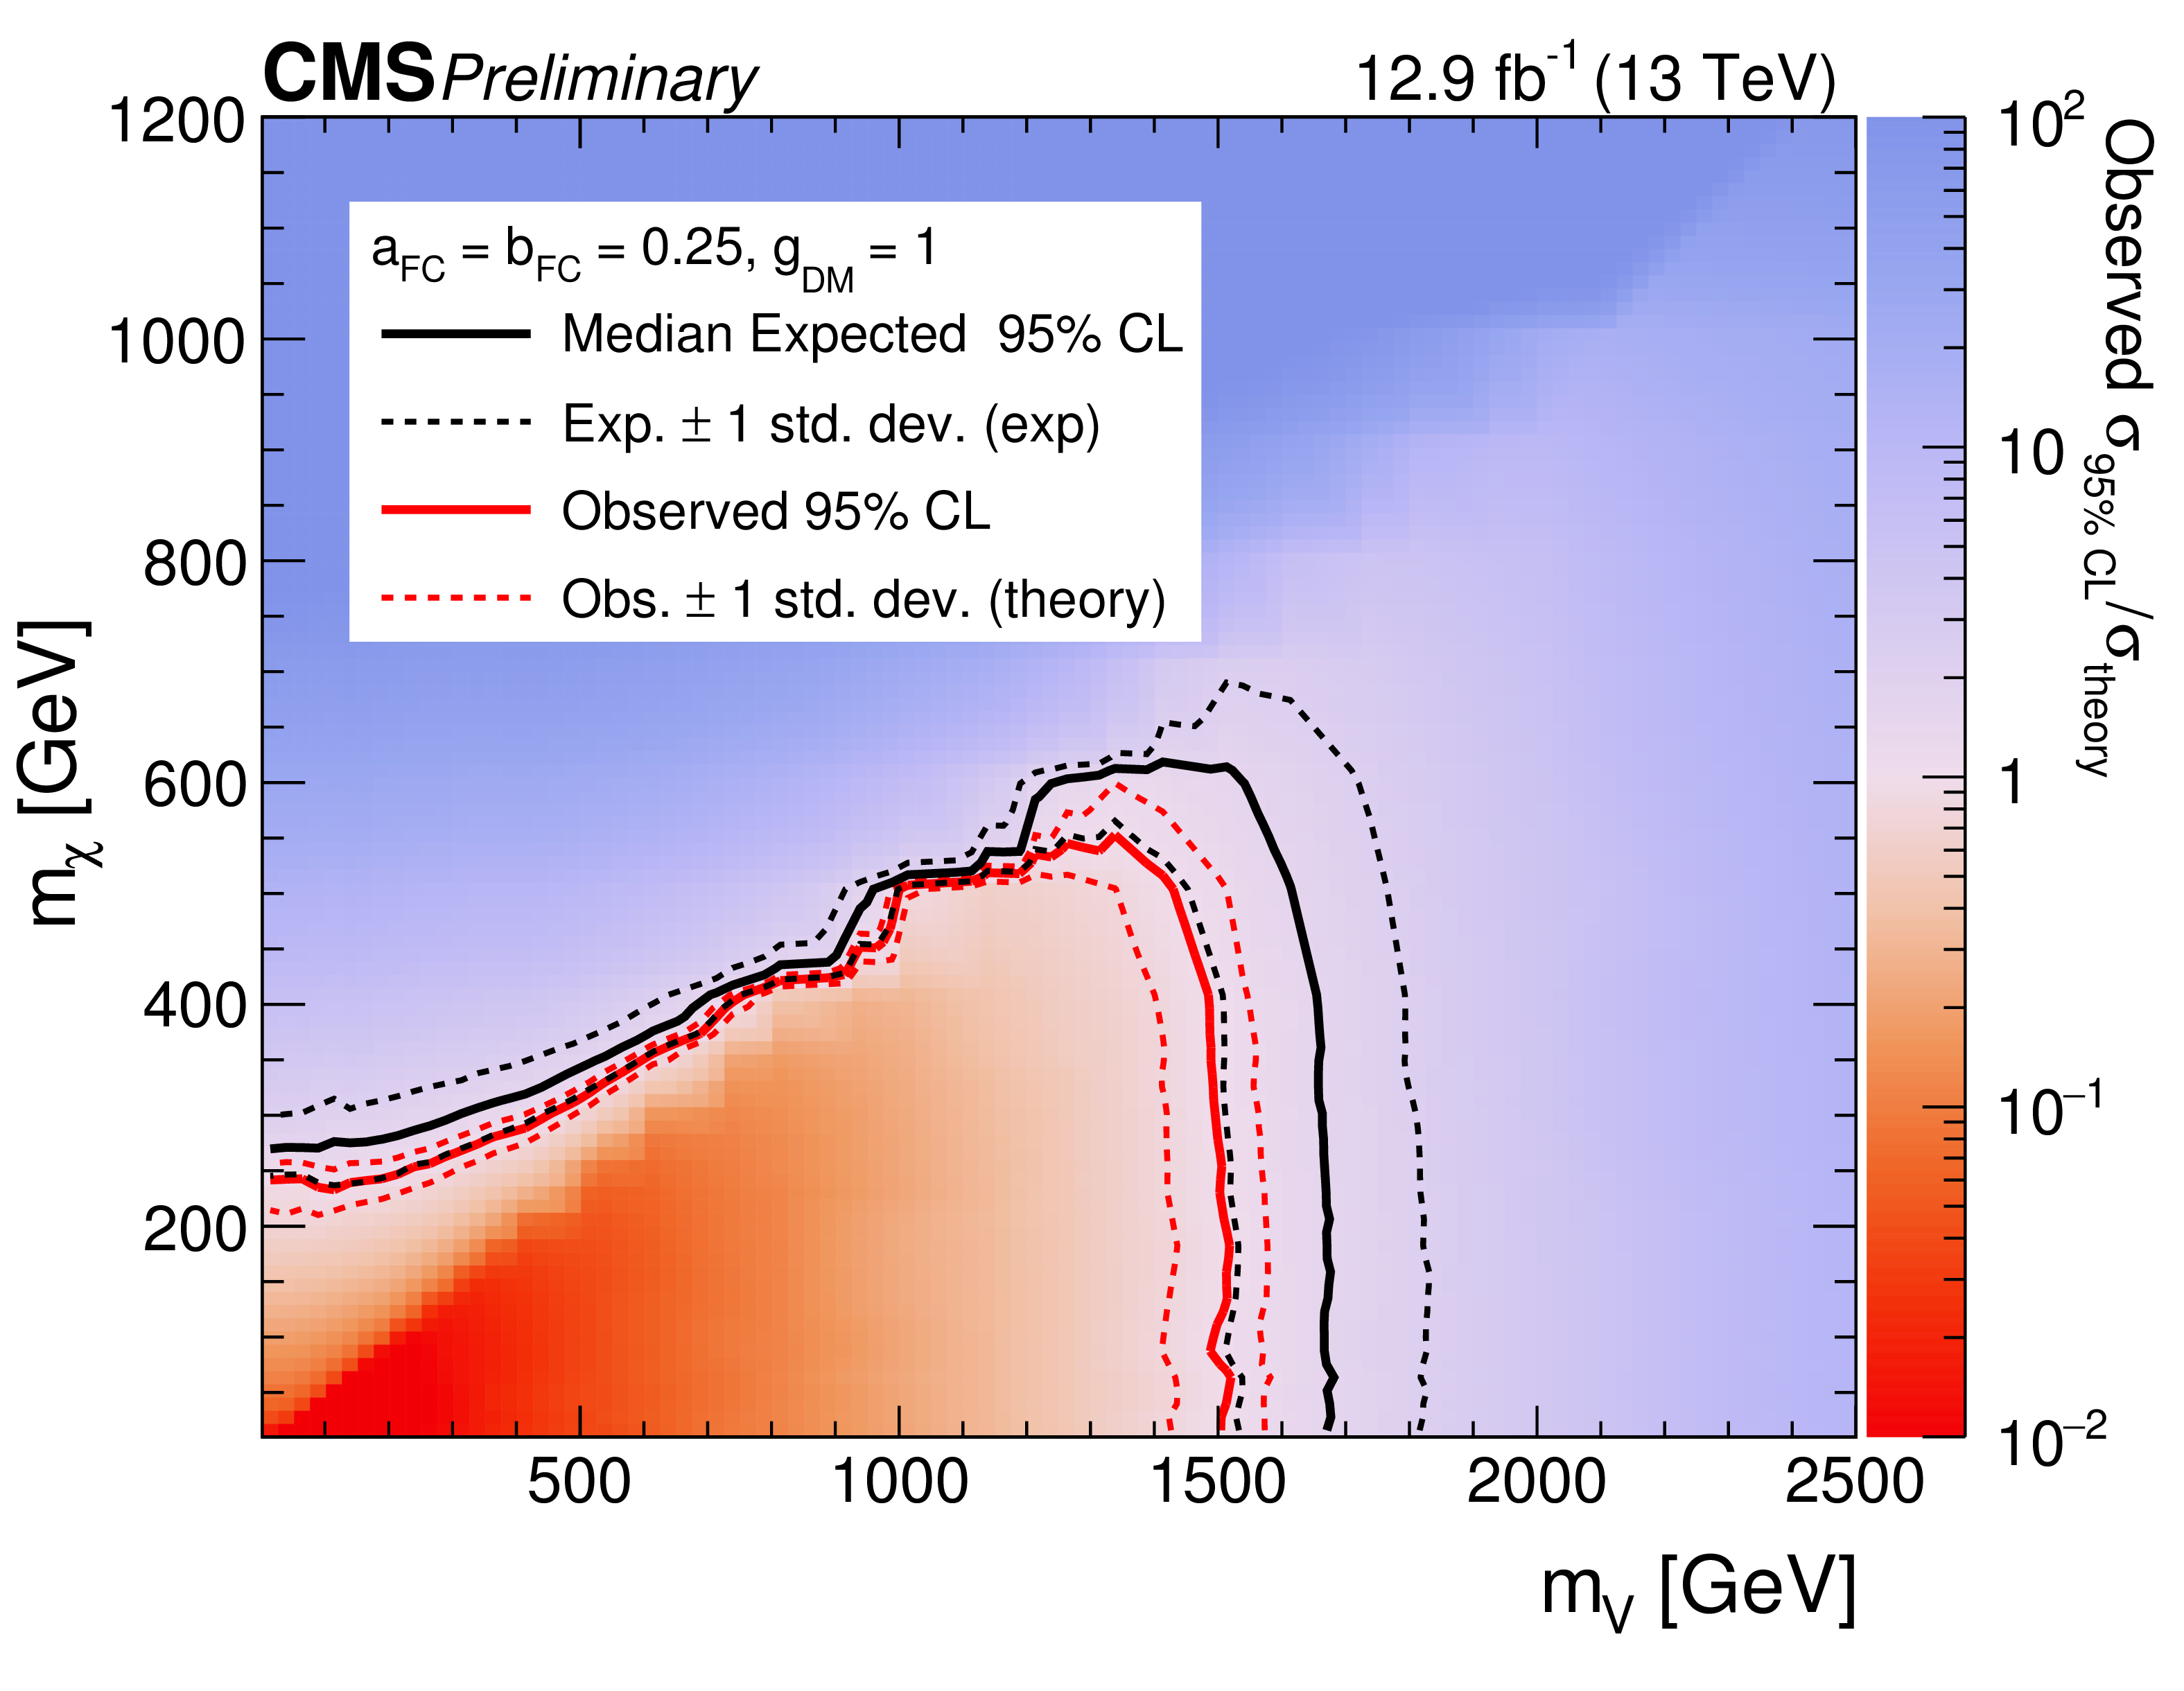
Figure 8:
Results for the FCNC interpretation presented in the two-dimensional plane spanned by the mediator and dark matter masses. The observed exclusion range (red solid line) is shown, also for the cases in which the predicted cross section is shifted by the assigned theory uncertainty (red dashed lines). The expected exclusion range is indicated by a black solid line, demonstrating the search sensitivity of the analysis. The experimental uncertainties are shown in black dashed lines. |
png pdf |
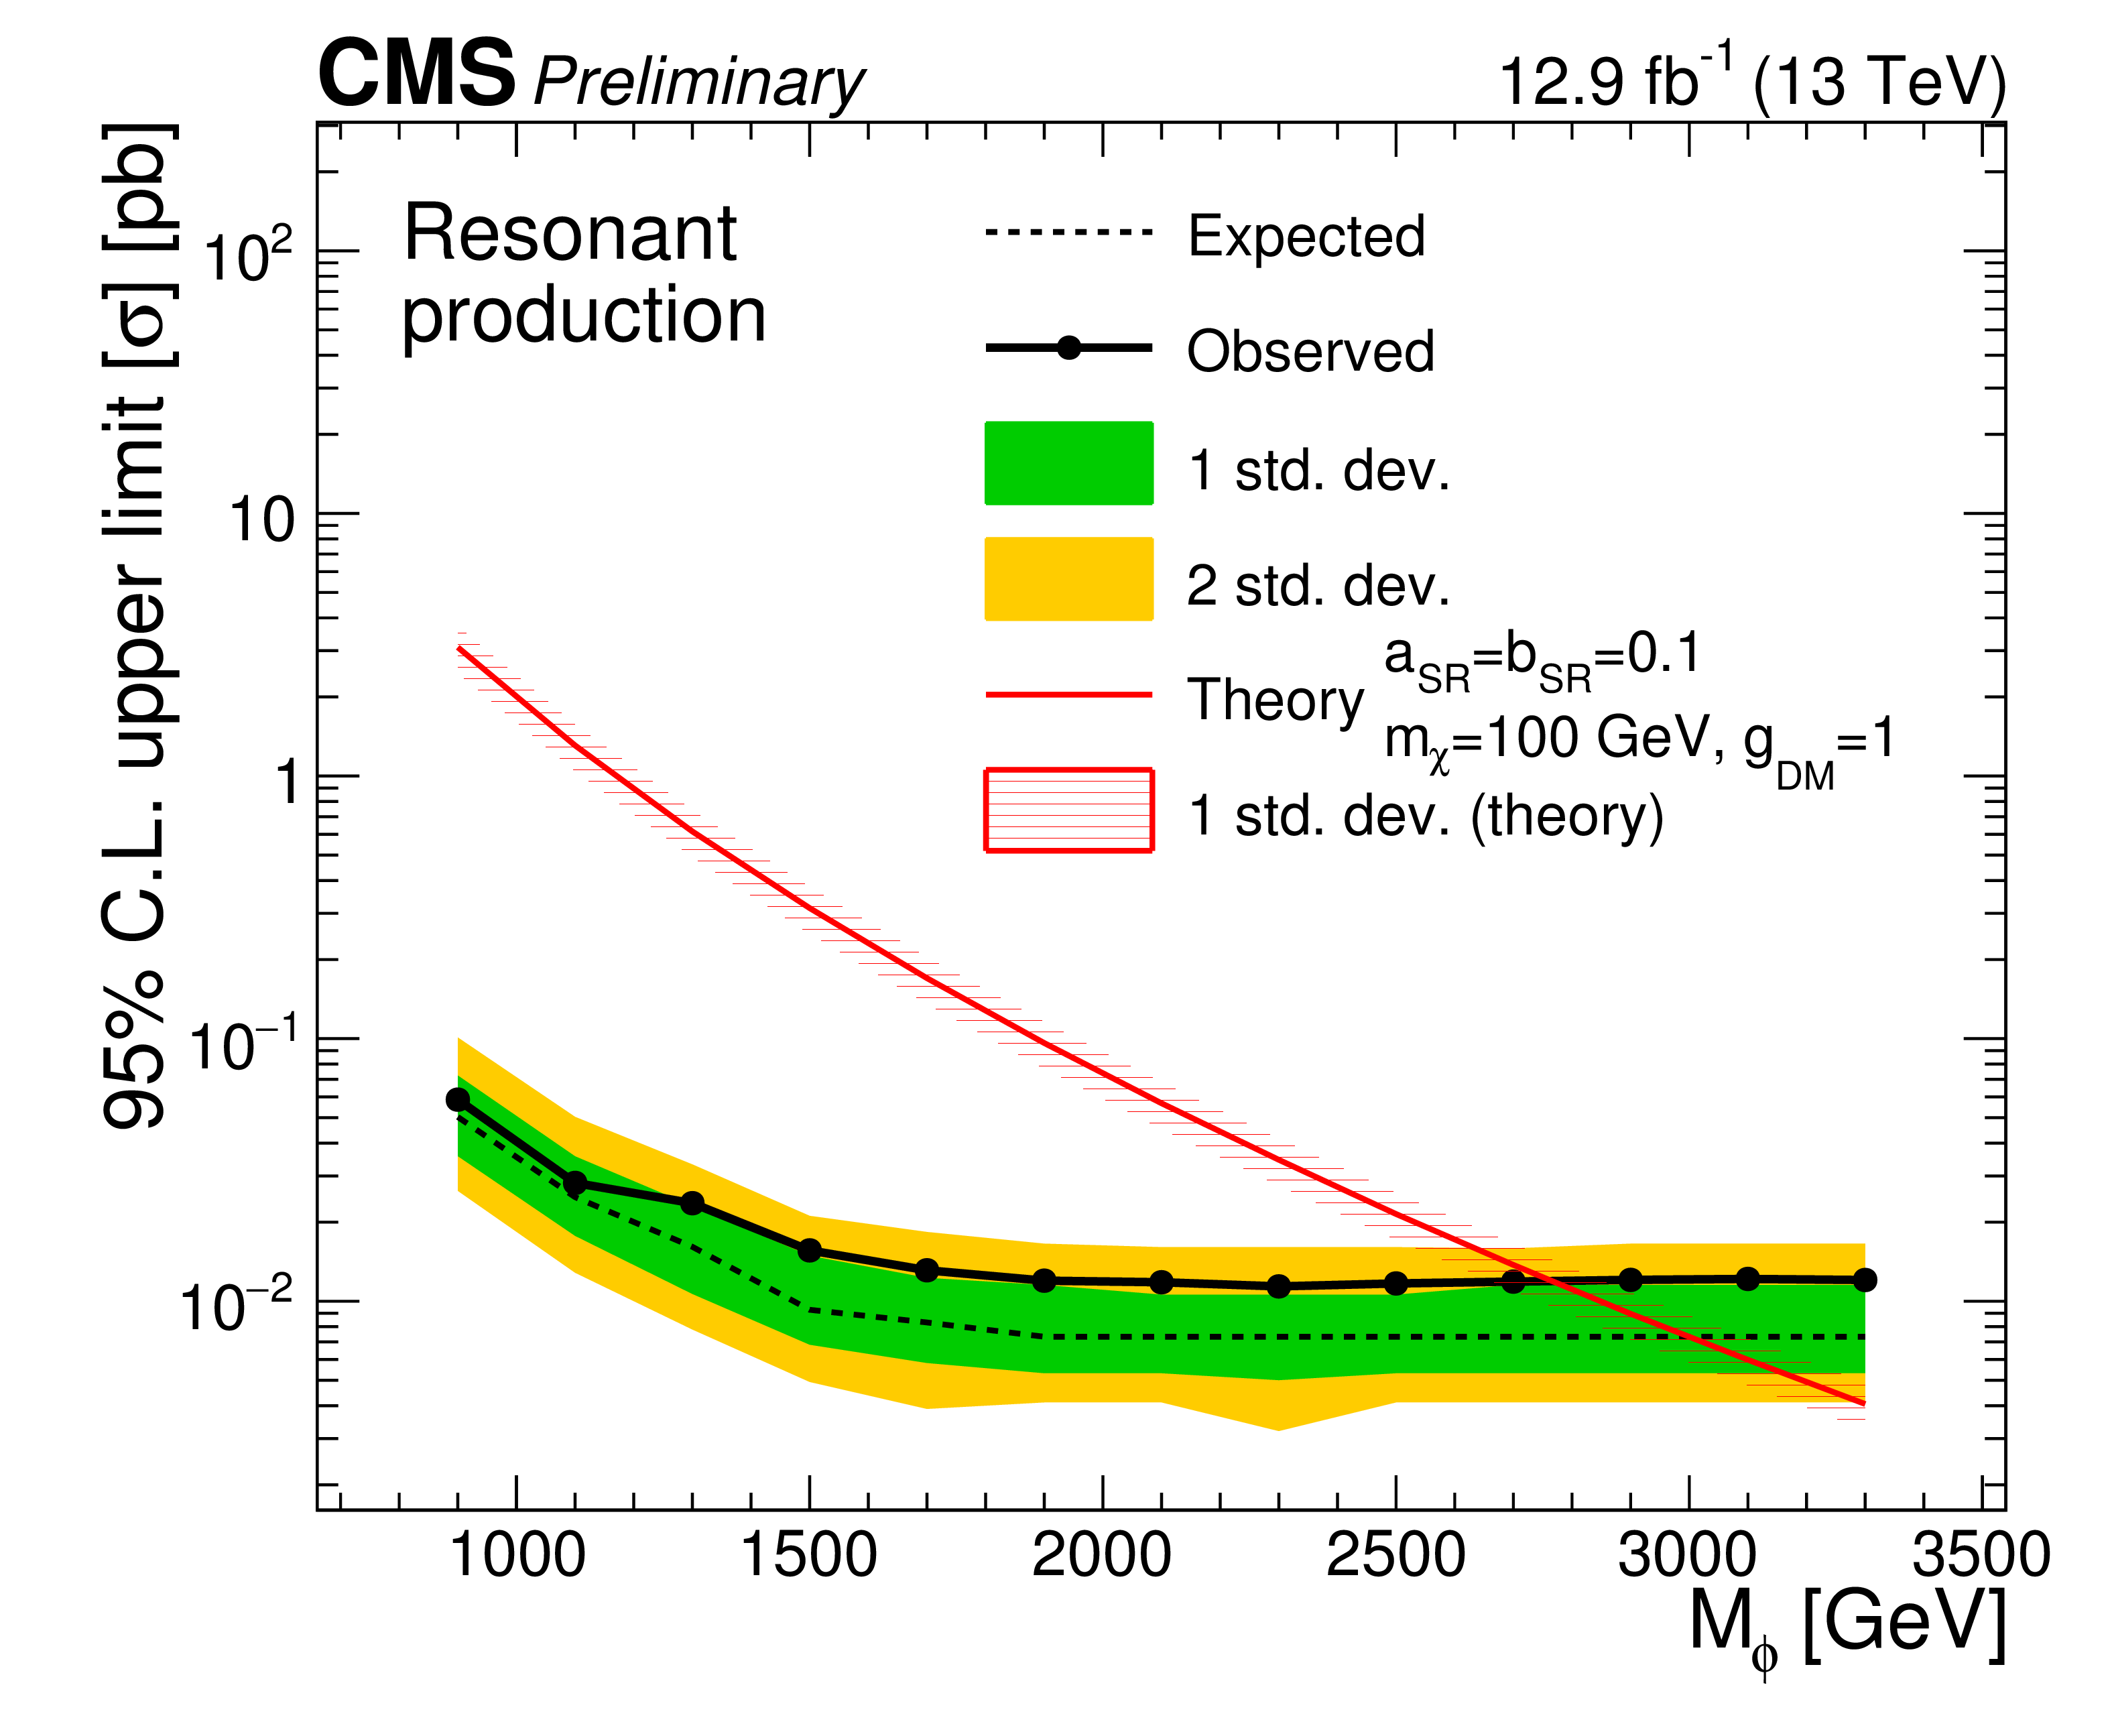
Figure 9-a:
Results assuming a resonant interpretation of the monotop signature. Shown are upper limits as a function of the mass of the scalar particle $S$, assuming fixed $a_\text {SR} = b_\text {SR}= $ 0.1. The limits are placed at a confidence level of 95%. a: limits on the inclusive cross section for monotop production; b: limits on $\sigma /\sigma _\text {theory}$. The green and yellow bands represent 1 and 2 standard deviations of experimental uncertainties, respectively. The red shaded band represents the 20% signal cross-section uncertainty. |
png pdf |
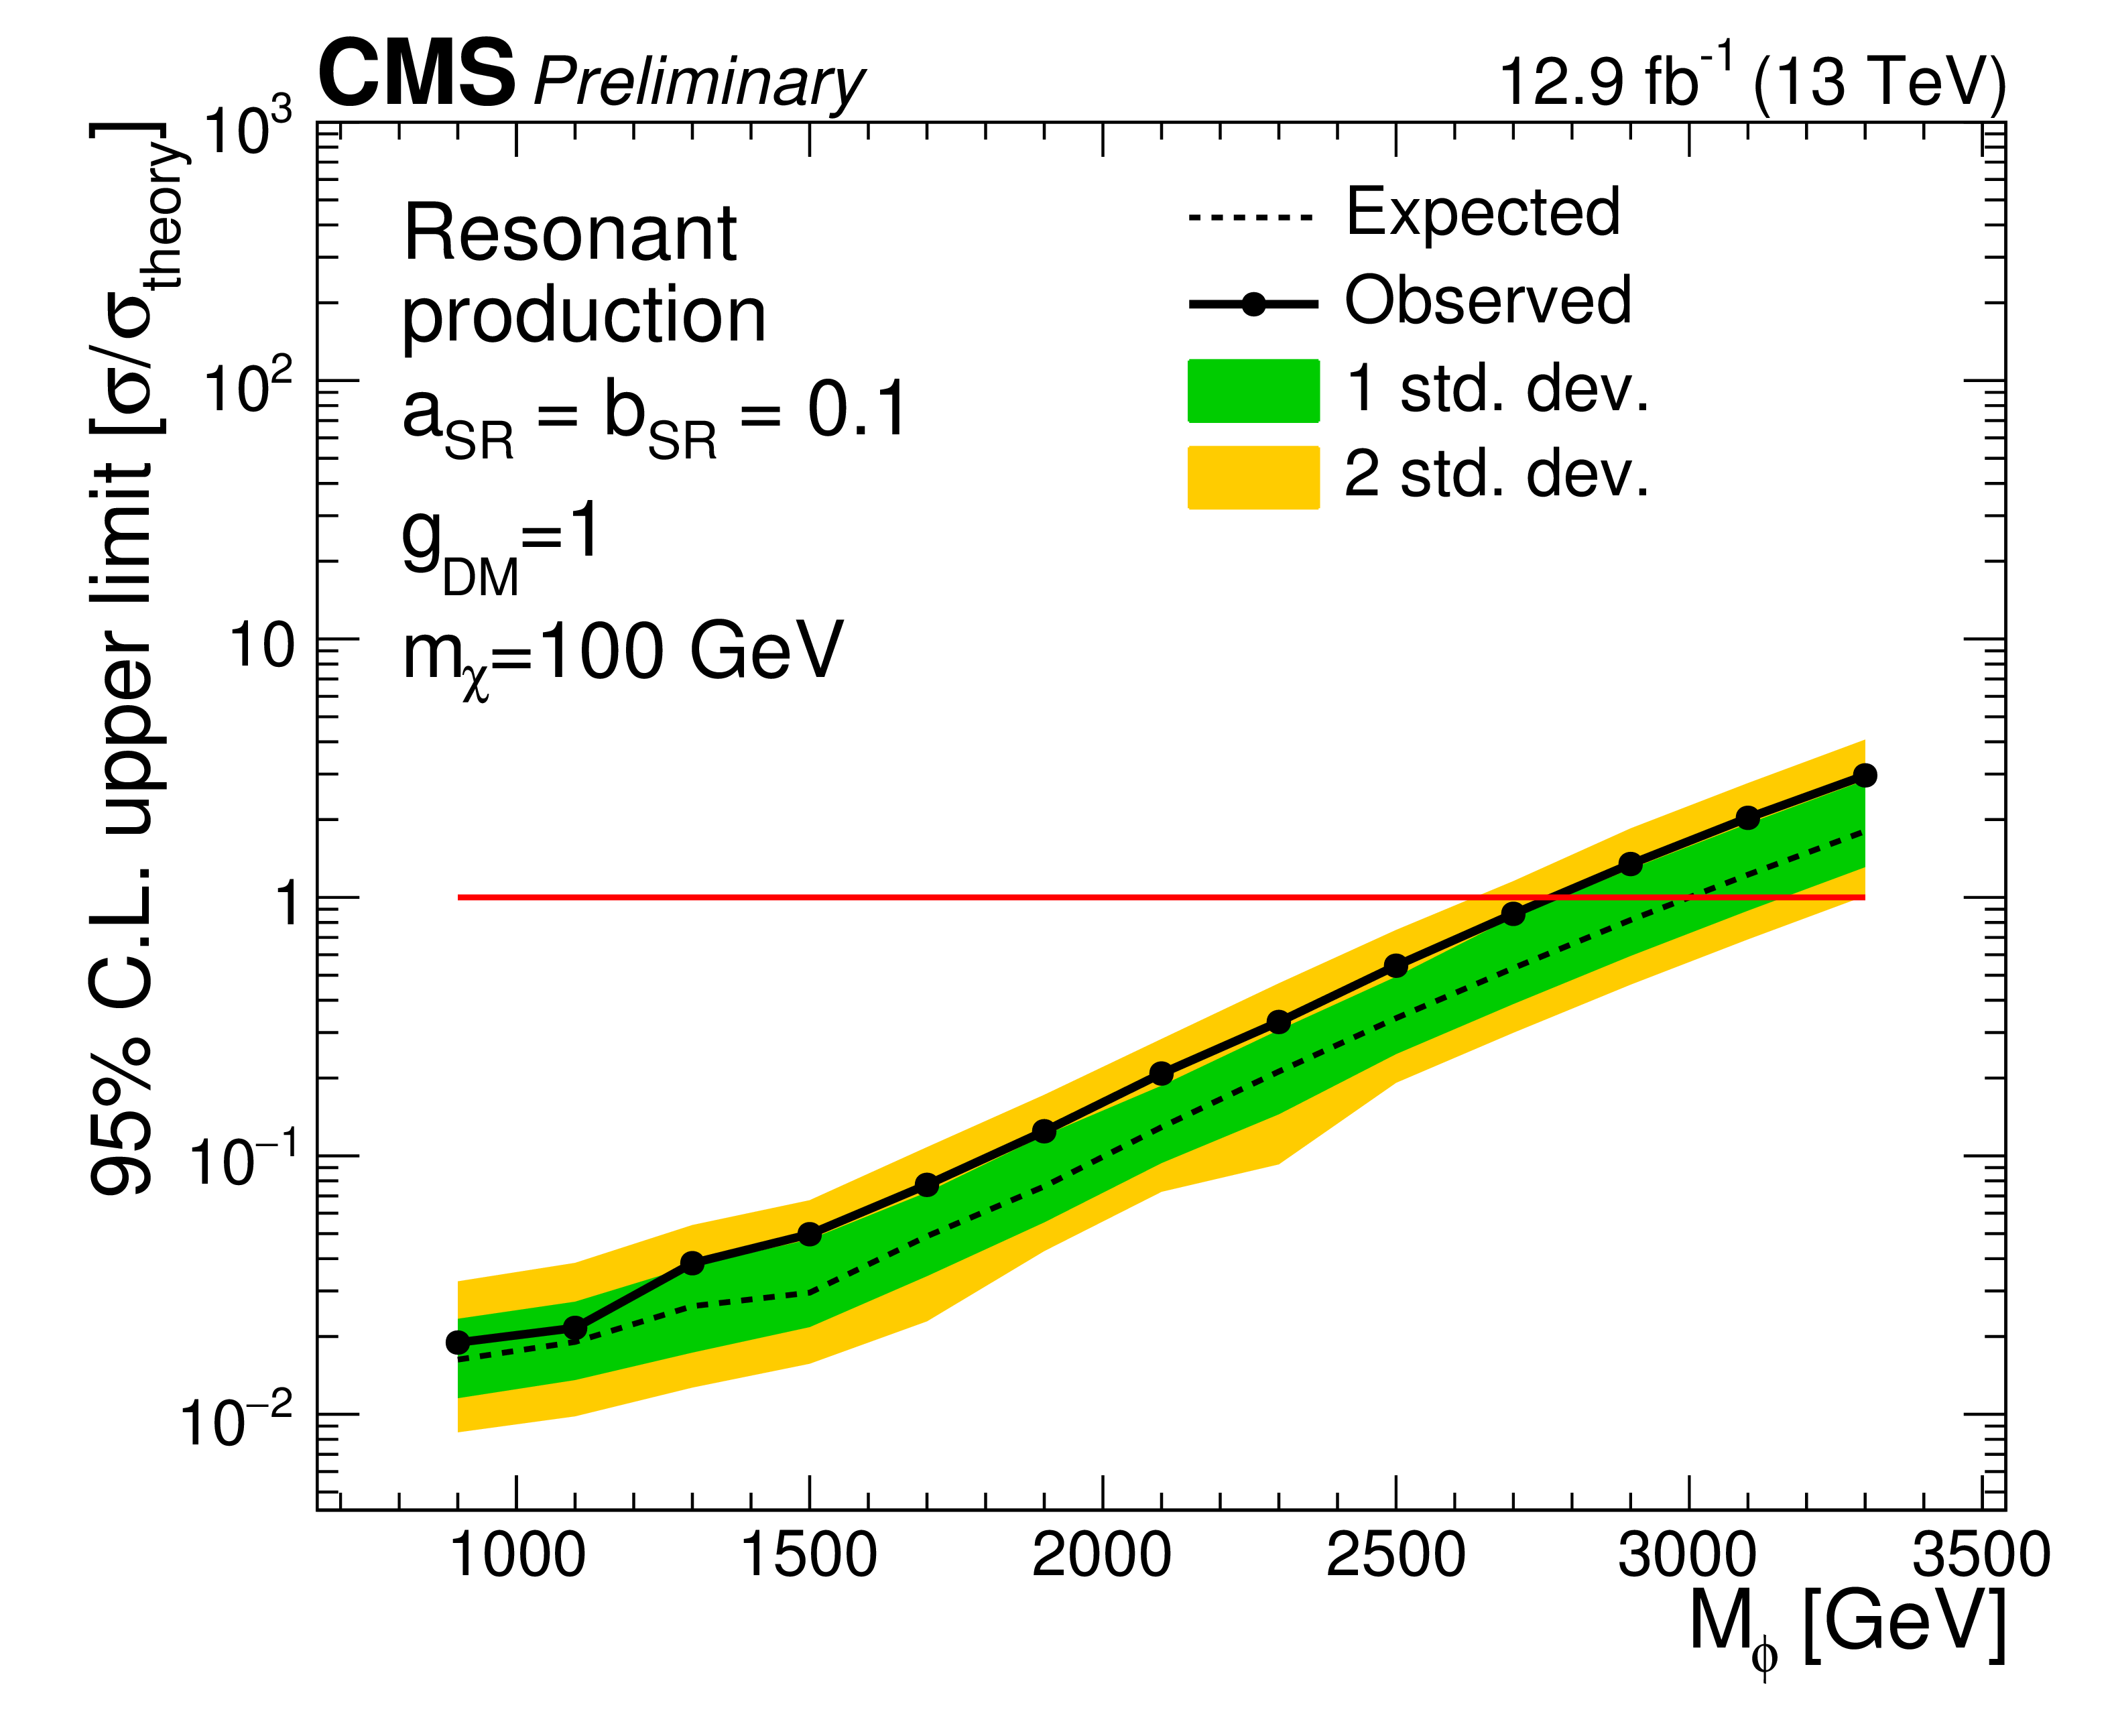
Figure 9-b:
Results assuming a resonant interpretation of the monotop signature. Shown are upper limits as a function of the mass of the scalar particle $S$, assuming fixed $a_\text {SR} = b_\text {SR}= $ 0.1. The limits are placed at a confidence level of 95%. a: limits on the inclusive cross section for monotop production; b: limits on $\sigma /\sigma _\text {theory}$. The green and yellow bands represent 1 and 2 standard deviations of experimental uncertainties, respectively. The red shaded band represents the 20% signal cross-section uncertainty. |
| Summary |
| A search for dark matter in the monotop final state is performed. The data is found to be in agreement with the Standard Model prediction. Results are interpreted in terms of dark matter particles produced via a neutral flavor-changing interaction or via the decay of a colored, scalar resonance together with a single top quark. For the non-resonant model, assuming $m_\chi = 10 \gev$ and $a_\text{FC}=b_\text{FC}=$ 0.25, flavor-changing neutral currents of $m_V < $ 1.5 TeV are excluded at 95% confidence level, compared to an expected exclusion of $m_V<1.7 TeV$. For the resonant model, scalar fields with $M_\phi < $ 2.7 TeV are excluded at 95% confidence level, compared to an expected exclusion of $m_V < $ 3.0 TeV. This extends the previous limit on the resonant model, which was set at $M_\phi =$ 1.6 TeV [5]. |
| References | ||||
| 1 | LUX Collaboration | Improved Limits on Scattering of Weakly Interacting Massive Particles from Reanalysis of 2013 LUX Data | PRL 116 (2016), no. 16, 161301 | 1512.03506 |
| 2 | J. Andrea, B. Fuks, and F. Maltoni | Monotops at the LHC | PRD84 (2011) 074025 | 1106.6199 |
| 3 | CDF Collaboration | Search for a Dark Matter Candidate Produced in Association with a Single Top Quark in $ p\overline{p} $ Collisions at $ \sqrt{s}=1.96\text{ }\text{ }\mathrm{TeV} $ | PRL 108 (May, 2012) 201802 | |
| 4 | CMS Collaboration | Search for Monotop Signatures in Proton-Proton Collisions at $ \sqrt{s}=8\text{ }\text{ }\mathrm{TeV} $ | PRL 114 (Mar, 2015) 101801 | |
| 5 | CMS Collaboration | Search for monotop in the muon channel in proton-proton collisions at 8 TeV | ||
| 6 | CMS Collaboration | Search for dark matter in association with a boosted top quark in the all hadronic final state | CMS-PAS-EXO-16-017 | CMS-PAS-EXO-16-017 |
| 7 | ATLAS Collaboration | Search for invisible particles produced in association with single-top-quarks in proton-proton collisions at $ \sqrt{s}=8\text{ }\text{ }\mathrm{TeV} $ with the ATLAS detector | EPJC 75 (2015) 79 | |
| 8 | I. Boucheneb, G. Cacciapaglia, A. Deandrea, and B. Fuks | Revisiting monotop production at the LHC | JHEP 01 (2015) 1--24 | |
| 9 | D. Abercrombie et al. | Dark Matter Benchmark Models for Early LHC Run-2 Searches: Report of the ATLAS/CMS Dark Matter Forum | 1507.00966 | |
| 10 | CMS Collaboration | The CMS experiment at the CERN LHC | JINST 3 (2008) S08004 | CMS-00-001 |
| 11 | CMS Collaboration | Particle--Flow Event Reconstruction in CMS and Performance for Jets, Taus, and $ E_{\mathrm{T}}^{\text{miss}} $ | CDS | |
| 12 | M. Cacciari, G. P. Salam, and G. Soyez | The Anti-k(t) jet clustering algorithm | JHEP 04 (2008) 063 | 0802.1189 |
| 13 | CMS Collaboration | A Cambridge-Aachen (C-A) based Jet Algorithm for boosted top-jet tagging | CDS | |
| 14 | D. Bertolini, P. Harris, M. Low, and N. Tran | Pileup per particle identification | JHEP 10 (2014) 1--22 | 1407.6013 |
| 15 | CMS Collaboration | Determination of jet energy calibration and transverse momentum resolution in CMS | JINST 6 (November, 2011) 11002 | CMS-JME-10-011 1107.4277 |
| 16 | A. Larkoski, S. Marzani, G. Soyez, and J. Thaler | Soft drop | JHEP 146 (2014) | 1402.2657 |
| 17 | CMS Collaboration | Identification of b-quark jets with the CMS experiment | JINST 8 (2012) P04013 | |
| 18 | CMS Collaboration | Performance of b tagging at $ \sqrt{s} = 8 $$ TeV $ in multijet, $ \mathrm{t}\bar{\mathrm{t}} $, and boosted topology events. | CMS-PAS-BTV-13-001 | CMS-PAS-BTV-13-001 |
| 19 | J. Thaler and K. Tilburg | Identifying boosted objects with N-subjettiness | JHEP 03 (2011) 015 | 1011.2268 |
| 20 | CMS Collaboration | Reconstruction and identification of $ \tau $ lepton decays to hadrons and $ \nu_\tau $ at CMS | JINST 11 (2015) P01019 | |
| 21 | J. Alwall et al. | The automated computation of tree-level and next-to-leading order differential cross sections, and their matching to parton shower simulations | JHEP 1407 (2014) 079 | 1405.0301 |
| 22 | C. Oleari | The POWHEG BOX | Nuclear Physics B Proceedings Supplements 205 (August, 2010) 36--41 | 1007.3893 |
| 23 | T. Sj\"ostrand et al. | An Introduction to PYTHIA 8.2 | CPC 191 (2015) 159--177 | 1410.3012 |
| 24 | M. L. Mangano, M. Moretti, F. Piccinini, and M. Treccani | Matching matrix elements and shower evolution for top-quark production in hadronic collisions | JHEP 0701 (2007) 013 | hep-ph/0611129 |
| 25 | S. Agostinelli, J. Allison, K. Amako et al. | Geant4 - a simulation toolkit | Nucl.Instrum.Meth. 506 (2003), no. 3, 250 -- 303 | |
| 26 | CMS Collaboration | Performance of Photon Reconstruction and Identification with the CMS Detector in Proton-Proton Collisions at sqrt(s) = 8 TeV | JINST 10 (2015), no. 08, P08010 | CMS-EGM-14-001 1502.02702 |
| 27 | CMS Collaboration | Data-Driven Estimation of the Invisible Z Backgrund to the SUSY MET Plus Jets Search | Technical Report CMS-PAS-SUS-08-002, CERN, Geneva | |
| 28 | J. H. Kuhn, A. Kulesza, S. Pozzorini, and M. Schulze | Electroweak corrections to hadronic photon production at large transverse momenta | JHEP 03 (2006) 059 | hep-ph/0508253 |
| 29 | S. Kallweit et al. | NLO electroweak automation and precise predictions for W+multijet production at the LHC | JHEP 04 (2015) 012 | 1412.5157 |
| 30 | S. Kallweit et al. | NLO QCD+EW automation and precise predictions for V+multijet production | in 50th Rencontres de Moriond on QCD and High Energy Interactions La Thuile, Italy, March 21-28, 2015 2015 | 1505.05704 |
| 31 | S. Kallweit et al. | NLO QCD+EW predictions for V + jets including off-shell vector-boson decays and multijet merging | JHEP 04 (2016) 021 | 1511.08692 |
| 32 | NNPDF Collaboration | Parton distributions for the LHC Run II | JHEP 04 (2015) 040 | 1410.8849 |
| 33 | CMS Collaboration | Differential cross section measurements for the production of a W boson in association with jets in proton–proton collisions at $ \sqrt s=7 $ TeV | PLB741 (2015) 12--37 | CMS-SMP-12-023 1406.7533 |
| 34 | CMS Collaboration | Measurement of the production cross section for a W boson and two b jets in pp collisions at $ \sqrt{s} $=7 TeV | PLB735 (2014) 204--225 | CMS-SMP-12-026 1312.6608 |
| 35 | CMS Collaboration | Measurements of jet multiplicity and differential production cross sections of $ Z + $ jets events in proton-proton collisions at $ \sqrt{s} = $ 7 TeV | PRD91 (2015), no. 5, 052008 | CMS-SMP-12-017 1408.3104 |
| 36 | CMS Collaboration | Measurement of the production cross sections for a Z boson and one or more b jets in pp collisions at sqrt(s) = 7 TeV | JHEP 06 (2014) 120 | CMS-SMP-13-004 1402.1521 |
| 37 | CMS Collaboration | First measurement of the differential cross section for ttbar production in the dilepton final state at $ \sqrt{s} $=13 TeV | CMS-PAS-TOP-15-010 | CMS-PAS-TOP-15-010 |
| 38 | CMS Collaboration | Measurement of the ZZ production cross section in $ \ell\ell\ell'\ell' $ decays in pp collisions at $ \sqrt{s} = 13 $ TeV | CMS-PAS-SMP-15-005 | CMS-PAS-SMP-15-005 |
| 39 | CMS Collaboration | Measurement of the WZ production cross section in pp collisions at $ \sqrt{s} = 13 $ TeV | CMS-PAS-SMP-15-006 | CMS-PAS-SMP-15-006 |
| 40 | CMS Collaboration | Performance of the CMS missing transverse momentum reconstruction in pp data at $ \sqrt{s} $ = 8 TeV | JINST 10 (2015), no. 02, P02006 | CMS-JME-13-003 1411.0511 |
| 41 | A. L. Read | Presentation of search results: the CLs technique | Journal of Physics G: Nuclear and Particle Physics 28 (2002), no. 10 | |
|
|
Compact Muon Solenoid LHC, CERN |
|

|

|

|

|

|