

Compact Muon Solenoid
LHC, CERN
| CMS-PAS-EXO-17-004 | ||
| Search for long-lived particles that stop in the CMS detector and decay to muons at $\sqrt{s}= $ 13 TeV | ||
| CMS Collaboration | ||
| July 2017 | ||
| Abstract: A search for long-lived particles that are produced in proton-proton collisions at the CERN LHC, come to rest in the CMS detector, and decay to muons is presented. The decays of stopped particles could be observed during the intervals between LHC beam crossings, at times well separated from any proton-proton collisions. The analysis uses 39 fb$^{-1}$ of $\sqrt{s}= $ 13 TeV data collected by CMS in 2015 and 2016, during a search interval totaling 744 hours of trigger livetime. The results are interpreted with one model that predicts a long-lived gluino and another model that predicts a long-lived particle that has twice the electron charge and that behaves like a lepton. Cross section limits are set as a function of lifetime and as a function of mass, for lifetimes between 100 ns and 10 days. This is the first search for stopped particles that decay to muons at the LHC. | ||
| Links: CDS record (PDF) ; inSPIRE record ; CADI line (restricted) ; | ||
| Figures | |

png pdf |
Figure 1:
The stopping efficiency per particle as a function of mass for gluinos and mchamps. The mchamps have $|Q|=2e$. |
png pdf |
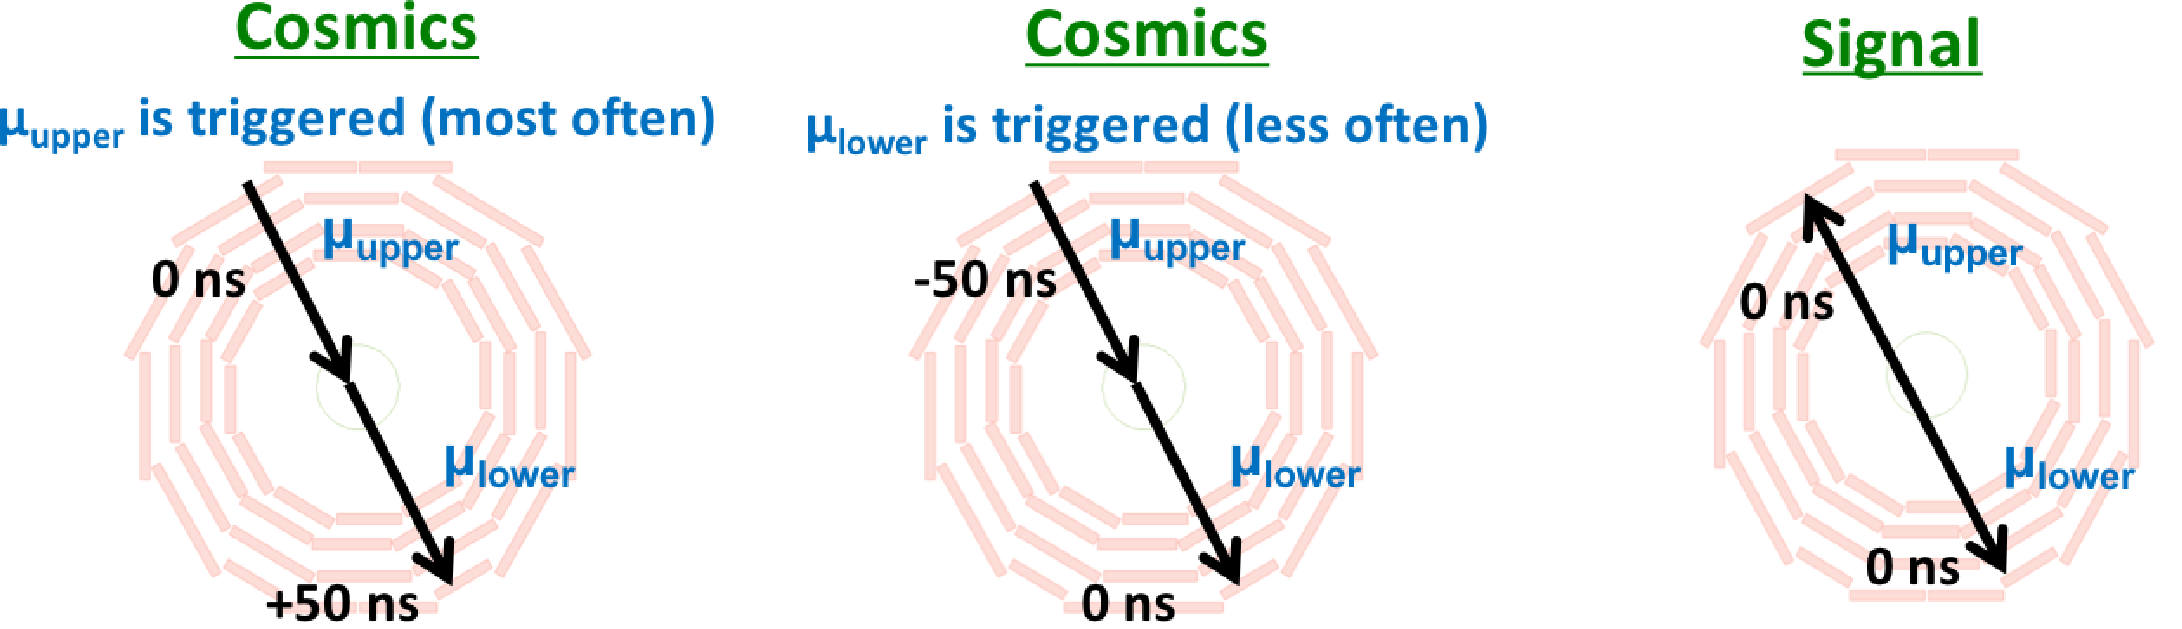
Figure 2:
A diagram showing the typical direction and the corresponding $t_{\mathrm {DT}}$ values of muons coming from cosmic muon background (left) and signal (right). This is a simple schematic and does not necessarily reflect how close the muons would come to the beamspot. Furthermore, the muons from the signal are not necessarily back-to-back. |
png pdf |
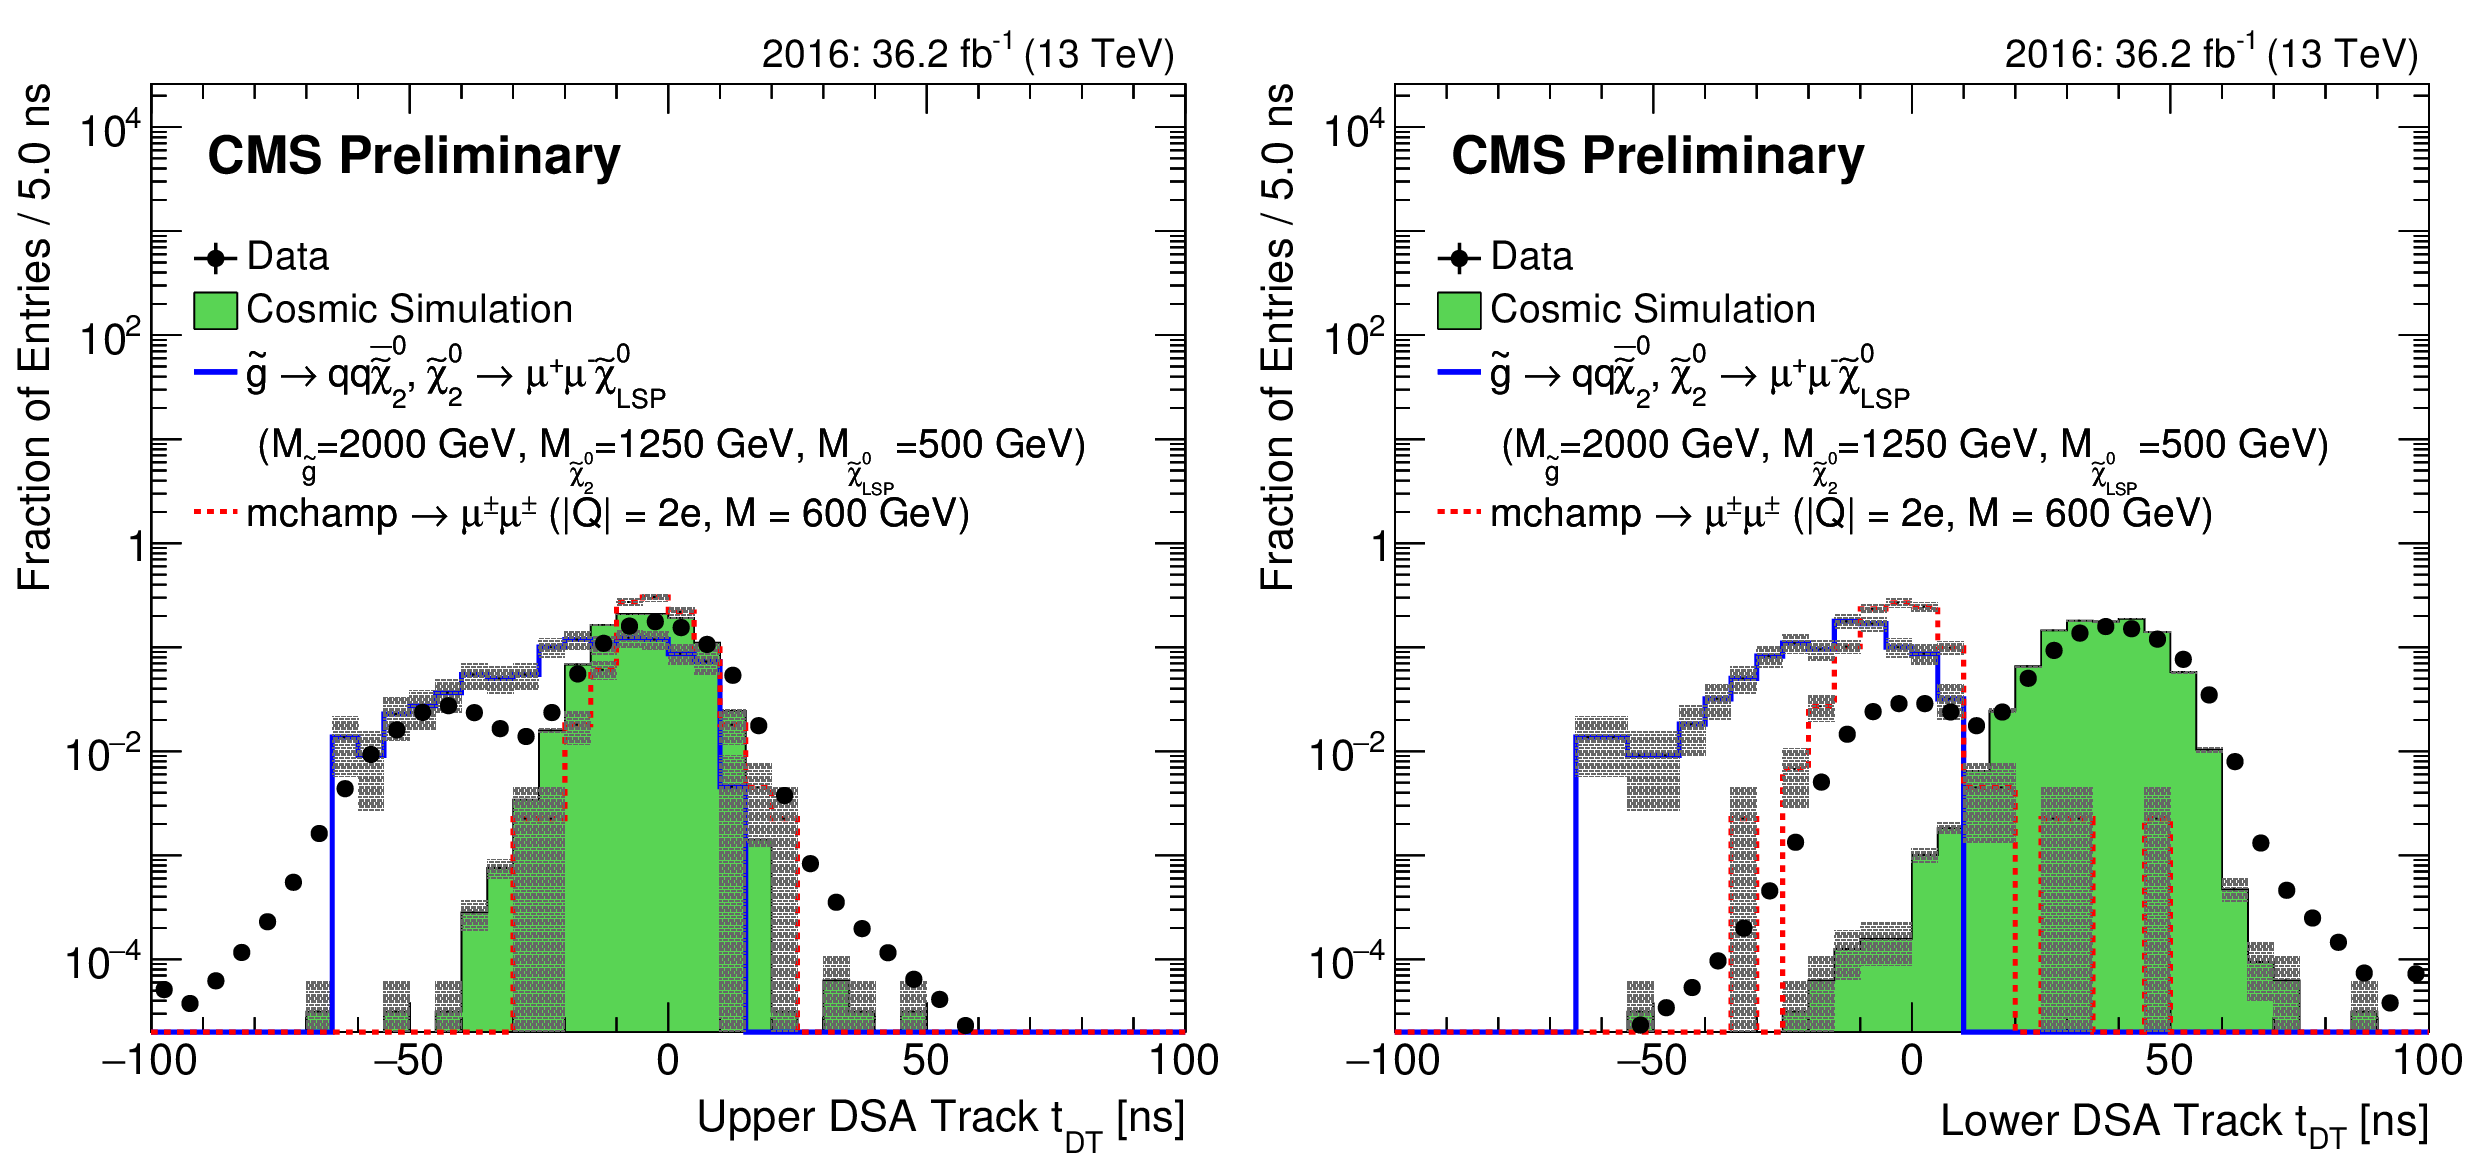
Figure 3:
DSA muon track $t_{\mathrm {DT}}$ for 2016 search sample data, cosmic muon MC simulation, 2000 GeV gluinos, and 600 GeV mchamps. $t_{\mathrm {DT}}$ of the upper (left) and lower (right) hemisphere DSA tracks is plotted. The events plotted pass a subset of the full analysis selection that is designed to select good quality DSA muon tracks but does not reject the cosmic muon background (see Section 5). The gluino and mchamp distributions are not exactly the same because the two muons from the mchamp decay are back-to-back, but the two muons from the gluino decay are not. The grey bands indicate the statistical uncertainty in the simulation. The histograms are normalized to unit area. |
png pdf |
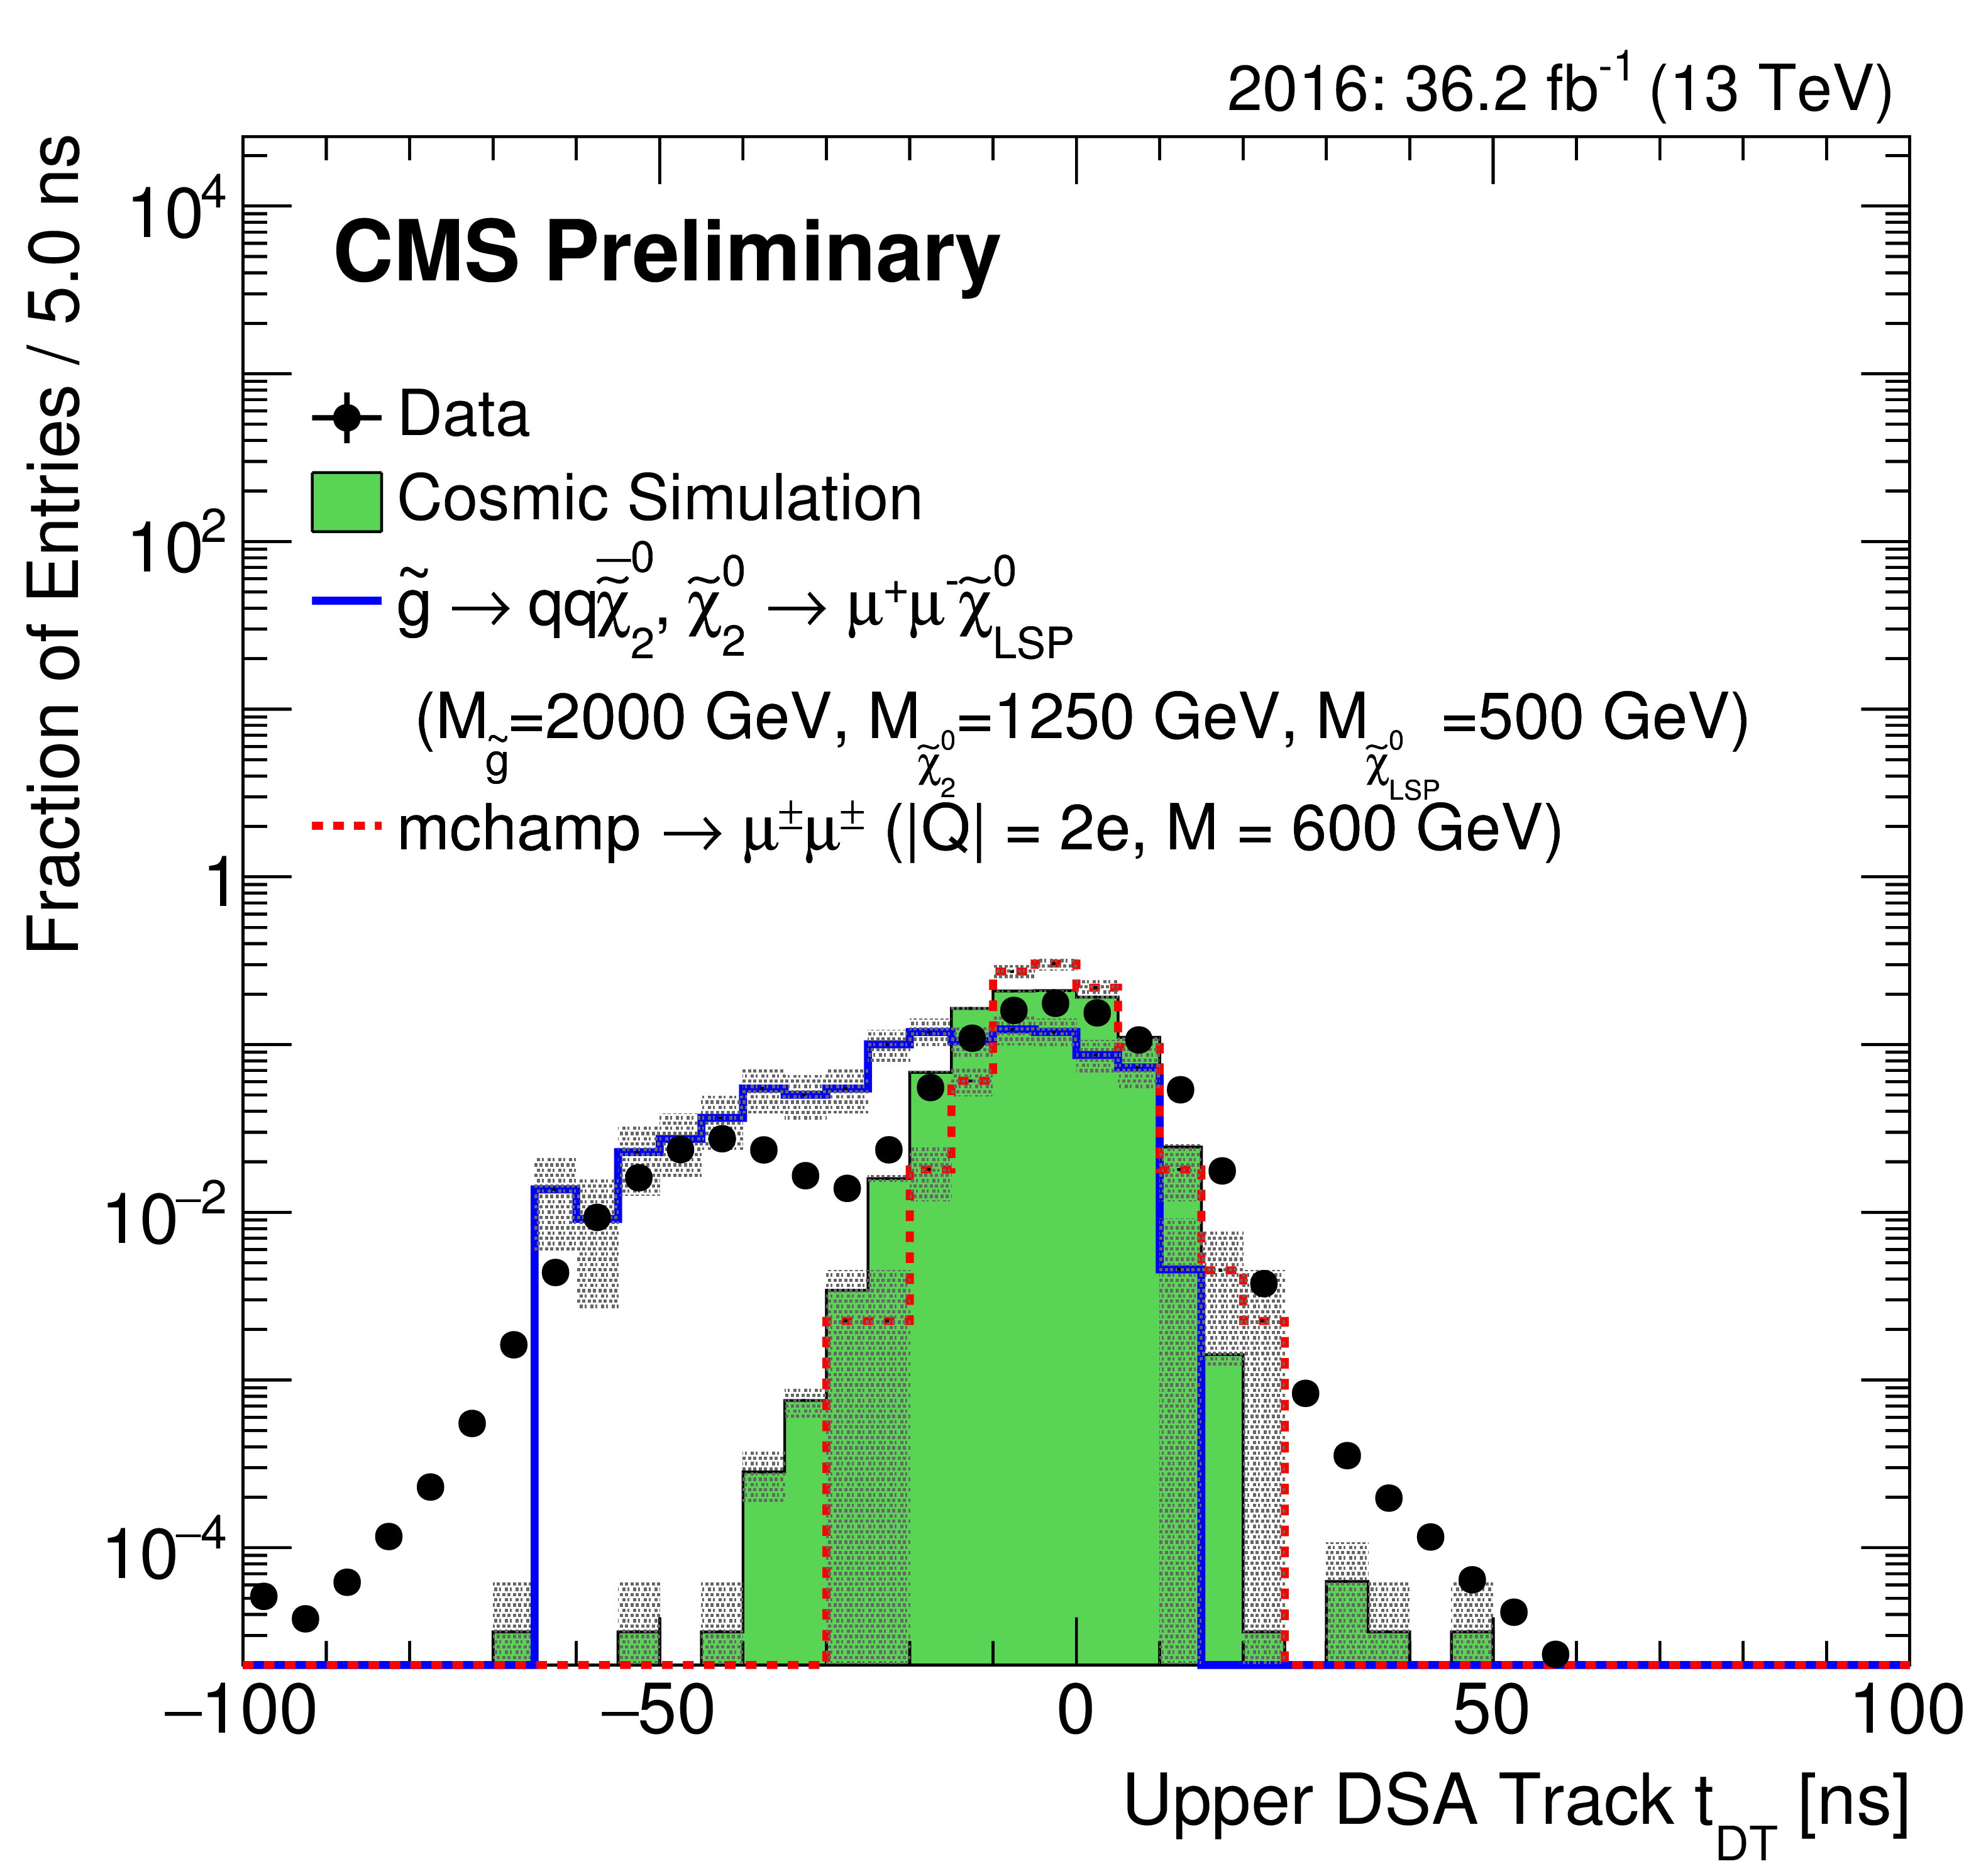
Figure 3-a:
DSA muon track $t_{\mathrm {DT}}$ for 2016 search sample data, cosmic muon MC simulation, 2000 GeV gluinos, and 600 GeV mchamps. $t_{\mathrm {DT}}$ of the upper hemisphere DSA tracks is plotted. The events plotted pass a subset of the full analysis selection that is designed to select good quality DSA muon tracks but does not reject the cosmic muon background (see Section 5). The gluino and mchamp distributions are not exactly the same because the two muons from the mchamp decay are back-to-back, but the two muons from the gluino decay are not. The grey bands indicate the statistical uncertainty in the simulation. The histograms are normalized to unit area. |

png pdf |
Figure 3-b:
DSA muon track $t_{\mathrm {DT}}$ for 2016 search sample data, cosmic muon MC simulation, 2000 GeV gluinos, and 600 GeV mchamps. $t_{\mathrm {DT}}$ of the lower hemisphere DSA tracks is plotted. The events plotted pass a subset of the full analysis selection that is designed to select good quality DSA muon tracks but does not reject the cosmic muon background (see Section 5). The gluino and mchamp distributions are not exactly the same because the two muons from the mchamp decay are back-to-back, but the two muons from the gluino decay are not. The grey bands indicate the statistical uncertainty in the simulation. The histograms are normalized to unit area. |

png pdf |
Figure 4:
A diagram showing the typical direction and thus, the sign of $\beta $ of muons coming from cosmic muon background (left) and signal (right). This is a simple schematic and does not necessarily reflect how close the muons would come to the beamspot. Furthermore, the muons from the signal are not necessarily back-to-back. |

png pdf |
Figure 5:
DSA muon track $\beta ^{-1}$ for 2016 search sample data, cosmic muon MC simulation, 2000 GeV gluinos, and 600 GeV mchamps. The $\beta ^{-1}$ of the upper (left) and lower (right) hemisphere DSA tracks is plotted. The events plotted pass a subset of the full analysis selection that is designed to select good quality DSA muon tracks but does not reject the cosmic muon background (see Section 5). The grey bands indicate the statistical uncertainty in the simulation. The histograms are normalized to unit area. |

png pdf |
Figure 5-a:
DSA muon track $\beta ^{-1}$ for 2016 search sample data, cosmic muon MC simulation, 2000 GeV gluinos, and 600 GeV mchamps. The $\beta ^{-1}$ of the upper hemisphere DSA tracks is plotted. The events plotted pass a subset of the full analysis selection that is designed to select good quality DSA muon tracks but does not reject the cosmic muon background (see Section 5). The grey bands indicate the statistical uncertainty in the simulation. The histograms are normalized to unit area. |

png pdf |
Figure 5-b:
DSA muon track $\beta ^{-1}$ for 2016 search sample data, cosmic muon MC simulation, 2000 GeV gluinos, and 600 GeV mchamps. The $\beta ^{-1}$ of the lower hemisphere DSA tracks is plotted. The events plotted pass a subset of the full analysis selection that is designed to select good quality DSA muon tracks but does not reject the cosmic muon background (see Section 5). The grey bands indicate the statistical uncertainty in the simulation. The histograms are normalized to unit area. |
png pdf |
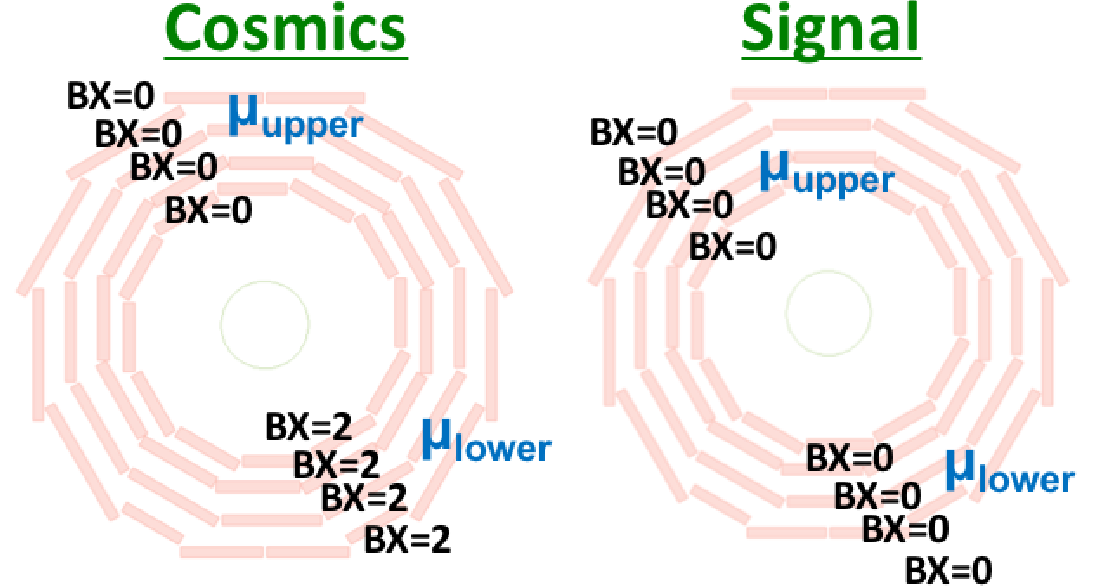
Figure 6:
A diagram showing the typical RPC BX assignments of muons coming from cosmic muon background (left) and signal (right). This is a simple schematic and does not necessarily reflect how close the muons would come to the beamspot. Furthermore, the muons from the signal are not necessarily back-to-back. |

png pdf |
Figure 7:
DSA muon track $t_{\mathrm {RPC}}$ for 2016 search sample data, cosmic muon MC simulation, 2000 GeV gluinos, and 600 GeV mchamps. $t_{\mathrm {RPC}}$ of the upper (left) and lower (right) hemisphere DSA tracks is plotted. The events plotted pass a subset of the full analysis selection that is designed to select good quality DSA muon tracks but does not reject the cosmic muon background (see Section 5). The grey bands indicate the statistical uncertainty in the simulation. The histograms are normalized to unit area. |

png pdf |
Figure 7-a:
DSA muon track $t_{\mathrm {RPC}}$ for 2016 search sample data, cosmic muon MC simulation, 2000 GeV gluinos, and 600 GeV mchamps. $t_{\mathrm {RPC}}$ of the upper hemisphere DSA tracks is plotted. The events plotted pass a subset of the full analysis selection that is designed to select good quality DSA muon tracks but does not reject the cosmic muon background (see Section 5). The grey bands indicate the statistical uncertainty in the simulation. The histograms are normalized to unit area. |
png pdf |
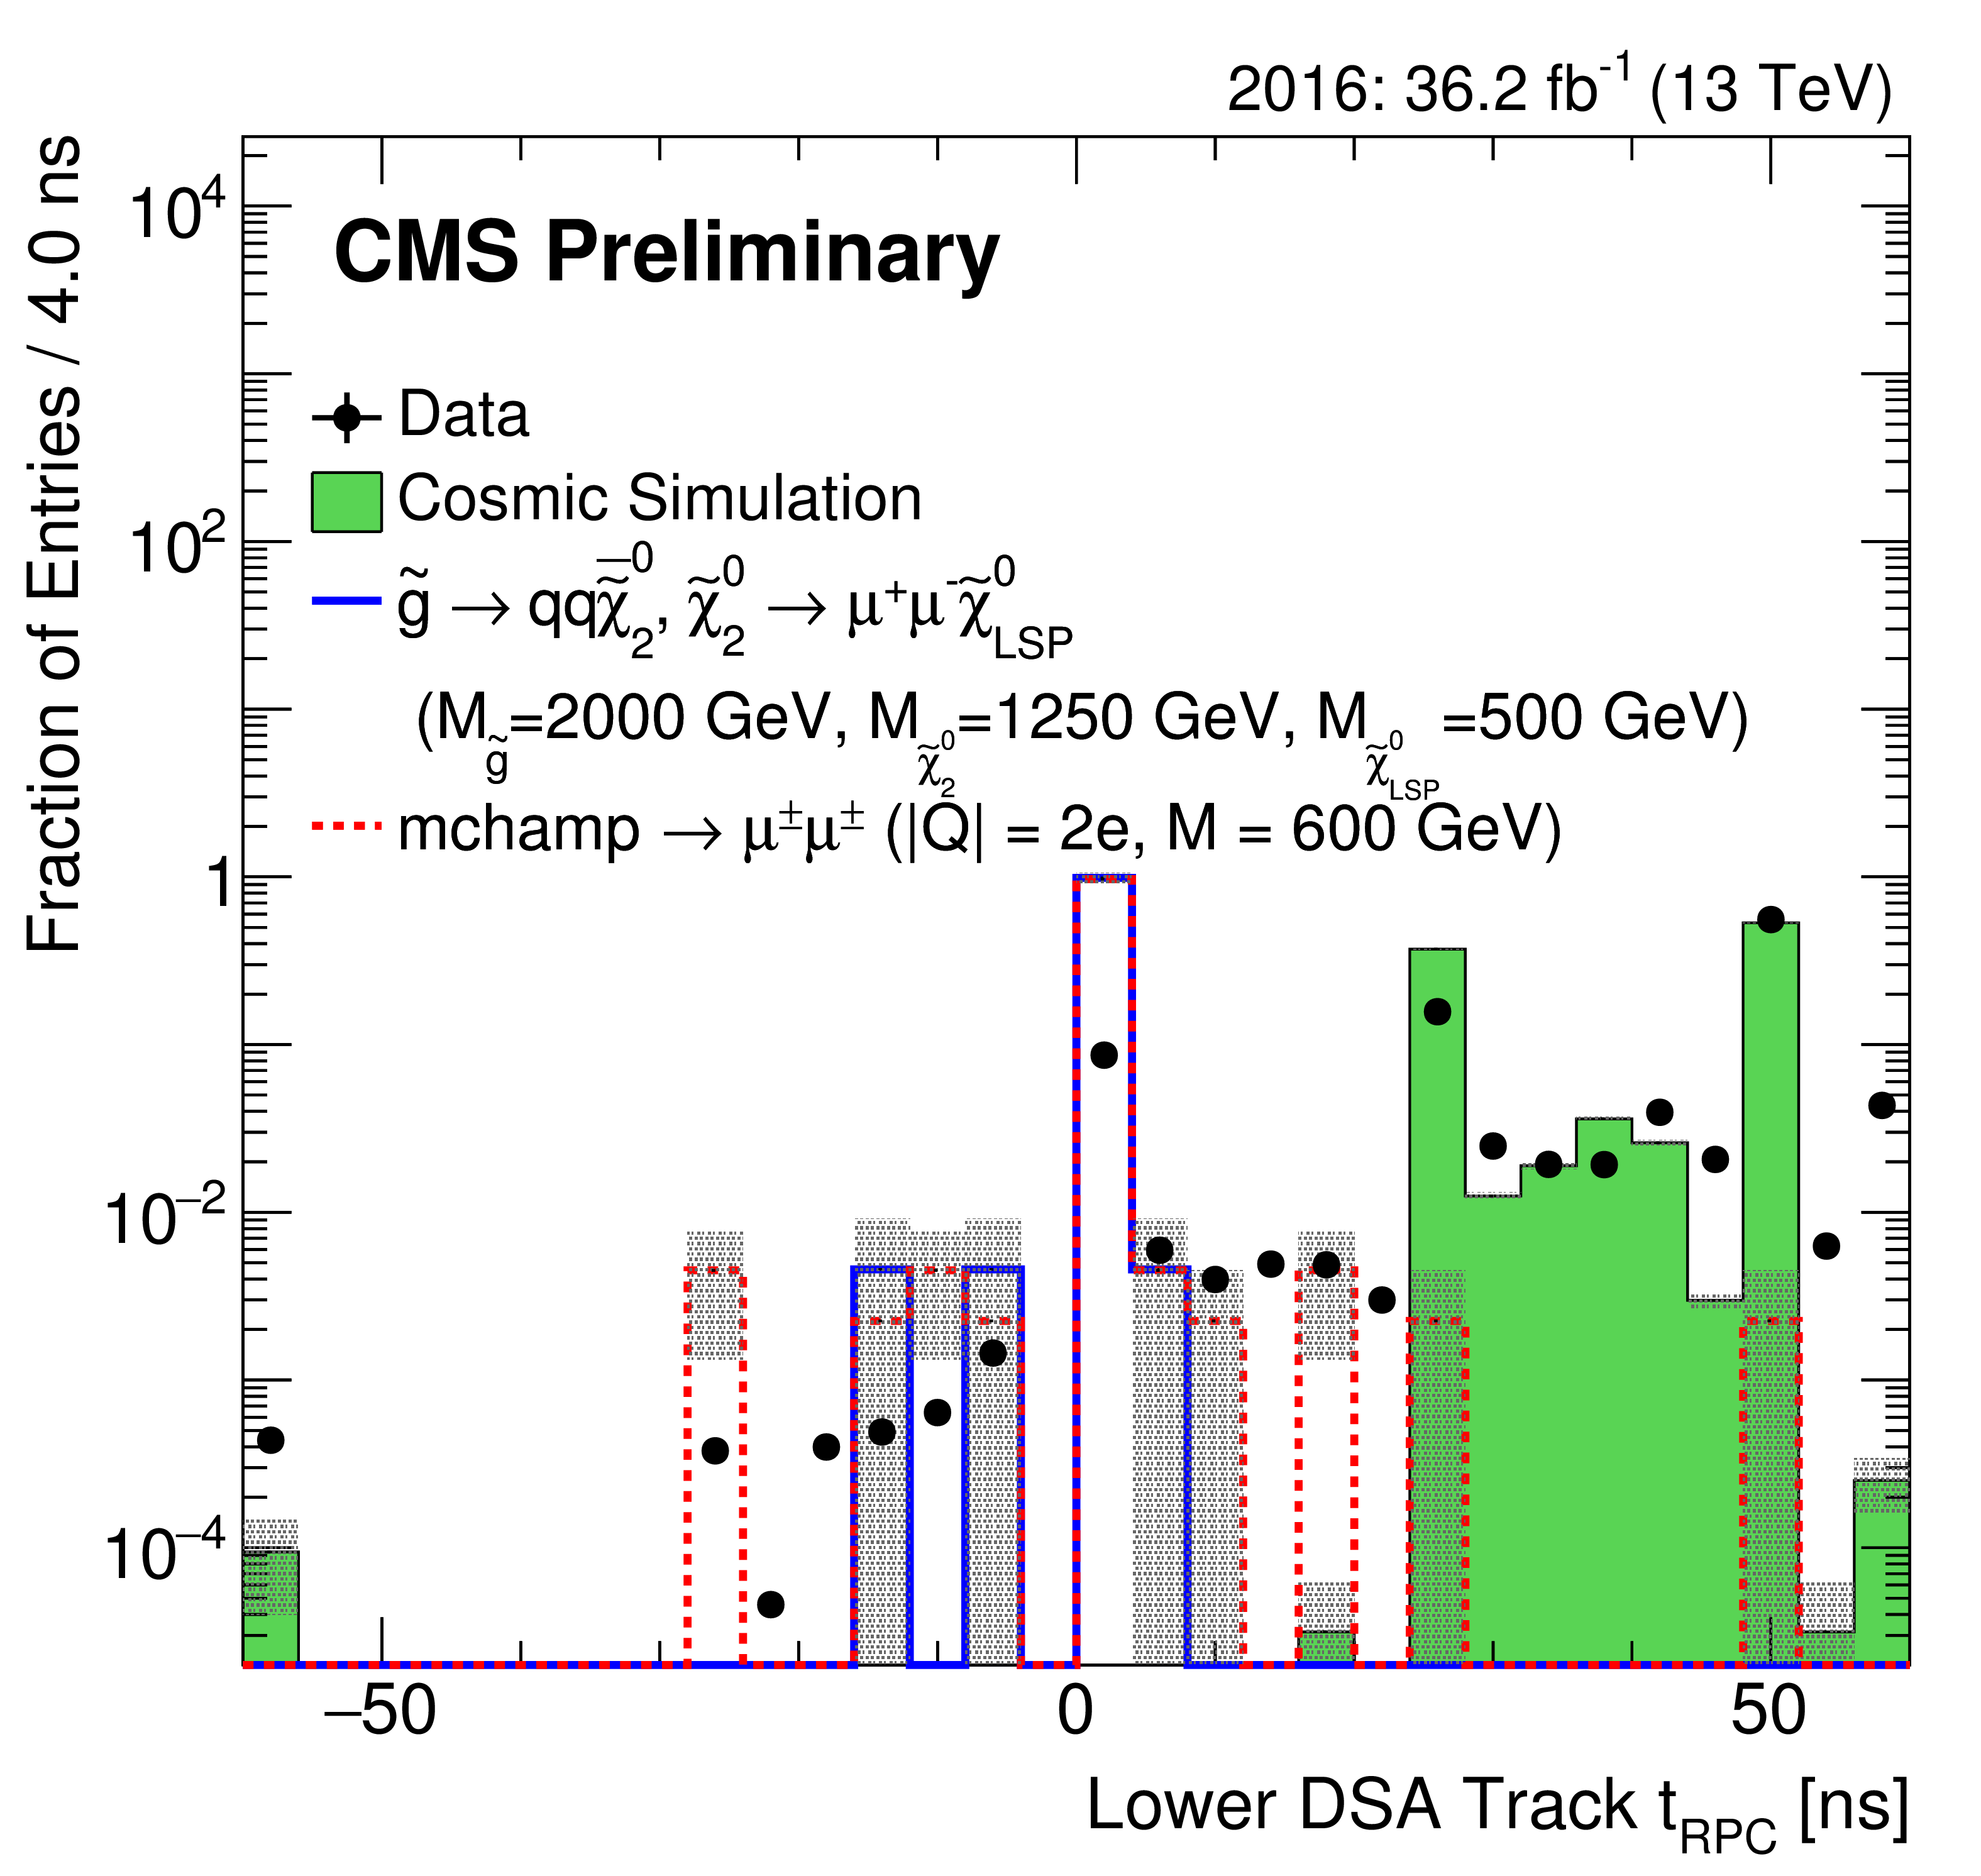
Figure 7-b:
DSA muon track $t_{\mathrm {RPC}}$ for 2016 search sample data, cosmic muon MC simulation, 2000 GeV gluinos, and 600 GeV mchamps. $t_{\mathrm {RPC}}$ of the lower hemisphere DSA tracks is plotted. The events plotted pass a subset of the full analysis selection that is designed to select good quality DSA muon tracks but does not reject the cosmic muon background (see Section 5). The grey bands indicate the statistical uncertainty in the simulation. The histograms are normalized to unit area. |

png pdf |
Figure 8:
DSA muon track $\Delta t_{\mathrm {DT}}$ (left) and $\Delta t_{\mathrm {RPC}}$ (right) for 2016 search sample data, cosmic muon MC simulation, 2000 GeV gluinos, and 600 GeV mchamps. The events plotted pass a subset of the full analysis selection that is designed to select good quality DSA muon tracks but does not reject the cosmic muon background (see Section 5). The grey bands indicate the statistical uncertainty in the simulation. The histograms are normalized to unit area. |
png pdf |
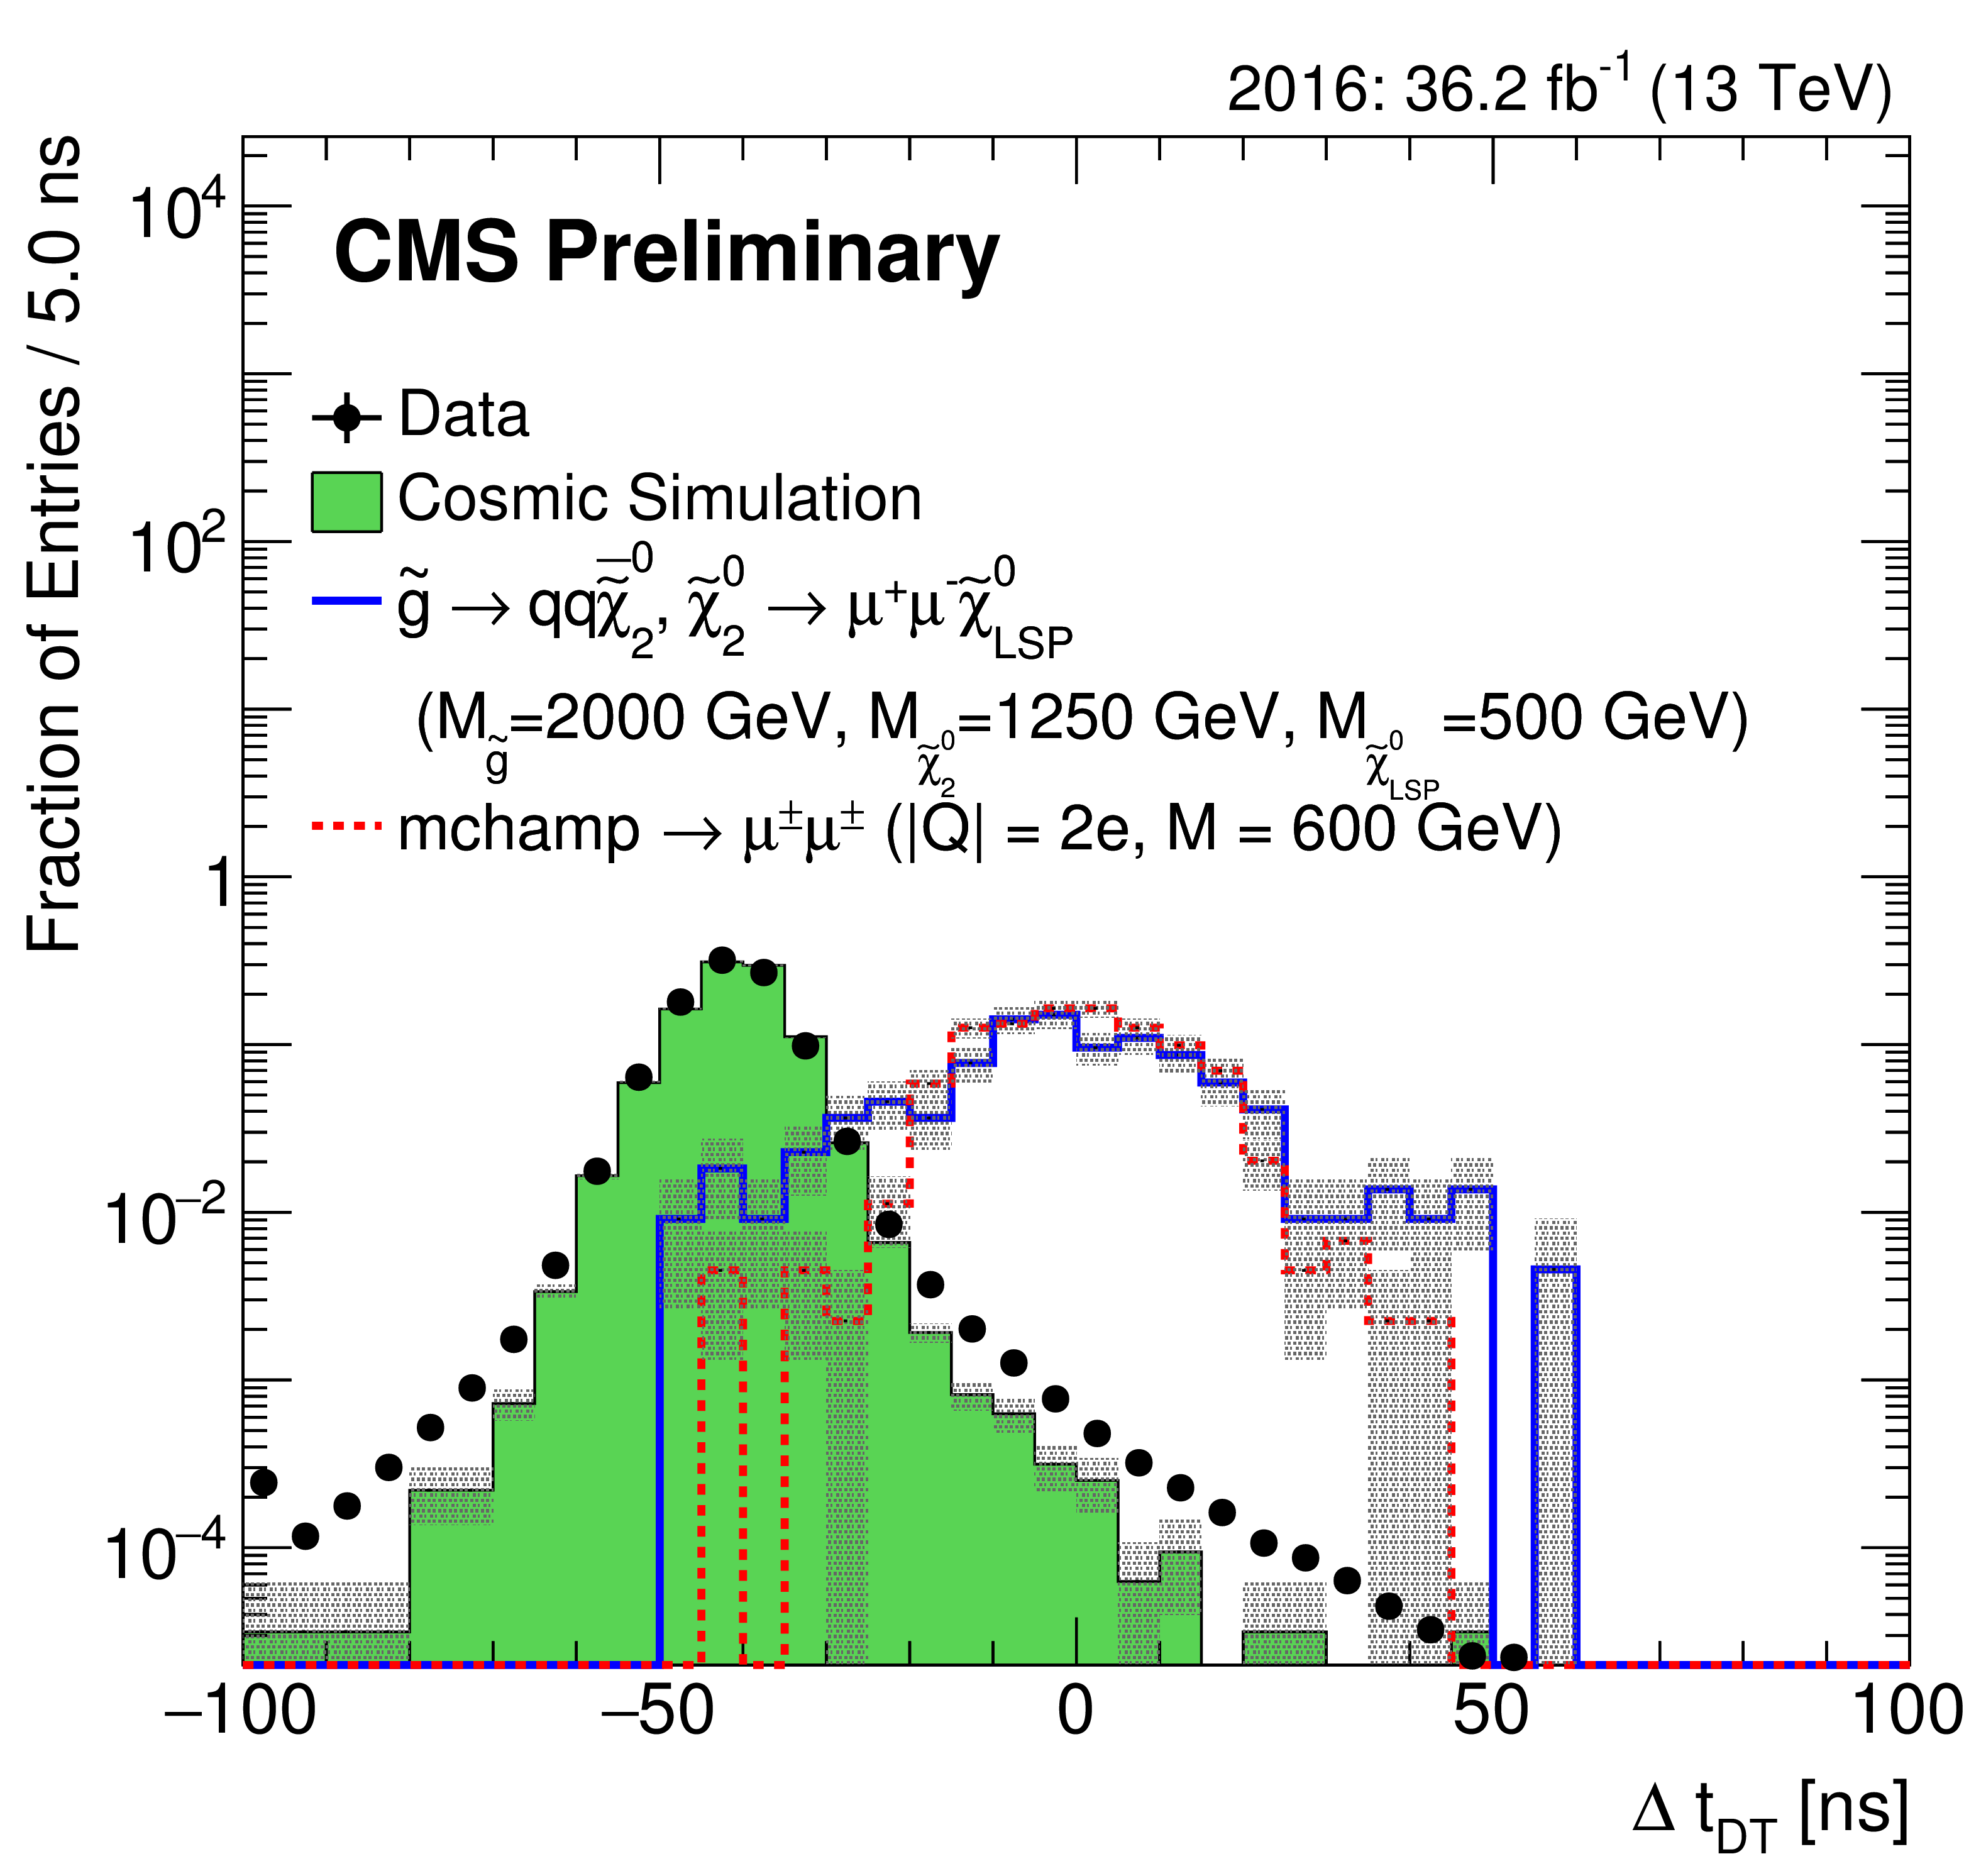
Figure 8-a:
DSA muon track $\Delta t_{\mathrm {DT}}$ for 2016 search sample data, cosmic muon MC simulation, 2000 GeV gluinos, and 600 GeV mchamps. The events plotted pass a subset of the full analysis selection that is designed to select good quality DSA muon tracks but does not reject the cosmic muon background (see Section 5). The grey bands indicate the statistical uncertainty in the simulation. The histograms are normalized to unit area. |

png pdf |
Figure 8-b:
DSA muon track $\Delta t_{\mathrm {RPC}}$ for 2016 search sample data, cosmic muon MC simulation, 2000 GeV gluinos, and 600 GeV mchamps. The events plotted pass a subset of the full analysis selection that is designed to select good quality DSA muon tracks but does not reject the cosmic muon background (see Section 5). The grey bands indicate the statistical uncertainty in the simulation. The histograms are normalized to unit area. |

png pdf |
Figure 9:
The integral under the fit to $\Delta t_{\mathrm {DT}}$ with the sum of two Gaussian distributions and a Crystal Ball function, when $\Delta t_{\mathrm {DT}}>-20$ ns, as a function of the lower $\Delta t_{\mathrm {RPC}}$ selection, for 2015 (red squares) and 2016 (black circles) data. The points are fitted with an error function, and used to extrapolate to the signal region, which is defined as $\Delta t_{\mathrm {RPC}}>-7.5$ ns. |

png pdf |
Figure 10:
95% CL cross section times BF limits on 1000 GeV gluino (left) and 1000 GeV mchamp (right) pair production as a function of lifetime, for combined 2015 and 2016 data. The observed limits are shown in the solid black line, the expected limits are shown in the dotted black line, the expected 1$\sigma $ and 2$\sigma $ bands are shown in green and yellow, respectively, and the theoretical cross sections assuming 100% BF are shown in the red line. |

png pdf |
Figure 10-a:
95% CL cross section times BF limits on 1000 GeV gluino pair production as a function of lifetime, for combined 2015 and 2016 data. The observed limits are shown in the solid black line, the expected limits are shown in the dotted black line, the expected 1$\sigma $ and 2$\sigma $ bands are shown in green and yellow, respectively, and the theoretical cross sections assuming 100% BF are shown in the red line. |

png pdf |
Figure 10-b:
95% CL cross section times BF limits on 1000 GeV mchamp pair production as a function of lifetime, for combined 2015 and 2016 data. The observed limits are shown in the solid black line, the expected limits are shown in the dotted black line, the expected 1$\sigma $ and 2$\sigma $ bands are shown in green and yellow, respectively, and the theoretical cross sections assuming 100% BF are shown in the red line. |

png pdf |
Figure 11:
95% CL cross section times BF limits on gluino (left) and mchamp (right) pair production as a function of mass, for lifetimes between 10 $\mu$s and 1000 s, for combined 2015 and 2016 data. The observed limits are shown in the solid black points, the expected limits are shown in the dotted black line, the expected 1$\sigma $ and 2$\sigma $ bands are shown in green and yellow, respectively, and the theoretical cross sections assuming 100% BF are shown in the red line. |

png pdf |
Figure 11-a:
95% CL cross section times BF limits on gluino pair production as a function of mass, for lifetimes between 10 $\mu$s and 1000 s, for combined 2015 and 2016 data. The observed limits are shown in the solid black points, the expected limits are shown in the dotted black line, the expected 1$\sigma $ and 2$\sigma $ bands are shown in green and yellow, respectively, and the theoretical cross sections assuming 100% BF are shown in the red line. |
png pdf |
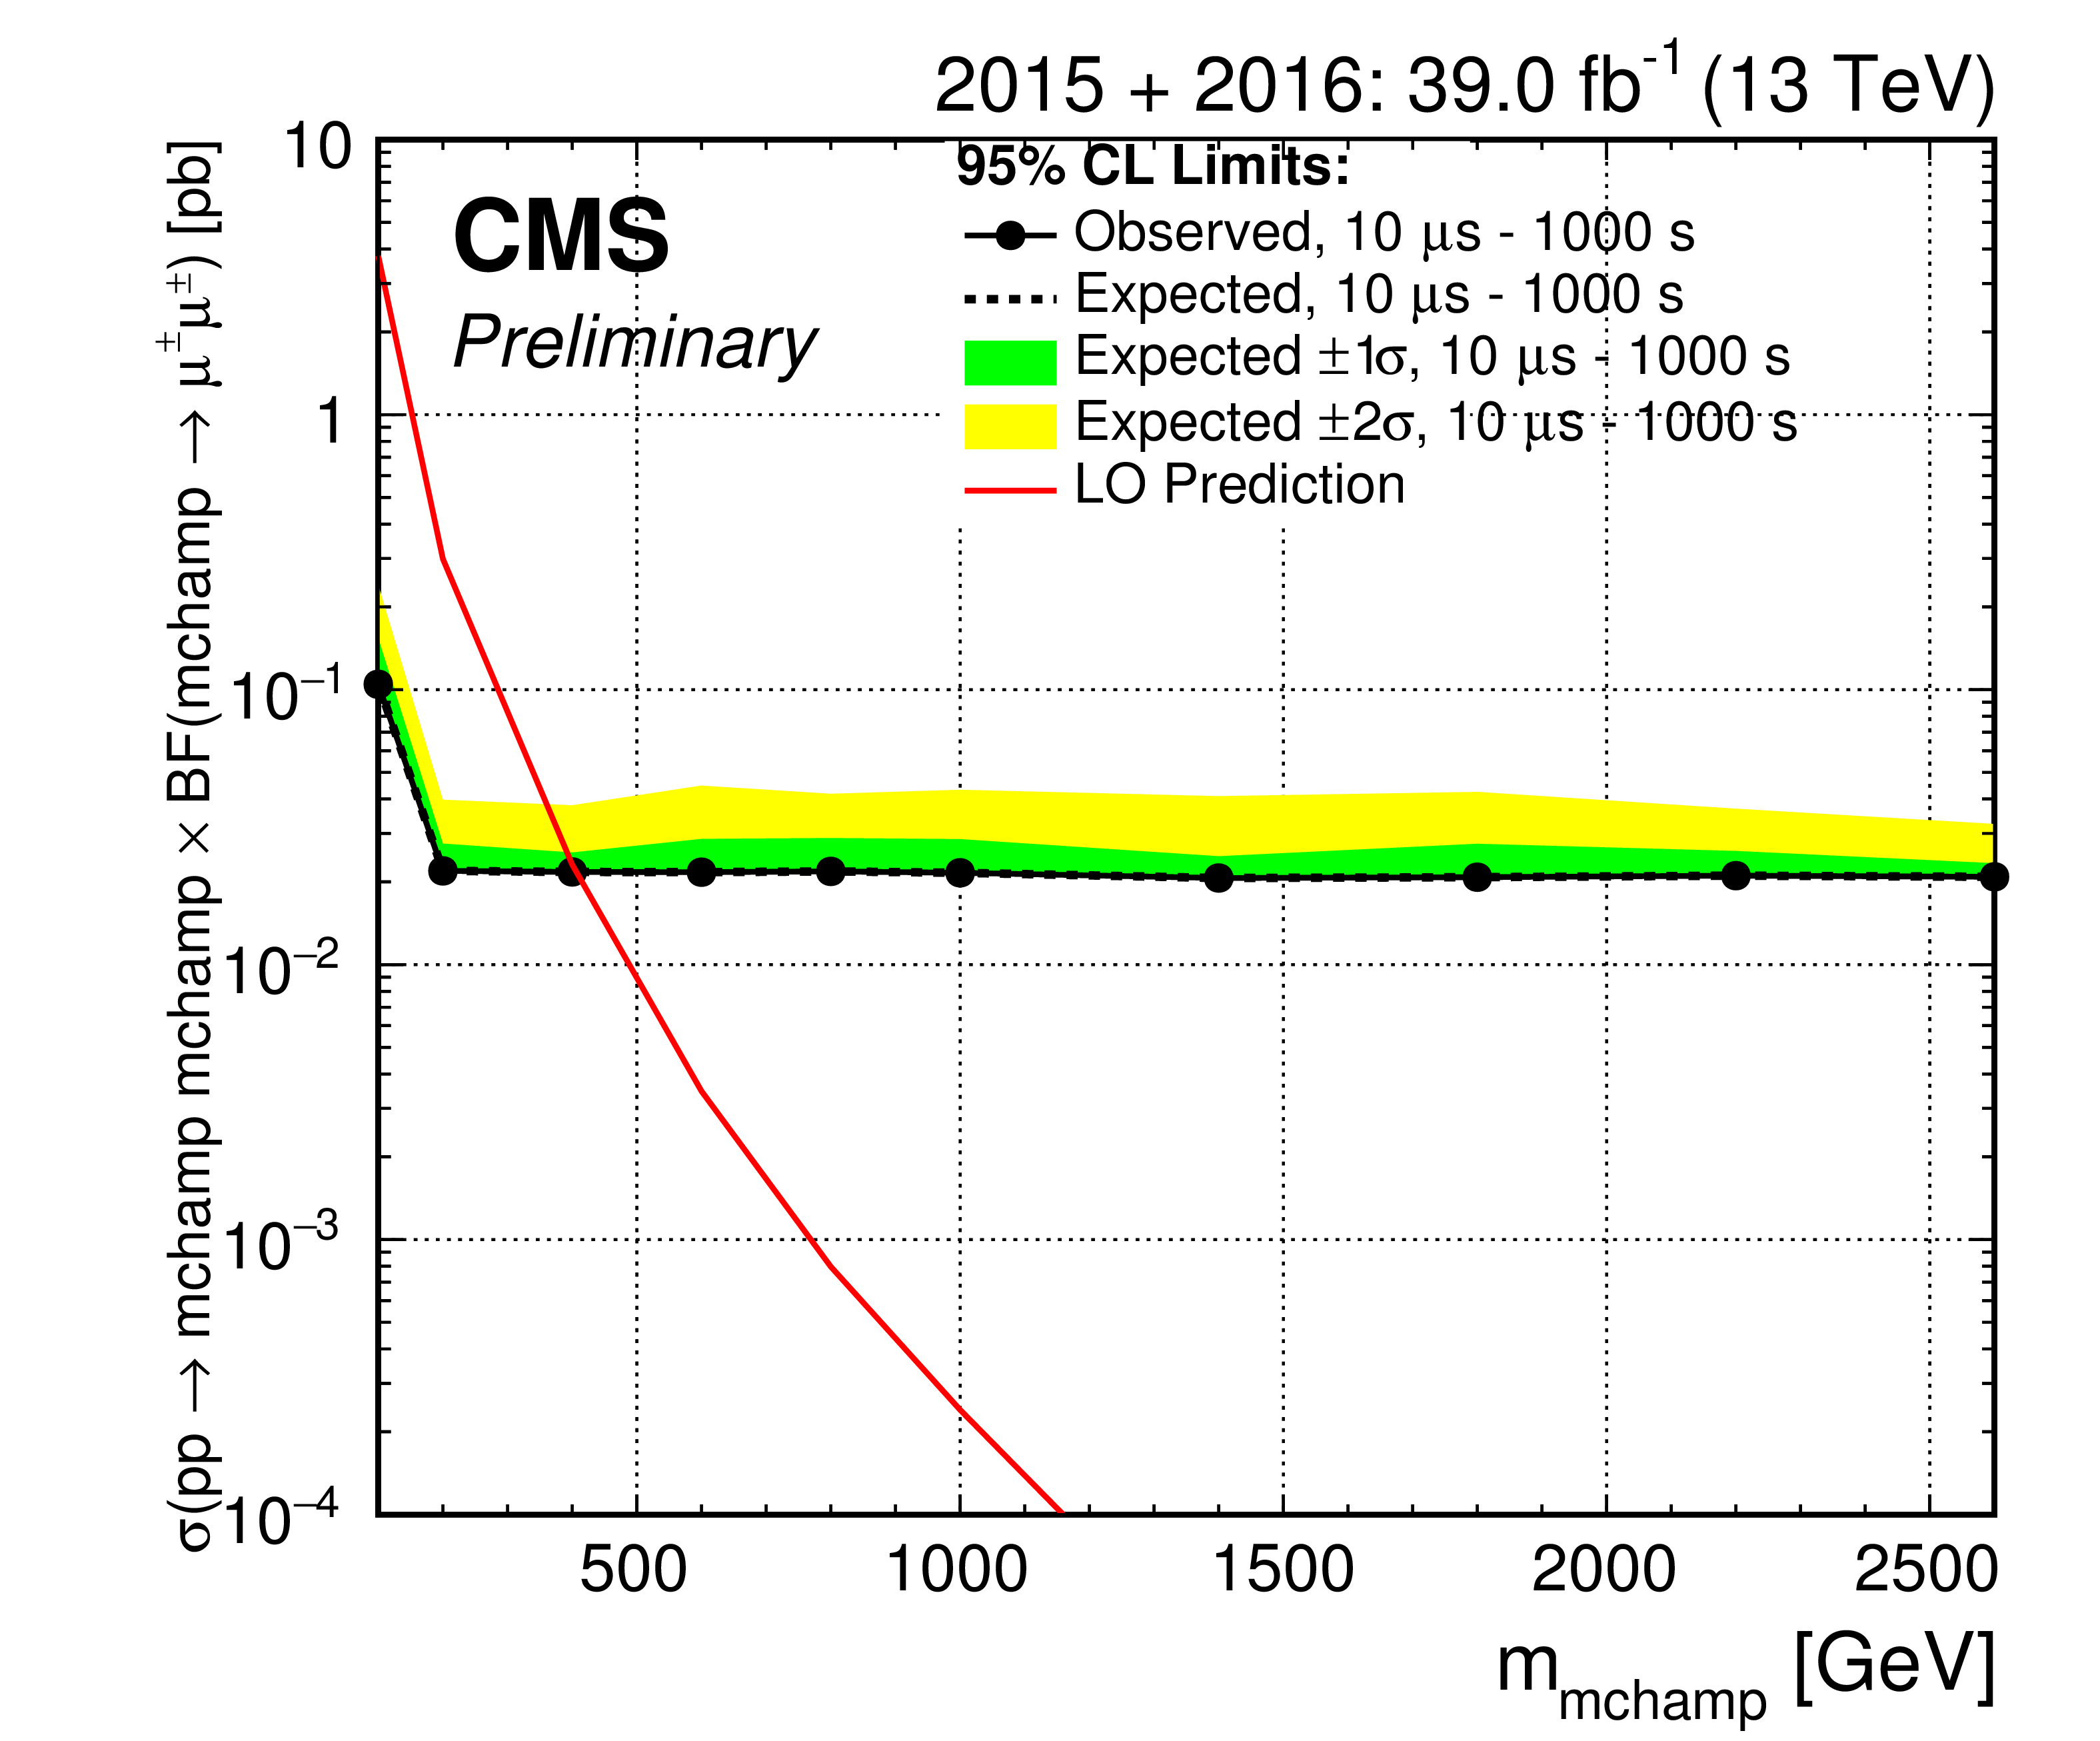
Figure 11-b:
95% CL cross section times BF limits on mchamp pair production as a function of mass, for lifetimes between 10 $\mu$s and 1000 s, for combined 2015 and 2016 data. The observed limits are shown in the solid black points, the expected limits are shown in the dotted black line, the expected 1$\sigma $ and 2$\sigma $ bands are shown in green and yellow, respectively, and the theoretical cross sections assuming 100% BF are shown in the red line. |
| Tables | |

png pdf |
Table 1:
Systematic uncertainties in the signal efficiency for the 2015 and 2016 analyses. |
png pdf |
Table 2:
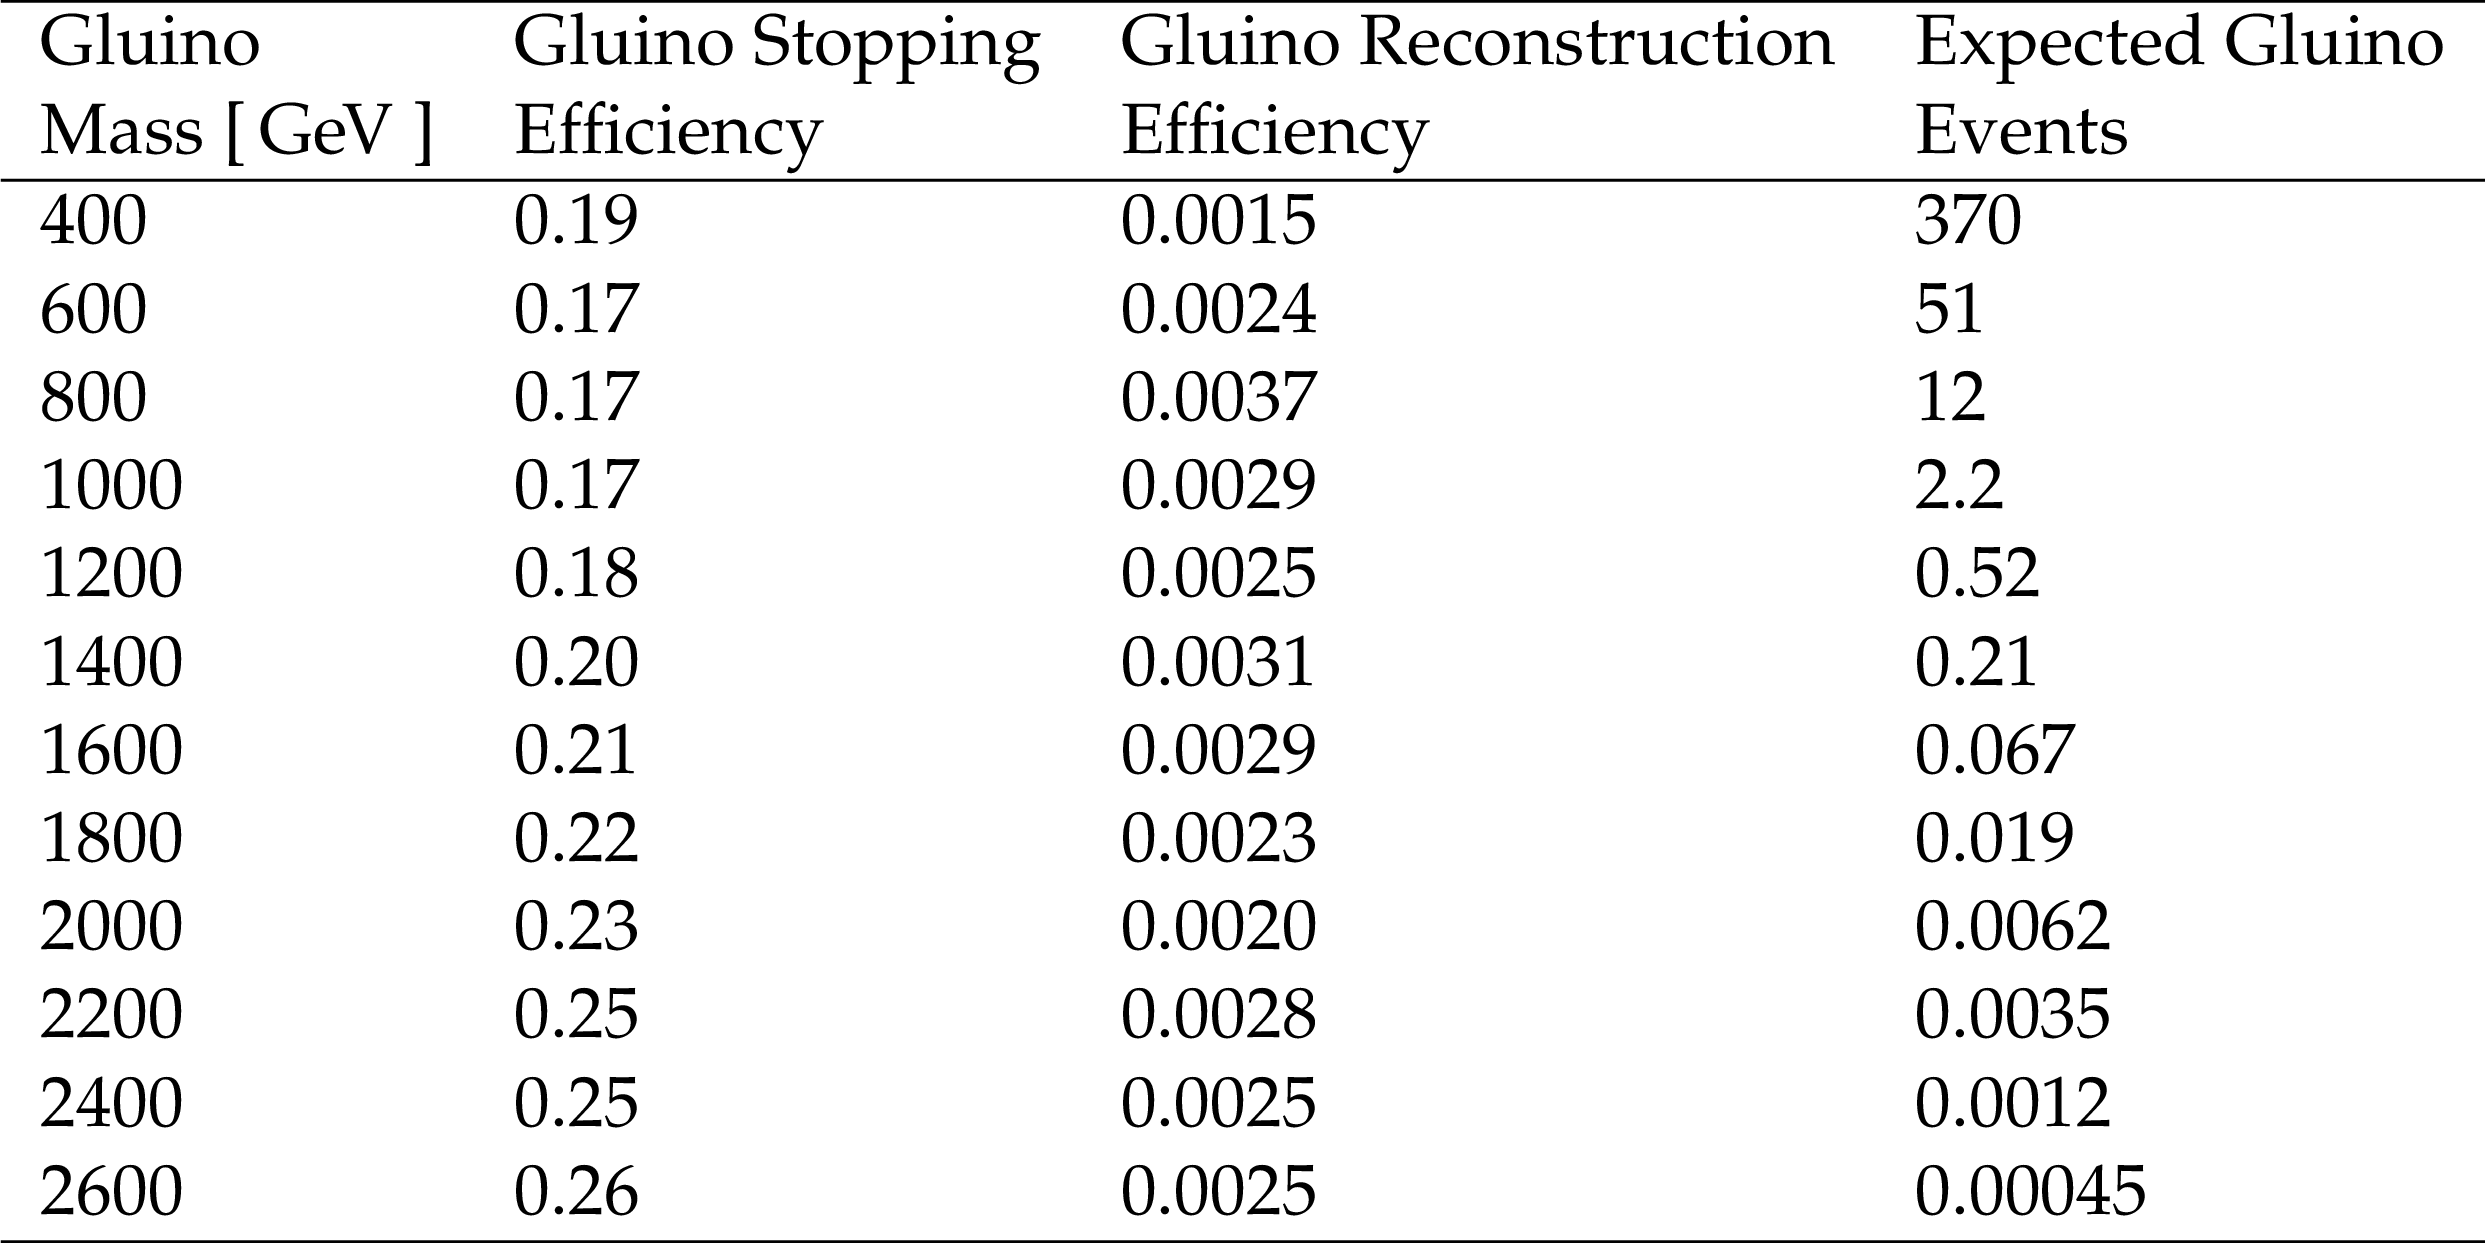
Gluino stopping efficiency, reconstruction efficiency, and the number of expected gluino events with lifetimes between 10 $\mu$s and 1000 s assuming 100% BF, for each mass for the 2016 analysis. |

png pdf |
Table 3:
Mchamp stopping efficiency, reconstruction efficiency, and the number of expected mchamp events with lifetimes between 10 $\mu$s and 1000 s assuming 100% BF, for each mass for the 2016 analysis. |
| Summary |
|
A search for delayed muons produced in pp collisions at $\sqrt{s}= $ 13 TeV has been performed at CMS with 2.8 fb$^{-1}$ and 36.2 fb$^{-1}$ data collected in 2015 and 2016. This search looked for new long-lived particles that stopped in the CMS detector and subsequently decayed to muons. These stopped particles were looked for when there were no collisions in the detector, namely, during gaps between LHC beam crossings. No evidence of signal was found and 95% confidence level cross section times branching fraction (BF) upper limits were set for combined 2015 and 2016 data. For lifetimes between 10 $\mu$s and 1000 s, limits were set between 1 and 0.01 pb for gluinos of mass between 400 and 2600 GeV and for mchamps of mass between 100 and 2600 GeV. Assuming a 100% BF, then for lifetimes between 10 $\mu$s and 1000 s, gluinos with mass between 400 and 970 (970) GeV observed (expected) are excluded, while mchamps with mass between 100 and 410 (410) GeV observed (expected) are excluded. Cross section times BF limits were also set for each gluino and mchamp mass as a function of lifetime, for lifetimes between 100 ns and 10 days. These are the first limits for stopped particles that decay to muons at the LHC. |
| References | ||||
| 1 | S. Dimopoulos, M. Dine, S. Raby, and S. Thomas | Experimental signatures of low energy gauge-mediated supersymmetry breaking | PRL 76 (1996) 3494 | |
| 2 | H. Baer, K. Cheung, and J. Gunion | A heavy gluino as the lightest supersymmetric particle | PRD 59 (1999) 075002 | |
| 3 | T. Jittoh, J. Sato, T. Shimomura, and M. Yamanaka | Long life stau in the minimal supersymmetric standard model | PRD 73 (2006) 055009 | |
| 4 | M. Strassler and K. Zurek | Echoes of a hidden valley at hadron colliders | PLB 651 (2007) 374 | |
| 5 | A. Arvanitaki et al. | Astrophysical probes of unification | PRD 79 (2009) 105022 | |
| 6 | N. Arkani-Hamed and S. Dimopoulos | Supersymmetric unification without low energy supersymmetry and signatures for fine-tuning at the lhc | JHEP 06 (2005) 073 | |
| 7 | K. Kohri and T. Takahashi | Cosmology with long-lived charged massive particles | PLB 682 (2010) 337--341 | |
| 8 | M. Byrne, C. Kolda, and P. Regan | Bounds on charged, stable superpartners from cosmic ray production | PRD 66 (2002) 075007 | |
| 9 | P. Smith et al. | A search for anomalous hydrogen in enriched d2o, using a time-of-flight spectrometer | Nucl. Phys. B 206 (1982), no. 3, 333 -- 348 | |
| 10 | Particle Data Group | Review of particle physics | Chin. Phys.C 40 (2016) 100001 | |
| 11 | M. Fairbairn et al. | Stable massive particles at colliders | PR 438 (2007) 1--63 | |
| 12 | P. Fayet | Spontaneously broken supersymmetric theories of weak, electromagnetic and strong interactions | PLB 69 (1977) 489 -- 494 | |
| 13 | P. Fayet | Massive gluinos | PLB 78 (1978) 417 -- 420 | |
| 14 | G. R. Farrar and P. Fayet | Phenomenology of the production, decay, and detection of new hadronic states associated with supersymmetry | PLB 76 (1978) 575 -- 579 | |
| 15 | A. Arvanitaki et al. | Stopping gluinos | PRD 76 (2007) 055007 | |
| 16 | P. W. Graham, K. Howe, S. Rajendran, and D. Stolarski | New measurements with stopped particles at the LHC | PRD 86 (2012) 034020 | |
| 17 | ATLAS Collaboration | Search for long-lived stopped $ r $-hadrons decaying out-of-time with pp collisions using the ATLAS detector | PRD 88 (2013) 112003 | |
| 18 | ATLAS Collaboration | Search for decays of stopped, long-lived particles from 7 TeV pp collisions with the ATLAS detector | EPJC 72 (2012) 1--21 | |
| 19 | CMS Collaboration | Search for decays of stopped long-lived particles produced in proton-proton collisions at $ \sqrt{s}= $ 8 TeV | EPJC 75 (2015) 151 | |
| 20 | CMS Collaboration | Search for stopped gluinos in pp collisions at $ \sqrt{s}= $ 7 TeV | PRL 106 (2011) 011801 | |
| 21 | ATLAS Collaboration | Search for heavy long-lived charged particles with the ATLAS detector in pp collisions at $ \sqrt{s}= $ 7 TeV | PLB 703 (2011) 428--446 | |
| 22 | ATLAS Collaboration | Search for stable hadronising squarks and gluinos with the ATLAS experiment at the LHC | PLB 701 (2011) 1--19 | |
| 23 | ATLAS Collaboration | Search for massive long-lived highly ionising particles with the ATLAS detector at the LHC | PLB 698 (2011) 353--370 | |
| 24 | ATLAS Collaboration | Searches for heavy long-lived sleptons and $ r $-hadrons with the ATLAS detector in pp collisions at $ \sqrt{s}= $ 7 TeV | PLB 720 (2013) 277 -- 308 | |
| 25 | ATLAS Collaboration | Search for long-lived, multi-charged particles in pp collisions at $ \sqrt{s}= $ 7 TeV using the ATLAS detector | PLB 722 (2013) 305 -- 323 | |
| 26 | ATLAS Collaboration | Search for heavy long-lived multi-charged particles in pp collisions at $ \sqrt{s}= $ 8 TeV using the ATLAS detector | EPJC 75 (2015) 362 | |
| 27 | ATLAS Collaboration | Search for metastable heavy charged particles with large ionisation energy loss in pp collisions at $ \sqrt{s}= $ 8 TeV using the ATLAS experiment | EPJC 75 (2015) 407 | |
| 28 | CMS Collaboration | Searches for long-lived charged particles in pp collisions at $ \sqrt{s}= $ 7 and 8 TeV | JHEP 07 (2013) 122 | |
| 29 | CMS Collaboration | Search for heavy stable charged particles in pp collisions at $ \sqrt{s}= $ 7 TeV | JHEP 2011 (2011), no. 3, 24 | |
| 30 | CMS Collaboration | Search for fractionally charged particles in pp collisions at $ \sqrt{s}= $ 7 TeV | PRD 87 (2013) 092008 | |
| 31 | CMS Collaboration | Search for heavy long-lived charged particles in pp collisions at $ \sqrt{s}= $ 7 TeV | PLB 713 (2012) 408--433 | |
| 32 | CMS Collaboration | Constraints on the pmssm, amsb model and on other models from the search for long-lived charged particles in proton-proton collisions at $ \sqrt{s}= $ 8 TeV | EPJC 75 (2015) 325 | |
| 33 | LHCb Collaboration | Search for long-lived heavy charged particles using a ring imaging cherenkov technique at lhcb | 1506.09173 | |
| 34 | CMS Collaboration | Search for long-lived charged particles in proton-proton collisions at 13 TeV | PRD 94 (Dec, 2016) 112004 | |
| 35 | CMS Collaboration | Search for heavy stable charged particles with 12.9 fb$^{-1} $ of 2016 data | CMS-PAS-EXO-16-036 | CMS-PAS-EXO-16-036 |
| 36 | CMS Collaboration | The CMS experiment at the CERN LHC | JINST 3 (2008) S08004 | CMS-00-001 |
| 37 | G. Giudice and A. Romanino | Split supersymmetry | Nucl. Phys. B 699 (2004) 65 | |
| 38 | N. Arkani-Hamed and S. Dimopoulos | Supersymmetric unification without low energy supersymmetry and signatures for fine-tuning at the LHC | JHEP 2005 (2005) 073 | |
| 39 | CMS Collaboration | Interpretation of searches for supersymmetry with simplified models | PRD 88 (Sep, 2013) 052017 | |
| 40 | G. L. Kane, C. Kolda, L. Roszkowski, and J. D. Wells | Study of constrained minimal supersymmetry | PRD 49 (Jun, 1994) 6173--6210 | |
| 41 | A. H. Chamseddine, R. Arnowitt, and P. Nath | Locally supersymmetric grand unification | PRL 49 (Oct, 1982) 970--974 | |
| 42 | P. Langacker and G. Steigman | Requiem for a fractionally charged, massive particle | PRD 84 (2011) 065040 | |
| 43 | C. S. Aulakh, K. Benakli, and G. Senjanovic | Reconciling high-scale left-right symmetry with supersymmetry | PRL 79 (1997) 2188--2191 | |
| 44 | T. Sjostrand, S. Mrenna, and P. Skands | Pythia 6.4 physics and manual | JHEP 2006 (2006), no. 05, 026 | |
| 45 | T. Sjostrand, S. Mrenna, and P. Skands | A brief introduction to pythia 8.1 | CPC. 178 (2008), no. 05, 852 -- 867 | |
| 46 | GEANT4 Collaboration | Geant4: A simulation toolkit | Nucl. Instrum. Methods A 506 (2003) 250 -- 303 | |
| 47 | GEANT4 Collaboration | Geant4 developments and applications | IEEE Trans. Nucl. Sci. 53 (2006) 270 -- 278 | |
| 48 | CMS Collaboration | Muon reconstruction and identification improvements for run-2 and first results with 2015 run data | CDS | |
| 49 | CMS Collaboration | CMS luminosity measurement for the 2015 data taking period | CMS Public Analysis Note CMS-PAS-LUM-15-001 (2015) | |
| 50 | CMS Collaboration | CMS Luminosity Measurements for the 2016 Data Taking Period | CMS-PAS-LUM-17-001 | CMS-PAS-LUM-17-001 |
| 51 | T. Junk | Confidence level computation for combining searches with small statistics | Nucl. Instrum. Methods A 434 (1999) 435 -- 443 | |
| 52 | A. L. Read | Presentation of search results: the cl s technique | J Phys G 28 (2002) 2693 | |
| 53 | R. Cousins and V. Highland | Incorporating systematic uncertainties into an upper limit | Nucl. Instrum. Methods A 320 (1992) 331 | |
| 54 | The ATLAS Collaboration, The CMS Collaboration, The LHC Higgs Combination Group Collaboration | Procedure for the LHC Higgs boson search combination in Summer 2011 | CMS-NOTE-2011-005 | |
|
|
Compact Muon Solenoid LHC, CERN |
|

|

|

|

|

|