

Compact Muon Solenoid
LHC, CERN
| CMS-PAS-LUM-17-001 | ||
| CMS luminosity measurements for the 2016 data-taking period | ||
| CMS Collaboration | ||
| March 2017 | ||
| Abstract: The measurement of the integrated luminosity delivered to the CMS Experiment during the 2016 LHC proton-proton run at a center-of-mass energy of 13 TeV is presented. The Pixel Cluster Counting method is used and the absolute luminosity scale calibration is derived from an analysis of Van der Meer Scans performed in May 2016. The overall uncertainty of the luminosity measurement is estimated to be 2.5%. | ||
| Links: CDS record (PDF) ; inSPIRE record ; CADI line (restricted) ; | ||
| Figures | |

png pdf |
Figure 1:
The dynamic inefficiency for different numbers of bunch crossings and at different total instantaneous luminosities. The hit efficiency is a ratio of measured pixel clusters that are associated to reconstructed tracks to predicted pixel clusters. The inefficiency is greatest at highest instantaneous luminosity and in layer 1 of the barrel reaches up to 6%. For all other regions of the pixel detector the inefficiency is less than 1%. |
png pdf |
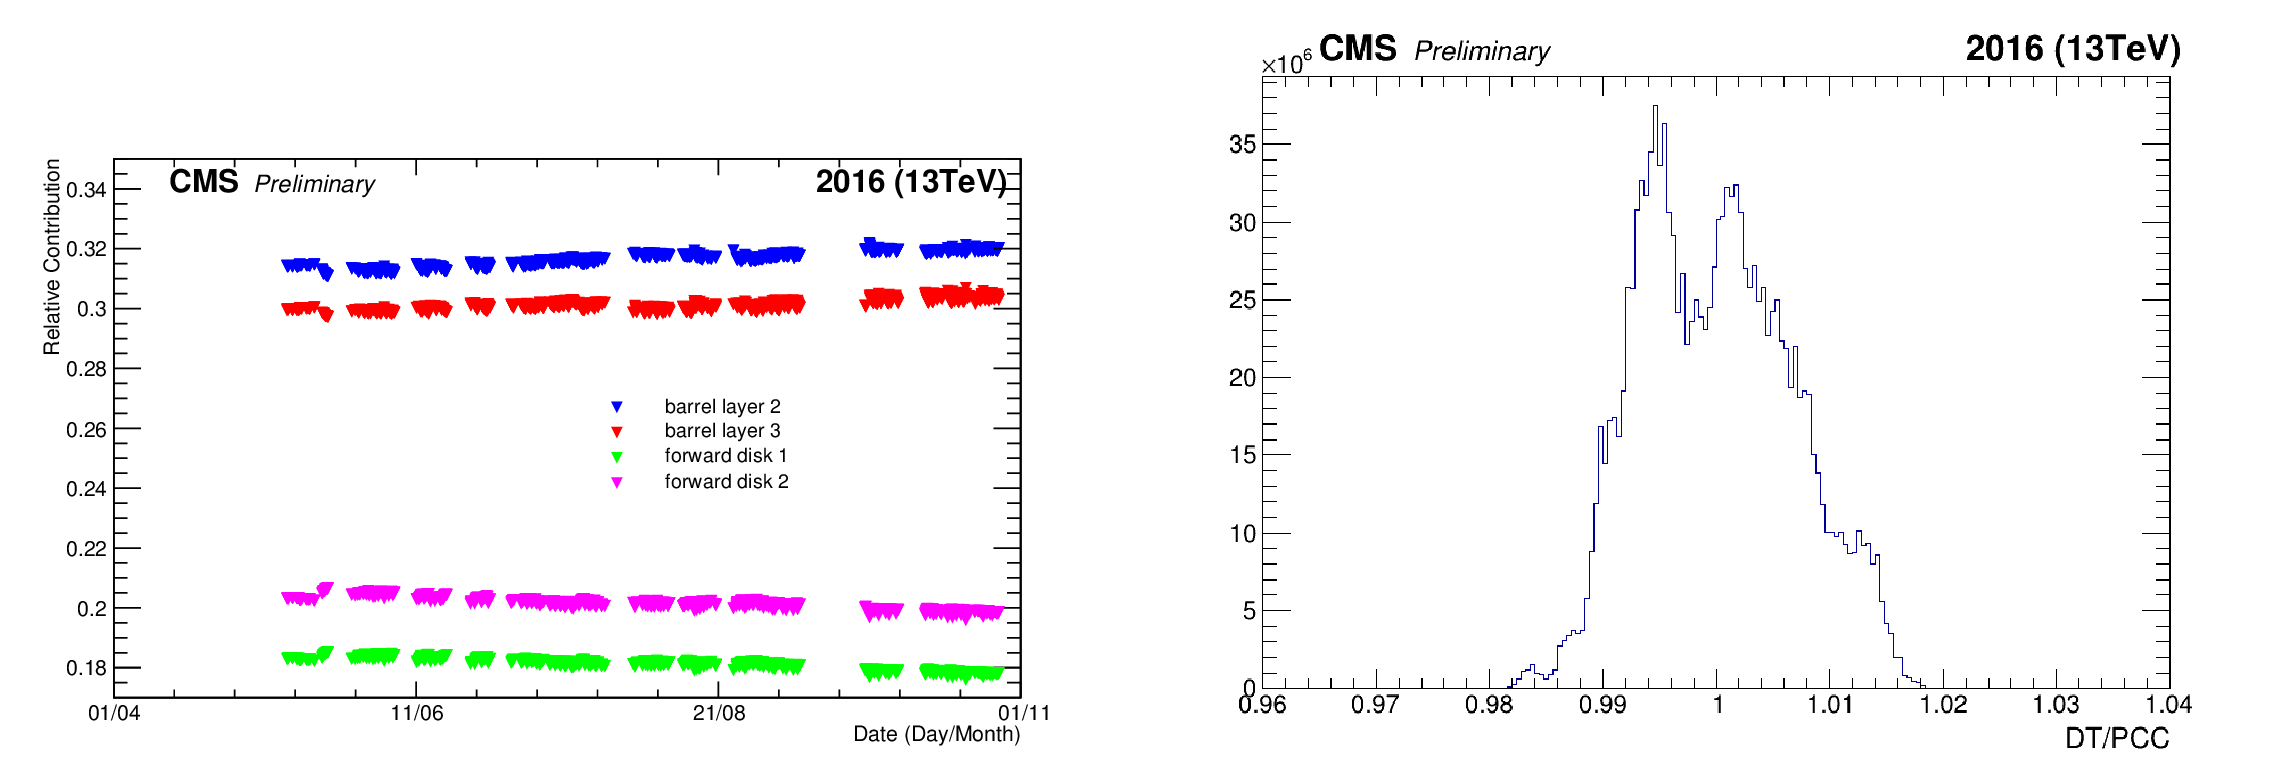
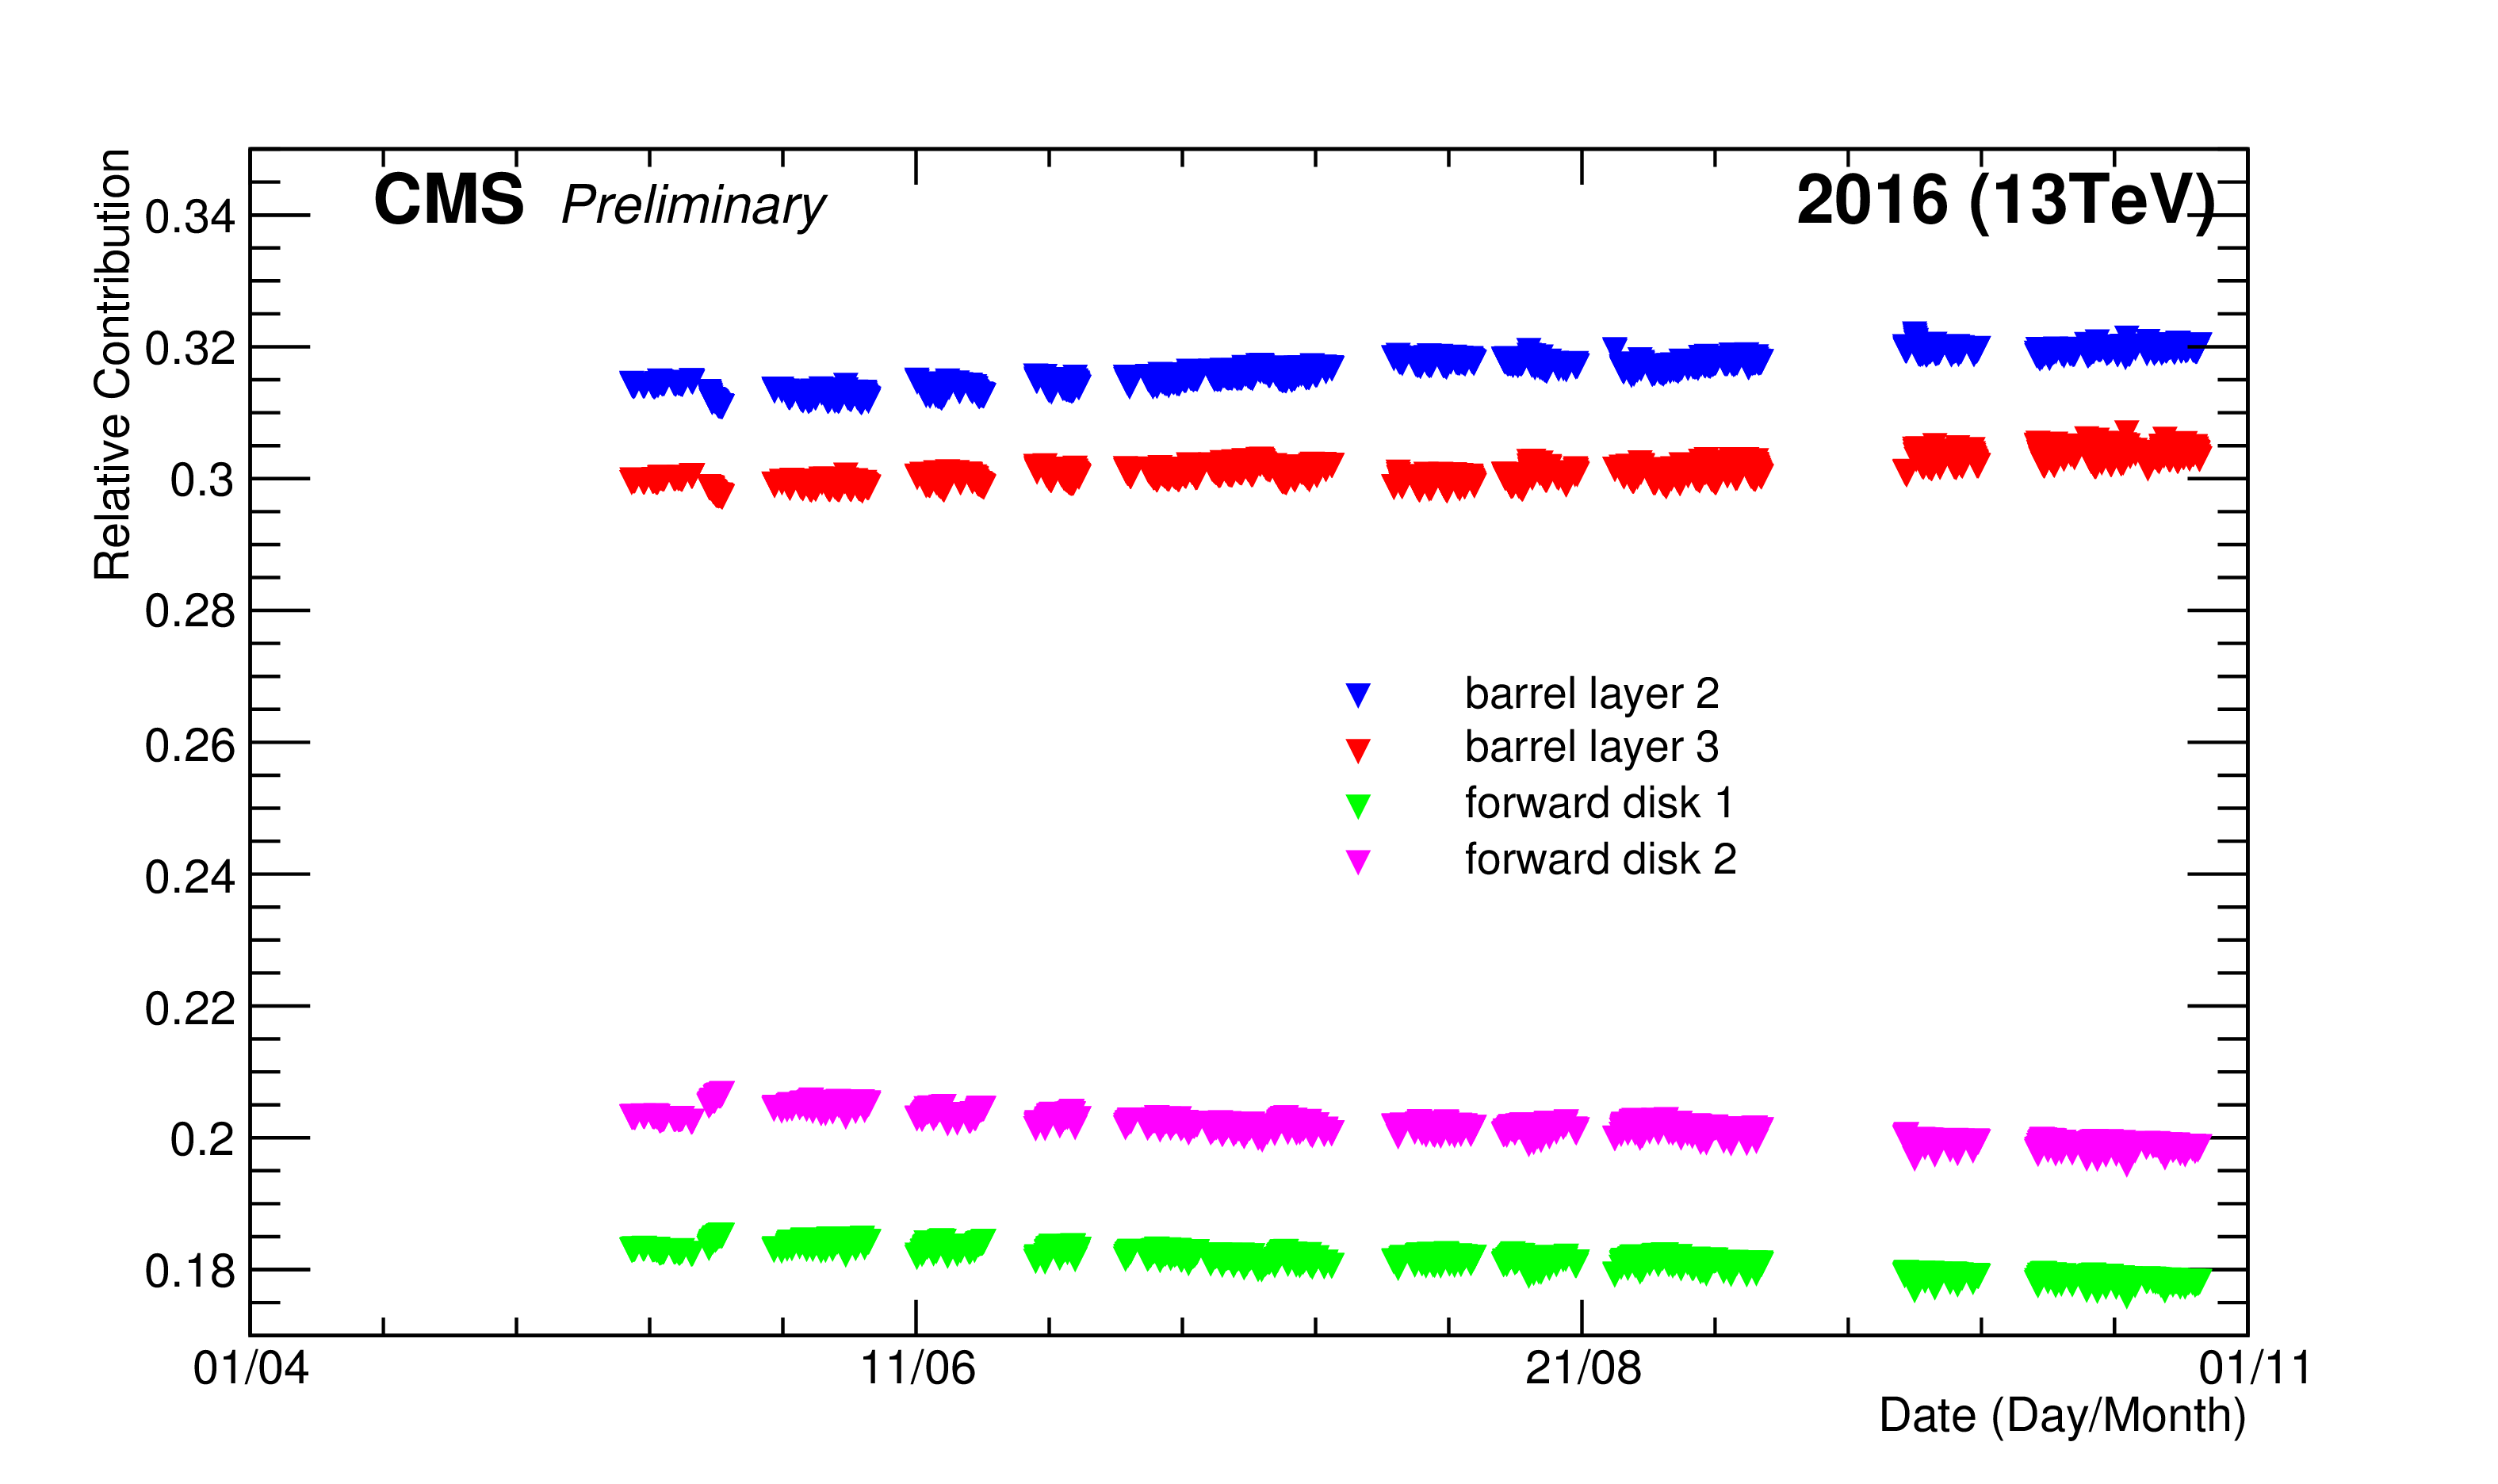
Figure 2:
Shown above are the relative contributions of the Pixel layers to the overall PCC rate over time (left) and the ratio of CMS recorded luminosities per 10 Lumisections measured with PCC and DTLumi over the entire 2016 data-taking period integrated over time (right). |
png pdf |
Figure 2-a:
Shown above are the relative contributions of the Pixel layers to the overall PCC rate over time. |

png |
Figure 2-b:
The ratio of CMS recorded luminosities per 10 Lumisections measured with PCC and DTLumi over the entire 2016 data-taking period integrated over time. |

png pdf |
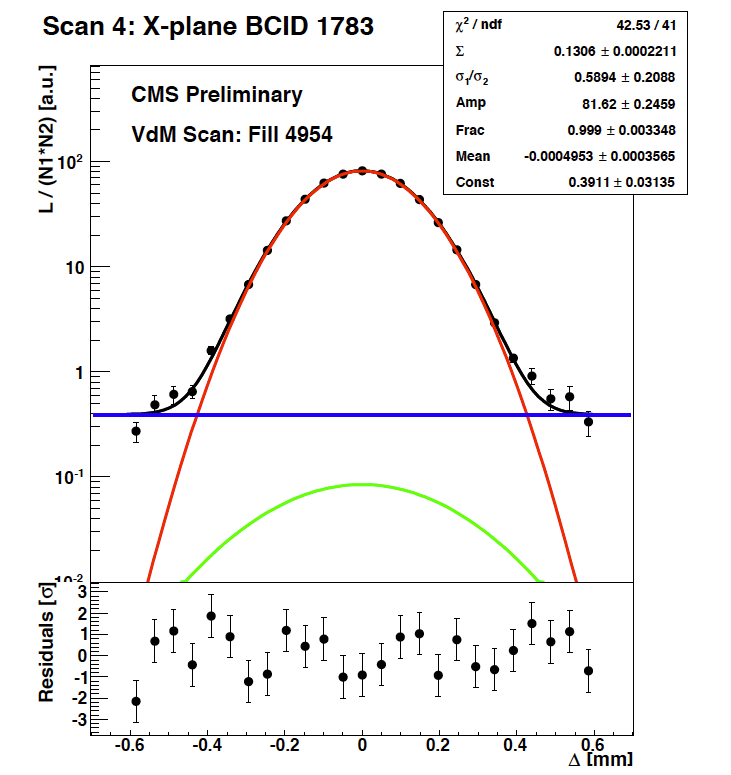
Figure 3:
Shown are the fitted scan curves recorded by PCC during X2 (left) and Y2 (right). |
png |
Figure 3-a:
Shown are the fitted scan curves recorded by PCC during X2. |

png |
Figure 3-b:
Shown are the fitted scan curves recorded by PCC during Y2. |
png pdf |
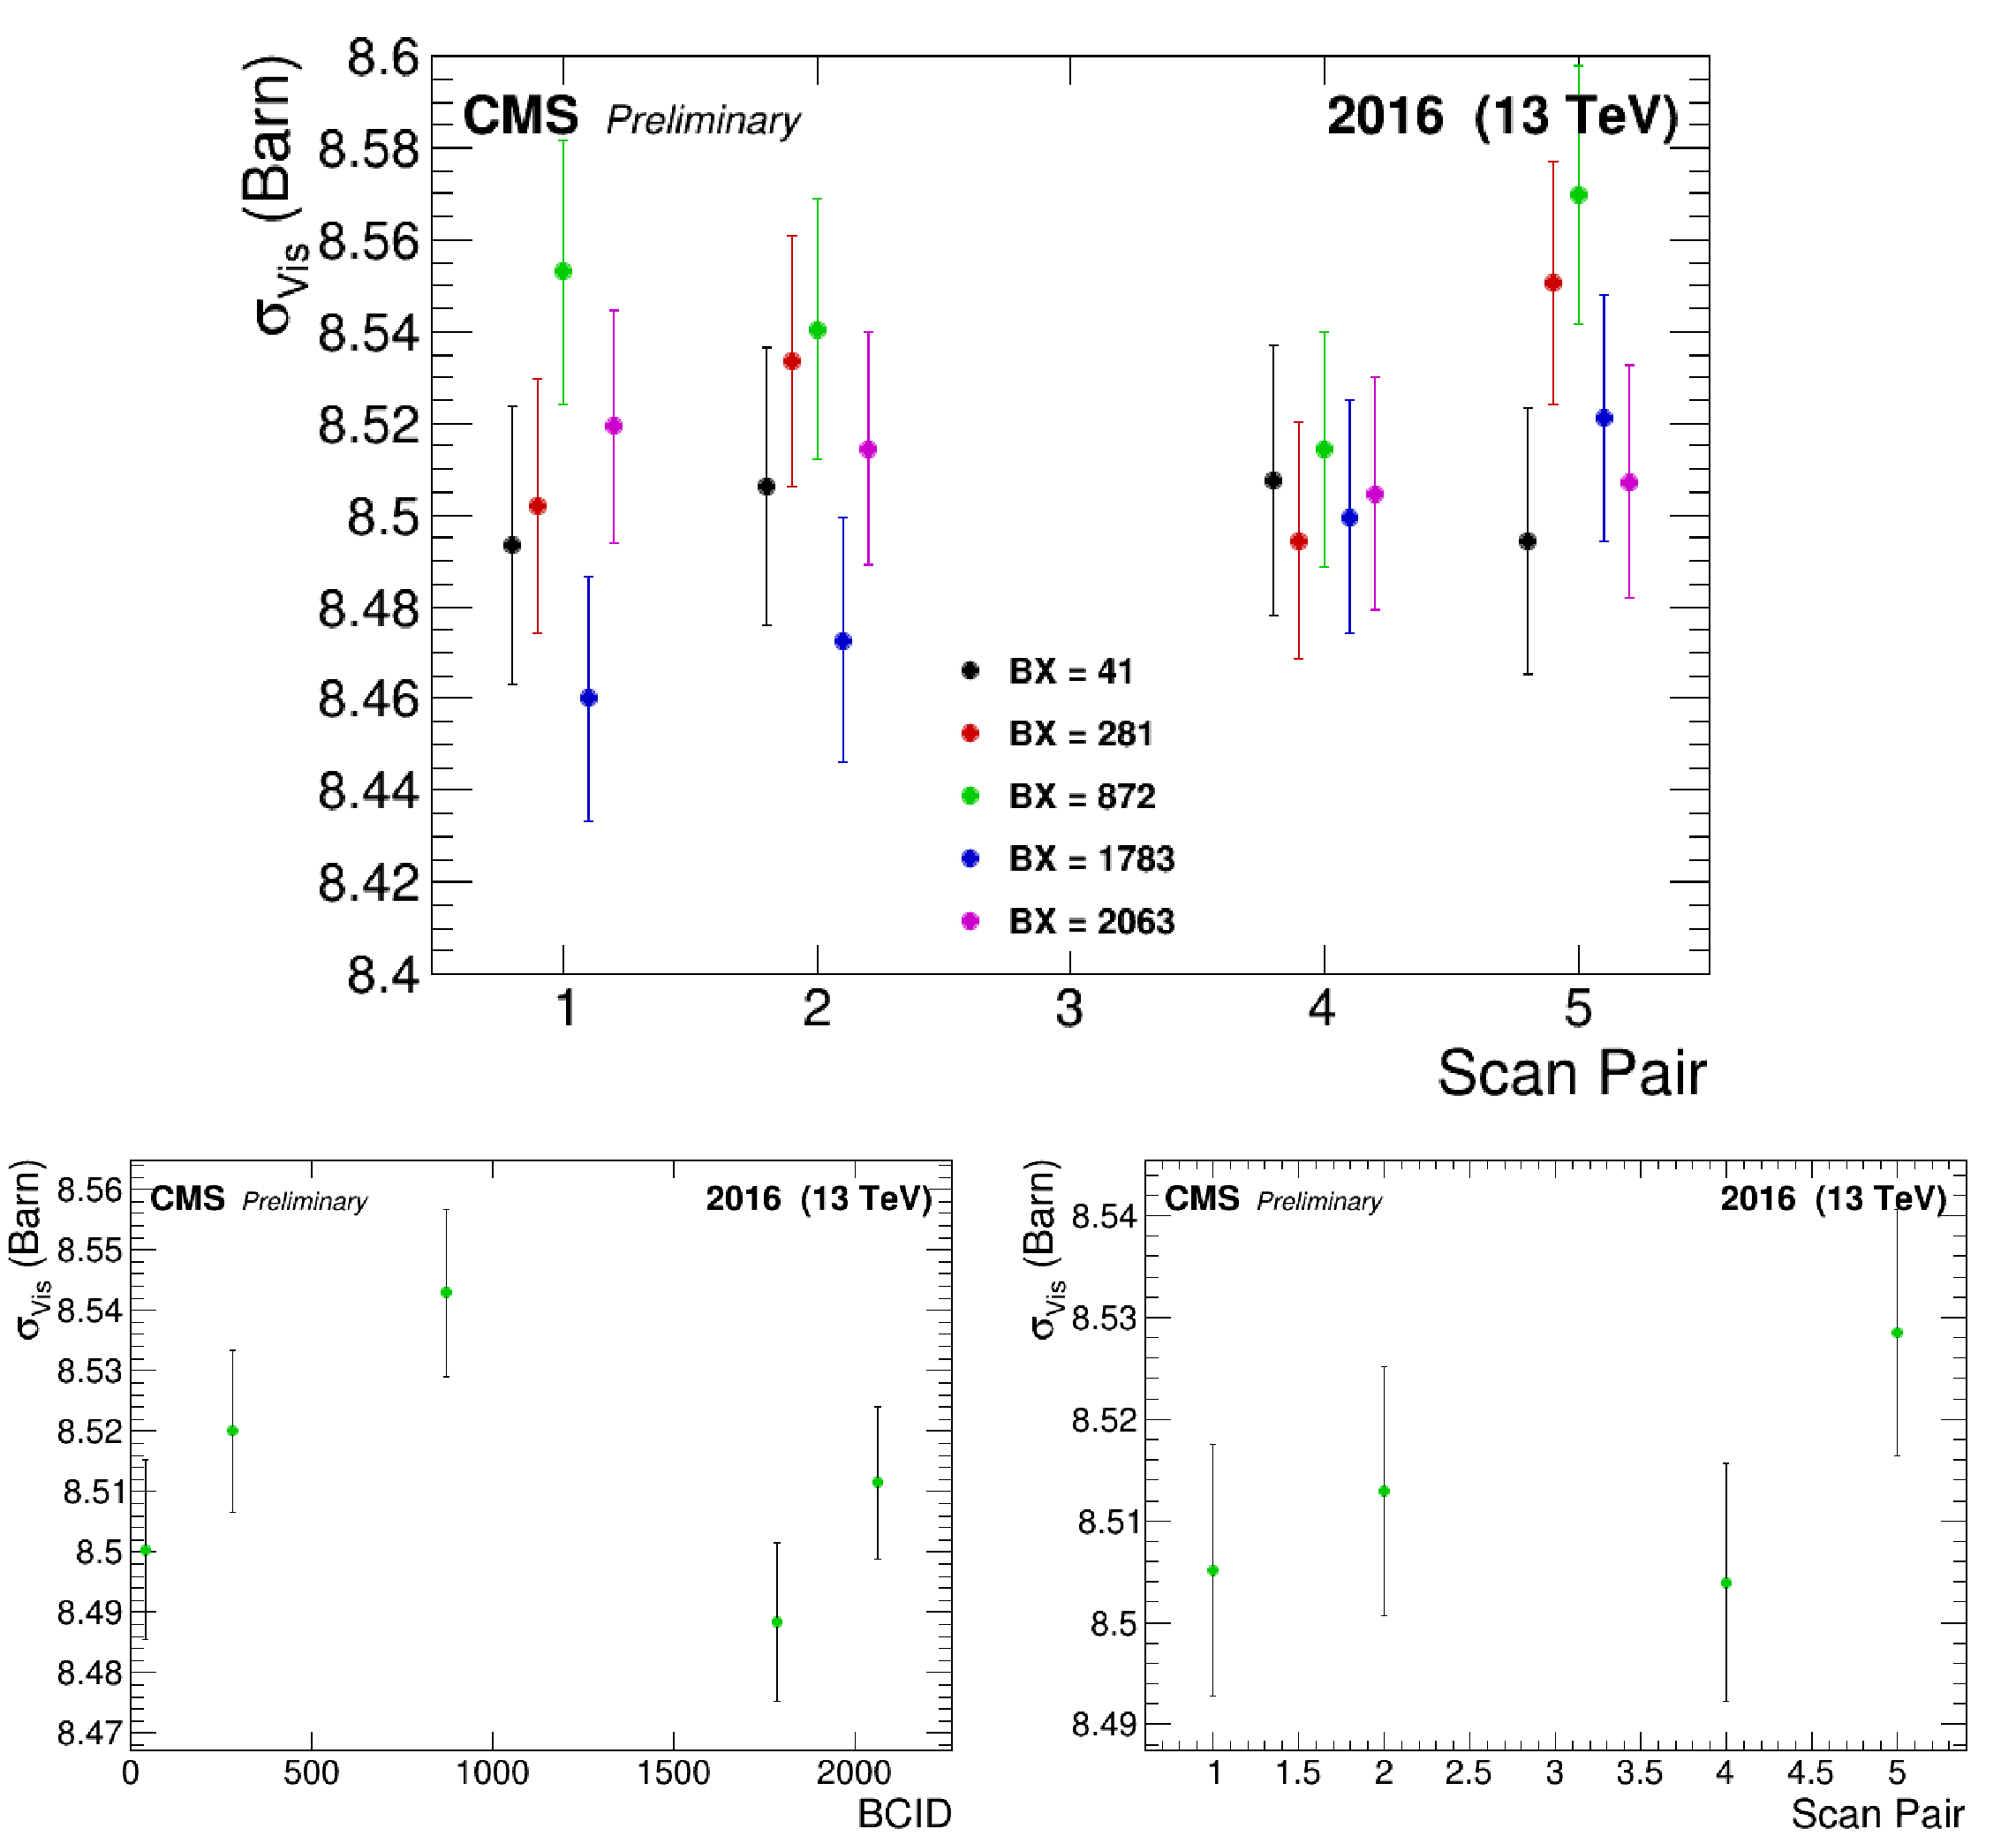
Figure 4:
The upper plot shows the measured cross sections with statistical error per BCID and scan. The lower left is the weighted average of PCC visible cross sections per bunch crossing. The lower right plot depicts the weighted average of visible cross sections per scan. |

png |
Figure 4-a:
The plot shows the measured cross sections with statistical error per BCID and scan. |
png |
Figure 4-b:
The plot shows the weighted average of PCC visible cross sections per bunch crossing. |

png |
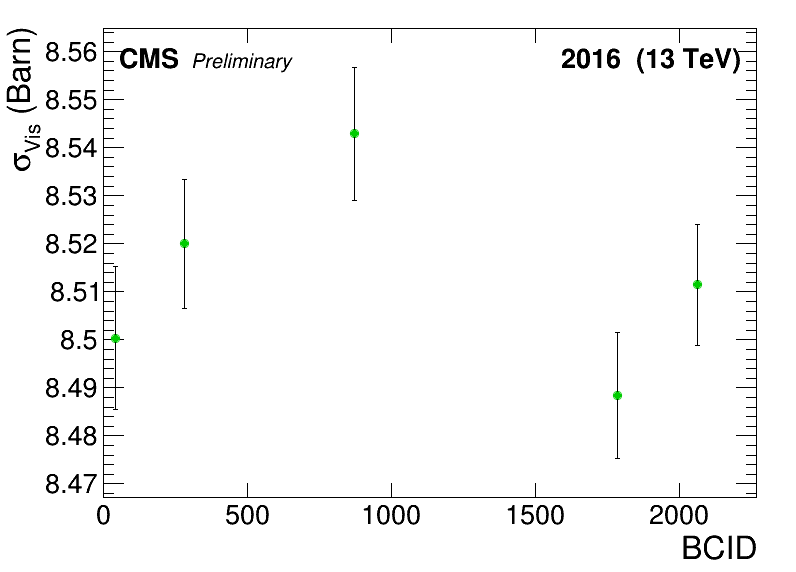
Figure 4-c:
The plot depicts the weighted average of visible cross sections per scan. |
png pdf |
Figure 5:
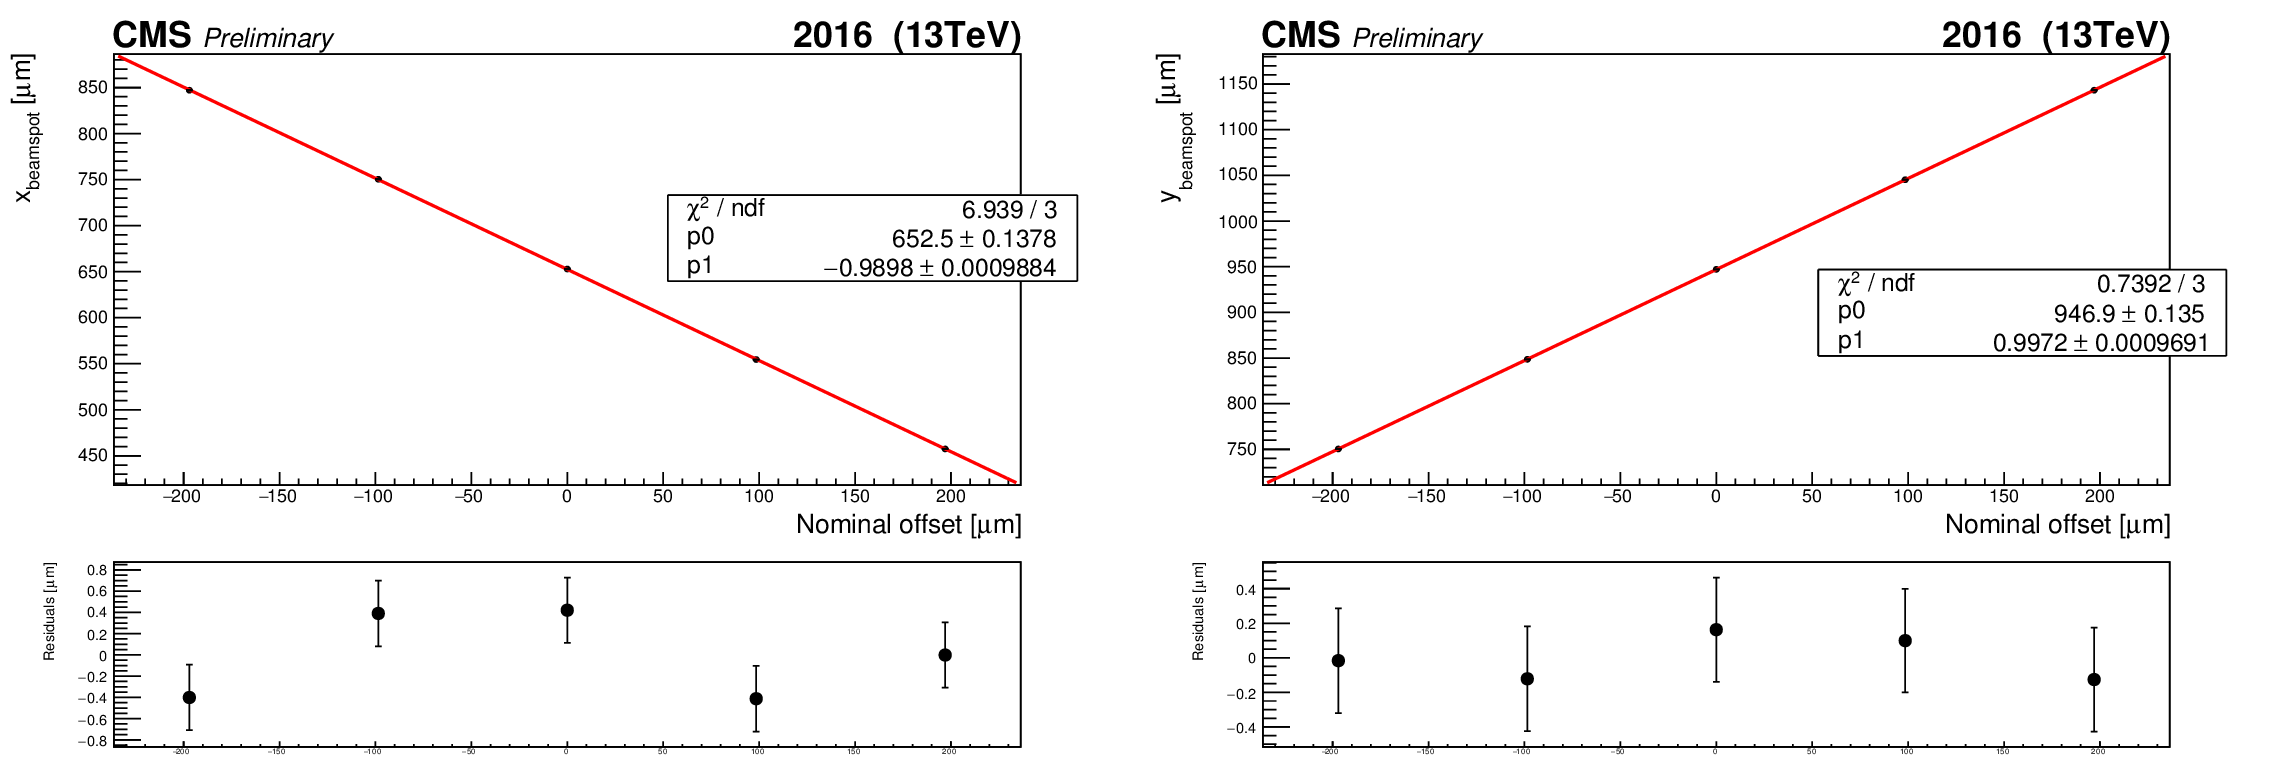
Examples of the measured beamspot position as a function of the beam centroid offset are shown for a horizontal (left) and vertical (right) LSC scan. The points are fitted with a straight line to derive the LSC constant. |

png pdf |
Figure 5-a:
Examples of the measured beamspot position as a function of the beam centroid offset are shown for a horizontal LSC scan. The points are fitted with a straight line to derive the LSC constant. |

png pdf |
Figure 5-b:
Examples of the measured beamspot position as a function of the beam centroid offset are shown for a vertical LSC scan. The points are fitted with a straight line to derive the LSC constant. |

png pdf |
Figure 6:
The difference of the two vertical and horizontal beam orbits from before and after each scan as measured by the DOROS BPM in ${ \mu }$m is shown. |
png pdf |
Figure 7:
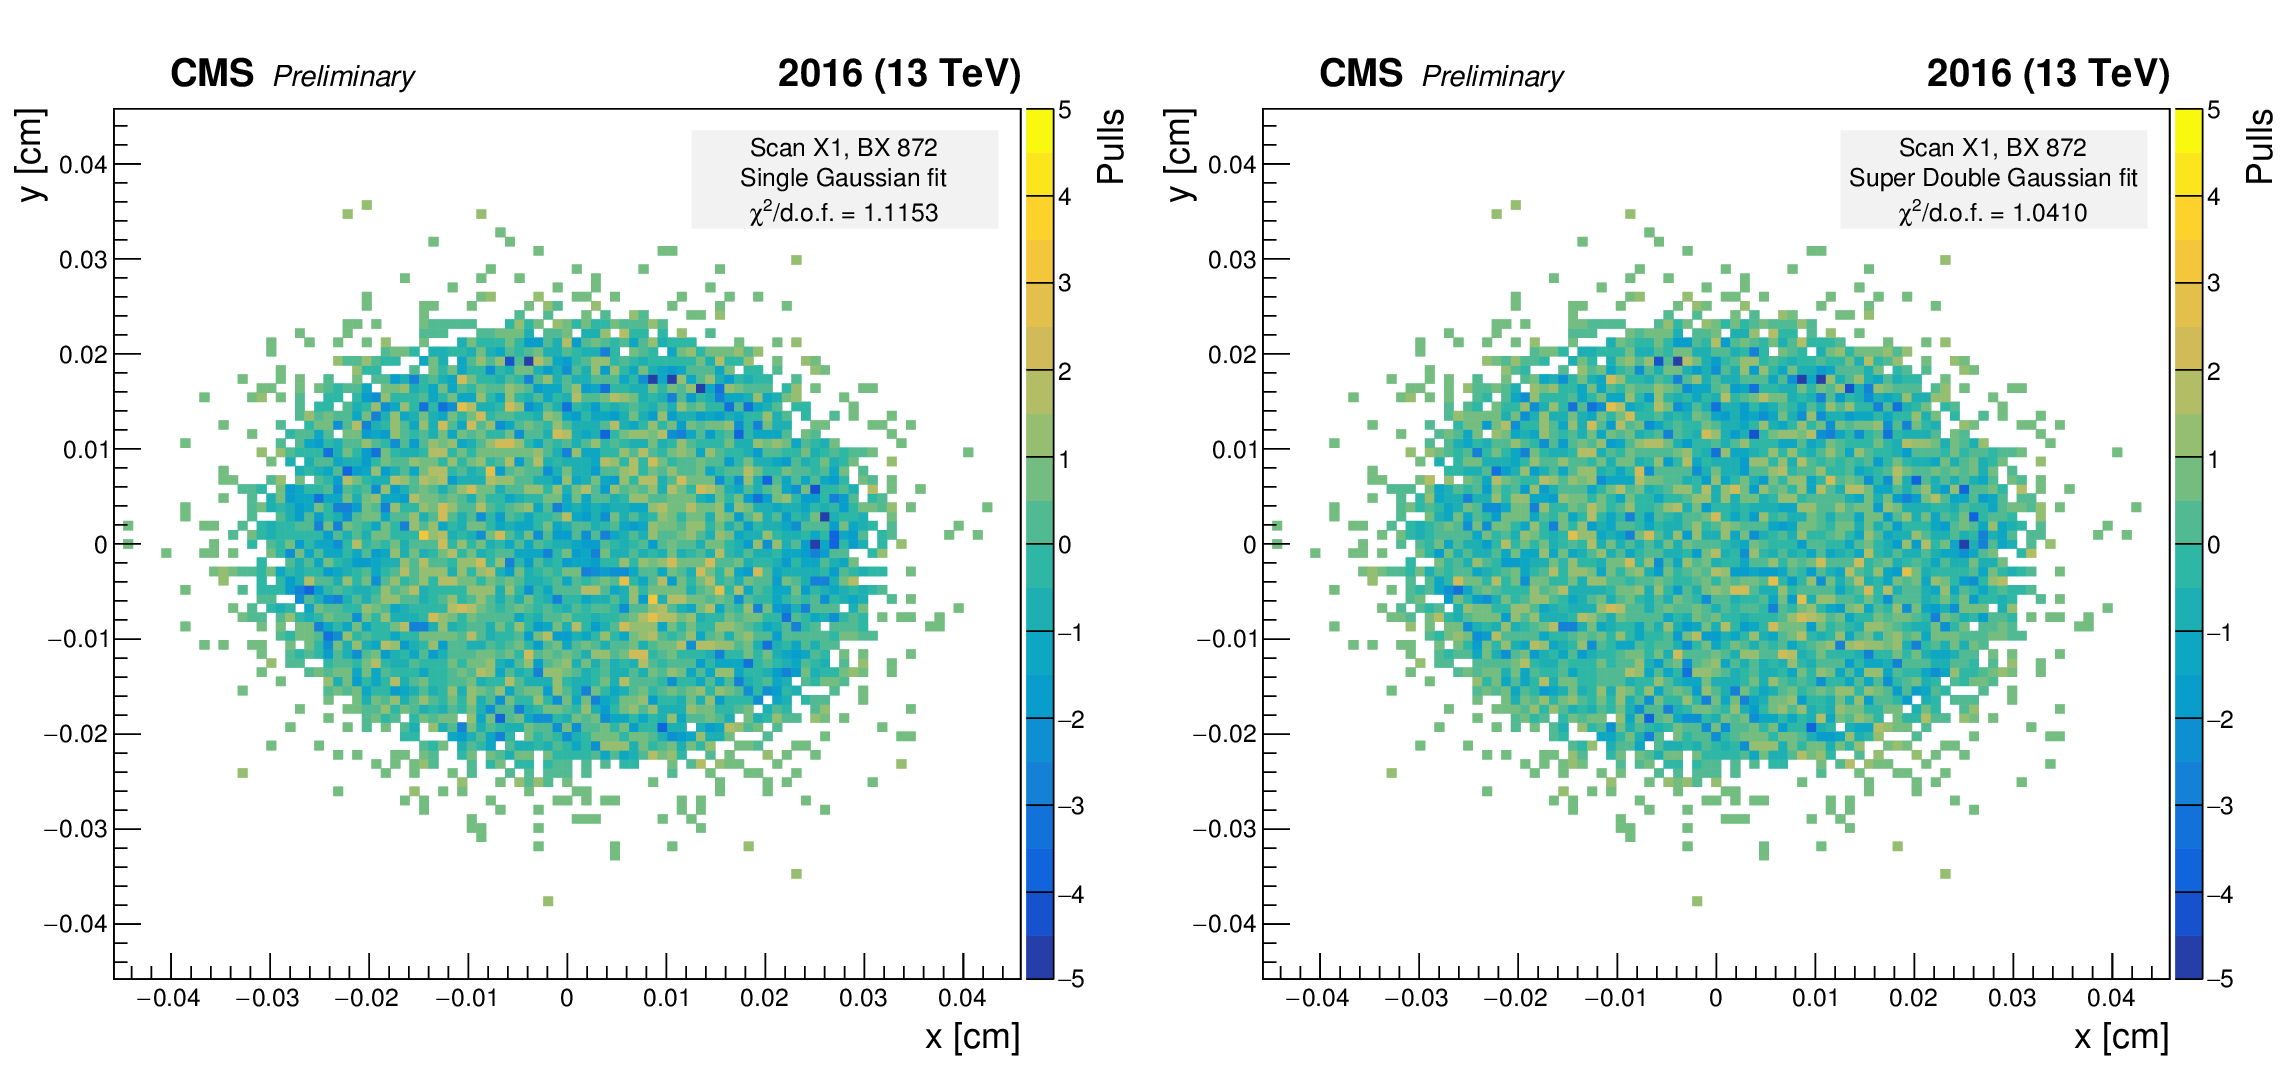
Example of the pull distributions of the fitted model of Single Gaussian type (left) and Super Double Gaussian type (right) with respect to the vertex distribution accumulated during scan X3 of BCID 872. |

png pdf |
Figure 7-a:
Example of the pull distributions of the fitted model of Single Gaussian type with respect to the vertex distribution accumulated during scan X3 of BCID 872. |

png pdf |
Figure 7-b:
Example of the pull distributions of the fitted model of Super Double Gaussian type with respect to the vertex distribution accumulated during scan X3 of BCID 872. |
| Tables | |
png pdf |
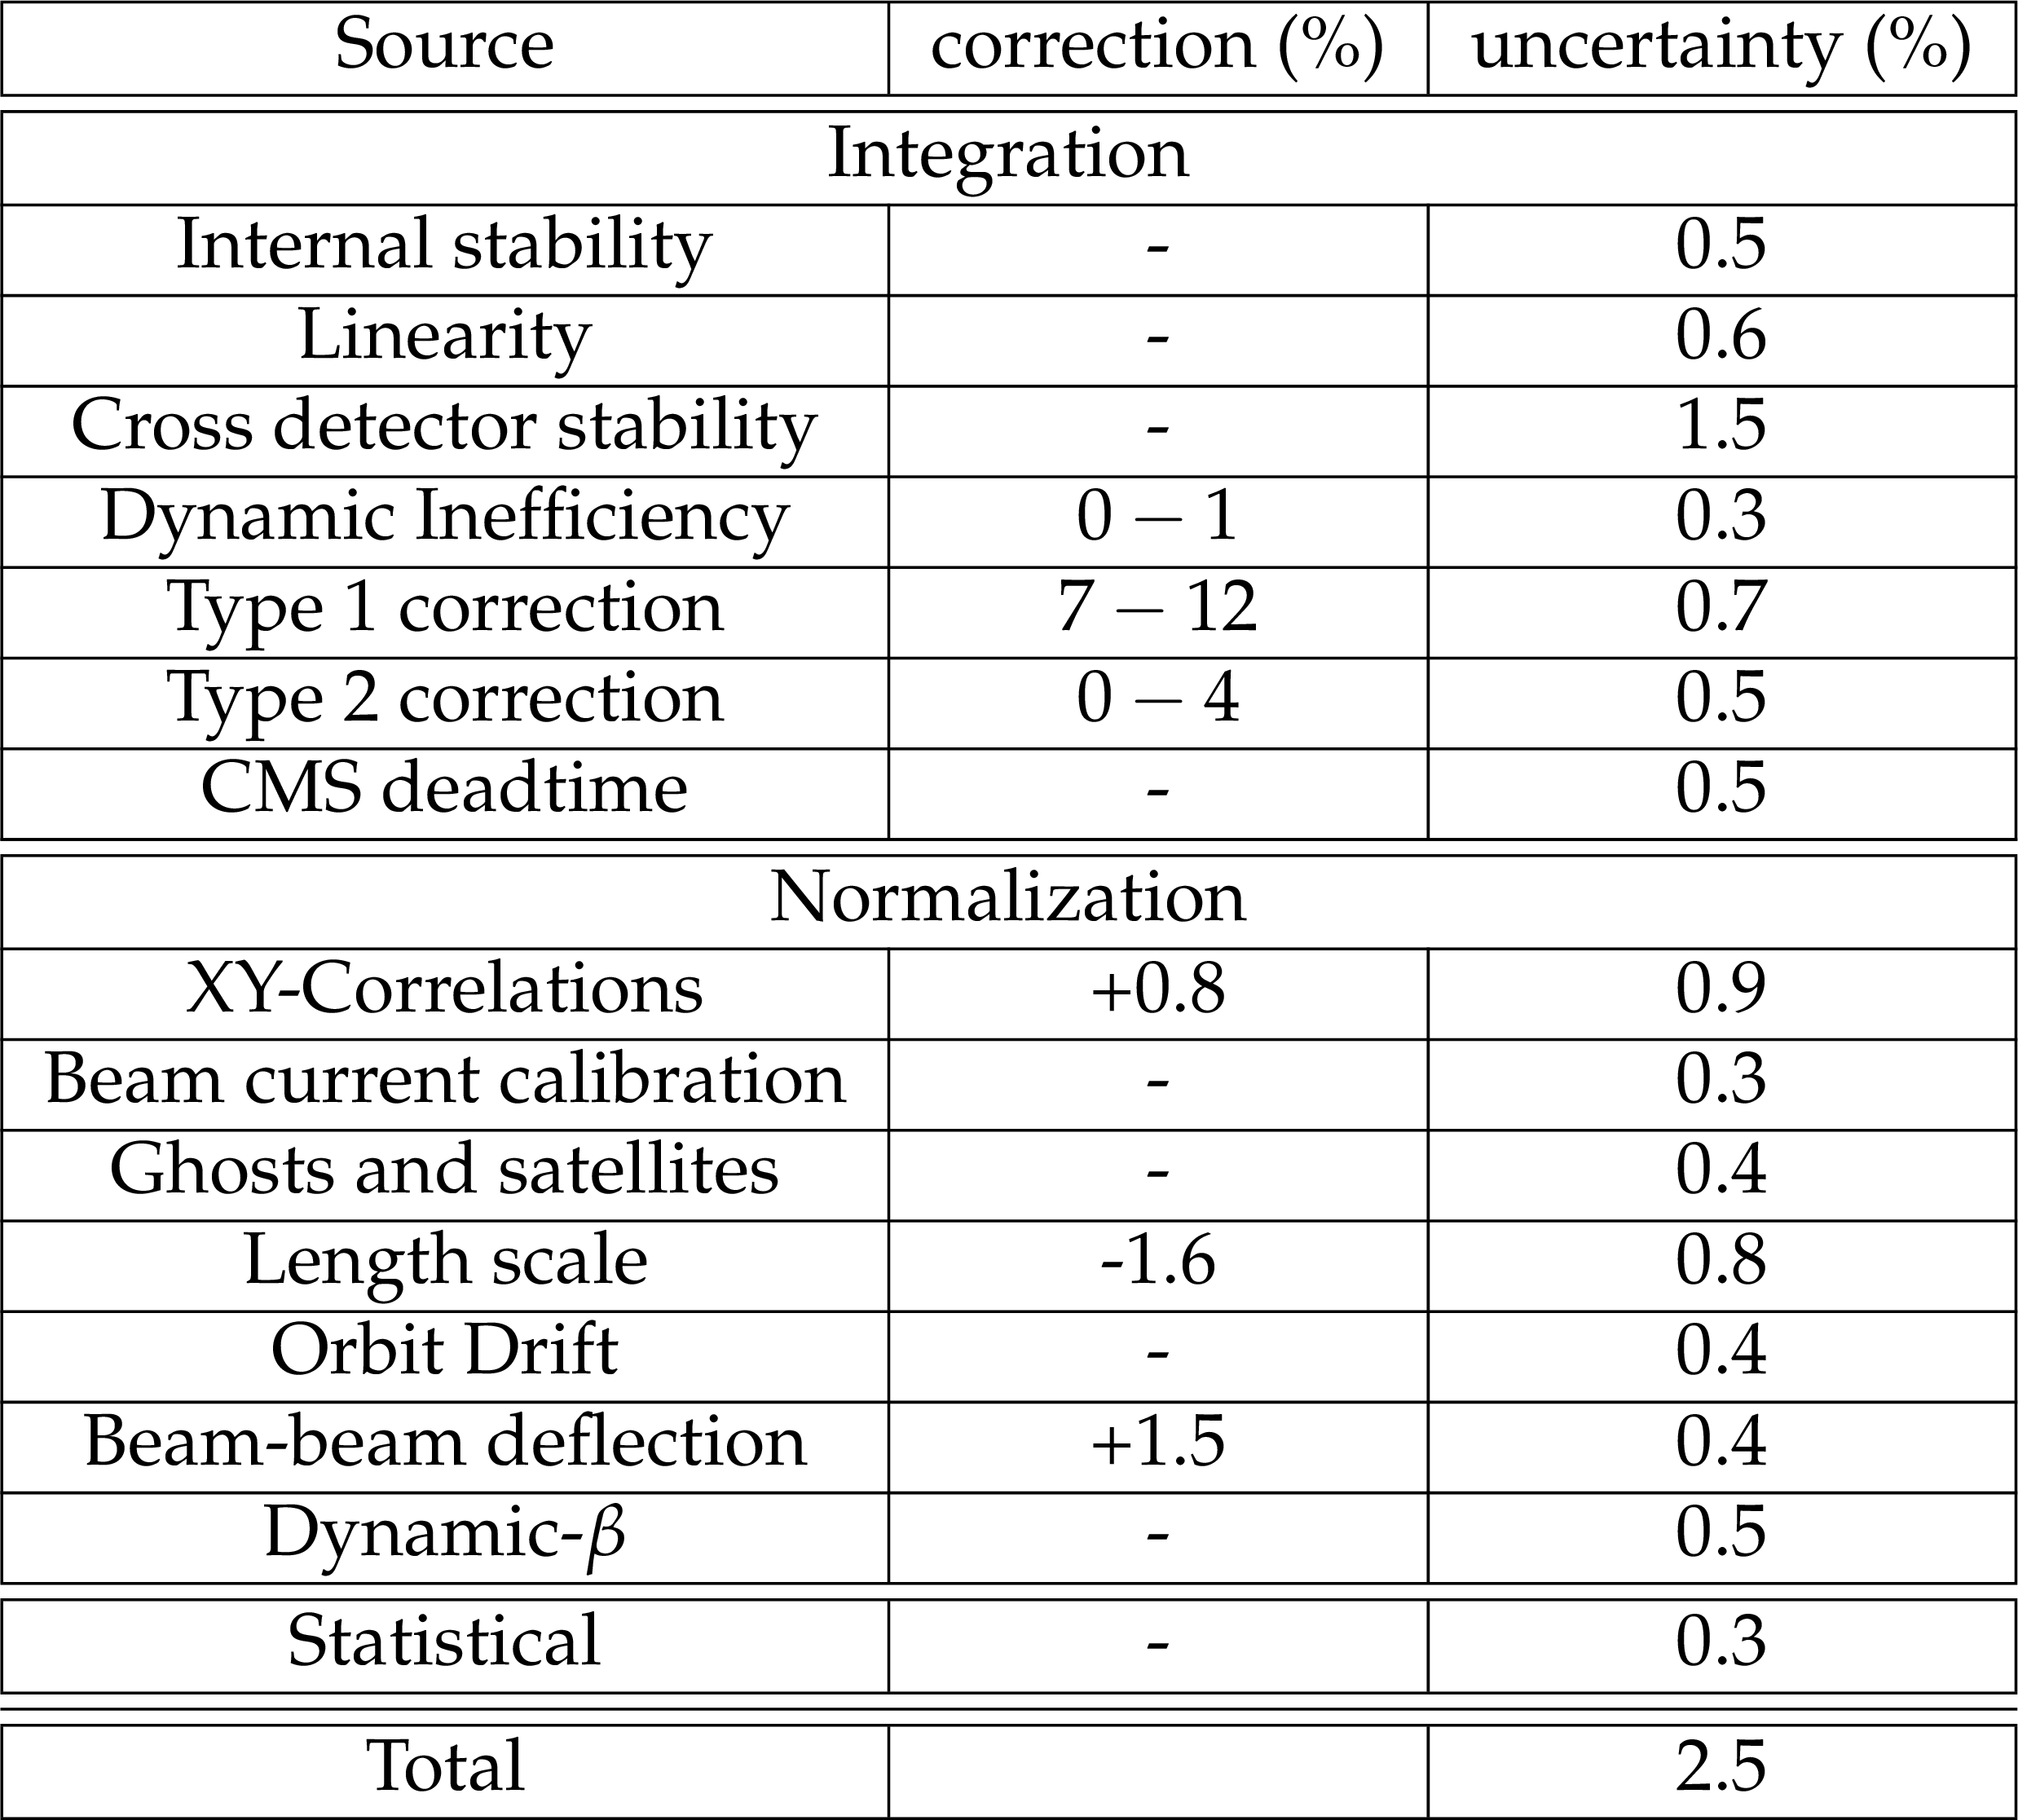
Table 1:
Summary of systematic uncertainties entering the CMS luminosity measurement for 13 TeV proton-proton collisions. When applicable, the percentage correction is shown. |
| Summary |
|
The analysis of the VdM scans performed by the CMS Collaboration in May 2016 for the calibration of the Pixel Cluster Counting rate to the absolute luminosity scale for proton-proton collisions at $\sqrt{s}= $ 13 TeV has been presented. Acceptance effects affecting the Pixel Cluster rate over time throughout the 2016 data-taking period have been identified and corrections derived. Table 1 summarizes the corrections and systematic uncertainties discussed in Sections 3.3 and 2.2. The various sources are grouped into uncertainties entering the normalization, i.e. luminosity scale calibration during the VdM scan procedure, and uncertainties entering the stability of the PCC rate over time. The dominant uncertainties contributing to the luminosity scale calibration are associated with the non-factorizability of the colliding proton bunch densities and the length scale calibration of the beam-beam separations. All normalization uncertainties are treated as uncorrelated and amount to a total uncertainty of 1.5% on the luminosity scale calibration. The integration uncertainty incorporates the uncertainties associated with the extrapolation of the PCC visible cross section to PCC rate measurements under usual data-taking conditions as discussed in Section 2. In addition, an uncertainty of 0.5% associated with the deadtime estimate of the CMS DAQ system is included affecting the recorded integrated luminosity. The total uncertainty in the integration of the visible cross section is estimated to be 2%. The uncertainties on the integration and normalization are treated as uncorrelated. In summary, the overall uncertainty in the measured integrated luminosity recorded by the CMS experiment is estimated to be 2.5%. |
| References | ||||
| 1 | CMS Collaboration | CMS Luminosity Measurement for the 2015 Data Taking Period | CMS-PAS-LUM-15-001 | CMS-PAS-LUM-15-001 |
| 2 | CMS Collaboration | CMS Luminosity Calibration for the pp Reference Run at $ \sqrt{s}= $ 5.02 TeV | CMS-PAS-LUM-16-001 | CMS-PAS-LUM-16-001 |
| 3 | S. van der Meer | Calibration of the effective beam height in the ISR | CERN-ISR-PO-68-31. ISR-PO-68-31 | |
| 4 | ALICE Collaboration | Measurement of visible cross sections in proton-lead collisions at $ \sqrt{s_{\rm NN}} $ = 5.02 TeV in van der Meer scans with the ALICE detector | JINST 9 (2014), no. 11, P11003 | 1405.1849 |
| 5 | ATLAS Collaboration | Improved luminosity determination in pp collisions at $ \sqrt{s} $ = 7 TeV using the ATLAS detector at the LHC | EPJC73 (2013), no. 8 | 1302.4393 |
| 6 | LHCb Collaboration | Precision luminosity measurements at LHCb | JINST 9 (2014), no. 12, P12005 | 1410.0149 |
| 7 | CMS Collaboration | CMS Luminosity Based on Pixel Cluster Counting - Summer 2013 Update | CDS | |
| 8 | P. Odier, M. Ludwig, and S. Thoulet | The DCCT for the LHC Beam Intensity Measurement | CERN-BE-2009-019, May | |
| 9 | D. Belohrad et al. | The LHC Fast BCT system: A comparison of Design Parameters with Initial Performance | CERN-BE-2010-010, May | |
| 10 | A. Jeff et al. | Longitudinal density monitor for the LHC | PRST Accel. Beams 15 (Mar, 2012) 032803 | |
| 11 | A. Jeff, C. Welsch, and A. Boccardi | PhD thesis, Liverpool U., Dec, 2012 Presented 11 Dec 2012 | ||
| 12 | M. Gasior, J. Olexa, and R. Steinhagen | BPM Electronics based on Compensated Diode Detectors – Results from Development Systems | Conf. Proc. C1204151 (Apr, 2012) MOPG010. 3 p | |
| 13 | M. Zanetti | Beams Scan based Absolute Normalization of the CMS Luminosity Measurement. CMS 2010 luminosity determination | CERN-Proceedings-2011-001, Jan | |
| 14 | CMS Collaboration | CMS Luminosity Based on Pixel Cluster Counting - Summer 2012 Update | CDS | |
| 15 | M. Klute, C. Medlock, and J. Salfeld-Nebgen | Beam imaging and luminosity calibration | Journal of Instrumentation 12 (2017), no. 03, P03018 | |
| 16 | W. Kozanecki, T. Pieloni, and J. Wenninger | Observation of Beam-Beam Deflections with LHC Orbit Data | CERN-ACC-NOTE-2013-0006, Aug | |
|
|
Compact Muon Solenoid LHC, CERN |
|

|

|

|

|

|