

Compact Muon Solenoid
LHC, CERN
| CMS-PAS-FTR-18-004 | ||
| Prospects for a search for gluon-mediated FCNC in top quark production using the CMS Phase-2 detector at the HL-LHC | ||
| CMS Collaboration | ||
| September 2018 | ||
| Abstract: Prospects are presented for a search for gluon-mediated flavour-changing neutral currents in the top quark production via tug and tcg vertices using the CMS Phase-2 detector at the HL-LHC. The analysis uses Monte Carlo samples of proton-proton collisions at $\sqrt{s} = $ 14 TeV with a full simulation of the Phase-2 upgraded CMS detector assuming an average of 200 proton-proton interactions per bunch crossing. The final state signature of the signal is similar to that for the t-channel single top quark production in the $\mu \rm e $+ jets final state. Bayesian and deep learning neural networks are used to discriminate the signal events against backgrounds. The 95% C.L. expected exclusion limits on the coupling strengths are $|\kappa_\mathrm{tug}| /\lambda < 1.8\times 10^{-3}\, (2.9\times 10^{-3})\, \mathrm{TeV}^{-1}$ and $|\kappa_\mathrm{tcg}| /\lambda < 5.2\times 10^{-3}\, (9.1\times 10^{-3})\, \mathrm{TeV}^{-1}$ for integrated luminosity of 3000 fb$^{-1}$ (300 fb$^{-1}$). The corresponding limits on branching fractions are $\mathcal{B}(\rm t\rightarrow \rm{ug}) < 3.8 \times 10^{-6}\, (9.8 \times 10^{-6})$ and $\mathcal{B}(\rm t\rightarrow \rm{cg}) < 32 \times 10^{-6}\, (99 \times 10^{-6})$ for integrated luminosity of 3000 fb$^{-1}$ (300 fb$^{-1}$). Therefore, the exploitation of the full HL-LHC data set with the upgraded CMS detector will allow to improve the current limits by an order of magnitude. | ||
| Links: CDS record (PDF) ; inSPIRE record ; CADI line (restricted) ; | ||
| Figures & Tables | Summary | Additional Tables | References | CMS Publications |
|---|
| Figures | |
png pdf |
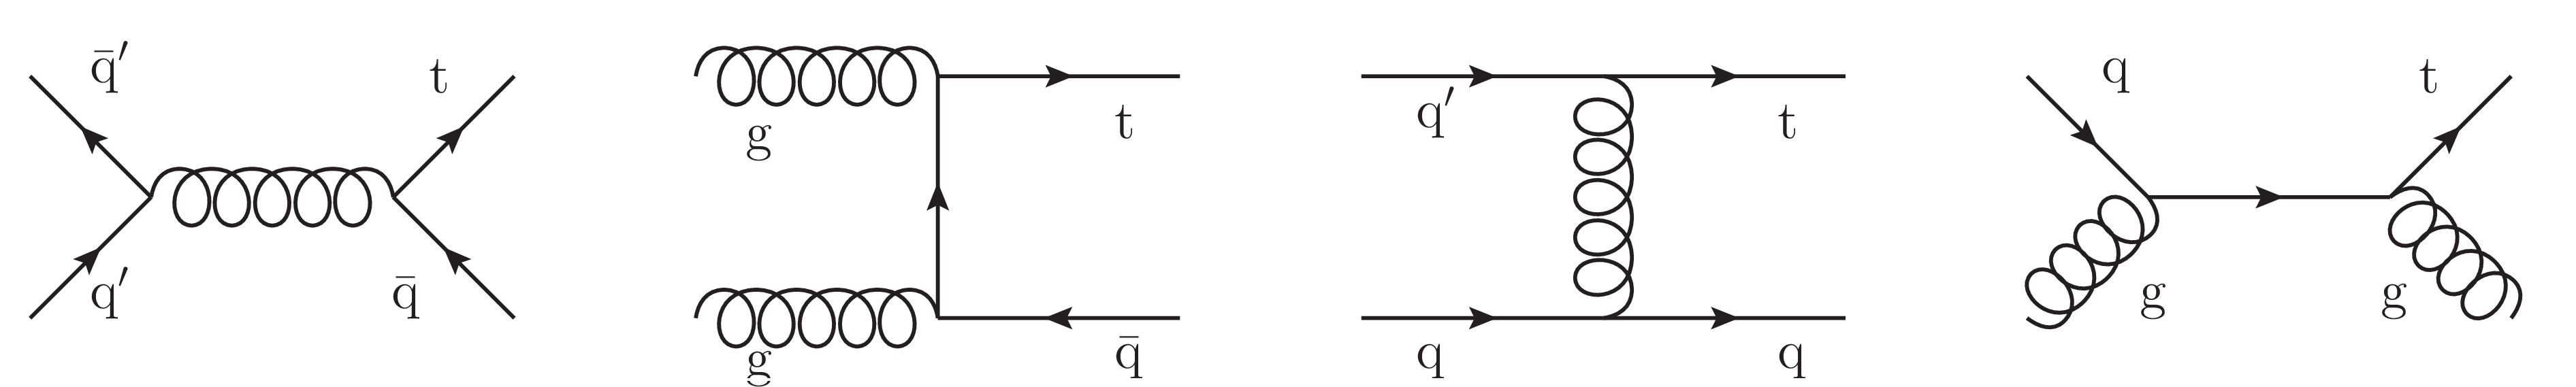
Figure 1:
Representative Feynman diagrams for the FCNC processes with tqg interactions (q=u,c). |

png pdf |
Figure 2:
The Multijet BNN input variable distributions: ${m_{\mathrm T}({\mathrm {W}})}$ (top left), ${E_{\mathrm {T}}^{\text {miss}}}$ (top right), $\Delta \phi (\rm lep, {E_{\mathrm {T}}^{\text {miss}}})$ (middle left) and $ {p_{\mathrm {T}}} (\rm lep)$ (middle right). Comparison of distributions of the training and testing events of the Multijet BNN (bottom left) and resulting distribution of the Multijet BNN discriminant (bottom right). The solid and dashed lines give the expected distributions for FCNC tgu and tgc processes, respectively, assuming a coupling of $| \kappa _{\rm tug}| = $ 0.09 and $| \kappa _{\rm tcg}| = $ 0.06 TeV$ ^{-1}$. Both muon and electron channels are presented on the plots. |

png pdf |
Figure 2-a:
The Multijet BNN input variable distributions: ${m_{\mathrm T}({\mathrm {W}})}$ (top left), ${E_{\mathrm {T}}^{\text {miss}}}$ (top right), $\Delta \phi (\rm lep, {E_{\mathrm {T}}^{\text {miss}}})$ (middle left) and $ {p_{\mathrm {T}}} (\rm lep)$ (middle right). Comparison of distributions of the training and testing events of the Multijet BNN (bottom left) and resulting distribution of the Multijet BNN discriminant (bottom right). The solid and dashed lines give the expected distributions for FCNC tgu and tgc processes, respectively, assuming a coupling of $| \kappa _{\rm tug}| = $ 0.09 and $| \kappa _{\rm tcg}| = $ 0.06 TeV$ ^{-1}$. Both muon and electron channels are presented on the plots. |

png pdf |
Figure 2-b:
The Multijet BNN input variable distributions: ${m_{\mathrm T}({\mathrm {W}})}$ (top left), ${E_{\mathrm {T}}^{\text {miss}}}$ (top right), $\Delta \phi (\rm lep, {E_{\mathrm {T}}^{\text {miss}}})$ (middle left) and $ {p_{\mathrm {T}}} (\rm lep)$ (middle right). Comparison of distributions of the training and testing events of the Multijet BNN (bottom left) and resulting distribution of the Multijet BNN discriminant (bottom right). The solid and dashed lines give the expected distributions for FCNC tgu and tgc processes, respectively, assuming a coupling of $| \kappa _{\rm tug}| = $ 0.09 and $| \kappa _{\rm tcg}| = $ 0.06 TeV$ ^{-1}$. Both muon and electron channels are presented on the plots. |

png pdf |
Figure 2-c:
The Multijet BNN input variable distributions: ${m_{\mathrm T}({\mathrm {W}})}$ (top left), ${E_{\mathrm {T}}^{\text {miss}}}$ (top right), $\Delta \phi (\rm lep, {E_{\mathrm {T}}^{\text {miss}}})$ (middle left) and $ {p_{\mathrm {T}}} (\rm lep)$ (middle right). Comparison of distributions of the training and testing events of the Multijet BNN (bottom left) and resulting distribution of the Multijet BNN discriminant (bottom right). The solid and dashed lines give the expected distributions for FCNC tgu and tgc processes, respectively, assuming a coupling of $| \kappa _{\rm tug}| = $ 0.09 and $| \kappa _{\rm tcg}| = $ 0.06 TeV$ ^{-1}$. Both muon and electron channels are presented on the plots. |
png pdf |
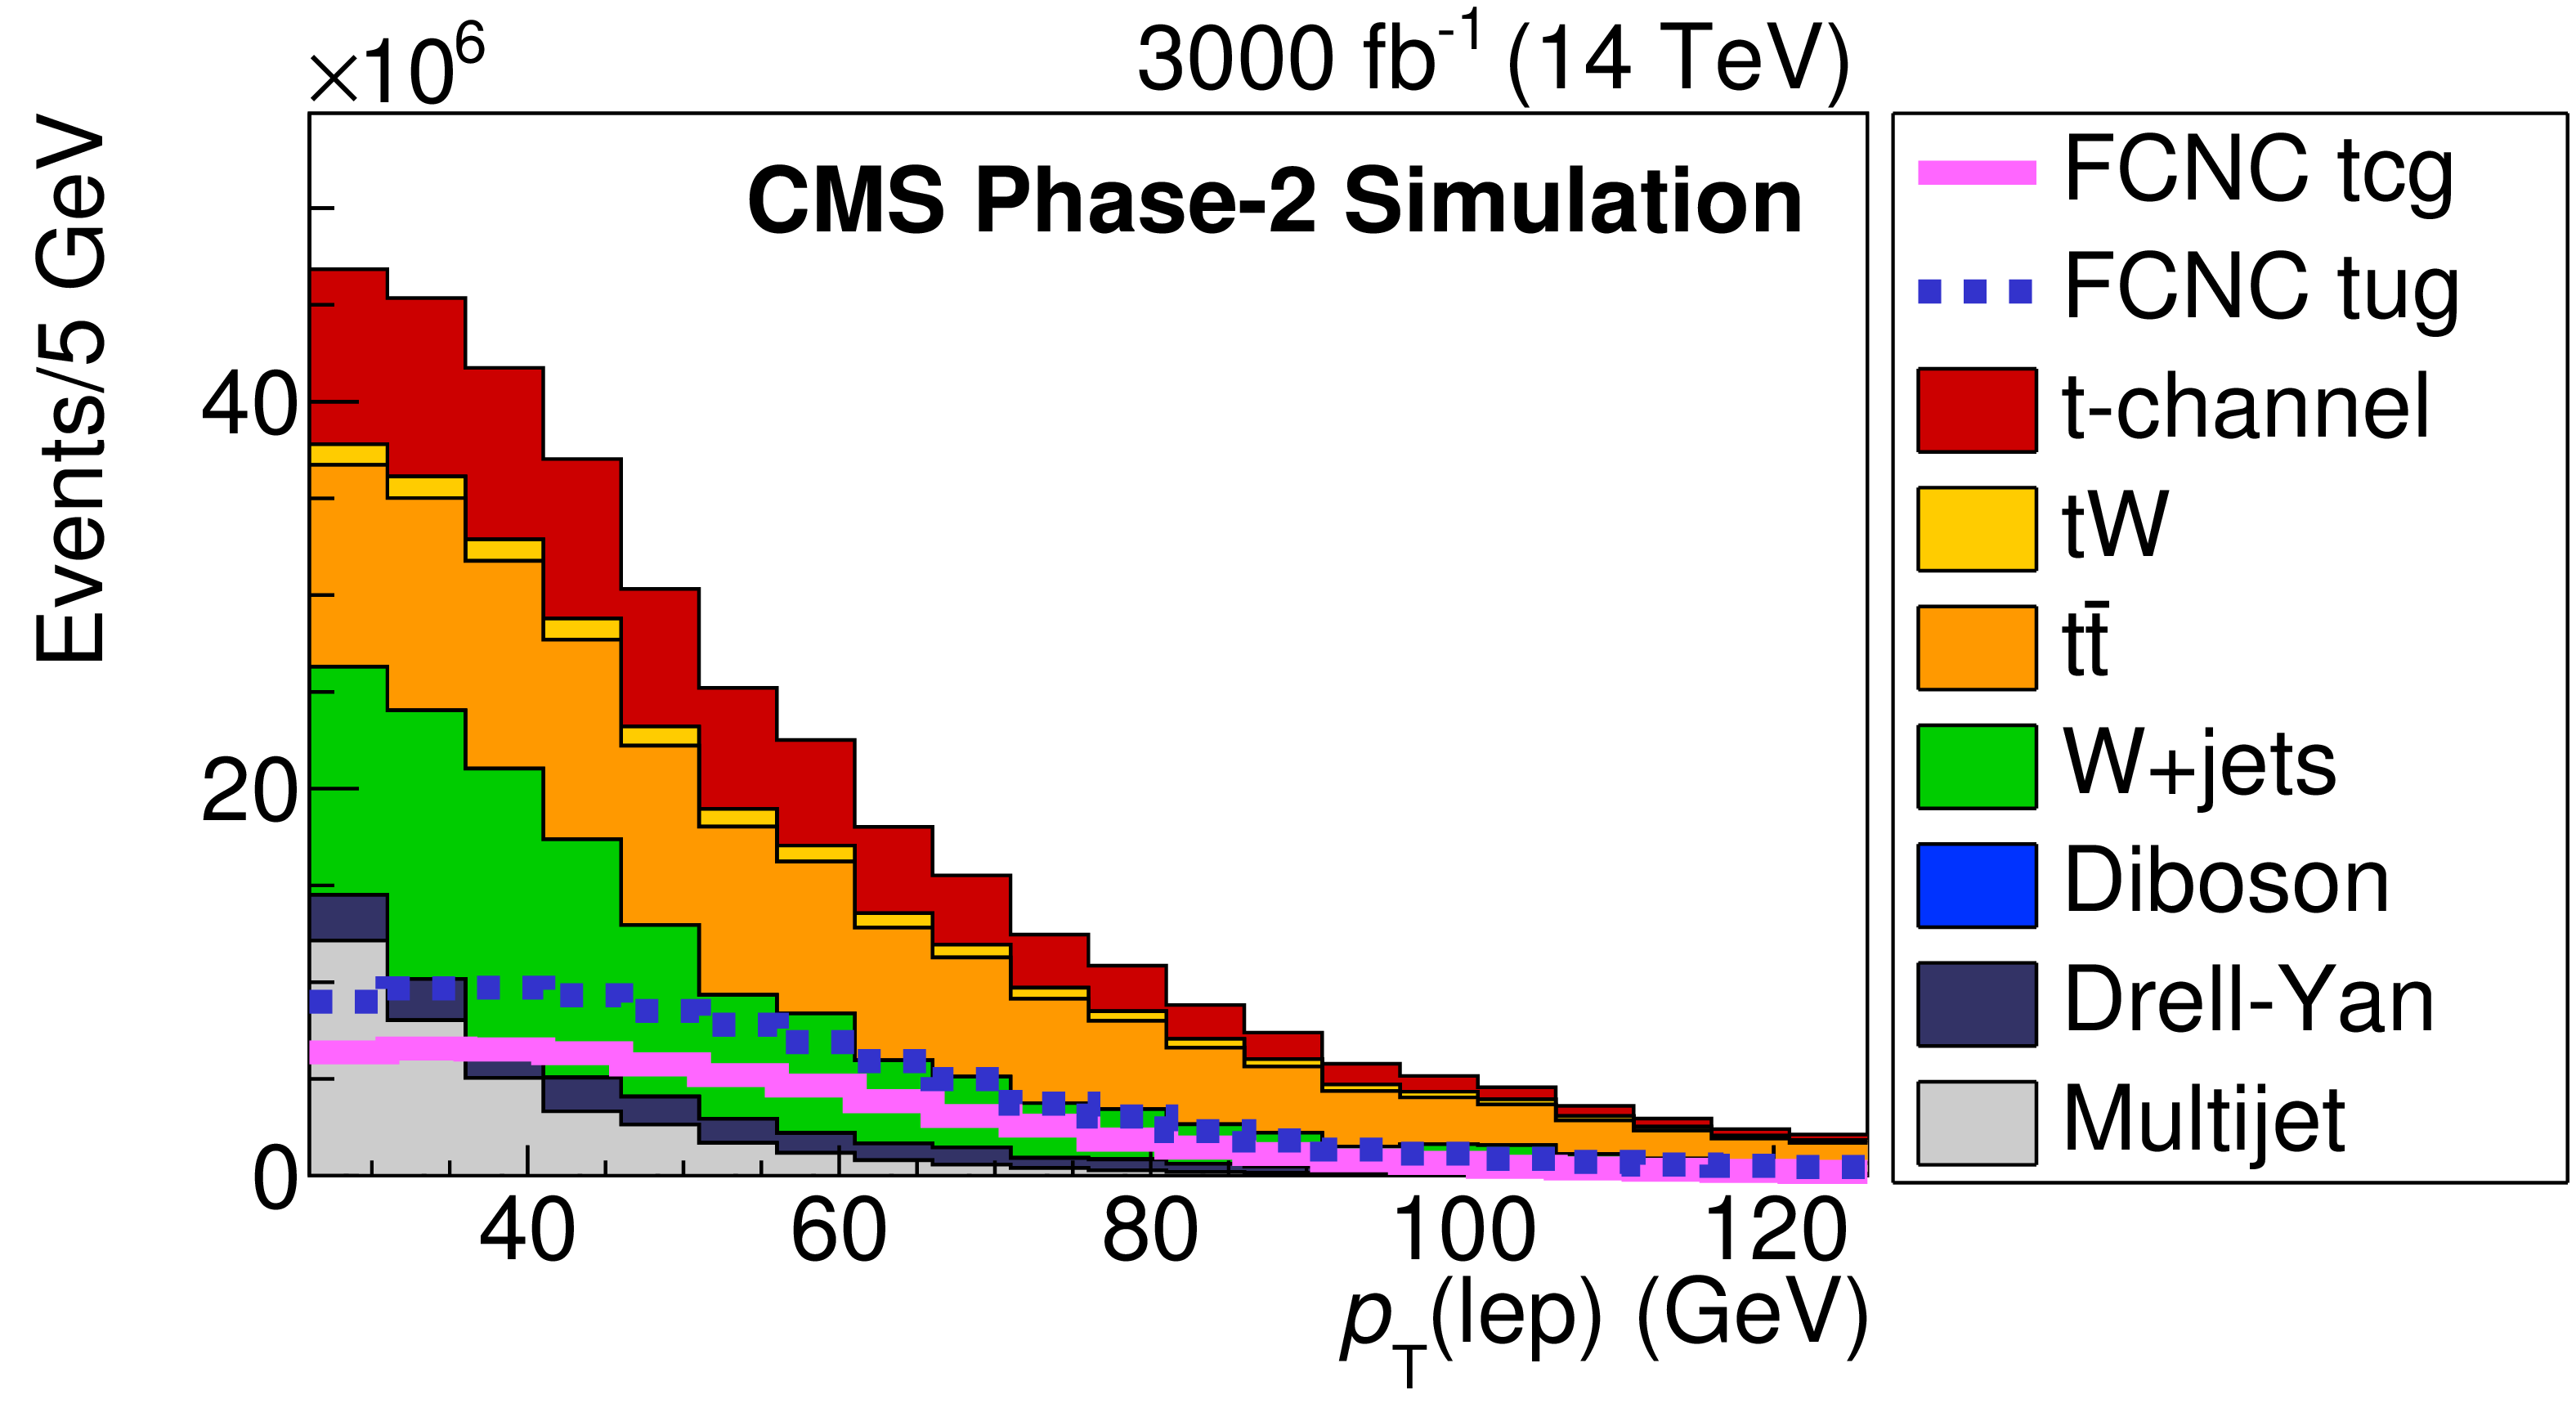
Figure 2-d:
The Multijet BNN input variable distributions: ${m_{\mathrm T}({\mathrm {W}})}$ (top left), ${E_{\mathrm {T}}^{\text {miss}}}$ (top right), $\Delta \phi (\rm lep, {E_{\mathrm {T}}^{\text {miss}}})$ (middle left) and $ {p_{\mathrm {T}}} (\rm lep)$ (middle right). Comparison of distributions of the training and testing events of the Multijet BNN (bottom left) and resulting distribution of the Multijet BNN discriminant (bottom right). The solid and dashed lines give the expected distributions for FCNC tgu and tgc processes, respectively, assuming a coupling of $| \kappa _{\rm tug}| = $ 0.09 and $| \kappa _{\rm tcg}| = $ 0.06 TeV$ ^{-1}$. Both muon and electron channels are presented on the plots. |

png pdf |
Figure 2-e:
The Multijet BNN input variable distributions: ${m_{\mathrm T}({\mathrm {W}})}$ (top left), ${E_{\mathrm {T}}^{\text {miss}}}$ (top right), $\Delta \phi (\rm lep, {E_{\mathrm {T}}^{\text {miss}}})$ (middle left) and $ {p_{\mathrm {T}}} (\rm lep)$ (middle right). Comparison of distributions of the training and testing events of the Multijet BNN (bottom left) and resulting distribution of the Multijet BNN discriminant (bottom right). The solid and dashed lines give the expected distributions for FCNC tgu and tgc processes, respectively, assuming a coupling of $| \kappa _{\rm tug}| = $ 0.09 and $| \kappa _{\rm tcg}| = $ 0.06 TeV$ ^{-1}$. Both muon and electron channels are presented on the plots. |
png pdf |
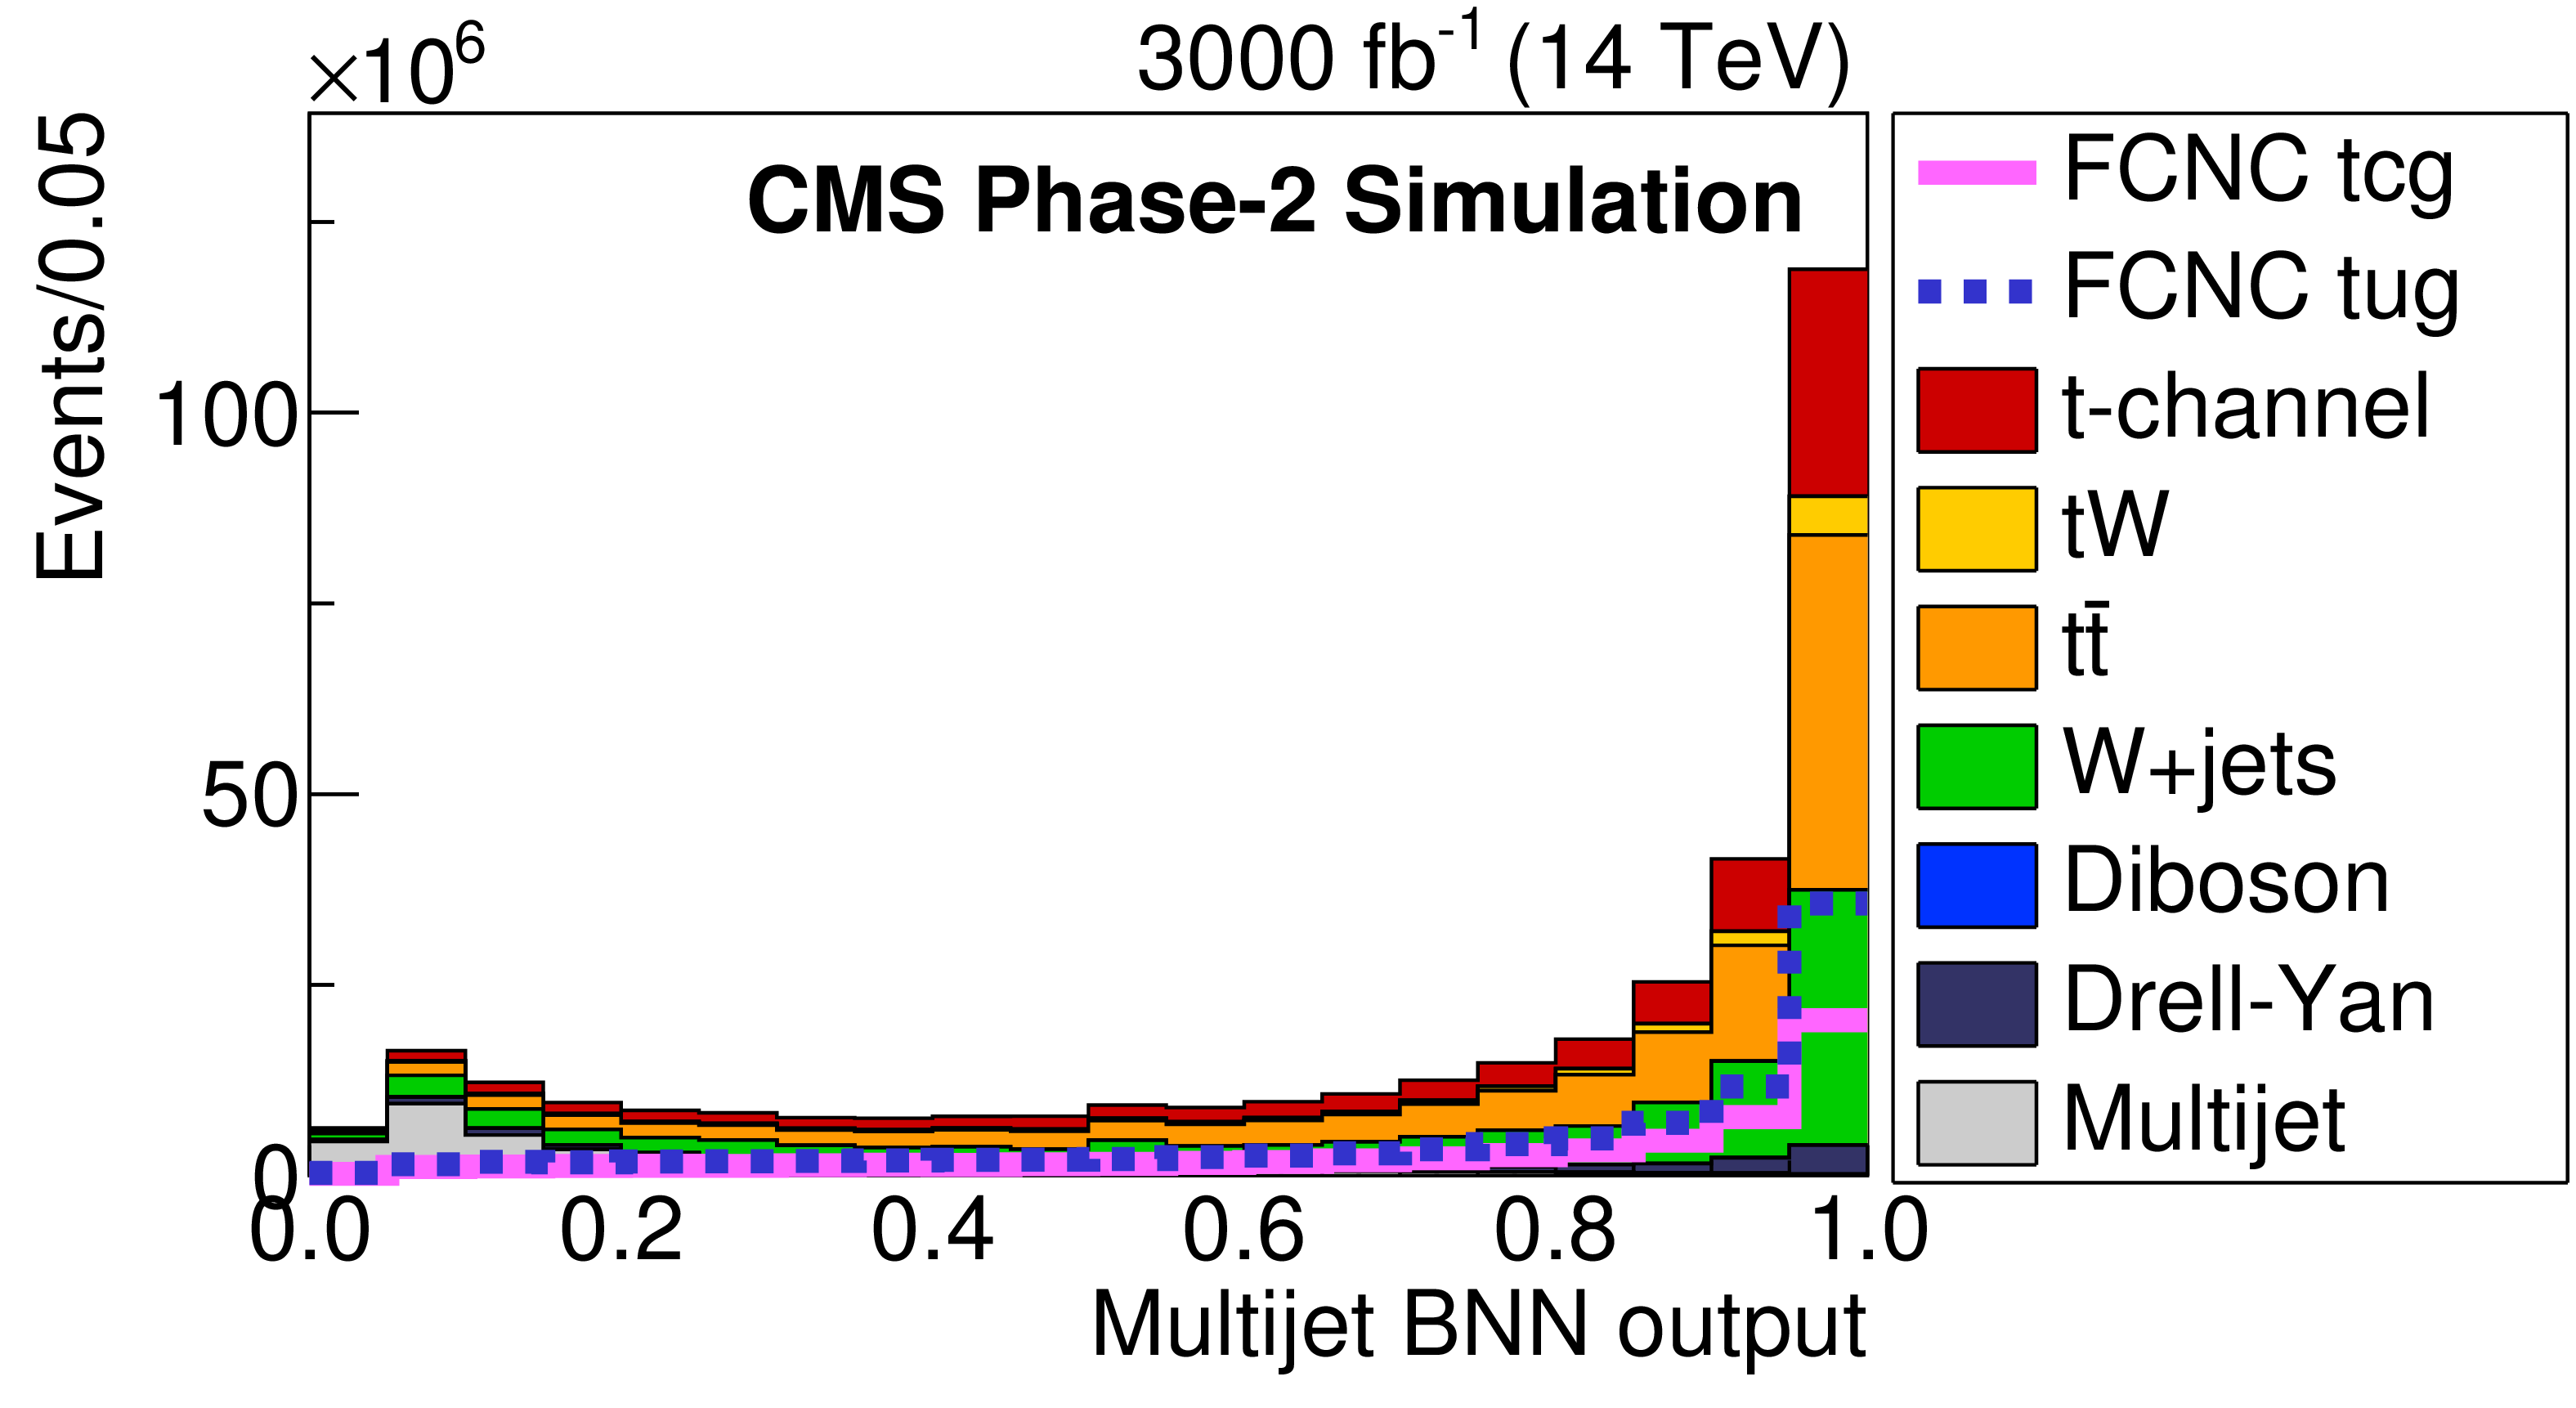
Figure 2-f:
The Multijet BNN input variable distributions: ${m_{\mathrm T}({\mathrm {W}})}$ (top left), ${E_{\mathrm {T}}^{\text {miss}}}$ (top right), $\Delta \phi (\rm lep, {E_{\mathrm {T}}^{\text {miss}}})$ (middle left) and $ {p_{\mathrm {T}}} (\rm lep)$ (middle right). Comparison of distributions of the training and testing events of the Multijet BNN (bottom left) and resulting distribution of the Multijet BNN discriminant (bottom right). The solid and dashed lines give the expected distributions for FCNC tgu and tgc processes, respectively, assuming a coupling of $| \kappa _{\rm tug}| = $ 0.09 and $| \kappa _{\rm tcg}| = $ 0.06 TeV$ ^{-1}$. Both muon and electron channels are presented on the plots. |

png pdf |
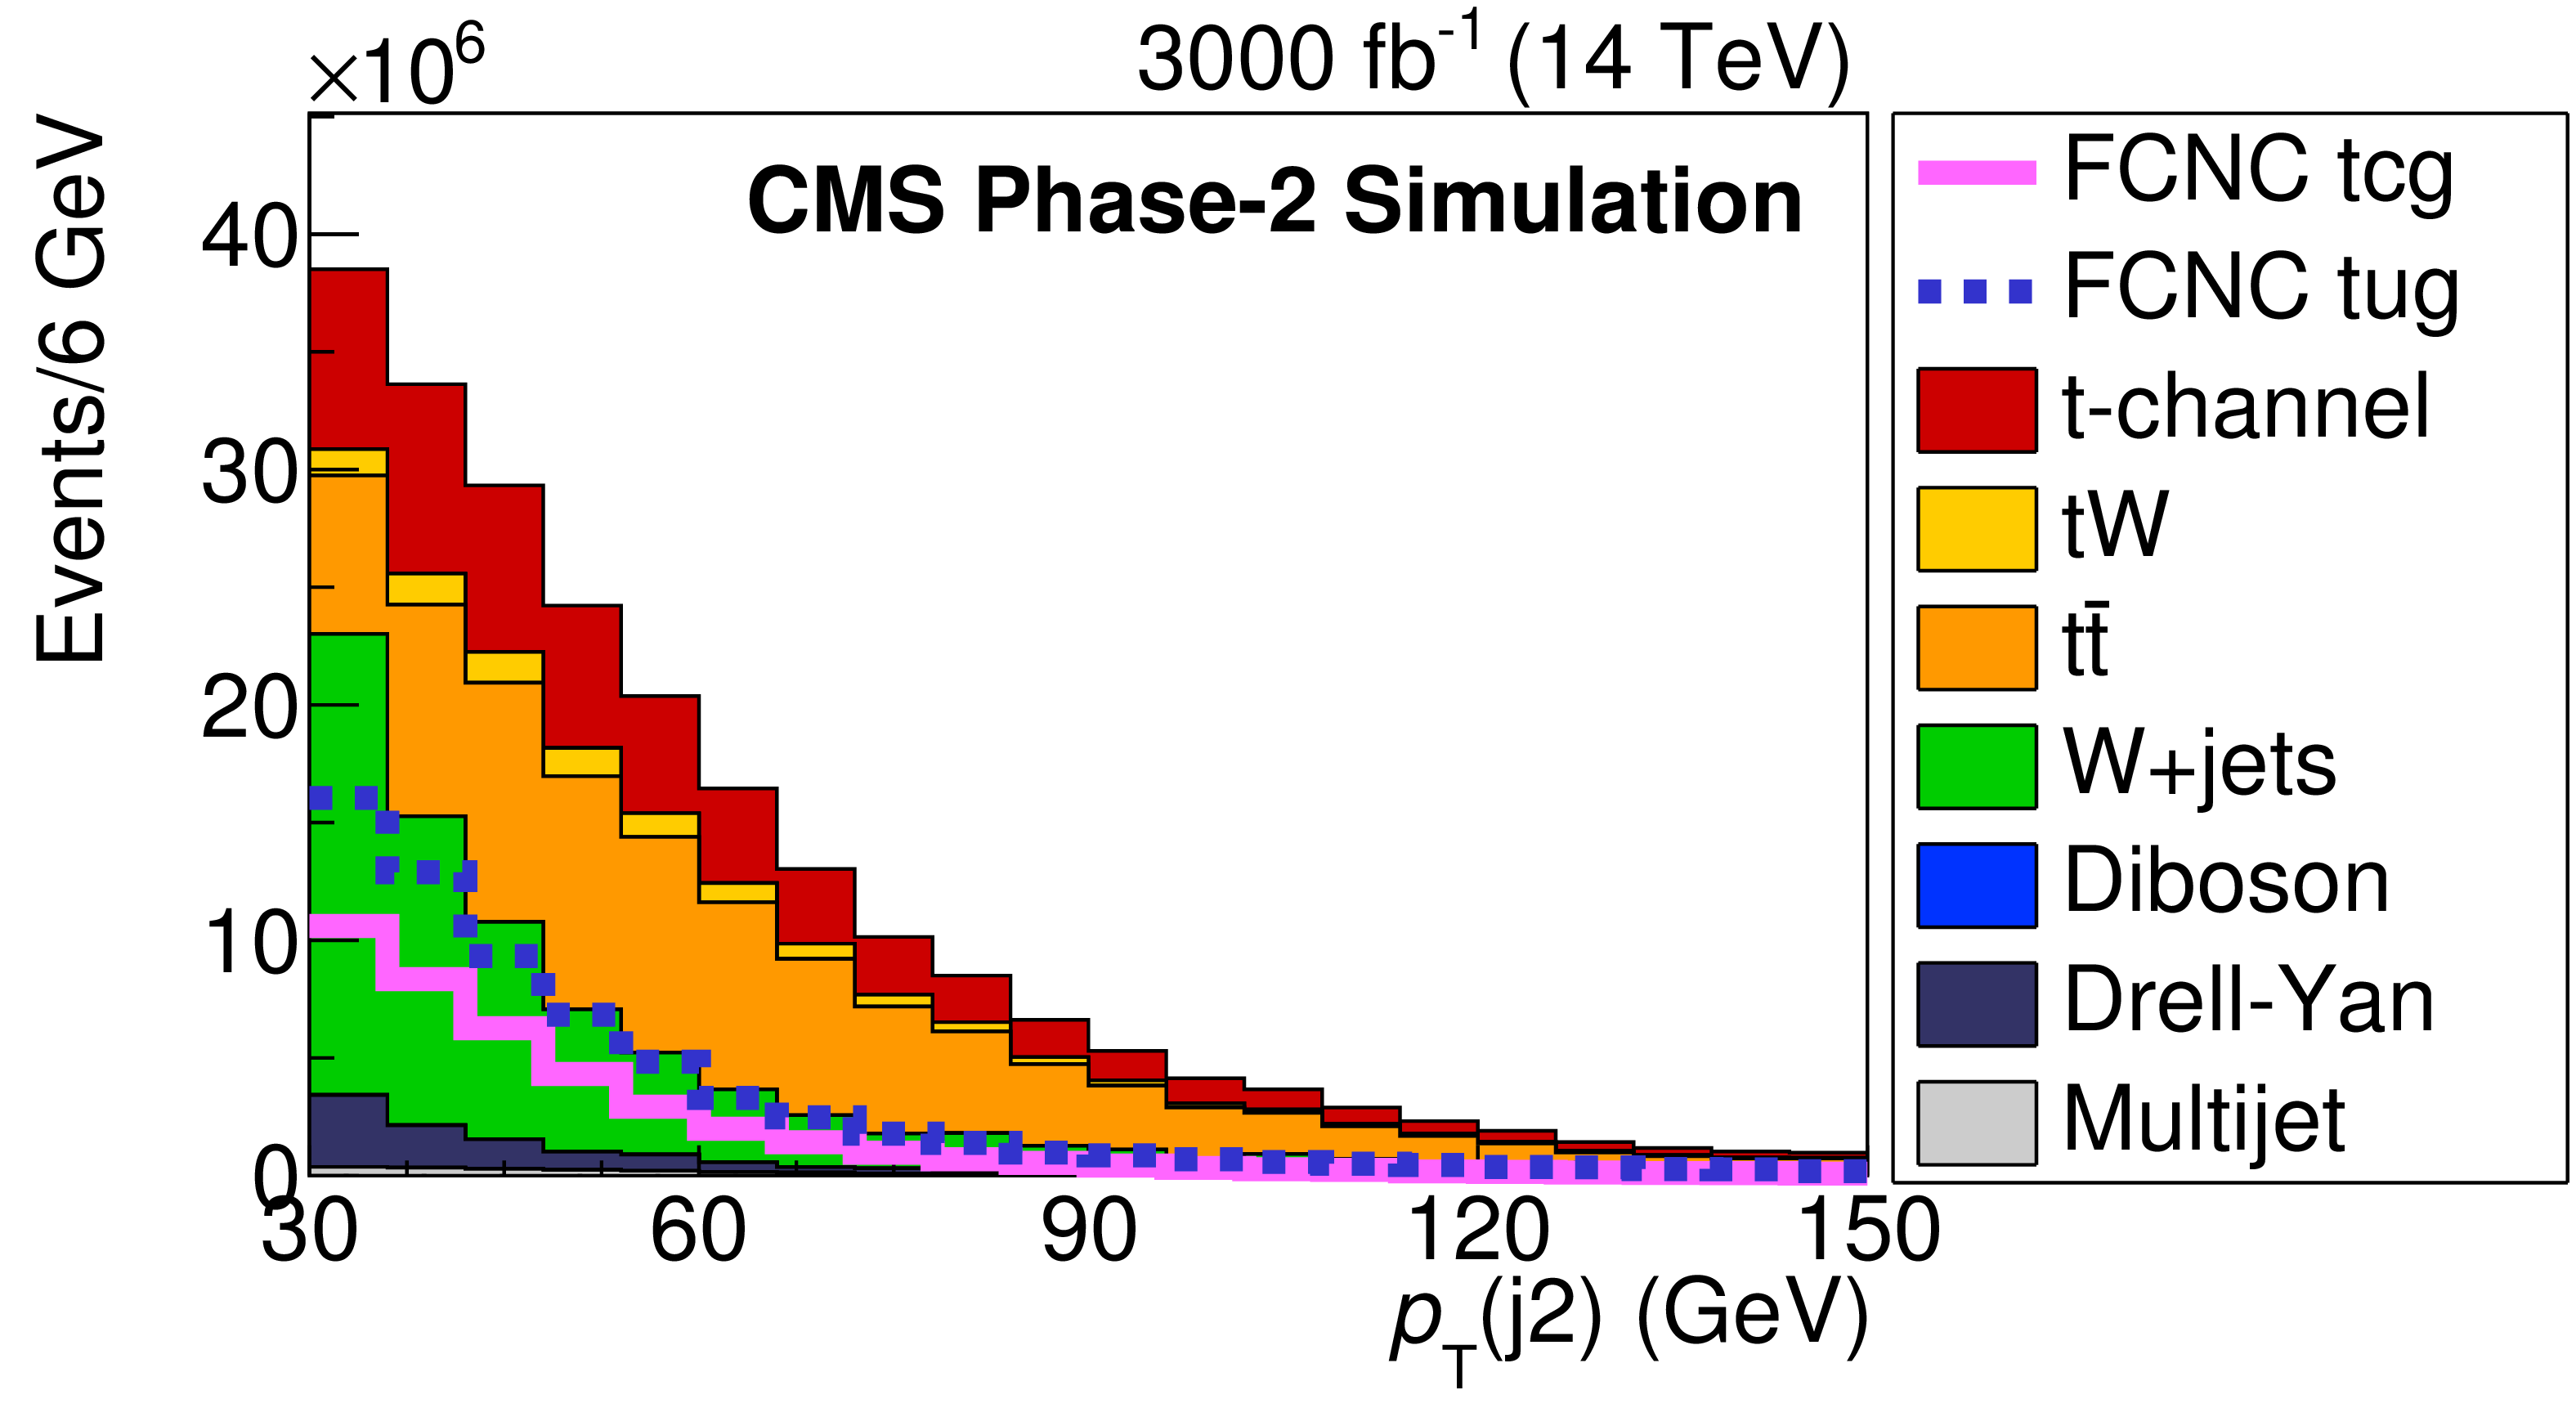
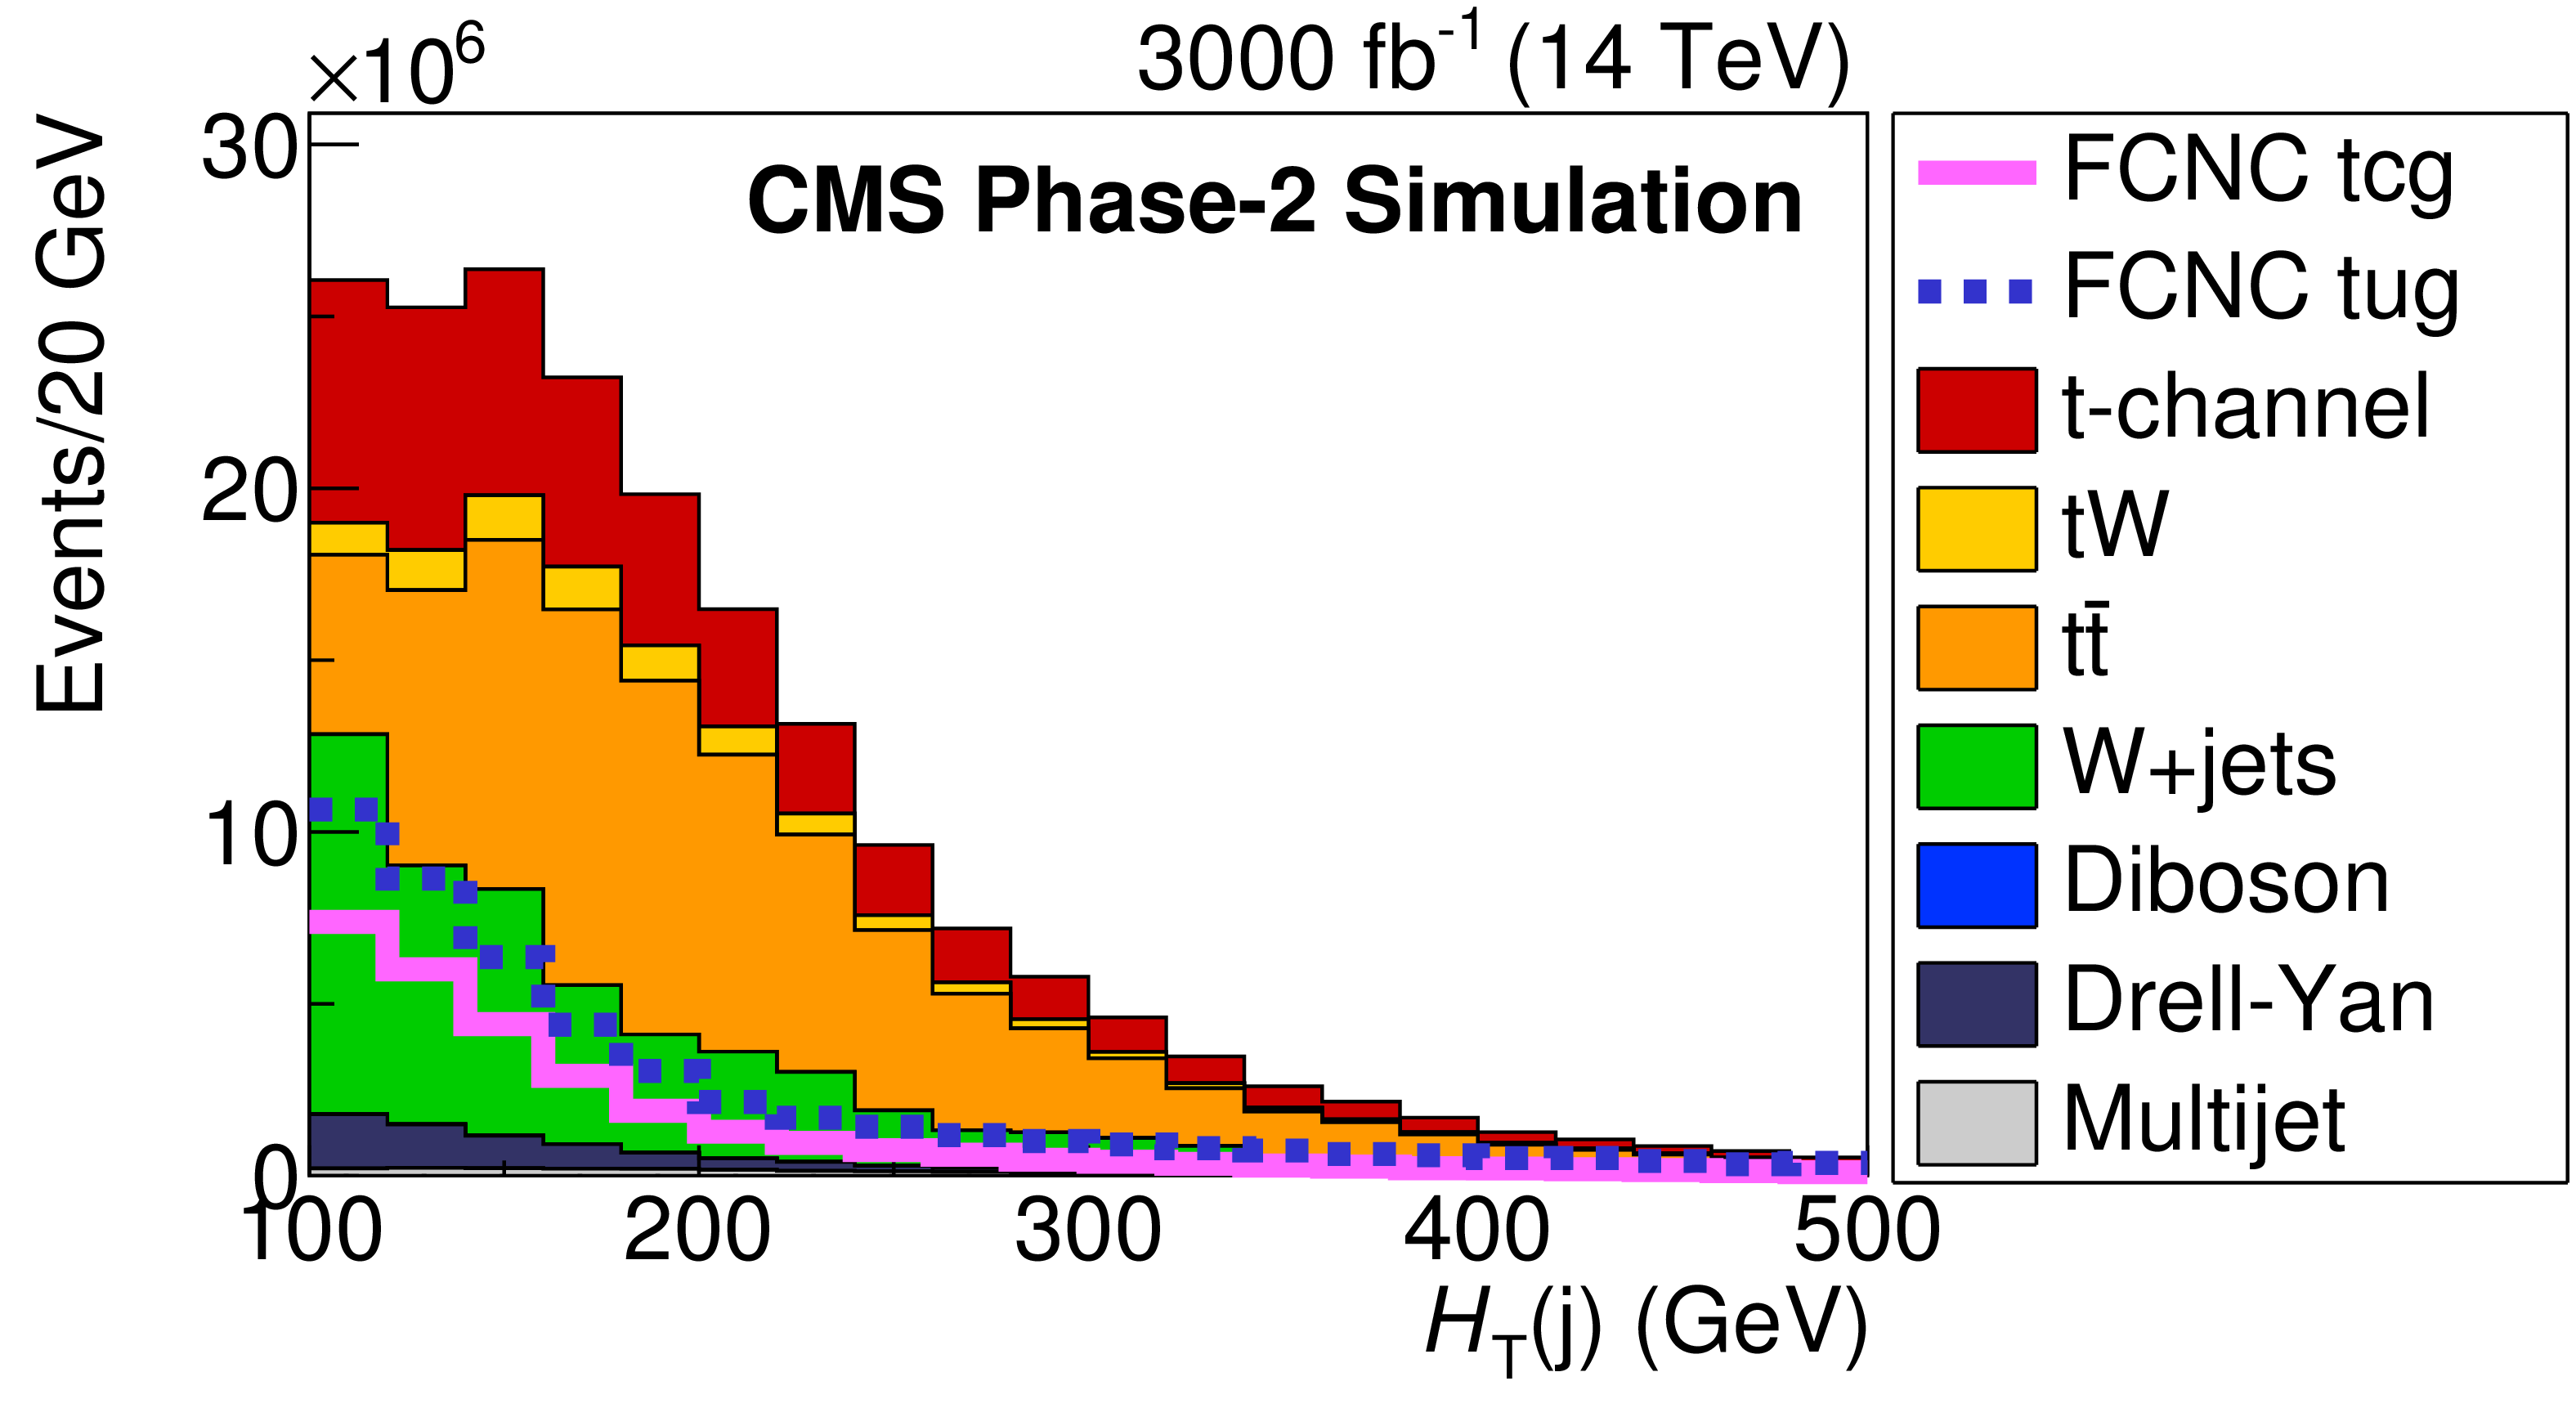
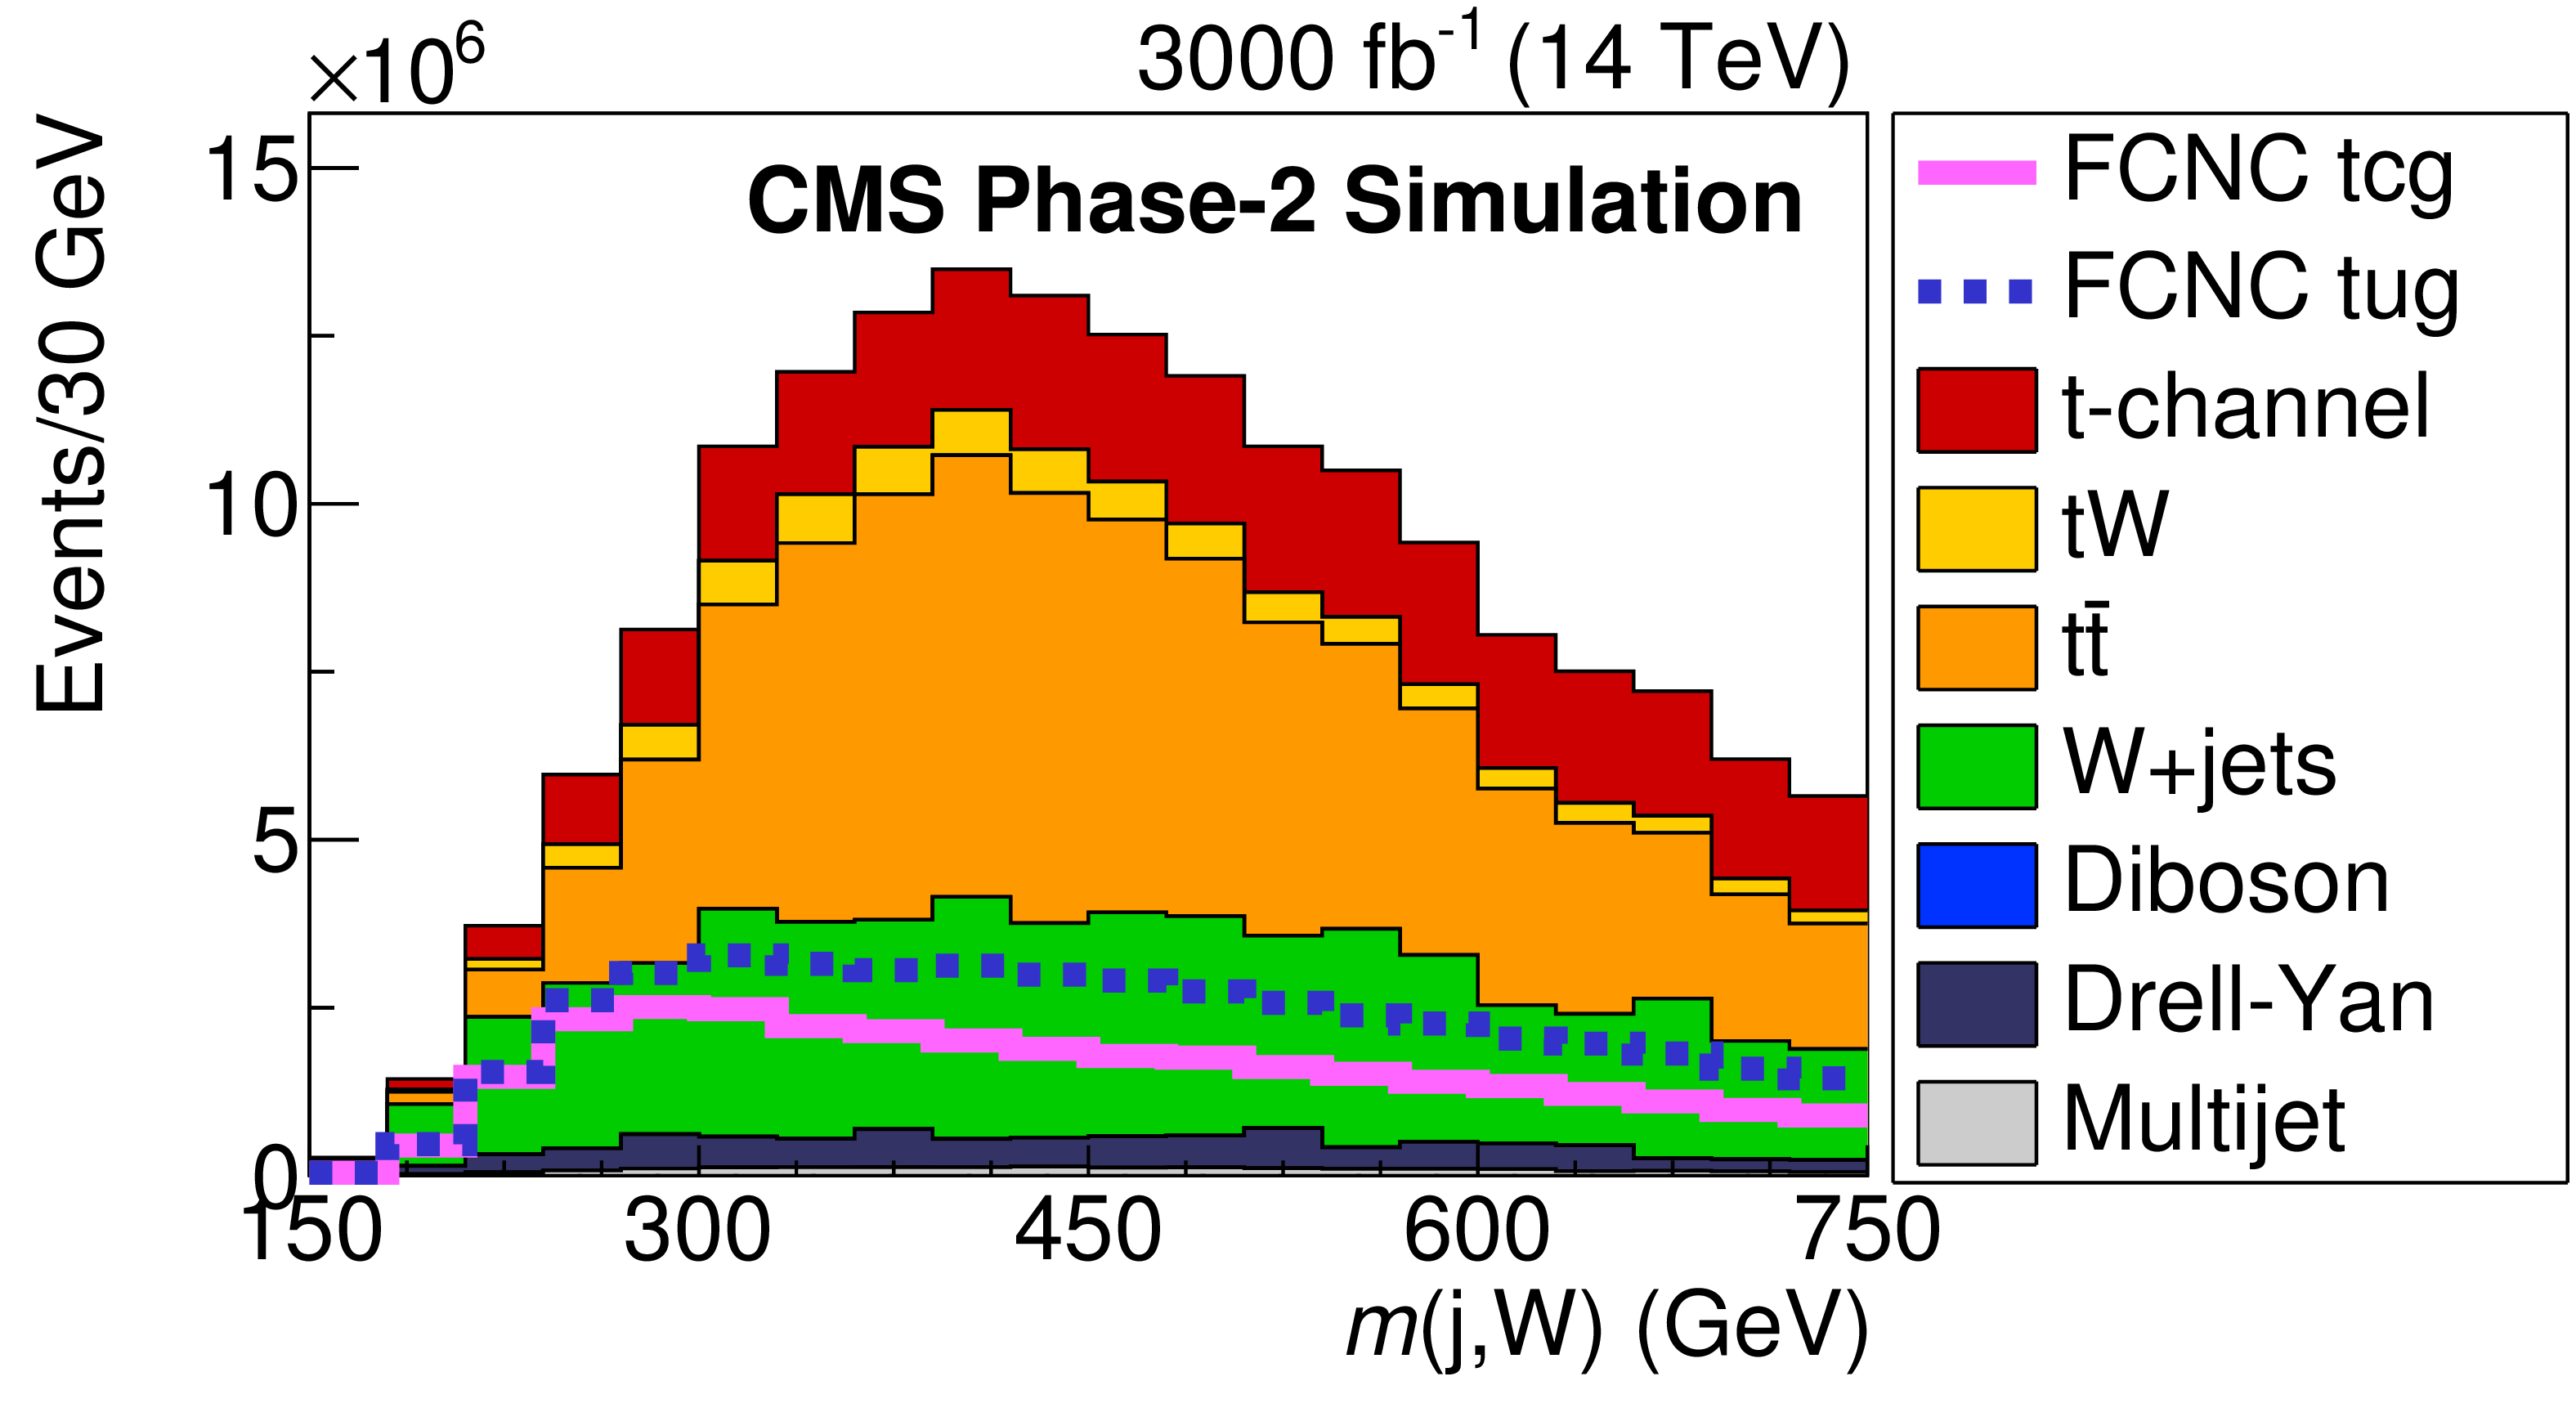
Figure 3:
Comparison of FCNC tgc and tgu signal with the SM processes for the BNN input variables. The solid and dashed lines give the expected distributions for FCNC tgu and tgc processes, respectively, assuming the couplings $ | \kappa _{\rm tug}| = $ 0.06 TeV$ ^{-1}$ and $| \kappa _{\rm tcg}| = $ 0.09 TeV$ ^{-1}$. The requirement of Multijet BNN $ > $ 0.7 is applied. The variables are described in Table1. |

png pdf |
Figure 3-a:
Comparison of FCNC tgc and tgu signal with the SM processes for the BNN input variables. The solid and dashed lines give the expected distributions for FCNC tgu and tgc processes, respectively, assuming the couplings $ | \kappa _{\rm tug}| = $ 0.06 TeV$ ^{-1}$ and $| \kappa _{\rm tcg}| = $ 0.09 TeV$ ^{-1}$. The requirement of Multijet BNN $ > $ 0.7 is applied. The variables are described in Table1. |
png pdf |
Figure 3-b:
Comparison of FCNC tgc and tgu signal with the SM processes for the BNN input variables. The solid and dashed lines give the expected distributions for FCNC tgu and tgc processes, respectively, assuming the couplings $ | \kappa _{\rm tug}| = $ 0.06 TeV$ ^{-1}$ and $| \kappa _{\rm tcg}| = $ 0.09 TeV$ ^{-1}$. The requirement of Multijet BNN $ > $ 0.7 is applied. The variables are described in Table1. |

png pdf |
Figure 3-c:
Comparison of FCNC tgc and tgu signal with the SM processes for the BNN input variables. The solid and dashed lines give the expected distributions for FCNC tgu and tgc processes, respectively, assuming the couplings $ | \kappa _{\rm tug}| = $ 0.06 TeV$ ^{-1}$ and $| \kappa _{\rm tcg}| = $ 0.09 TeV$ ^{-1}$. The requirement of Multijet BNN $ > $ 0.7 is applied. The variables are described in Table1. |
png pdf |
Figure 3-d:
Comparison of FCNC tgc and tgu signal with the SM processes for the BNN input variables. The solid and dashed lines give the expected distributions for FCNC tgu and tgc processes, respectively, assuming the couplings $ | \kappa _{\rm tug}| = $ 0.06 TeV$ ^{-1}$ and $| \kappa _{\rm tcg}| = $ 0.09 TeV$ ^{-1}$. The requirement of Multijet BNN $ > $ 0.7 is applied. The variables are described in Table1. |
png pdf |
Figure 3-e:
Comparison of FCNC tgc and tgu signal with the SM processes for the BNN input variables. The solid and dashed lines give the expected distributions for FCNC tgu and tgc processes, respectively, assuming the couplings $ | \kappa _{\rm tug}| = $ 0.06 TeV$ ^{-1}$ and $| \kappa _{\rm tcg}| = $ 0.09 TeV$ ^{-1}$. The requirement of Multijet BNN $ > $ 0.7 is applied. The variables are described in Table1. |

png pdf |
Figure 3-f:
Comparison of FCNC tgc and tgu signal with the SM processes for the BNN input variables. The solid and dashed lines give the expected distributions for FCNC tgu and tgc processes, respectively, assuming the couplings $ | \kappa _{\rm tug}| = $ 0.06 TeV$ ^{-1}$ and $| \kappa _{\rm tcg}| = $ 0.09 TeV$ ^{-1}$. The requirement of Multijet BNN $ > $ 0.7 is applied. The variables are described in Table1. |
png pdf |
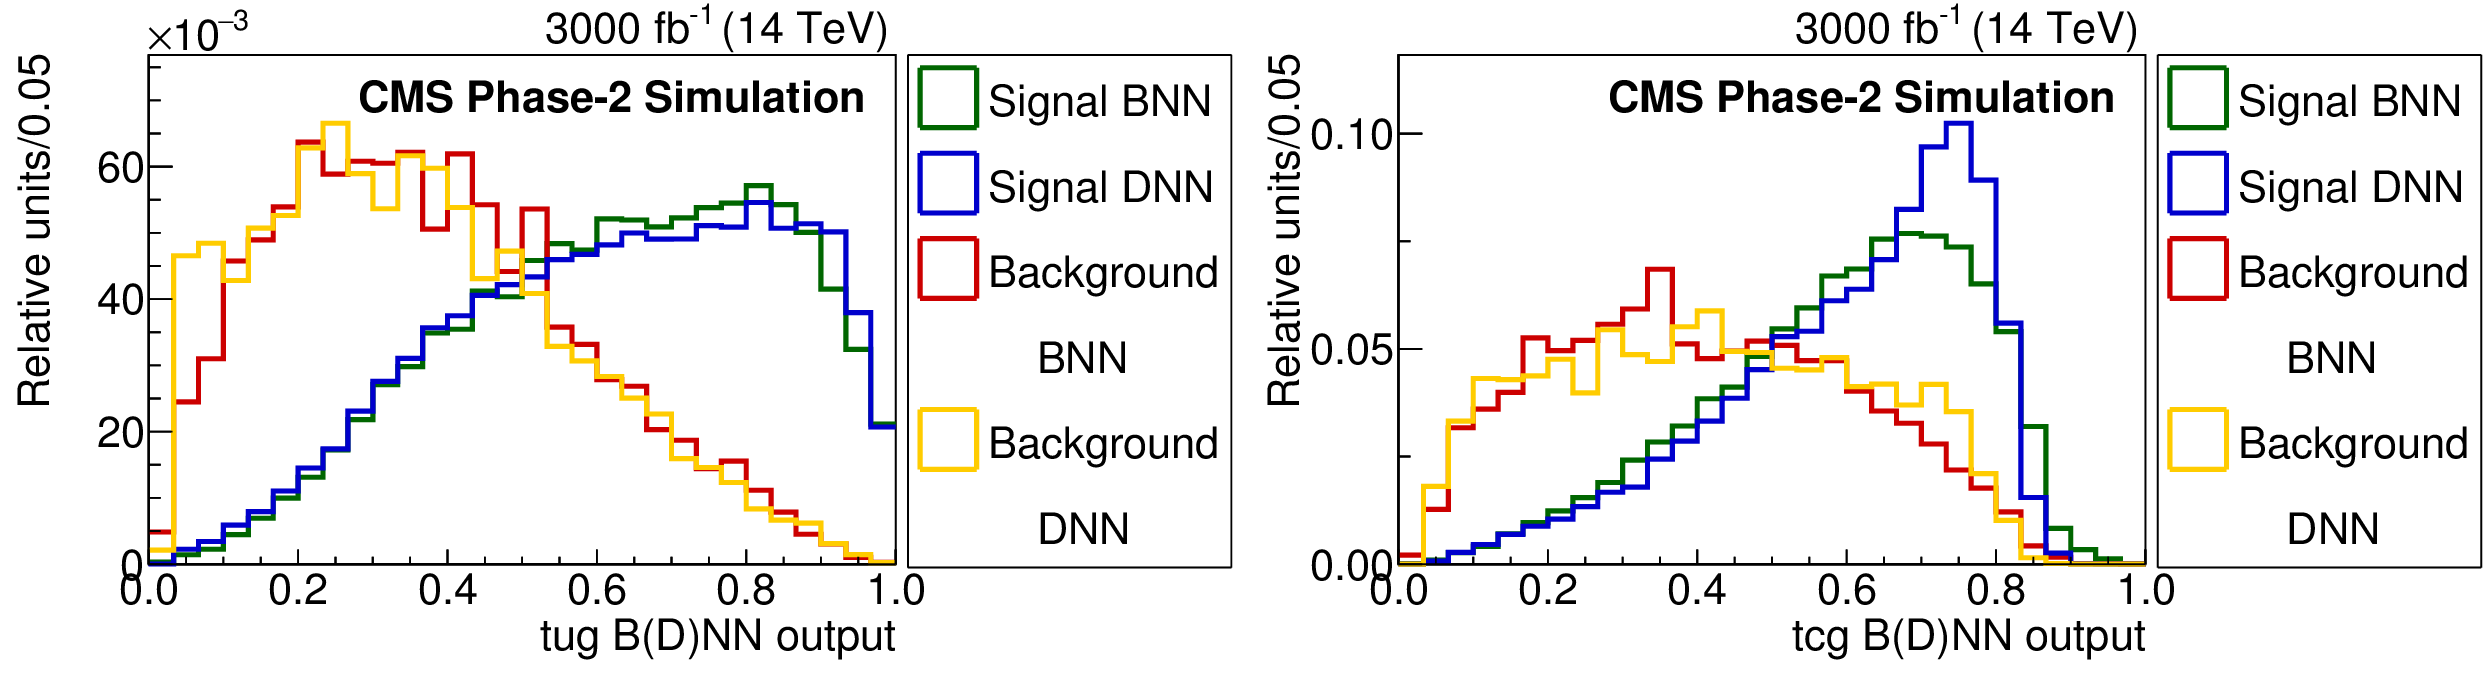
Figure 4:
Comparison of the BNN and DNN FCNC discriminant distributions to distinguish FCNC tgu (left) and tgc (right) processes (signal) from the SM processes (background). The requirement of Multijet BNN $ > $ 0.7 is applied. |

png pdf |
Figure 4-a:
Comparison of the BNN and DNN FCNC discriminant distributions to distinguish FCNC tgu (left) and tgc (right) processes (signal) from the SM processes (background). The requirement of Multijet BNN $ > $ 0.7 is applied. |

png pdf |
Figure 4-b:
Comparison of the BNN and DNN FCNC discriminant distributions to distinguish FCNC tgu (left) and tgc (right) processes (signal) from the SM processes (background). The requirement of Multijet BNN $ > $ 0.7 is applied. |
png pdf |
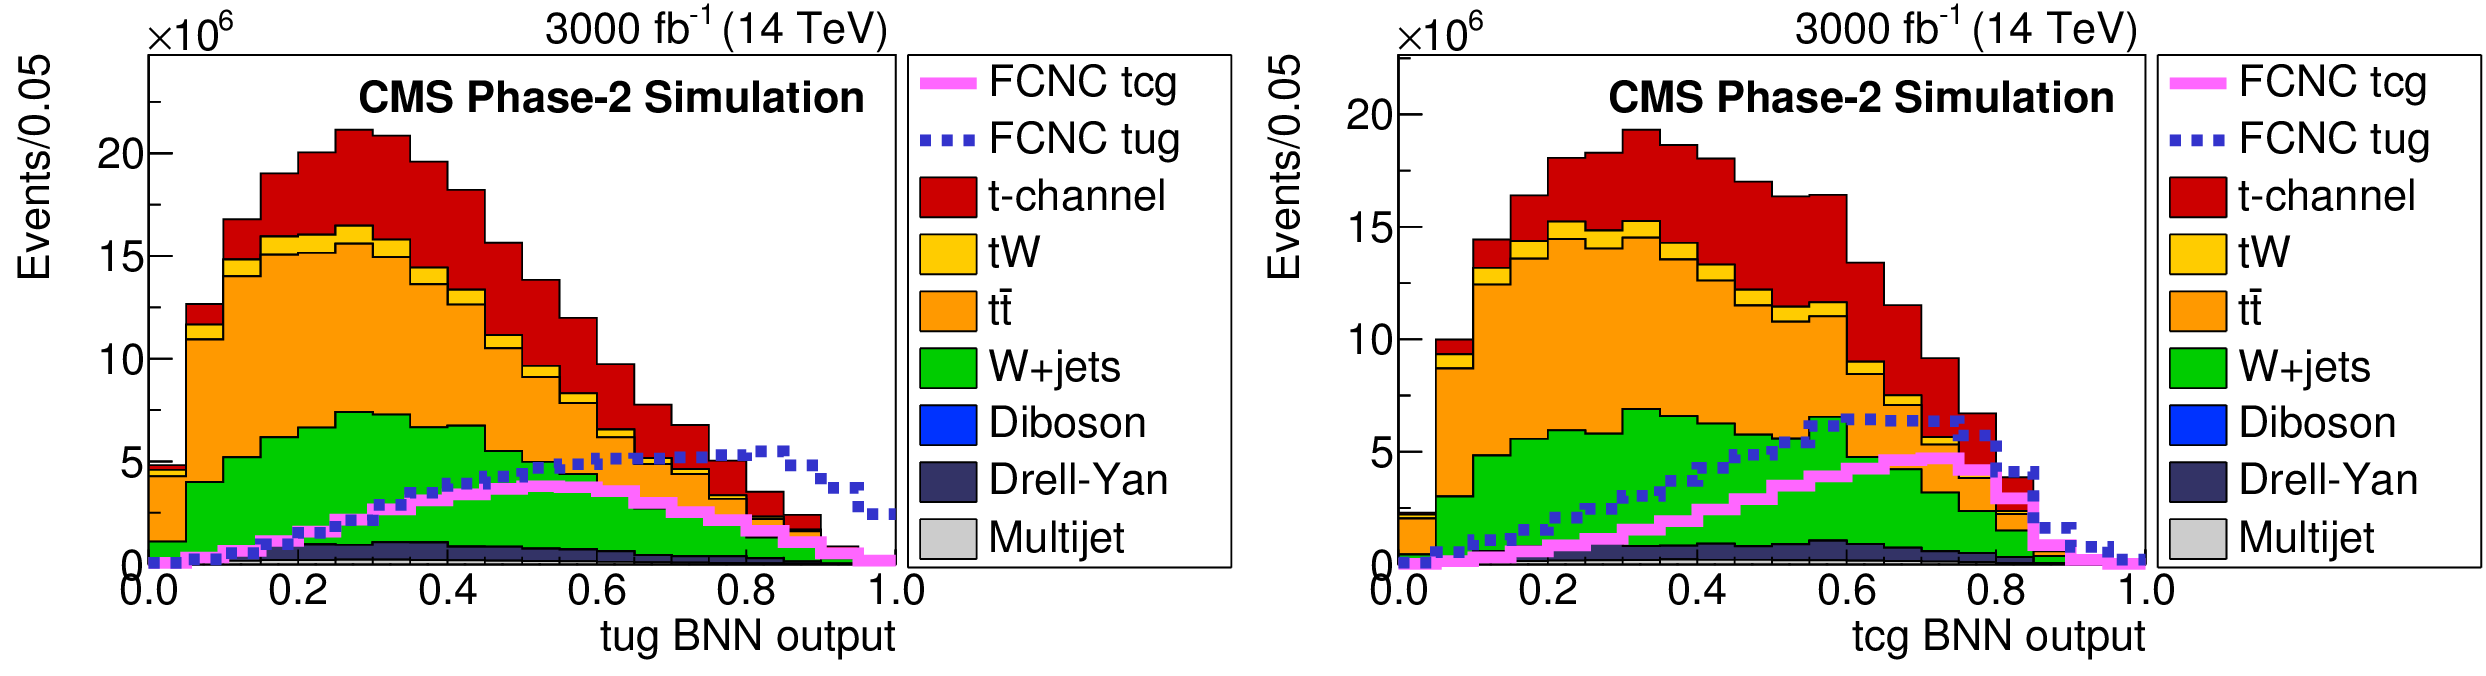
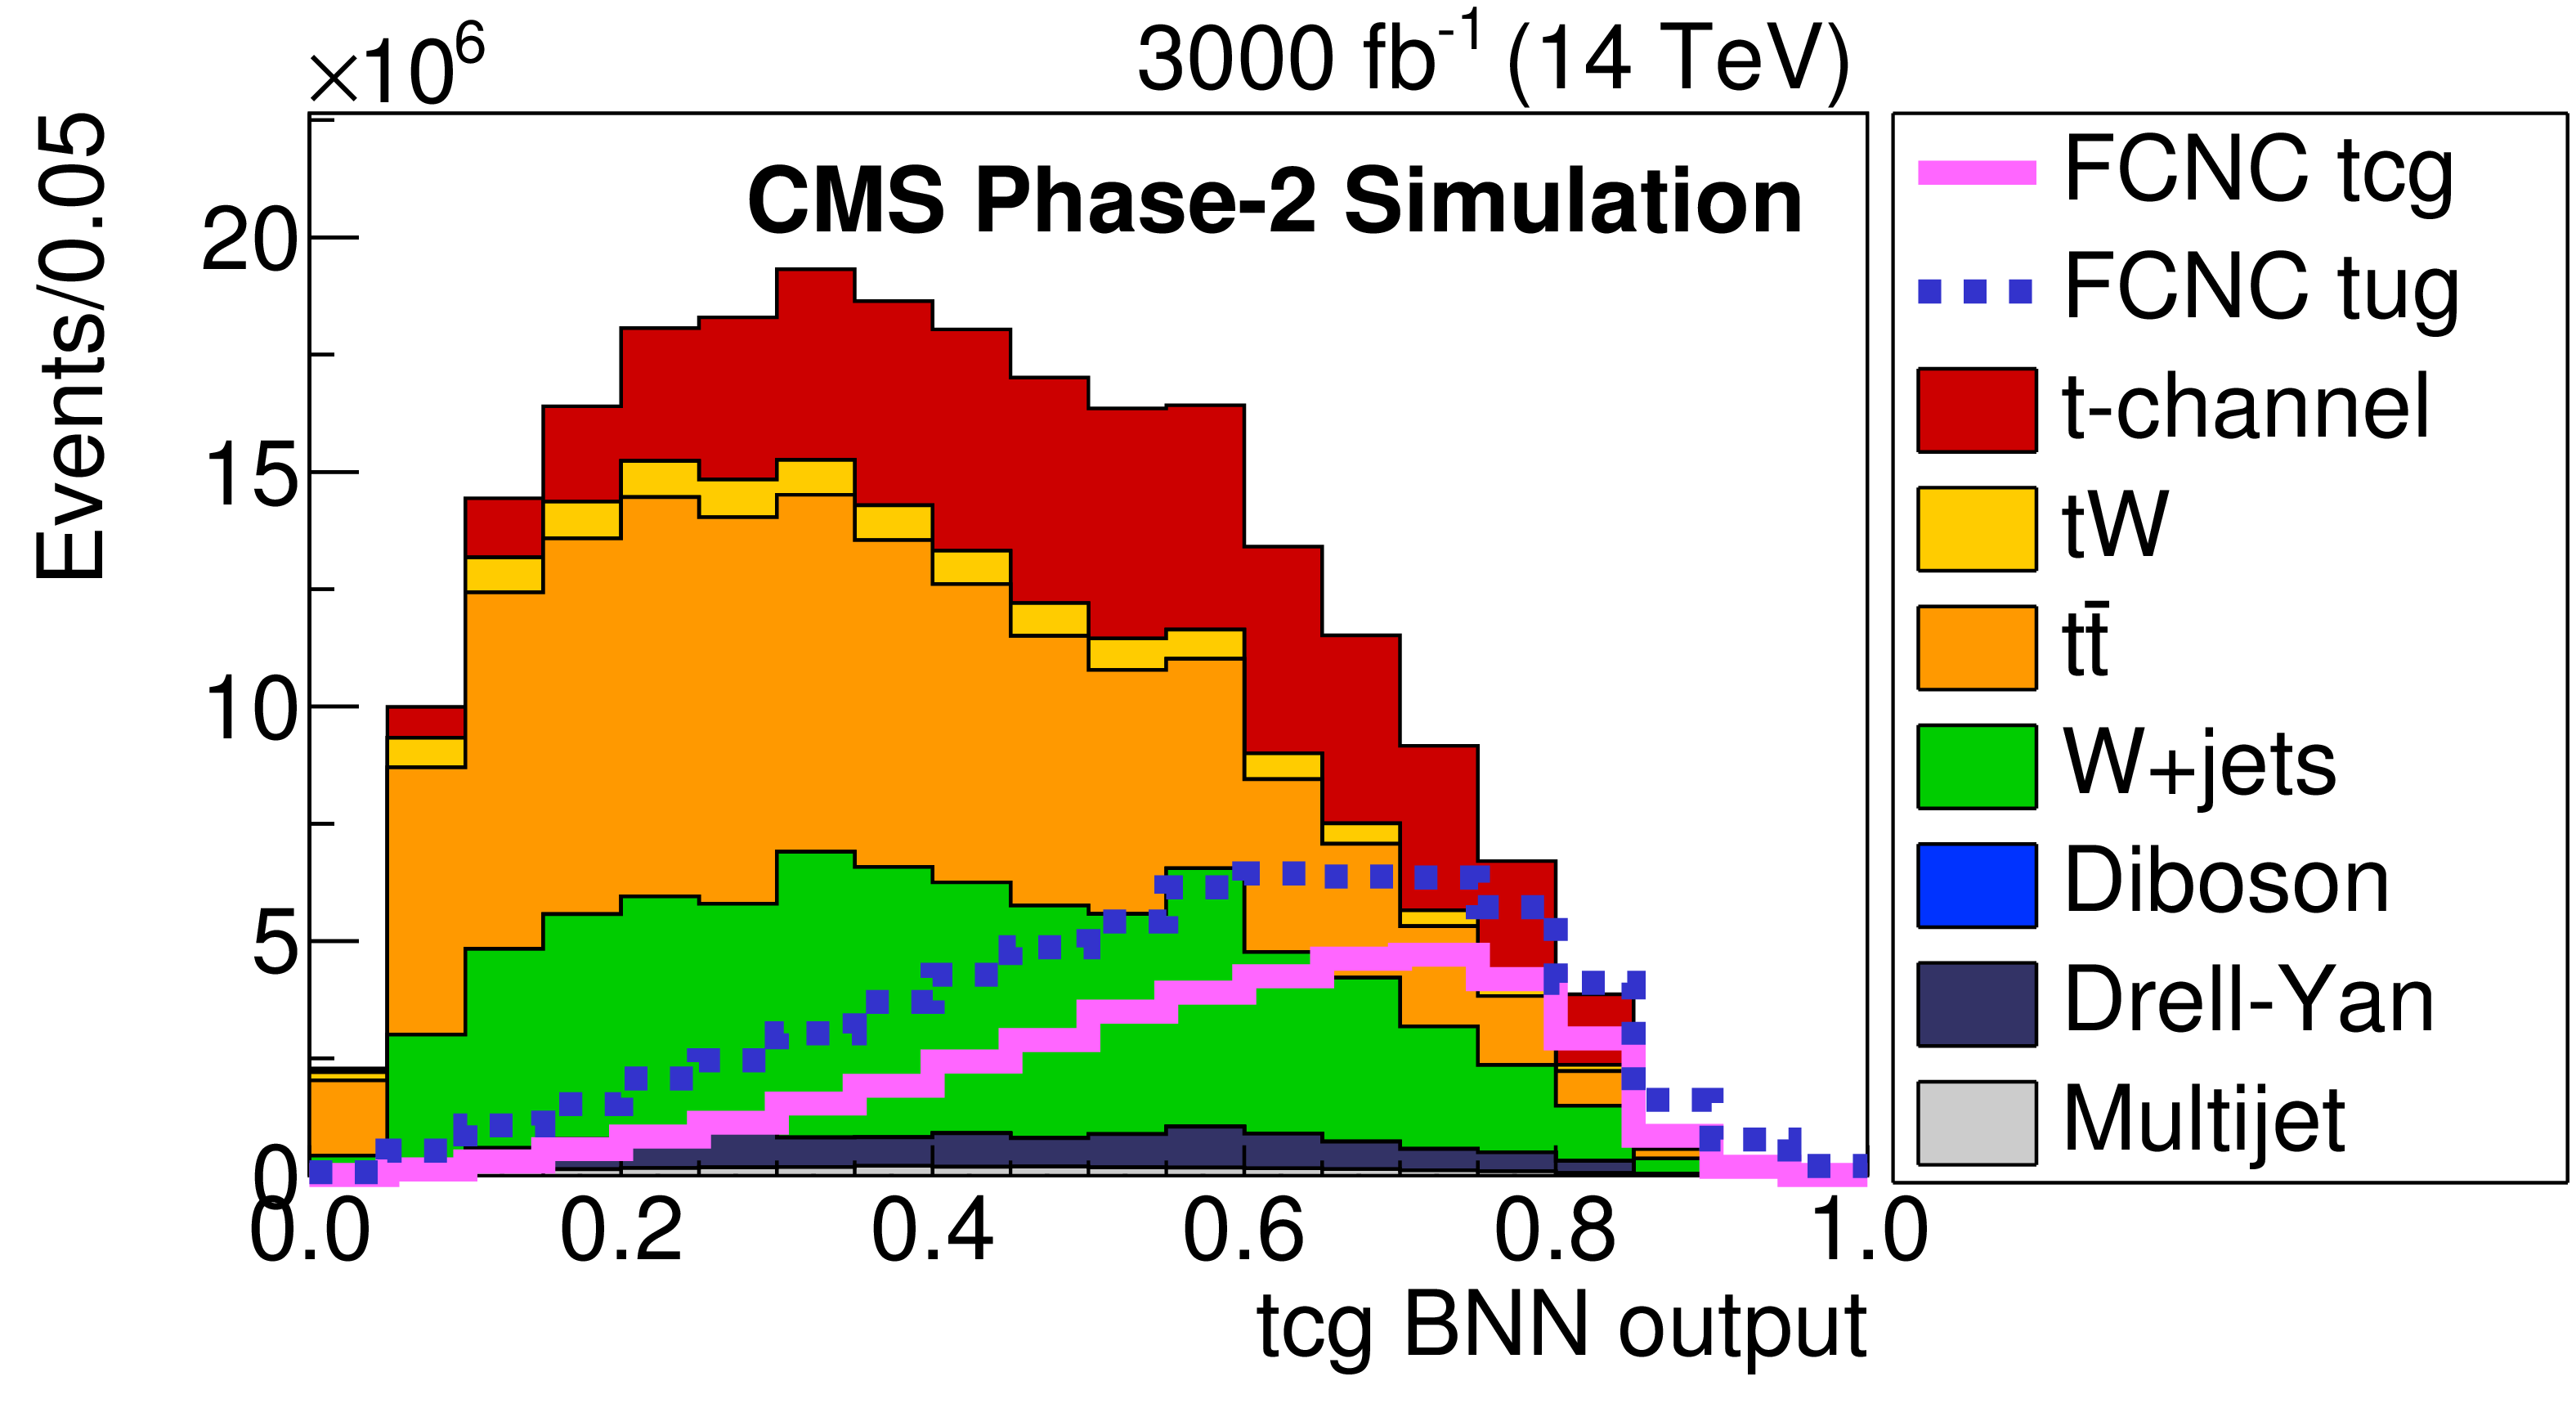
Figure 5:
The FCNC BNN discriminant distributions to distinguish FCNC tgu (left) or tgc (right) processes from the SM contribution. The solid and dashed lines give the expected distributions for FCNC tgu and tgc processes, respectively, assuming the couplings to be $| \kappa _{\rm tug}| = $ 0.06 and $ | \kappa _{\rm tcg}| = $ 0.09 TeV$ ^{-1}$. The requirement of Multijet BNN $ > $ 0.7 is applied. |

png pdf |
Figure 5-a:
The FCNC BNN discriminant distributions to distinguish FCNC tgu (left) or tgc (right) processes from the SM contribution. The solid and dashed lines give the expected distributions for FCNC tgu and tgc processes, respectively, assuming the couplings to be $| \kappa _{\rm tug}| = $ 0.06 and $ | \kappa _{\rm tcg}| = $ 0.09 TeV$ ^{-1}$. The requirement of Multijet BNN $ > $ 0.7 is applied. |
png pdf |
Figure 5-b:
The FCNC BNN discriminant distributions to distinguish FCNC tgu (left) or tgc (right) processes from the SM contribution. The solid and dashed lines give the expected distributions for FCNC tgu and tgc processes, respectively, assuming the couplings to be $| \kappa _{\rm tug}| = $ 0.06 and $ | \kappa _{\rm tcg}| = $ 0.09 TeV$ ^{-1}$. The requirement of Multijet BNN $ > $ 0.7 is applied. |
png pdf |
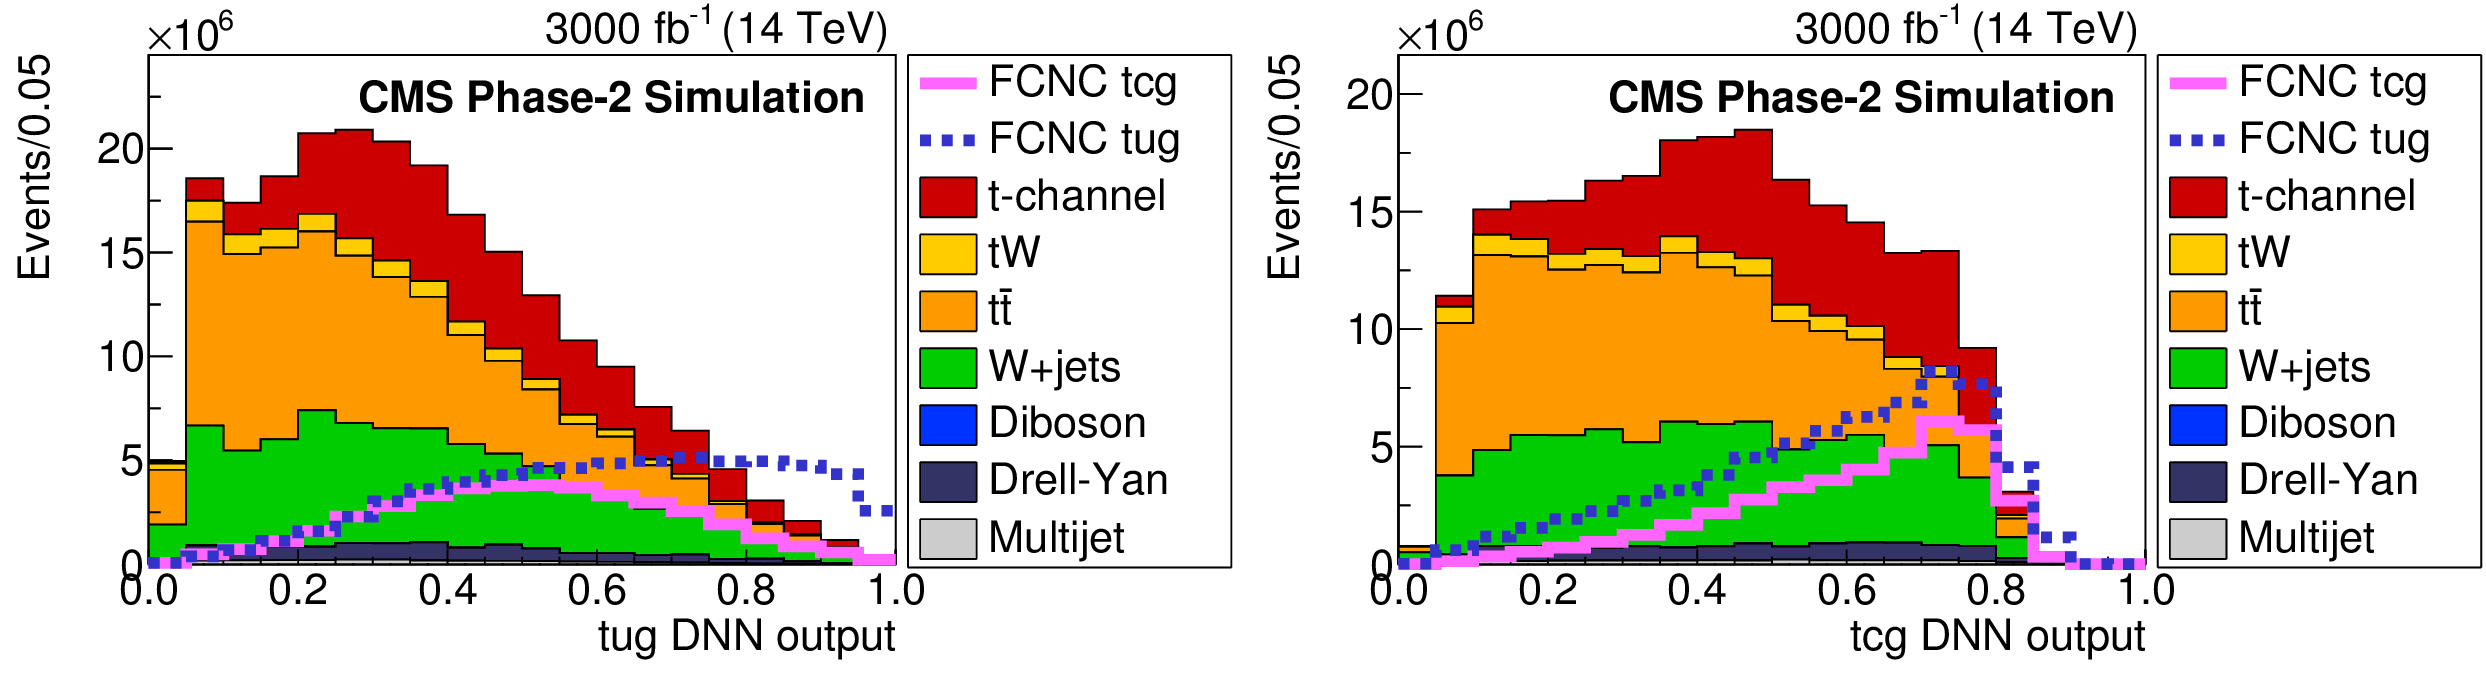
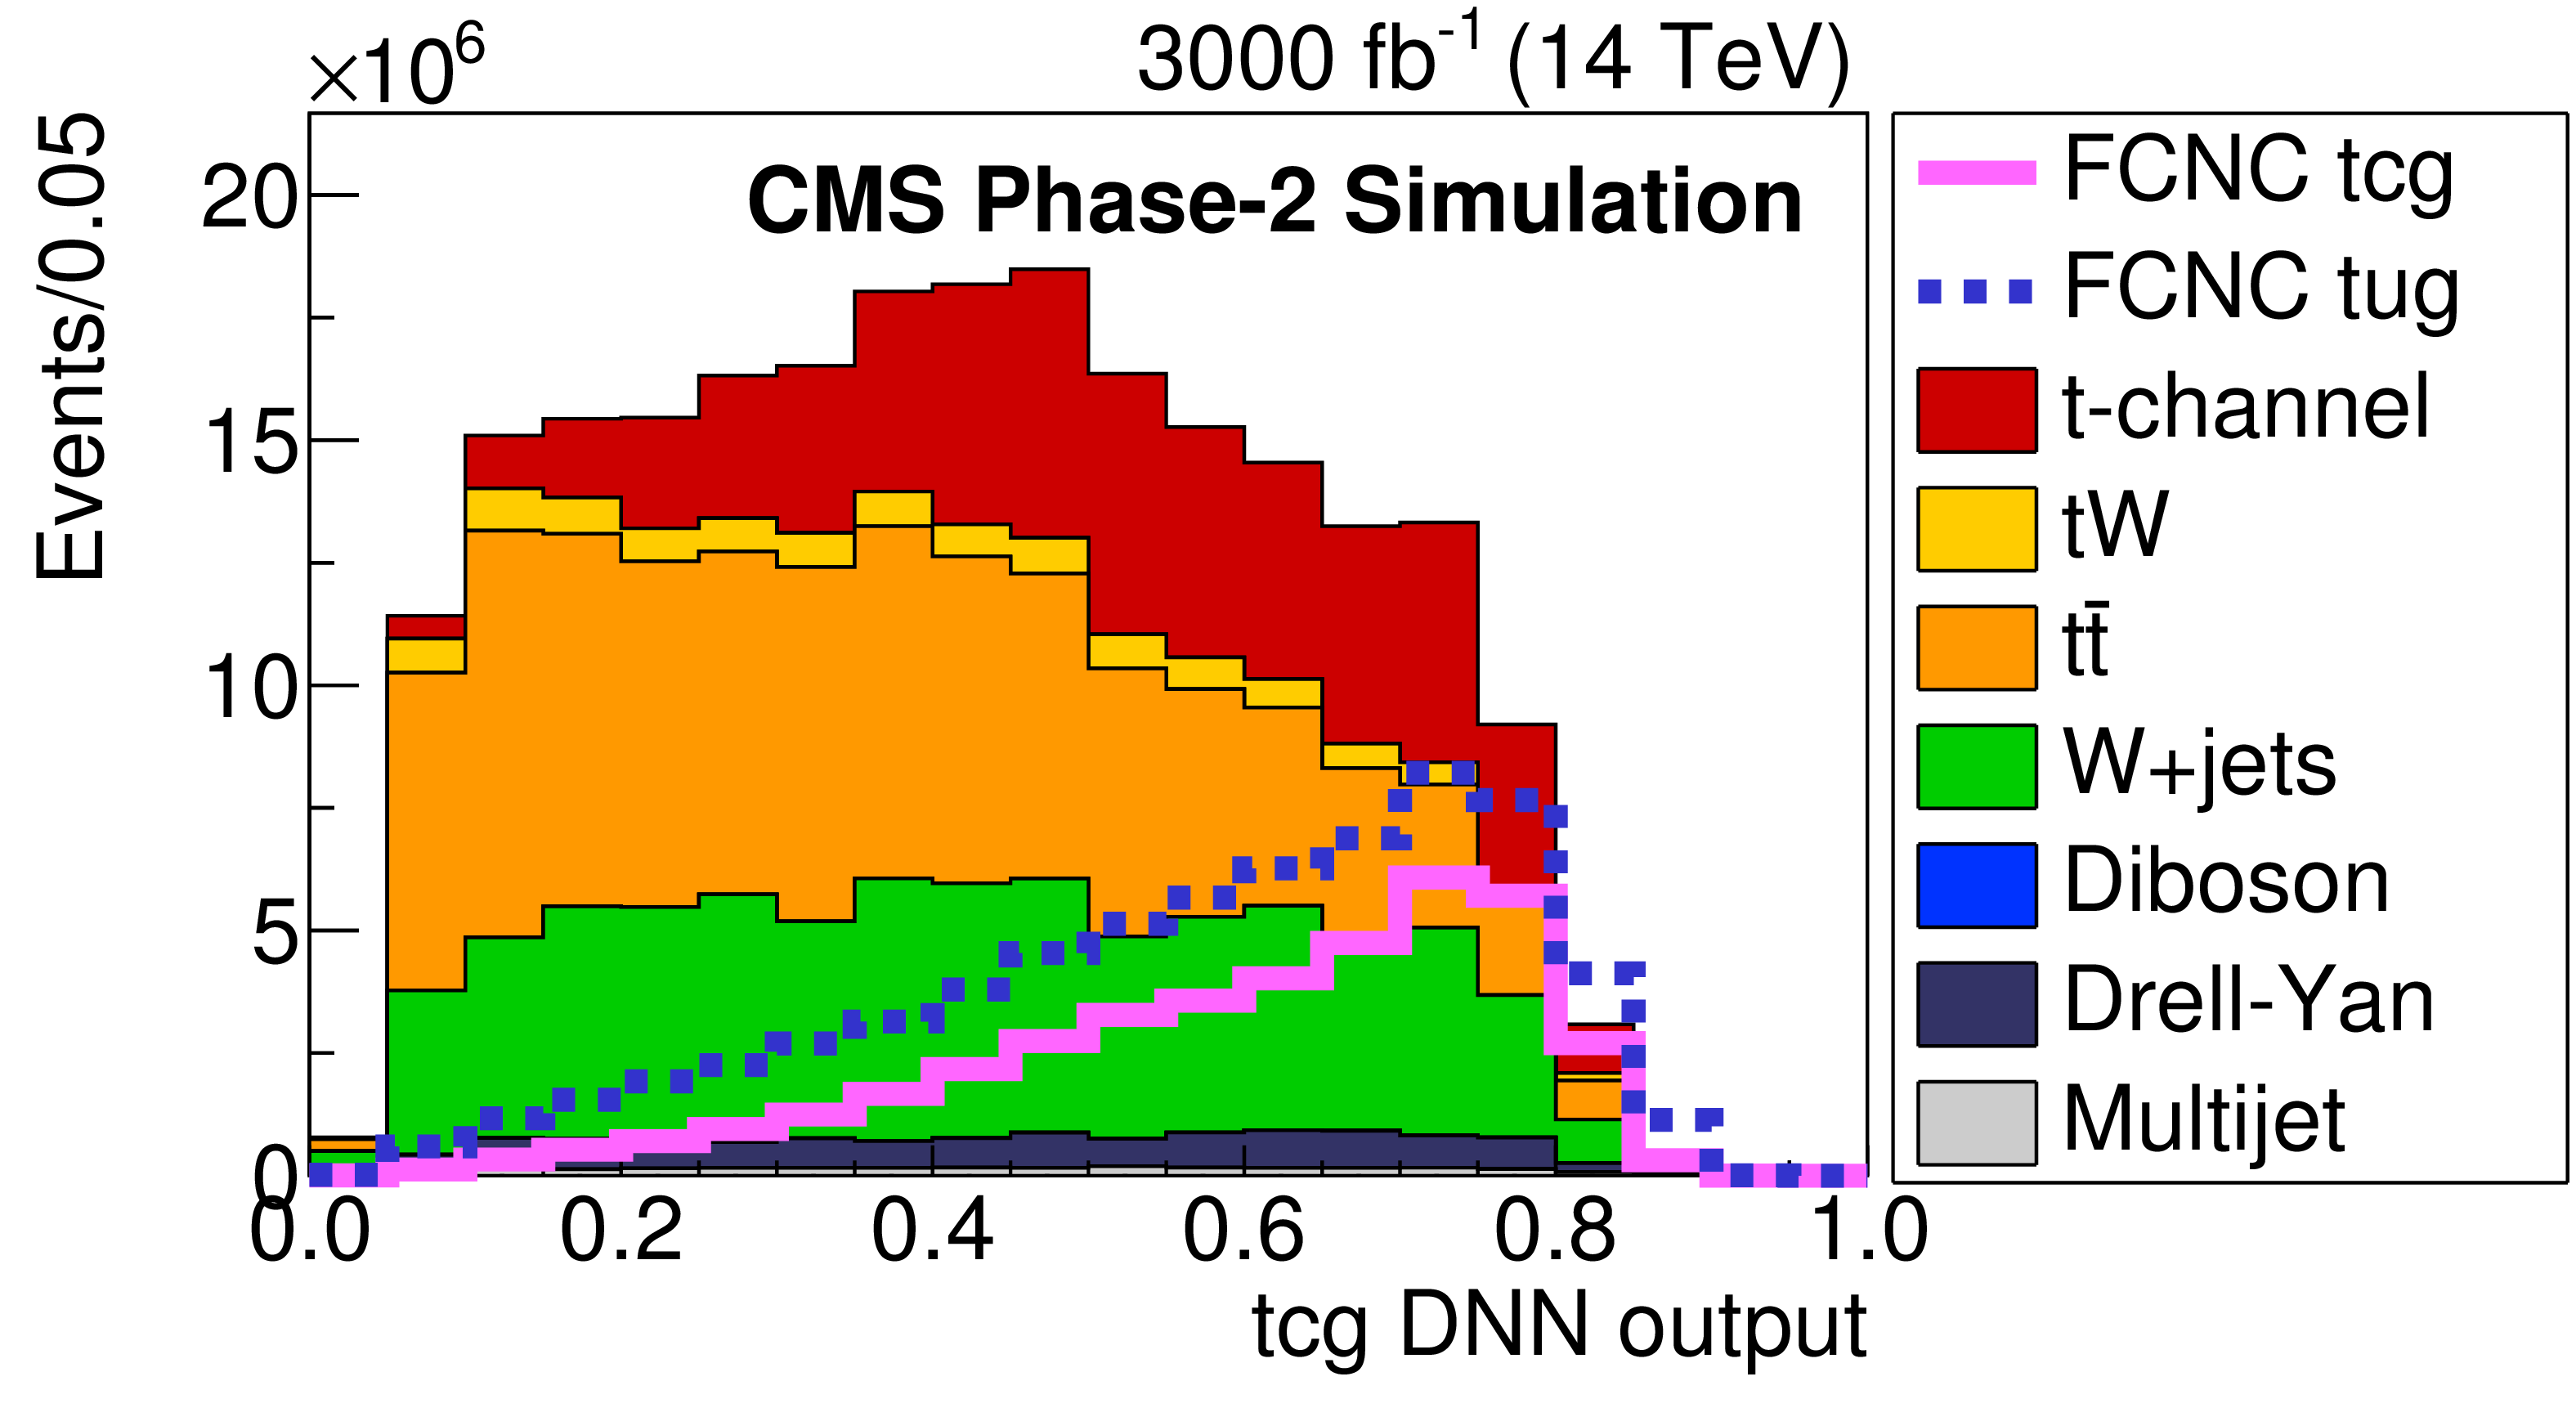
Figure 6:
The FCNC DNN discriminant distributions when the DNN is trained to distinguish FCNC tgu (left) and tgc (right) processes from the SM processes. The solid and dashed lines give the expected distributions for FCNC tgu and tgc processes, respectively, assuming a coupling of $ | \kappa _{\rm tug}| = $ 0.06 and $ | \kappa _{\rm tcg}| = $ 0.09 TeV$ ^{-1}$ on the left (right) plots. The requirement of Multijet BNN $ > $ 0.7 is applied. |

png pdf |
Figure 6-a:
The FCNC DNN discriminant distributions when the DNN is trained to distinguish FCNC tgu (left) and tgc (right) processes from the SM processes. The solid and dashed lines give the expected distributions for FCNC tgu and tgc processes, respectively, assuming a coupling of $ | \kappa _{\rm tug}| = $ 0.06 and $ | \kappa _{\rm tcg}| = $ 0.09 TeV$ ^{-1}$ on the left (right) plots. The requirement of Multijet BNN $ > $ 0.7 is applied. |
png pdf |
Figure 6-b:
The FCNC DNN discriminant distributions when the DNN is trained to distinguish FCNC tgu (left) and tgc (right) processes from the SM processes. The solid and dashed lines give the expected distributions for FCNC tgu and tgc processes, respectively, assuming a coupling of $ | \kappa _{\rm tug}| = $ 0.06 and $ | \kappa _{\rm tcg}| = $ 0.09 TeV$ ^{-1}$ on the left (right) plots. The requirement of Multijet BNN $ > $ 0.7 is applied. |
png pdf |
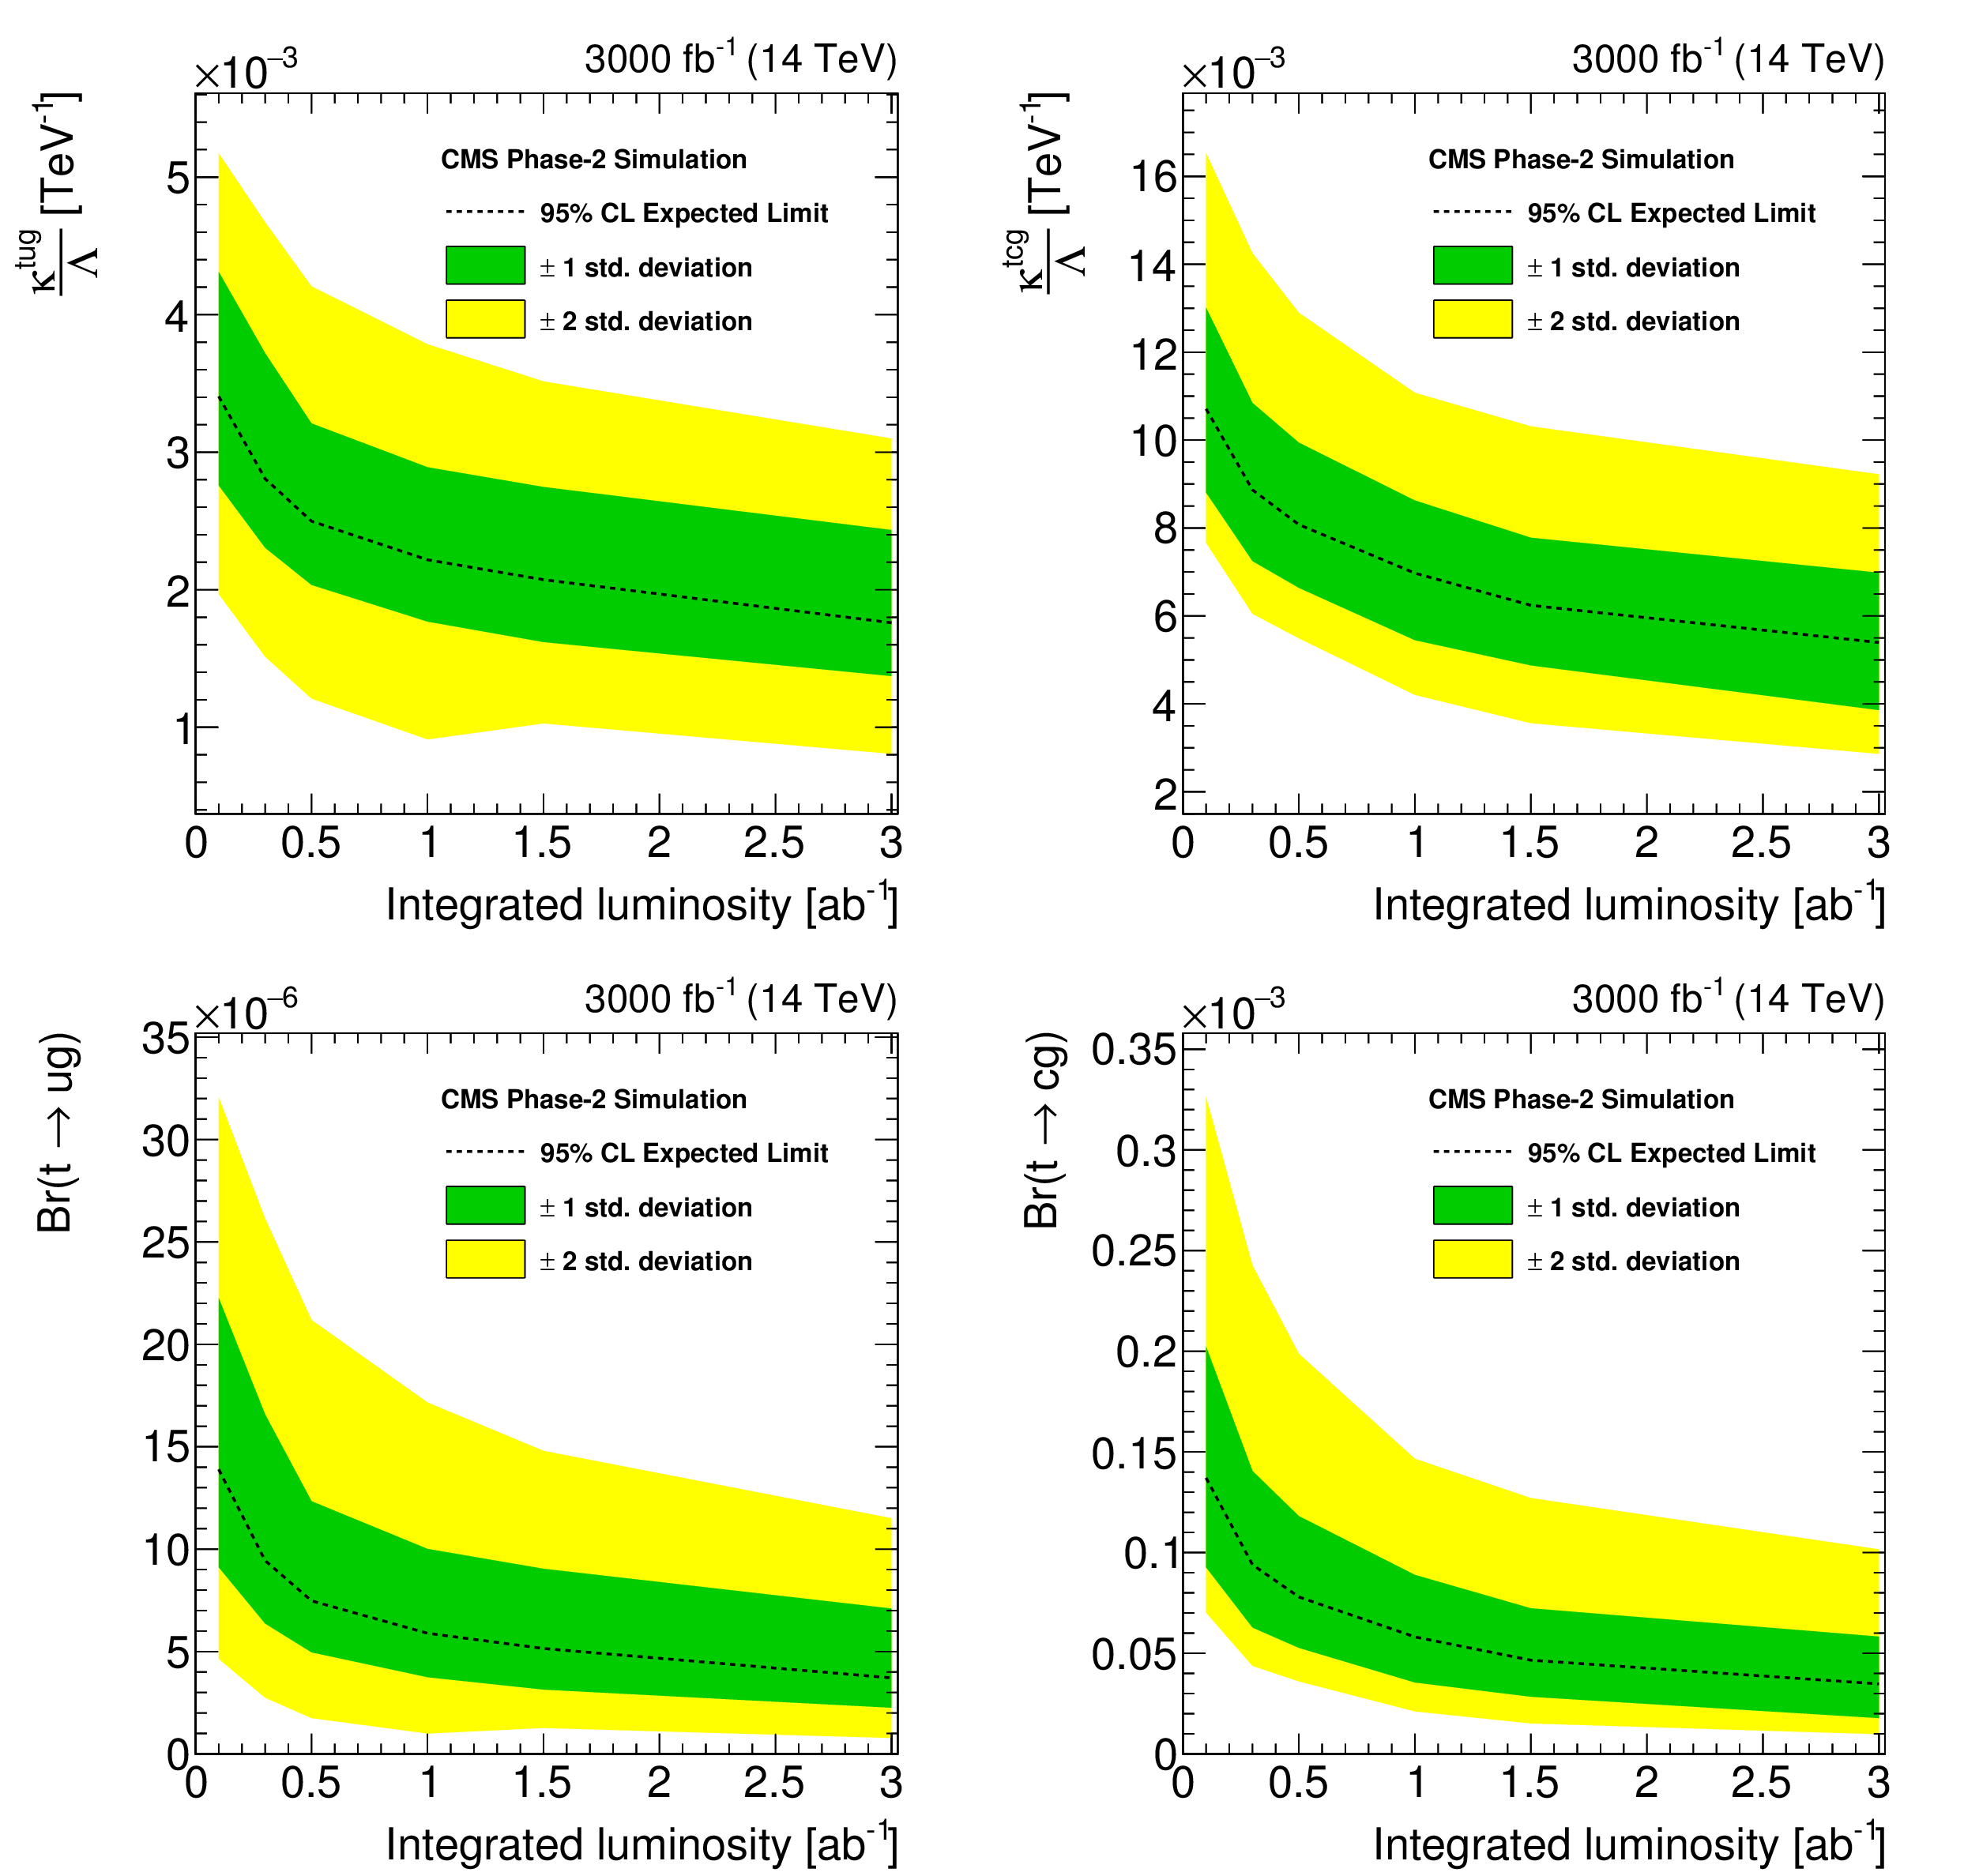
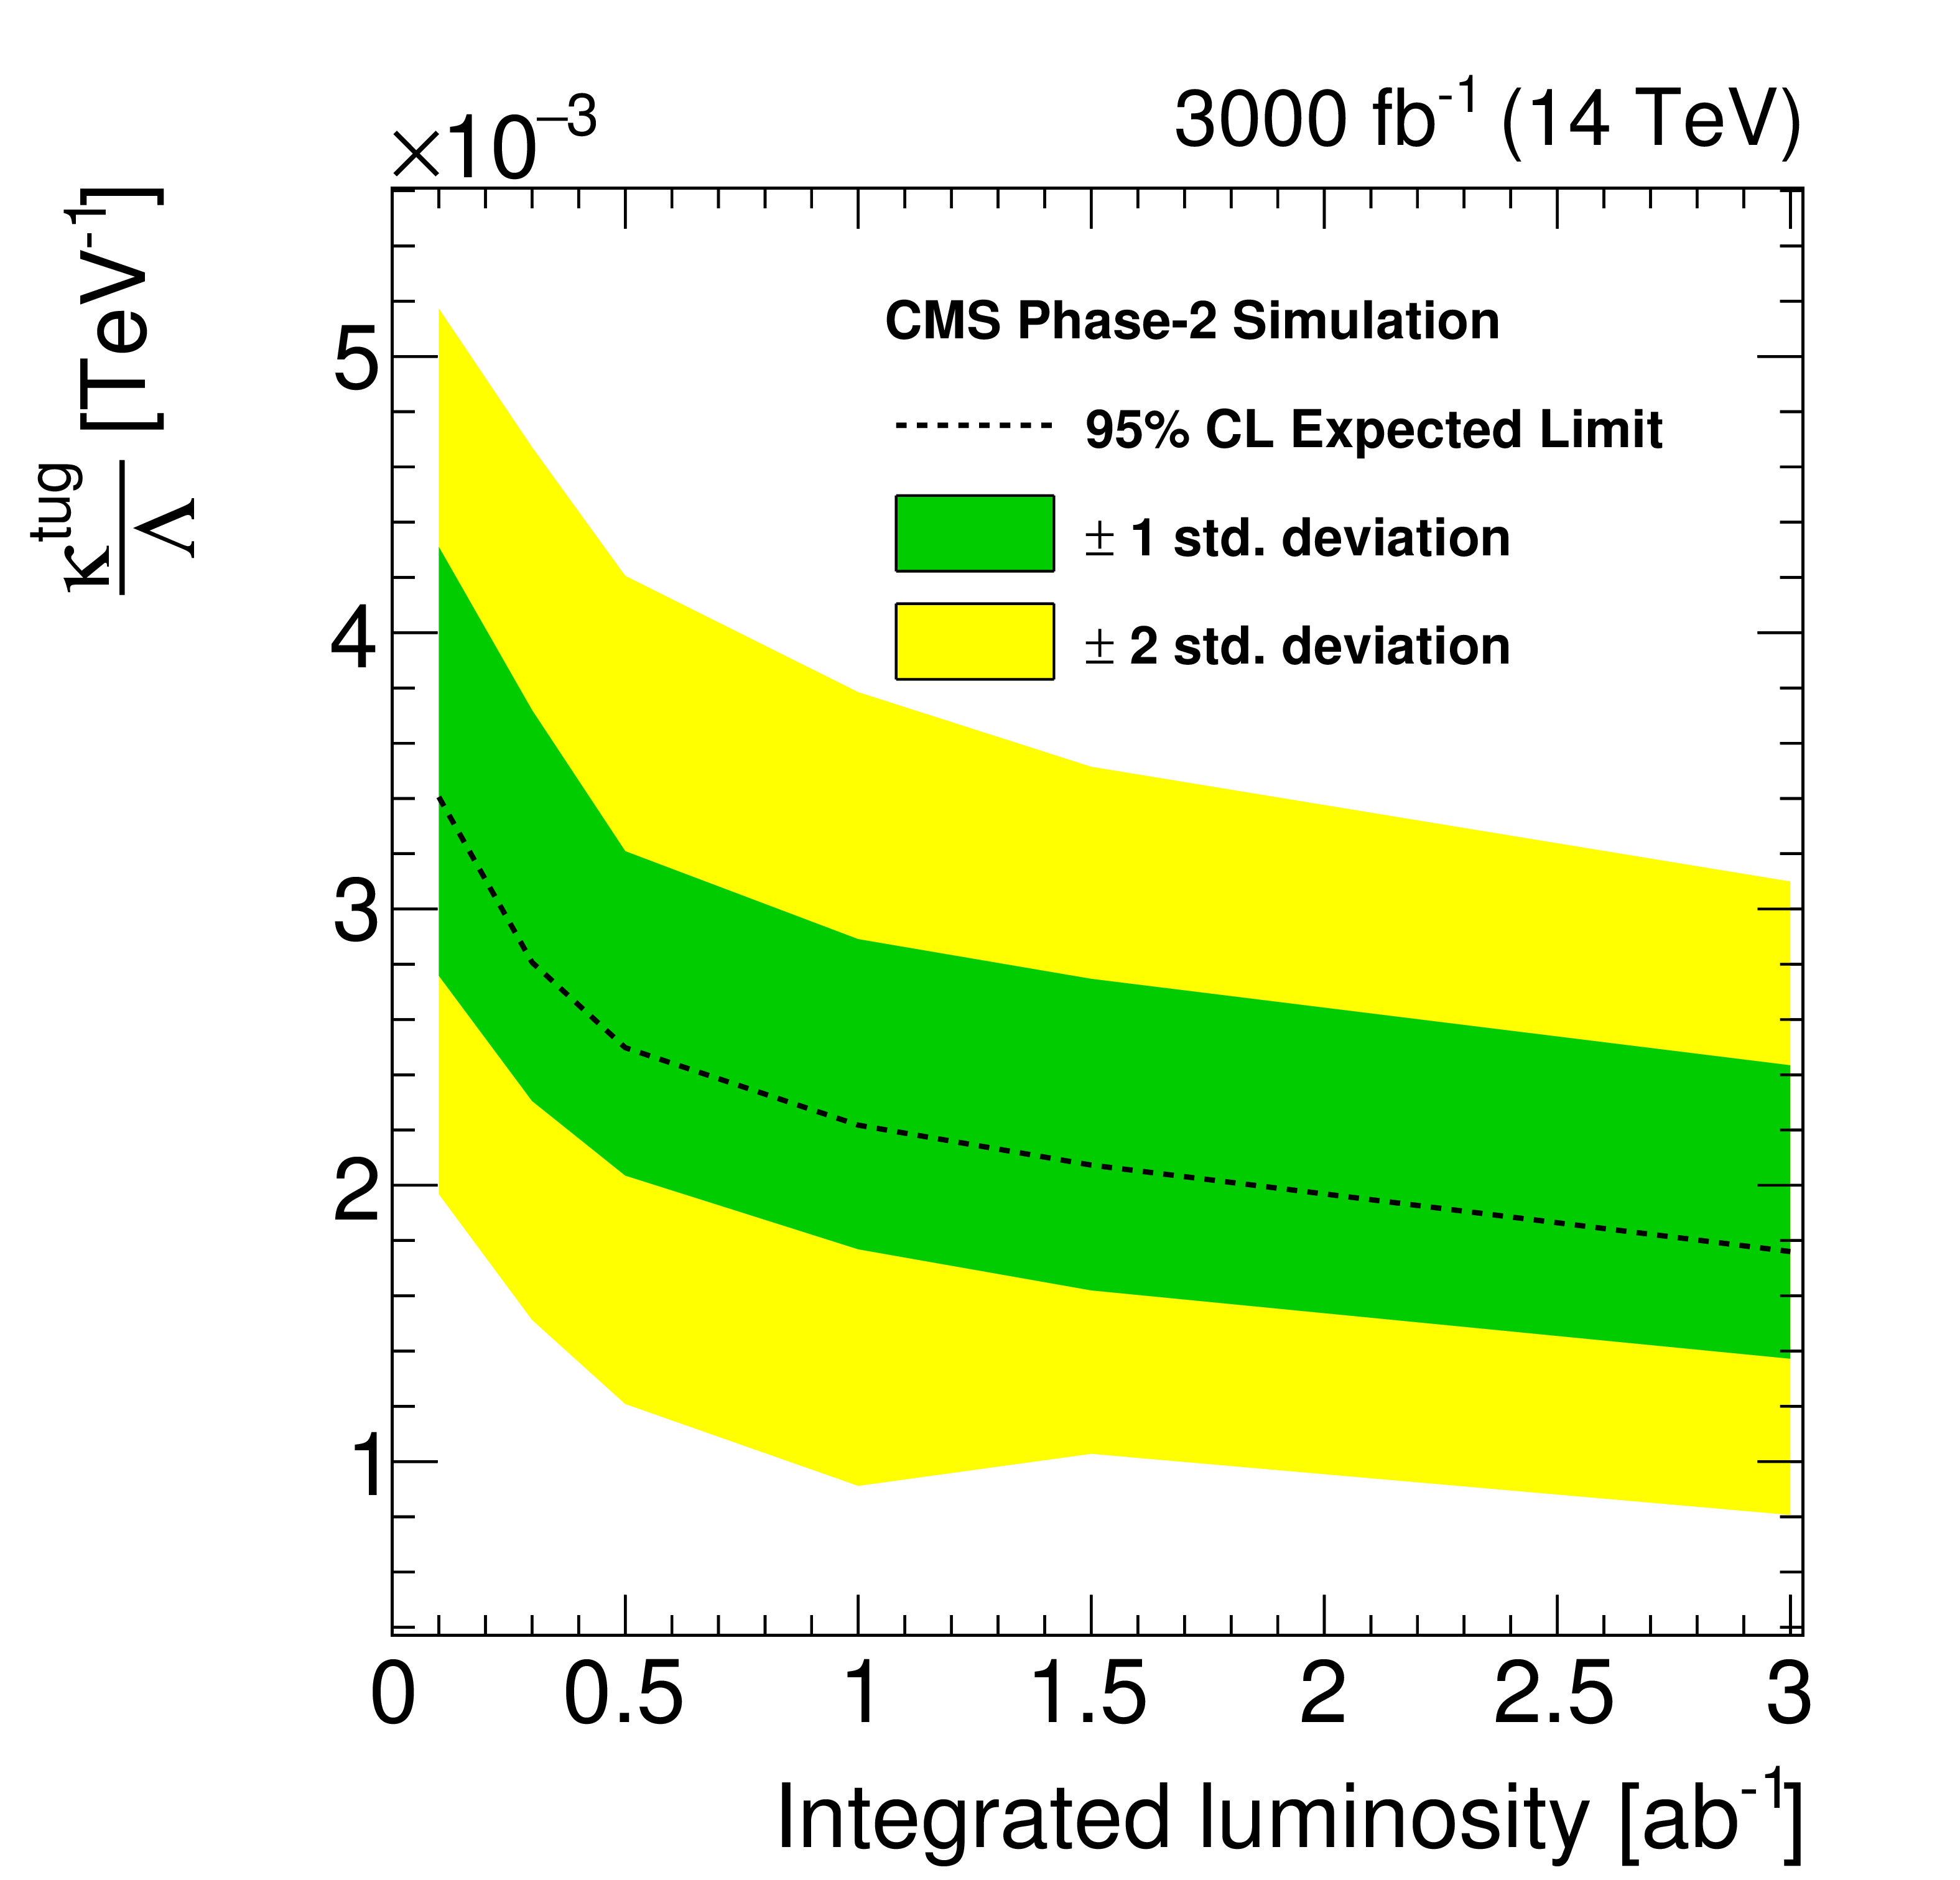
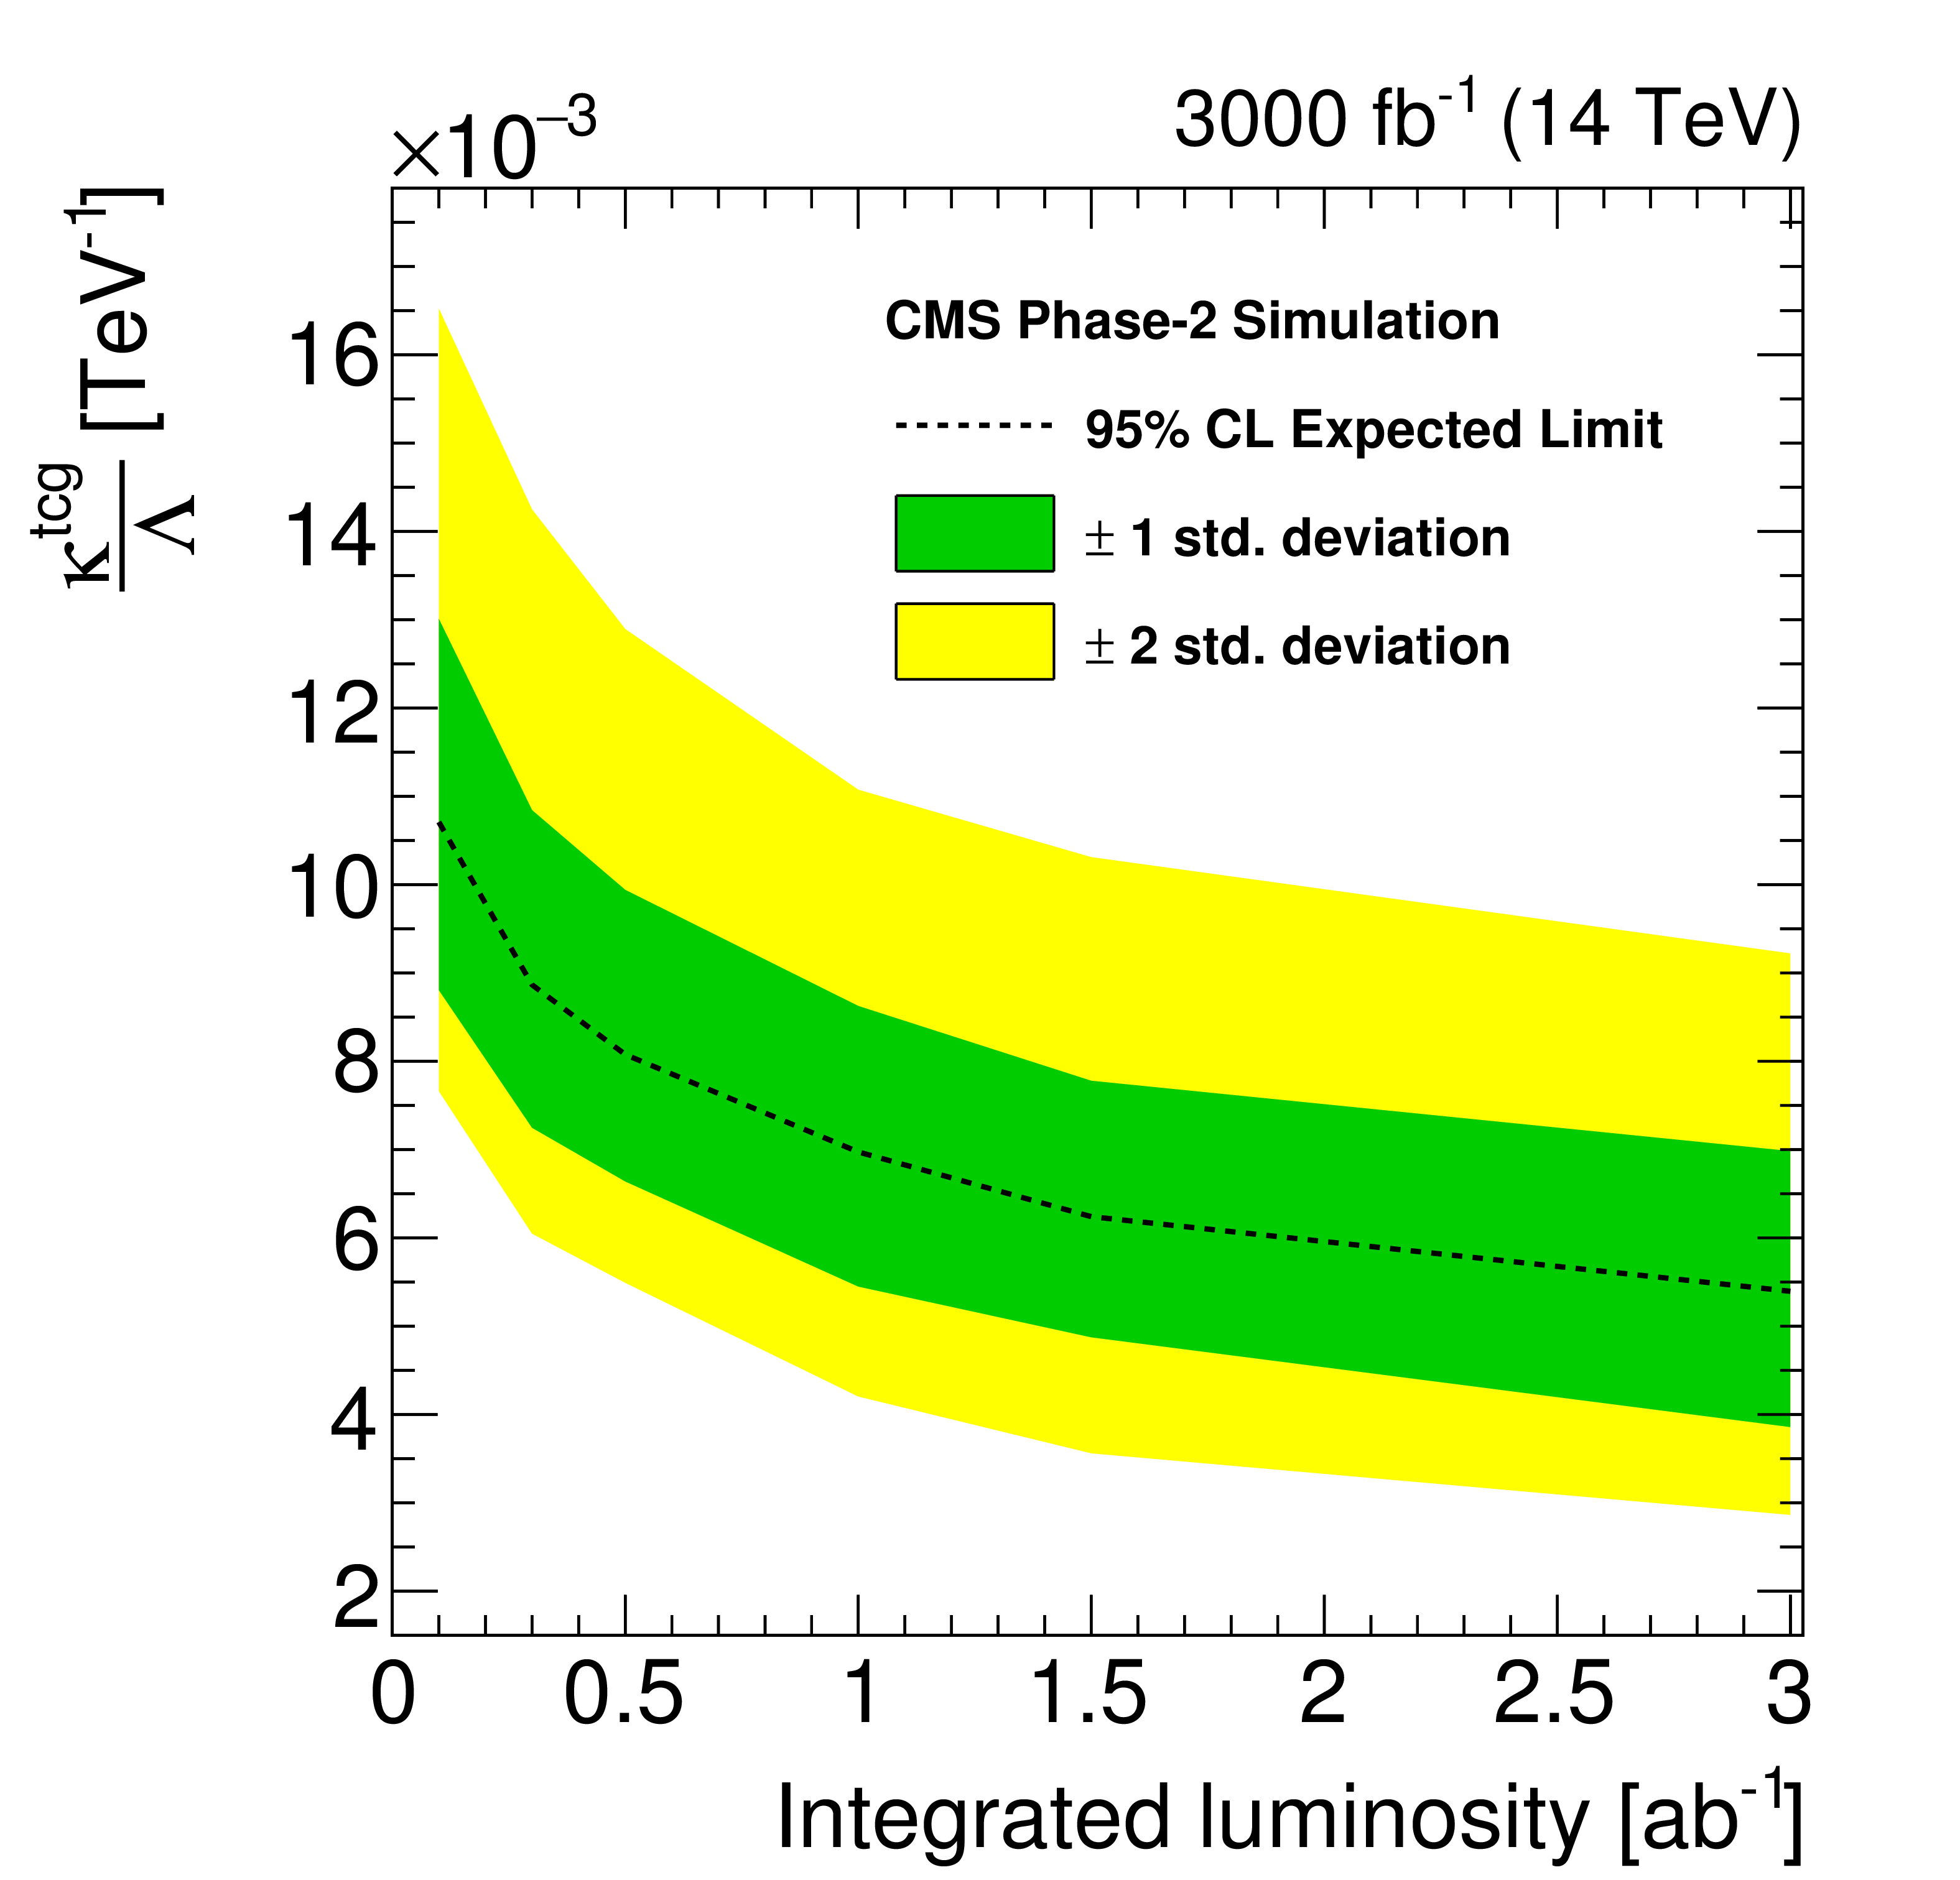
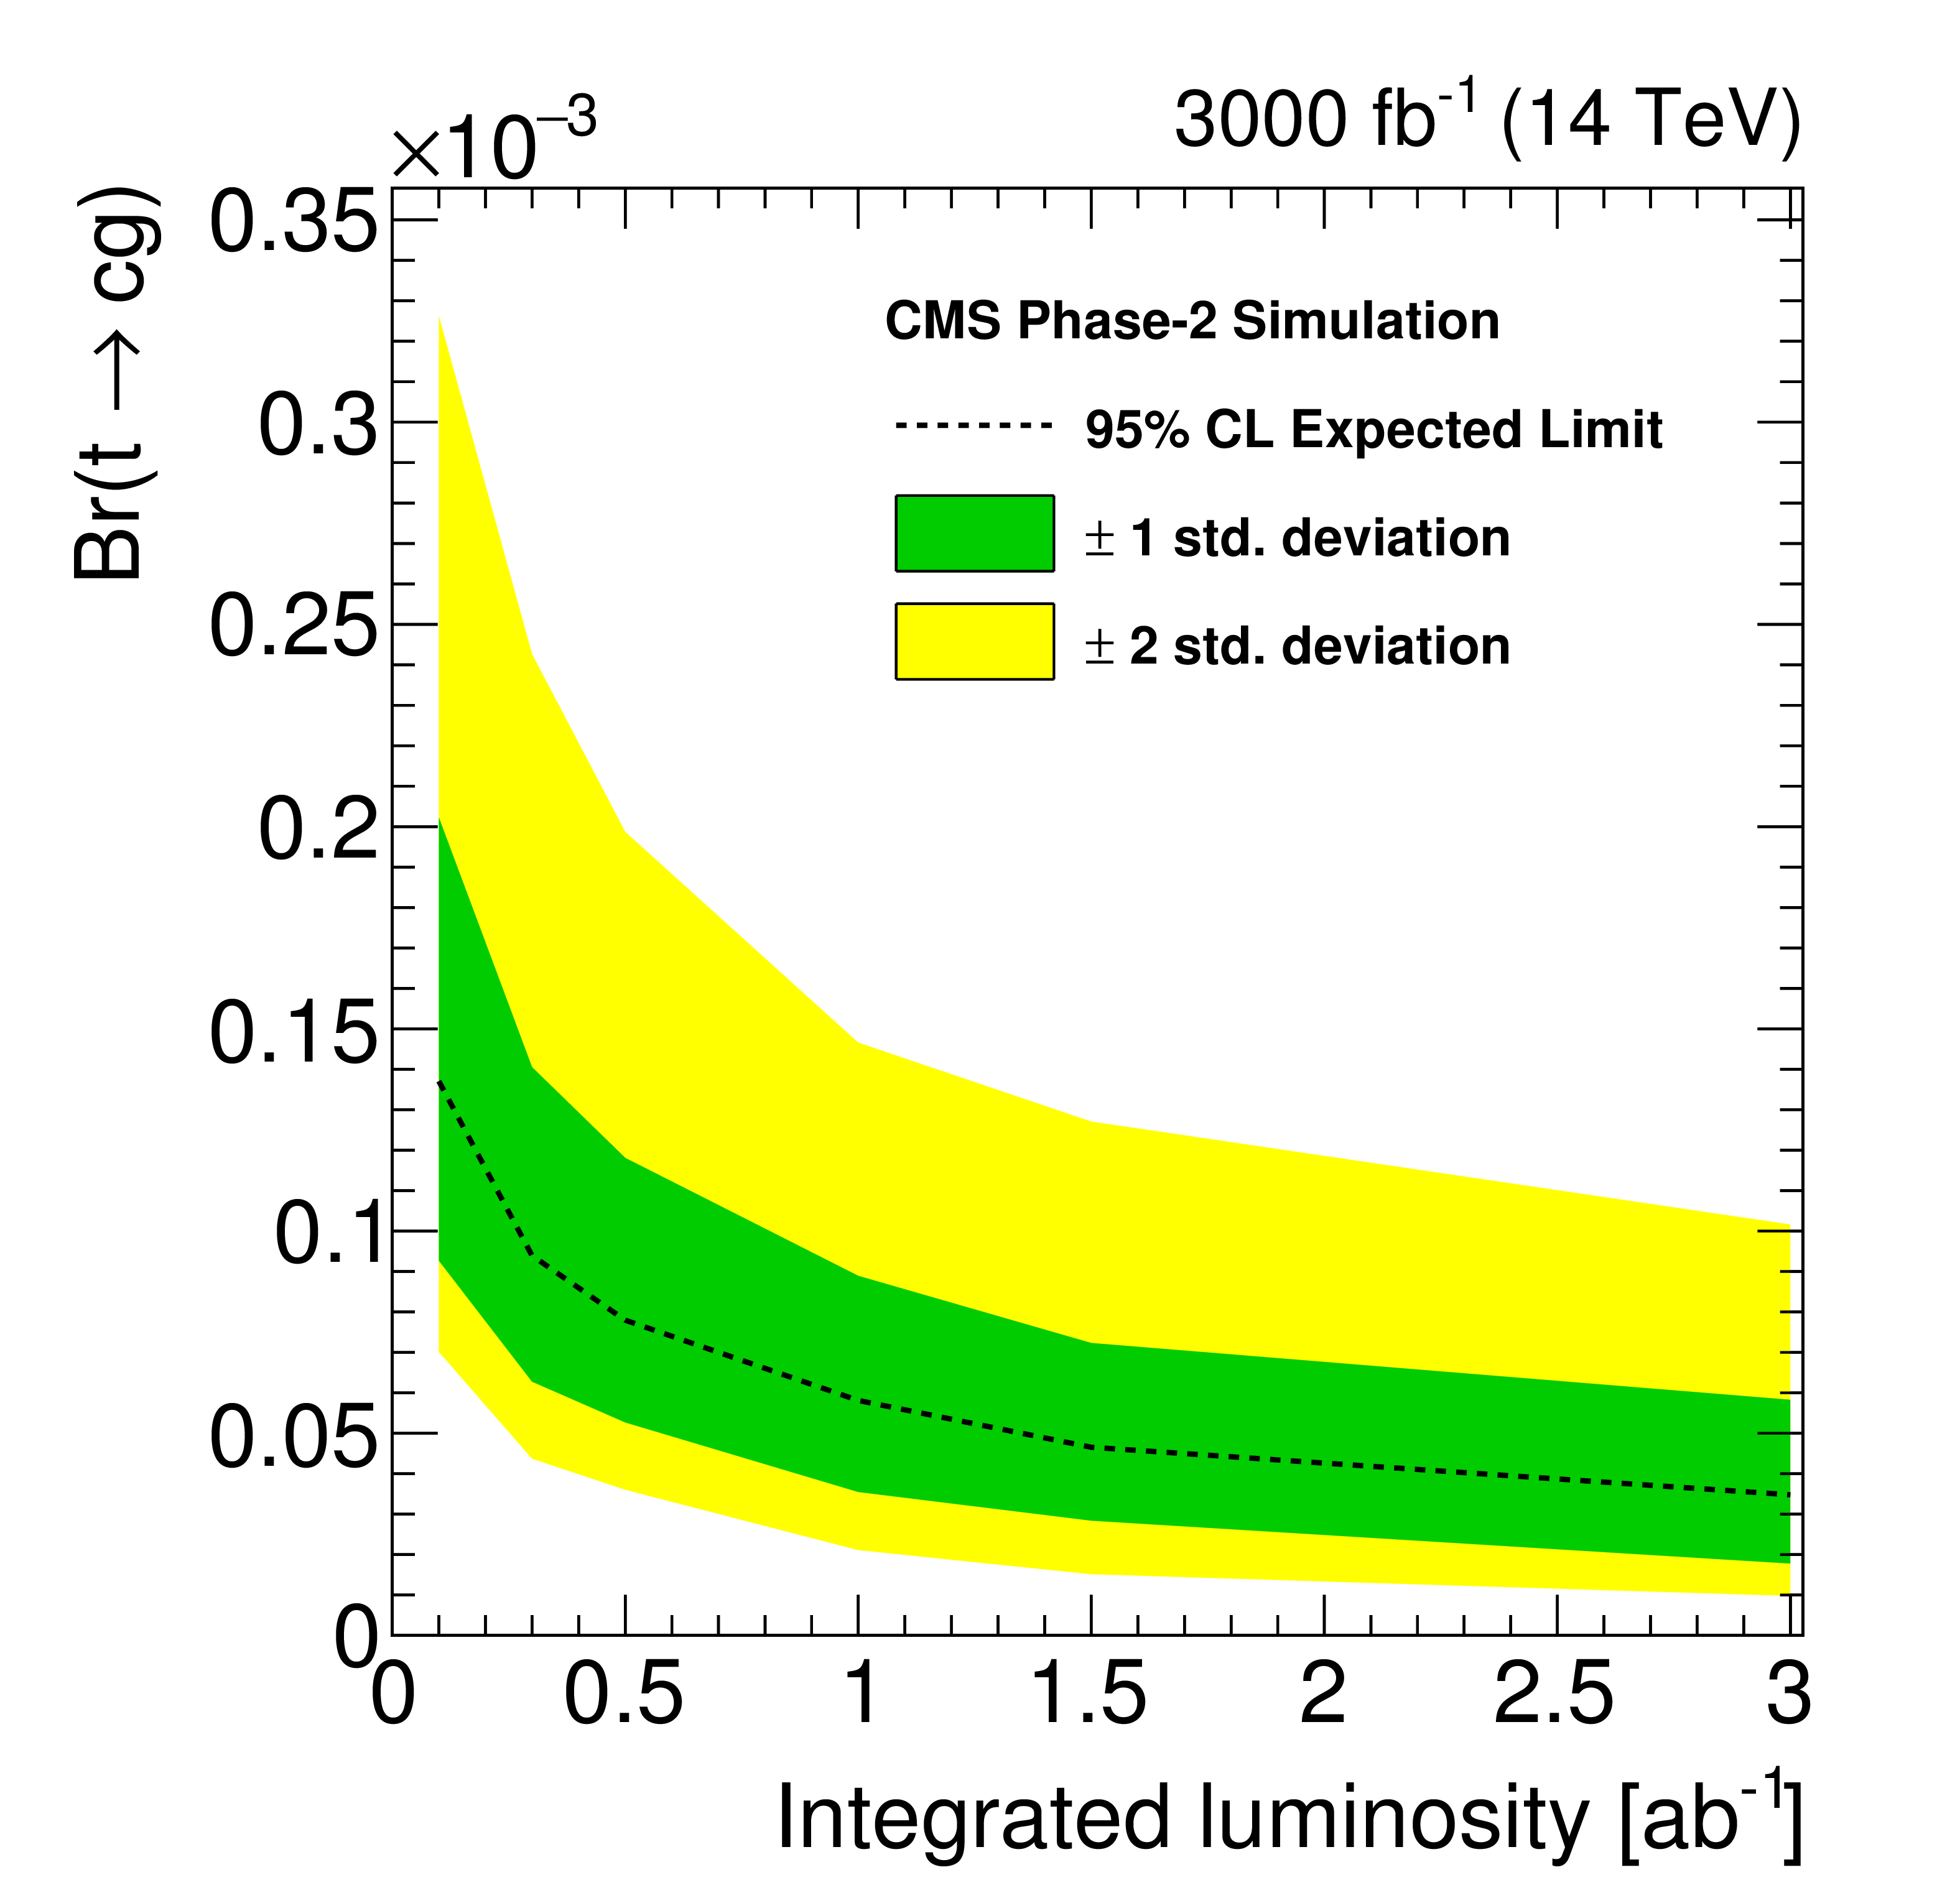
Figure 7:
The expected exclusion limits at 95% C.L. on the FCNC couplings and the corresponding branching fractions as a function of integrated luminosity. |
png pdf |
Figure 7-a:
The expected exclusion limits at 95% C.L. on the FCNC couplings and the corresponding branching fractions as a function of integrated luminosity. |
png pdf |
Figure 7-b:
The expected exclusion limits at 95% C.L. on the FCNC couplings and the corresponding branching fractions as a function of integrated luminosity. |

png pdf |
Figure 7-c:
The expected exclusion limits at 95% C.L. on the FCNC couplings and the corresponding branching fractions as a function of integrated luminosity. |
png pdf |
Figure 7-d:
The expected exclusion limits at 95% C.L. on the FCNC couplings and the corresponding branching fractions as a function of integrated luminosity. |
png pdf |
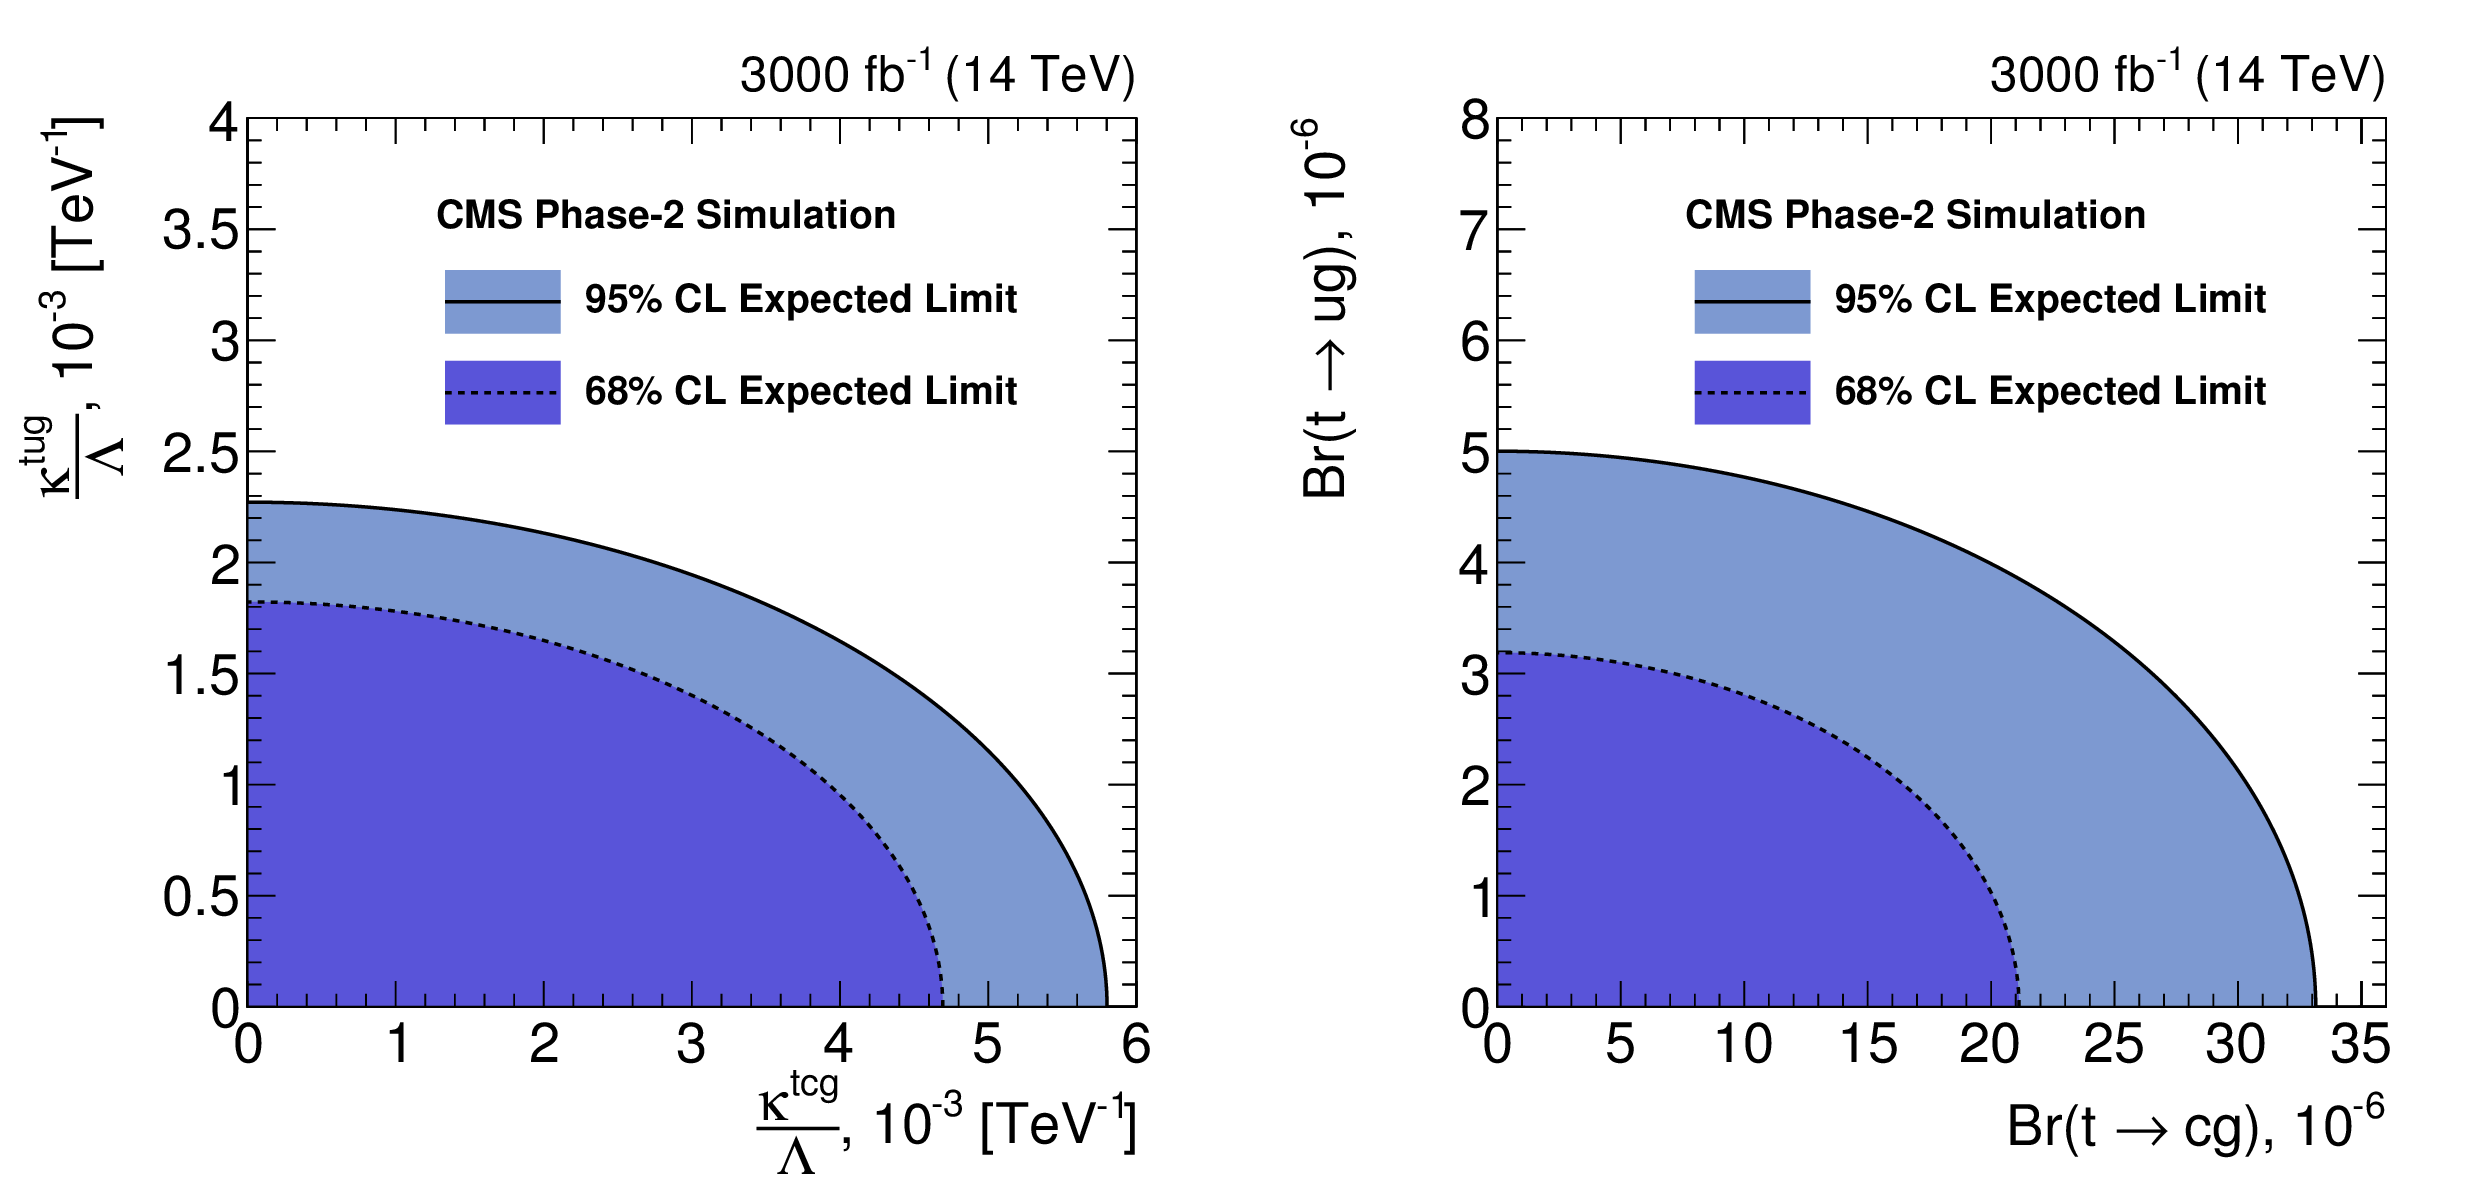
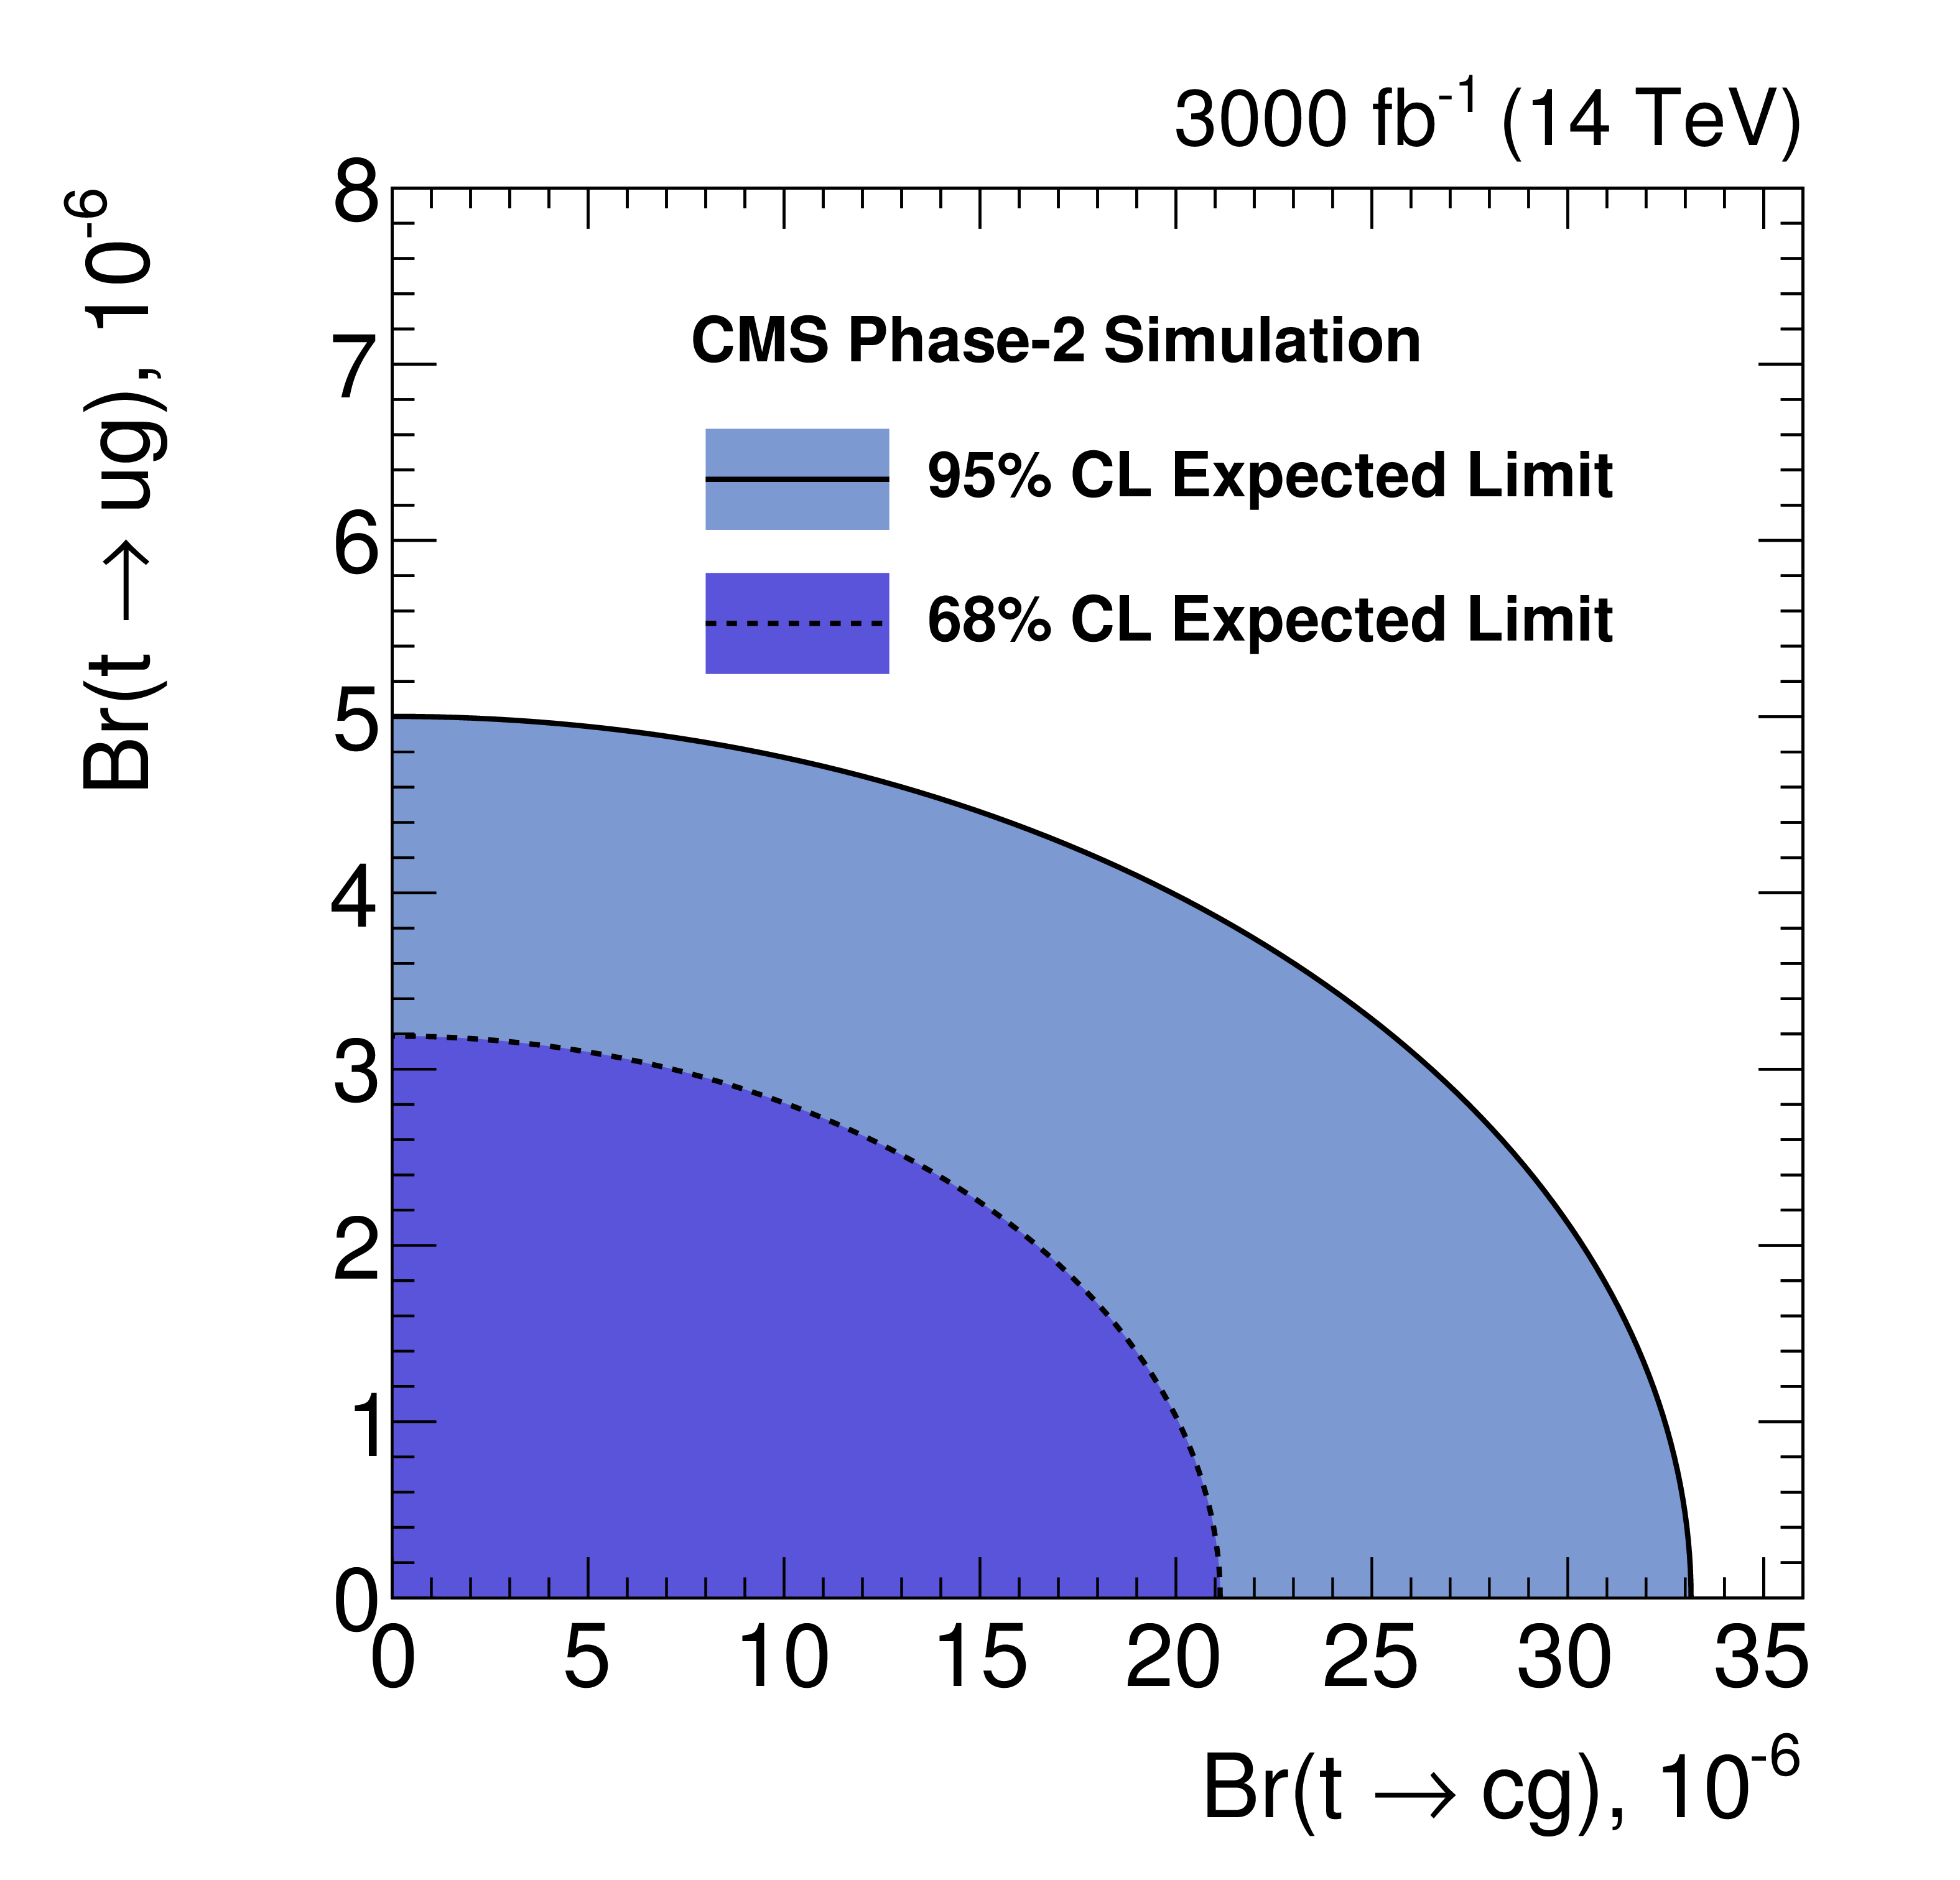
Figure 8:
Two-dimensional expected limits on the FCNC couplings and the corresponding branching fractions at 68% and 95% C.L. for an integrated luminosity of 3000 fb$^{-1}$. |

png pdf |
Figure 8-a:
Two-dimensional expected limits on the FCNC couplings and the corresponding branching fractions at 68% and 95% C.L. for an integrated luminosity of 3000 fb$^{-1}$. |
png pdf |
Figure 8-b:
Two-dimensional expected limits on the FCNC couplings and the corresponding branching fractions at 68% and 95% C.L. for an integrated luminosity of 3000 fb$^{-1}$. |
png pdf |
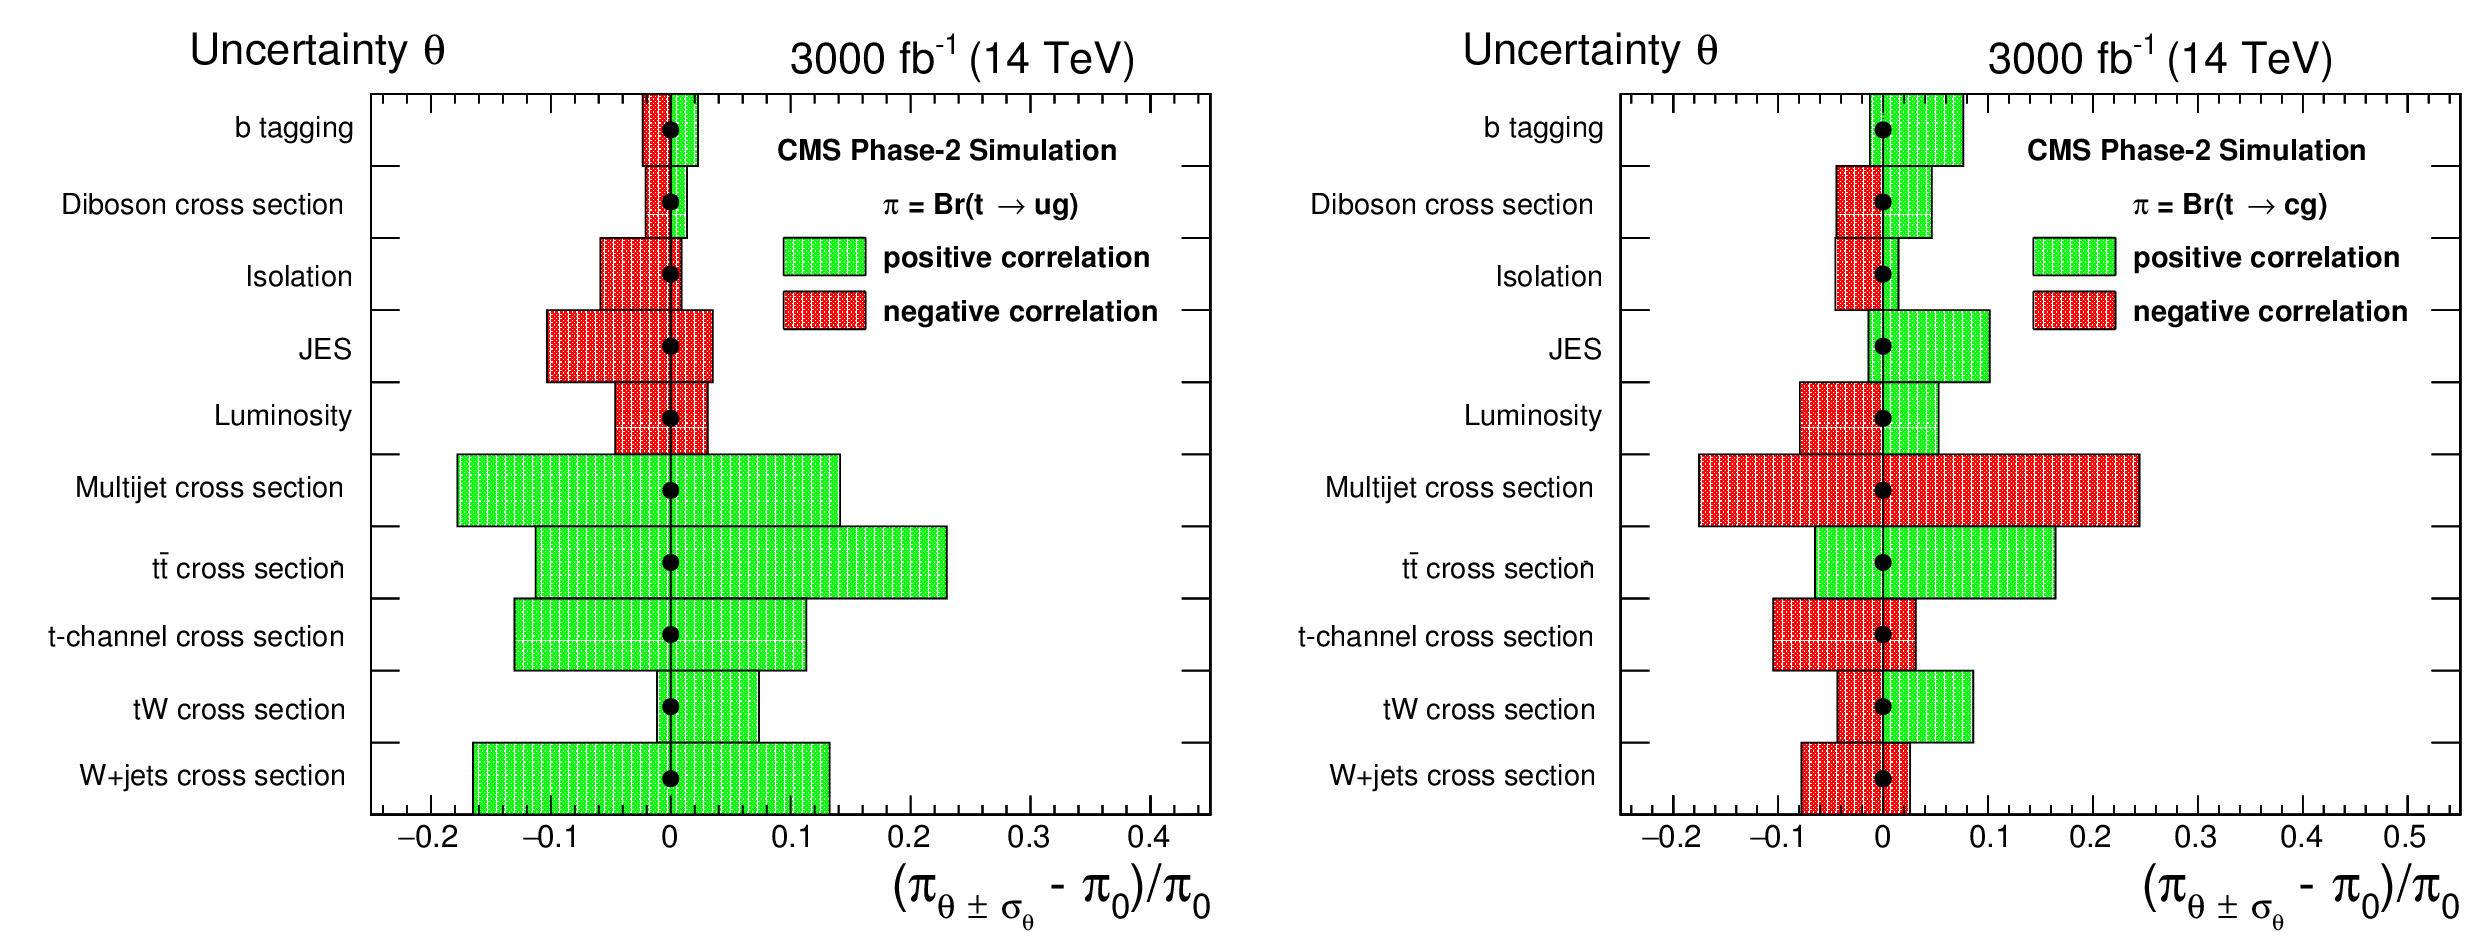
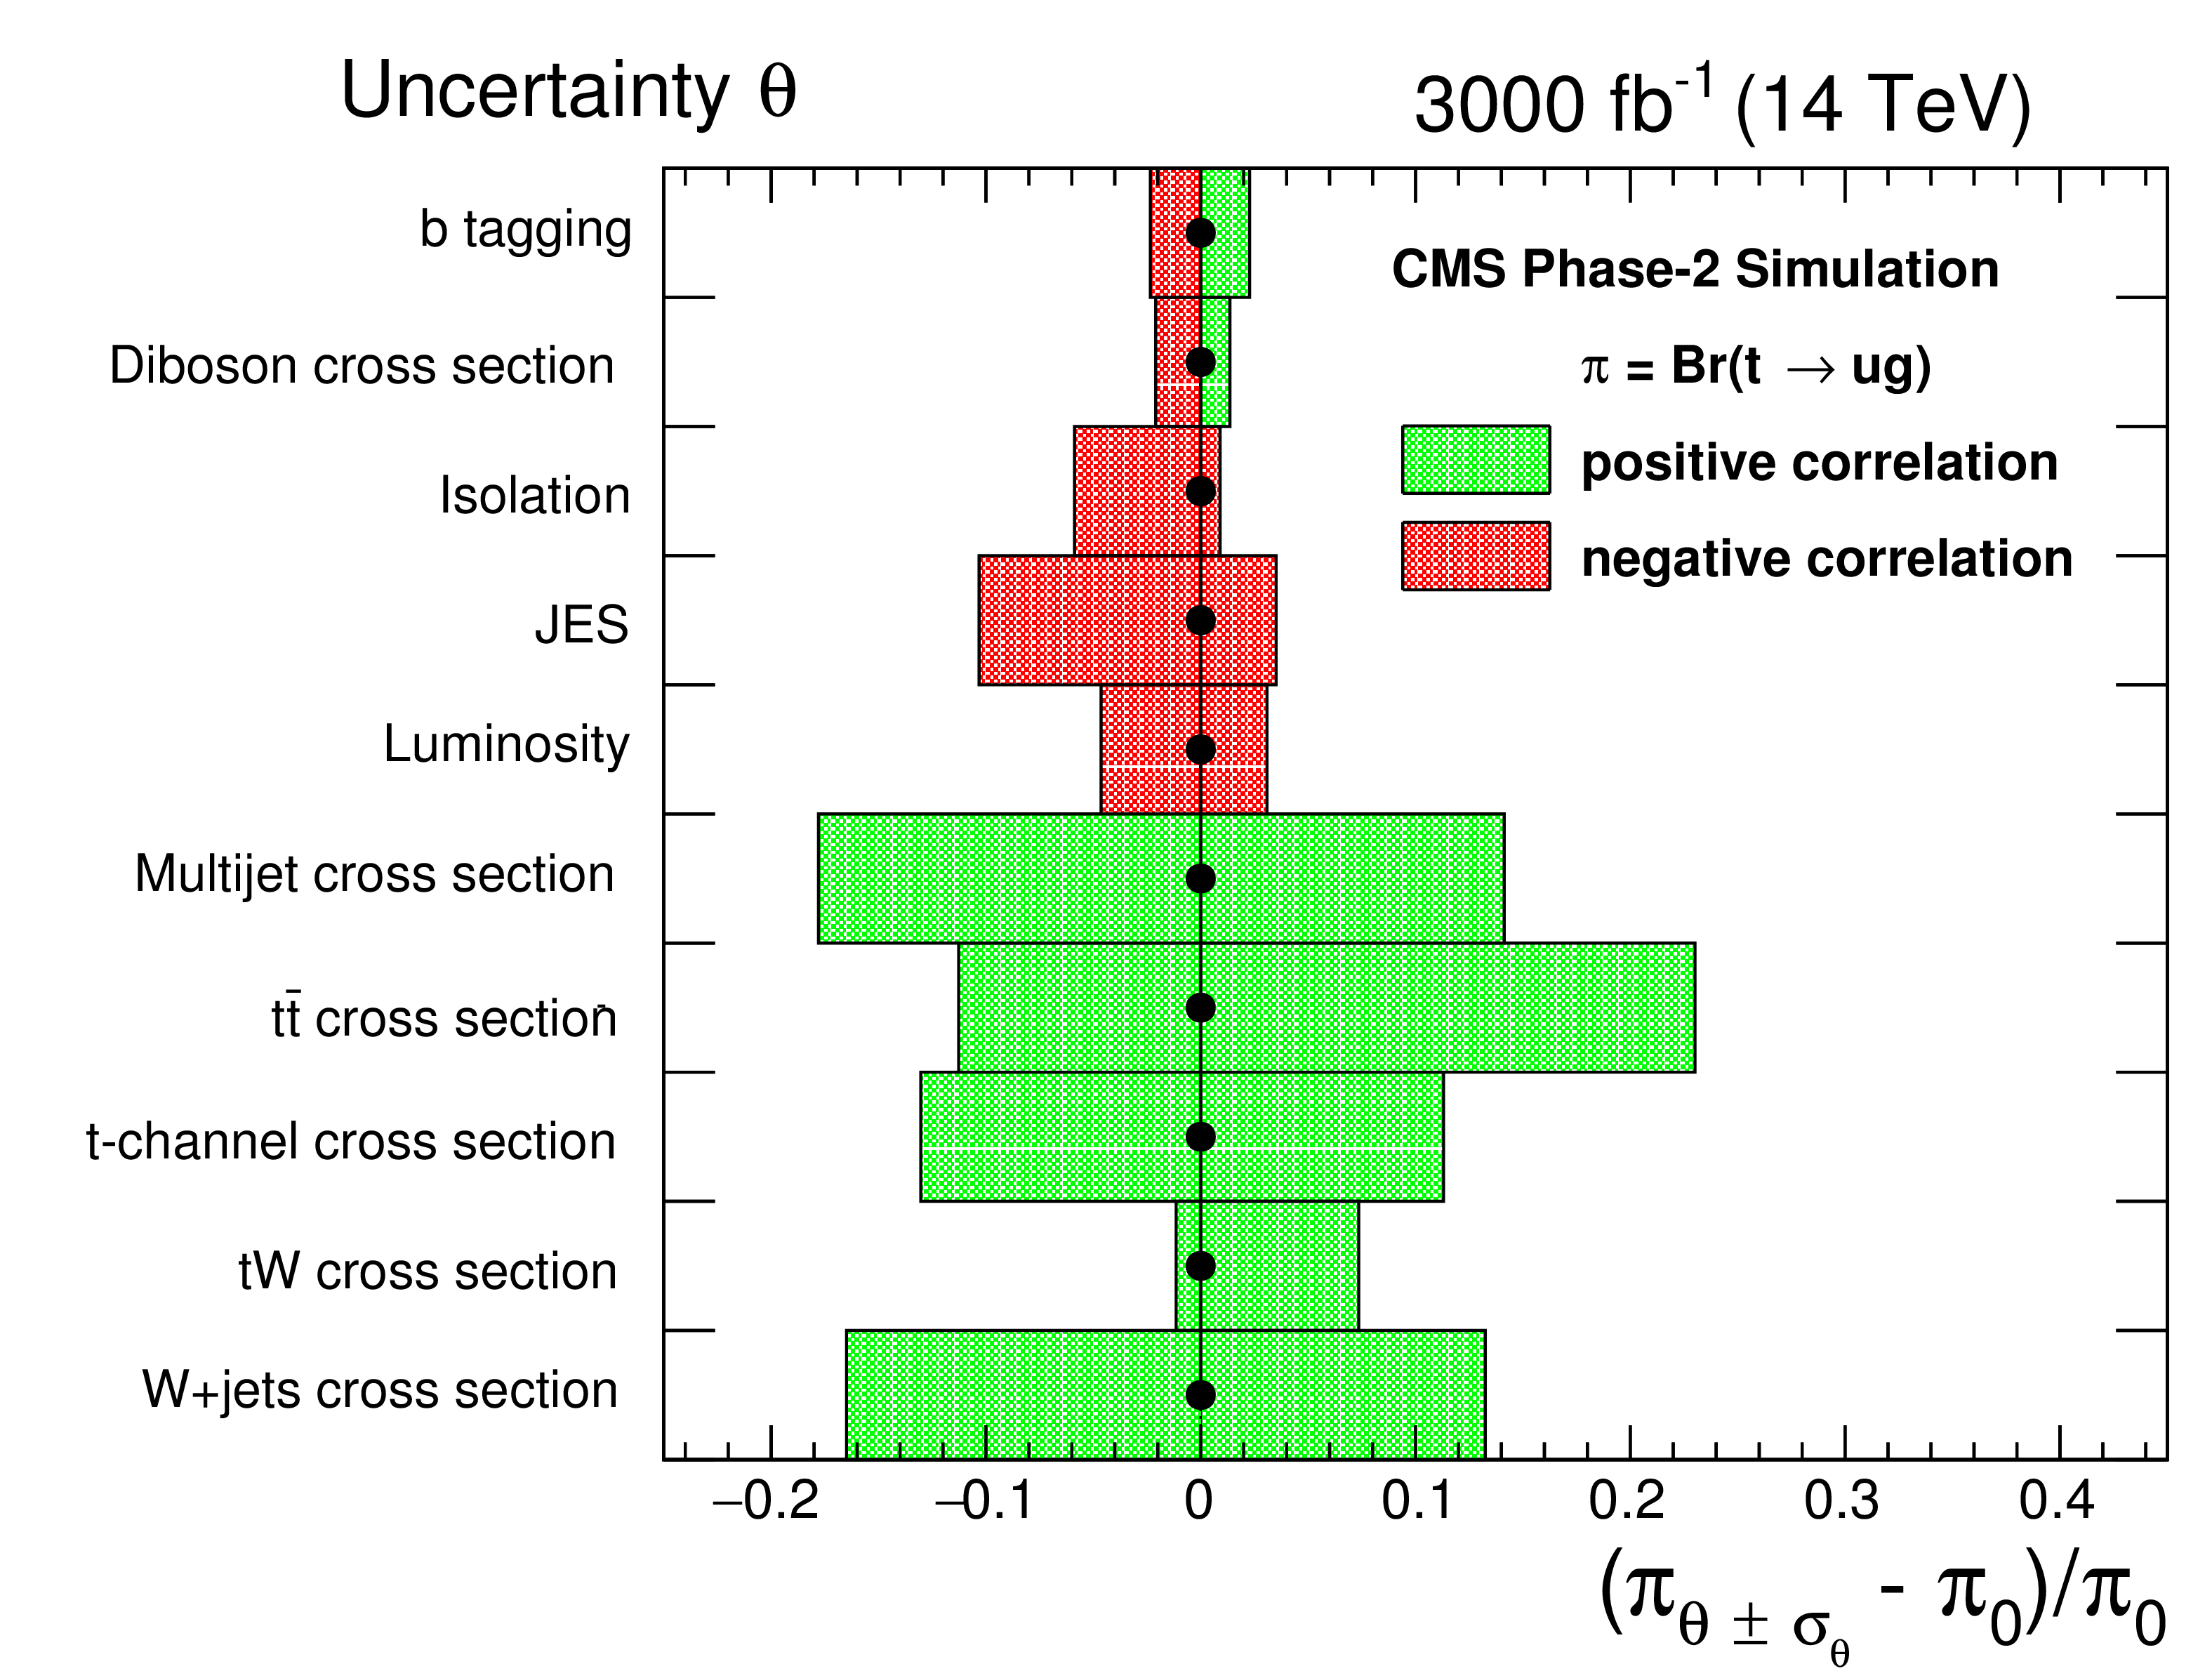
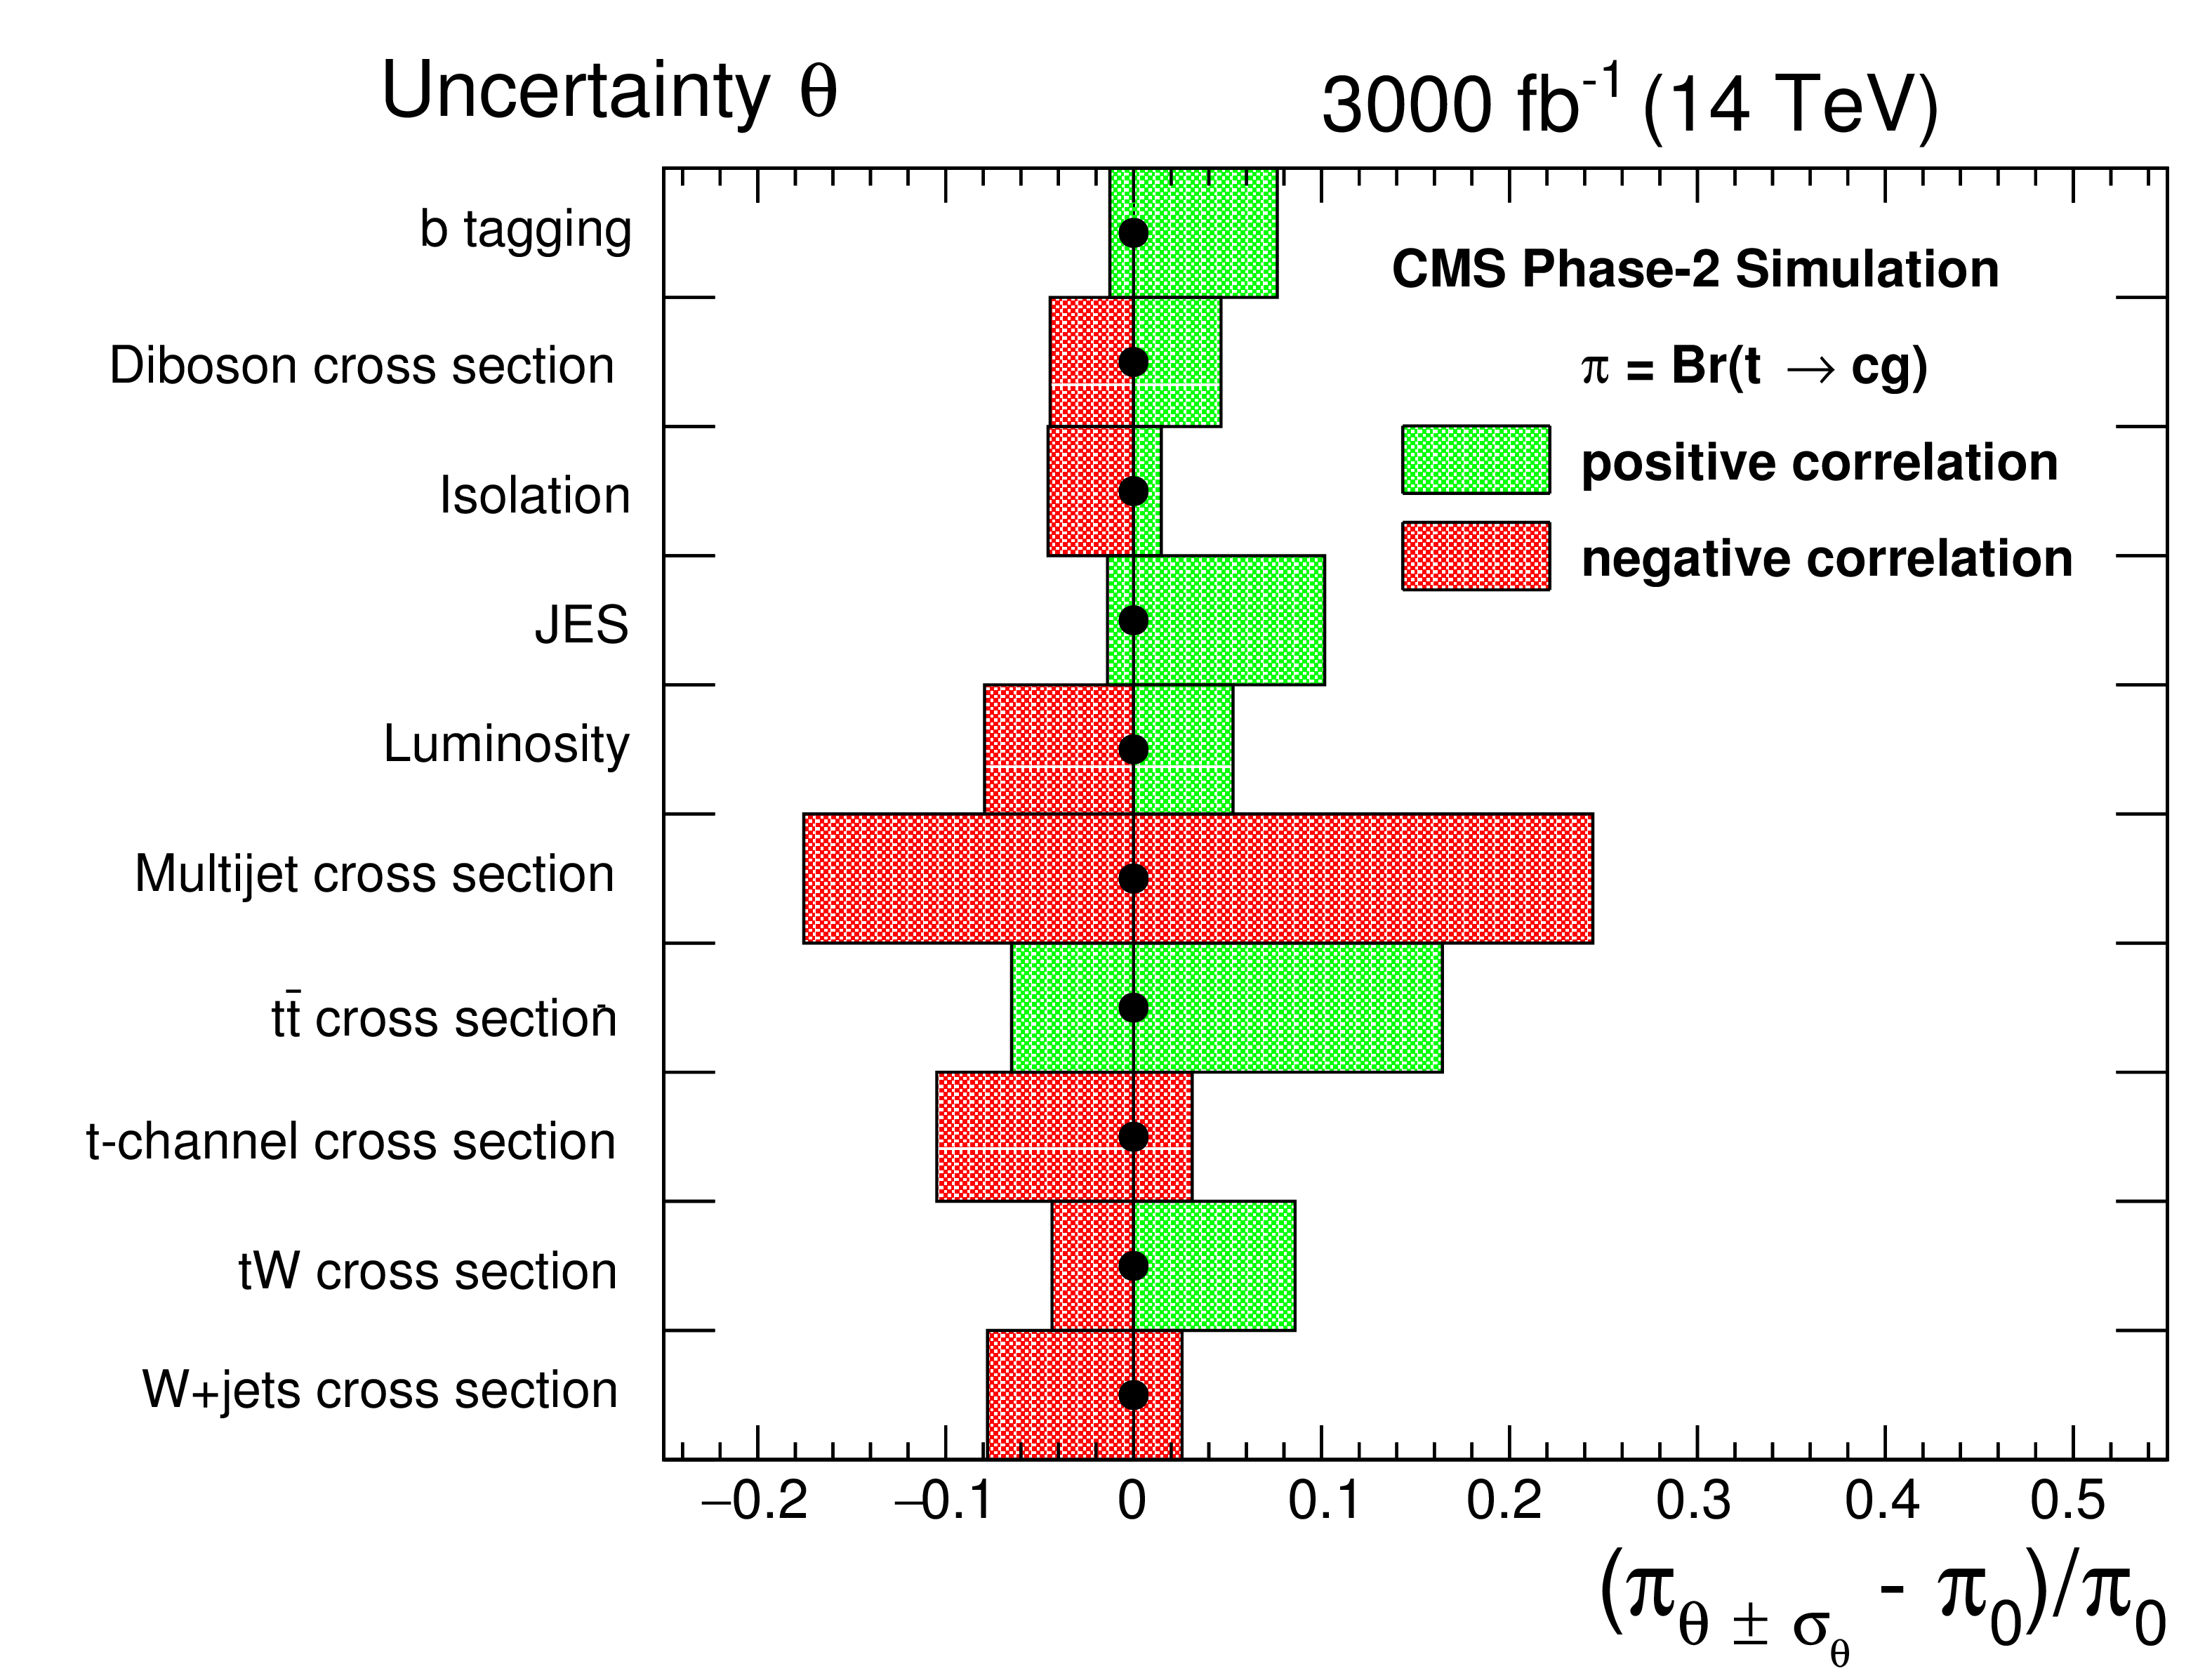
Figure 9:
Effect of the systematic uncertainties on the expected exclusion limits on the branching fractions for $\mathcal {B}({\rm t\rightarrow \rm ug})$ (left plot) and $\mathcal {B}({\rm t\rightarrow \rm cg})$ (right plot). |
png pdf |
Figure 9-a:
Effect of the systematic uncertainties on the expected exclusion limits on the branching fractions for $\mathcal {B}({\rm t\rightarrow \rm ug})$ (left plot) and $\mathcal {B}({\rm t\rightarrow \rm cg})$ (right plot). |
png pdf |
Figure 9-b:
Effect of the systematic uncertainties on the expected exclusion limits on the branching fractions for $\mathcal {B}({\rm t\rightarrow \rm ug})$ (left plot) and $\mathcal {B}({\rm t\rightarrow \rm cg})$ (right plot). |
| Tables | |

png pdf |
Table 1:
Input variables for the BNN/DNNs used in the analysis. The symbol X represents the variables used for each particular BNN/DNN. The notations "leading" and "next-to-leading" refer to the highest-$ {p_{\mathrm {T}}} $ and second-highest-$ {p_{\mathrm {T}}} $ jet, respectively. The notation "best" jet is used for the jet that gives a reconstructed mass of the top quark closest to the value of 172.5 GeV, which is used in the MC simulation. |

png pdf |
Table 2:
The predicted event yields before and after the multijet BNN suppression for integrated luminosity of 3000 fb$^{-1}$. The estimations for tug and tcg processes assume coupling values of $| \kappa _{\rm tug}| = $ 0.03 and $ | \kappa _{\rm tcg}| = $ 0.03 TeV$ ^{-1}$, respectively. |

png pdf |
Table 3:
The expected exclusion 1D limits at 95% C.L. on the FCNC couplings and the corresponding branching fractions for an integrated luminosity of 300 fb$^{-1}$ and 3000 fb$^{-1}$. In addition, a comparison with statistic-only uncertainties is shown. |
| Summary |
| A direct search for model-independent FCNC ${|\kappa_{\rm tug}|/\lambda}$ and ${|\kappa_{\rm tcg}|/\lambda}$ couplings of the tug and tcg interactions has been projected for HL-LHC pp collisions at $\sqrt{s} = $ 14 TeV based on full Monte Carlo simulation of the CMS experiment after the Phase II upgrades. The 95% C.L. expected exclusion limits on the coupling strengths are $|\kappa_\mathrm{tug}| /\lambda < 1.8 \times 10^{-3}\, (2.9 \times 10^{-3})\, \mathrm{TeV^{-1}}$ and $|\kappa_\mathrm{tcg}| /\lambda < 5.2 \times 10^{-3}\, (9.1 \times 10^{-3}) \,\mathrm{TeV^{-1}}$ for the integrated luminosity of 3000 fb$^{-1}$ (300 fb$^{-1}$). The corresponding limits on branching fractions for the integrated luminosity of 3000 fb$^{-1}$ are $\mathcal{B}({\rm t\rightarrow \rm ug} ) < 3.8 \times 10^{-6}$ and $\mathcal{B}({\rm t\rightarrow \rm cg} ) < 32 \times 10^{-6}$. These results demonstrate that about one order of magnitude improvement can be achieved with respect to existing limits [23] on the branching fractions of rare FCNC top quark decays. |
| Additional Tables | |
png pdf |
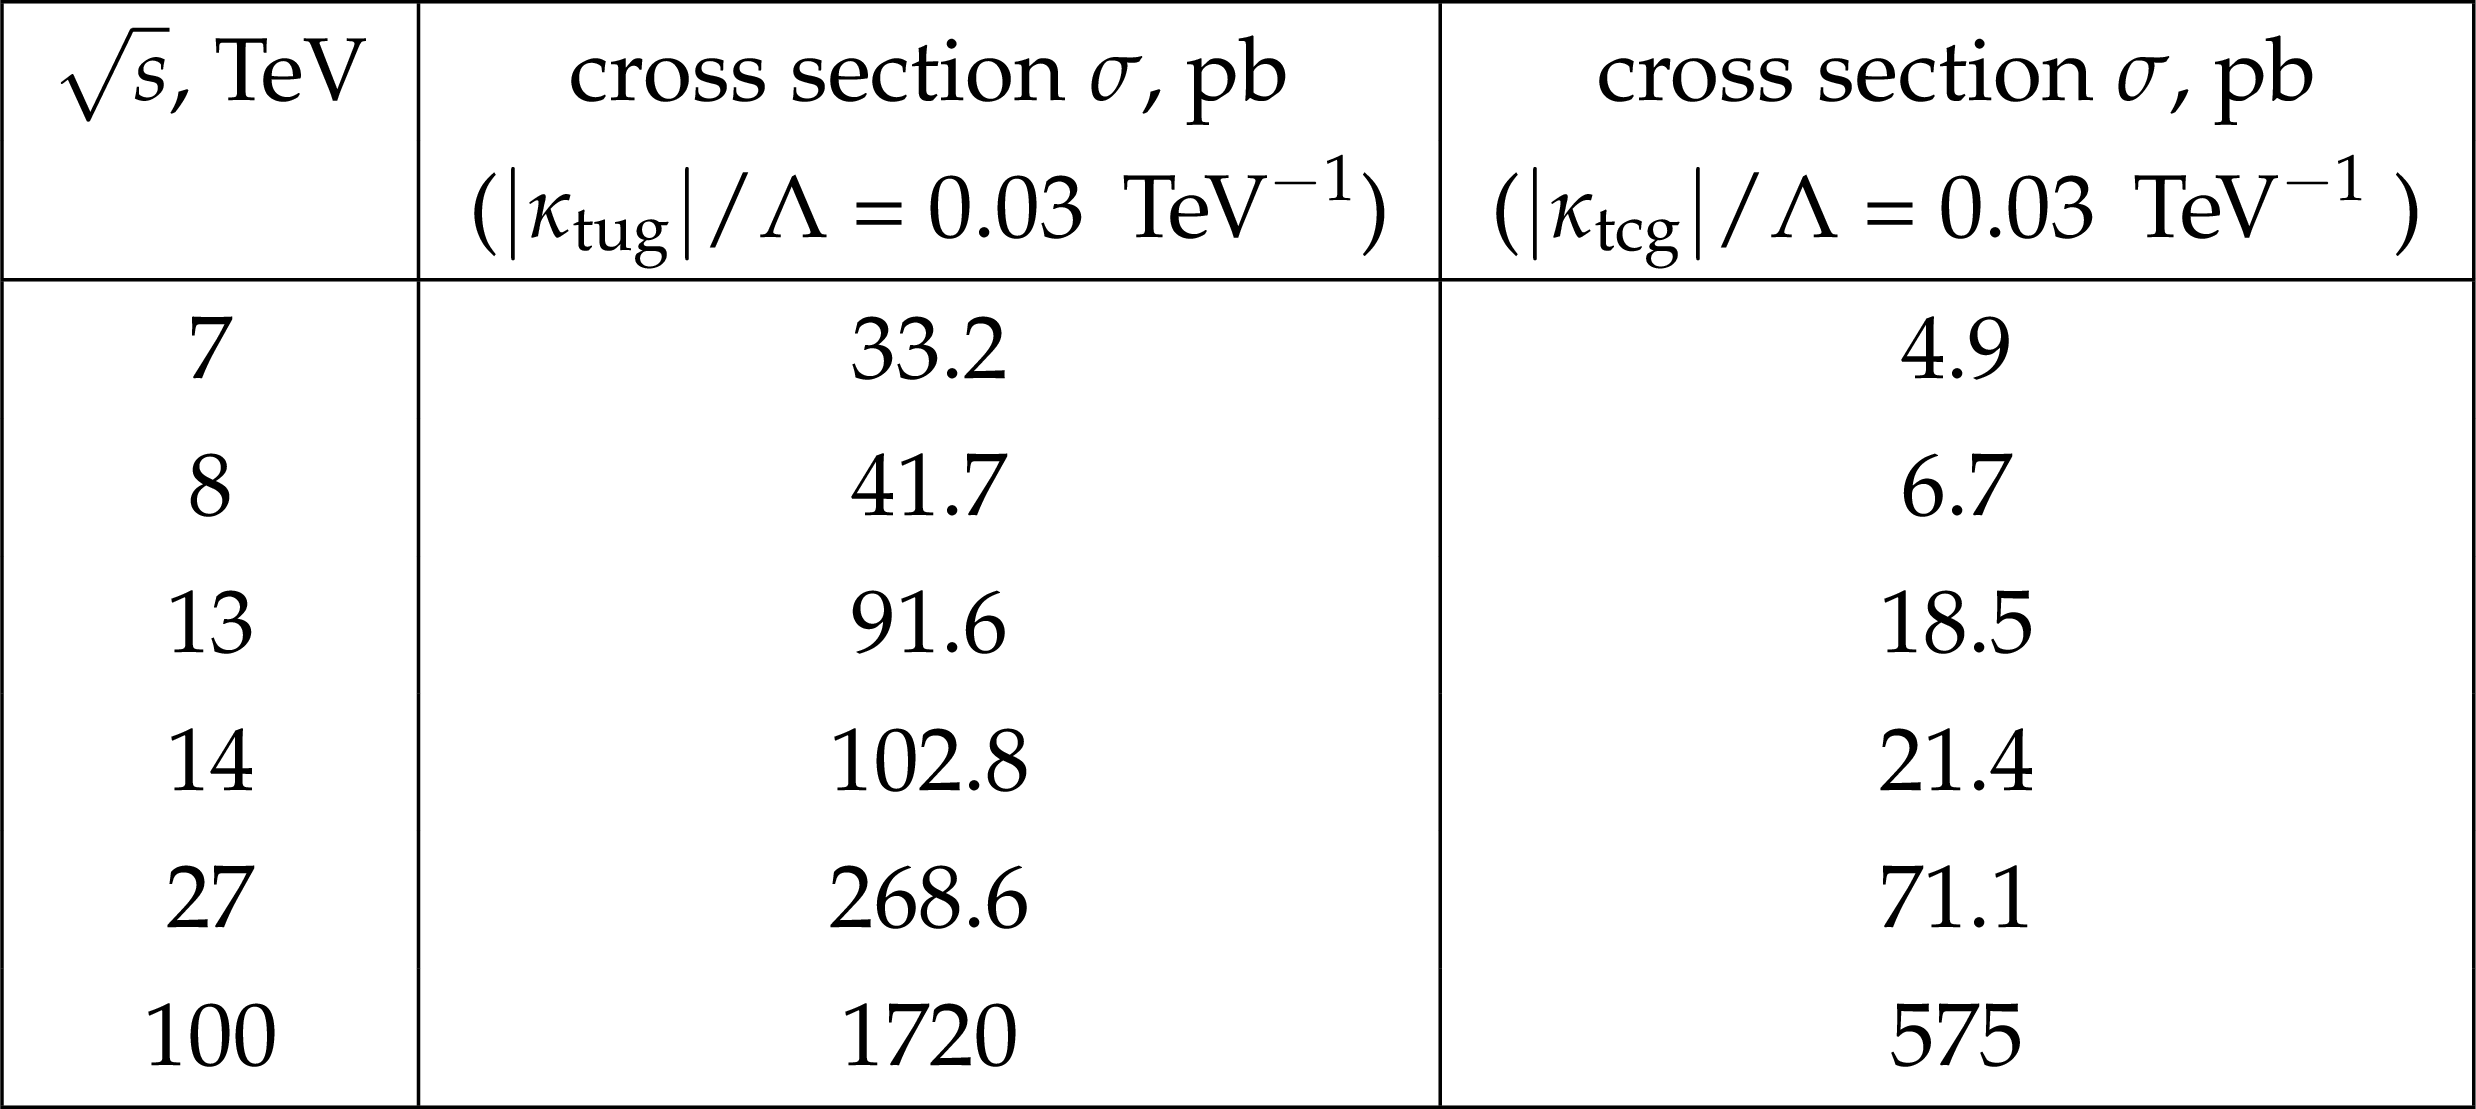
Additional Table 1:
The FCNC $ {\rm pp\rightarrow \rm tj} $ process cross sections for different energies of pp collisions at the LHC. The cross sections are calculated in CompHEP at LO and could be scaled to NLO cross sections using a corresponding k-factor [54]. The given numbers for tgu and tgc processes assume a coupling values of ${< \kappa _{\rm tug}> /\Lambda} = $ 0.03 and $ {< \kappa _{\rm tcg}> /\Lambda} = $ 0.03 TeV$ ^{-1}$, respectively. |
png pdf |
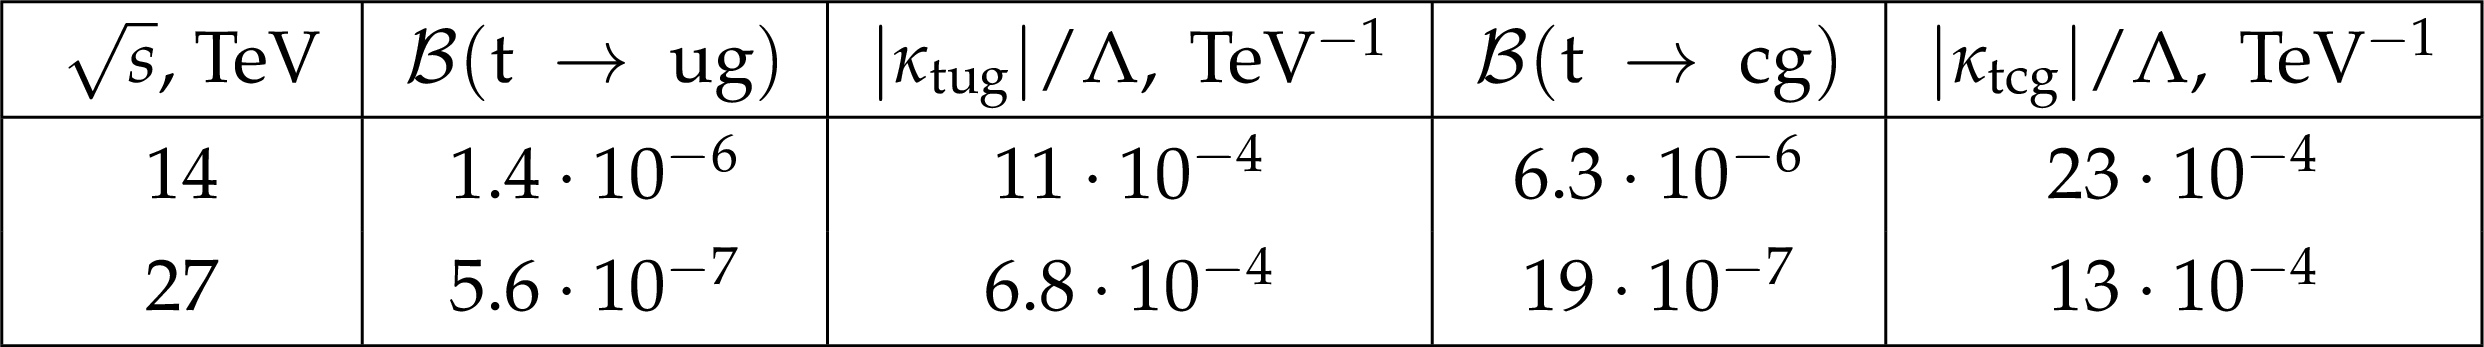
Additional Table 2:
The expected exclusion 1D limits at 95% C.L. on the FCNC couplings and the corresponding branching fractions for $\sqrt {s} = $ 14 TeV and integrated luminosity $\mathcal {L} = $ 15 ab$^{-1}$, and extrapolation of the expected limits to $\sqrt {s} = $ 27 TeV, $\mathcal {L}=$ 15 ab$^{-1}$. The extrapolation has been performed with the following formula: $ {< \kappa ^\mathrm {exp}_\mathrm {27 TeV}>} / {\Lambda} = {< \kappa ^\mathrm {exp}_\mathrm {14 TeV}>} / {\Lambda} \sqrt {\frac {\sigma _\mathrm {14 TeV}} {\sigma _\mathrm {27 TeV}}}$. |
| References | ||||
| 1 | M. Beneke et al. | Top quark physics | in 1999 CERN Workshop on standard model physics (and more) at the LHC, CERN, Geneva, Switzerland, 25-26 May: Proceedings, pp. 419--529 2000 | hep-ph/0003033 |
| 2 | S. L. Glashow, J. Iliopoulos, and L. Maiani | Weak interactions with lepton-hadron symmetry | PRD 2 (1970) 1285 | |
| 3 | Particle Data Group, C. Patrignani et al. | Review of particle physics | CPC 40 (2016) 100001 | |
| 4 | G. Eilam, J. L. Hewett, and A. Soni | Rare decays of the top quark in the standard and two Higgs doublet models | PRD 44 (1991) 1473, .[Erratum: \DOI10.1103/PhysRevD.59.039901 | |
| 5 | D. Atwood, L. Reina, and A. Soni | Probing flavor changing top-charm-scalar interactions in $ {\rm e^{+} e^{-}} $ collisions | PRD 53 (1996) 1199 | hep-ph/9506243 |
| 6 | J. M. Yang, B.-L. Young, and X. Zhang | Flavor-changing top quark decays in R-parity-violating SUSY | PRD 58 (1998) 055001 | hep-ph/9705341 |
| 7 | Y. Grossman | Phenomenology of models with more than two Higgs doublets | NPB 426 (1994) 355 | hep-ph/9401311 |
| 8 | A. Pich and P. Tuzon | Yukawa alignment in the two-Higgs-doublet model | PRD 80 (2009) 091702 | 0908.1554 |
| 9 | V. Keus, S. F. King, and S. Moretti | Three-Higgs-doublet models: symmetries, potentials and Higgs boson masses | JHEP 01 (2014) 052 | 1310.8253 |
| 10 | J. L. Diaz-Cruz, R. Martinez, M. A. Perez, and A. Rosado | Flavor changing radiative decay of the t quark | PRD 41 (1990) 891 | |
| 11 | A. Arhrib and W.-S. Hou | Flavor changing neutral currents involving heavy quarks with four generations | JHEP 07 (2006) 009 | hep-ph/0602035 |
| 12 | G. C. Branco and M. N. Rebelo | New physics in the flavour sector in the presence of flavour changing neutral currents | in Proceedings of the Corfu Summer Institute 2012, p. 024 2013 | 1308.4639 |
| 13 | H. Georgi, L. Kaplan, D. Morin, and A. Schenk | Effects of top compositeness | PRD 51 (1995) 3888 | hep-ph/9410307 |
| 14 | G. F. Giudice, C. Grojean, A. Pomarol, and R. Rattazzi | The strongly-interacting light Higgs | JHEP 06 (2007) 045 | hep-ph/0703164 |
| 15 | M. Konig, M. Neubert, and D. M. Straub | Dipole operator constraints on composite Higgs models | EPJC 74 (2014) 2945 | 1403.2756 |
| 16 | K. Agashe et al. | Warped dipole completed, with a tower of Higgs bosons | JHEP 06 (2015) 196 | 1412.6468 |
| 17 | R. Contino, Y. Nomura, and A. Pomarol | Higgs as a holographic pseudo-Goldstone boson | NPB 671 (2003) 148 | hep-ph/0306259 |
| 18 | J. A. Aguilar-Saavedra | A minimal set of top anomalous couplings | NPB 812 (2009) 181 | 0811.3842 |
| 19 | S. Willenbrock and C. Zhang | Effective field theory beyond the Standard Model | Ann. Rev. Nucl. Part. Sci. 64 (2014) 83 | 1401.0470 |
| 20 | CDF Collaboration | Search for top-quark production via flavor-changing neutral currents in $ \mathrm{W} $+1 jet events at CDF | PRL 102 (2009) 151801 | 0812.3400 |
| 21 | D0 Collaboration | Search for flavor changing neutral currents via quark-gluon couplings in single top quark production using 2.3$ fb$^{-1} of $ \rm {p\bar{p}} $ collisions | PLB 693 (2010) 81 | 1006.3575 |
| 22 | ATLAS Collaboration | Search for single top-quark production via flavour-changing neutral currents at 8 TeV with the ATLAS detector | EPJC 76 (2016) 55 | 1509.00294 |
| 23 | CMS Collaboration | Search for anomalous Wtb couplings and flavour-changing neutral currents in t-channel single top quark production in pp collisions at $ \sqrt{s} = $ 7 and 8 TeV | JHEP 02 (2017) 028 | CMS-TOP-14-007 1610.03545 |
| 24 | CMS Collaboration | The Phase-2 Upgrade of the CMS Endcap Calorimeter | CDS | |
| 25 | CMS Collaboration | The Phase-2 Upgrade of the CMS DAQ Interim Technical Design Report | CDS | |
| 26 | CMS Collaboration | The Phase-2 Upgrade of the CMS L1 Trigger Interim Technical Design Report | CDS | |
| 27 | CMS Collaboration | The Phase-2 Upgrade of the CMS Muon Detectors | CDS | |
| 28 | CMS Collaboration | The Phase-2 Upgrade of the CMS Tracker | CDS | |
| 29 | CMS Collaboration | Technical proposal for the Phase-II upgrade of the Compact Muon Solenoid | CMS-PAS-TDR-15-002 | CMS-PAS-TDR-15-002 |
| 30 | CMS Collaboration | Measurement of the $ t $-channel single-top-quark production cross section and of the $ |V_{\mathrm{tb}}| $ CKM matrix element in pp collisions at $ \sqrt{s} = $ 8 TeV | JHEP 06 (2014) 090 | CMS-TOP-12-038 1403.7366 |
| 31 | CMS Collaboration | Measurement of top quark polarisation in $ t $-channel single top quark production | JHEP 04 (2016) 073 | CMS-TOP-13-001 1511.02138 |
| 32 | ATLAS Collaboration | Comprehensive measurements of $ t $-channel single top-quark production cross sections at $ \sqrt{s} = $ 7 TeV with the ATLAS detector | PRD 90 (2014) 112006 | 1406.7844 |
| 33 | E. Boos et al. | Method for simulating electroweak top-quark production events in the NLO approximation: SingleTop event generator | Phys. Atom. Nucl. 69 (2006) 1317 | |
| 34 | E. Boos et al. | CompHEP 4.4: automatic computations from Lagrangians to events | NIMA 534 (2004) 250 | hep-ph/0403113 |
| 35 | J. Alwall et al. | MadGraph 5: going beyond | JHEP 06 (2011) 128 | 1106.0522 |
| 36 | S. Alioli, P. Nason, C. Oleari, and E. Re | A general framework for implementing NLO calculations in shower Monte Carlo programs: the POWHEG BOX | JHEP 06 (2010) 043 | 1002.2581 |
| 37 | CMS Collaboration | Particle-flow reconstruction and global event description with the CMS detector | JINST 12 (2017) P10003 | CMS-PRF-14-001 1706.04965 |
| 38 | M. Cacciari, G. P. Salam, and G. Soyez | The anti-$ {k_{\mathrm{T}}} $ jet clustering algorithm | JHEP 04 (2008) 063 | 0802.1189 |
| 39 | M. Cacciari, G. P. Salam, and G. Soyez | FastJet user manual | EPJC 72 (2012) 1896 | 1111.6097 |
| 40 | CMS Collaboration | Performance of CMS muon reconstruction in pp collision events at $ \sqrt{s}= $ 7 TeV | JINST 7 (2012) P10002 | CMS-MUO-10-004 1206.4071 |
| 41 | D. Bertolini, P. Harris, M. Low, and N. Tran | Pileup Per Particle Identification | JHEP 10 (2014) 059 | 1407.6013 |
| 42 | CMS Collaboration | Identification of heavy-flavour jets with the CMS detector in pp collisions at 13 TeV | JINST 13 (2018) P05011 | CMS-BTV-16-002 1712.07158 |
| 43 | M. N. Radford | Number ISBN 0-387-94724-8. Dept. of Statistics and Dept. of Computer Science, University of Toronto | ||
| 44 | M. N. Radford | Number 2004-11-10. Dept. of Statistics and Dept. of Computer Science, University of Toronto | ||
| 45 | E.Boos et al. | Method of Optimum Observables and Implementation of Neural Networks in Physics Investigations | Phys. Atom. Nucl. 71 (2008) 383--393 | |
| 46 | G. Mahlon and S. J. Parke | Improved spin basis for angular correlation studies in single top quark production at the Tevatron | PRD 55 (1997) 7249 | hep-ph/9611367 |
| 47 | J. A. Aguilar-Saavedra and R. V. Herrero-Hahn | Model-independent measurement of the top quark polarisation | PLB 718 (2012) 983 | 1208.6006 |
| 48 | M. Abadi et al. | Tensorflow: Large-scale machine learning on heterogeneous distributed systems | CoRR (2016) | 1603.04467 |
| 49 | F. Chollet et al. | |||
| 50 | D. Anderson, J.-R. Vlimant, and M. Spiropulu | An MPI-Based Python Framework for Distributed Training with Keras | in International Conference for High Performance Computing, Networking, Storage and Analysis (SC17) Denver, CO, November 12-17, 2017 2017 | 1712.05878 |
| 51 | J. Ott | PhD thesis, Hamburg U., CERN-THESIS-2012-343, IEKP-KA-2012-25, https://cds.cern.ch/record/1517436 | ||
| 52 | M. Czakon, P. Fiedler, and A. Mitov | Total top-quark pair-production cross section at hadron colliders through $ \mathcal{O}(\alpha^4_S) $ | PRL 110 (2013) 252004 | 1303.6254 |
| 53 | LHC Higgs Cross Section Working Group Collaboration | Handbook of LHC Higgs Cross Sections: 4. Deciphering the Nature of the Higgs Sector | CERN-2017-002-M, FERMILAB-FN-1025-T, Oct | |
| 54 | J. J. Liu, C. S. Li, L. L. Yang, and L. G. Jin | Next-to-leading order QCD corrections to the direct top quark production via model-independent FCNC couplings at hadron colliders | PRD 72 (2005) 074018 | hep-ph/0508016 |
| 55 | J. J. Zhang et al. | Next-to-leading order QCD corrections to the top quark decay via model-independent FCNC couplings | PRL 102 (2009) 072001 | 0810.3889 |
|
|
Compact Muon Solenoid LHC, CERN |
|

|

|

|

|

|