

Compact Muon Solenoid
LHC, CERN
| CMS-PAS-HIG-16-003 | ||
| Search for the standard model Higgs boson produced through vector boson fusion and decaying to $\mathrm{ b \bar{b} }$ with proton-proton collisions at $\sqrt{s}= $ 13 TeV | ||
| CMS Collaboration | ||
| June 2016 | ||
| Abstract: A search for a standard model Higgs boson (H) that is produced through vector boson fusion and decays to a bottom-quark pair is performed using proton-proton collisions at $\sqrt{s}= $ 13 TeV. The data sample corresponds to an integrated luminosity of 2.3 fb$^{-1}$ recorded in 2015 with the CMS experiment at the CERN LHC. The observed 95% confidence level upper limit on the production of a $\mathrm{H}\rightarrow \mathrm{b\overline{b}}$ signal at a mass of 125 GeV is 3.0 times the standard model expectation, compared to 5.0 expected in absence of a signal. The combination of this result with the previous CMS search using proton-proton collisions at $\sqrt{s}= $ 8 TeV yields an observed 95% confidence level upper limit on the signal production of 3.4 times the standard model expectation, where 2.2 is expected in the absence of signal, and a corresponding fitted signal strength $\mu=\sigma/\sigma_\mathrm{SM}=1.3^{+1.2}_{-1.1}$. | ||
| Links: CDS record (PDF) ; inSPIRE record ; CADI line (restricted) ; | ||
| Figures | |

png pdf |
Figure 1-a:
Distributions of the invariant mass of the two VBF-jet candidates $(m_{\mathrm{ q } \mathrm{ q } })$ for events in the SingleB (left) and DoubleB (right) samples. Data are shown by the points, while the simulated backgrounds are stacked. The LO QCD cross section is scaled such that the total number of background events matches the number of events in the data for each category, with a resulting multiplicative factor of 1.10 and 1.01 for the SingleB and DoubleB samples respectively. The VBF Higgs boson signal is displayed by a solid line, and the GF Higgs boson signal is shown by a dashed line. The panels at the bottom show the fractional difference between data and background simulation, with the shaded band representing the statistical uncertainties in the MC samples. |

png pdf |
Figure 1-b:
Distributions of the invariant mass of the two VBF-jet candidates $(m_{\mathrm{ q } \mathrm{ q } })$ for events in the SingleB (left) and DoubleB (right) samples. Data are shown by the points, while the simulated backgrounds are stacked. The LO QCD cross section is scaled such that the total number of background events matches the number of events in the data for each category, with a resulting multiplicative factor of 1.10 and 1.01 for the SingleB and DoubleB samples respectively. The VBF Higgs boson signal is displayed by a solid line, and the GF Higgs boson signal is shown by a dashed line. The panels at the bottom show the fractional difference between data and background simulation, with the shaded band representing the statistical uncertainties in the MC samples. |

png pdf |
Figure 2-a:
Simulated invariant mass distribution of the two b-jet candidates before and after the jet ${p_{\mathrm {T}}}$ regression, for VBF signal events. The generated Higgs boson signal mass is 125 GeV and the event selection corresponds to the SingleB (a) and DoubleB (b) samples. By FWHM we denote the width of the distribution at the middle of its maximum height. |

png pdf |
Figure 2-b:
Simulated invariant mass distribution of the two b-jet candidates before and after the jet ${p_{\mathrm {T}}}$ regression, for VBF signal events. The generated Higgs boson signal mass is 125 GeV and the event selection corresponds to the SingleB (a) and DoubleB (b) samples. By FWHM we denote the width of the distribution at the middle of its maximum height. |
png pdf |
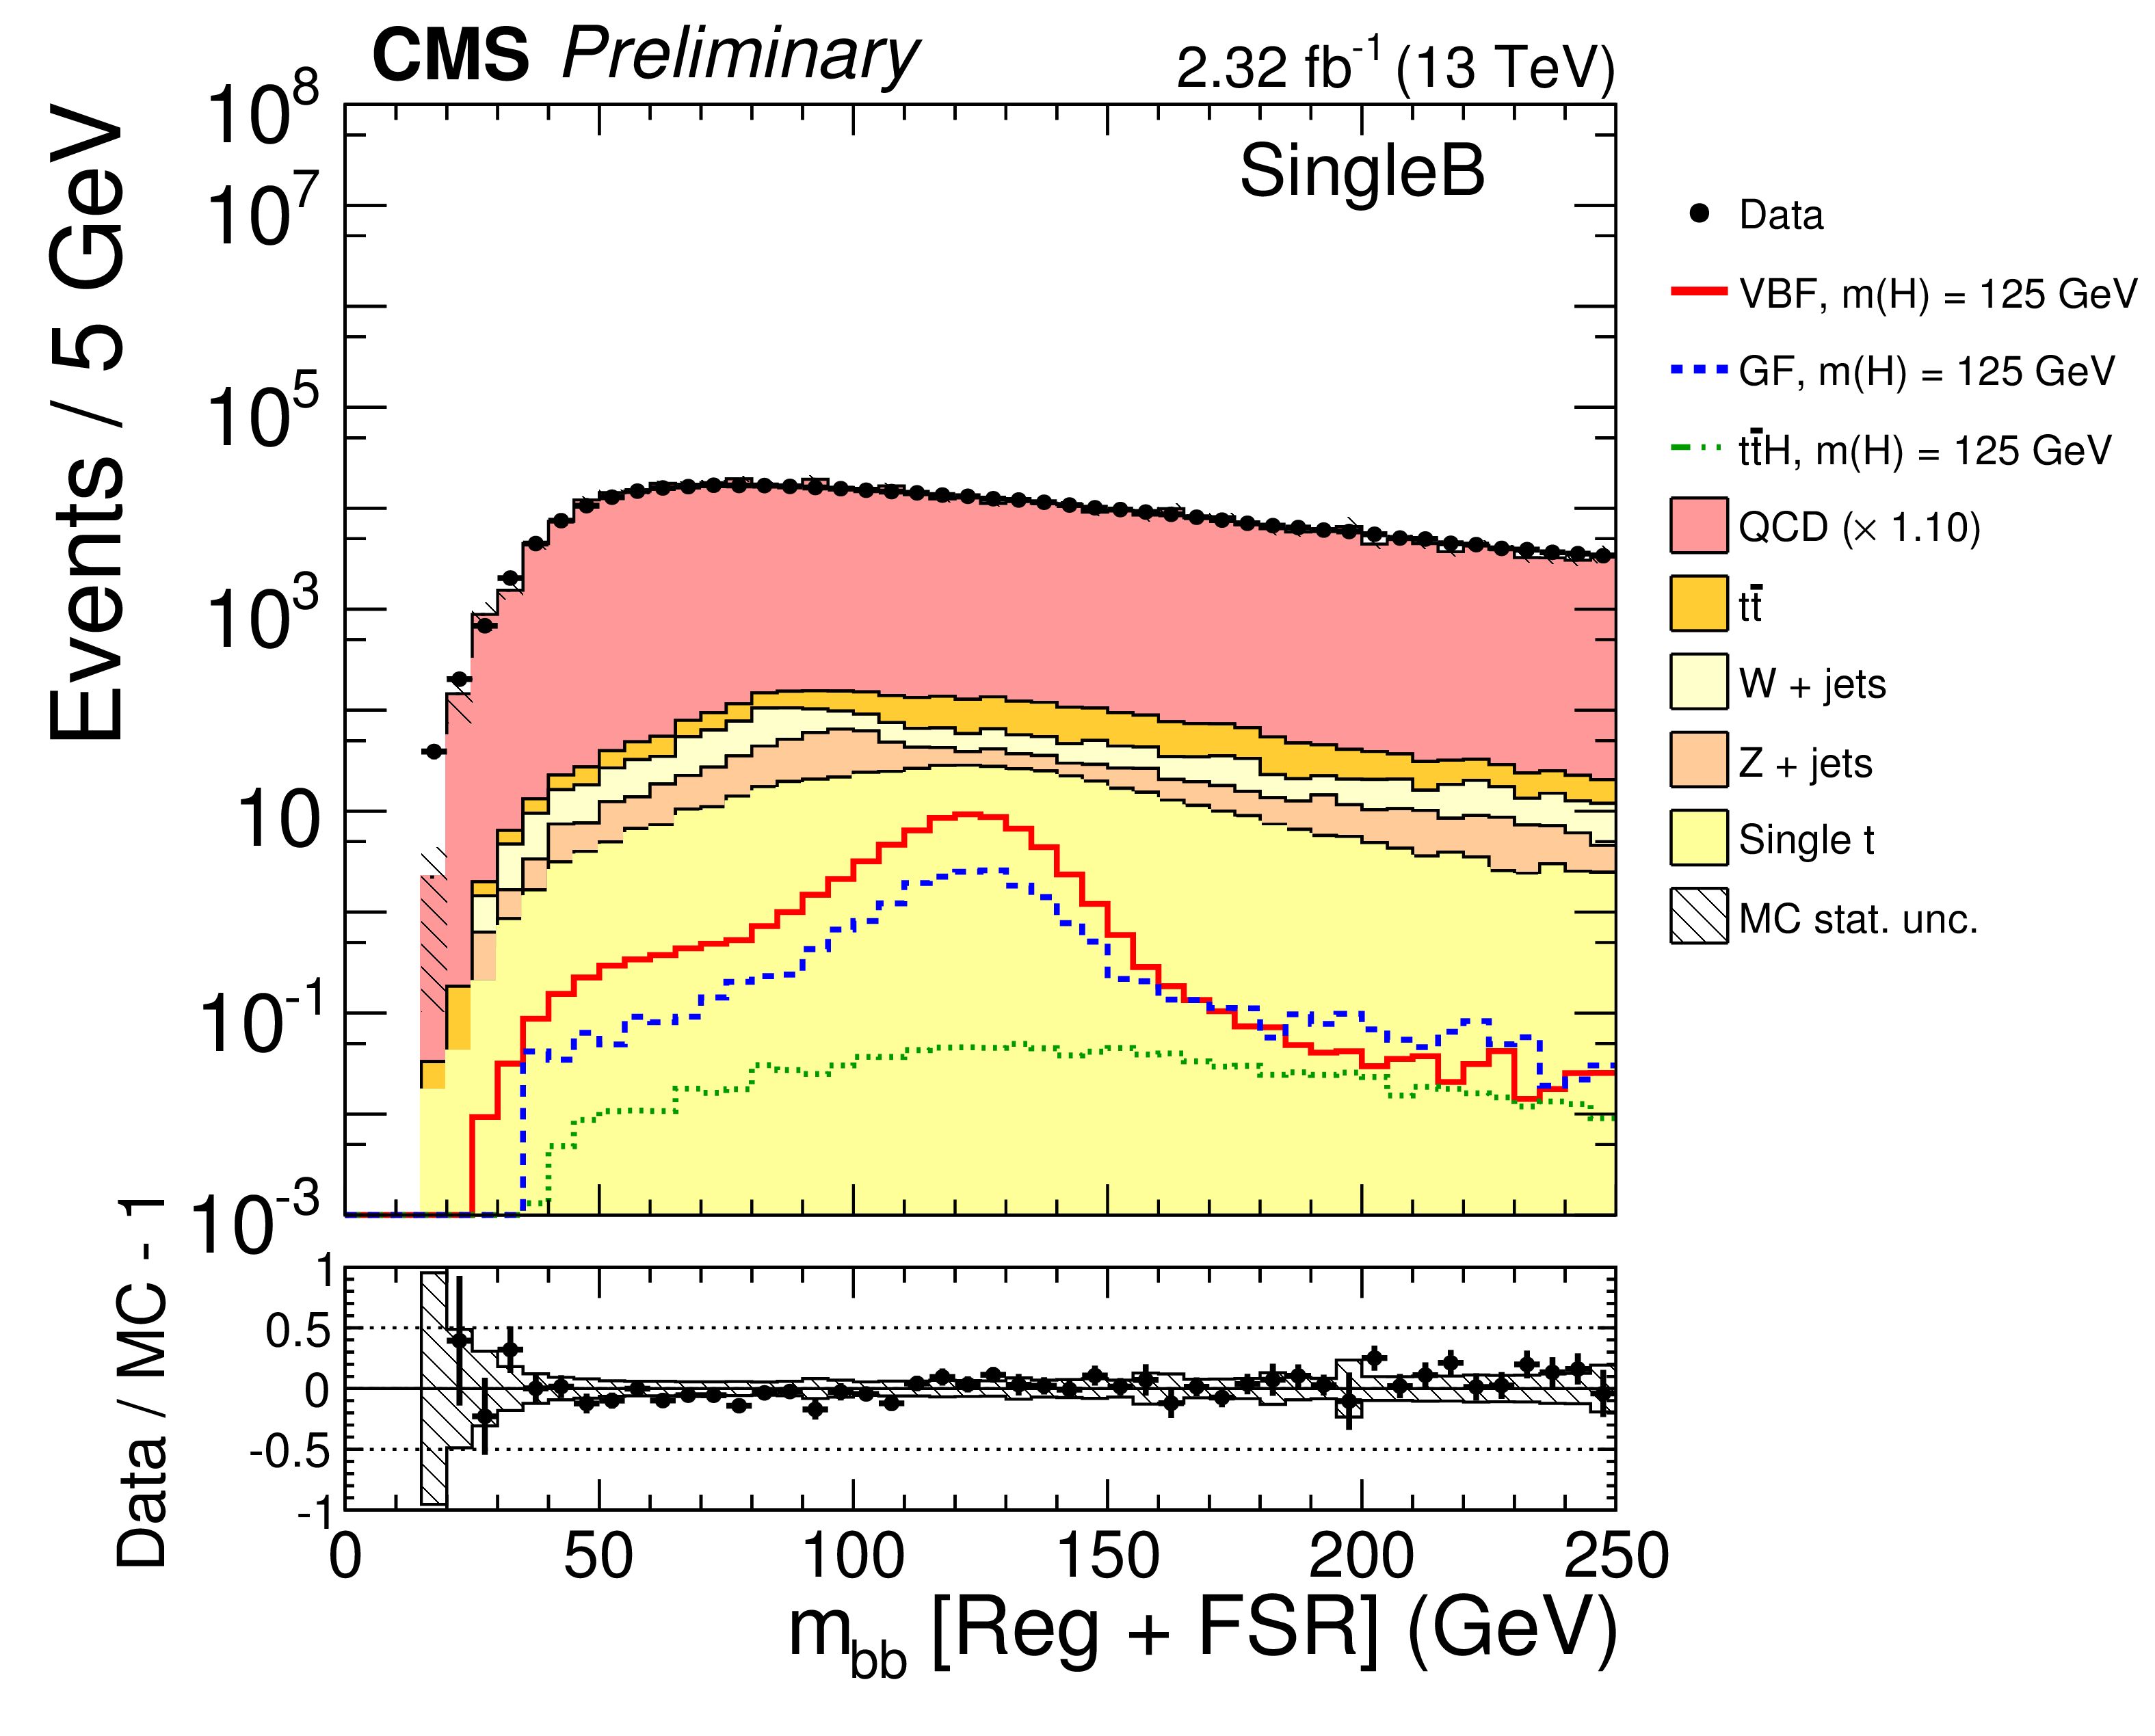
Figure 3-a:
Distribution in invariant mass of the two b-jet candidates, after the jet ${p_{\mathrm {T}}}$ regression, for events in the SingleB (left) and DoubleB (right) samples. Data are shown by the points, while the simulated backgrounds are stacked. The LO QCD cross section is scaled such that the total number of background events matches the number of events in the data for each category, with a resulting multiplicative factor of 1.10 and 1.01 for the SingleB and DoubleB samples respectively. The panel at the bottom shows the fractional difference between the data and the background simulation, with the shaded band representing the statistical uncertainties in the MC samples. |

png pdf |
Figure 3-b:
Distribution in invariant mass of the two b-jet candidates, after the jet ${p_{\mathrm {T}}}$ regression, for events in the SingleB (left) and DoubleB (right) samples. Data are shown by the points, while the simulated backgrounds are stacked. The LO QCD cross section is scaled such that the total number of background events matches the number of events in the data for each category, with a resulting multiplicative factor of 1.10 and 1.01 for the SingleB and DoubleB samples respectively. The panel at the bottom shows the fractional difference between the data and the background simulation, with the shaded band representing the statistical uncertainties in the MC samples. |

png pdf |
Figure 4-a:
Distribution of $\sigma _2$, the minor RMS for the ${p_{\mathrm {T}}}$-leading q-jet in the SingleB (left) and DoubleB (right) sample events. Data are shown by the points, while the simulated backgrounds are stacked. The LO QCD cross section is scaled such that the total number of background events matches the number of events in the data for each category, with a resulting multiplicative factor of 1.10 and 1.01 for the SingleB and DoubleB samples respectively. The panel at the bottom shows the fractional difference between the data and the background simulation, with the shaded band representing the statistical uncertainties in the MC samples. |

png pdf |
Figure 4-b:
Distribution of $\sigma _2$, the minor RMS for the ${p_{\mathrm {T}}}$-leading q-jet in the SingleB (left) and DoubleB (right) sample events. Data are shown by the points, while the simulated backgrounds are stacked. The LO QCD cross section is scaled such that the total number of background events matches the number of events in the data for each category, with a resulting multiplicative factor of 1.10 and 1.01 for the SingleB and DoubleB samples respectively. The panel at the bottom shows the fractional difference between the data and the background simulation, with the shaded band representing the statistical uncertainties in the MC samples. |

png pdf |
Figure 5-a:
Distribution of the soft TrackJet multiplicity $N_5^{\rm soft}$ with transverse momentum $ {p_{\mathrm {T}}} > $ 5 GeV in the SingleB (a) and DoubleB (b) sample events. Data are shown by the points, while the simulated backgrounds are stacked. The LO QCD cross section is scaled such that the total number of background events matches the number of events in the data for each category, with a resulting multiplicative factor of 1.10 and 1.01 for the SingleB and DoubleB samples respectively. The panel at the bottom shows the fractional difference between the data and the background simulation, with the shaded band representing the statistical uncertainties in the MC samples. |

png pdf |
Figure 5-b:
Distribution of the soft TrackJet multiplicity $N_5^{\rm soft}$ with transverse momentum $ {p_{\mathrm {T}}} > $ 5 GeV in the SingleB (a) and DoubleB (b) sample events. Data are shown by the points, while the simulated backgrounds are stacked. The LO QCD cross section is scaled such that the total number of background events matches the number of events in the data for each category, with a resulting multiplicative factor of 1.10 and 1.01 for the SingleB and DoubleB samples respectively. The panel at the bottom shows the fractional difference between the data and the background simulation, with the shaded band representing the statistical uncertainties in the MC samples. |

png pdf |
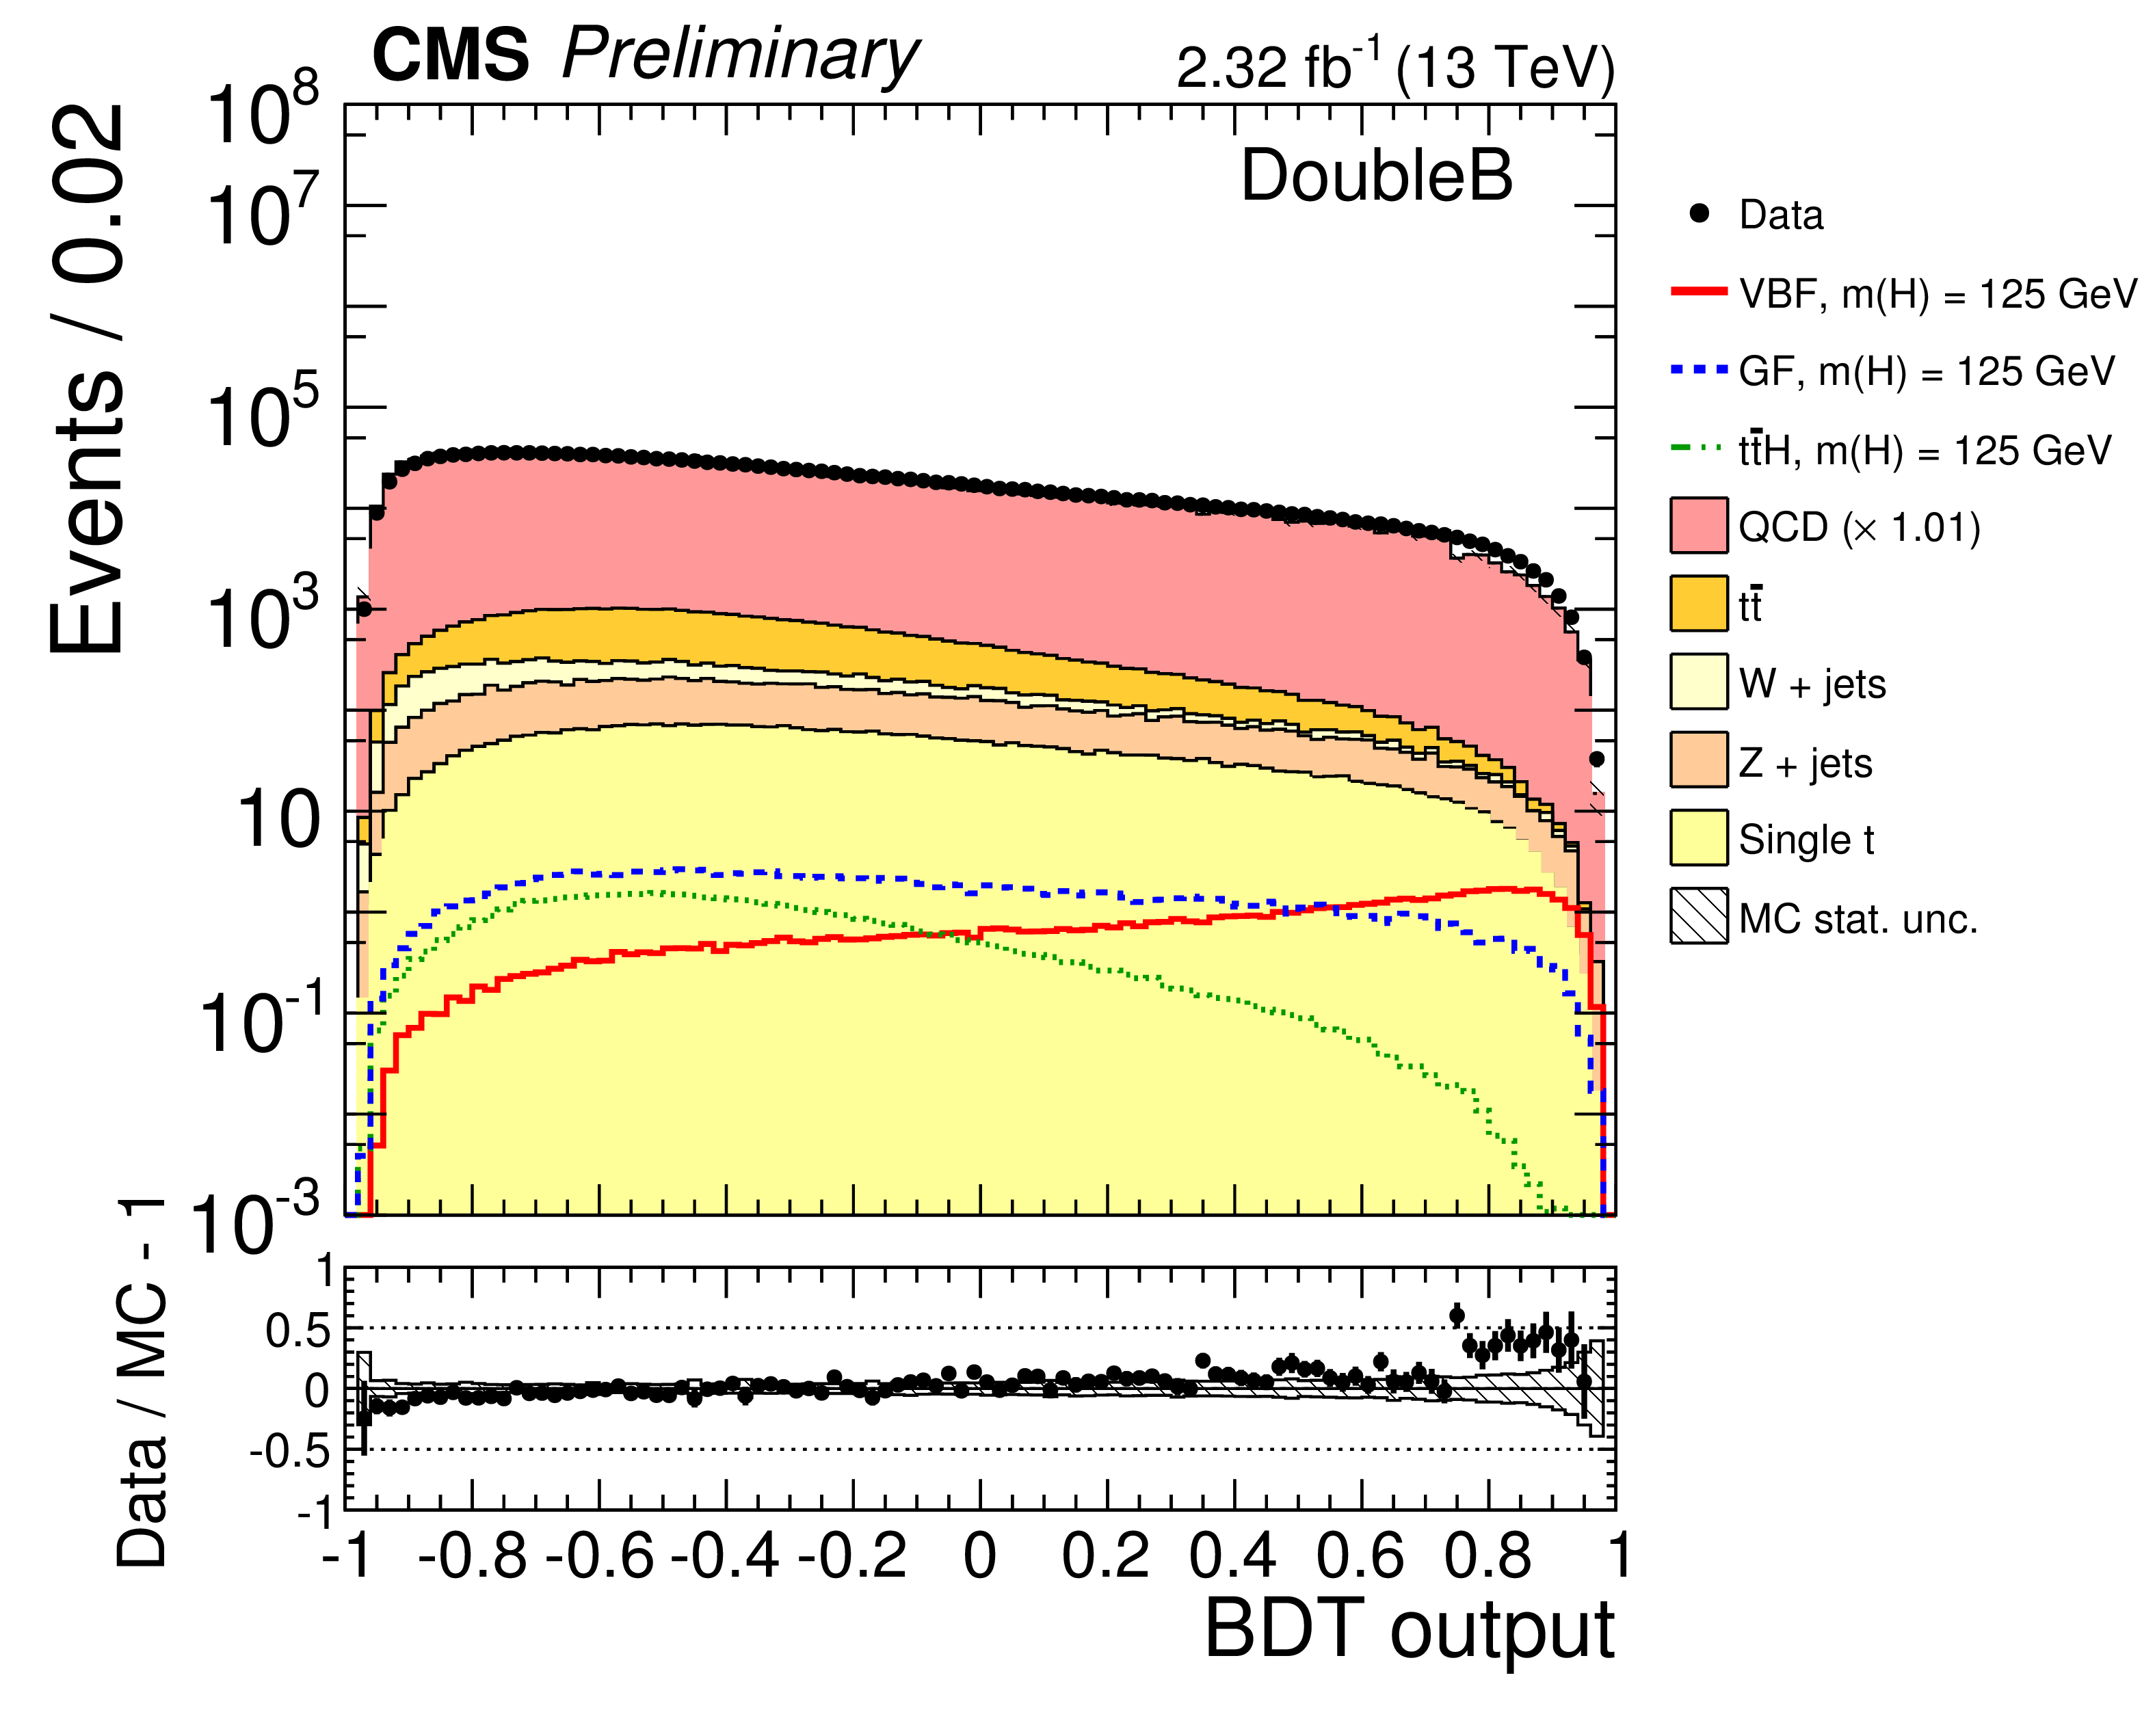
Figure 6-a:
Distribution of the BDT output for the events in the SingleB (a) and DoubleB (b) sets. Data are shown by the points, while the simulated backgrounds are stacked. The LO QCD cross sections are scaled such that the total number of background events equals the number of events in data. The panels at the bottom show the fractional difference between the data and the background simulation, with the shaded band representing the statistical uncertainties of the MC samples. |
png pdf |
Figure 6-b:
Distribution of the BDT output for the events in the SingleB (a) and DoubleB (b) sets. Data are shown by the points, while the simulated backgrounds are stacked. The LO QCD cross sections are scaled such that the total number of background events equals the number of events in data. The panels at the bottom show the fractional difference between the data and the background simulation, with the shaded band representing the statistical uncertainties of the MC samples. |

png pdf |
Figure 7-a:
Fit of the invariant mass of the two b-jet candidates for the Higgs boson signal ($m_{\mathrm{ H } }= $ 125 GeV) in the four event categories of SingleB in the background-only hypothesis. Data are shown with markers. The dashed line is the background component, and the dashed-dotted line is the QCD component alone. The bottom panel shows the background-subtracted distribution, and with the 1$\sigma $ and 2$\sigma $ background uncertainty bands. |

png pdf |
Figure 7-b:
Fit of the invariant mass of the two b-jet candidates for the Higgs boson signal ($m_{\mathrm{ H } }= $ 125 GeV) in the four event categories of SingleB in the background-only hypothesis. Data are shown with markers. The dashed line is the background component, and the dashed-dotted line is the QCD component alone. The bottom panel shows the background-subtracted distribution, and with the 1$\sigma $ and 2$\sigma $ background uncertainty bands. |

png pdf |
Figure 7-c:
Fit of the invariant mass of the two b-jet candidates for the Higgs boson signal ($m_{\mathrm{ H } }= $ 125 GeV) in the four event categories of SingleB in the background-only hypothesis. Data are shown with markers. The dashed line is the background component, and the dashed-dotted line is the QCD component alone. The bottom panel shows the background-subtracted distribution, and with the 1$\sigma $ and 2$\sigma $ background uncertainty bands. |

png pdf |
Figure 7-d:
Fit of the invariant mass of the two b-jet candidates for the Higgs boson signal ($m_{\mathrm{ H } }= $ 125 GeV) in the four event categories of SingleB in the background-only hypothesis. Data are shown with markers. The dashed line is the background component, and the dashed-dotted line is the QCD component alone. The bottom panel shows the background-subtracted distribution, and with the 1$\sigma $ and 2$\sigma $ background uncertainty bands. |

png pdf |
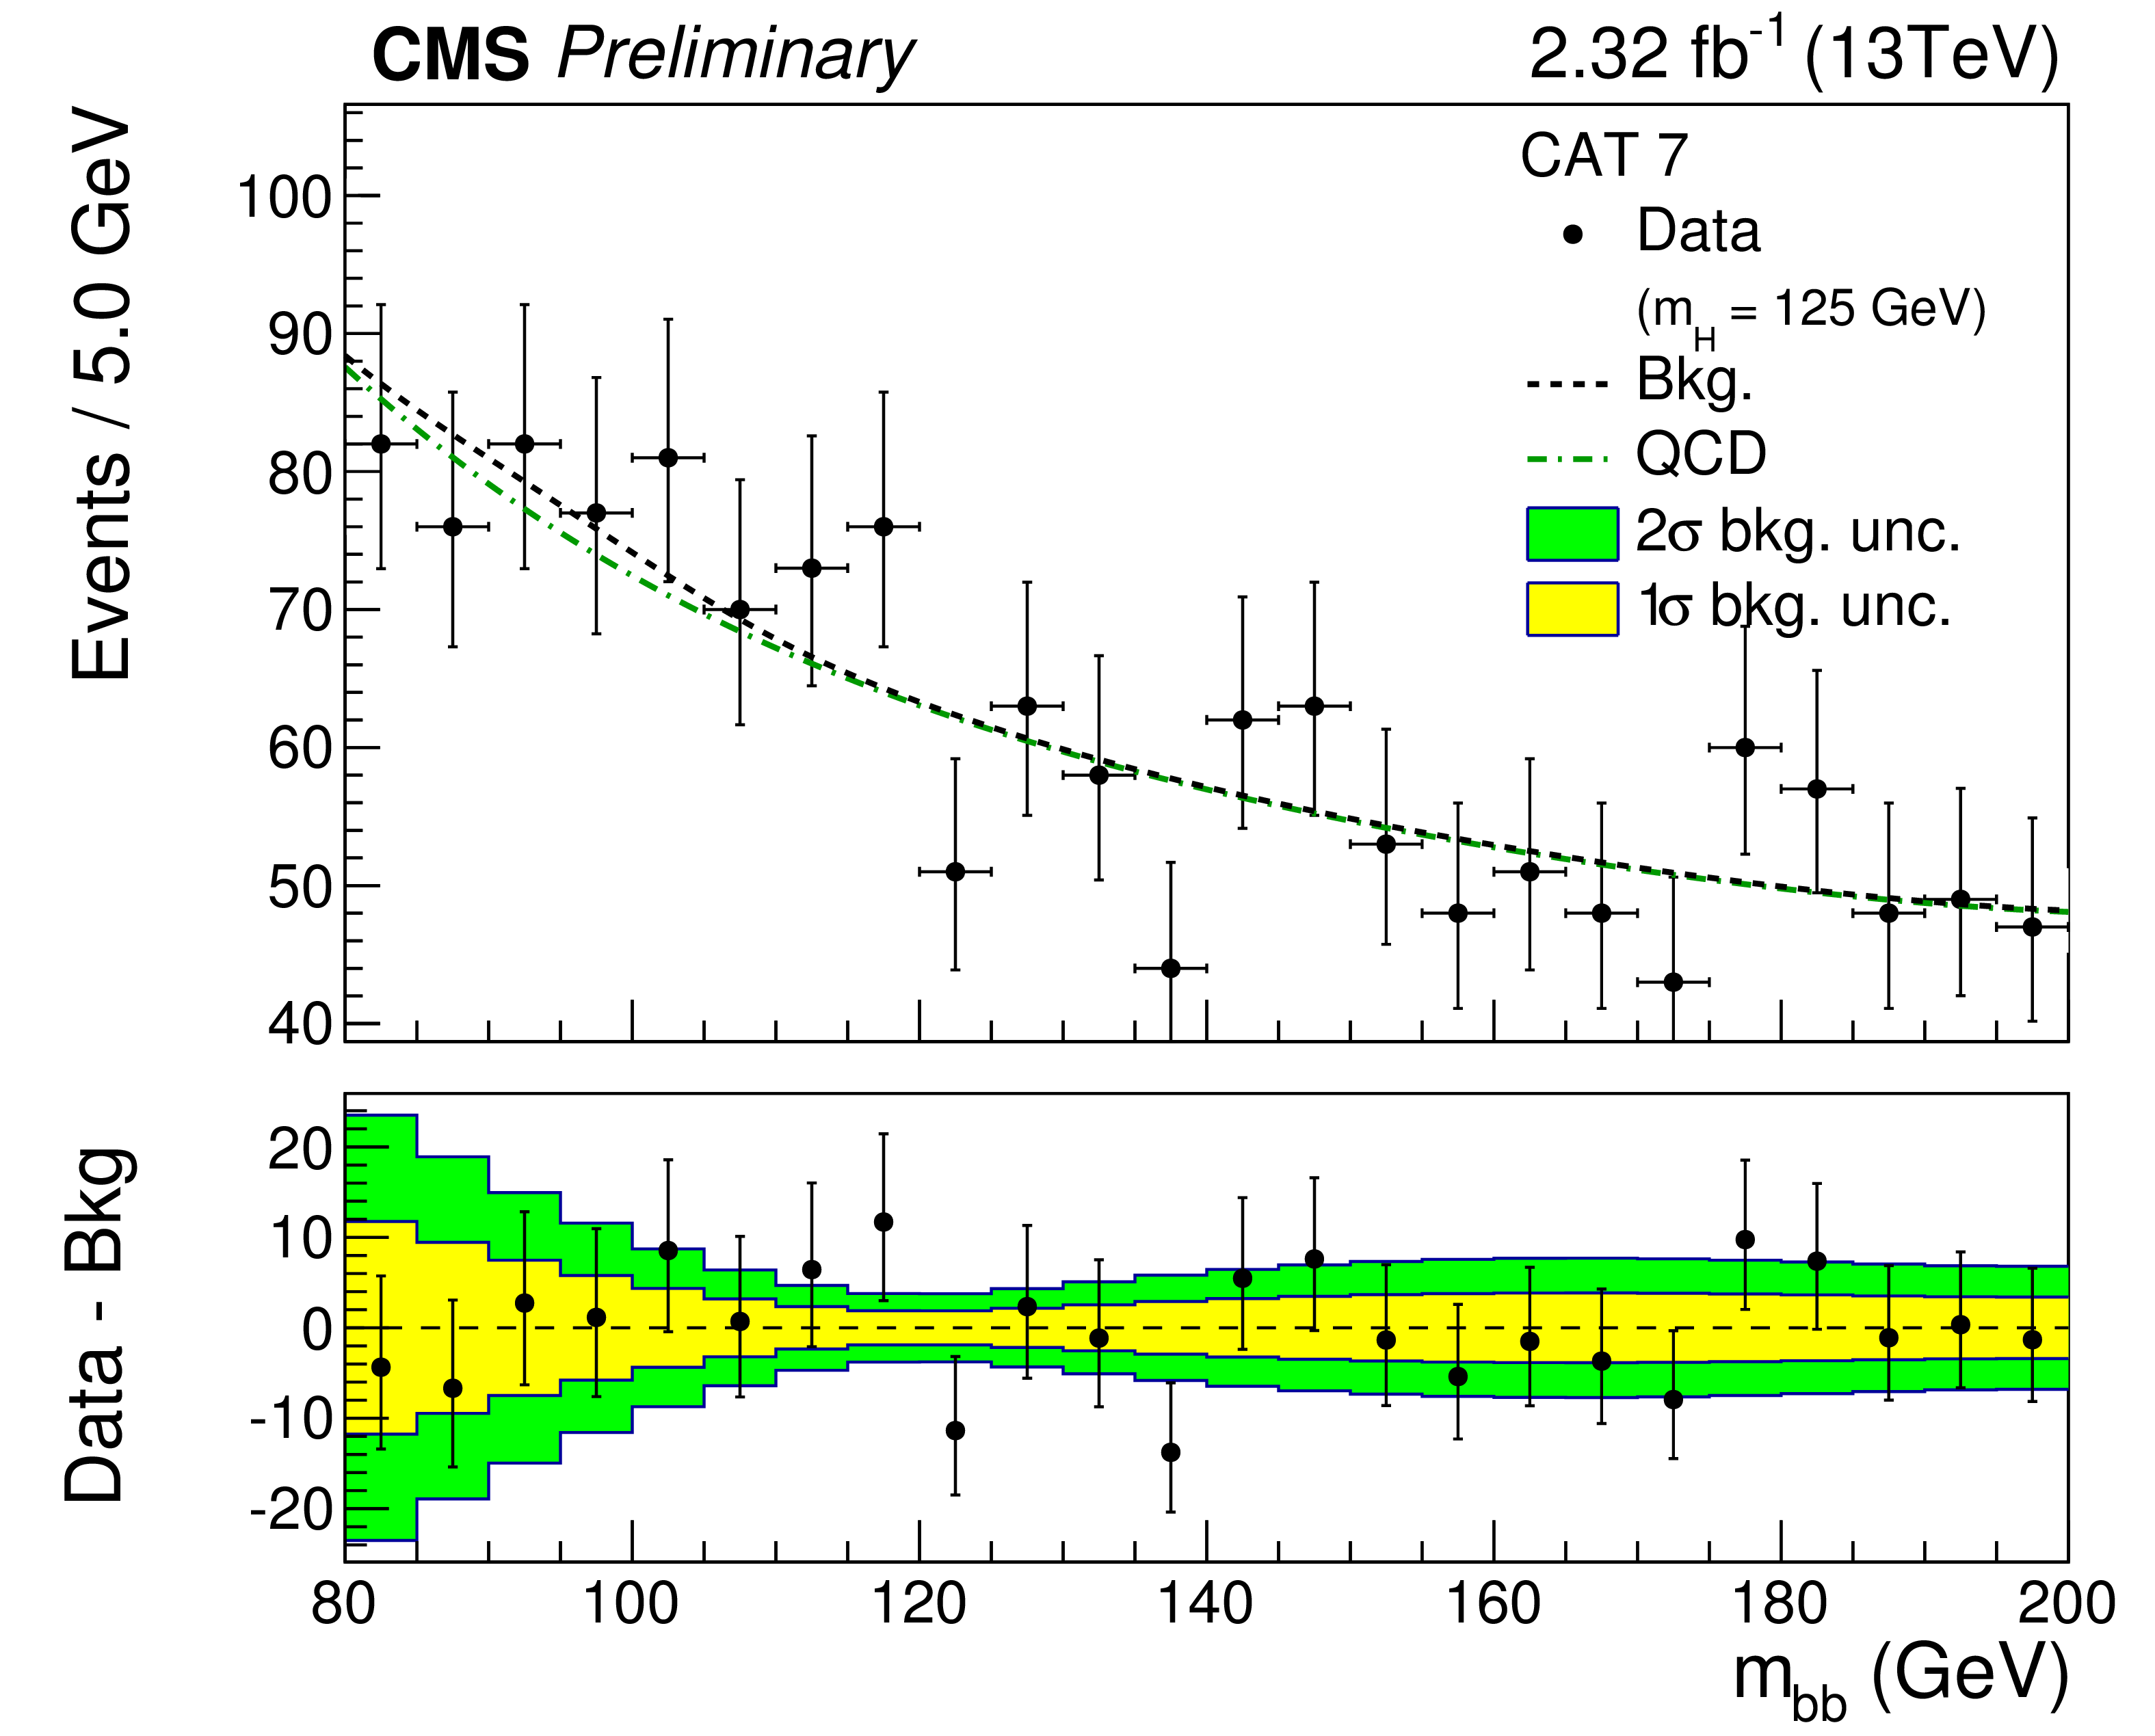
Figure 8-a:
Fit of the invariant mass of the two b-jet candidates for the Higgs boson signal ($m_{\mathrm{ H } }= $ 125 GeV) in the three event categories of DoubleB in the background-only hypothesis. Data are shown with markers. The dashed line is the background component, and the dashed-dotted line is the QCD component alone. The bottom panel shows the background-subtracted distribution, and with the 1$\sigma $ and 2$\sigma $ background uncertainty bands. |

png pdf |
Figure 8-b:
Fit of the invariant mass of the two b-jet candidates for the Higgs boson signal ($m_{\mathrm{ H } }= $ 125 GeV) in the three event categories of DoubleB in the background-only hypothesis. Data are shown with markers. The dashed line is the background component, and the dashed-dotted line is the QCD component alone. The bottom panel shows the background-subtracted distribution, and with the 1$\sigma $ and 2$\sigma $ background uncertainty bands. |
png pdf |
Figure 8-c:
Fit of the invariant mass of the two b-jet candidates for the Higgs boson signal ($m_{\mathrm{ H } }= $ 125 GeV) in the three event categories of DoubleB in the background-only hypothesis. Data are shown with markers. The dashed line is the background component, and the dashed-dotted line is the QCD component alone. The bottom panel shows the background-subtracted distribution, and with the 1$\sigma $ and 2$\sigma $ background uncertainty bands. |

png pdf |
Figure 9:
Observed and SM-expected likelihood profile of the signal strength $\mu =\sigma /\sigma _\mathrm {SM}$ with $m_{\mathrm{ H } }= $ 125 GeV, using Run 1 8TeV data, Run 2 13TeV data, and for the combination of 8 TeV and 13 TeV data. |
| Tables | |

png pdf |
Table 1:
Summary of selection requirements for the two analyses. |
png pdf |
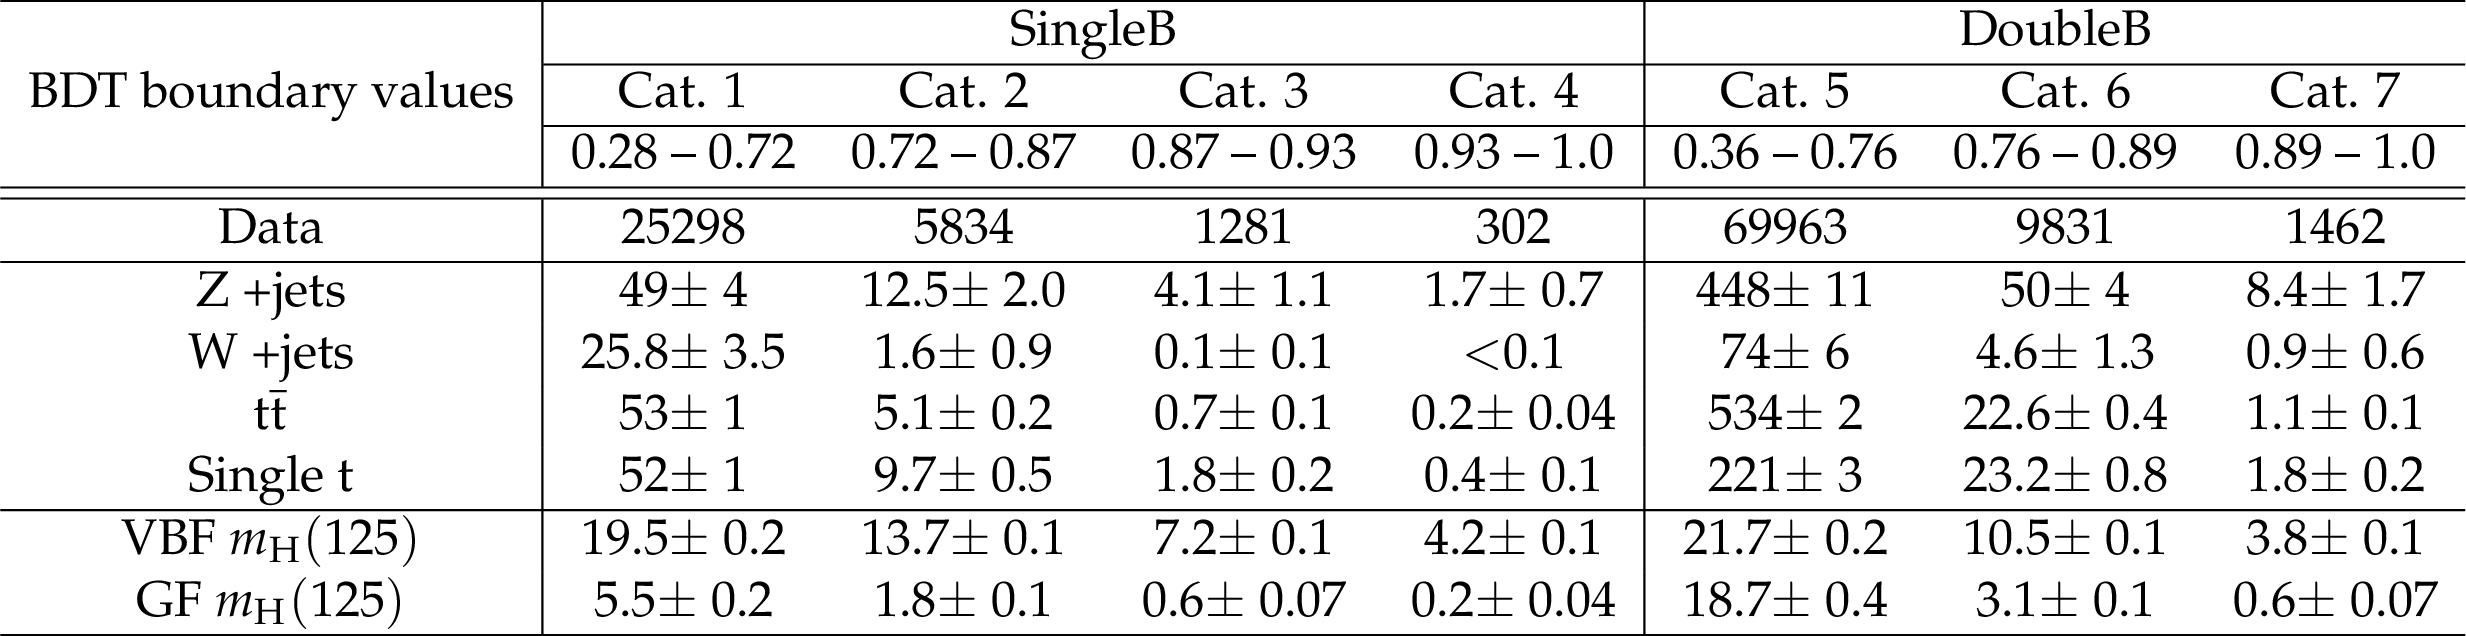
Table 2:
Definition of the event categories and corresponding yields in the $m_{\mathrm{ b } \mathrm{ b } }$ interval [80,200] GeV, for the data and the MC expectation, with statistical uncertainties only. The BDT output boundary values refer to the distributions shown in Fig. 6. |

png pdf |
Table 3:
Sources of systematic uncertainty and their impact on the shape and normalization of the background and signal processes. |
| Summary |
|
A search has been carried out for the SM Higgs boson produced in vector boson fusion and decaying to $\mathrm{ b \bar{b} }$ with a data sample of pp collisions at $\sqrt{s}= $ 13 TeV collected with the CMS detector at the LHC corresponding to an integrated luminosity of 2.3 fb$^{-1}$. Upper limits, at the 95% confidence level, on the production cross section times the $\mathrm{ H }\to\mathrm{ b \bar{b} }$ branching fraction, relative to expectations for a SM Higgs boson, are extracted for a Higgs boson with mass 125 GeV. The expected upper limits in the absence of a signal is 5.0 times the SM prediction, while the observed upper limit is 3.0, and the fitted signal strength is $\mu=\sigma/\sigma_\mathrm{SM}=-3.7^{+2.4}_{-2.5}$. The combination of the results obtained in this search with the similar CMS search with Run 1 data yields an observed (expected) upper limit of 3.4 (2.3) times the SM prediction. The combined fitted $\mathrm{ H }\to\mathrm{ b \bar{b} }$ signal strength is $\mu=1.3^{+1.2}_{-1.1}$, with a signal significance of 1.2 standard deviations for $m_{\mathrm{ H }}= $ 125 GeV. |
| References | ||||
| 1 | A. Salam and J. C. Ward | On a Gauge Theory of Elementary Interactions | Nuovo Cim. 19 (1961) 165--170 | |
| 2 | S. Glashow | Partial Symmetries of Weak Interactions | Nucl.Phys. 22 (1961) 579--588 | |
| 3 | S. Weinberg | A Model of Leptons | Phys.Rev.Lett. 19 (1967) 1264--1266 | |
| 4 | F. Englert and R. Brout | Broken Symmetry and the Mass of Gauge Vector Mesons | PRL 13 (1964) 321--323 | |
| 5 | P. W. Higgs | Broken Symmetries and the Masses of Gauge Bosons | PRL 13 (1964) 508--509 | |
| 6 | G. S. Guralnik, C. R. Hagen, and T. W. B. Kibble | Global Conservation Laws and Massless Particless | PRL 13 (1964) 585--587 | |
| 7 | CMS Collaboration | Observation of a new boson at a mass of 125 GeV with the CMS experiment at the LHC | PLB716 (2012) 30--61 | CMS-HIG-12-028 1207.7235 |
| 8 | ATLAS Collaboration | Observation of a new particle in the search for the Standard Model Higgs boson with the ATLAS detector at the LHC | PLB716 (2012) 1--29 | 1207.7214 |
| 9 | ATLAS and CMS Collaboration | Combined Measurement of the Higgs Boson Mass in $ pp $ Collisions at $ \sqrt{s}=7 $ and 8 TeV with the ATLAS and CMS Experiments | PRL 114 (2015) 191803 | 1503.07589 |
| 10 | ATLAS and CMS Collaborations | Measurements of the Higgs boson production and decay rates and constraints on its couplings from a combined ATLAS and CMS analysis of the LHC pp collision data at $ \sqrt{s} $ = 7 and 8 TeV | ||
| 11 | LHC Higgs Cross Section Working Group et al. | Handbook of LHC Higgs Cross Sections: 2. Differential Distributions | CERN-2012-002 (CERN, Geneva, 2012) | 1201.3084 |
| 12 | LHC Higgs Cross Section Working Group et al. | Handbook of LHC Higgs Cross Sections: 4. Deciphering the nature of the Higgs sector | in preparation | |
| 13 | CMS Collaboration | Search for the standard model Higgs boson produced through vector boson fusion and decaying to $ b \overline{b} $ | PRD92 (2015), no. 3, 032008 | CMS-HIG-14-004 1506.01010 |
| 14 | CMS Collaboration | Search for the standard model Higgs boson produced in association with $ W $ or $ Z $ bosons and decaying to bottom quarks | PRD 89 (2014) 012003 | CMS-HIG-13-012 1310.3687 |
| 15 | CMS Collaboration | Search for the standard model Higgs boson produced in association with a top-quark pair in pp collisions at the LHC | JHEP 05 (2013) 145 | CMS-HIG-12-035 1303.0763 |
| 16 | CMS Collaboration | Search for the associated production of the Higgs boson with a top-quark pair | JHEP 09 (2014) 087, , [Erratum: JHEP10,106(2014)] | CMS-HIG-13-029 1408.1682 |
| 17 | CMS Collaboration | The CMS experiment at the CERN LHC | JINST 3 (2008) S08004 | CMS-00-001 |
| 18 | NNPDF Collaboration | Parton distributions for the LHC Run II | JHEP 04 (2015) 040 | 1410.8849 |
| 19 | P. Nason | A New method for combining NLO QCD with shower Monte Carlo algorithms | JHEP 11 (2004) 040 | hep-ph/0409146 |
| 20 | S. Frixione, P. Nason, and C. Oleari | Matching NLO QCD computations with Parton Shower simulations: the POWHEG method | JHEP 11 (2007) 070 | 0709.2092 |
| 21 | S. Alioli, P. Nason, C. Oleari, and E. Re | A general framework for implementing NLO calculations in shower Monte Carlo programs: the POWHEG BOX | JHEP 06 (2010) 043 | 1002.2581 |
| 22 | T. Sj\"ostrand, S. Mrenna, and P. Skands | A brief introduction to PYTHIA 8.1 | CPC 178 (2008) 852 | 0710.3820 |
| 23 | T. Sj\"ostrand et al. | An Introduction to PYTHIA 8.2 | CPC 191 (2015) 159--177 | 1410.3012 |
| 24 | CMS Collaboration | Event generator tunes obtained from underlying event and multiparton scattering measurements | CMS-GEN-14-001 1512.00815 |
|
| 25 | J. Alwall et al. | The automated computation of tree-level and next-to-leading order differential cross sections, and their matching to parton shower simulations | JHEP 07 (2014) 079 | 1405.0301 |
| 26 | S. Alioli, P. Nason, C. Oleari, and E. Re | NLO single-top production matched with shower in POWHEG: s- and t-channel contributions | JHEP 09 (2009) 111, , [Erratum: JHEP02,011(2010)] | 0907.4076 |
| 27 | E. Re | Single-top Wt-channel production matched with parton showers using the POWHEG method | EPJC71 (2011) 1547 | 1009.2450 |
| 28 | R. Gavin, Y. Li, F. Petriello, and S. Quackenbush | FEWZ 2.0: A code for hadronic Z production at next-to-next-to-leading order | CPC 182 (2011) 2388 | 1011.3540 |
| 29 | Y. Li and F. Petriello | Combining QCD and electroweak corrections to dilepton production in the framework of the FEWZ simulation code | PRD 86 (2012) 094034 | 1208.5967 |
| 30 | R. Gavin, Y. Li, F. Petriello, and S. Quackenbush | W physics at the LHC with FEWZ 2.1 | CPC 184 (2013) 208 | 1201.5896 |
| 31 | M. Czakon, P. Fiedler, and A. Mitov | Total Top-Quark Pair-Production Cross Section at Hadron Colliders Through O($ \alpha_S^4 $) | PRL 110 (2013) 252004 | 1303.6254 |
| 32 | N. Kidonakis | Differential and total cross sections for top pair and single top production | 1205.3453 | |
| 33 | CMS Collaboration | Identification of b-quark jets with the CMS experiment | JINST 8 (2013) P04013 | CMS-BTV-12-001 1211.4462 |
| 34 | CMS Collaboration Collaboration | Identification of b quark jets at the CMS Experiment in the LHC Run 2 | Technical Report CMS-PAS-BTV-15-001, CERN, Geneva | |
| 35 | CMS Collaboration | Particle--flow event reconstruction in CMS and performance for jets, taus, and $ E_{\mathrm{T}}^{\text{miss}} $ | CDS | |
| 36 | CMS Collaboration | Commissioning of the Particle-flow Event Reconstruction with the first LHC collisions recorded in the CMS detector | CDS | |
| 37 | CMS Collaboration | Commissioning of the particle-flow reconstruction in minimum-bias and jet events from $ \mathrm{ p }\mathrm{ p } $ collisions at 7 TeV | CDS | |
| 38 | M. Cacciari and G. P. Salam | Dispelling the $ N^{3} $ myth for the $ k_{t} $ jet-finder | PLB 641 (2006) 57 | hep-ph/0512210 |
| 39 | M. Cacciari, G. P. Salam, and G. Soyez | The anti-$ k_{t} $ jet clustering algorithm | JHEP 04 (2008) 063 | 0802.1189 |
| 40 | CMS Collaboration | Determination of Jet Energy Calibration and Transverse Momentum Resolution in CMS | JINST 6 (2011) P11002 | CMS-JME-10-011 1107.4277 |
| 41 | CMS Collaboration | Pileup jet identification | CMS-PAS-JME-13-005 | CMS-PAS-JME-13-005 |
| 42 | H. Voss, A. H\"ocker, J. Stelzer, and F. Tegenfeldt | TMVA, the Toolkit for Multivariate Data Analysis with ROOT | in XIth International Workshop on Advanced Computing and Analysis Techniques in Physics Research (ACAT), p. 40 2007 | physics/0703039 |
| 43 | CMS Collaboration | Measurement of the hadronic activity in events with a Z and two jets and extraction of the cross section for the electroweak production of a Z with two jets in pp collisions at $ \sqrt{s} $ = 7 TeV | JHEP 10 (2013) 062 | CMS-FSQ-12-019 1305.7389 |
| 44 | CMS Collaboration | Measurement of electroweak production of two jets in association with a Z boson in proton-proton collisions at $ \sqrt{s}=8\,\text {TeV} $ | EPJC75 (2015), no. 2, 66 | CMS-FSQ-12-035 1410.3153 |
| 45 | CMS Collaboration | Performance of quark/gluon discrimination in 8 TeV pp data | CMS-PAS-JME-13-002 | CMS-PAS-JME-13-002 |
| 46 | CMS Collaboration | Description and performance of track and primary-vertex reconstruction with the CMS tracker | JINST 9 (2014), no. 10, P10009 | CMS-TRK-11-001 1405.6569 |
| 47 | CMS Collaboration | Commissioning of trackjets in pp collisions at $ \sqrt{s} $=7 TeV | CDS | |
| 48 | CMS Collaboration | Performance of jet reconstruction with charged tracks only | CDS | |
| 49 | LHC Higgs Cross Section Working Group et al. | Handbook of LHC Higgs Cross Sections: 3. Higgs Properties | CERN-2013-004 (CERN, Geneva, 2013) | 1307.1347 |
| 50 | P. Richardson and A. Wilcock | Monte Carlo Simulation of Hard Radiation in Decays in Beyond the Standard Model Physics in Herwig++ | EPJC74 (2014) 2713 | 1303.4563 |
| 51 | J. Bellm et al. | Herwig++ 2.7 Release Note | 1310.6877 | |
| 52 | CMS Collaboration | CMS Luminosity Measurement for the 2015 Data Taking Period | CMS-PAS-LUM-15-001 | CMS-PAS-LUM-15-001 |
| 53 | T. Junk | Confidence level computation for combining searches with small statistics | NIMA434 (1999) 435--443 | hep-ex/9902006 |
| 54 | A. L. Read | Presentation of search results: The CL(s) technique | JPG28 (2002) 2693--2704, .[,11(2002)] | |
| 55 | G. Cowan, K. Cranmer, E. Gross, and O. Vitells | Asymptotic formulae for likelihood-based tests of new physics | EPJC71 (2011) 1554, , [Erratum: Eur. Phys. J.C73,2501(2013)] | 1007.1727 |
|
|
Compact Muon Solenoid LHC, CERN |
|

|

|

|

|

|