

Compact Muon Solenoid
LHC, CERN
| CMS-PAS-SMP-16-005 | ||
| Measurement of the differential cross section for the production of a W ($\rightarrow \mu\nu$) boson in association with jets at $\sqrt{s} = $ 13 TeV | ||
| CMS Collaboration | ||
| August 2016 | ||
| Abstract: A measurement of the differential cross sections for a W ($\rightarrow \mu\nu$) boson produced in association with jets is presented. The measurement is based on the 13 TeV proton-proton collisions data corresponding to an integrated luminosity of 2.5 fb$^{-1}$ recorded by the CMS detector at the CERN LHC. The cross sections are reported as a function of jet multiplicity, the jet transverse momenta, the jet rapidity, and the scalar sum of the jet transverse momenta for different jet multiplicities. The measured cross sections are compared with the predictions that include multileg leading order and next-to-leading order matrix element calculations interfaced with parton showers and a next-to-next-to-leading order calculation for W+1 jet. | ||
|
Links:
CDS record (PDF) ;
inSPIRE record ;
CADI line (restricted) ;
These preliminary results are superseded in this paper, PRD 96 (2017) 072005. The superseded preliminary plots can be found here. |
||
| Figures | |

png pdf |
Figure 1-a:
Data to simulation comparison of exclusive jet multiplicity before (a) and after (b) the application of the b tag veto. The diboson samples (WW, WZ, and ZZ) are represented by VV. The error bars on the ratio panel represent the statistical uncertainty of the data and simulated signal sample. |

png pdf |
Figure 1-b:
Data to simulation comparison of exclusive jet multiplicity before (a) and after (b) the application of the b tag veto. The diboson samples (WW, WZ, and ZZ) are represented by VV. The error bars on the ratio panel represent the statistical uncertainty of the data and simulated signal sample. |
png pdf |
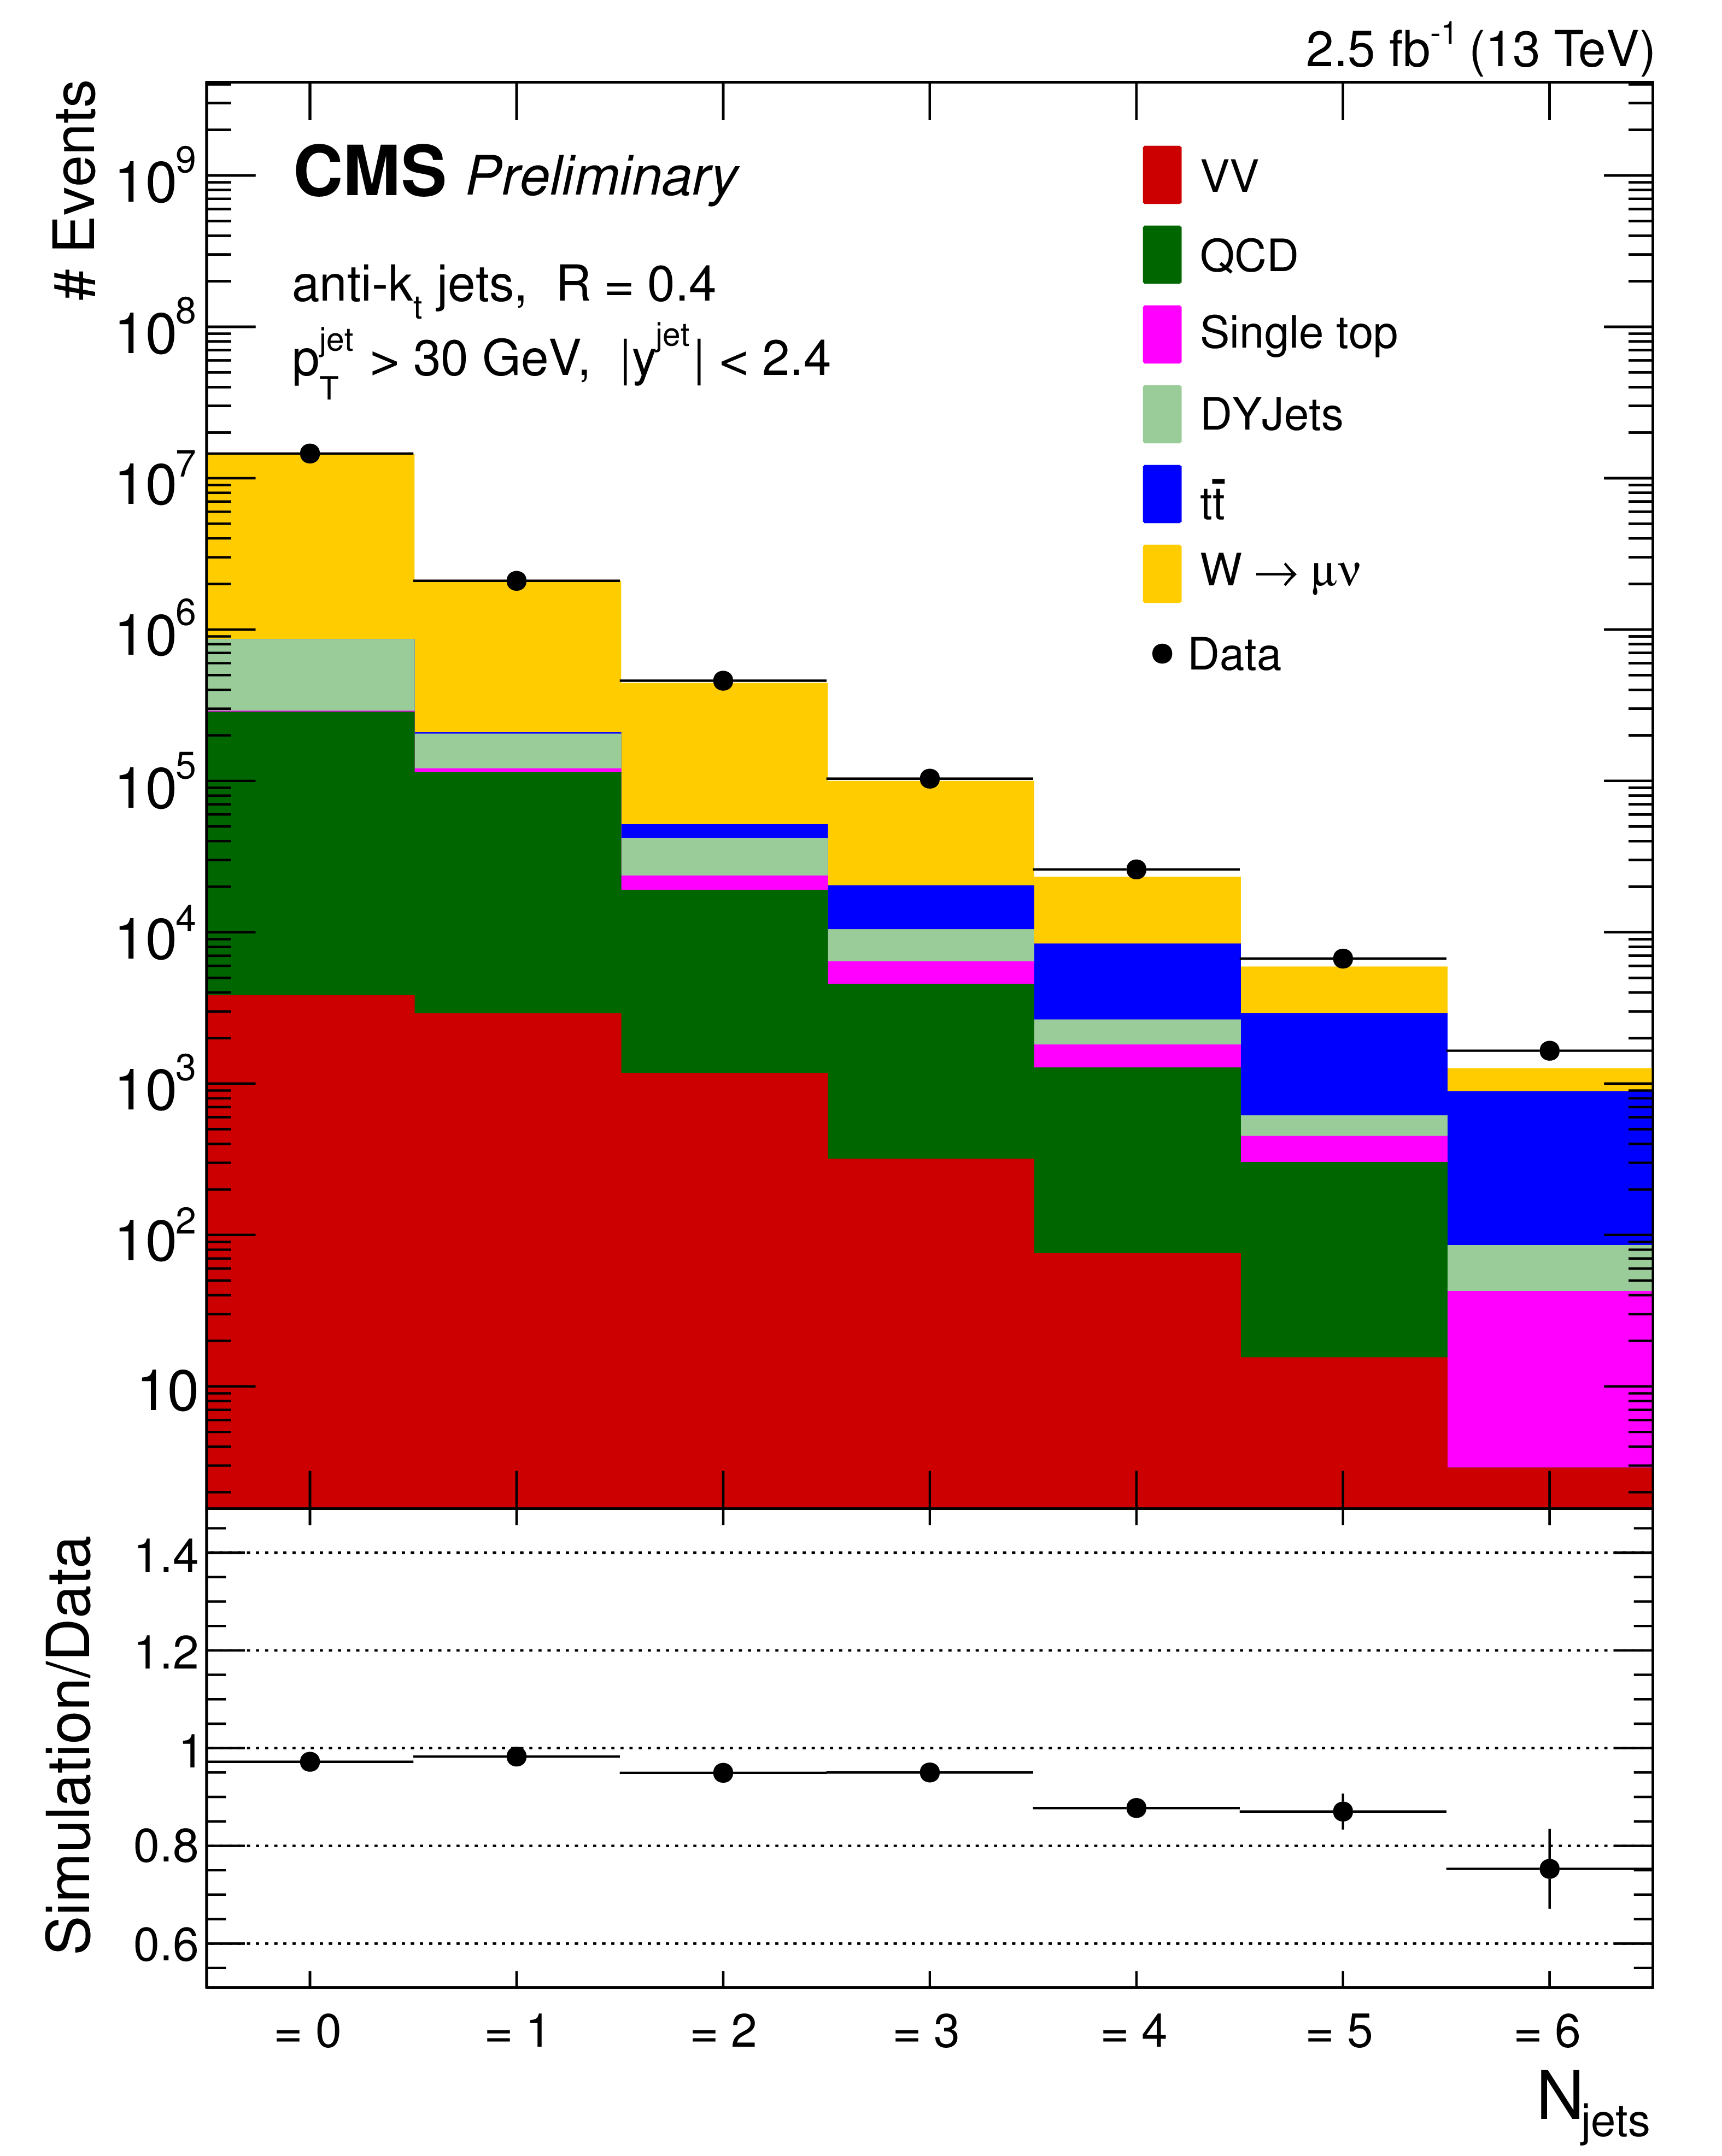
Figure 2-a:
Data to simulation comparison of exclusive (a) and inclusive (b) jet multiplicity. QCD background is estimated using a data-driven method. The diboson samples (WW, WZ, and ZZ) are represented by VV. The error bars on the ratio panel represent the statistical uncertainty of the data and simulated signal sample. |

png pdf |
Figure 2-b:
Data to simulation comparison of exclusive (a) and inclusive (b) jet multiplicity. QCD background is estimated using a data-driven method. The diboson samples (WW, WZ, and ZZ) are represented by VV. The error bars on the ratio panel represent the statistical uncertainty of the data and simulated signal sample. |
png pdf |
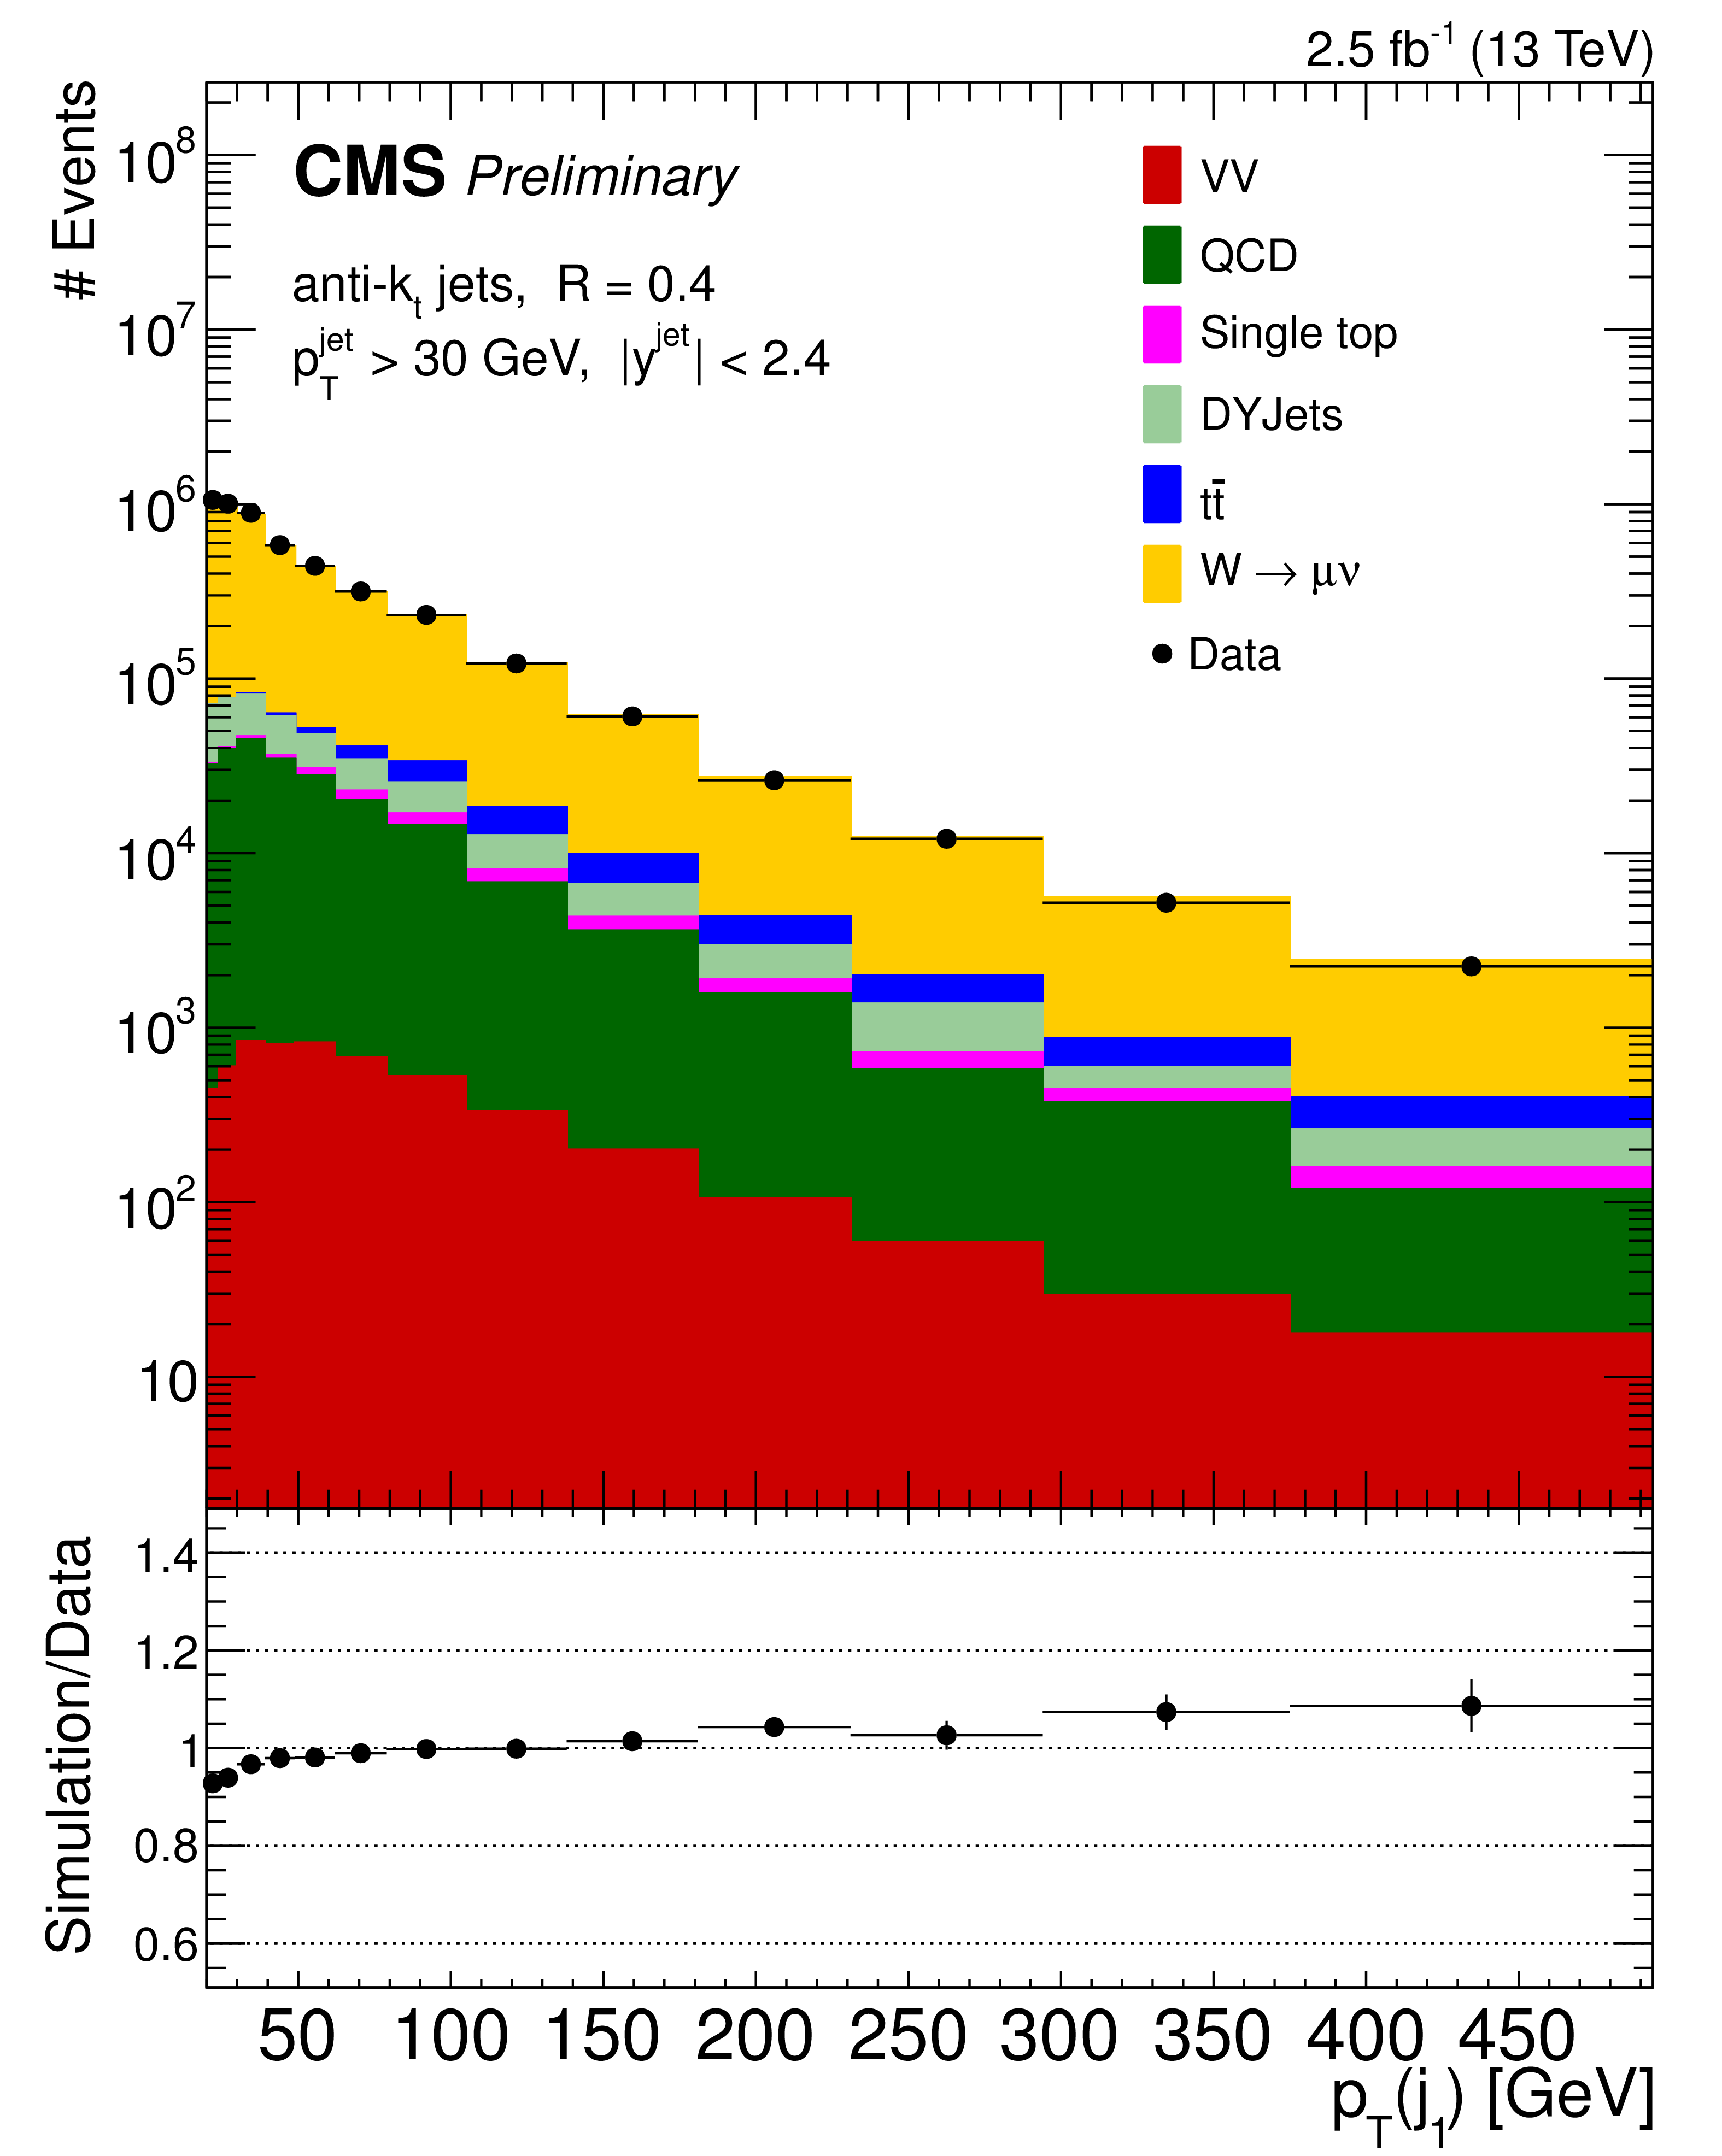
Figure 3-a:
Data to simulation comparison of $1^{st}$ (a) and $2^{nd}$ (b) jet $ {p_{\mathrm {T}}} $. QCD background is estimated using a data-driven method. The diboson samples (WW, WZ, and ZZ) are represented by VV. The error bars on the ratio panel represent the statistical uncertainty of the data and simulated signal sample. |
png pdf |
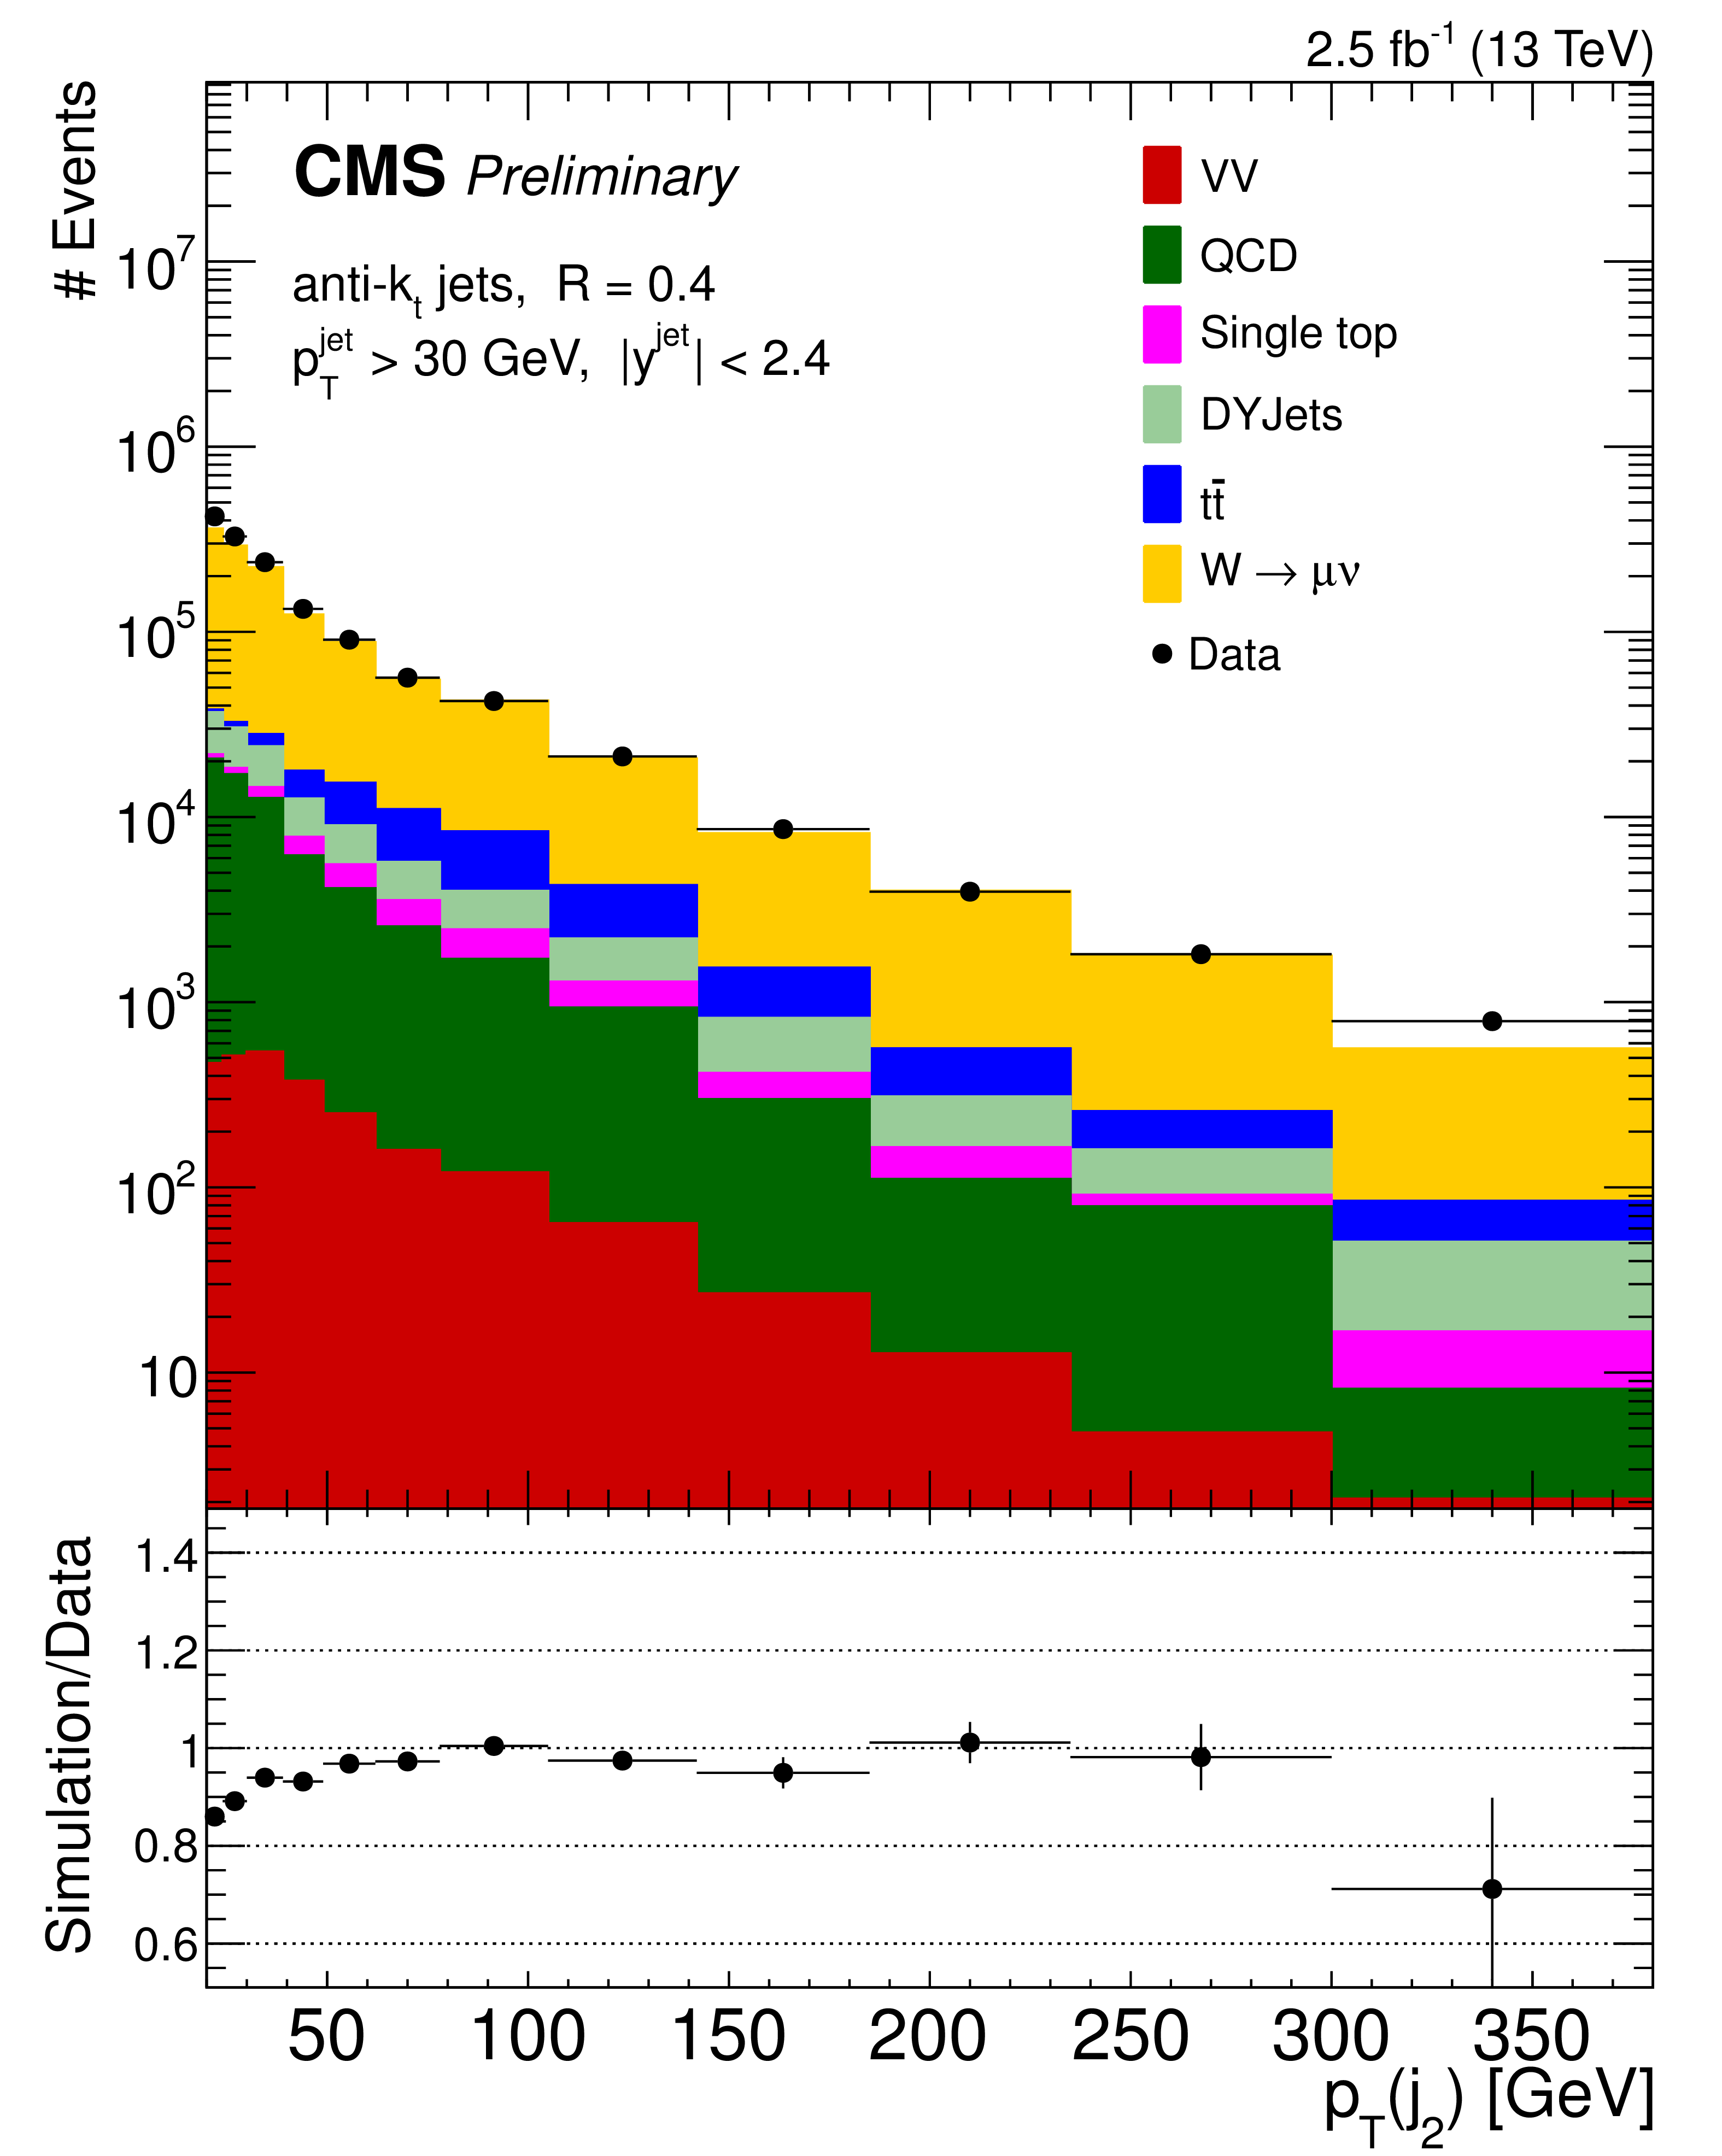
Figure 3-b:
Data to simulation comparison of $1^{st}$ (a) and $2^{nd}$ (b) jet $ {p_{\mathrm {T}}} $. QCD background is estimated using a data-driven method. The diboson samples (WW, WZ, and ZZ) are represented by VV. The error bars on the ratio panel represent the statistical uncertainty of the data and simulated signal sample. |
png pdf |
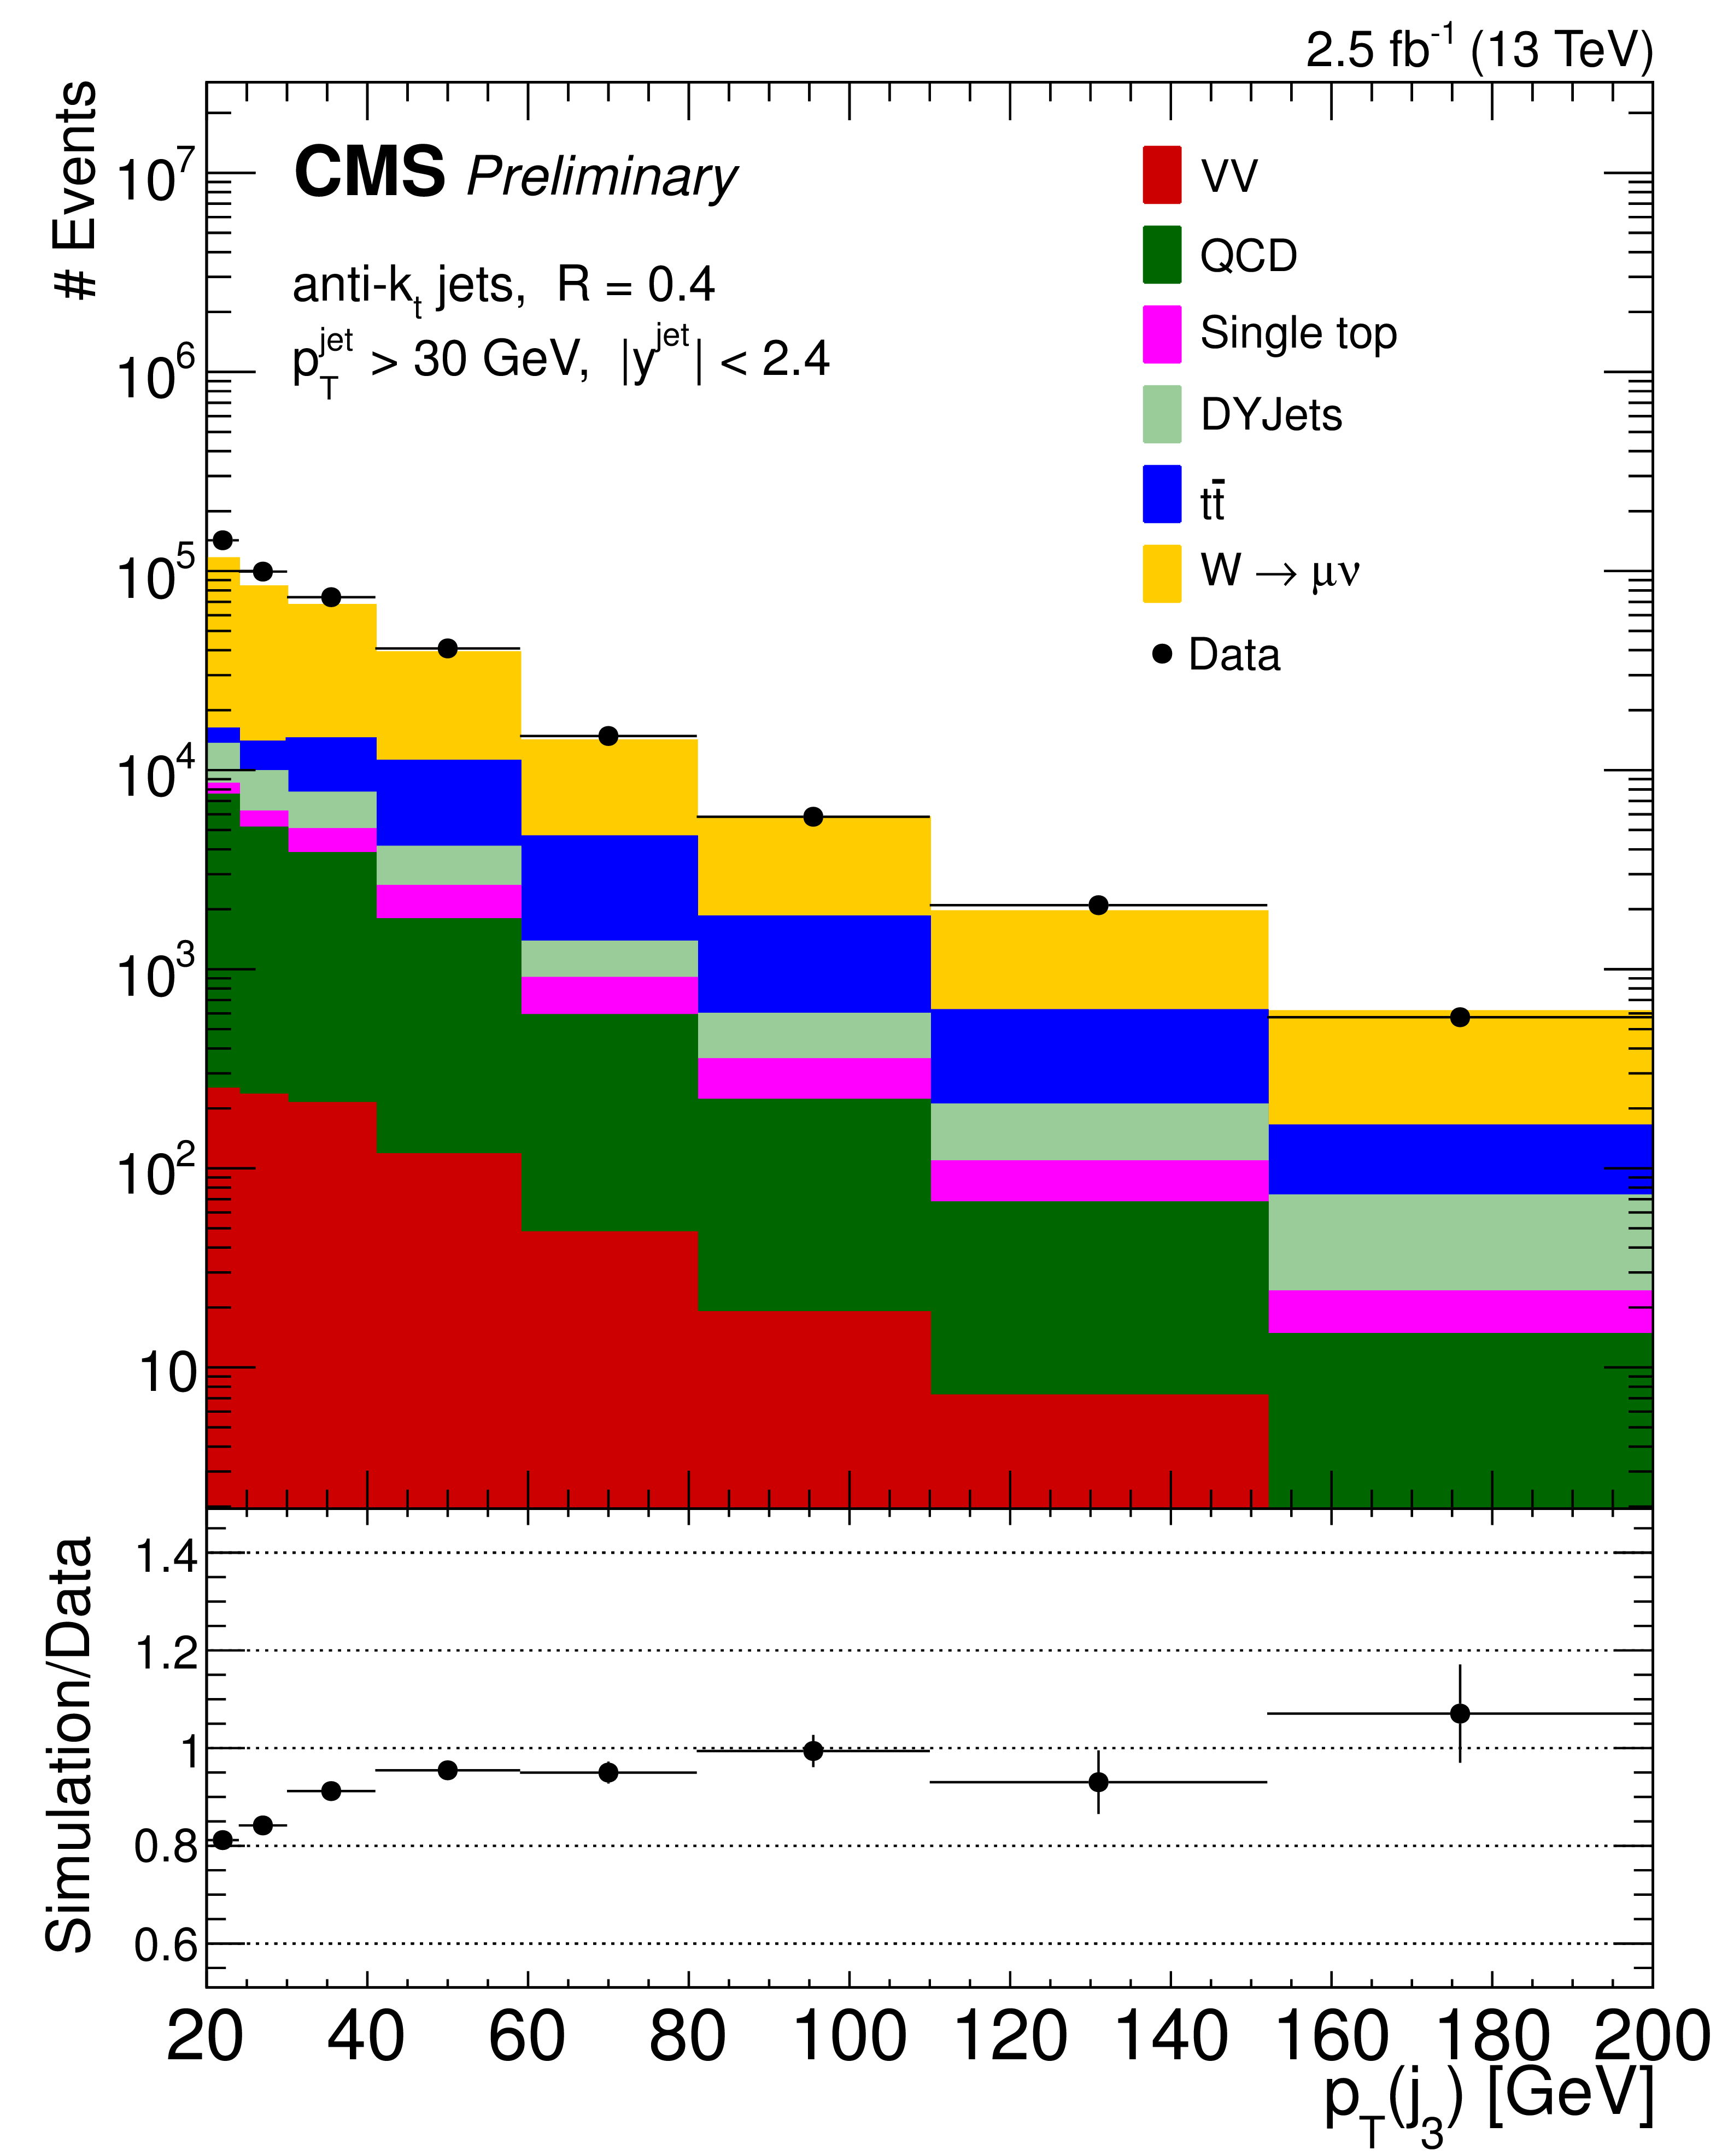
Figure 4:
Data to simulation comparison of $3^{rd}$ jet $ {p_{\mathrm {T}}} $. QCD background is estimated using a data-driven method. The diboson samples (WW, WZ, and ZZ) are represented by VV. The error bars on the ratio panel represent the statistical uncertainty of the data and simulated signal sample. |

png pdf |
Figure 5-a:
Data to simulation comparison of exclusive (a) and inclusive (b) jet multiplicity in the $ {\mathrm {t}\overline {\mathrm {t}}} $-enriched control sample. The diboson samples (WW, WZ, and ZZ) are represented by VV. The error bars on the ratio panel represent the statistical uncertainty of the data and simulated signal sample. |

png pdf |
Figure 5-b:
Data to simulation comparison of exclusive (a) and inclusive (b) jet multiplicity in the $ {\mathrm {t}\overline {\mathrm {t}}} $-enriched control sample. The diboson samples (WW, WZ, and ZZ) are represented by VV. The error bars on the ratio panel represent the statistical uncertainty of the data and simulated signal sample. |
png pdf |
Figure 6-a:
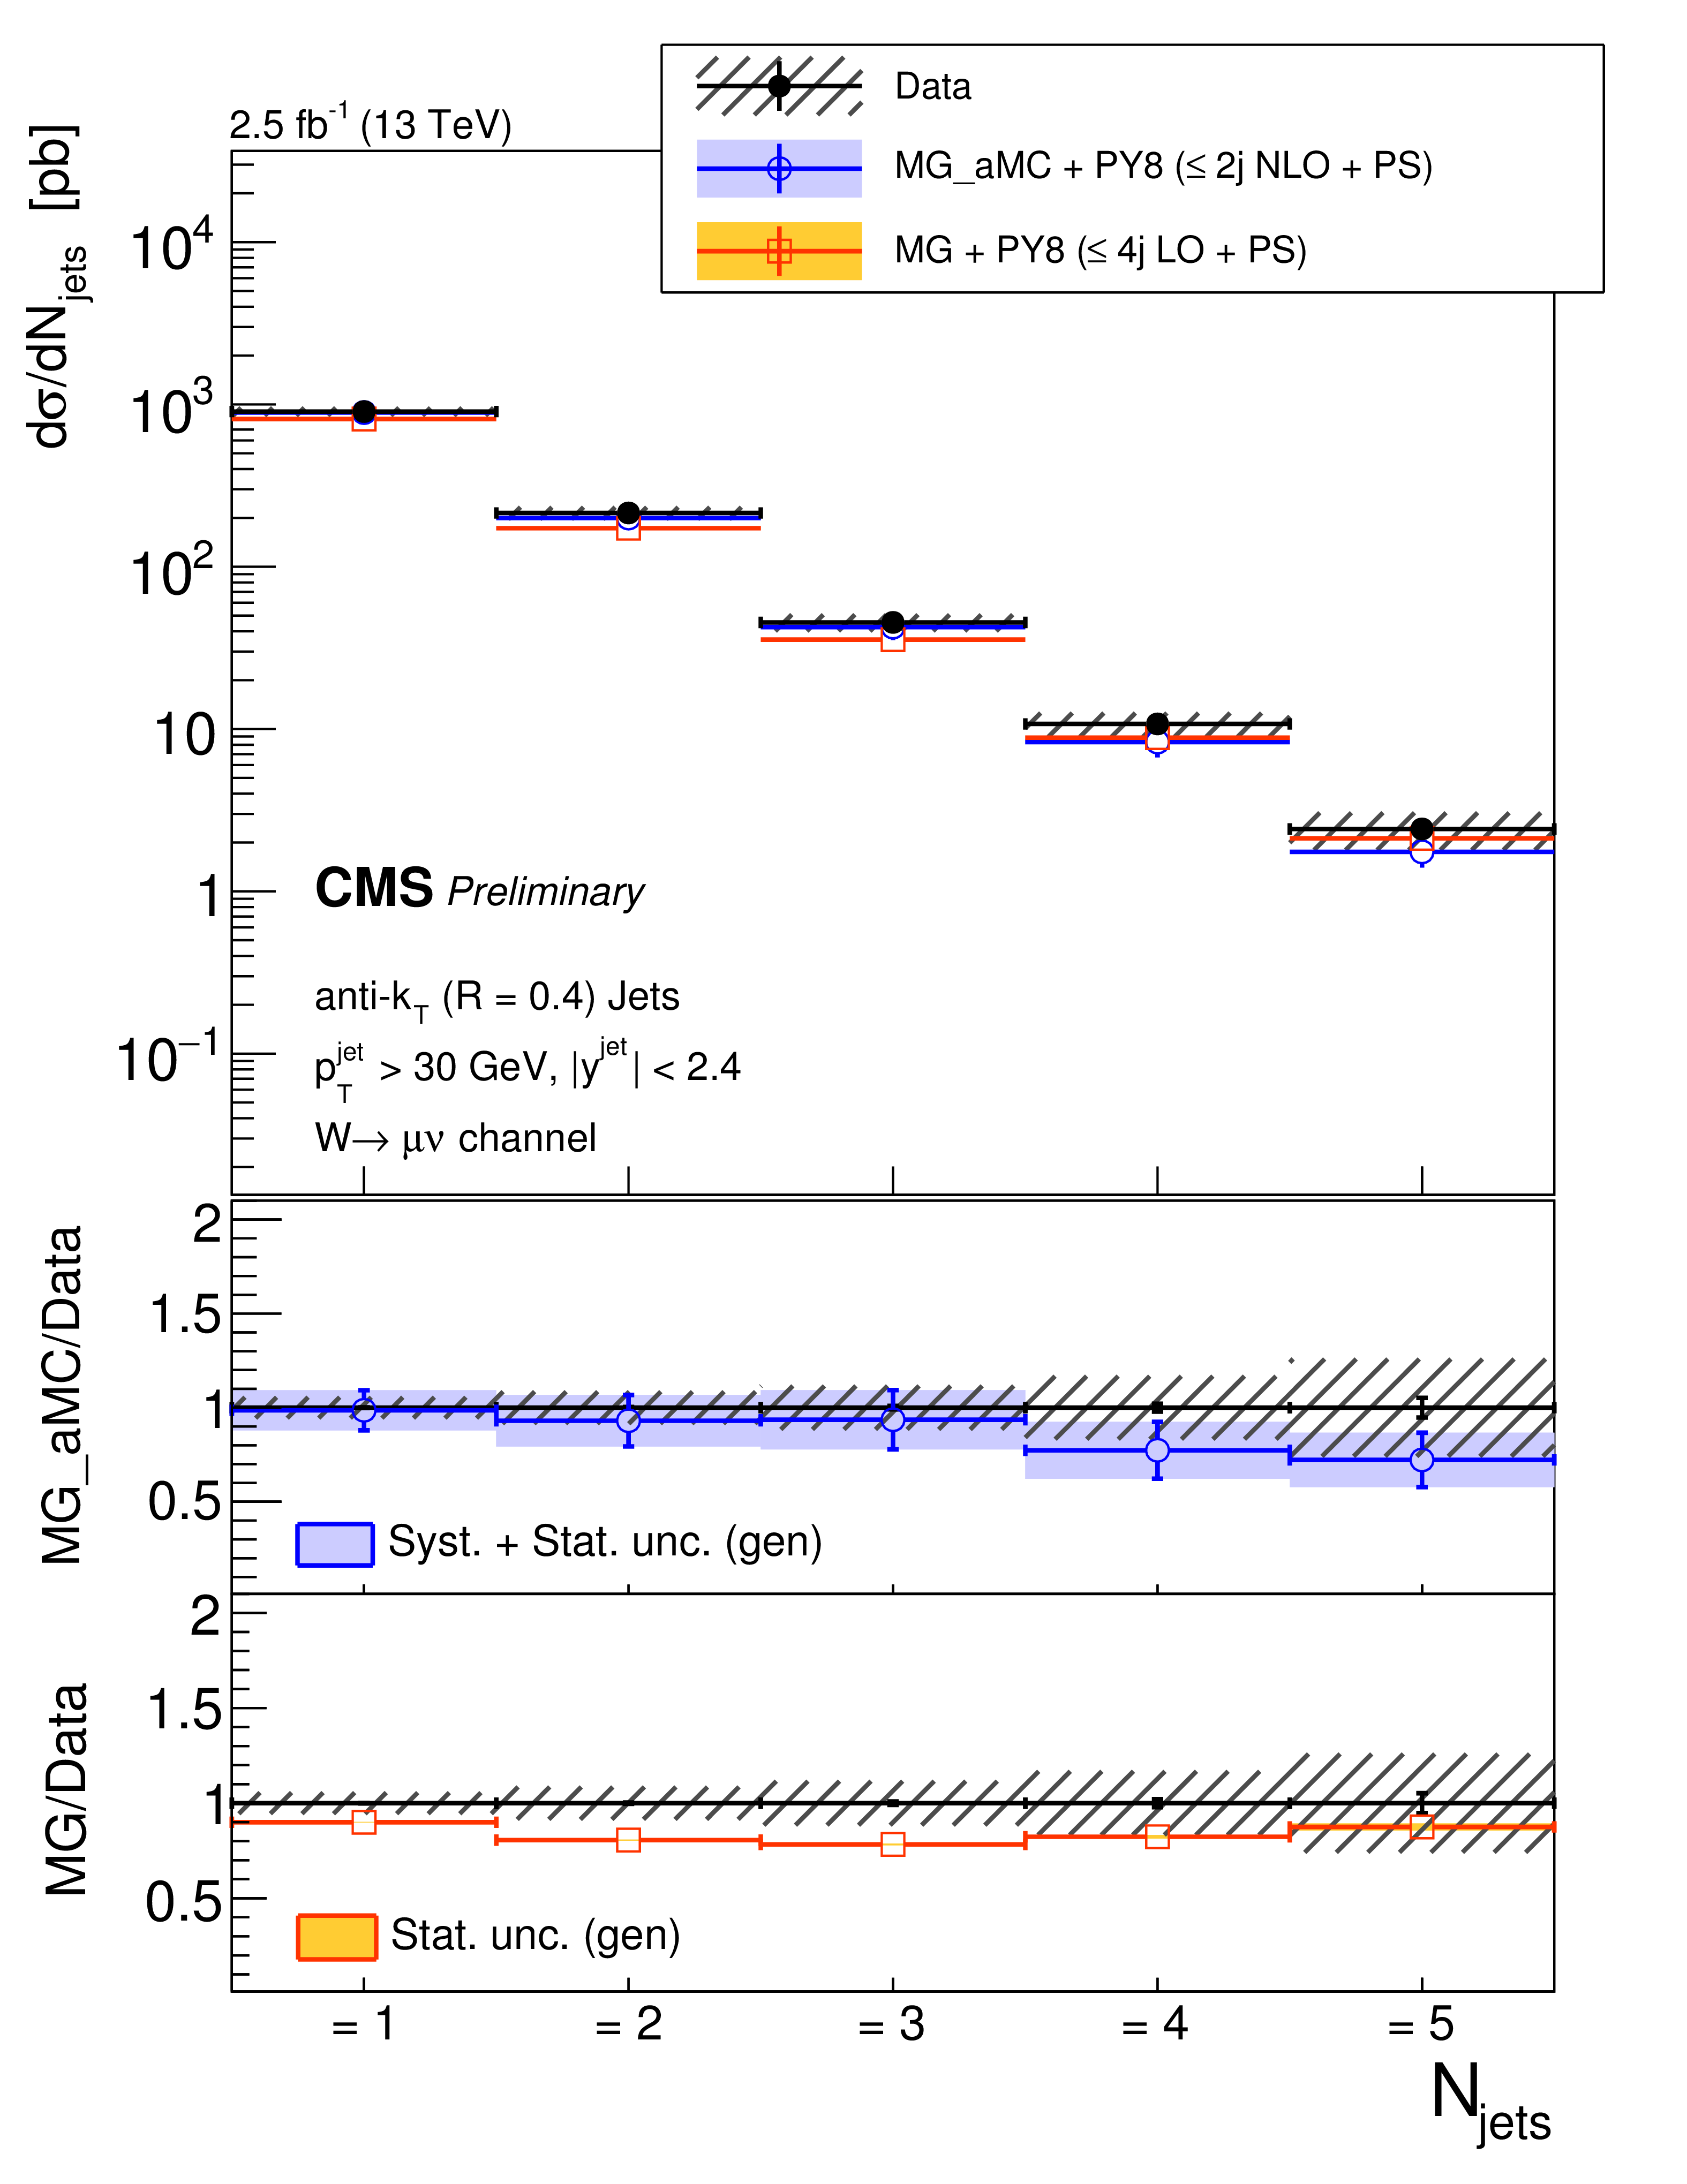
The differential cross section measurement for the exclusive and inclusive jet multiplicities, compared to the predictions of MG-aMC FxFx and MG-aMC, where latter denoted as MG in the legends. Black circular markers with the grey hatched band represent the unfolded data measurement and its total experimental uncertainty. MG-aMC is given only with its statistical uncertainty. Color filled band around MG-aMC FxFx prediction represents its theoretical uncertainty including both statistical and systematical uncertainties. The lower panels show the ratios of the prediction to the unfolded data. |

png pdf |
Figure 6-b:
The differential cross section measurement for the exclusive and inclusive jet multiplicities, compared to the predictions of MG-aMC FxFx and MG-aMC, where latter denoted as MG in the legends. Black circular markers with the grey hatched band represent the unfolded data measurement and its total experimental uncertainty. MG-aMC is given only with its statistical uncertainty. Color filled band around MG-aMC FxFx prediction represents its theoretical uncertainty including both statistical and systematical uncertainties. The lower panels show the ratios of the prediction to the unfolded data. |
png pdf |
Figure 7-a:
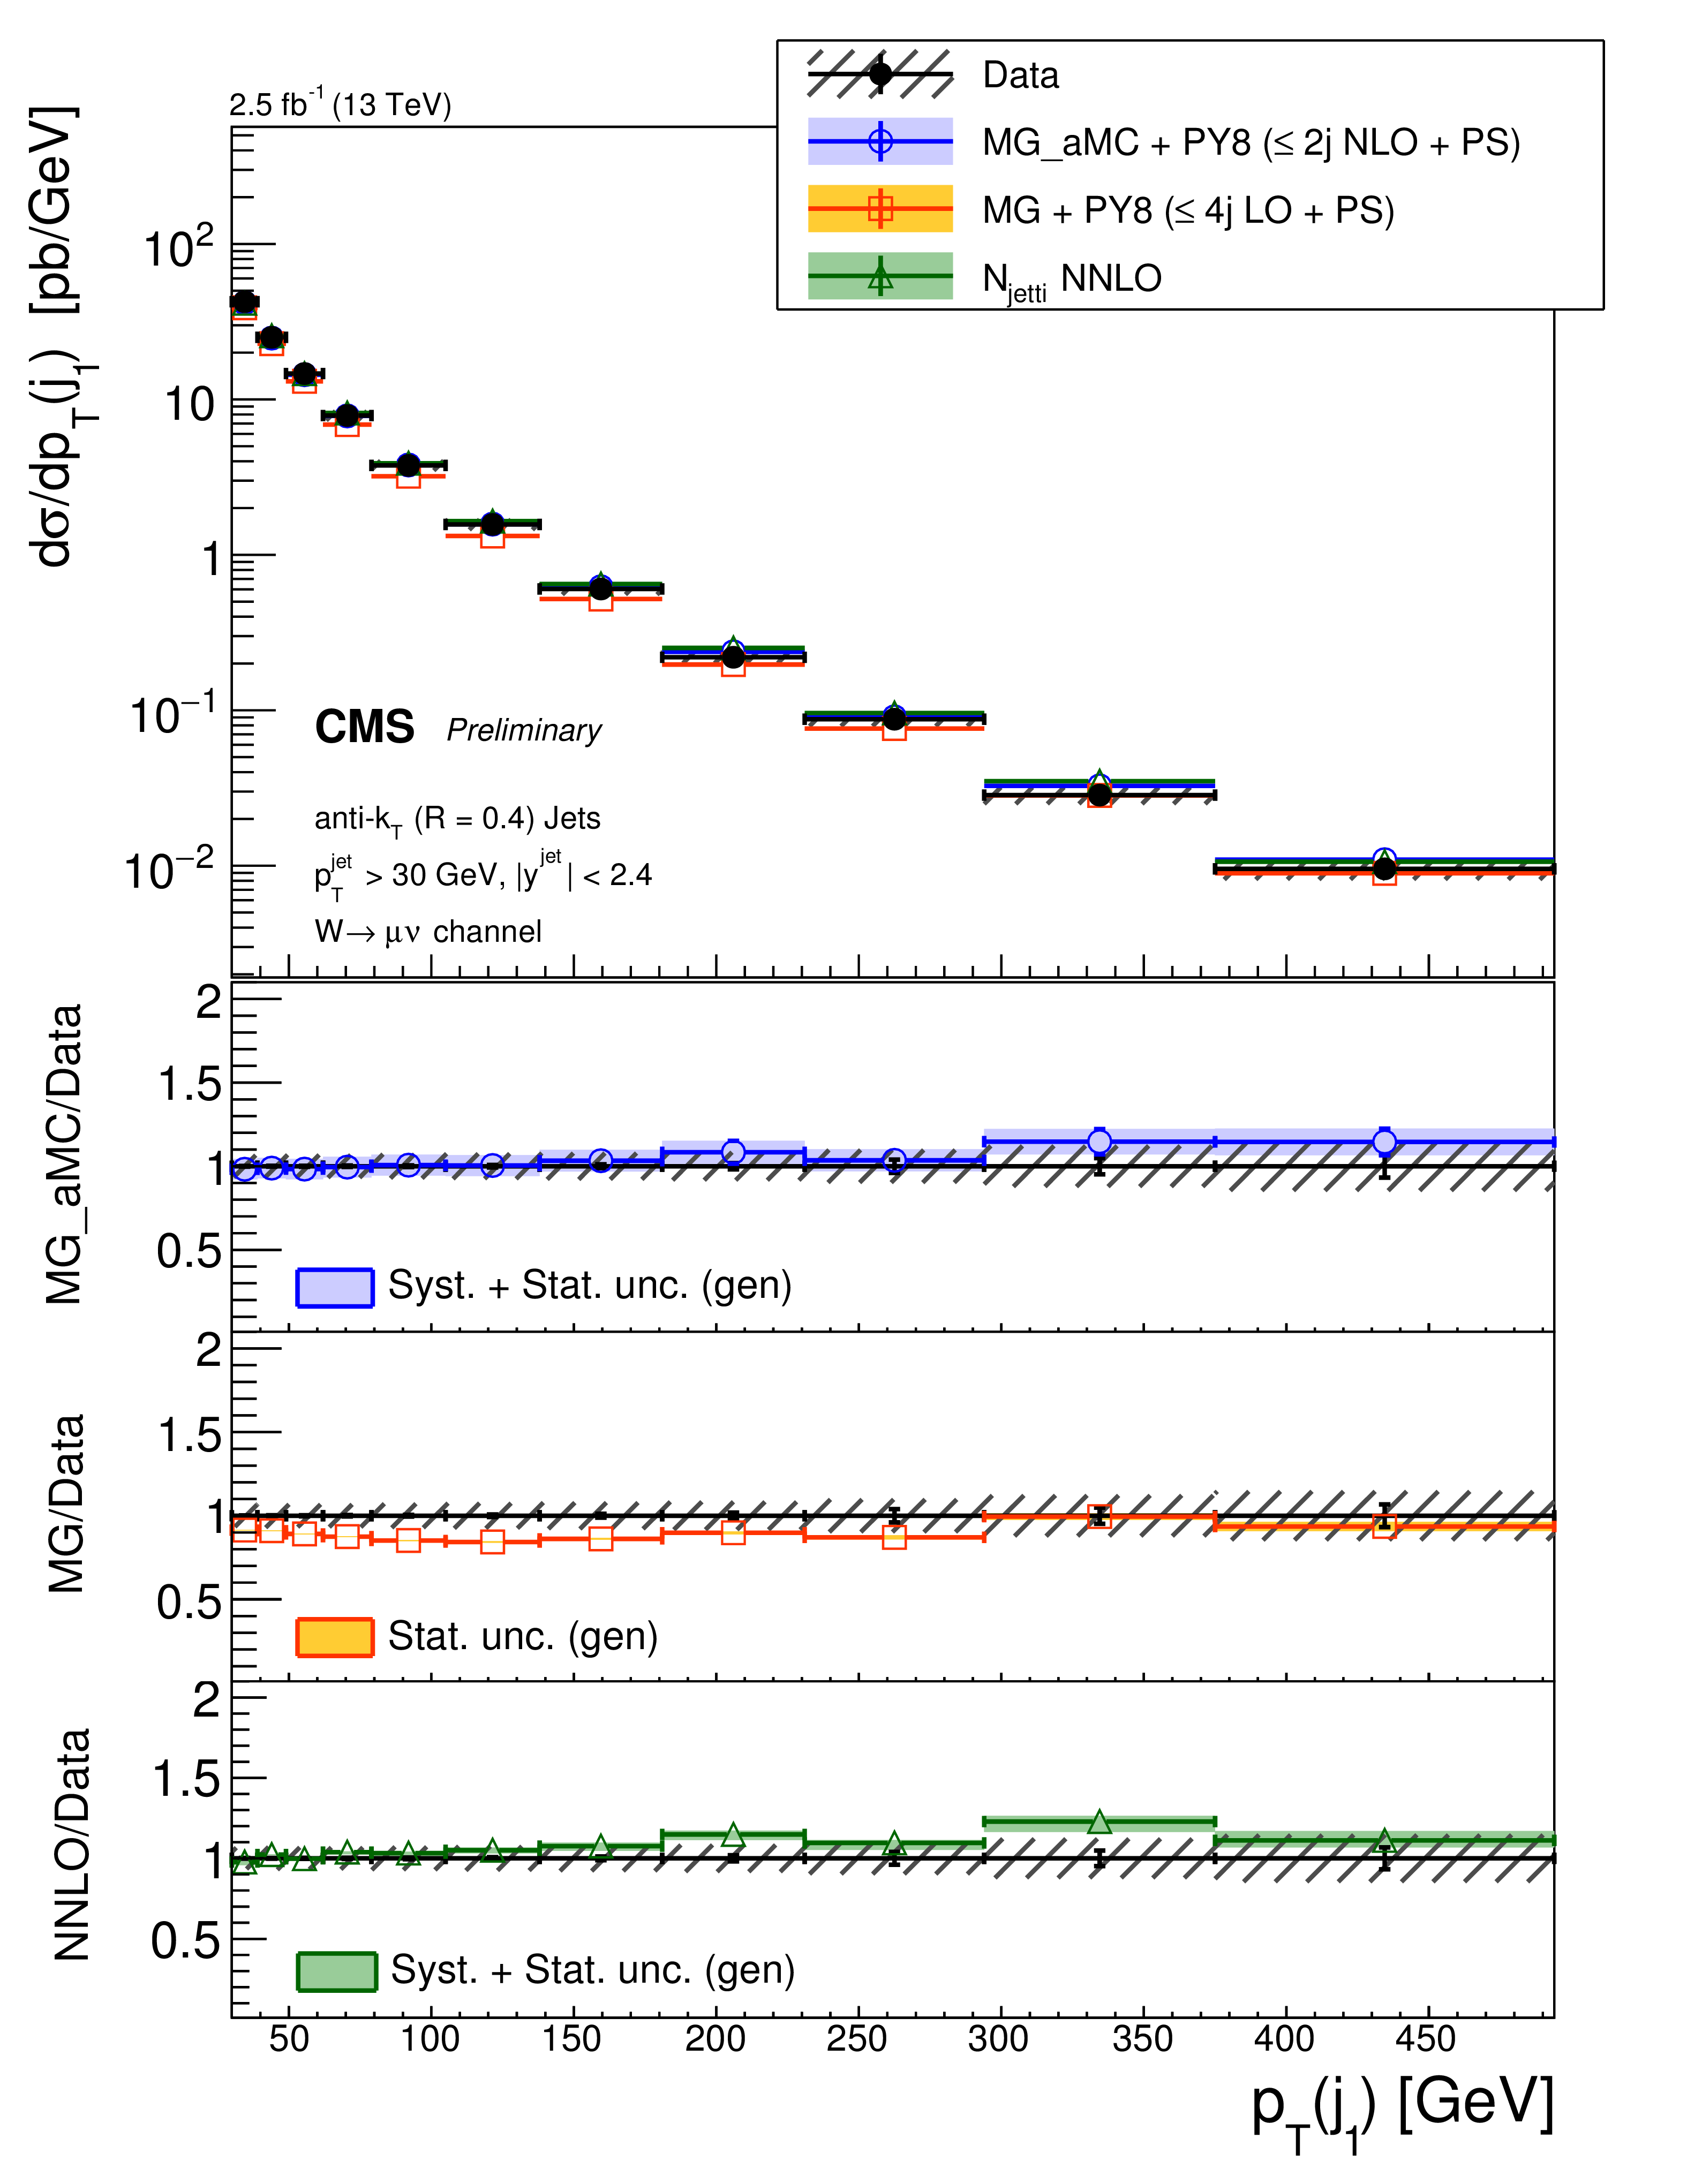
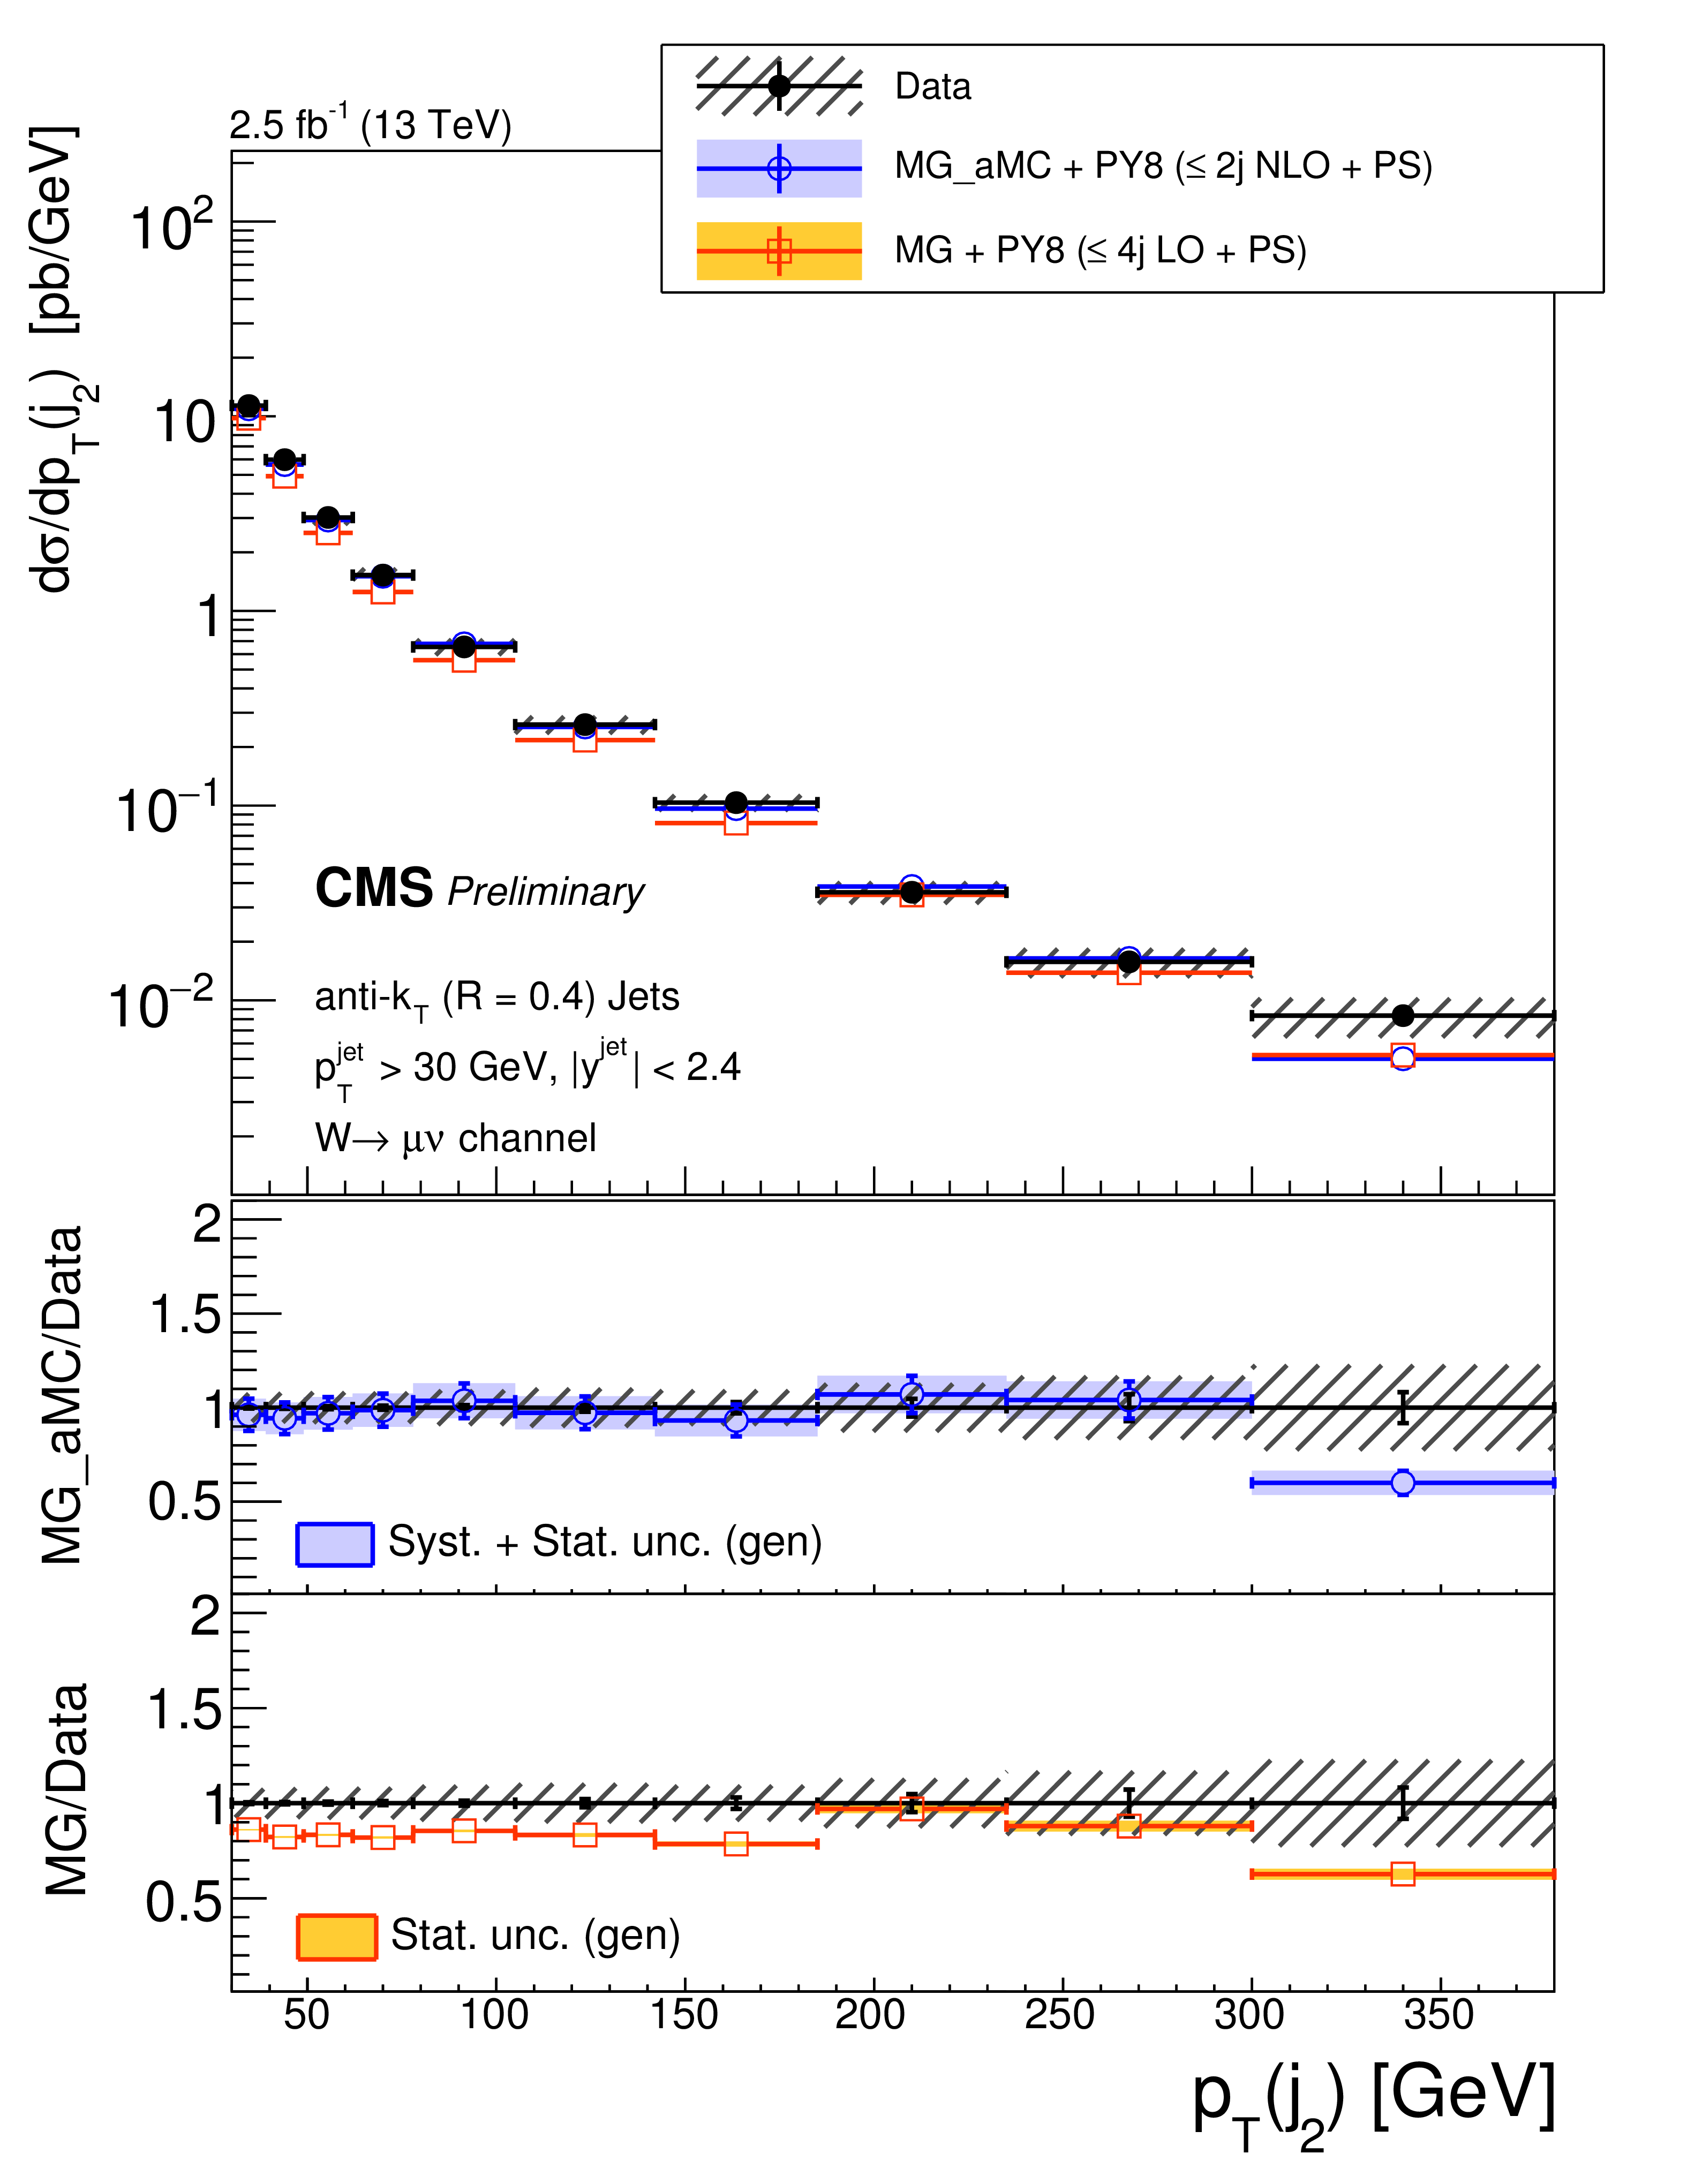
The differential cross section measurement for the leading three jets' transverse momenta, compared to the predictions of MG-aMC FxFx and MG-aMC, where latter denoted as MG in the legends. The NNLO prediction for W+1-jet is included in the first leading jet transverse momentum. Black circular markers with the grey hatched band represent the unfolded data measurement and its total experimental uncertainty. MG-aMC is given only with its statistical uncertainty. Color filled bands around MG-aMC FxFx and NNLO predictions represent their theoretical uncertainties including both statistical and systematical uncertainties. The lower panels show the ratios of the prediction to the unfolded data. |
png pdf |
Figure 7-b:
The differential cross section measurement for the leading three jets' transverse momenta, compared to the predictions of MG-aMC FxFx and MG-aMC, where latter denoted as MG in the legends. The NNLO prediction for W+1-jet is included in the first leading jet transverse momentum. Black circular markers with the grey hatched band represent the unfolded data measurement and its total experimental uncertainty. MG-aMC is given only with its statistical uncertainty. Color filled bands around MG-aMC FxFx and NNLO predictions represent their theoretical uncertainties including both statistical and systematical uncertainties. The lower panels show the ratios of the prediction to the unfolded data. |

png pdf |
Figure 7-c:
The differential cross section measurement for the leading three jets' transverse momenta, compared to the predictions of MG-aMC FxFx and MG-aMC, where latter denoted as MG in the legends. The NNLO prediction for W+1-jet is included in the first leading jet transverse momentum. Black circular markers with the grey hatched band represent the unfolded data measurement and its total experimental uncertainty. MG-aMC is given only with its statistical uncertainty. Color filled bands around MG-aMC FxFx and NNLO predictions represent their theoretical uncertainties including both statistical and systematical uncertainties. The lower panels show the ratios of the prediction to the unfolded data. |
png pdf |
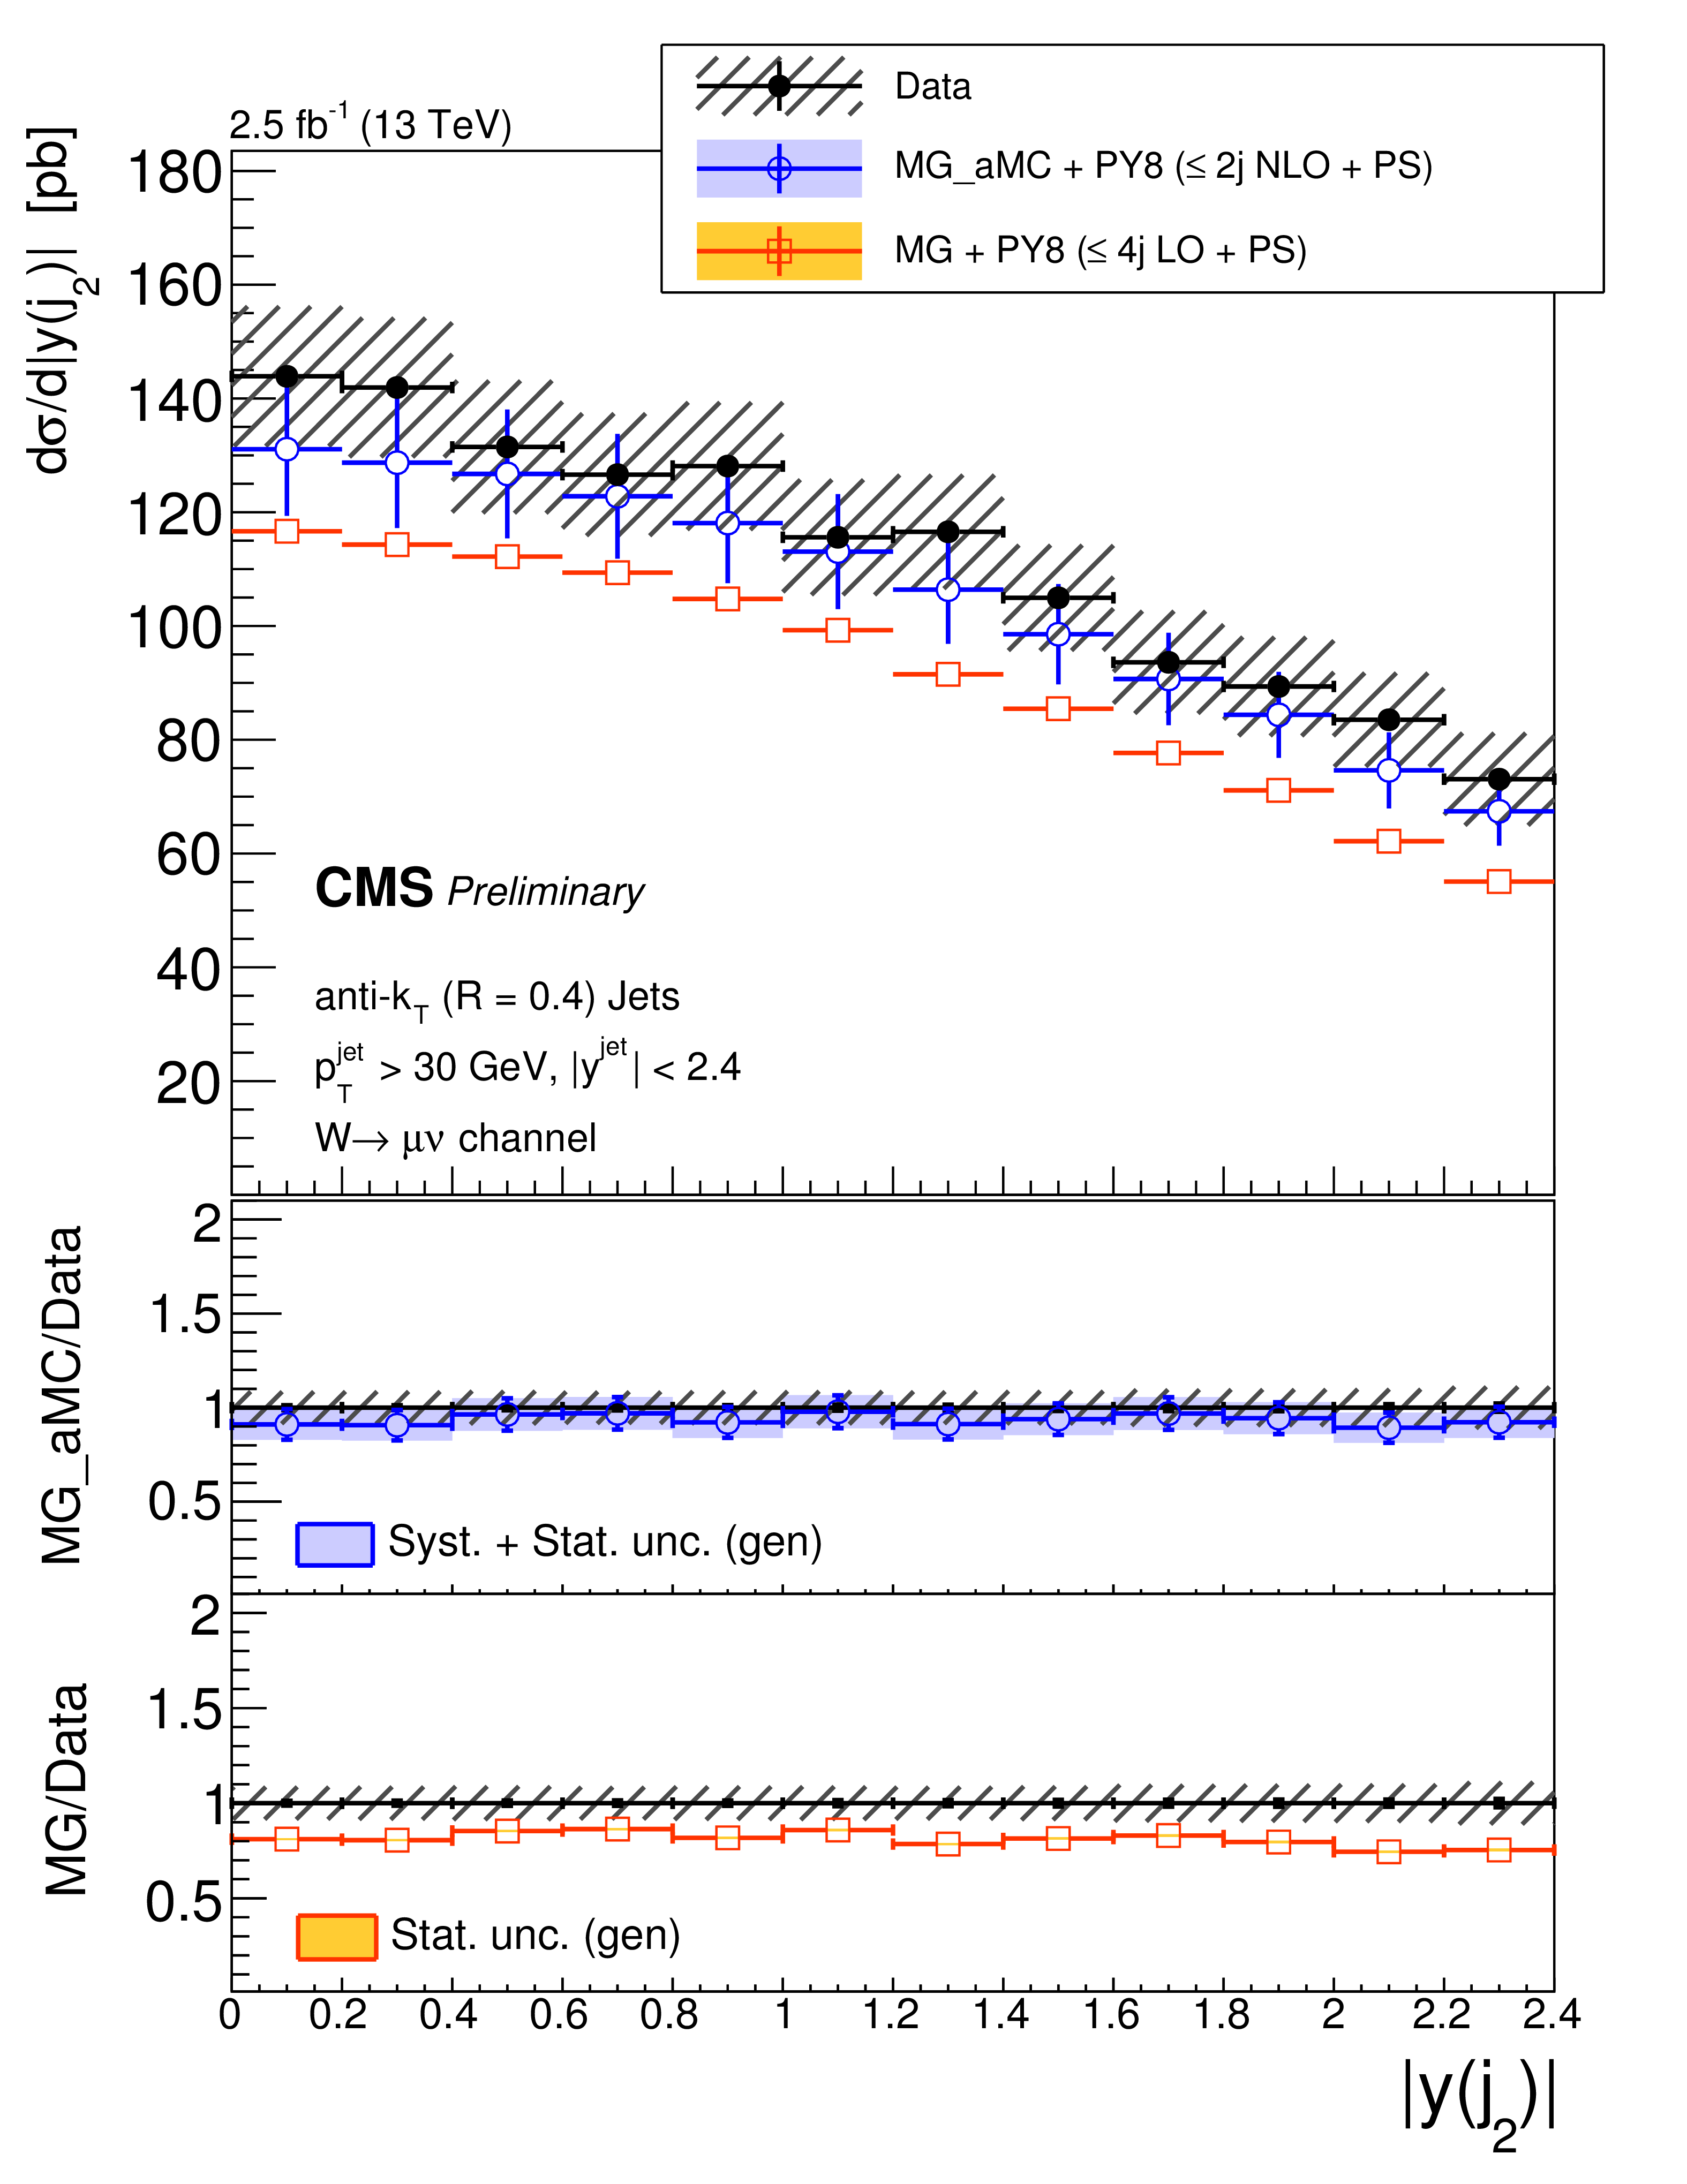
Figure 8-a:
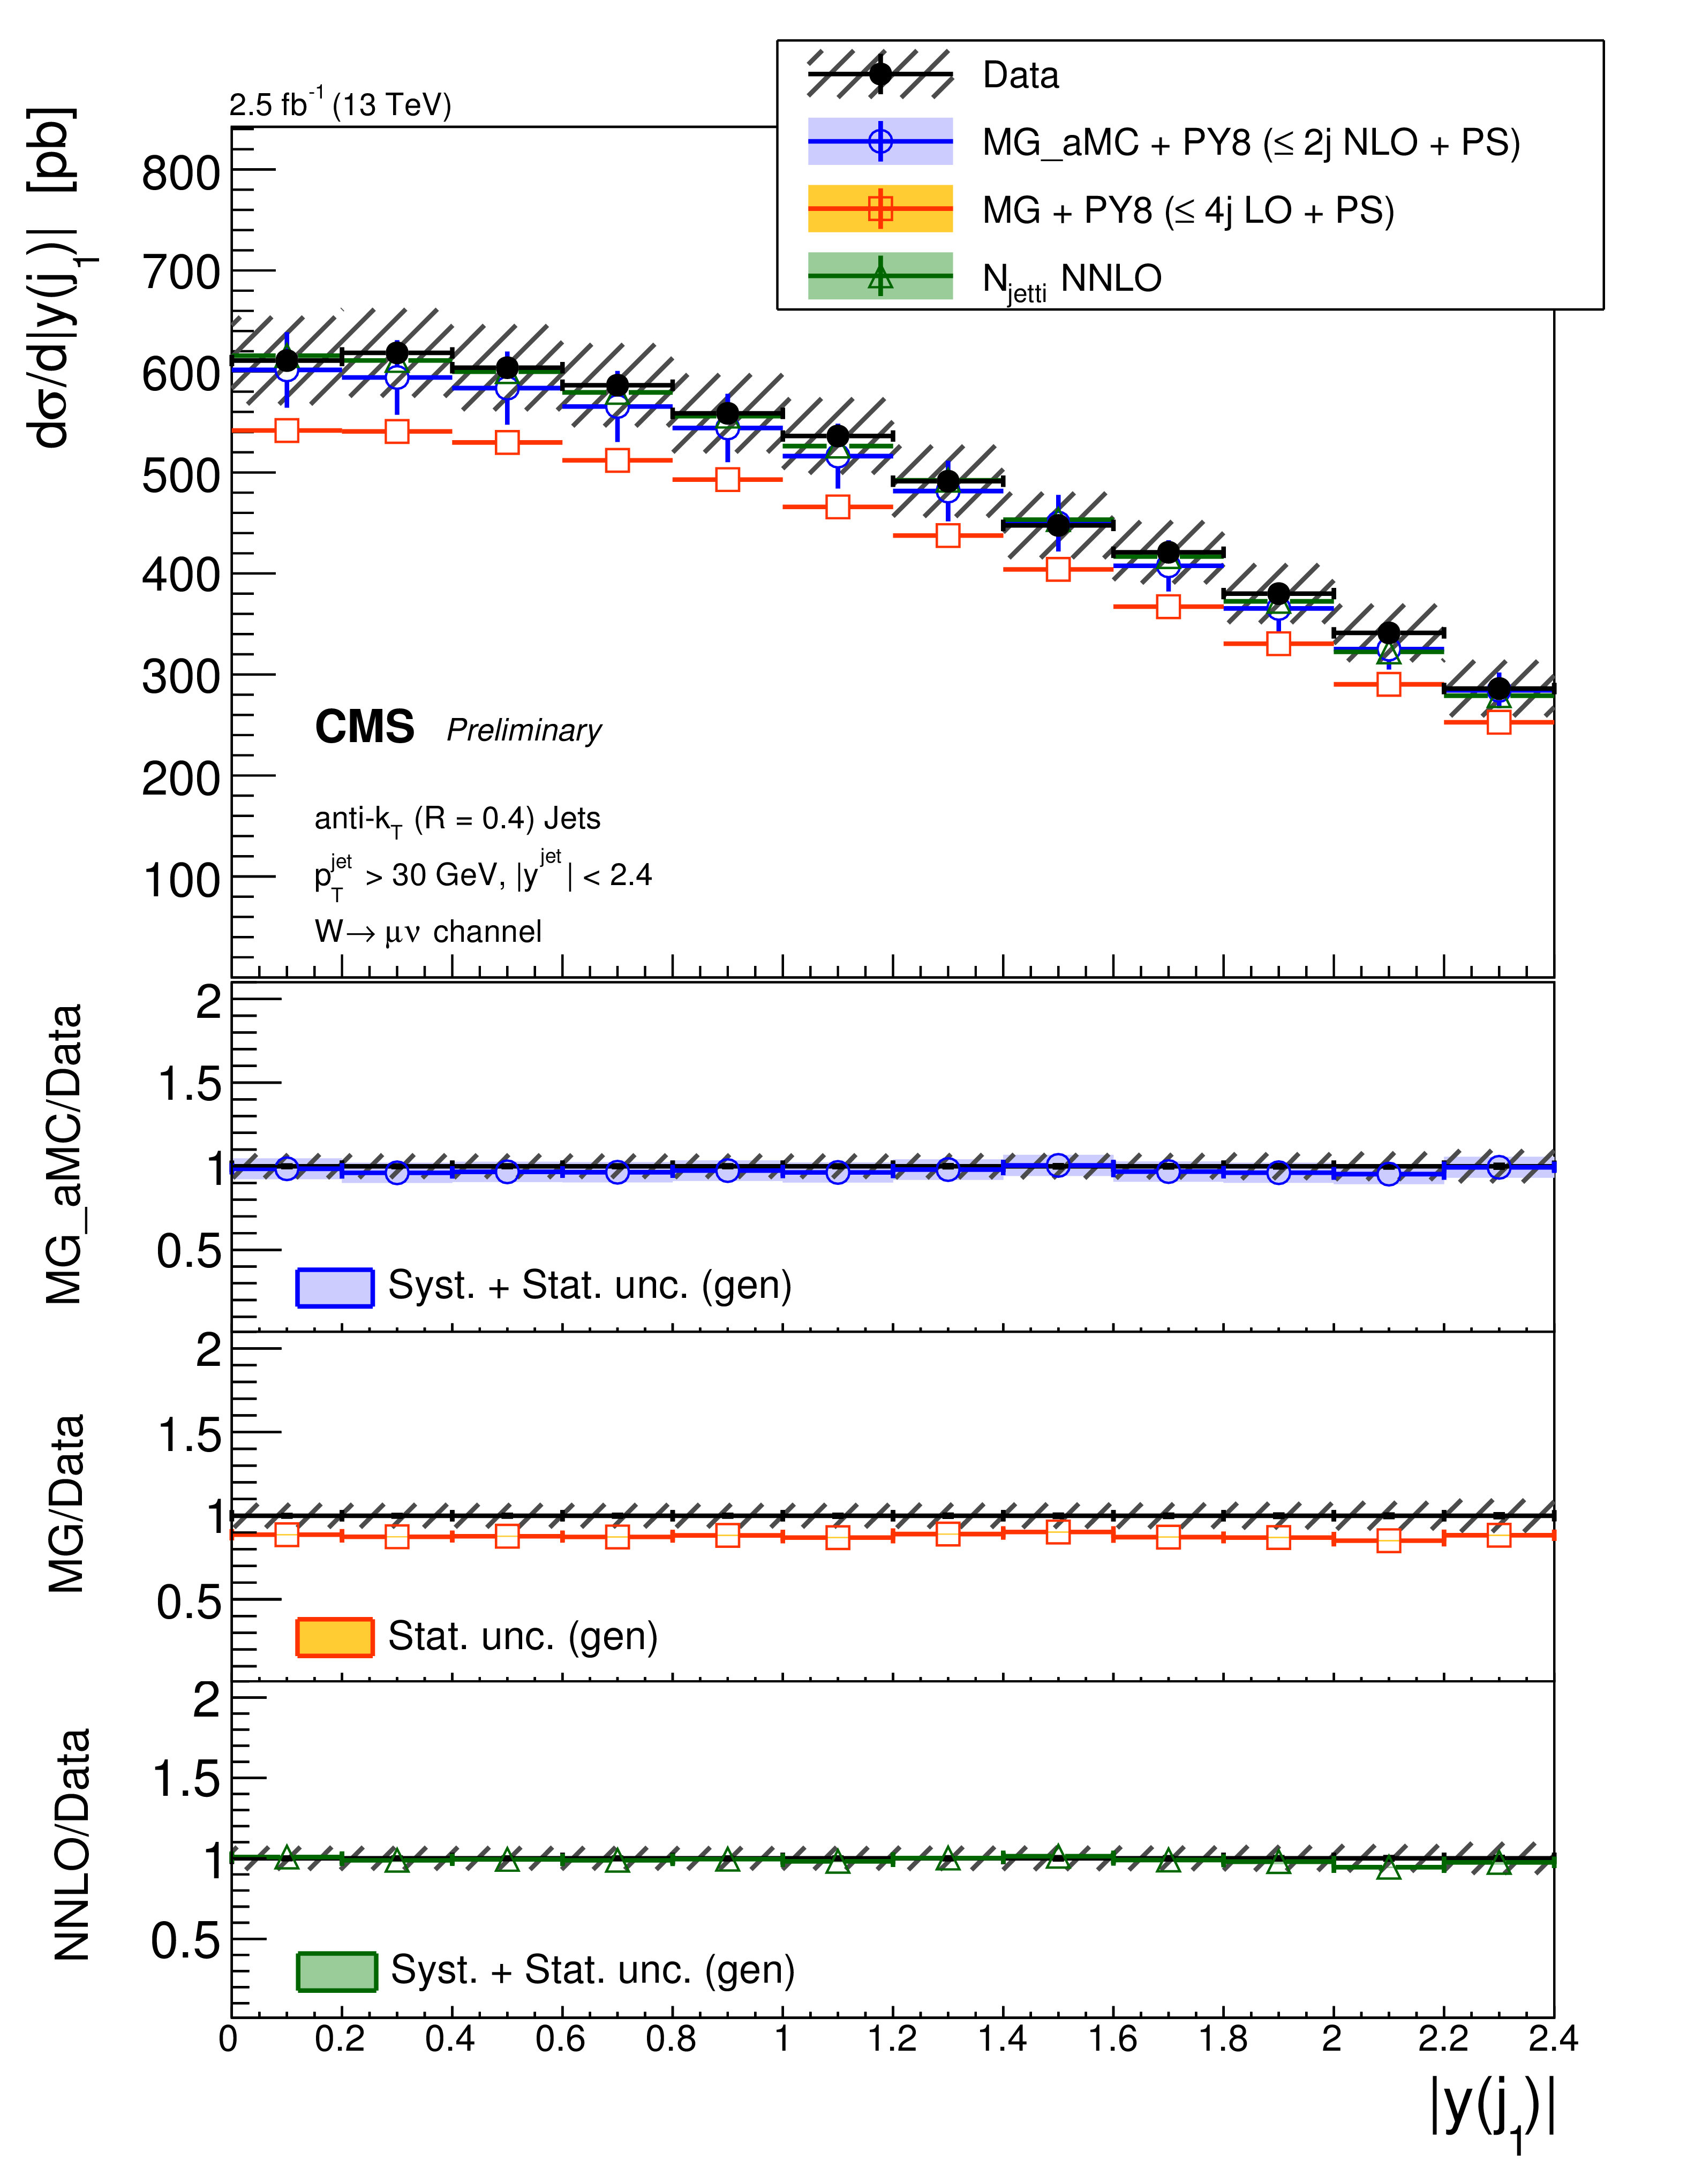
The differential cross section measurement for the leading three jets' absolute rapidities, compared to the predictions of MG-aMC FxFx and MG-aMC, where latter denoted as MG in the legends. The NNLO prediction for W+1-jet is included in the first leading jet absolute rapidity. Black circular markers with the grey hatched band represent the unfolded data measurement and total experimental uncertainty. MG-aMC is given only with its statistical uncertainty. Color filled bands around MG-aMC FxFx and NNLO predictions represent their theoretical uncertainties including both statistical and systematical uncertainties. The lower panels show the ratios of the prediction to the unfolded data. |
png pdf |
Figure 8-b:
The differential cross section measurement for the leading three jets' absolute rapidities, compared to the predictions of MG-aMC FxFx and MG-aMC, where latter denoted as MG in the legends. The NNLO prediction for W+1-jet is included in the first leading jet absolute rapidity. Black circular markers with the grey hatched band represent the unfolded data measurement and total experimental uncertainty. MG-aMC is given only with its statistical uncertainty. Color filled bands around MG-aMC FxFx and NNLO predictions represent their theoretical uncertainties including both statistical and systematical uncertainties. The lower panels show the ratios of the prediction to the unfolded data. |
png pdf |
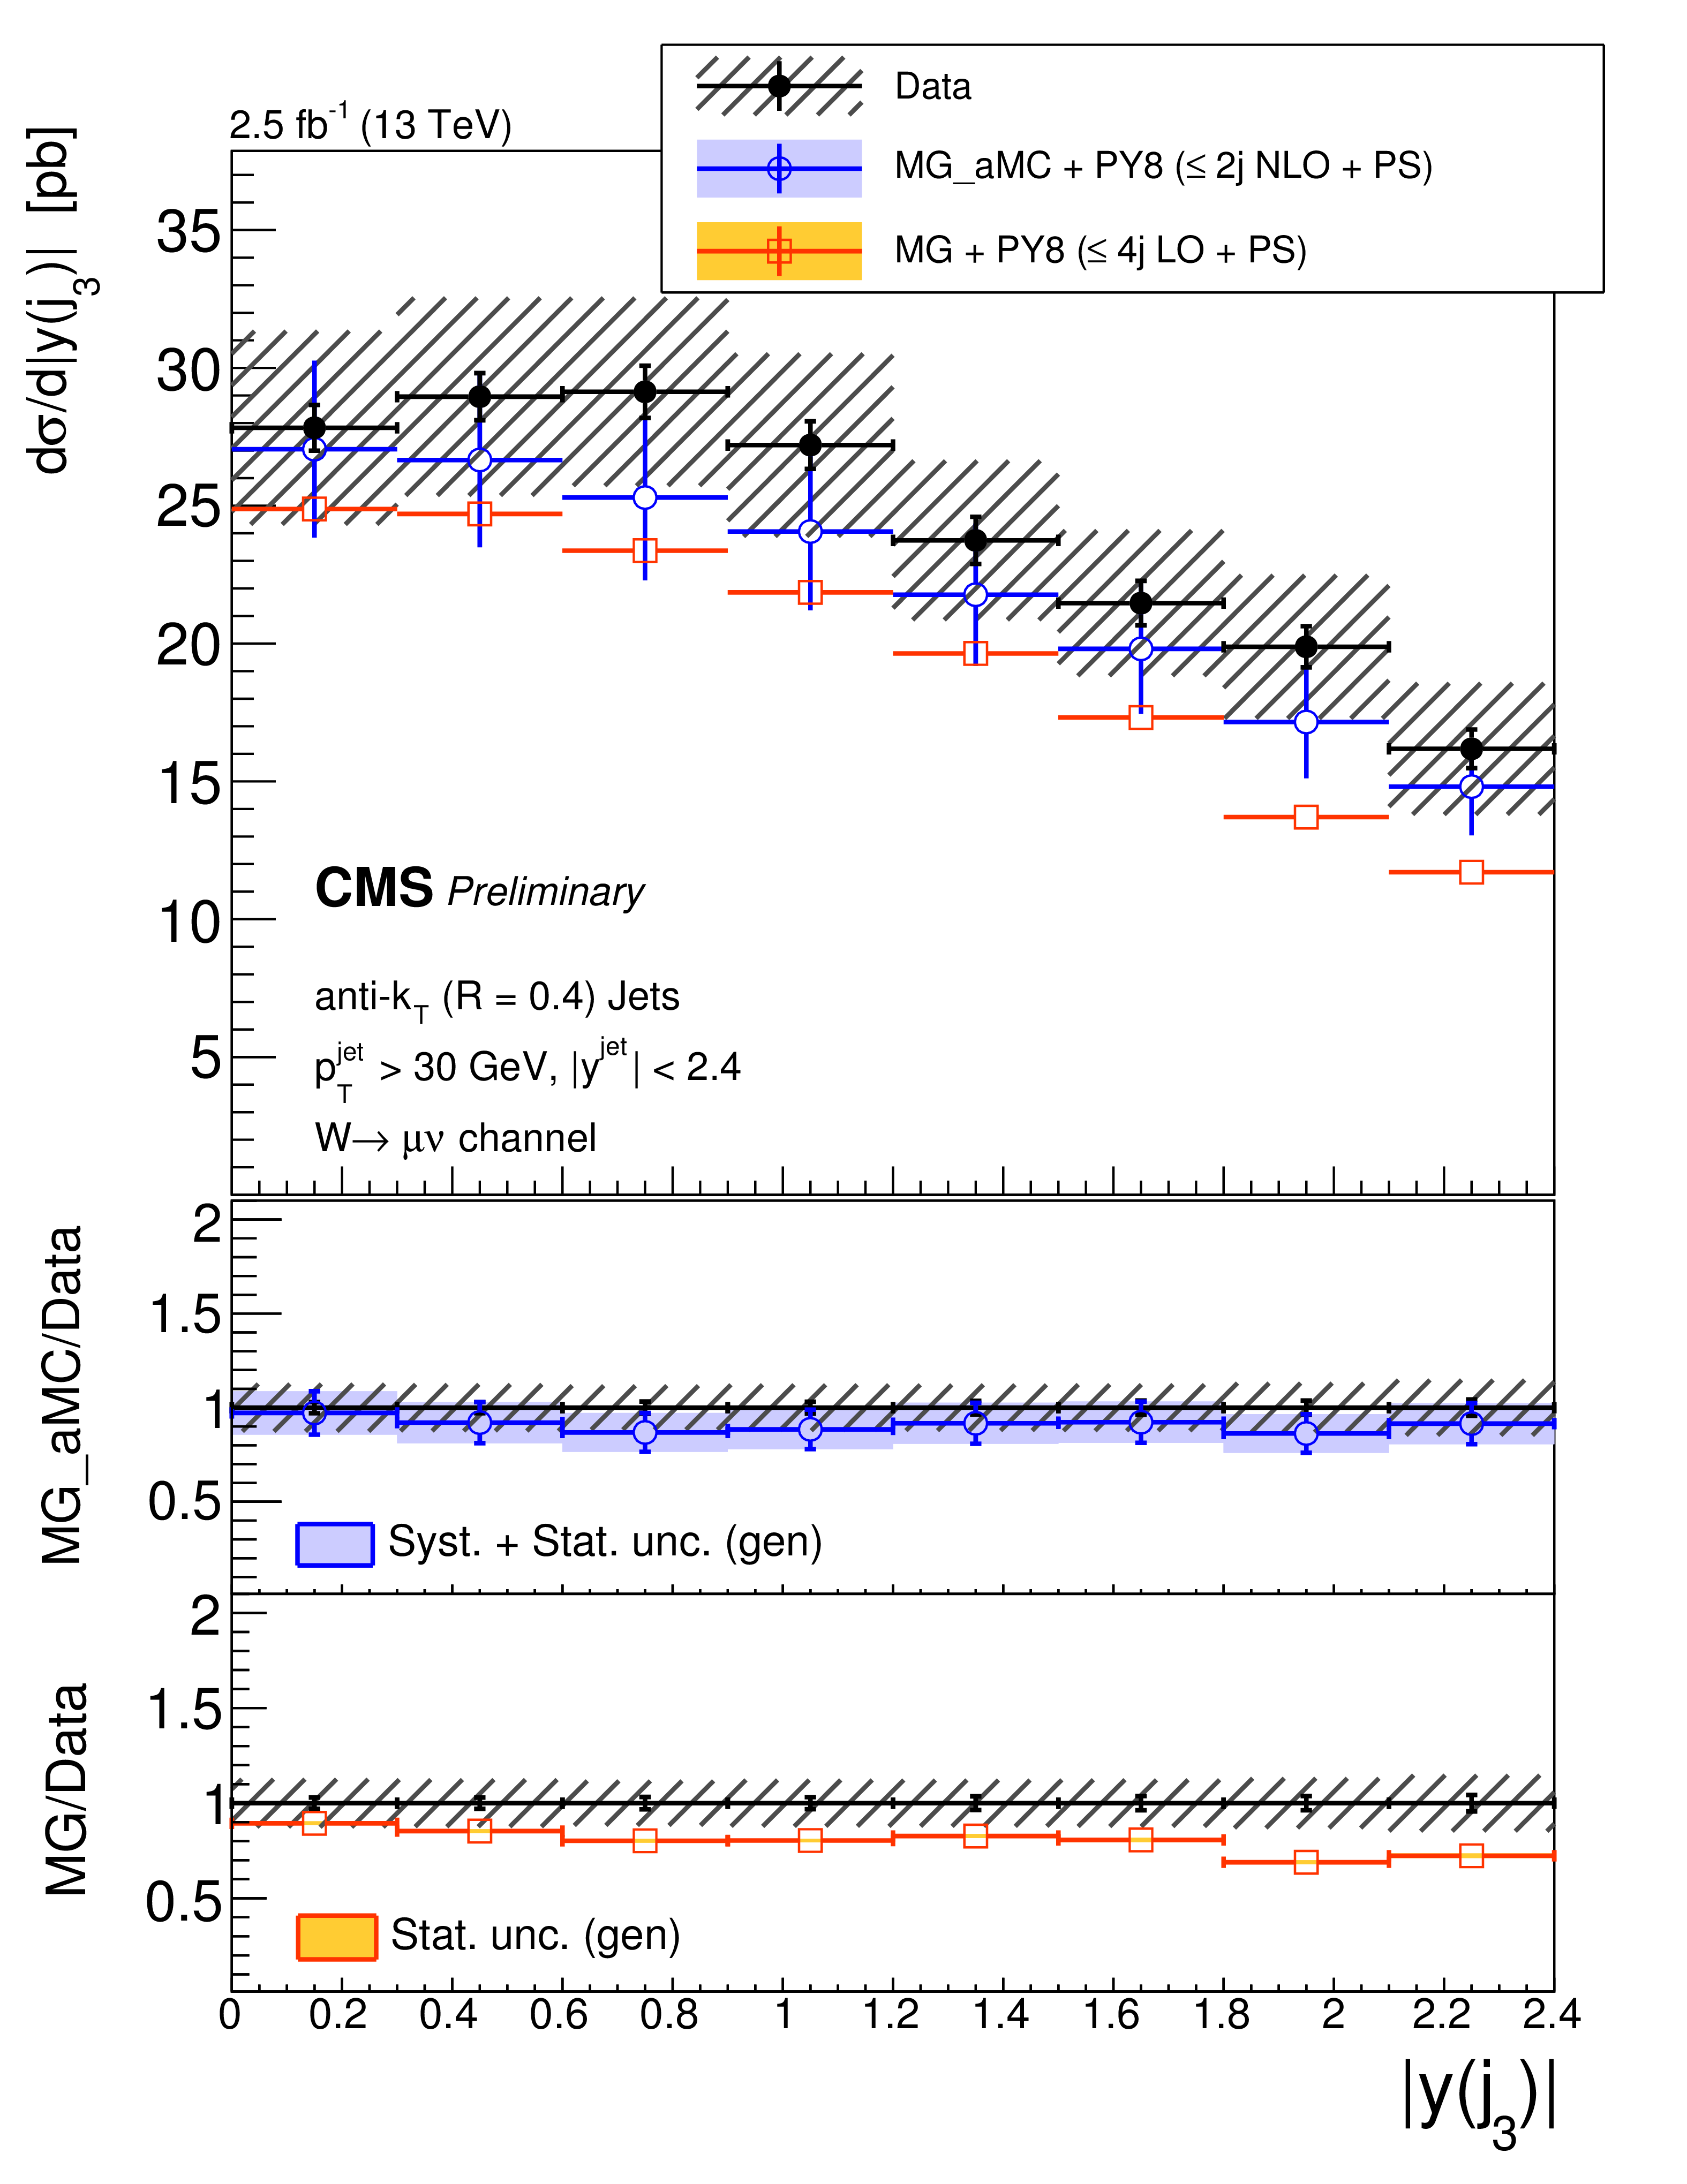
Figure 8-c:
The differential cross section measurement for the leading three jets' absolute rapidities, compared to the predictions of MG-aMC FxFx and MG-aMC, where latter denoted as MG in the legends. The NNLO prediction for W+1-jet is included in the first leading jet absolute rapidity. Black circular markers with the grey hatched band represent the unfolded data measurement and total experimental uncertainty. MG-aMC is given only with its statistical uncertainty. Color filled bands around MG-aMC FxFx and NNLO predictions represent their theoretical uncertainties including both statistical and systematical uncertainties. The lower panels show the ratios of the prediction to the unfolded data. |

png pdf |
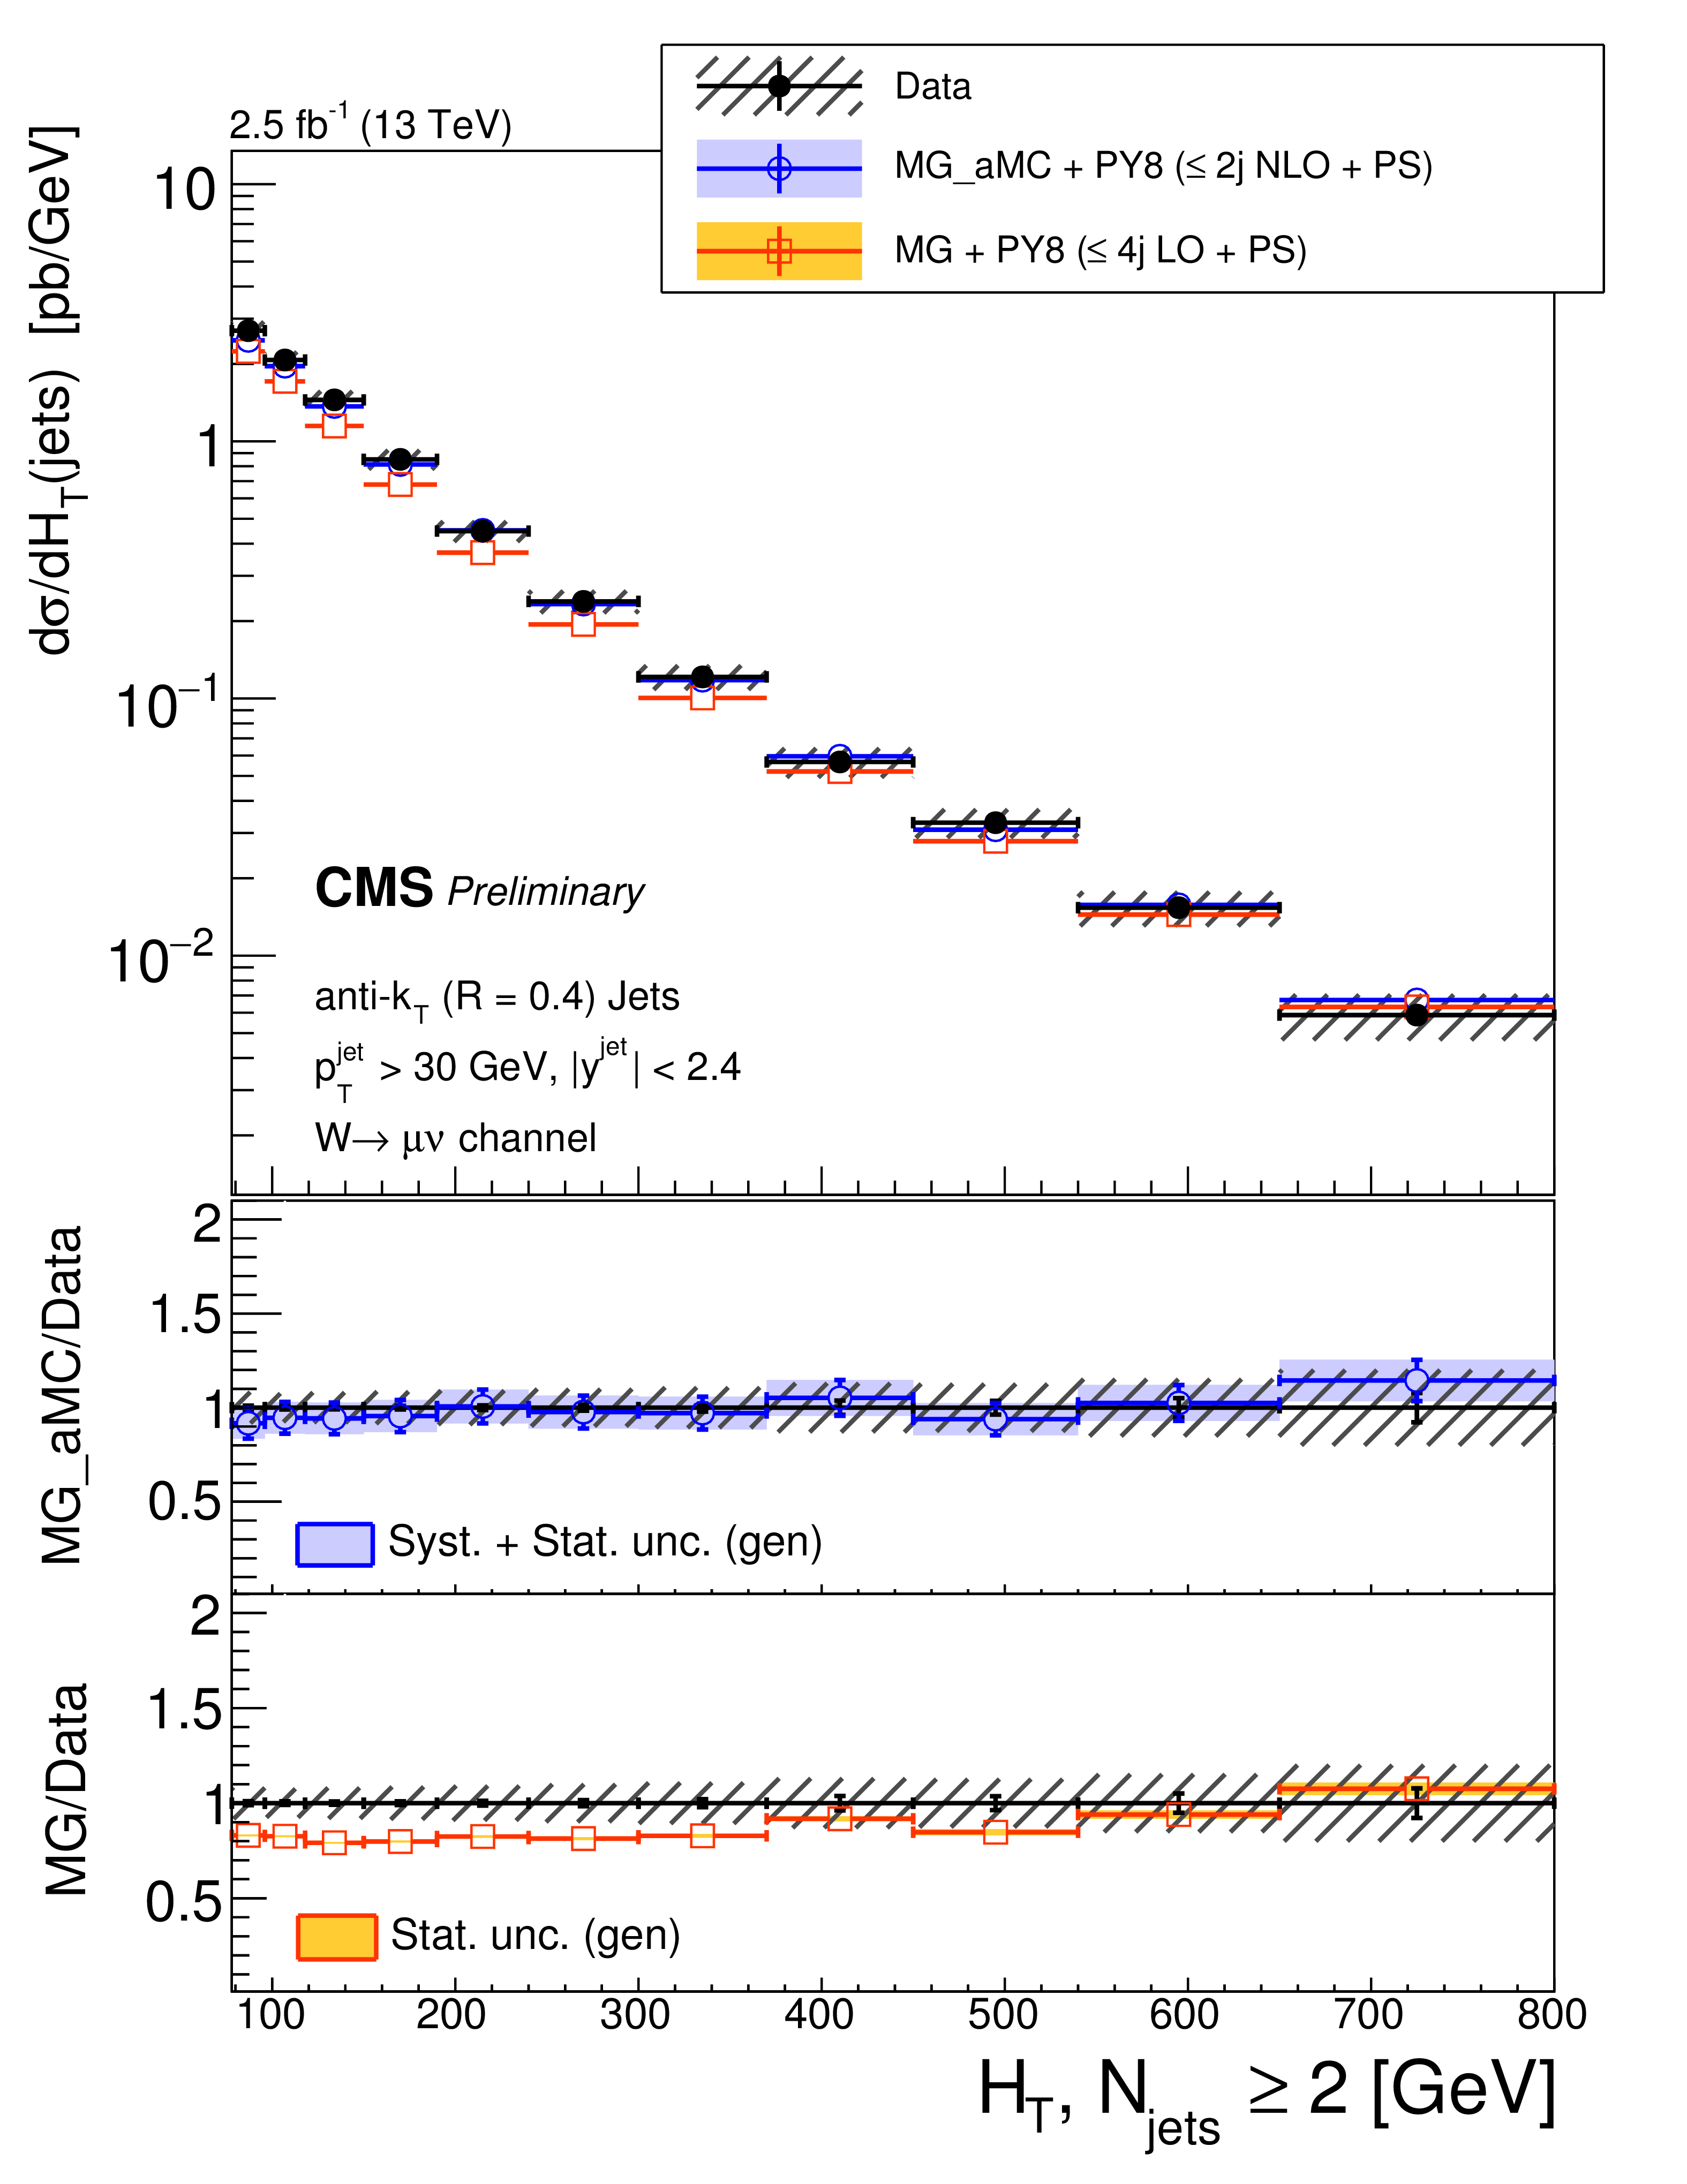
Figure 9-a:
The differential cross section measurement for $ {H_{\mathrm {T}}} $ for inclusive jet multiplicities 1-3, compared to the predictions of MG-aMC FxFx and MG-aMC, where latter denoted as MG in the legends. The NNLO prediction for W+1-jet is included in the jets $ {H_{\mathrm {T}}} $ for one inclusive jet. Black circular markers with the grey hatched band represent the unfolded data measurement and total experimental uncertainty. MG-aMC is given only with its statistical uncertainty. Color filled bands around MG-aMC FxFx and NNLO predictions represent their theoretical uncertainties incuding both statistical and systematical uncertainties. The lower panels show the ratio of the prediction to the unfolded data. |
png pdf |
Figure 9-b:
The differential cross section measurement for $ {H_{\mathrm {T}}} $ for inclusive jet multiplicities 1-3, compared to the predictions of MG-aMC FxFx and MG-aMC, where latter denoted as MG in the legends. The NNLO prediction for W+1-jet is included in the jets $ {H_{\mathrm {T}}} $ for one inclusive jet. Black circular markers with the grey hatched band represent the unfolded data measurement and total experimental uncertainty. MG-aMC is given only with its statistical uncertainty. Color filled bands around MG-aMC FxFx and NNLO predictions represent their theoretical uncertainties incuding both statistical and systematical uncertainties. The lower panels show the ratio of the prediction to the unfolded data. |
png pdf |
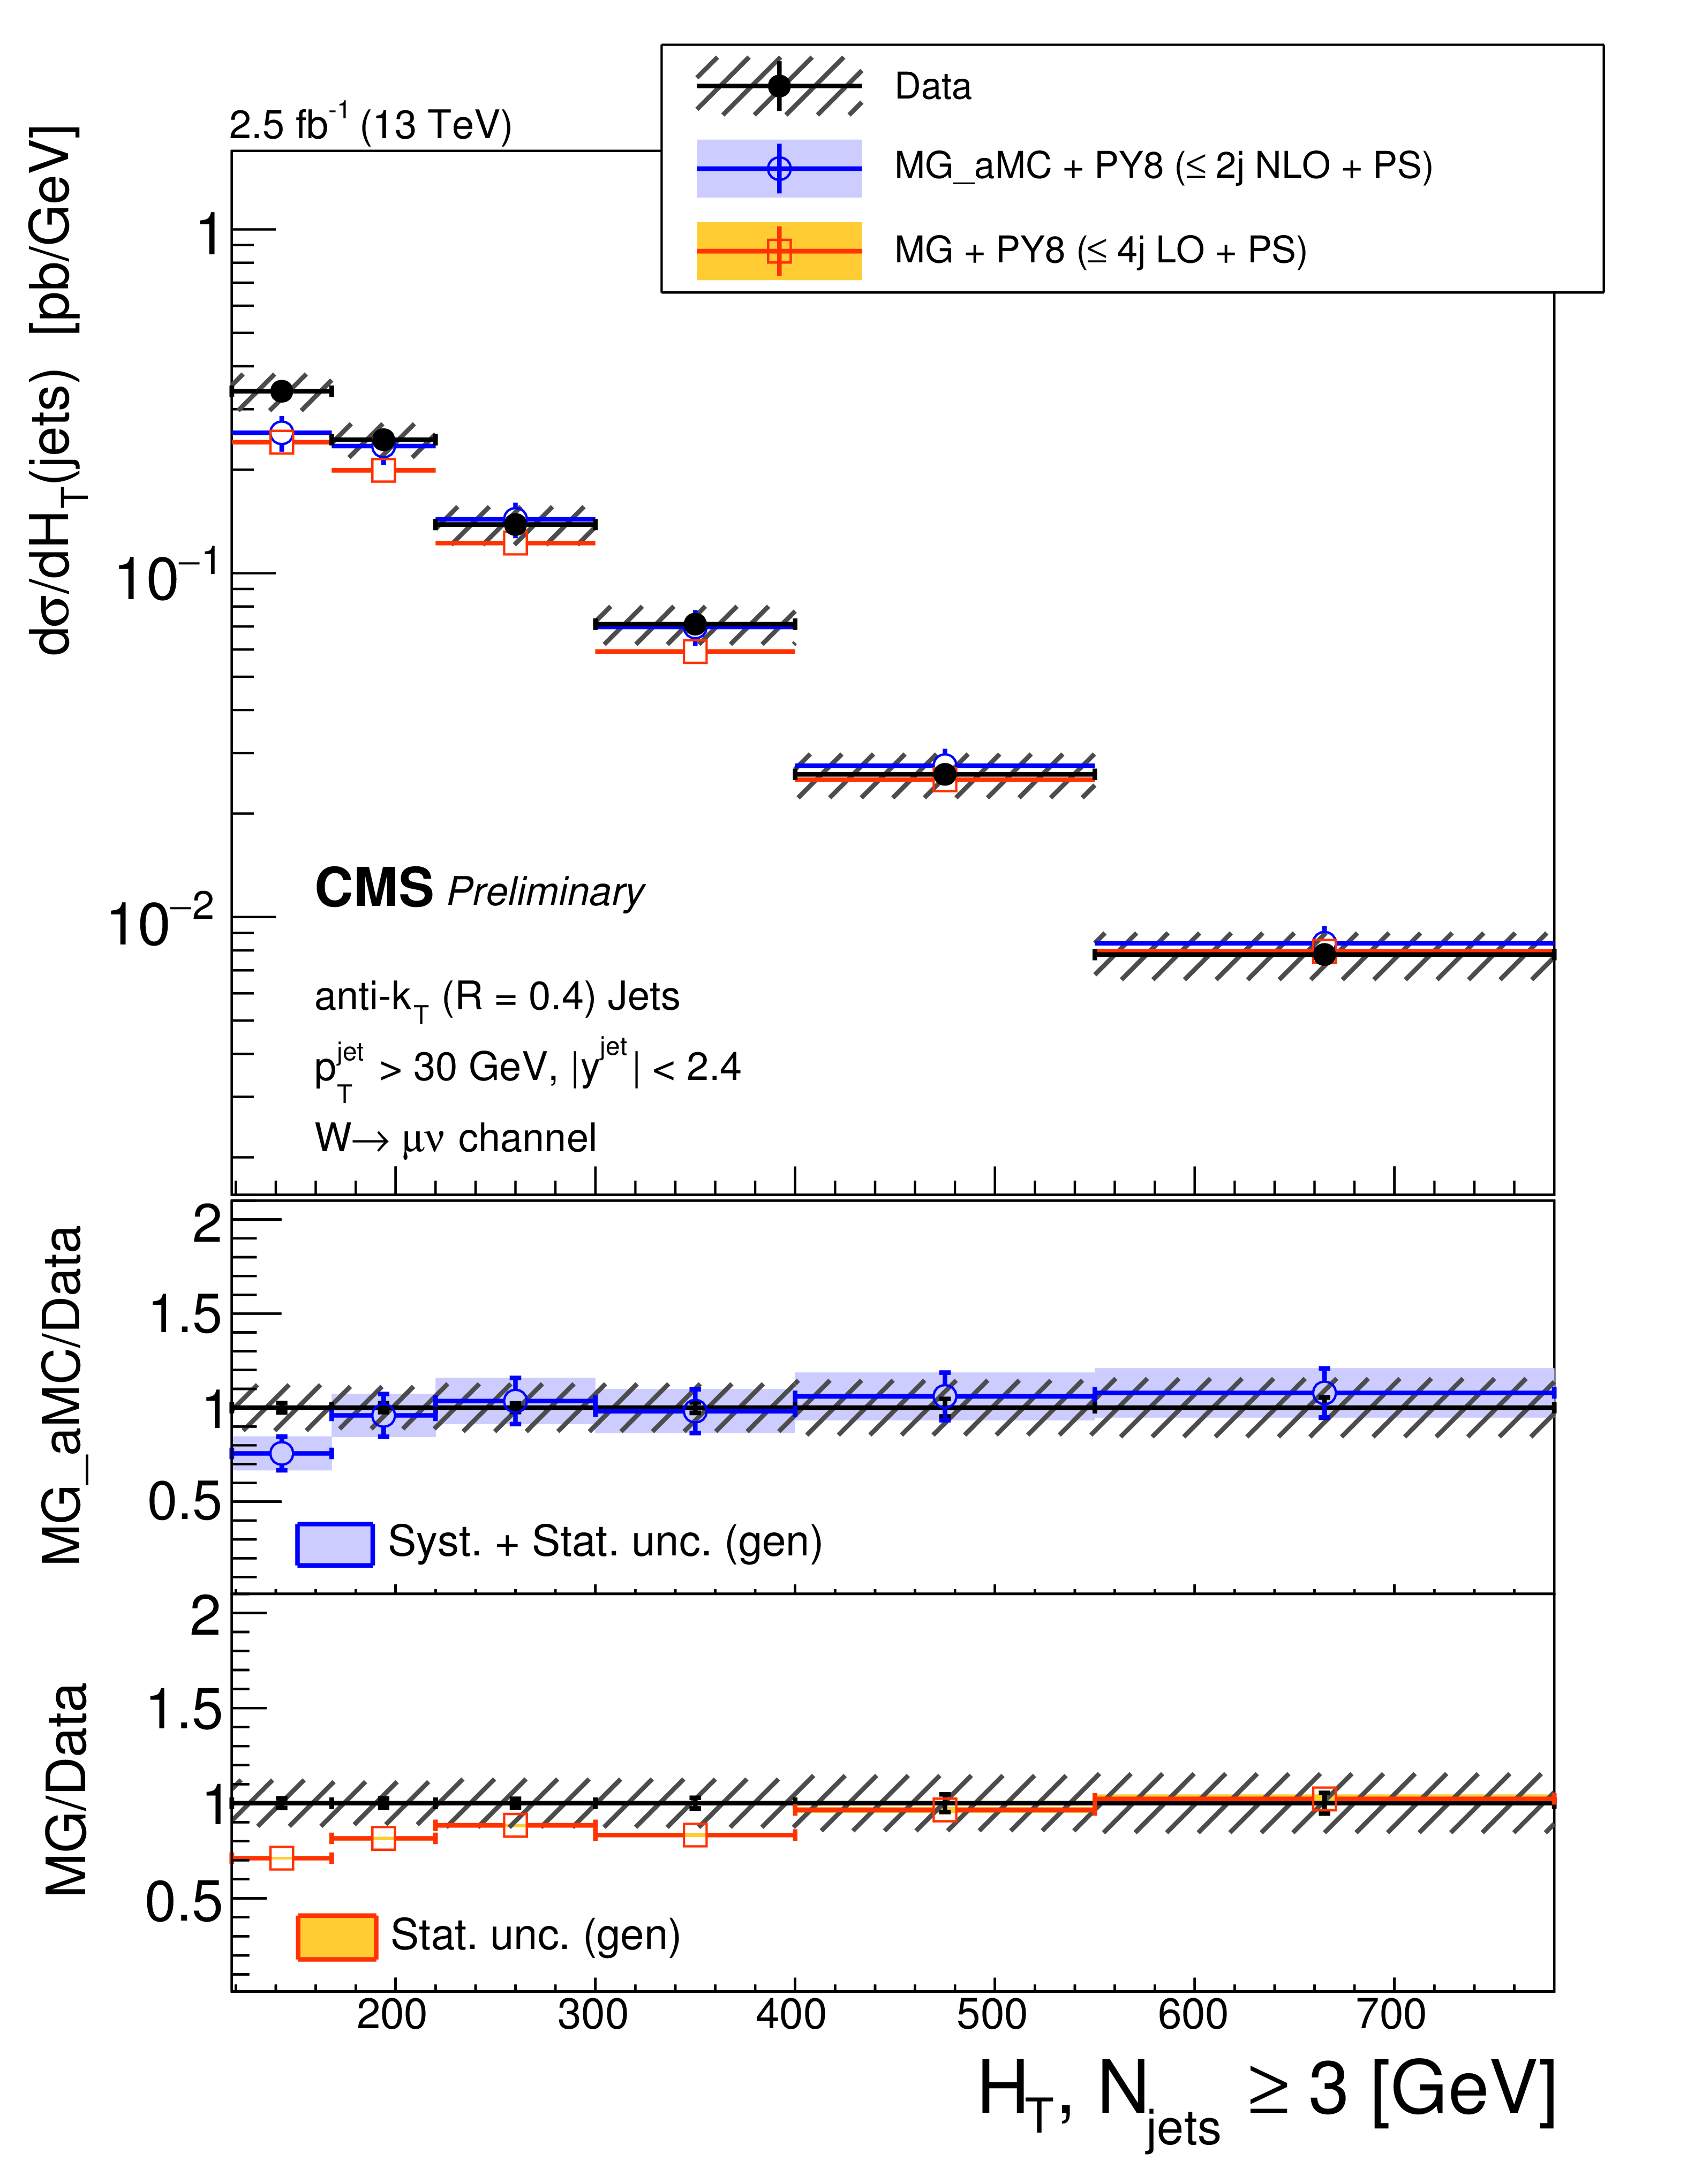
Figure 9-c:
The differential cross section measurement for $ {H_{\mathrm {T}}} $ for inclusive jet multiplicities 1-3, compared to the predictions of MG-aMC FxFx and MG-aMC, where latter denoted as MG in the legends. The NNLO prediction for W+1-jet is included in the jets $ {H_{\mathrm {T}}} $ for one inclusive jet. Black circular markers with the grey hatched band represent the unfolded data measurement and total experimental uncertainty. MG-aMC is given only with its statistical uncertainty. Color filled bands around MG-aMC FxFx and NNLO predictions represent their theoretical uncertainties incuding both statistical and systematical uncertainties. The lower panels show the ratio of the prediction to the unfolded data. |
| Tables | |

png pdf |
Table 1:
Number of events in data and simulation as a function of the exclusive jet multiplicity after the implementation of b tag veto. QCD background is estimated using a data-driven method. The diboson samples (WW, WZ, and ZZ) are represented by VV. |
| Summary |
| The first measurement of the differential cross sections for a W boson produced in association with jets in proton-proton collisions at a centre-of-mass energy of 13 TeV is presented. The collisions data used correspond to an integrated luminosity of 2.5 fb$^{-1}$ with 25 ns bunch crossing and were collected with the CMS detector during 2015 at the LHC. The differential cross sections are measured using the muon decay mode of the W boson as a function of the exclusive and the inclusive jet multiplicities up to a multiplicity of five, the jet $p_{\mathrm{T}}$ and rapidity $|y|$ for the three leading jets, and the jet $H_{\mathrm{T}}$ for a multiplicity up to at least three jets. The data distributions are corrected for all detector effects by means of regularised unfolding and compared with the particle level predictions by MG-aMC FxFx at NLO accuracy and by MG-aMC tree level at LO accuracy. The measured data is compared with a calculation at NNLO accuracy for W+1-jet production. The predictions are able to describe data well on the exclusive and inclusive jet multiplicities within the uncertainties. The predictions are in good agreement with data on the jet $p_{\mathrm{T}}$ spectra. The jet $|y|$ and $H_{\mathrm{T}}$ spectra are well modeled by both MG-aMC FxFx merged NLO prediction for all inclusive jet multiplicities and NNLO calculation for one inclusive jet. Overall, MG-aMC tree level slightly underestimates data on the observables. |
| References | ||||
| 1 | CMS Collaboration | Differential cross section measurements for the production of a W boson in association with jets in proton–proton collisions at $ \sqrt s=7 $ TeV | PLB741 (2015) 12--37 | CMS-SMP-12-023 1406.7533 |
| 2 | CMS Collaboration | Differential cross section measurements of W bosons produced in association with jets in proton-proton collisions at $ \sqrt{s}=8 $ TeV | ||
| 3 | CMS Collaboration | The CMS experiment at the CERN LHC | JINST 3 (2008) S08004 | CMS-00-001 |
| 4 | GEANT4 Collaboration | GEANT4: A Simulation toolkit | NIMA506 (2003) 250--303 | |
| 5 | J. Alwall et al. | The automated computation of tree-level and next-to-leading order differential cross sections, and their matching to parton shower simulations | JHEP 07 (2014) 079 | 1405.0301 |
| 6 | R. Frederix and S. Frixione | Merging meets matching in MC@NLO | JHEP 12 (2012) 061 | 1209.6215 |
| 7 | P. Nason | A New method for combining NLO QCD with shower Monte Carlo algorithms | JHEP 11 (2004) 040 | hep-ph/0409146 |
| 8 | S. Frixione, P. Nason, and C. Oleari | Matching NLO QCD computations with Parton Shower simulations: the POWHEG method | JHEP 11 (2007) 070 | 0709.2092 |
| 9 | S. Alioli, P. Nason, C. Oleari, and E. Re | A general framework for implementing NLO calculations in shower Monte Carlo programs: the POWHEG BOX | JHEP 06 (2010) 043 | 1002.2581 |
| 10 | S. Alioli, P. Nason, C. Oleari, and E. Re | NLO single-top production matched with shower in POWHEG: s- and t-channel contributions | JHEP 09 (2009) 111, , [Erratum: JHEP02,011(2010)] | 0907.4076 |
| 11 | T. Melia, P. Nason, R. Rontsch, and G. Zanderighi | W+W-, WZ and ZZ production in the POWHEG BOX | JHEP 11 (2011) 078 | 1107.5051 |
| 12 | T. Sjostrand, S. Mrenna, and P. Z. Skands | A Brief Introduction to PYTHIA 8.1 | CPC 178 (2008) 852--867 | 0710.3820 |
| 13 | CMS Collaboration | Event generator tunes obtained from underlying event and multiparton scattering measurements | EPJC76 (2016), no. 3, 155 | CMS-GEN-14-001 1512.00815 |
| 14 | J. M. Campbell and R. K. Ellis | MCFM for the Tevatron and the LHC | NPPS 205-206 (2010) 10--15 | 1007.3492 |
| 15 | R. Gavin, Y. Li, F. Petriello, and S. Quackenbush | W Physics at the LHC with FEWZ 2.1 | CPC 184 (2013) 208--214 | 1201.5896 |
| 16 | J. Alwall et al. | MadGraph 5 : Going Beyond | JHEP 06 (2011) 128 | 1106.0522 |
| 17 | J. Pumplin et al. | New generation of parton distributions with uncertainties from global QCD analysis | JHEP 07 (2002) 012 | hep-ph/0201195 |
| 18 | J. Alwall et al. | Comparative study of various algorithms for the merging of parton showers and matrix elements in hadronic collisions | EPJC53 (2008) 473--500 | 0706.2569 |
| 19 | J. Alwall, S. de Visscher, and F. Maltoni | QCD radiation in the production of heavy colored particles at the LHC | JHEP 02 (2009) 017 | 0810.5350 |
| 20 | NNPDF Collaboration | Parton distributions for the LHC Run II | JHEP 04 (2015) 040 | 1410.8849 |
| 21 | R. D. Ball et al. | A first unbiased global NLO determination of parton distributions and their uncertainties | Nucl. Phys. B838 (2010) 136--206 | 1002.4407 |
| 22 | R. D. Ball et al. | Impact of Heavy Quark Masses on Parton Distributions and LHC Phenomenology | Nucl. Phys. B849 (2011) 296--363 | 1101.1300 |
| 23 | R. Boughezal, C. Focke, X. Liu, and F. Petriello | $ W $-boson production in association with a jet at next-to-next-to-leading order in perturbative QCD | PRL 115 (2015), no. 6, 062002 | 1504.02131 |
| 24 | R. Boughezal, X. Liu, and F. Petriello | W-boson plus jet differential distributions at NNLO in QCD | 1602.06965 | |
| 25 | S. Dulat et al. | New parton distribution functions from a global analysis of quantum chromodynamics | PRD93 (2016), no. 3, 033006 | 1506.07443 |
| 26 | CMS Collaboration | Particle-Flow Event Reconstruction in CMS and Performance for Jets, Taus, and MET | CDS | |
| 27 | CMS Collaboration | Commissioning of the Particle-flow Event Reconstruction with the first LHC collisions recorded in the CMS detector | CDS | |
| 28 | CMS Collaboration | Performance of CMS muon reconstruction in $ pp $ collision events at $ \sqrt{s}=7 $ TeV | JINST 7 (2012) P10002 | CMS-MUO-10-004 1206.4071 |
| 29 | CMS Collaboration | Performance of muon identification in pp collisions at $ \sqrt{s}=7 $ TeV | CDS | |
| 30 | CMS Collaboration | Commissioning of the Particle-Flow reconstruction in Minimum-Bias and Jet Events from pp Collisions at 7 TeV | CDS | |
| 31 | M. Cacciari, G. P. Salam, and G. Soyez | The Anti-k(t) jet clustering algorithm | JHEP 04 (2008) 063 | 0802.1189 |
| 32 | CMS Collaboration | Jet energy scale and resolution in the CMS experiment in pp collisions at 8 TeV | CMS-JME-13-004 1607.03663 |
|
| 33 | CMS Collaboration | Pileup Jet Identification | CMS-PAS-JME-13-005 | CMS-PAS-JME-13-005 |
| 34 | CMS Collaboration | Identification of b quark jets at the CMS Experiment in the LHC Run 2 | CMS-PAS-BTV-15-001 | CMS-PAS-BTV-15-001 |
| 35 | G. D'Agostini | A Multidimensional unfolding method based on Bayes' theorem | NIMA362 (1995) 487--498 | |
| 36 | W. H. Richardson | Bayesian-Based Iterative Method of Image Restoration | J. Opt. Soc. Am. 62 (1972), no. 1, 55--59 | |
| 37 | L. B. Lucy | An iterative technique for the rectification of observed distributions | Astron. J. 79 (1974), no. 6, 745--754 | |
| 38 | T. Adye | Unfolding algorithms and tests using RooUnfold | in Proceedings of the PHYSTAT 2011 Workshop, CERN, Geneva, Switzerland, January 2011, CERN-2011-006, pp 313-318, pp. 313--318 2011 | 1105.1160 |
| 39 | CMS Collaboration | CMS Luminosity Based on Pixel Cluster Counting - Summer 2013 Update | CMS-PAS-LUM-13-001 | CMS-PAS-LUM-13-001 |
| 40 | S. Gangal and F. J. Tackmann | Next-to-leading-order uncertainties in Higgs+2 jets from gluon fusion | PRD87 (2013), no. 9, 093008 | 1302.5437 |
| 41 | I. W. Stewart and F. J. Tackmann | Theory Uncertainties for Higgs and Other Searches Using Jet Bins | PRD85 (2012) 034011 | 1107.2117 |
|
|
Compact Muon Solenoid LHC, CERN |
|

|

|

|

|

|