

Compact Muon Solenoid
LHC, CERN
| CMS-PAS-SMP-16-008 | ||
| Determination of the strong coupling constant from the measurement of inclusive multijet event cross sections in pp collisions at $\sqrt{s} = $ 8 TeV | ||
| CMS Collaboration | ||
| February 2017 | ||
| Abstract: A measurement of inclusive multijet event cross sections is presented from proton-proton collisions recorded at $\sqrt{s} = $ 8 TeV with the CMS detector and corresponding to an integrated luminosity of 19.7 fb$^{-1}$. Jets are reconstructed with the anti-k$_t$ clustering algorithm for a jet size parameter $ R = $ 0.7 in a phase space region ranging up to jet transverse momenta $p_\mathrm{T}$ of 2.0 TeV and an absolute rapidity of $|y|= $ 2.5. The inclusive 2-jet and 3-jet event cross sections are measured as a function of the average $p_\mathrm{T}$ of the two leading jets. The data are well described by predictions at next-to-leading order in perturbative quantum chromodynamics and additionally are compared to several Monte Carlo event generators. The strong coupling constant at the scale of the Z boson mass is inferred from a fit of the ratio of the 3-jet over 2-jet event cross section giving $\alpha_s(M_{\mathrm{Z}}) = $ 0.1150 $\pm$ 0.0010 (exp) $\pm$ 0.0013 (PDF) $\pm$ 0.0015 (NP) $^{+0.0050}_{-0.0000}$ (scale). | ||
| Links: CDS record (PDF) ; inSPIRE record ; CADI line (restricted) ; | ||
| Figures | |

png pdf |
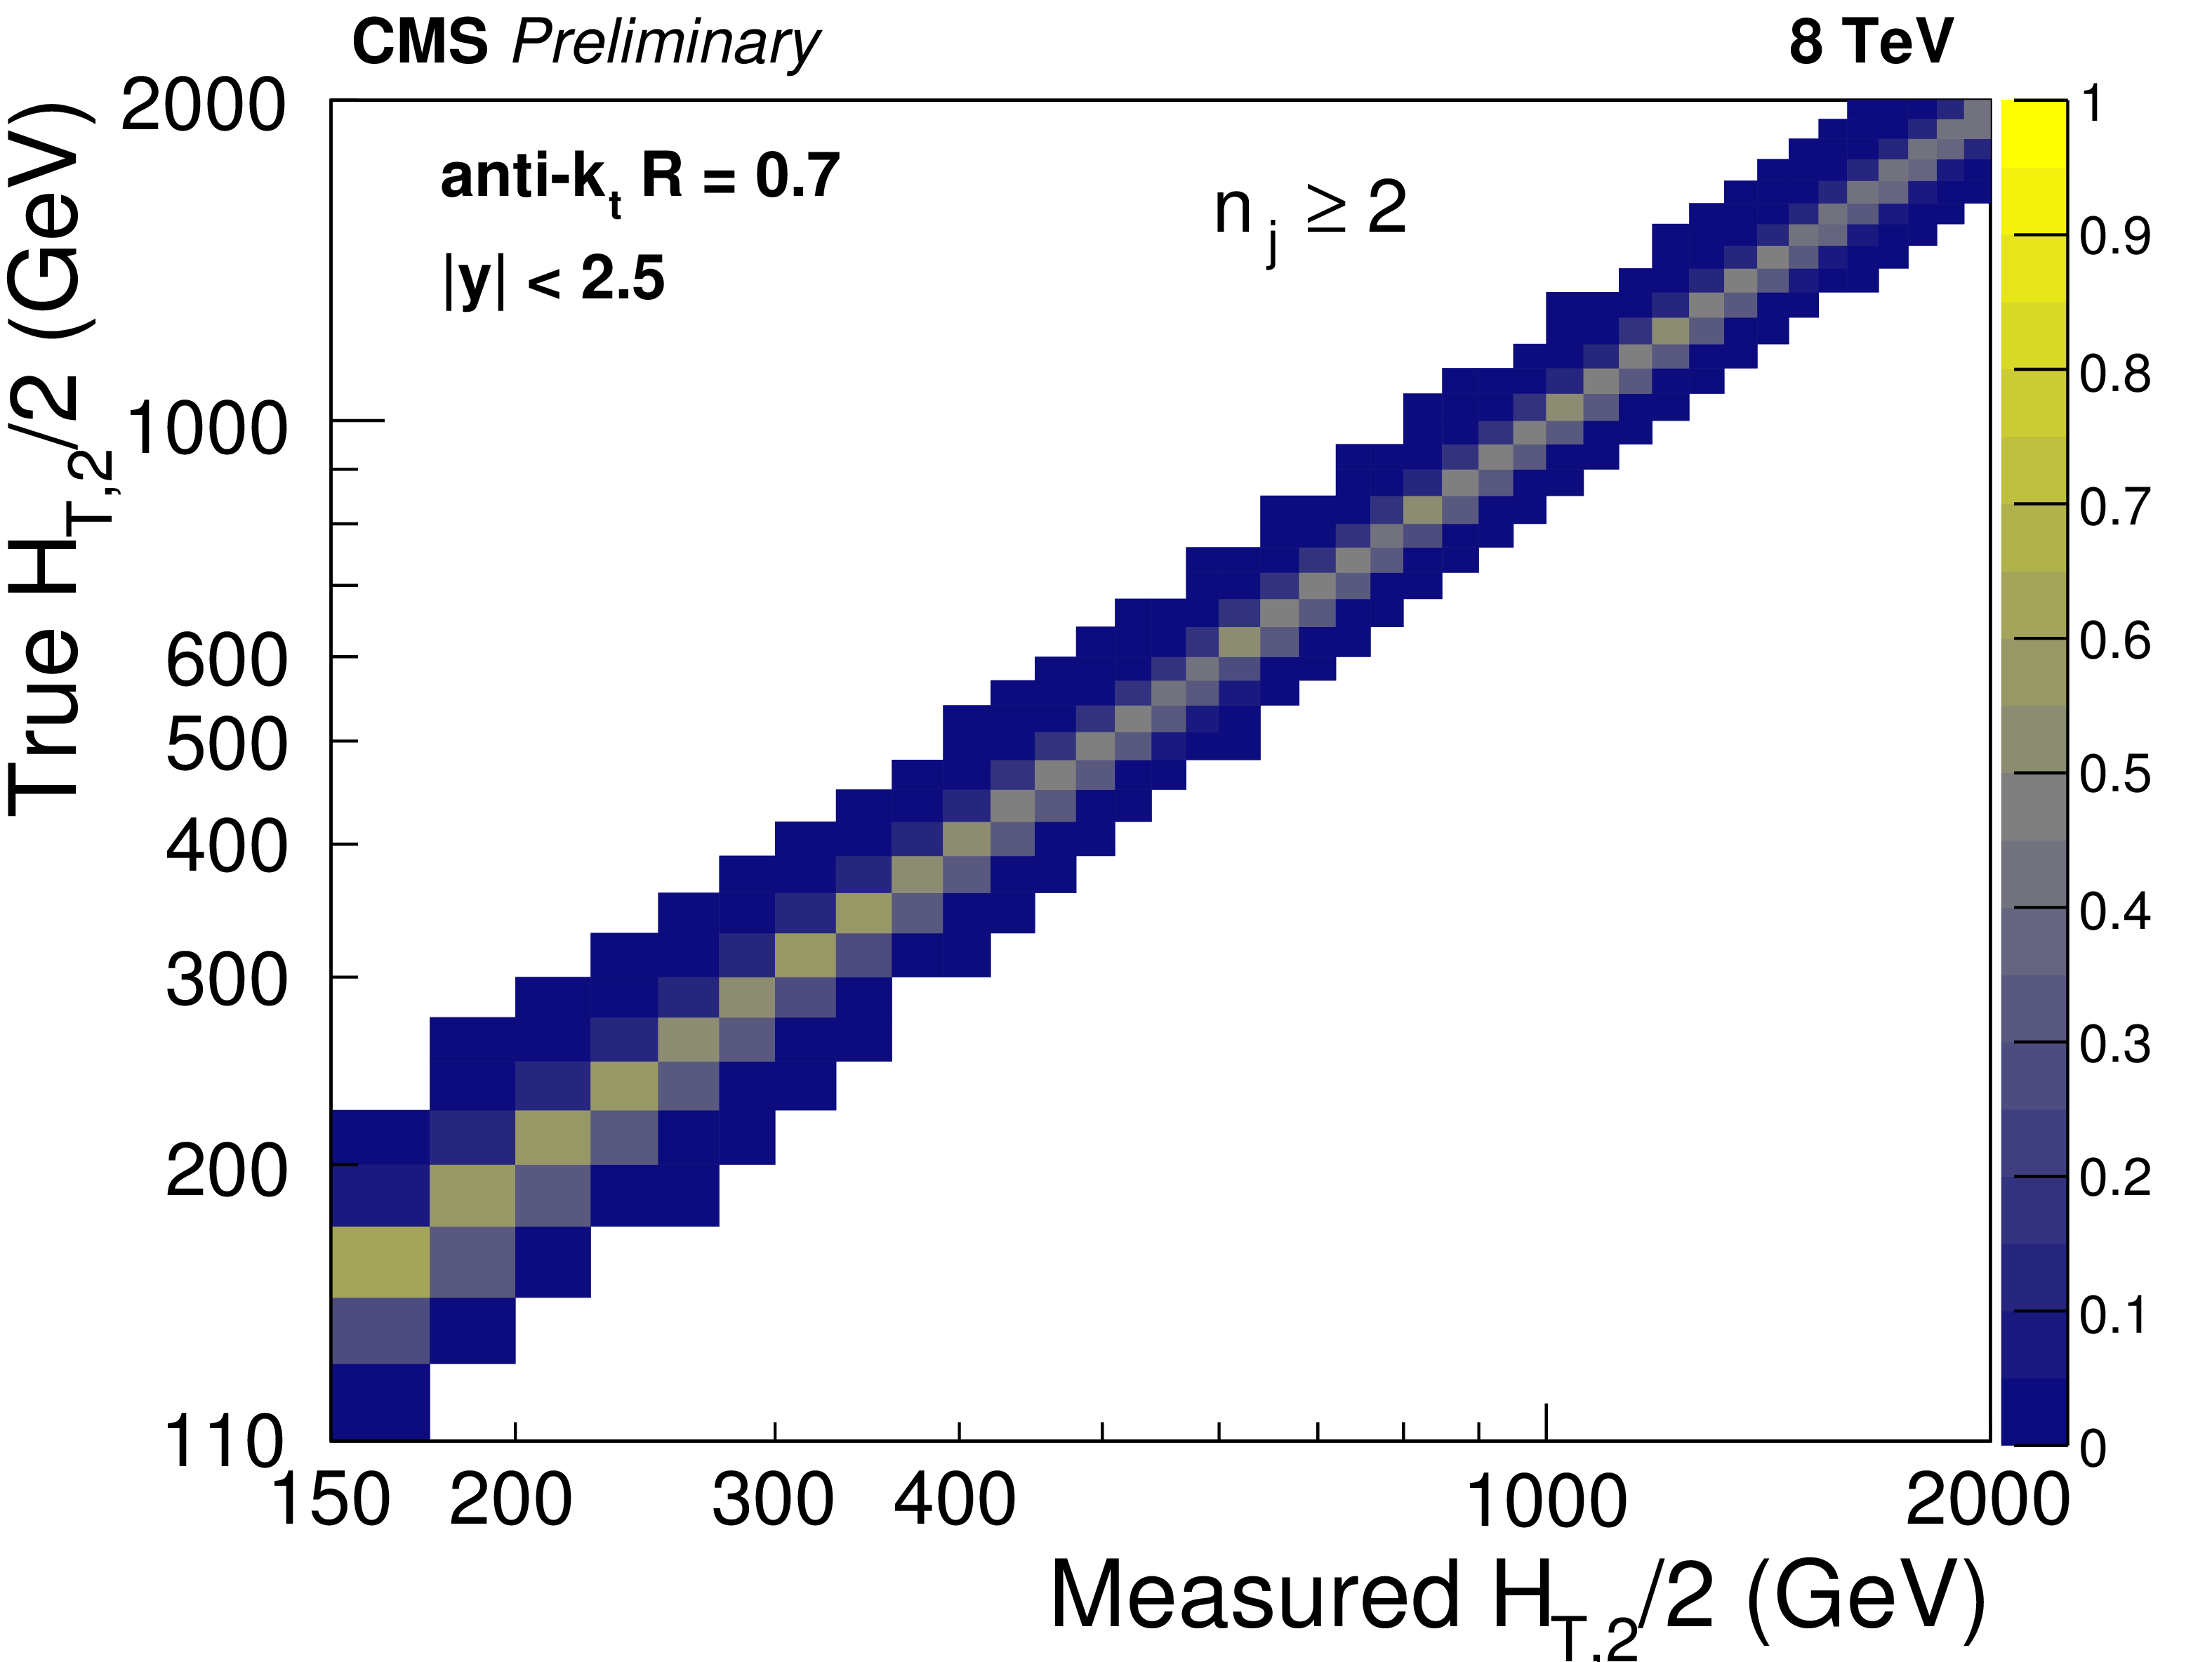
Figure 1:
Response matrices derived using a Toy MC procedure for the inclusive 2-jet (left) and 3-jet event samples (right). |
png pdf |
Figure 1-a:
Response matrices derived using a Toy MC procedure for the inclusive 2-jet (left) and 3-jet event samples (right). |

png pdf |
Figure 1-b:
Response matrices derived using a Toy MC procedure for the inclusive 2-jet (left) and 3-jet event samples (right). |
png pdf |
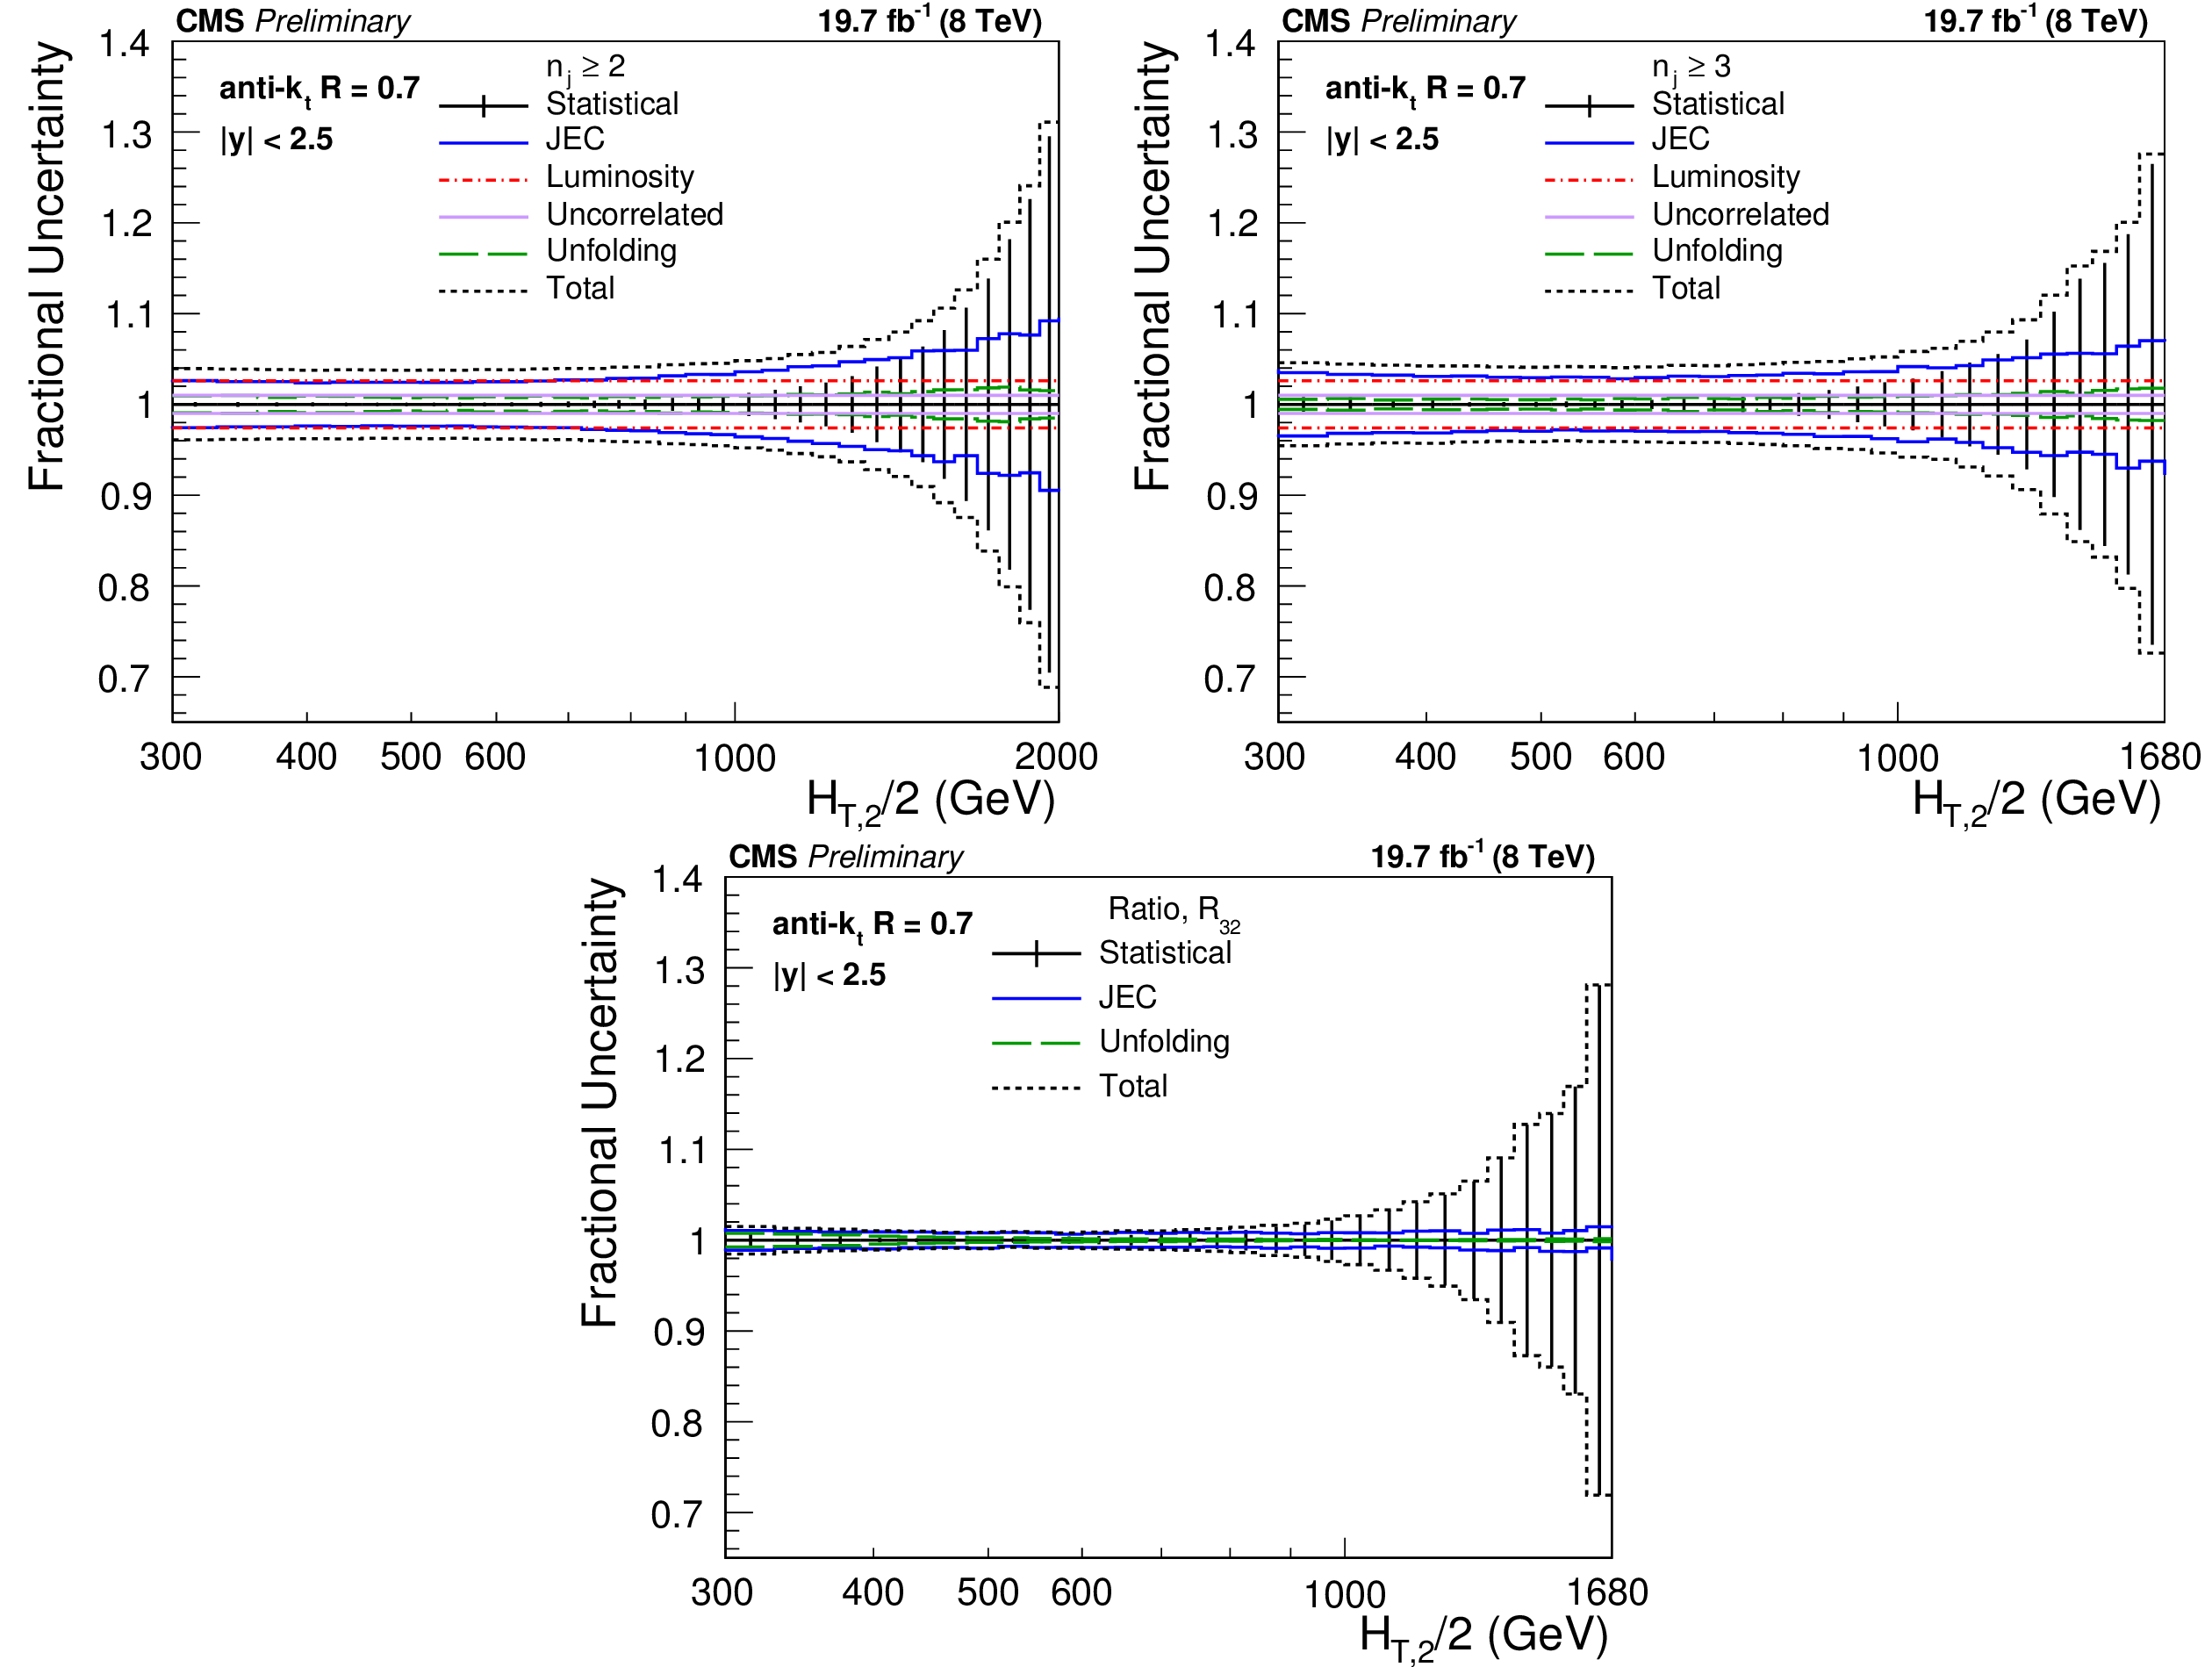
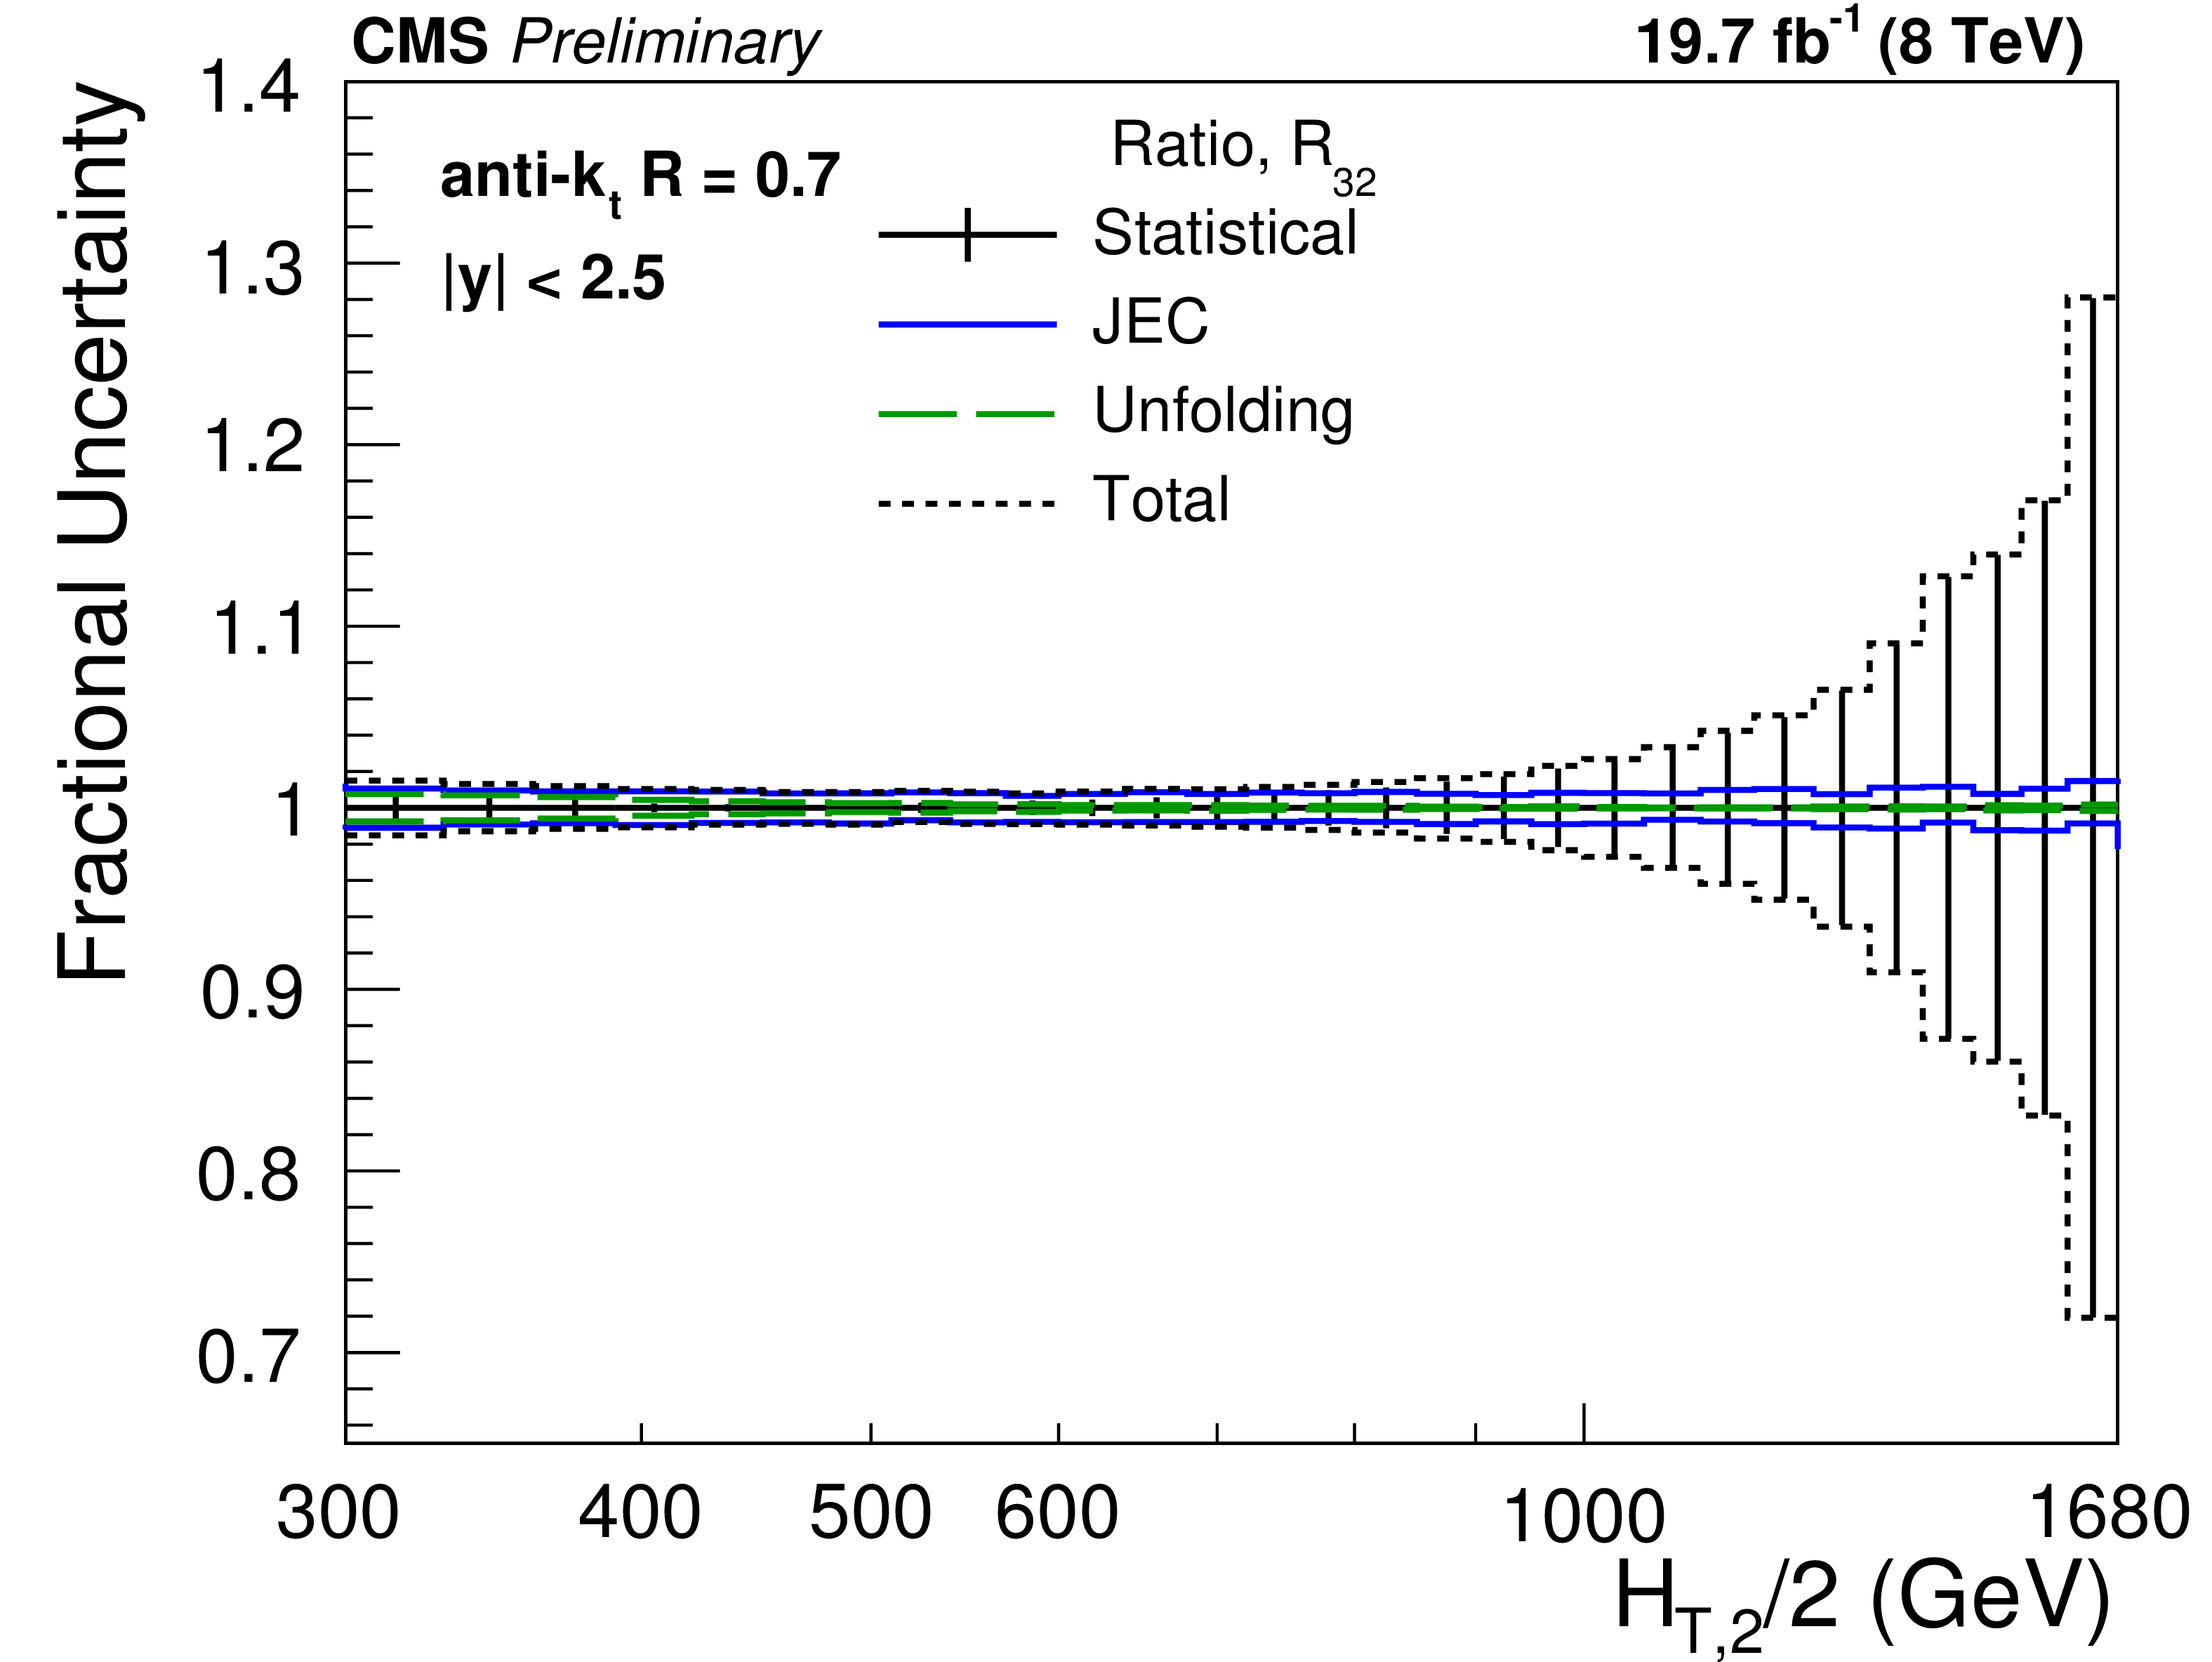
Figure 2:
Overview of all experimental uncertainties affecting the inclusive 2-jet (top left) and 3-jet event cross sections (top right) and their ratio ${R_{32}}$ (bottom). The error bars indicate the statistical uncertainty after unfolding. The colored lines represent the systematic uncertainties resulting from JEC, the luminosity, residual effects, and the unfolding including JER effects. Uncertainties due to luminosity and residual effects are cancelled completely in the ratio. The total experimental uncertainty, indicated by dashed black lines, is calculated by adding in quadrature all the sources of uncertainty. |

png pdf |
Figure 2-a:
Overview of all experimental uncertainties affecting the inclusive 2-jet (top left) and 3-jet event cross sections (top right) and their ratio ${R_{32}}$ (bottom). The error bars indicate the statistical uncertainty after unfolding. The colored lines represent the systematic uncertainties resulting from JEC, the luminosity, residual effects, and the unfolding including JER effects. Uncertainties due to luminosity and residual effects are cancelled completely in the ratio. The total experimental uncertainty, indicated by dashed black lines, is calculated by adding in quadrature all the sources of uncertainty. |

png pdf |
Figure 2-b:
Overview of all experimental uncertainties affecting the inclusive 2-jet (top left) and 3-jet event cross sections (top right) and their ratio ${R_{32}}$ (bottom). The error bars indicate the statistical uncertainty after unfolding. The colored lines represent the systematic uncertainties resulting from JEC, the luminosity, residual effects, and the unfolding including JER effects. Uncertainties due to luminosity and residual effects are cancelled completely in the ratio. The total experimental uncertainty, indicated by dashed black lines, is calculated by adding in quadrature all the sources of uncertainty. |
png pdf |
Figure 2-c:
Overview of all experimental uncertainties affecting the inclusive 2-jet (top left) and 3-jet event cross sections (top right) and their ratio ${R_{32}}$ (bottom). The error bars indicate the statistical uncertainty after unfolding. The colored lines represent the systematic uncertainties resulting from JEC, the luminosity, residual effects, and the unfolding including JER effects. Uncertainties due to luminosity and residual effects are cancelled completely in the ratio. The total experimental uncertainty, indicated by dashed black lines, is calculated by adding in quadrature all the sources of uncertainty. |

png pdf |
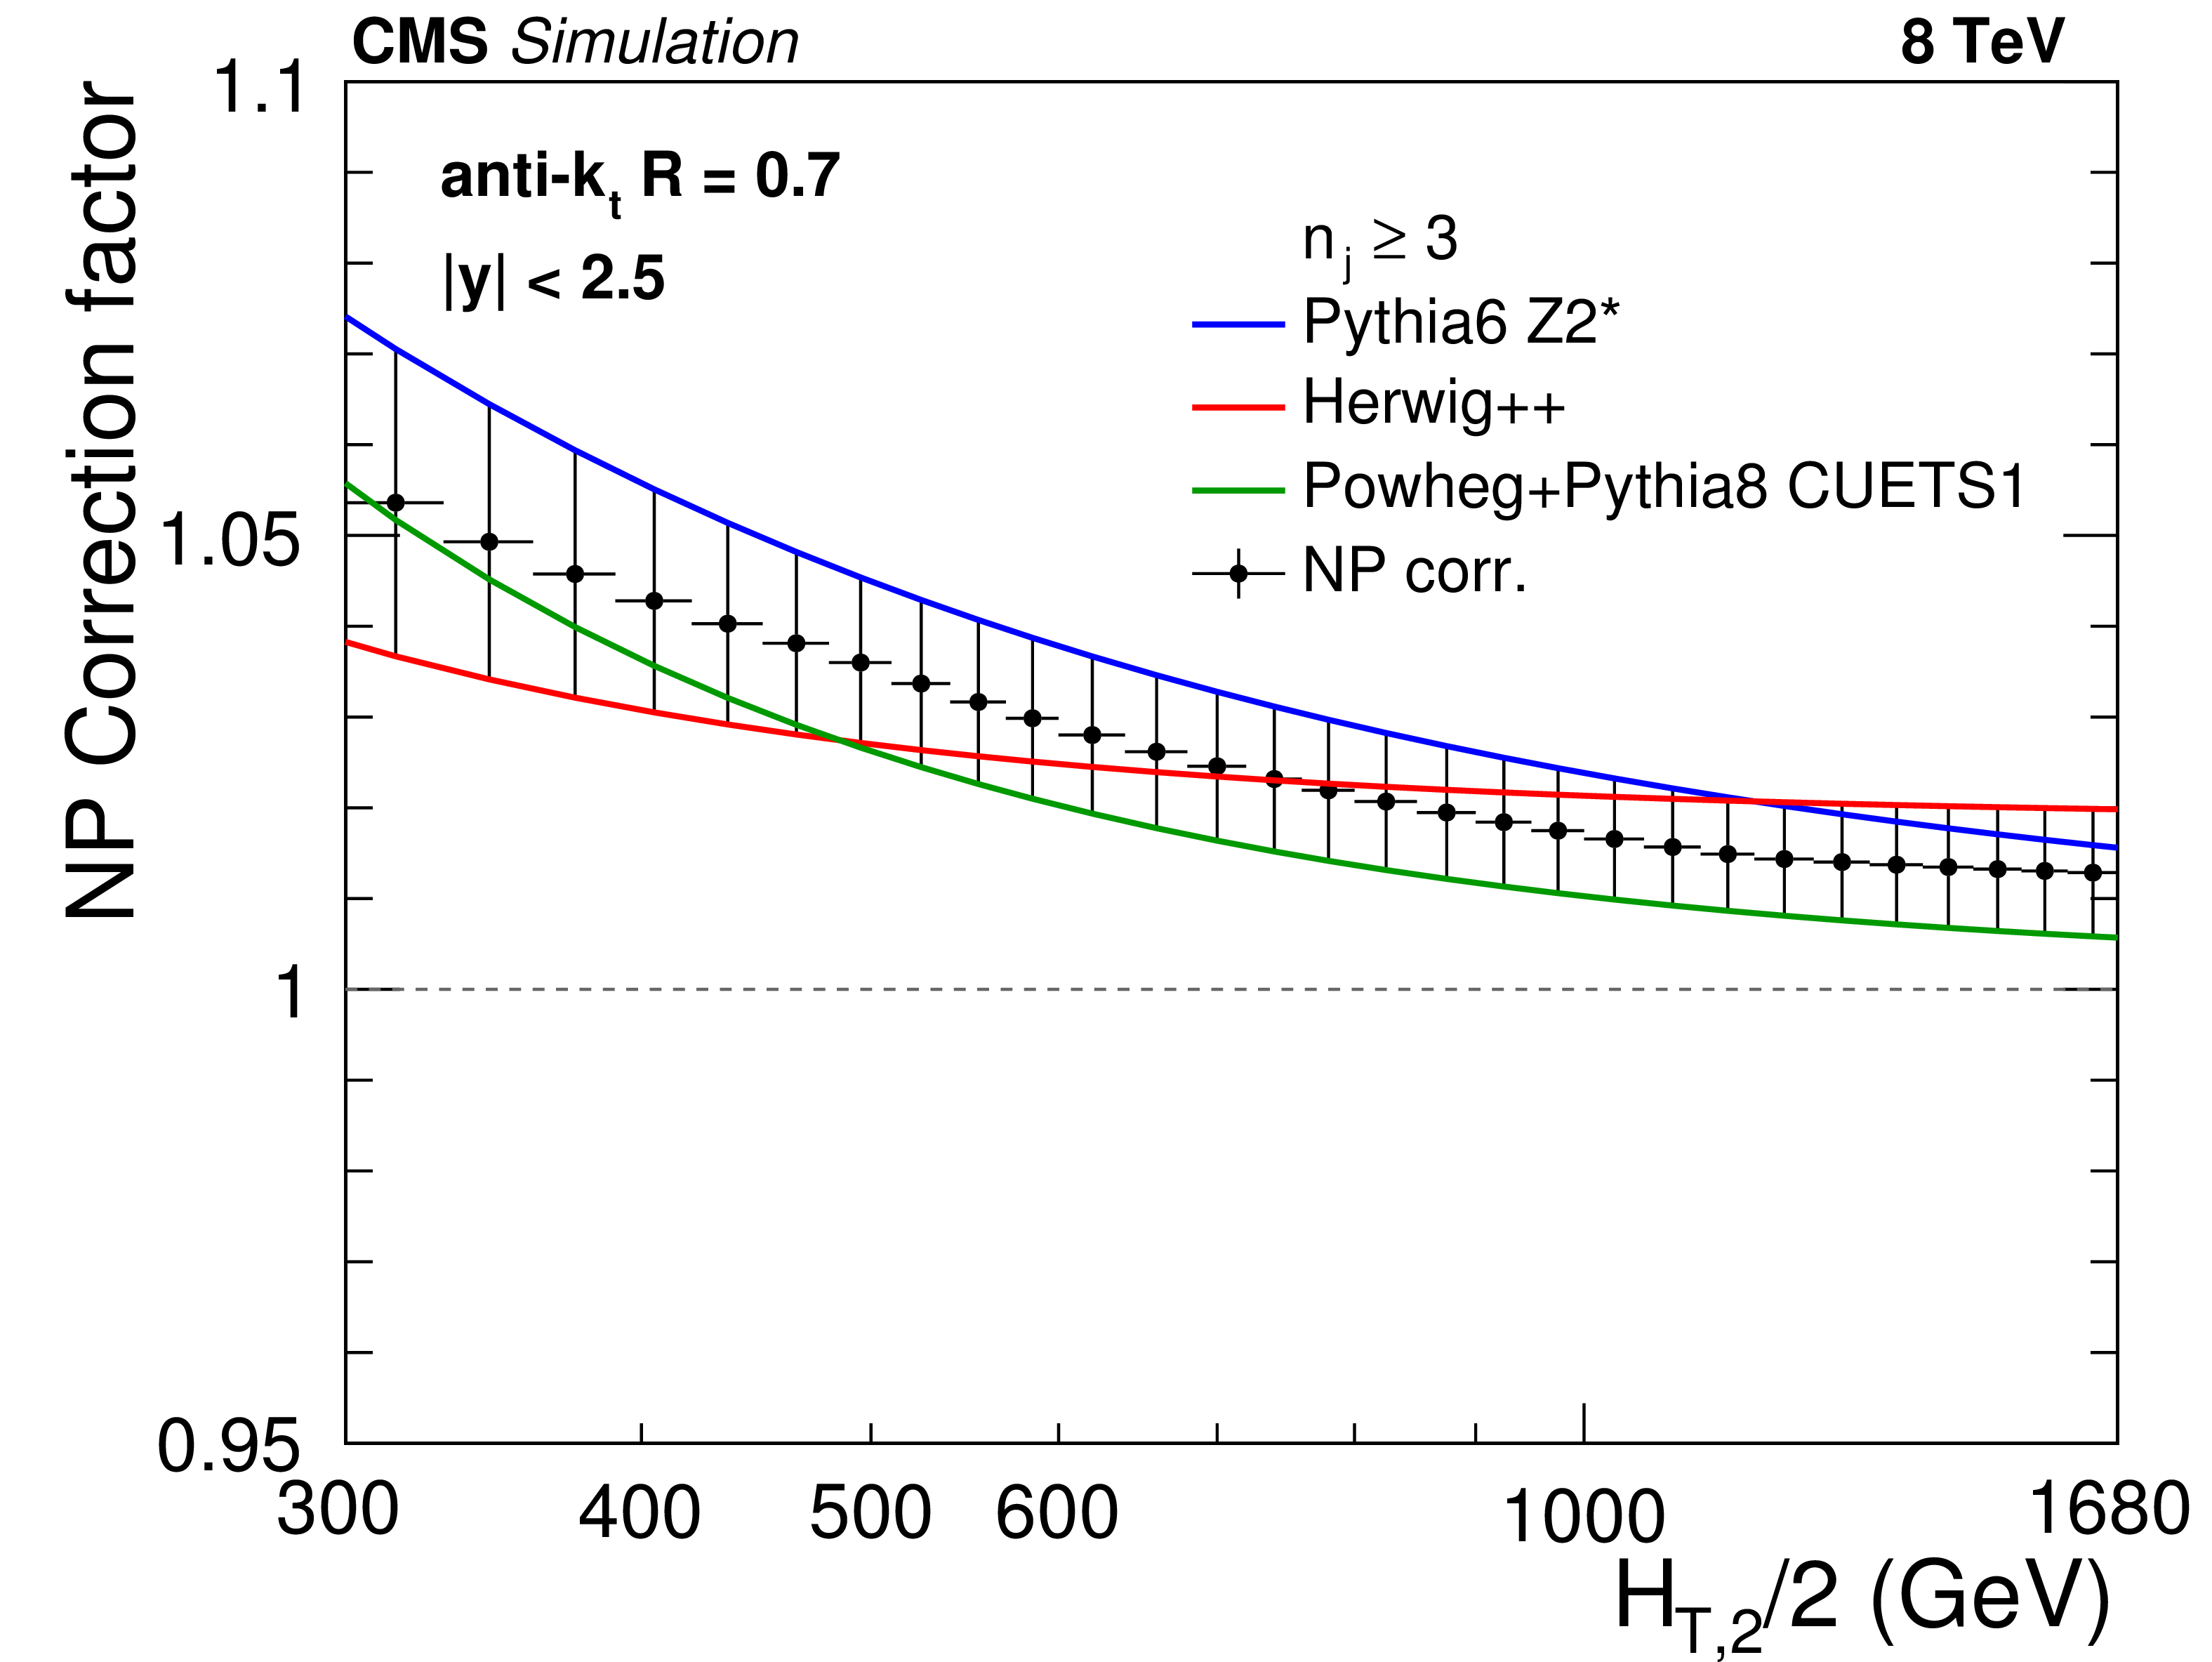
Figure 3:
Fits to the nonperturbative corrections obtained for inclusive 2-jet (top left) and 3-jet (top right) event cross sections and their ratio ${R_{32}}$ (bottom) as a function of ${H_{\mathrm {T,2}}/2} $ within $|y|< $ 2.5 for the three investigated MC event generators. |

png pdf |
Figure 3-a:
Fits to the nonperturbative corrections obtained for inclusive 2-jet (top left) and 3-jet (top right) event cross sections and their ratio ${R_{32}}$ (bottom) as a function of ${H_{\mathrm {T,2}}/2} $ within $|y|< $ 2.5 for the three investigated MC event generators. |
png pdf |
Figure 3-b:
Fits to the nonperturbative corrections obtained for inclusive 2-jet (top left) and 3-jet (top right) event cross sections and their ratio ${R_{32}}$ (bottom) as a function of ${H_{\mathrm {T,2}}/2} $ within $|y|< $ 2.5 for the three investigated MC event generators. |

png pdf |
Figure 3-c:
Fits to the nonperturbative corrections obtained for inclusive 2-jet (top left) and 3-jet (top right) event cross sections and their ratio ${R_{32}}$ (bottom) as a function of ${H_{\mathrm {T,2}}/2} $ within $|y|< $ 2.5 for the three investigated MC event generators. |

png pdf |
Figure 4:
Overview of theoretical uncertainties affecting the cross section prediction for inclusive 2-jet (top left) and 3-jet events (top right) and their ratio ${R_{32}}$ (bottom), using the CT10 PDF set. The total uncertainty is calculated by adding in quadrature the individual sources of uncertainty. The statistical uncertainties of the NLO computations are too small to be visible and are not shown. |

png pdf |
Figure 4-a:
Overview of theoretical uncertainties affecting the cross section prediction for inclusive 2-jet (top left) and 3-jet events (top right) and their ratio ${R_{32}}$ (bottom), using the CT10 PDF set. The total uncertainty is calculated by adding in quadrature the individual sources of uncertainty. The statistical uncertainties of the NLO computations are too small to be visible and are not shown. |

png pdf |
Figure 4-b:
Overview of theoretical uncertainties affecting the cross section prediction for inclusive 2-jet (top left) and 3-jet events (top right) and their ratio ${R_{32}}$ (bottom), using the CT10 PDF set. The total uncertainty is calculated by adding in quadrature the individual sources of uncertainty. The statistical uncertainties of the NLO computations are too small to be visible and are not shown. |

png pdf |
Figure 4-c:
Overview of theoretical uncertainties affecting the cross section prediction for inclusive 2-jet (top left) and 3-jet events (top right) and their ratio ${R_{32}}$ (bottom), using the CT10 PDF set. The total uncertainty is calculated by adding in quadrature the individual sources of uncertainty. The statistical uncertainties of the NLO computations are too small to be visible and are not shown. |
png pdf |
Figure 5:
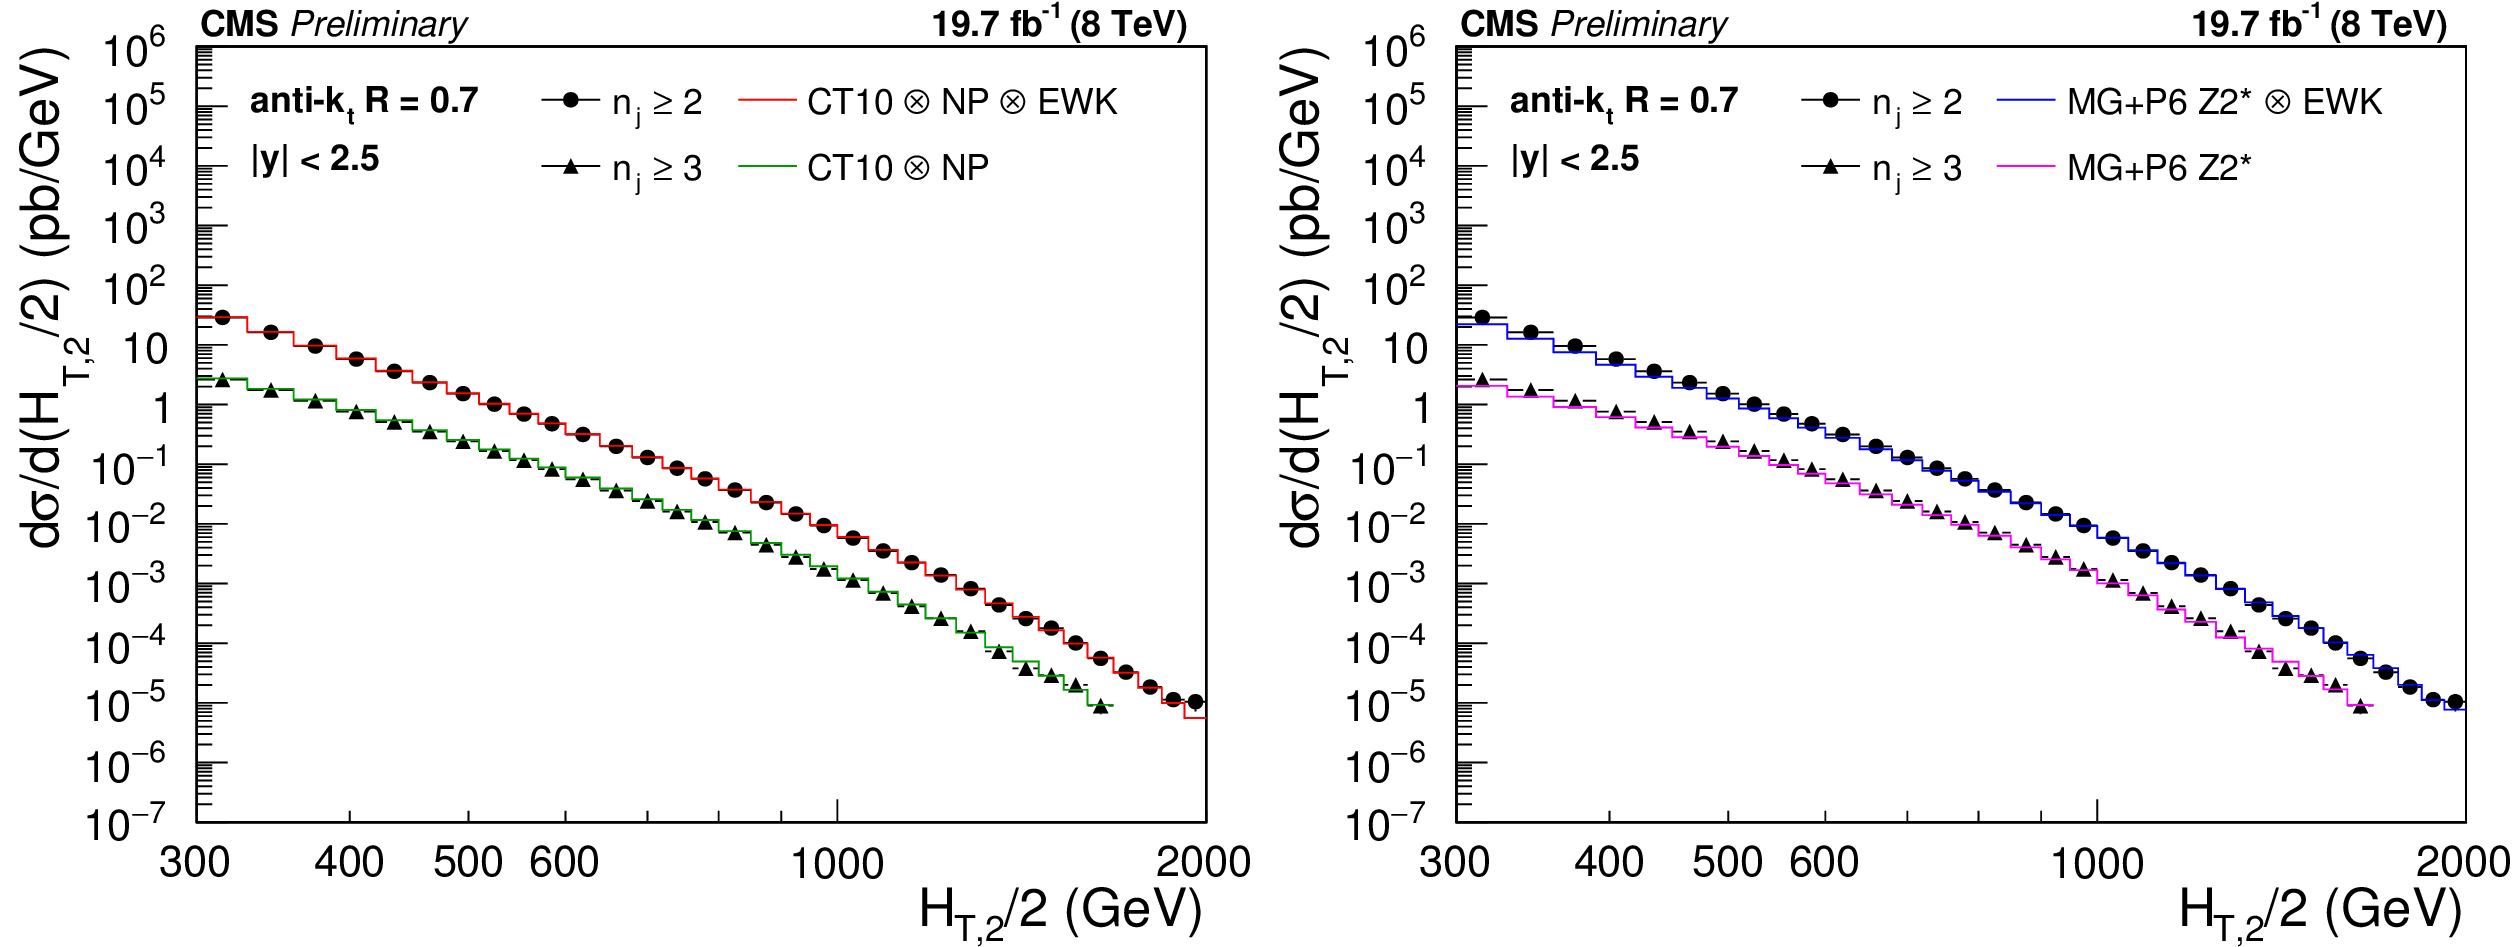
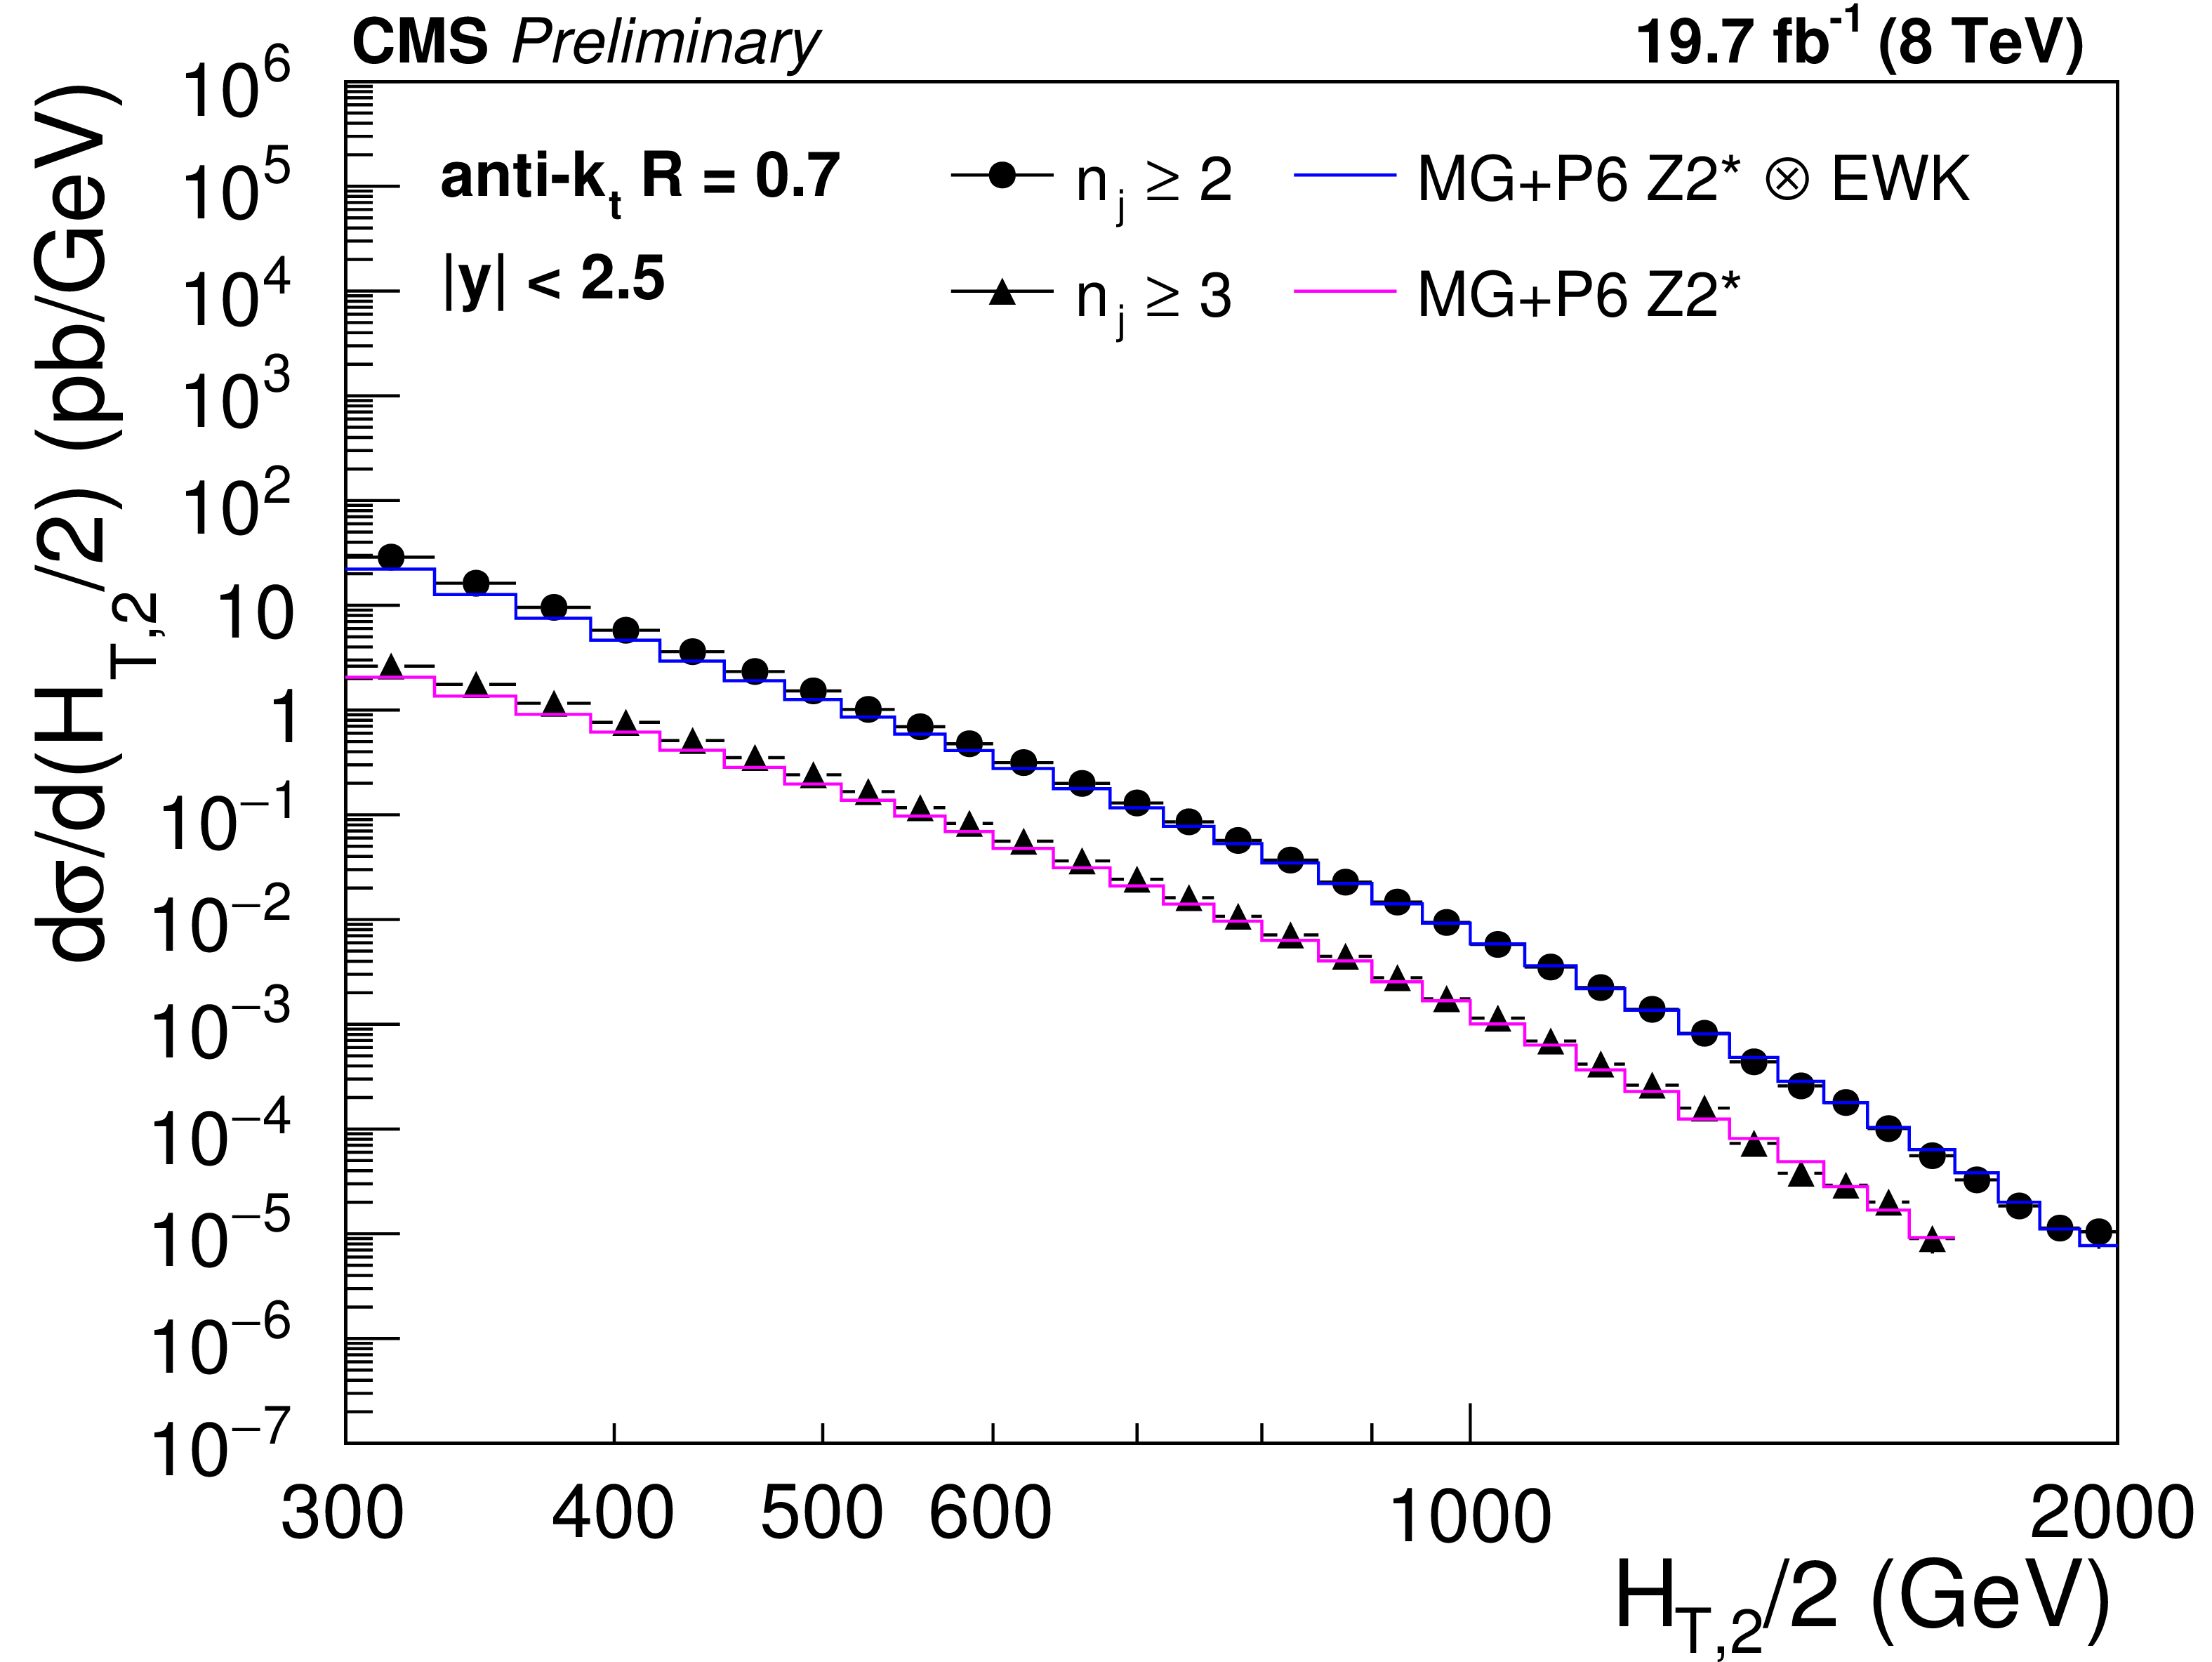
Comparison of the inclusive 2-jet and 3-jet event cross sections as a function of ${H_{\mathrm {T,2}}/2}$ to theoretical predictions. On the (left), the data (points) are shown together with NLOJet++ predictions (line) using the CT10 PDF set, corrected for NP and EWK (2-jet) or only NP effects (3-jet). On the (right), the data (points) are compared to predictions from MadGraph5+PYTHIA6 with tune ${\mathrm {Z2}^\star } $ (line), corrected for EWK effects in the 2-jet case. The error bars correspond to the total uncertainty, for which the statistical and systematic uncertainties are added in quadrature. |

png pdf |
Figure 5-a:
Comparison of the inclusive 2-jet and 3-jet event cross sections as a function of ${H_{\mathrm {T,2}}/2}$ to theoretical predictions. On the (left), the data (points) are shown together with NLOJet++ predictions (line) using the CT10 PDF set, corrected for NP and EWK (2-jet) or only NP effects (3-jet). On the (right), the data (points) are compared to predictions from MadGraph5+PYTHIA6 with tune ${\mathrm {Z2}^\star } $ (line), corrected for EWK effects in the 2-jet case. The error bars correspond to the total uncertainty, for which the statistical and systematic uncertainties are added in quadrature. |
png pdf |
Figure 5-b:
Comparison of the inclusive 2-jet and 3-jet event cross sections as a function of ${H_{\mathrm {T,2}}/2}$ to theoretical predictions. On the (left), the data (points) are shown together with NLOJet++ predictions (line) using the CT10 PDF set, corrected for NP and EWK (2-jet) or only NP effects (3-jet). On the (right), the data (points) are compared to predictions from MadGraph5+PYTHIA6 with tune ${\mathrm {Z2}^\star } $ (line), corrected for EWK effects in the 2-jet case. The error bars correspond to the total uncertainty, for which the statistical and systematic uncertainties are added in quadrature. |

png pdf |
Figure 6:
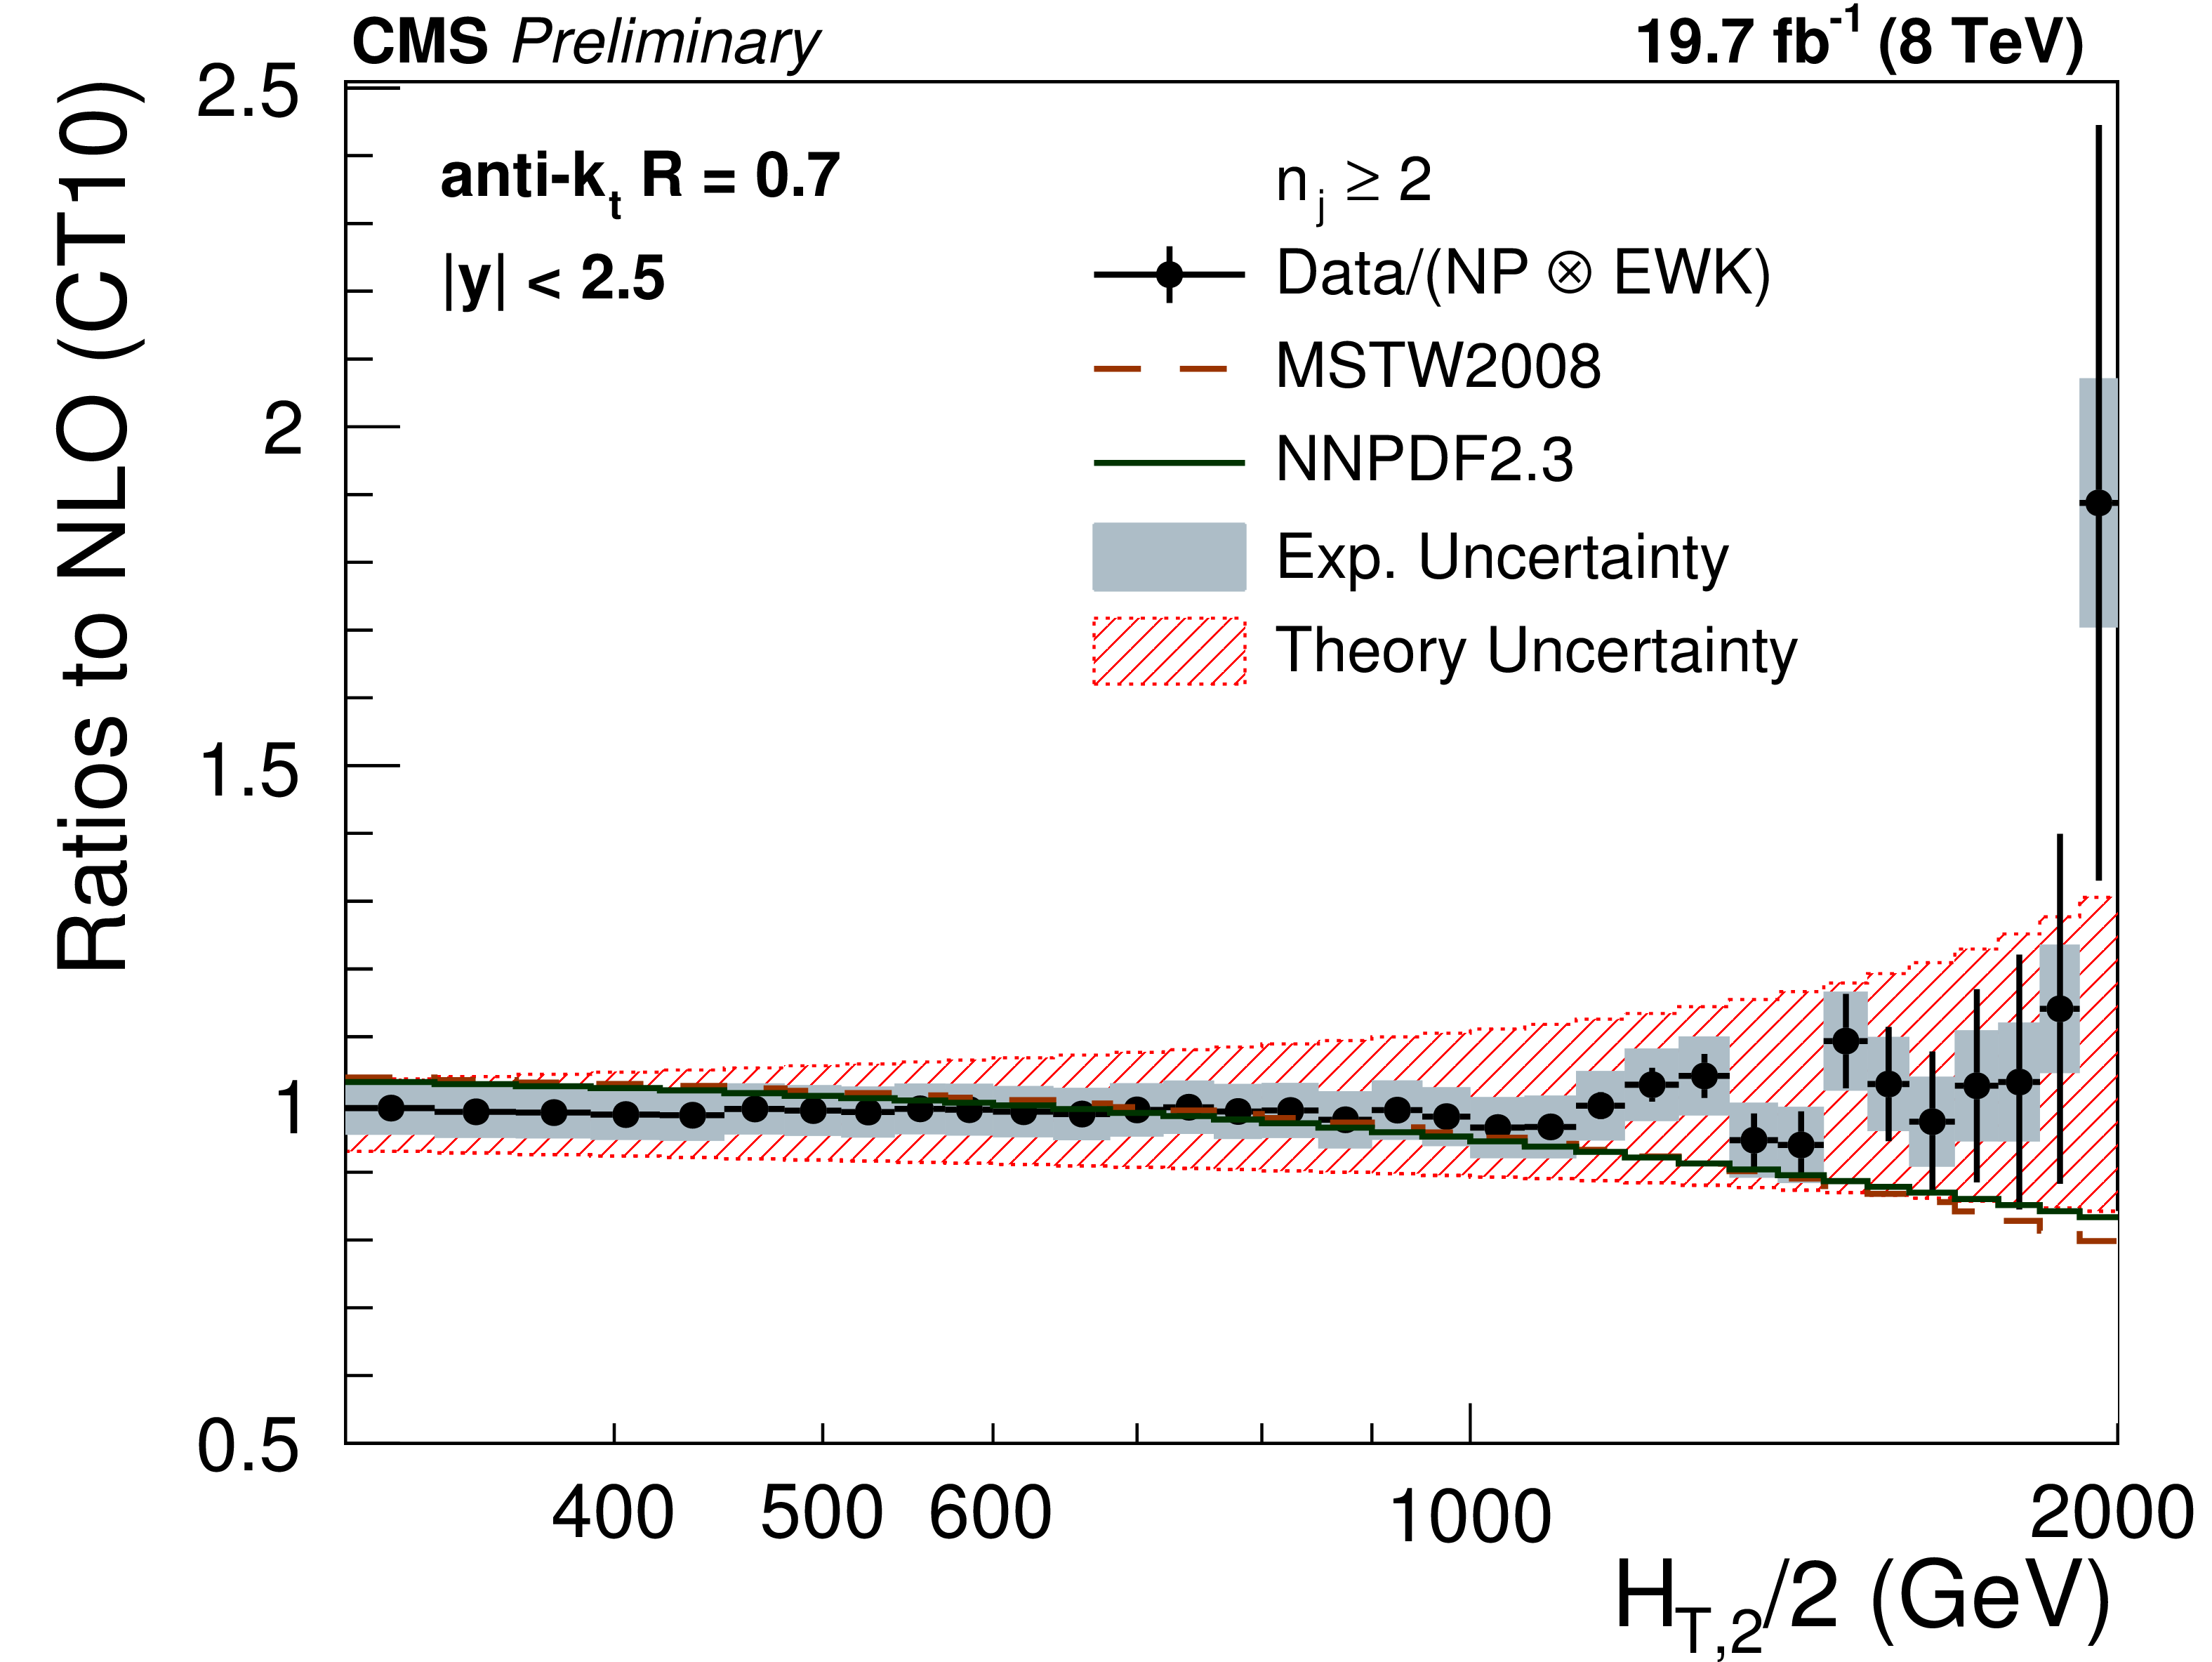
Ratio of data over theory using the CT10 PDF set for inclusive 2-jet (top left) and inclusive 3-jet event cross sections (top right) and their ratio $ {R_{32}} $ (bottom). For comparison predictions employing two other PDF sets are also shown. The error bars correspond to the statistical uncertainty of the data and the shaded rectangles to the total experimental systematic uncertainty. The shaded band around unity represents the total uncertainty of the theory. |
png pdf |
Figure 6-a:
Ratio of data over theory using the CT10 PDF set for inclusive 2-jet (top left) and inclusive 3-jet event cross sections (top right) and their ratio $ {R_{32}} $ (bottom). For comparison predictions employing two other PDF sets are also shown. The error bars correspond to the statistical uncertainty of the data and the shaded rectangles to the total experimental systematic uncertainty. The shaded band around unity represents the total uncertainty of the theory. |

png pdf |
Figure 6-b:
Ratio of data over theory using the CT10 PDF set for inclusive 2-jet (top left) and inclusive 3-jet event cross sections (top right) and their ratio $ {R_{32}} $ (bottom). For comparison predictions employing two other PDF sets are also shown. The error bars correspond to the statistical uncertainty of the data and the shaded rectangles to the total experimental systematic uncertainty. The shaded band around unity represents the total uncertainty of the theory. |

png pdf |
Figure 6-c:
Ratio of data over theory using the CT10 PDF set for inclusive 2-jet (top left) and inclusive 3-jet event cross sections (top right) and their ratio $ {R_{32}} $ (bottom). For comparison predictions employing two other PDF sets are also shown. The error bars correspond to the statistical uncertainty of the data and the shaded rectangles to the total experimental systematic uncertainty. The shaded band around unity represents the total uncertainty of the theory. |

png pdf |
Figure 7:
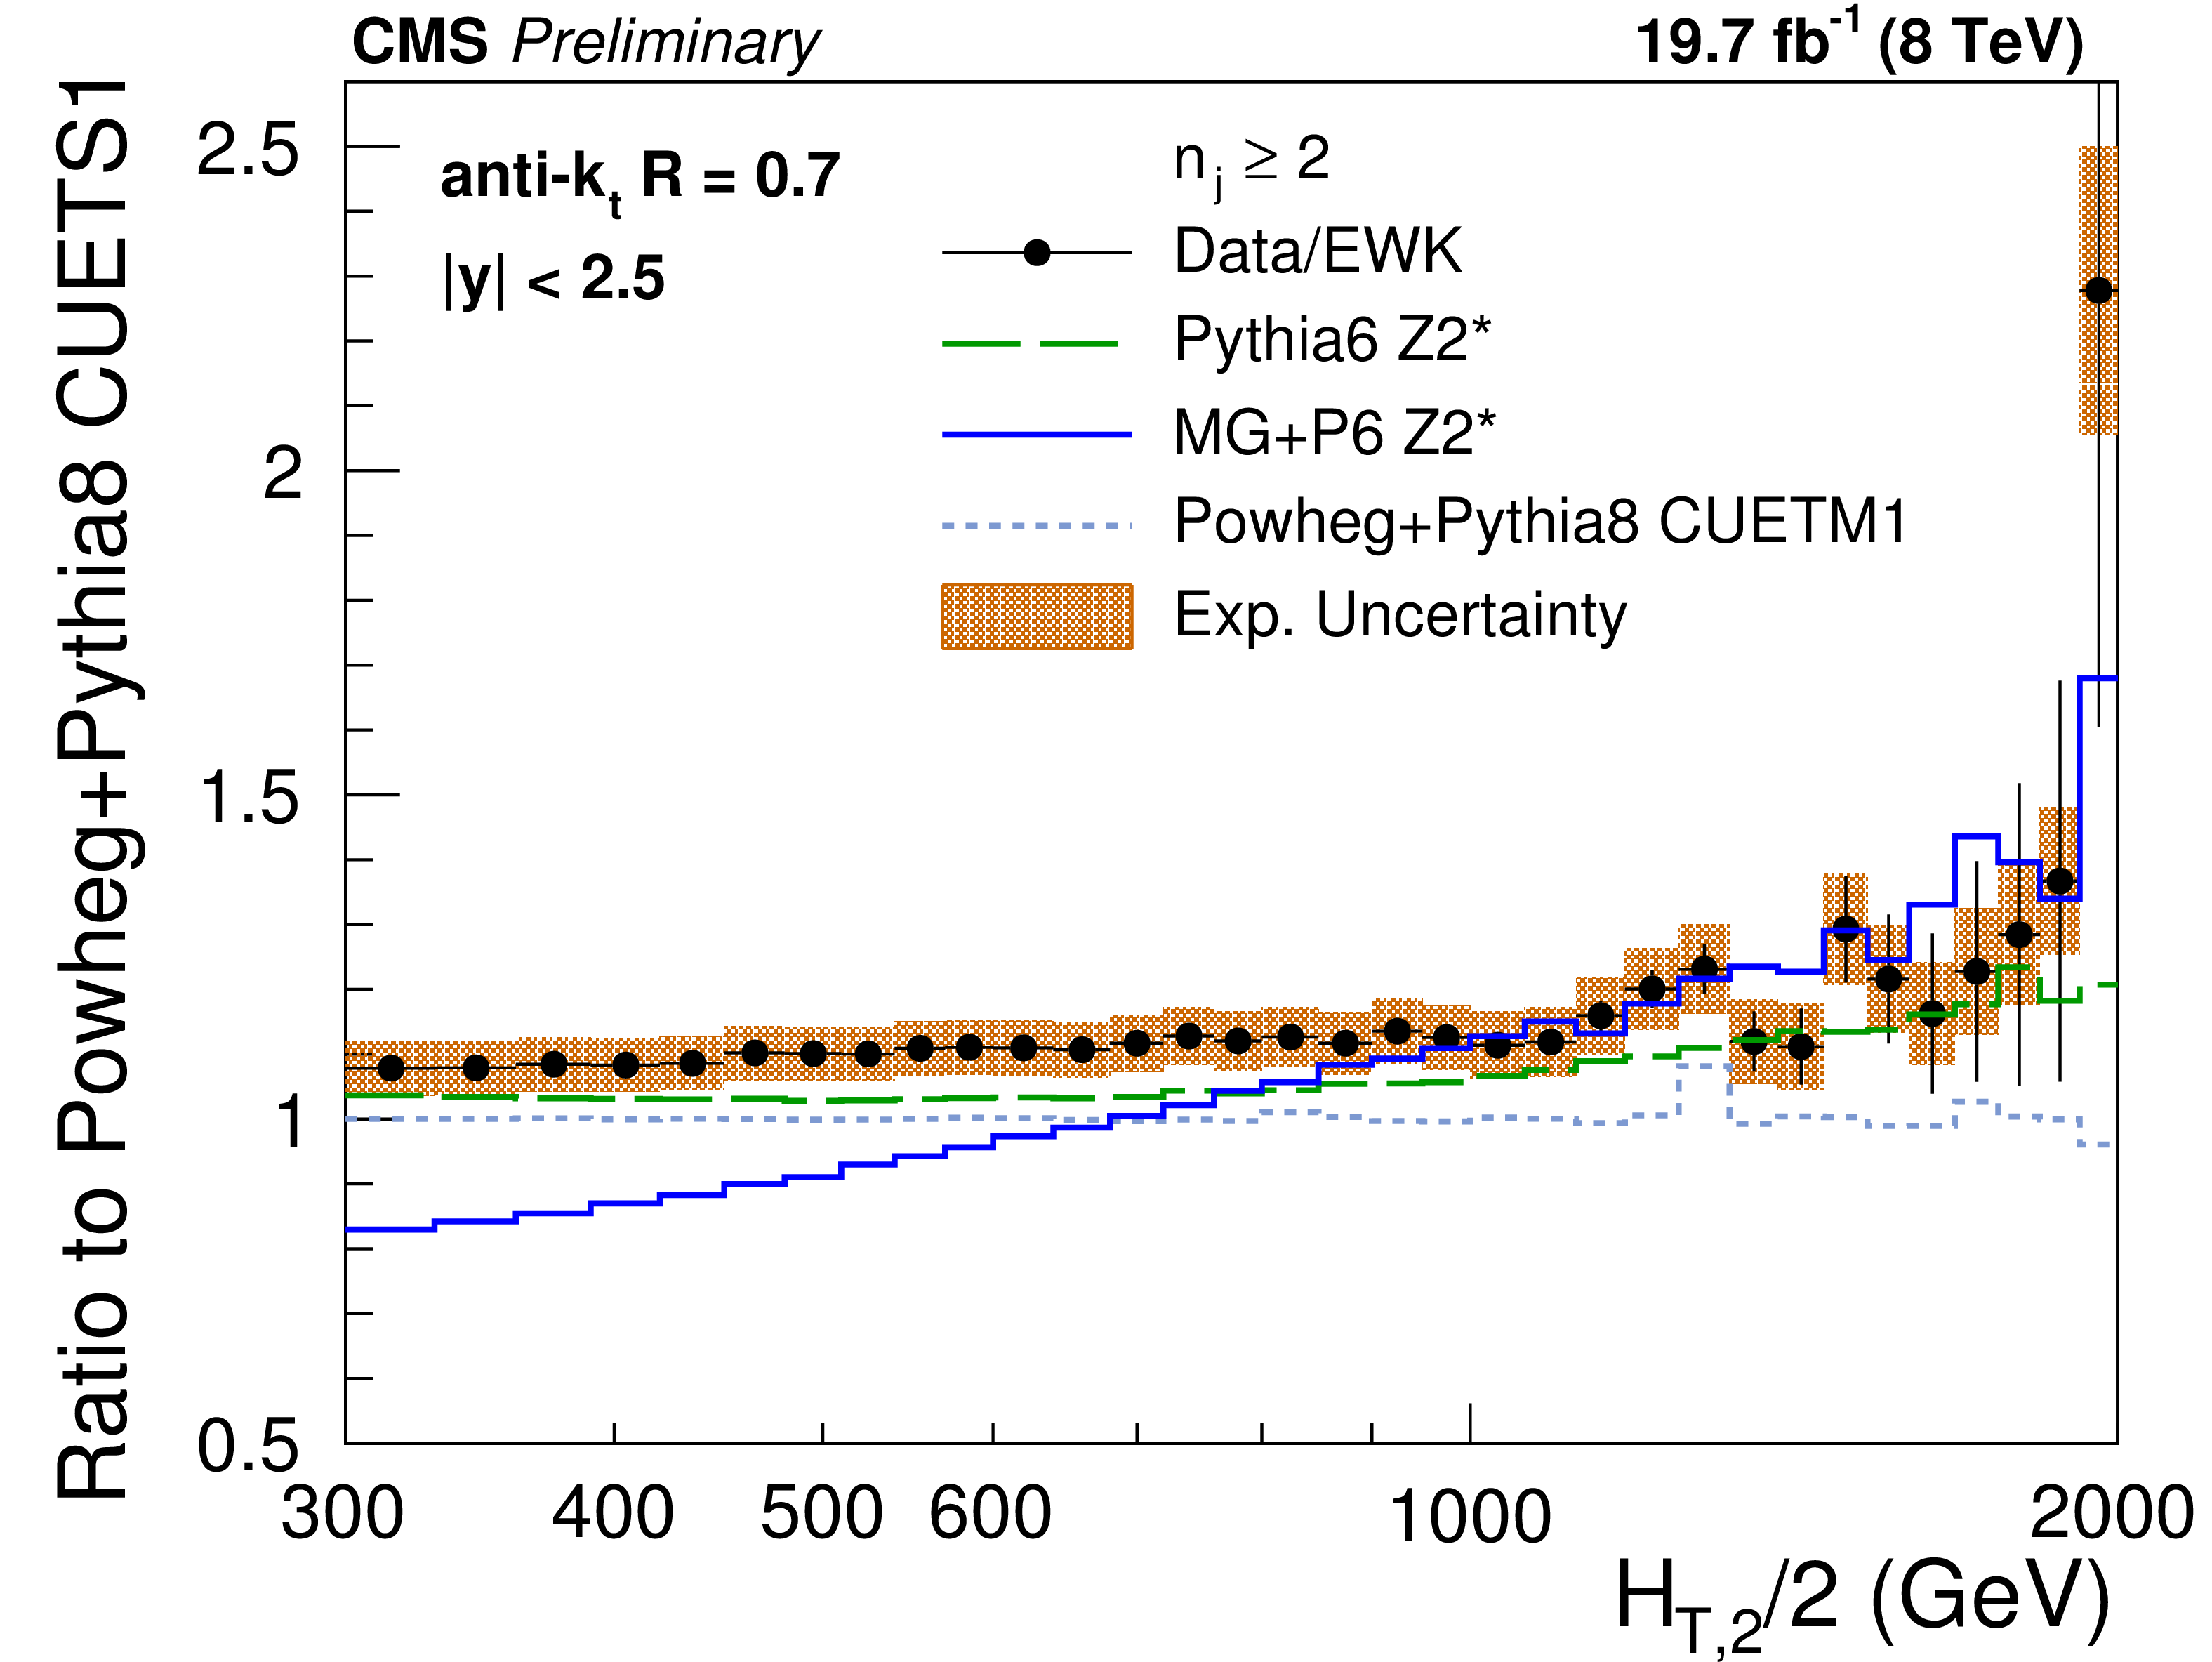
Ratio of data over the prediction from POWHEG+PYTHIA8 with tune CUETS1. For comparison the alternative tune CUETM1 of POWHEG+PYTHIA8 , the tree-level multi-leg improved prediction by MadGraph5+PYTHIA6 with tune $ {\mathrm {Z2}^\star } $ , and the LO MC predictions from PYTHIA6 tune $ {\mathrm {Z2}^\star } $ are shown as well. The error bars correspond to the statistical uncertainty of the data and the shaded rectangles to the total experimental systematic uncertainty. EWK corrections have been accounted for in this comparison in the 2-jet case. |
png pdf |
Figure 7-a:
Ratio of data over the prediction from POWHEG+PYTHIA8 with tune CUETS1. For comparison the alternative tune CUETM1 of POWHEG+PYTHIA8 , the tree-level multi-leg improved prediction by MadGraph5+PYTHIA6 with tune $ {\mathrm {Z2}^\star } $ , and the LO MC predictions from PYTHIA6 tune $ {\mathrm {Z2}^\star } $ are shown as well. The error bars correspond to the statistical uncertainty of the data and the shaded rectangles to the total experimental systematic uncertainty. EWK corrections have been accounted for in this comparison in the 2-jet case. |

png pdf |
Figure 7-b:
Ratio of data over the prediction from POWHEG+PYTHIA8 with tune CUETS1. For comparison the alternative tune CUETM1 of POWHEG+PYTHIA8 , the tree-level multi-leg improved prediction by MadGraph5+PYTHIA6 with tune $ {\mathrm {Z2}^\star } $ , and the LO MC predictions from PYTHIA6 tune $ {\mathrm {Z2}^\star } $ are shown as well. The error bars correspond to the statistical uncertainty of the data and the shaded rectangles to the total experimental systematic uncertainty. EWK corrections have been accounted for in this comparison in the 2-jet case. |

png pdf |
Figure 7-c:
Ratio of data over the prediction from POWHEG+PYTHIA8 with tune CUETS1. For comparison the alternative tune CUETM1 of POWHEG+PYTHIA8 , the tree-level multi-leg improved prediction by MadGraph5+PYTHIA6 with tune $ {\mathrm {Z2}^\star } $ , and the LO MC predictions from PYTHIA6 tune $ {\mathrm {Z2}^\star } $ are shown as well. The error bars correspond to the statistical uncertainty of the data and the shaded rectangles to the total experimental systematic uncertainty. EWK corrections have been accounted for in this comparison in the 2-jet case. |
png pdf |
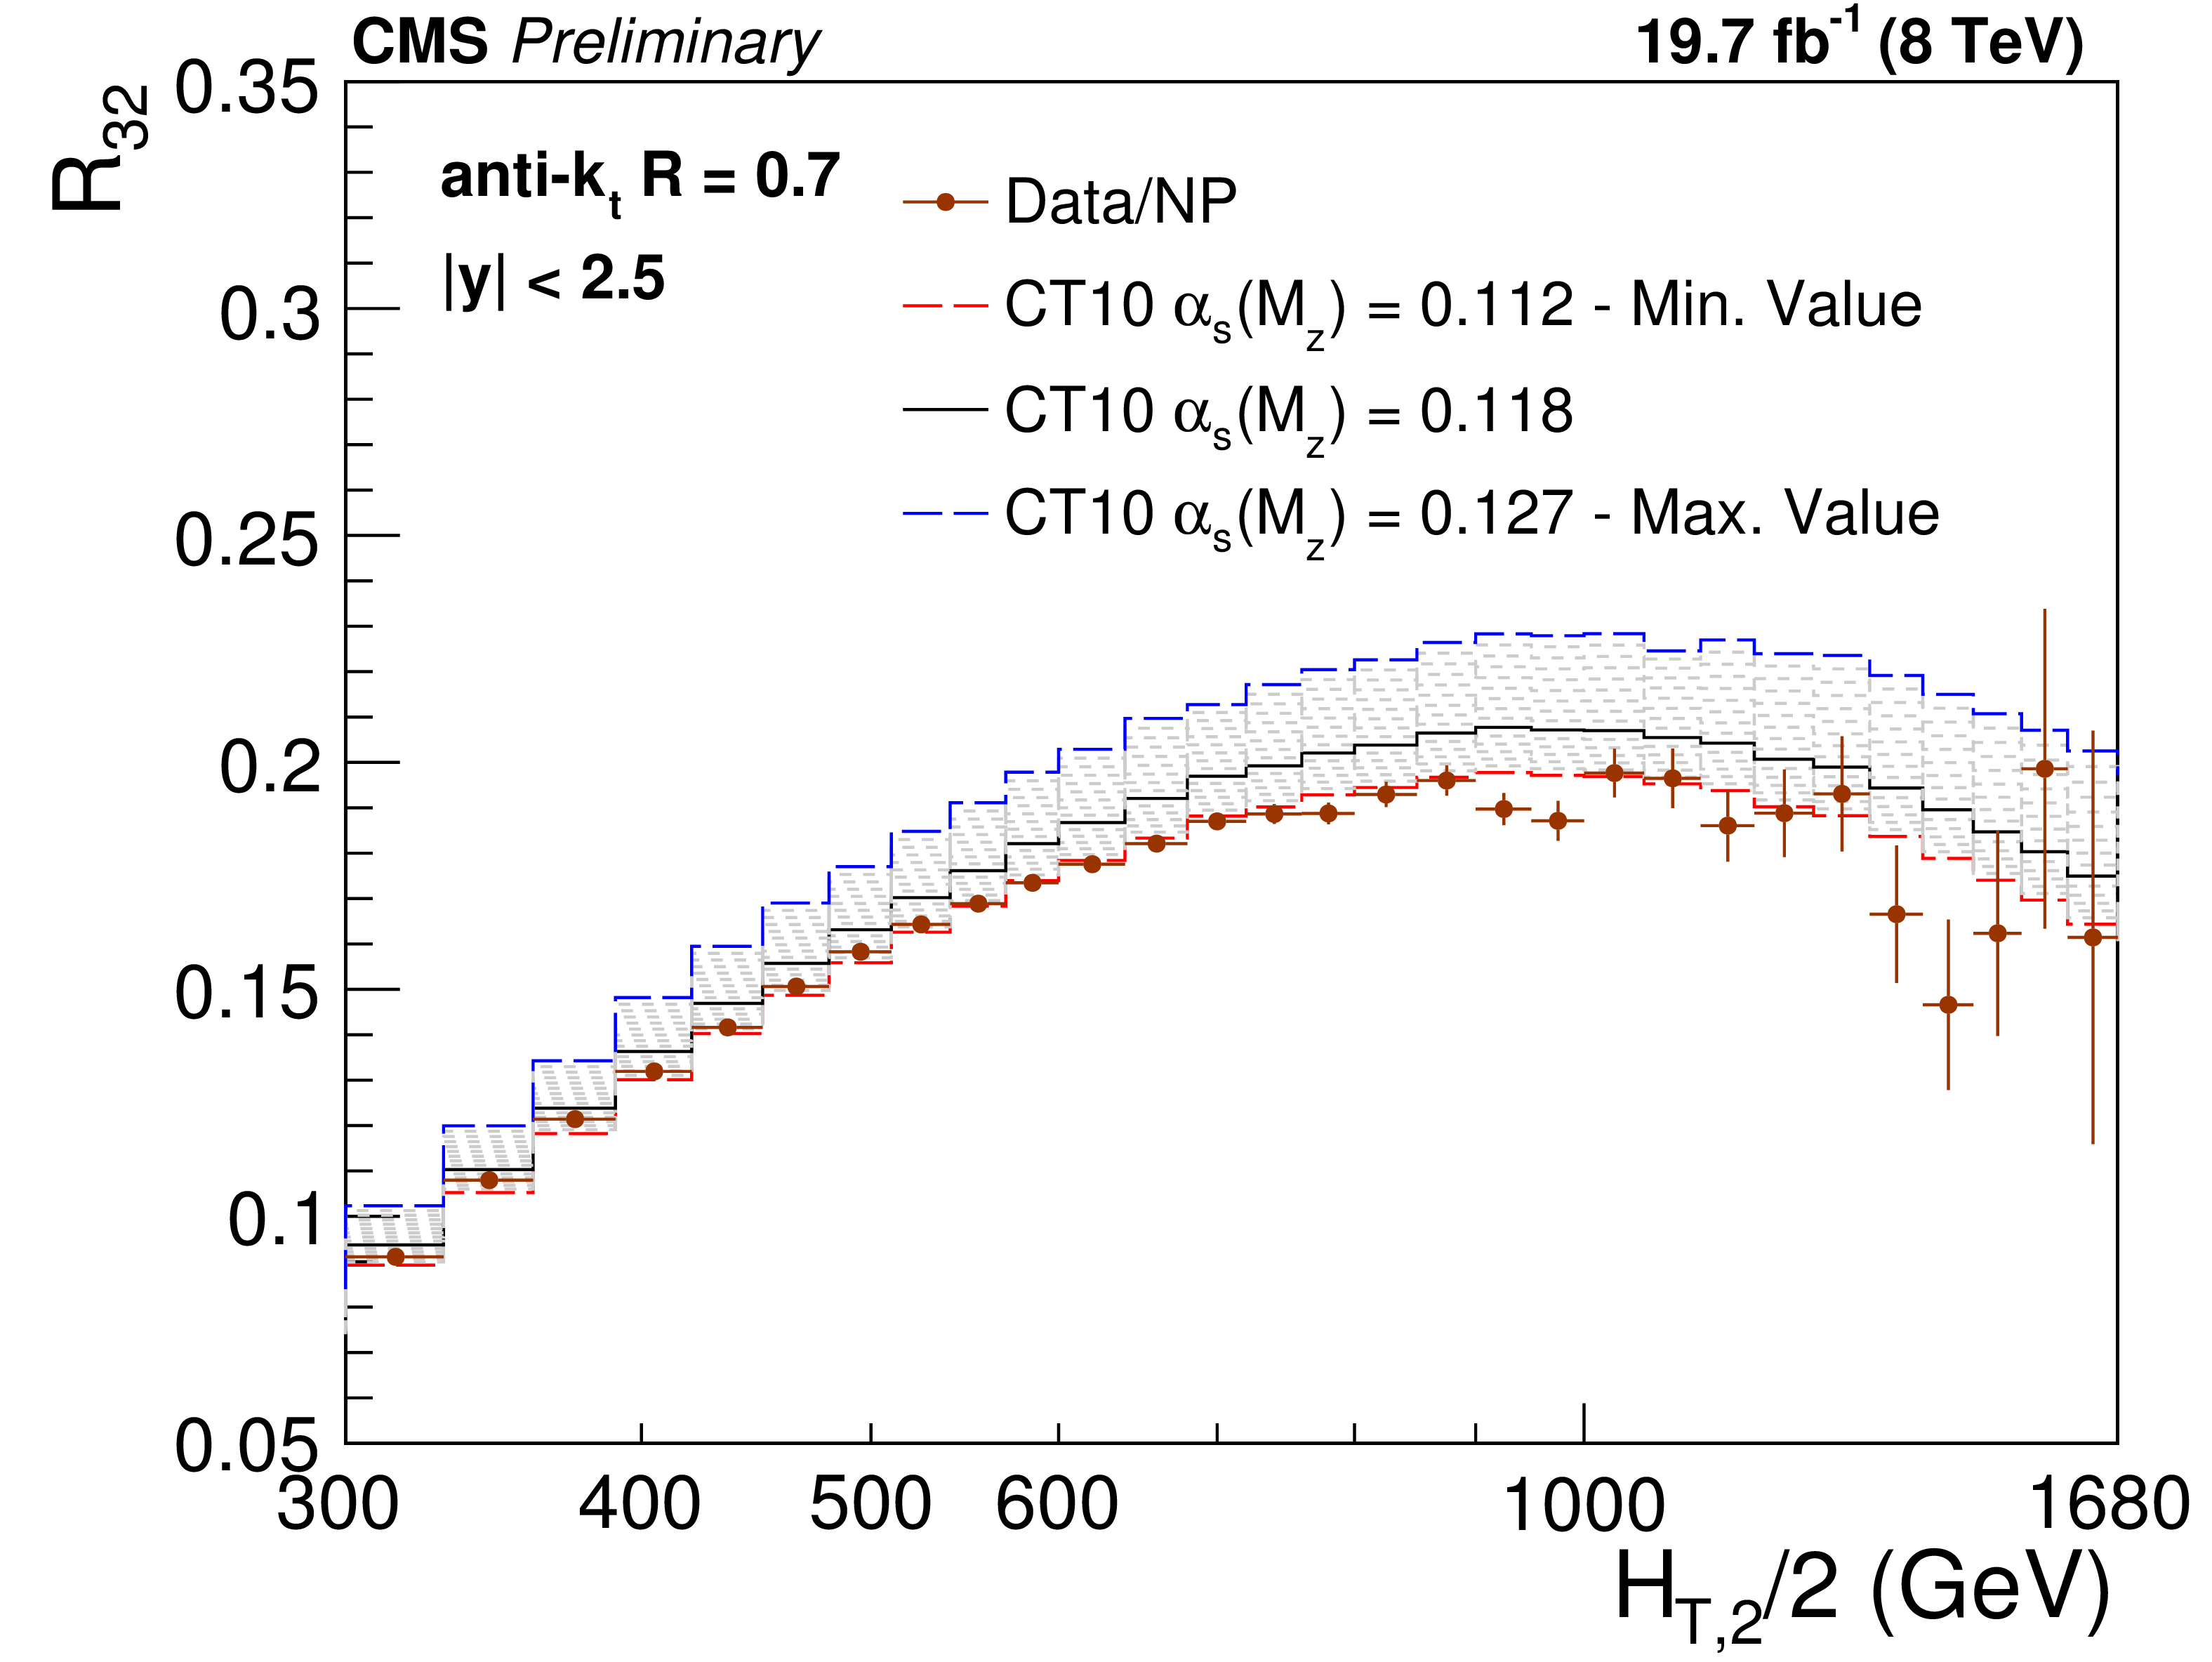
Figure 8:
Cross section ratio $ {R_{32}} $ as a function of $ {H_{\mathrm {T,2}}/2} $ calculated from data (solid circles) in comparison to that from NLO pQCD (lines). The error bars correspond to the total experimental uncertainty derived as quadratic sum from all uncertainty sources. The NLO predictions using the CT10 NLO PDF set corrected with NP corrections are shown for a series of values assumed for $ {\alpha _s(M_{\mathrm{Z}})} $ (dashed lines) together with the central prediction (solid line) where $ {\alpha _s(M_{\mathrm{Z}})} =0.118$. The assumption on $ {\alpha _s(M_{\mathrm{Z}})} $ is varied in steps of 0.001 in the range of 0.112-0.127. For brevity, the relative factor of NP between data and theory has been indicated as ``Data/NP'' in the legend. |
png pdf |
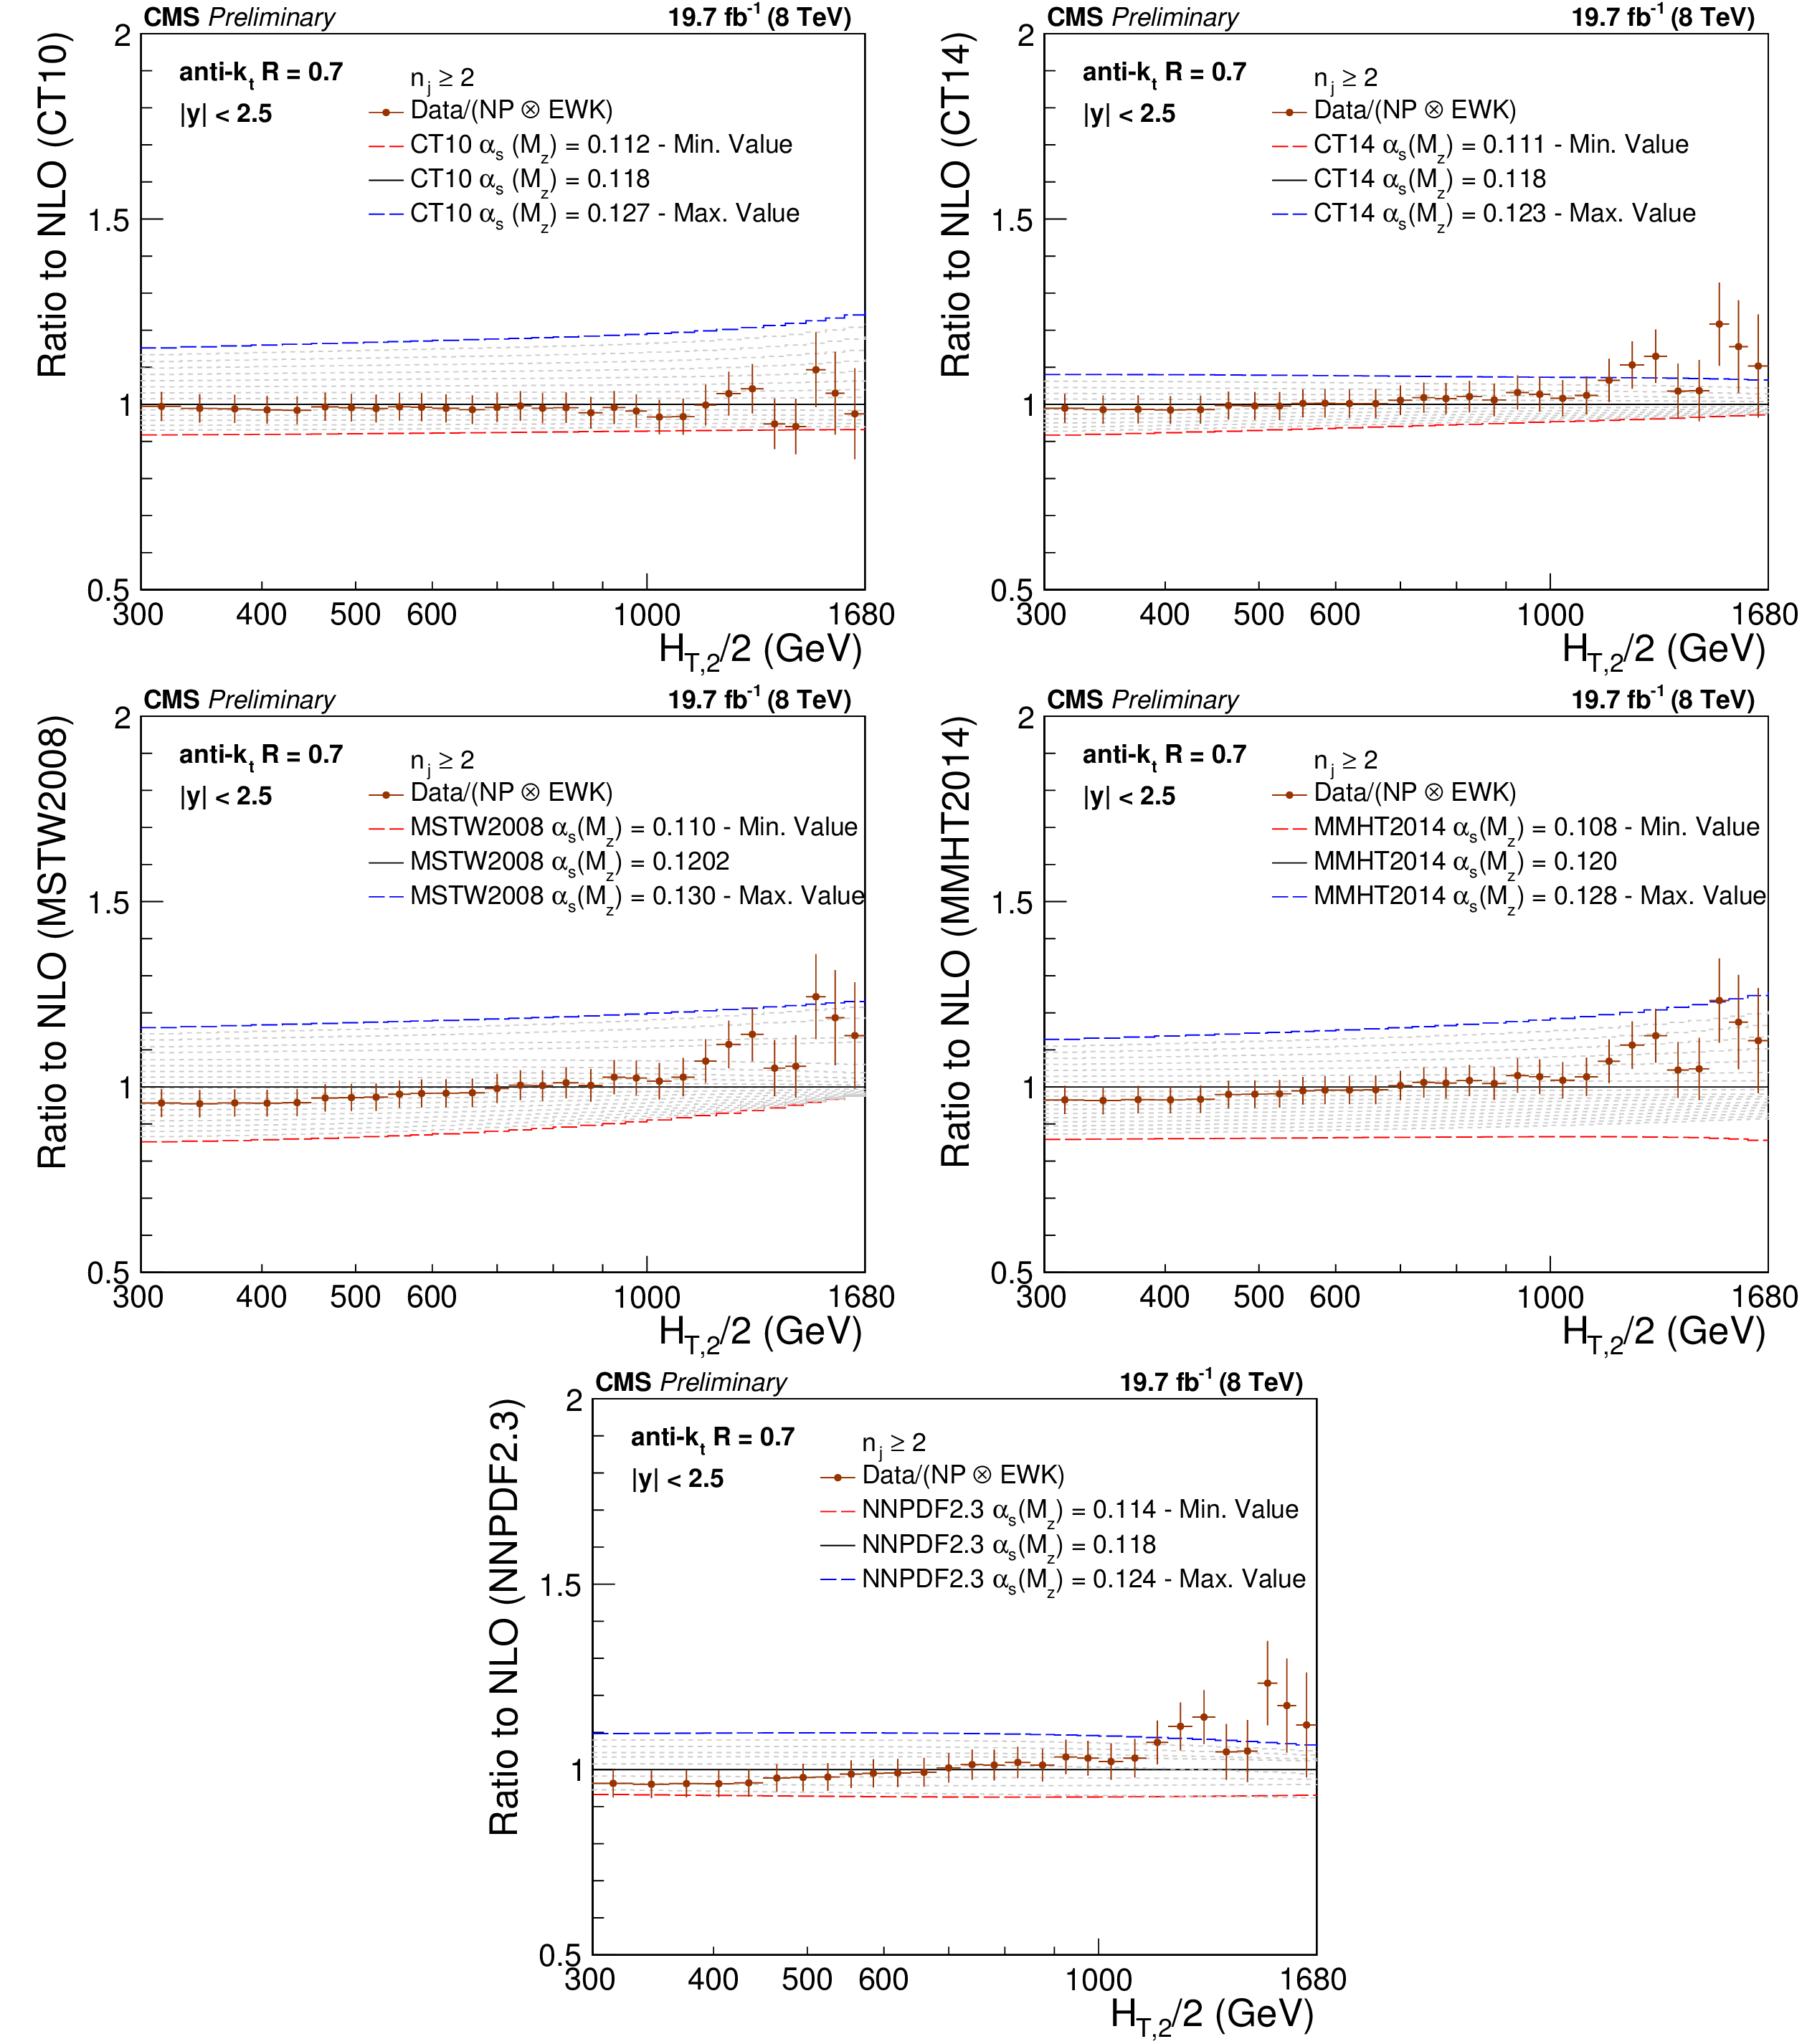
Figure 9:
Ratio of measured 2-jet inclusive event cross section (data points) over NLO theory times NP corrections for various PDF sets at their respective default value for $ {\alpha _s(M_{\mathrm{Z}})} $ (black solid line at unity). The error bars correspond to the total experimental uncertainty. The NLO predictions have been derived with the CT10 (top left), the CT14 (top right), the MSTW2008 (middle left), the MMHT2014 (middle right) and the NNPDF2.3 PDF sets (bottom) for the series of assumptions on $ {\alpha _s(M_{\mathrm{Z}})} $ available for the respective PDF set as specified in Table {tab:chap2:nlopdfsets}. For brevity, the relative factor of NP between data and theory has been indicated as ``Data/NP'' in the legend. |

png pdf |
Figure 9-a:
Ratio of measured 2-jet inclusive event cross section (data points) over NLO theory times NP corrections for various PDF sets at their respective default value for $ {\alpha _s(M_{\mathrm{Z}})} $ (black solid line at unity). The error bars correspond to the total experimental uncertainty. The NLO predictions have been derived with the CT10 (top left), the CT14 (top right), the MSTW2008 (middle left), the MMHT2014 (middle right) and the NNPDF2.3 PDF sets (bottom) for the series of assumptions on $ {\alpha _s(M_{\mathrm{Z}})} $ available for the respective PDF set as specified in Table {tab:chap2:nlopdfsets}. For brevity, the relative factor of NP between data and theory has been indicated as ``Data/NP'' in the legend. |

png pdf |
Figure 9-b:
Ratio of measured 2-jet inclusive event cross section (data points) over NLO theory times NP corrections for various PDF sets at their respective default value for $ {\alpha _s(M_{\mathrm{Z}})} $ (black solid line at unity). The error bars correspond to the total experimental uncertainty. The NLO predictions have been derived with the CT10 (top left), the CT14 (top right), the MSTW2008 (middle left), the MMHT2014 (middle right) and the NNPDF2.3 PDF sets (bottom) for the series of assumptions on $ {\alpha _s(M_{\mathrm{Z}})} $ available for the respective PDF set as specified in Table {tab:chap2:nlopdfsets}. For brevity, the relative factor of NP between data and theory has been indicated as ``Data/NP'' in the legend. |

png pdf |
Figure 9-c:
Ratio of measured 2-jet inclusive event cross section (data points) over NLO theory times NP corrections for various PDF sets at their respective default value for $ {\alpha _s(M_{\mathrm{Z}})} $ (black solid line at unity). The error bars correspond to the total experimental uncertainty. The NLO predictions have been derived with the CT10 (top left), the CT14 (top right), the MSTW2008 (middle left), the MMHT2014 (middle right) and the NNPDF2.3 PDF sets (bottom) for the series of assumptions on $ {\alpha _s(M_{\mathrm{Z}})} $ available for the respective PDF set as specified in Table {tab:chap2:nlopdfsets}. For brevity, the relative factor of NP between data and theory has been indicated as ``Data/NP'' in the legend. |

png pdf |
Figure 9-d:
Ratio of measured 2-jet inclusive event cross section (data points) over NLO theory times NP corrections for various PDF sets at their respective default value for $ {\alpha _s(M_{\mathrm{Z}})} $ (black solid line at unity). The error bars correspond to the total experimental uncertainty. The NLO predictions have been derived with the CT10 (top left), the CT14 (top right), the MSTW2008 (middle left), the MMHT2014 (middle right) and the NNPDF2.3 PDF sets (bottom) for the series of assumptions on $ {\alpha _s(M_{\mathrm{Z}})} $ available for the respective PDF set as specified in Table {tab:chap2:nlopdfsets}. For brevity, the relative factor of NP between data and theory has been indicated as ``Data/NP'' in the legend. |

png pdf |
Figure 9-e:
Ratio of measured 2-jet inclusive event cross section (data points) over NLO theory times NP corrections for various PDF sets at their respective default value for $ {\alpha _s(M_{\mathrm{Z}})} $ (black solid line at unity). The error bars correspond to the total experimental uncertainty. The NLO predictions have been derived with the CT10 (top left), the CT14 (top right), the MSTW2008 (middle left), the MMHT2014 (middle right) and the NNPDF2.3 PDF sets (bottom) for the series of assumptions on $ {\alpha _s(M_{\mathrm{Z}})} $ available for the respective PDF set as specified in Table {tab:chap2:nlopdfsets}. For brevity, the relative factor of NP between data and theory has been indicated as ``Data/NP'' in the legend. |

png pdf |
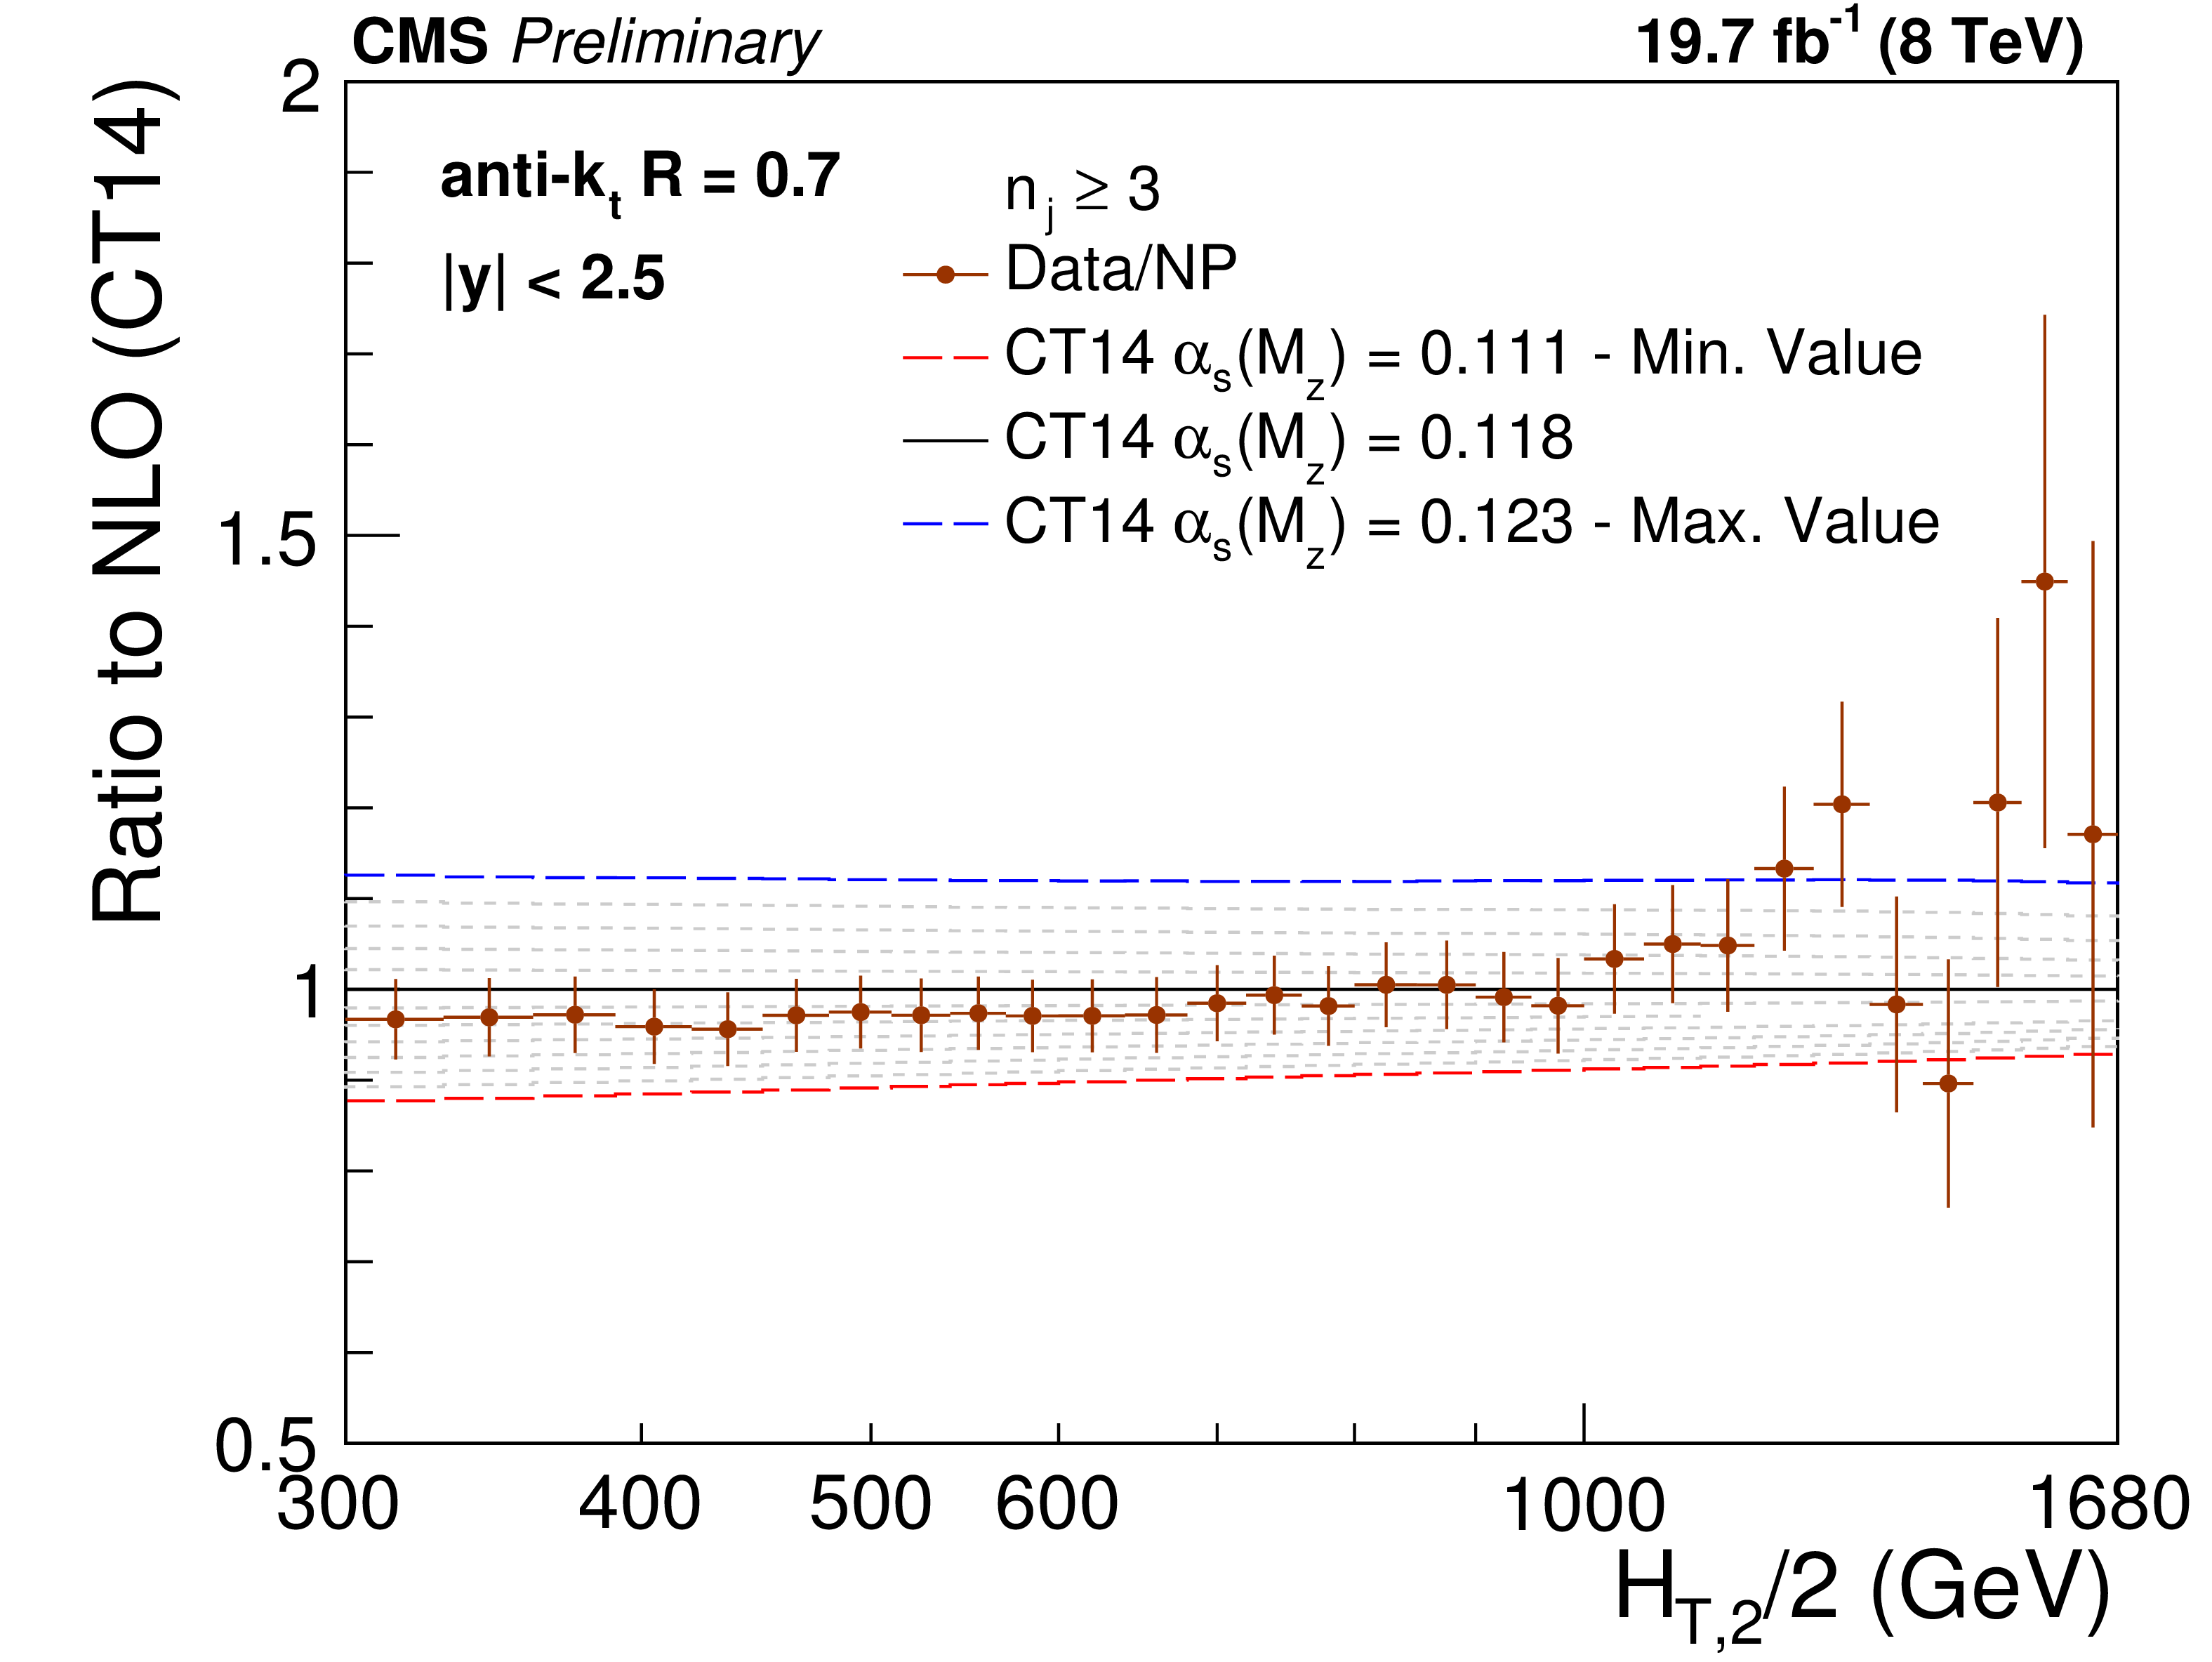
Figure 10:
Ratio of measured 3-jet inclusive event cross section (data points) over NLO theory times NP corrections for various PDF sets at their respective default value for $ {\alpha _s(M_{\mathrm{Z}})} $ (black solid line at unity). The error bars correspond to the total experimental uncertainty. The NLO predictions have been derived with the CT10 (top left), the CT14 (top right), the MSTW2008 (middle left), the MMHT2014 (middle right) and the NNPDF2.3 PDF sets (bottom) for the series of assumptions on $ {\alpha _s(M_{\mathrm{Z}})} $ available for the respective PDF set as specified in Table {tab:chap2:nlopdfsets}. For brevity, the relative factor of NP between data and theory has been indicated as ``Data/NP'' in the legend. |

png pdf |
Figure 10-a:
Ratio of measured 3-jet inclusive event cross section (data points) over NLO theory times NP corrections for various PDF sets at their respective default value for $ {\alpha _s(M_{\mathrm{Z}})} $ (black solid line at unity). The error bars correspond to the total experimental uncertainty. The NLO predictions have been derived with the CT10 (top left), the CT14 (top right), the MSTW2008 (middle left), the MMHT2014 (middle right) and the NNPDF2.3 PDF sets (bottom) for the series of assumptions on $ {\alpha _s(M_{\mathrm{Z}})} $ available for the respective PDF set as specified in Table {tab:chap2:nlopdfsets}. For brevity, the relative factor of NP between data and theory has been indicated as ``Data/NP'' in the legend. |
png pdf |
Figure 10-b:
Ratio of measured 3-jet inclusive event cross section (data points) over NLO theory times NP corrections for various PDF sets at their respective default value for $ {\alpha _s(M_{\mathrm{Z}})} $ (black solid line at unity). The error bars correspond to the total experimental uncertainty. The NLO predictions have been derived with the CT10 (top left), the CT14 (top right), the MSTW2008 (middle left), the MMHT2014 (middle right) and the NNPDF2.3 PDF sets (bottom) for the series of assumptions on $ {\alpha _s(M_{\mathrm{Z}})} $ available for the respective PDF set as specified in Table {tab:chap2:nlopdfsets}. For brevity, the relative factor of NP between data and theory has been indicated as ``Data/NP'' in the legend. |

png pdf |
Figure 10-c:
Ratio of measured 3-jet inclusive event cross section (data points) over NLO theory times NP corrections for various PDF sets at their respective default value for $ {\alpha _s(M_{\mathrm{Z}})} $ (black solid line at unity). The error bars correspond to the total experimental uncertainty. The NLO predictions have been derived with the CT10 (top left), the CT14 (top right), the MSTW2008 (middle left), the MMHT2014 (middle right) and the NNPDF2.3 PDF sets (bottom) for the series of assumptions on $ {\alpha _s(M_{\mathrm{Z}})} $ available for the respective PDF set as specified in Table {tab:chap2:nlopdfsets}. For brevity, the relative factor of NP between data and theory has been indicated as ``Data/NP'' in the legend. |

png pdf |
Figure 10-d:
Ratio of measured 3-jet inclusive event cross section (data points) over NLO theory times NP corrections for various PDF sets at their respective default value for $ {\alpha _s(M_{\mathrm{Z}})} $ (black solid line at unity). The error bars correspond to the total experimental uncertainty. The NLO predictions have been derived with the CT10 (top left), the CT14 (top right), the MSTW2008 (middle left), the MMHT2014 (middle right) and the NNPDF2.3 PDF sets (bottom) for the series of assumptions on $ {\alpha _s(M_{\mathrm{Z}})} $ available for the respective PDF set as specified in Table {tab:chap2:nlopdfsets}. For brevity, the relative factor of NP between data and theory has been indicated as ``Data/NP'' in the legend. |

png pdf |
Figure 10-e:
Ratio of measured 3-jet inclusive event cross section (data points) over NLO theory times NP corrections for various PDF sets at their respective default value for $ {\alpha _s(M_{\mathrm{Z}})} $ (black solid line at unity). The error bars correspond to the total experimental uncertainty. The NLO predictions have been derived with the CT10 (top left), the CT14 (top right), the MSTW2008 (middle left), the MMHT2014 (middle right) and the NNPDF2.3 PDF sets (bottom) for the series of assumptions on $ {\alpha _s(M_{\mathrm{Z}})} $ available for the respective PDF set as specified in Table {tab:chap2:nlopdfsets}. For brevity, the relative factor of NP between data and theory has been indicated as ``Data/NP'' in the legend. |

png pdf |
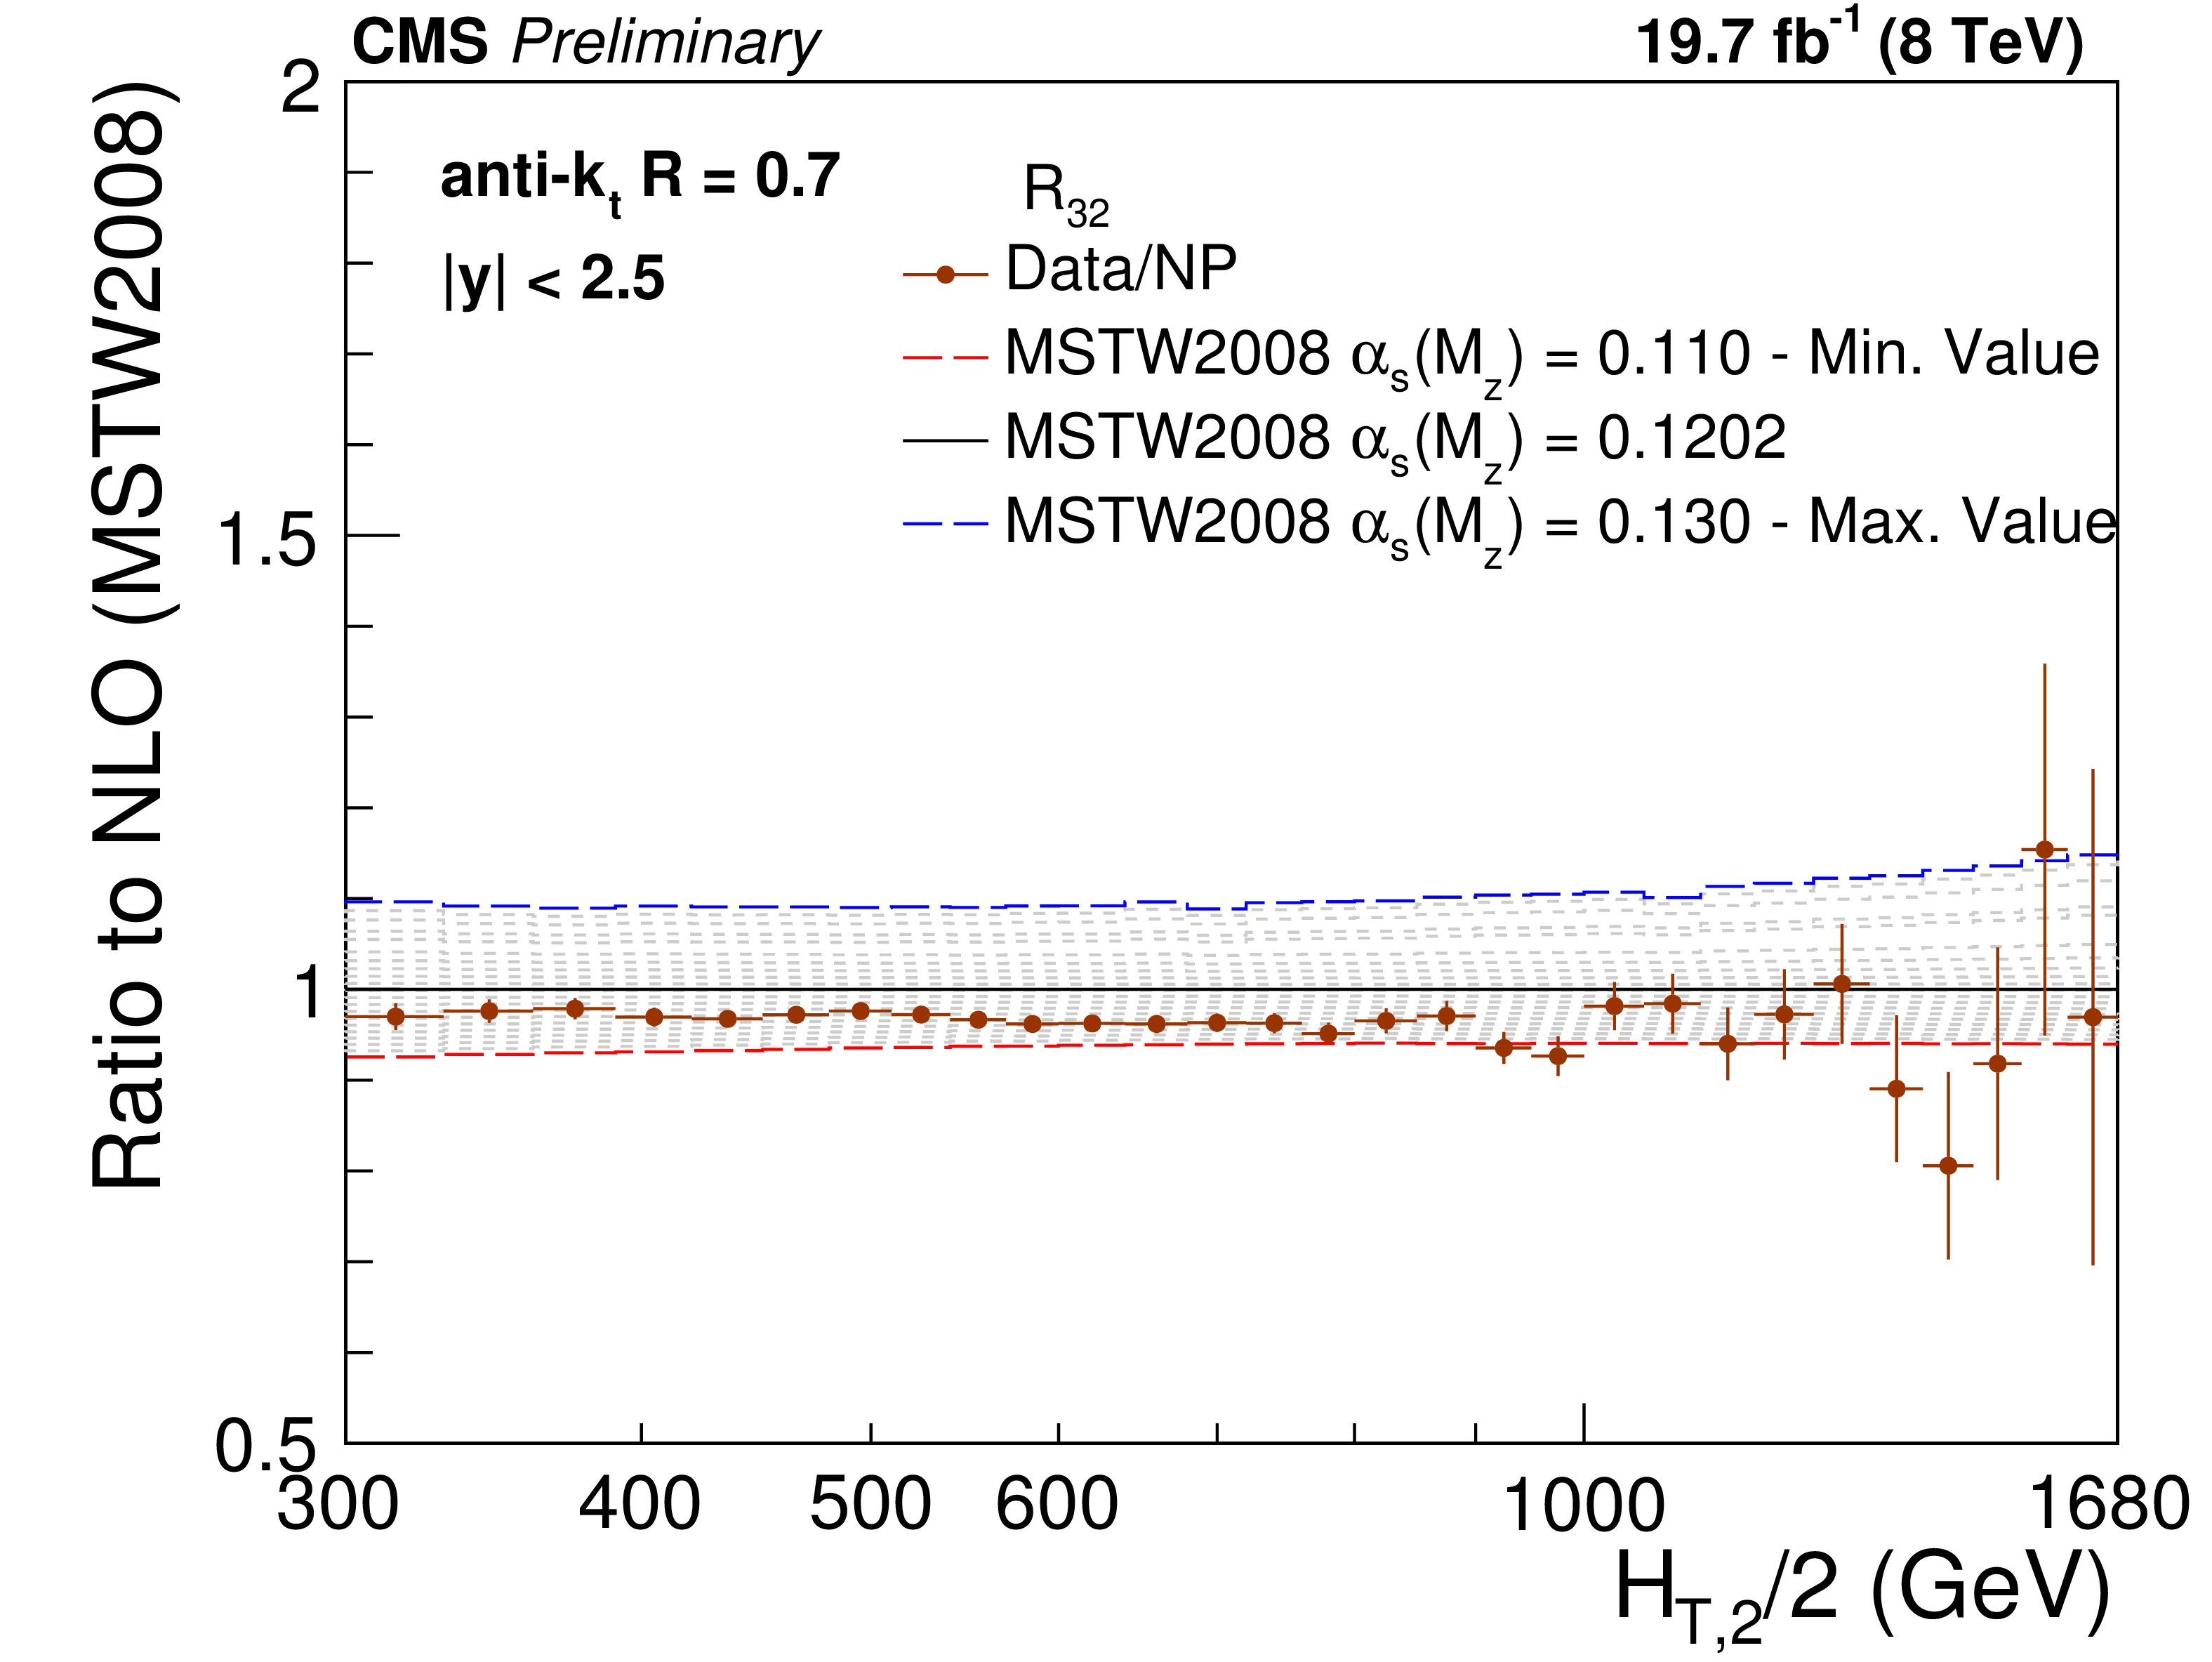
Figure 11:
Ratio of measured $ {R_{32}} $ ratio (data points) over NLO theory times NP corrections for various PDF sets at their respective default value for $ {\alpha _s(M_{\mathrm{Z}})} $ (black solid line at unity). The error bars correspond to the total experimental uncertainty. The NLO predictions have been derived with the CT10 (top left), the CT14 (top right), the MSTW2008 (middle left), the MMHT2014 (middle right) and the NNPDF2.3 PDF sets (bottom) for the series of assumptions on $ {\alpha _s(M_{\mathrm{Z}})} $ available for the respective PDF set as specified in Table 2. For brevity, the relative factor of NP between data and theory has been indicated as ``Data/NP'' in the legend. |

png pdf |
Figure 11-a:
Ratio of measured $ {R_{32}} $ ratio (data points) over NLO theory times NP corrections for various PDF sets at their respective default value for $ {\alpha _s(M_{\mathrm{Z}})} $ (black solid line at unity). The error bars correspond to the total experimental uncertainty. The NLO predictions have been derived with the CT10 (top left), the CT14 (top right), the MSTW2008 (middle left), the MMHT2014 (middle right) and the NNPDF2.3 PDF sets (bottom) for the series of assumptions on $ {\alpha _s(M_{\mathrm{Z}})} $ available for the respective PDF set as specified in Table 2. For brevity, the relative factor of NP between data and theory has been indicated as ``Data/NP'' in the legend. |

png pdf |
Figure 11-b:
Ratio of measured $ {R_{32}} $ ratio (data points) over NLO theory times NP corrections for various PDF sets at their respective default value for $ {\alpha _s(M_{\mathrm{Z}})} $ (black solid line at unity). The error bars correspond to the total experimental uncertainty. The NLO predictions have been derived with the CT10 (top left), the CT14 (top right), the MSTW2008 (middle left), the MMHT2014 (middle right) and the NNPDF2.3 PDF sets (bottom) for the series of assumptions on $ {\alpha _s(M_{\mathrm{Z}})} $ available for the respective PDF set as specified in Table 2. For brevity, the relative factor of NP between data and theory has been indicated as ``Data/NP'' in the legend. |
png pdf |
Figure 11-c:
Ratio of measured $ {R_{32}} $ ratio (data points) over NLO theory times NP corrections for various PDF sets at their respective default value for $ {\alpha _s(M_{\mathrm{Z}})} $ (black solid line at unity). The error bars correspond to the total experimental uncertainty. The NLO predictions have been derived with the CT10 (top left), the CT14 (top right), the MSTW2008 (middle left), the MMHT2014 (middle right) and the NNPDF2.3 PDF sets (bottom) for the series of assumptions on $ {\alpha _s(M_{\mathrm{Z}})} $ available for the respective PDF set as specified in Table 2. For brevity, the relative factor of NP between data and theory has been indicated as ``Data/NP'' in the legend. |

png pdf |
Figure 11-d:
Ratio of measured $ {R_{32}} $ ratio (data points) over NLO theory times NP corrections for various PDF sets at their respective default value for $ {\alpha _s(M_{\mathrm{Z}})} $ (black solid line at unity). The error bars correspond to the total experimental uncertainty. The NLO predictions have been derived with the CT10 (top left), the CT14 (top right), the MSTW2008 (middle left), the MMHT2014 (middle right) and the NNPDF2.3 PDF sets (bottom) for the series of assumptions on $ {\alpha _s(M_{\mathrm{Z}})} $ available for the respective PDF set as specified in Table 2. For brevity, the relative factor of NP between data and theory has been indicated as ``Data/NP'' in the legend. |

png pdf |
Figure 11-e:
Ratio of measured $ {R_{32}} $ ratio (data points) over NLO theory times NP corrections for various PDF sets at their respective default value for $ {\alpha _s(M_{\mathrm{Z}})} $ (black solid line at unity). The error bars correspond to the total experimental uncertainty. The NLO predictions have been derived with the CT10 (top left), the CT14 (top right), the MSTW2008 (middle left), the MMHT2014 (middle right) and the NNPDF2.3 PDF sets (bottom) for the series of assumptions on $ {\alpha _s(M_{\mathrm{Z}})} $ available for the respective PDF set as specified in Table 2. For brevity, the relative factor of NP between data and theory has been indicated as ``Data/NP'' in the legend. |

png pdf |
Figure 12:
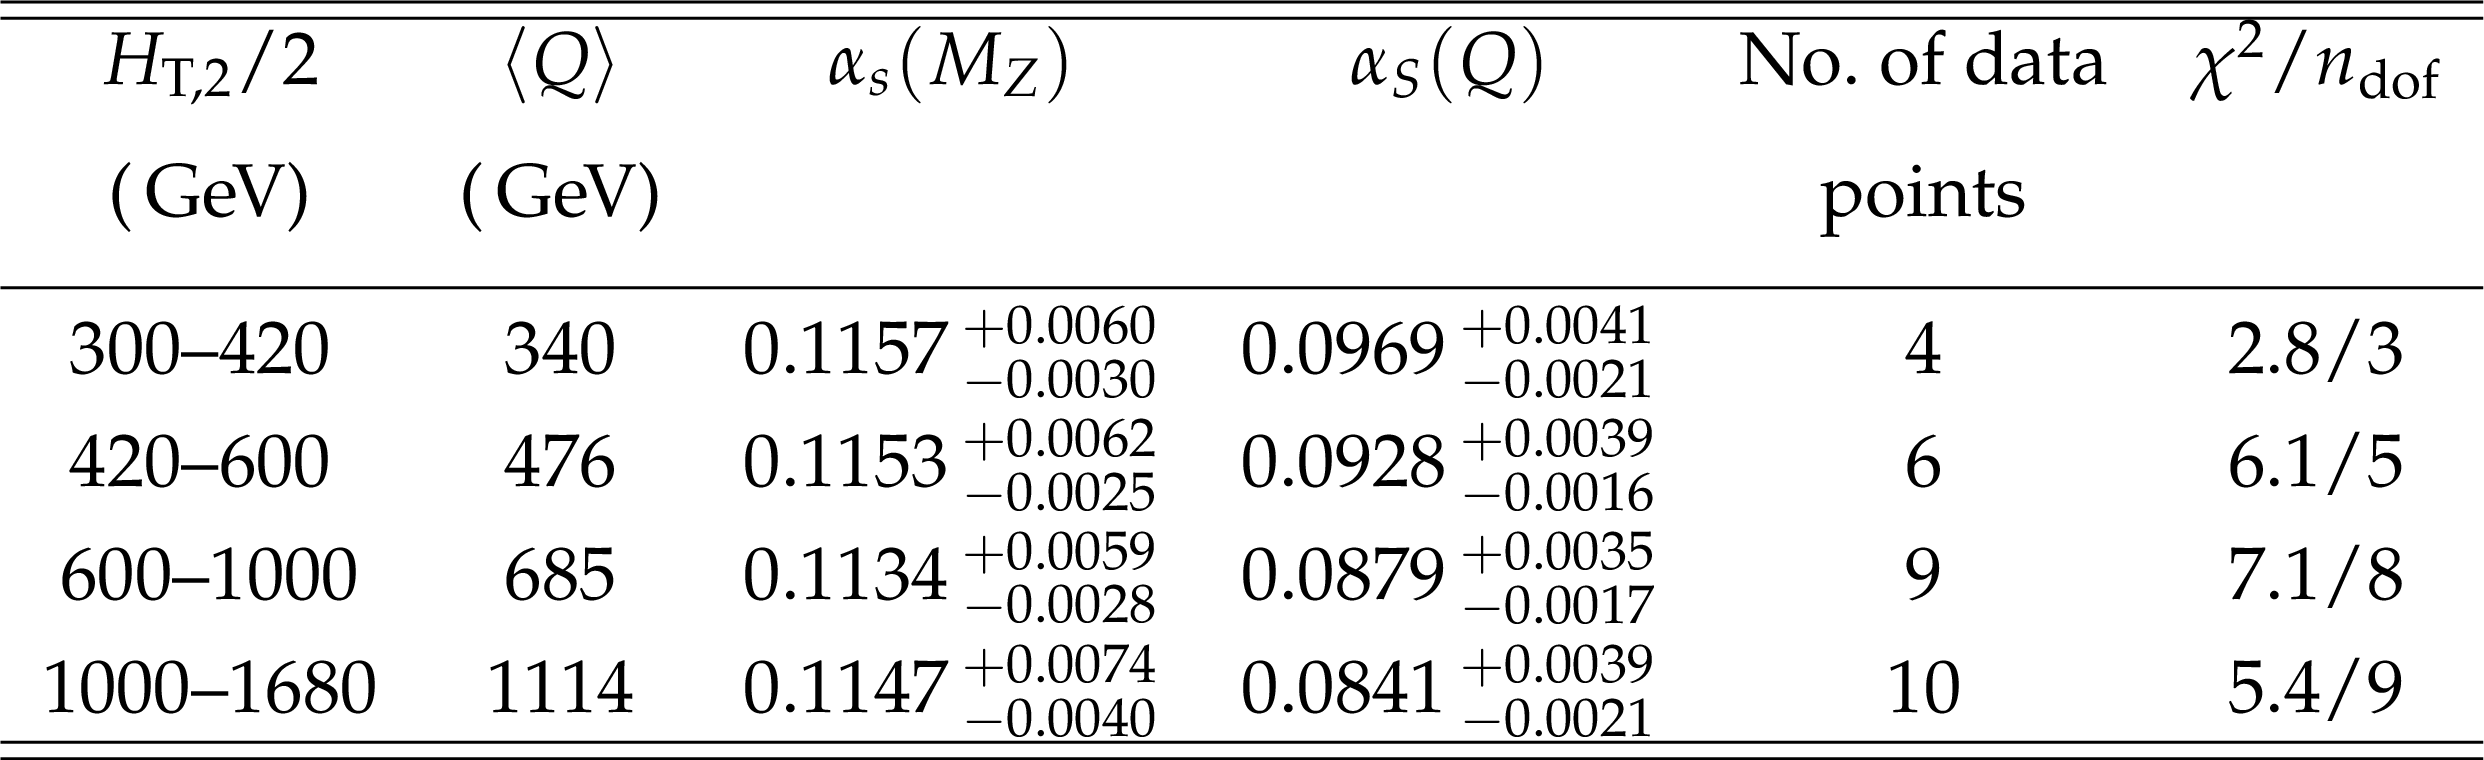
The running $ {\alpha _S(Q)} $ as a function of the scale $Q $ is shown as obtained by using the MSTW2008 NLO PDF set. The solid line and the uncertainty band are drawn by evolving the extracted $ {\alpha _s(M_{\mathrm{Z}})} $ values using the 2-loop 5-flavour renormalization group equations as implemented in RunDec [50,51]. The dashed line represents the evolution of the world average [52] and the black circles correspond to the $ {\alpha _S(Q)} $ determinations presented in Table 9. Results from other measurements of CMS [12,53,48,26,11], ATLAS [54], D0 [55,56], H1 [57,58], and ZEUS [59] are superimposed. |
| Tables | |
png pdf |
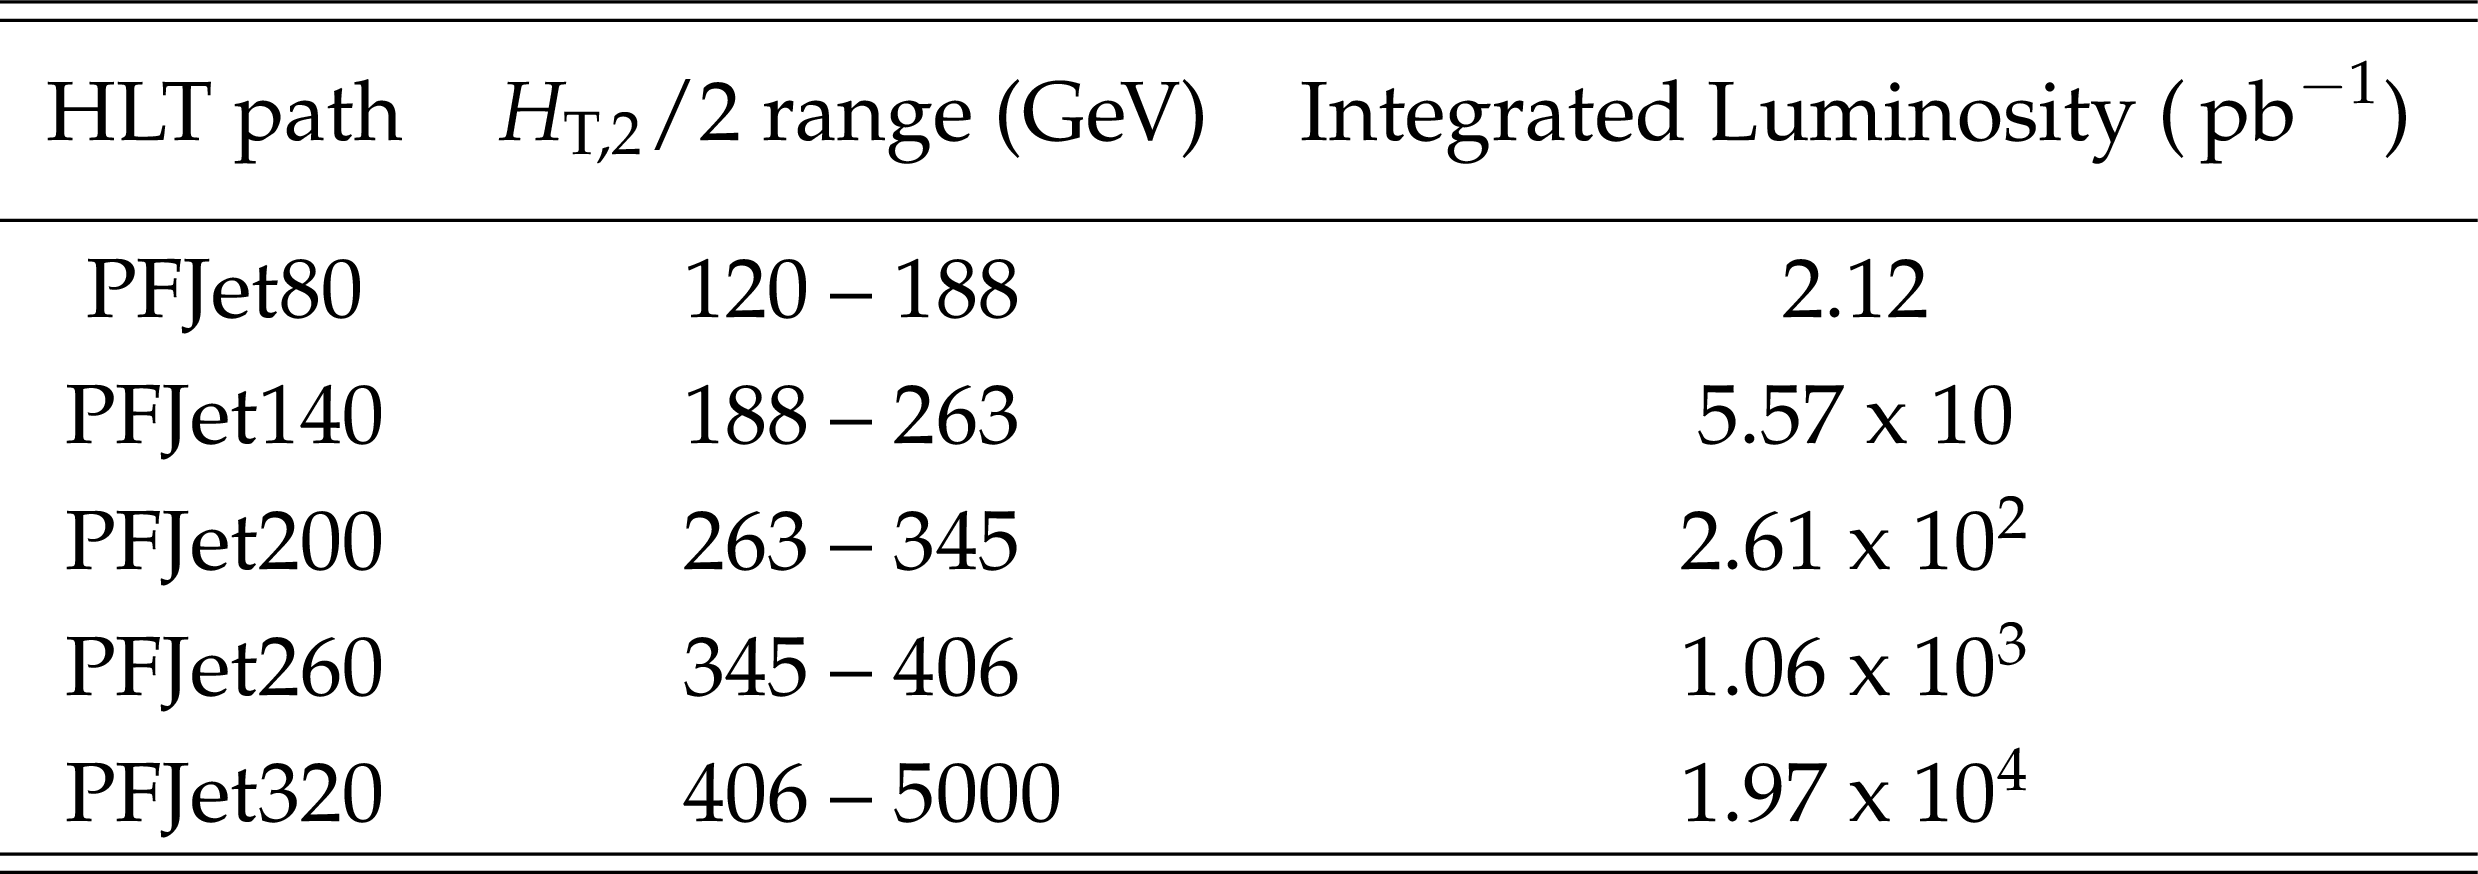
Table 1:
Trigger regions defined as ranges of the ${H_{\mathrm {T,2}}/2}$ for every single-jet trigger used in the inclusive multijet cross section measurement along with the effective integrated luminosities. |

png pdf |
Table 2:
NLO PDF sets available via {LHAPDF6} for comparisons to data with various assumptions on the value of ${\alpha _s(M_{\mathrm{Z}})} $. Sets existing already in LHC Run1 (upper rows) and newer sets for Run2 (lower rows) are listed together with the corresponding number of flavours ${N_F} $, the assumed masses $M_{\mathrm{t}}$ and $M_{\mathrm{Z}}$ of the top quark and the $Z$ boson, respectively, the default values of ${\alpha _s(M_{\mathrm{Z}})} $, and the range in ${\alpha _s(M_{\mathrm{Z}})}$ variation available for fits. A $^*$ behind the ${\alpha _s(M_{\mathrm{Z}})}$ values signifies that the parameter was fixed, not fitted. |
png pdf |
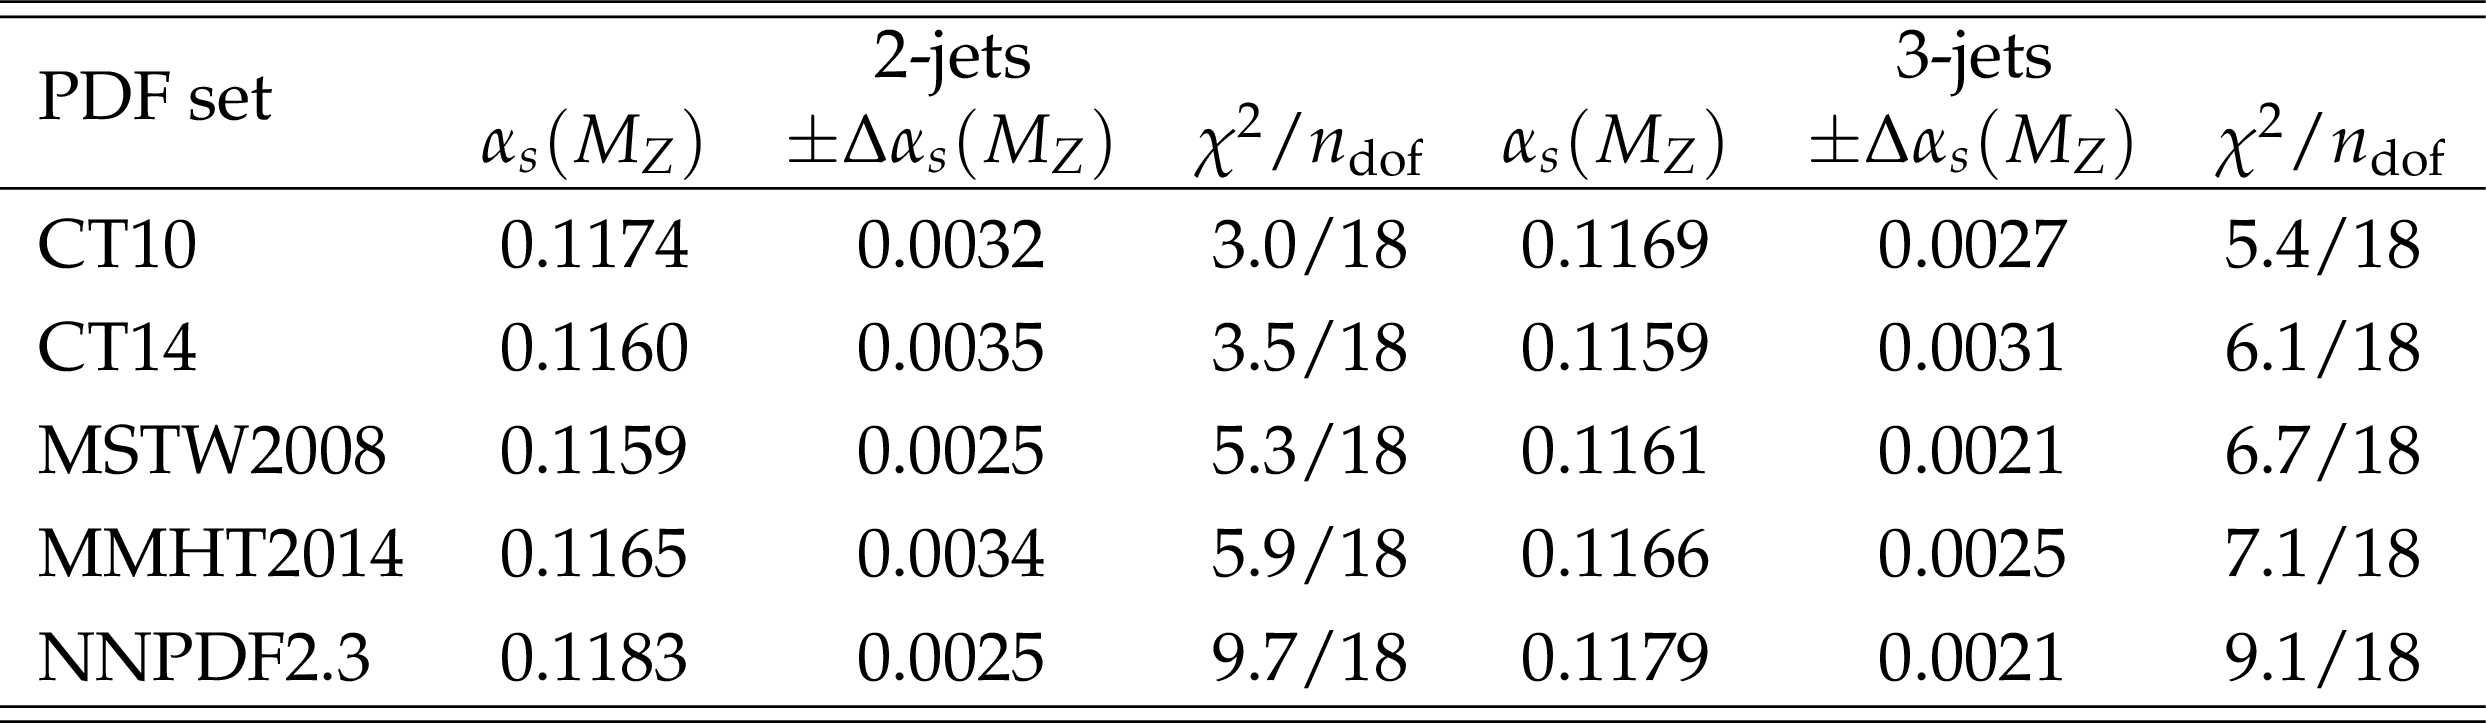
Table 3:
Determination of $ {\alpha _s(M_{\mathrm{Z}})} $ from the inclusive 2-jet and 3-jet event cross sections using five PDF sets at NLO. Only total uncertainties without scale variations are quoted. The results are obtained from a simultaneous fit to all 19 $ {H_{\mathrm {T,2}}/2} $ bins in the restricted range of 0.3 $ < {H_{\mathrm {T,2}}/2} < $ 1.0 TeV. |

png pdf |
Table 4:
Determination of $ {\alpha _s(M_{\mathrm{Z}})} $ from the inclusive 2-jet and 3-jet event cross sections simultaneously and from their ratio $ {R_{32}} $ using five PDF sets at NLO. Only total uncertainties without scale variations are quoted. The results are obtained from a simultaneous fit to all 38 (19) $ {H_{\mathrm {T,2}}/2} $ bins in the restricted range of 0.3 $ < {H_{\mathrm {T,2}}/2} < $ 1.0 TeV. For comparison, correlations between the two cross sections are neglected in the simultaneous fit on the left, but fully taken into account in the ratio fit on the right. |
png pdf |
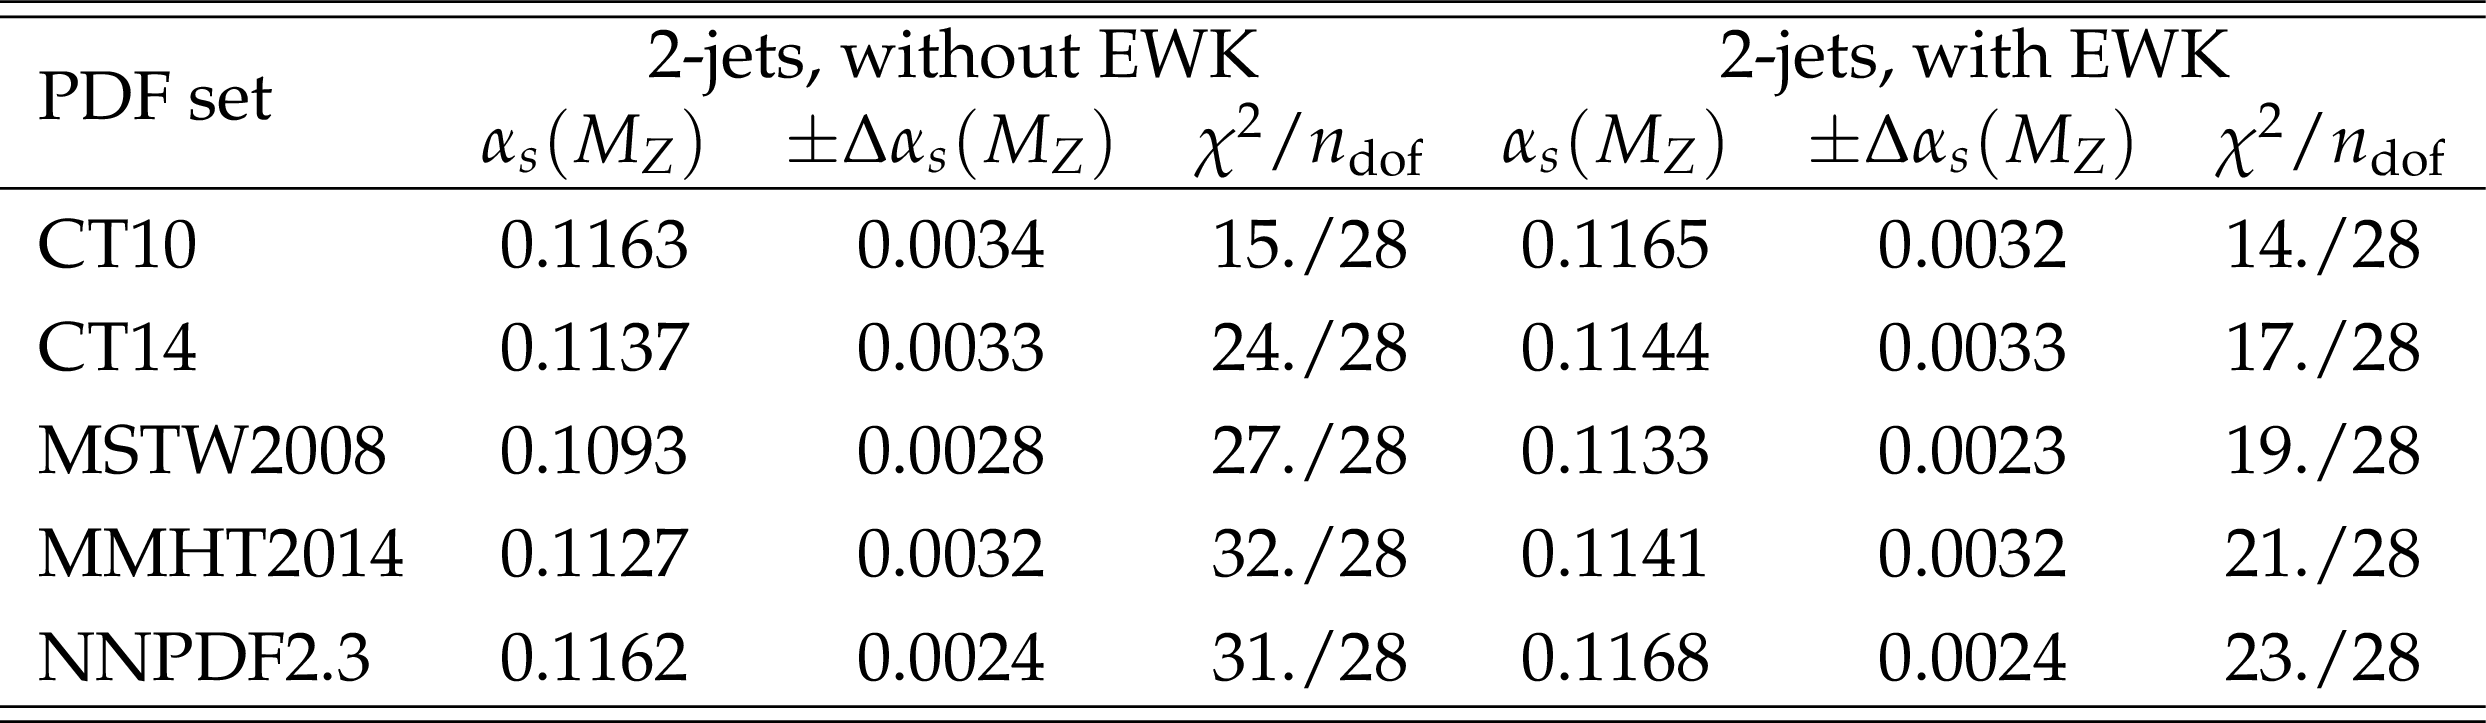
Table 5:
Determination of $ {\alpha _s(M_{\mathrm{Z}})} $ from the inclusive 2-jet event cross section using five PDF sets at NLO with (right) and without (left) EWK corrections. Only total uncertainties without scale variations are quoted. The results are obtained from a simultaneous fit to all 29 $ {H_{\mathrm {T,2}}/2} $ bins in the range of 0.3 $ < {H_{\mathrm {T,2}}/2} < $ 1.68 TeV. |
png pdf |
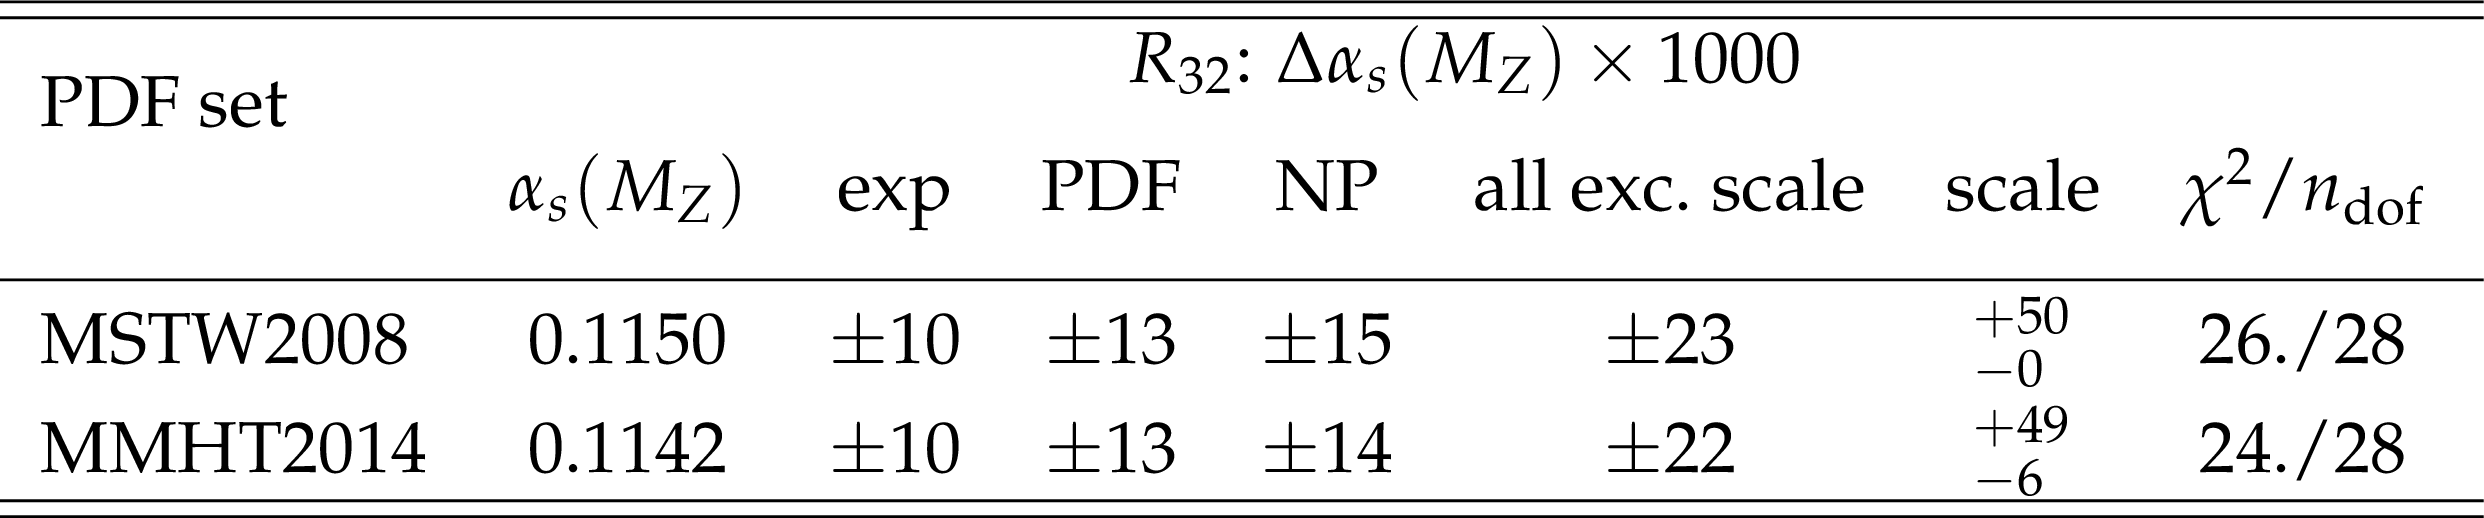
Table 6:
Determination of $ {\alpha _s(M_{\mathrm{Z}})} $ from the ratio $ {R_{32}} $ using the two most compatible PDF sets MSTW2008 and MMHT2014 at NLO. The results are obtained from a simultaneous fit to all 29 $ {H_{\mathrm {T,2}}/2} $ bins in the full range of 0.3 $ < {H_{\mathrm {T,2}}/2} < $ 1.68 TeV. |

png pdf |
Table 7:
Fitted values of $ {\alpha _s(M_{\mathrm{Z}})} $ using $ {R_{32}} $ in the $ {H_{\mathrm {T,2}}/2} $ range from 0.3 up to 1.68 TeV at the central scale and for the six scale factor combinations for the two PDF sets MSTW2008 and MMHT2014. |

png pdf |
Table 8:
Uncertainty composition for $ {\alpha _s(M_{\mathrm{Z}})} $ from the determination of ${\alpha _S}$ from the jet event rate $ {R_{32}} $ in bins of $ {H_{\mathrm {T,2}}/2} $ . The statistical uncertainty of the NLO computation is negligible in comparison to any of the other sources of uncertainty. Electroweak corrections, significant only at high $ {H_{\mathrm {T,2}}/2} $ , are assumed to cancel between the numerator and denominator. |
png pdf |
Table 9:
Evolution of the strong coupling constant between the scale of the Z boson mass and the cross-section averaged $ {H_{\mathrm {T,2}}/2} $ scale $ < Q > $ for the separate determinations in each respective fit range. The evolution is performed for five flavours at 2-loop order with the RunDec program [50,51]. |
| Summary |
| A measurement of the inclusive 2-jet (3-jet) event cross sections has been presented in a range of 0.3 $ < H_{\mathrm{T},2}/2 < $ 2.0 TeV (0.3 $ < H_{\mathrm{T},2}/2 < $ 1.68 TeV) for the average $ p_{\mathrm{T}} $ of the two leading jets at central rapidity of $|y|< $ 2.5. The data sample has been collected from proton-proton collisions at 8 TeV centre-of-mass energy and corresponds to an integrated luminosity of 19.7 fb$^{-1}$. The data are found to be well described by calculations at NLO in pQCD complemented with NP corrections that are important at low $ H_{\mathrm{T},2} /2 $. The upwards trend seen in the 2- and 3-jet data at high $ H_{\mathrm{T},2} /2 $ in comparison to the prediction at NLO QCD, is explained by the onset of EWK corrections in the 2-jet case. For the 3-jet event cross section these correction have not yet been computed. In the 3-jet to 2-jet cross section ratio the EWK corrections are assumed to cancel. In fact, NLO QCD provides an adequate description of $R_{32}$ in the accessible range of $ H_{\mathrm{T},2} /2 $. In contrast, LO tree-level MC predictions exhibit significant deviations. Based on the observed agreement, the strong coupling constant is determined in a fit to the $R_{32}$ measurement to$ \ \ \ \ \alpha_s(M_{\mathrm{Z}}) = $ 0.1150 $\pm$ 0.0023 (exp) $\pm$ 0.0013 (PDF) $\pm$ 0.0015 (NP) $^{+0.0050}_{-0.0000}$ (scale)$ \ \ \ \ \phantom{\alpha_s(M_{\mathrm{Z}}) = } $ 0.1150 $\pm$ 0.0010 (all except scale) $^{+0.0050}_{-0.0000}$ (scale)using the MSTW2008 PDF set. Employing the MMHT2014 PDF set instead leads to very similar results. Equally compatible determinations of $\alpha_{s}(M_{\mathrm{Z}})$ are achieved with separate fits to the inclusive 2-jet and 3-jet event cross sections employing various PDF sets provided the range in HT,2/2 is restricted to 0.3 $ < H_{\mathrm{T},2} /2 < $ 1.0 TeV. The result for $\alpha_{s}(M_{\mathrm{Z}})$ is in agreement with previous determinations obtained by the ATLAS and CMS collaborations [11, 12, 26, 48, 53, 54] and with the world average value of $\alpha_{s}(M_{\mathrm{Z}}) = $ 0.1181 $\pm$ 0.0011 derived in Ref. [52]. |
| References | ||||
| 1 | ALICE Collaboration | Measurement of the inclusive differential jet cross section in pp collisions at $ \sqrt{s} = $ 2.76 TeV | PLB 722 (2013) 262 | 1301.3475 |
| 2 | ATLAS Collaboration | Measurement of inclusive jet and dijet cross sections in proton-proton collisions at 7 TeV centre-of-mass energy with the ATLAS detector | EPJC 71 (2011) 1512 | 1009.5908 |
| 3 | ATLAS Collaboration | Measurement of inclusive jet and dijet production in pp collisions at $ \sqrt{s}= $ 7 TeV using the ATLAS detector | PRD 86 (2012) 014022 | 1112.6297 |
| 4 | ATLAS Collaboration | Measurement of the inclusive jet cross section in pp collisions at $ \sqrt{s} = $ 2.76 TeV and comparison to the inclusive jet cross section at $ \sqrt{s}= $ 7 TeV using the ATLAS detector | EPJC 73 (2013) 2509 | 1304.4739 |
| 5 | ATLAS Collaboration | Measurement of the inclusive jet cross-section in proton-proton collisions at $ \sqrt{s}= $ 7 TeV using 4.5 fb$ ^{-1} $ of data with the ATLAS detector | JHEP 02 (2015) 153 | 1410.8857 |
| 6 | CMS Collaboration | Measurement of the Inclusive Jet Cross Section in pp Collisions at $ \sqrt{s}= $ 7 TeV | PRL 107 (2011) 132001 | CMS-QCD-10-011 1106.0208 |
| 7 | CMS Collaboration | Measurement of the inclusive production cross sections for forward jets and for dijet events with one forward and one central jet in pp collisions at $ \sqrt{s}= $ 7 TeV | JHEP 06 (2012) 036 | CMS-FWD-11-002 1202.0704 |
| 8 | CMS Collaboration | Measurements of differential jet cross sections in proton-proton collisions at $ \sqrt{s}= $ 7 TeV with the CMS detector | PRD 87 (2013) 112002 | CMS-QCD-11-004 1212.6660 |
| 9 | CMS Collaboration | Measurement of the ratio of inclusive jet cross sections using the anti-$ k_T $ algorithm with radius parameters $ R = $ 0.5 and 0.7 in pp collisions at $ \sqrt{s} $ = 7 TeV | PRD 90 (2014) 072006 | CMS-SMP-13-002 1406.0324 |
| 10 | CMS Collaboration | Measurement of the double-differential inclusive jet cross section in proton-proton collisions at $ \sqrt{s}= $ 13 TeV | EPJC 76 (2016), no. 8, 451 | CMS-SMP-15-007 1605.04436 |
| 11 | CMS Collaboration | Measurement and QCD analysis of double-differential inclusive jet cross-sections in pp collisions at $ \sqrt{s}= $ 8 TeV and ratios to 2.76 and 7 TeV | Submitted to JHEP | CMS-SMP-14-001 1609.05331 |
| 12 | CMS Collaboration | Measurement of the ratio of the inclusive 3-jet cross section to the inclusive 2-jet cross section in pp collisions at $ \sqrt{s} = $ 7 TeV and first determination of the strong coupling constant in the TeV range | EPJC 73 (2013) 2604 | CMS-QCD-11-003 1304.7498 |
| 13 | M. Cacciari, G. P. Salam, and G. Soyez | The anti-$ k_t $ jet clustering algorithm | JHEP 04 (2008) 063 | 0802.1189 |
| 14 | CMS Trigger and Data Acquisition Group Collaboration | The CMS high level trigger | EPJC 46 (2006) 605 | hep-ex/0512077 |
| 15 | CMS Collaboration | Particle-Flow Event Reconstruction in CMS and Performance for Jets, Taus, and MET | CDS | |
| 16 | CMS Collaboration | Particle-flow commissioning with muons and electrons from J/Psi and W events at 7 TeV | CDS | |
| 17 | M. Cacciari, G. P. Salam, and G. Soyez | FastJet User Manual | EPJC 72 (2012) 1896 | 1111.6097 |
| 18 | CMS Collaboration | Jet energy scale and resolution in the CMS experiment in pp collisions at 8 TeV | Submitted to JINST | CMS-JME-13-004 1607.03663 |
| 19 | T. Sj\"ostrand, S. Mrenna, and P. Z. Skands | PYTHIA 6.4 Physics and Manual | JHEP 05 (2006) 026 | hep-ph/0603175 |
| 20 | CMS Collaboration | Charged particle multiplicities in pp interactions at $ \sqrt{s}= $ 0.9, 2.36, and 7 TeV | JHEP 01 (2011) 079 | CMS-QCD-10-004 1011.5531 |
| 21 | S. Agostinelli et al. | GEANT4: A Simulation toolkit | Nuclear Instruments \& Methods in Physics Research A 506 (2003) 250 | |
| 22 | CMS Collaboration | Description and performance of track and primary-vertex reconstruction with the CMS tracker | JINST 9 (2014), no. 10, P10009 | CMS-TRK-11-001 1405.6569 |
| 23 | CMS Collaboration | Jet Performance in pp Collisions at $ \sqrt{s}= $ 7 TeV | CDS | |
| 24 | G. D'Agostini | A Multidimensional unfolding method based on Bayes' theorem | NIMA 362 (1995) 487 | |
| 25 | T. Adye | Unfolding algorithms and tests using RooUnfold | in Proceedings, PHYSTAT 2011 Workshop on Statistical Issues Related to Discovery Claims in Search Experiments and Unfolding, Geneva, Switzerland | 1105.1160 |
| 26 | CMS Collaboration | Measurement of the inclusive 3-jet production differential cross section in proton-proton collisions at 7 TeV and determination of the strong coupling constant in the TeV range | EPJC 75 (2015) 186 | CMS-SMP-12-027 1412.1633 |
| 27 | CMS Collaboration | CMS Luminosity Based on Pixel Cluster Counting - Summer 2013 Update | CMS-PAS-LUM-13-001 | CMS-PAS-LUM-13-001 |
| 28 | Z. Nagy | Three jet cross-sections in hadron hadron collisions at next-to-leading order | PRL 88 (2002) 122003 | hep-ph/0110315 |
| 29 | Z. Nagy | Next-to-leading order calculation of three-jet observables in hadron hadron collisions | PRD 68 (2003) 094002 | hep-ph/0307268 |
| 30 | D. Britzger, K. Rabbertz, F. Stober, and M. Wobisch | New features in version 2 of the fastNLO project | in Proceedings, XX.\ International Workshop on Deep-Inelastic Scattering and Related Subjects (DIS 2012), Bonn, Germany | 1208.3641 |
| 31 | A. Buckley et al. | LHAPDF6: parton density access in the LHC precision era | EPJC75 (2015) 132 | 1412.7420 |
| 32 | CMS Collaboration | Measurement of the inclusive jet cross section in pp collisions at $ \sqrt{s} = $ 2.76 TeV | EPJC 76 (2016) 265 | CMS-SMP-14-017 1512.06212 |
| 33 | S. Alekhin, J. Bl\"umlein, and S. Moch | Parton Distribution Functions and Benchmark Cross Sections at NNLO | PRD 86 (2012) 054009 | 1202.2281 |
| 34 | H.-L. Lai et al. | New parton distributions for collider physics | PRD 82 (2010) 074024 | 1007.2241 |
| 35 | A. D. Martin, W. J. Stirling, R. S. Thorne, and G. Watt | Parton distributions for the LHC | EPJC 63 (2009) 189 | 0901.0002 |
| 36 | A. D. Martin, W. J. Stirling, R. S. Thorne, and G. Watt | Uncertainties on $ \alpha_S $ in global PDF analyses and implications for predicted hadronic cross sections | EPJC 64 (2009) 653 | 0905.3531 |
| 37 | R. D. Ball et al. | Parton distributions with LHC data | Nucl. Phys. B 867 (2013) 244 | 1207.1303 |
| 38 | S. Dulat et al. | New parton distribution functions from a global analysis of quantum chromodynamics | PRD 93 (2016) 033006 | 1506.07443 |
| 39 | H1, ZEUS Collaboration | Combination of measurements of inclusive deep inelastic $ {e^{\pm }p} $ scattering cross sections and QCD analysis of HERA data | EPJC 75 (2015) 580 | 1506.06042 |
| 40 | L. Harland-Lang, A. Martin, P. Motylinski, and R. Thorne | Parton distributions in the LHC era: MMHT 2014 PDFs | EPJC 75 (2015), no. 5, 204 | 1412.3989 |
| 41 | NNPDF Collaboration | Parton distributions for the LHC Run II | JHEP 04 (2015) 040 | 1410.8849 |
| 42 | S. Dittmaier, A. Huss, and C. Speckner | Weak radiative corrections to dijet production at hadron colliders | JHEP 11 (2012) 095 | 1210.0438 |
| 43 | M. B\"ahr et al. | Herwig++ Physics and Manual | EPJC 58 (2008) 639 | 0803.0883 |
| 44 | P. Nason | A New method for combining NLO QCD with shower Monte Carlo algorithms | JHEP 11 (2004) 040 | hep-ph/0409146 |
| 45 | S. Frixione, P. Nason, and C. Oleari | Matching NLO QCD computations with Parton Shower simulations: the POWHEG method | JHEP 11 (2007) 070 | 0709.2092 |
| 46 | S. Alioli et al. | Jet pair production in POWHEG | JHEP 04 (2011) 081 | 1012.3380 |
| 47 | CMS Collaboration | Event generator tunes obtained from underlying event and multiparton scattering measurements | EPJC 76 (2015) 155 | CMS-GEN-14-001 1512.00815 |
| 48 | CMS Collaboration | Constraints on parton distribution functions and extraction of the strong coupling constant from the inclusive jet cross section in pp collisions at $ \sqrt{s} = $ 7 TeV | EPJC 75 (2015) 288 | CMS-SMP-12-028 1410.6765 |
| 49 | J. Pumplin et al. | New generation of parton distributions with uncertainties from global QCD analysis | JHEP 07 (2002) 012 | hep-ph/0201195 |
| 50 | K. G. Chetyrkin, J. H. Kuhn, and M. Steinhauser | RunDec: A Mathematica package for running and decoupling of the strong coupling and quark masses | CPC 133 (2000) 43 | hep-ph/0004189 |
| 51 | B. Schmidt and M. Steinhauser | CRunDec: a C++ package for running and decoupling of the strong coupling and quark masses | CPC 183 (2012) 1845 | 1201.6149 |
| 52 | C. Patrignani and others (Particle Data Group) | Review of Particle Physics | CPC 40 (2016) 100001 | |
| 53 | CMS Collaboration | Determination of the top-quark pole mass and strong coupling constant from the $ \mathrm{t}\bar{\mathrm{t}} $ production cross section in pp collisions at $ \sqrt{s} = $ 7 TeV | PLB 728 (2014) 496 | CMS-TOP-12-022 1307.1907 |
| 54 | ATLAS Collaboration | Measurement of transverse energy-energy correlations in multi-jet events in pp collisions at $ \sqrt{s} = $ 7 TeV using the ATLAS detector and determination of the strong coupling constant $ \alpha_{\mathrm{s}}(m_Z) $ | PLB 750 (2015) 427 | 1508.01579 |
| 55 | D0 Collaboration | Determination of the strong coupling constant from the inclusive jet cross section in $ p\bar{p} $ collisions at $ \sqrt{s}= $ 1.96 TeV | PRD 80 (2009) 111107 | 0911.2710 |
| 56 | D0 Collaboration | Measurement of angular correlations of jets at $ \sqrt{s}= $ 1.96 TeV and determination of the strong coupling at high momentum transfers | PLB 718 (2012) 56 | 1207.4957 |
| 57 | H1 Collaboration | Measurement of multijet production in ep collisions at high $ Q^2 $ and determination of the strong coupling $ \alpha _s $ | EPJC 75 (2015) 65 | 1406.4709 |
| 58 | H1 Collaboration | Measurement of Jet Production Cross Sections in Deep-inelastic ep Scattering at HERA | Submitted to EPJC | 1611.03421 |
| 59 | ZEUS Collaboration | Inclusive-jet photoproduction at HERA and determination of $ \alpha_s $ | Nucl. Phys. B 864 (2012) 1 | 1205.6153 |
|
|
Compact Muon Solenoid LHC, CERN |
|

|

|

|

|

|