

Compact Muon Solenoid
LHC, CERN
| CMS-PAS-SUS-16-013 | ||
| Search for $R$-parity-violating SUSY in final states with zero or one lepton and large multiplicity of jets and b-tagged jets | ||
| CMS Collaboration | ||
| August 2016 | ||
| Abstract: Preliminary results are reported from a search for physics beyond the standard model in proton-proton collisions at $\sqrt{s}=$ 13 TeV, focusing on the signature of large multiplicity of jets and b-tagged jets, in a final state with zero or one reconstructed lepton. The data sample corresponds to an integrated luminosity of 2.7 fb$^{-1},$ recorded by the CMS experiment at the Large Hadron Collider. The results are interpreted in terms of limits on the parameter space for the $R$-parity-violating supersymmetric extension of the standard model in a benchmark model of gluino pair production where each gluino decays via $\tilde{\rm g} \rightarrow {\rm tbs}$. Assuming the gluino decays solely to tbs, gluino masses smaller than 1360 GeV are excluded at a 95% confidence level. | ||
| Links: CDS record (PDF) ; inSPIRE record ; CADI line (restricted) ; | ||
| Figures | |
png pdf |
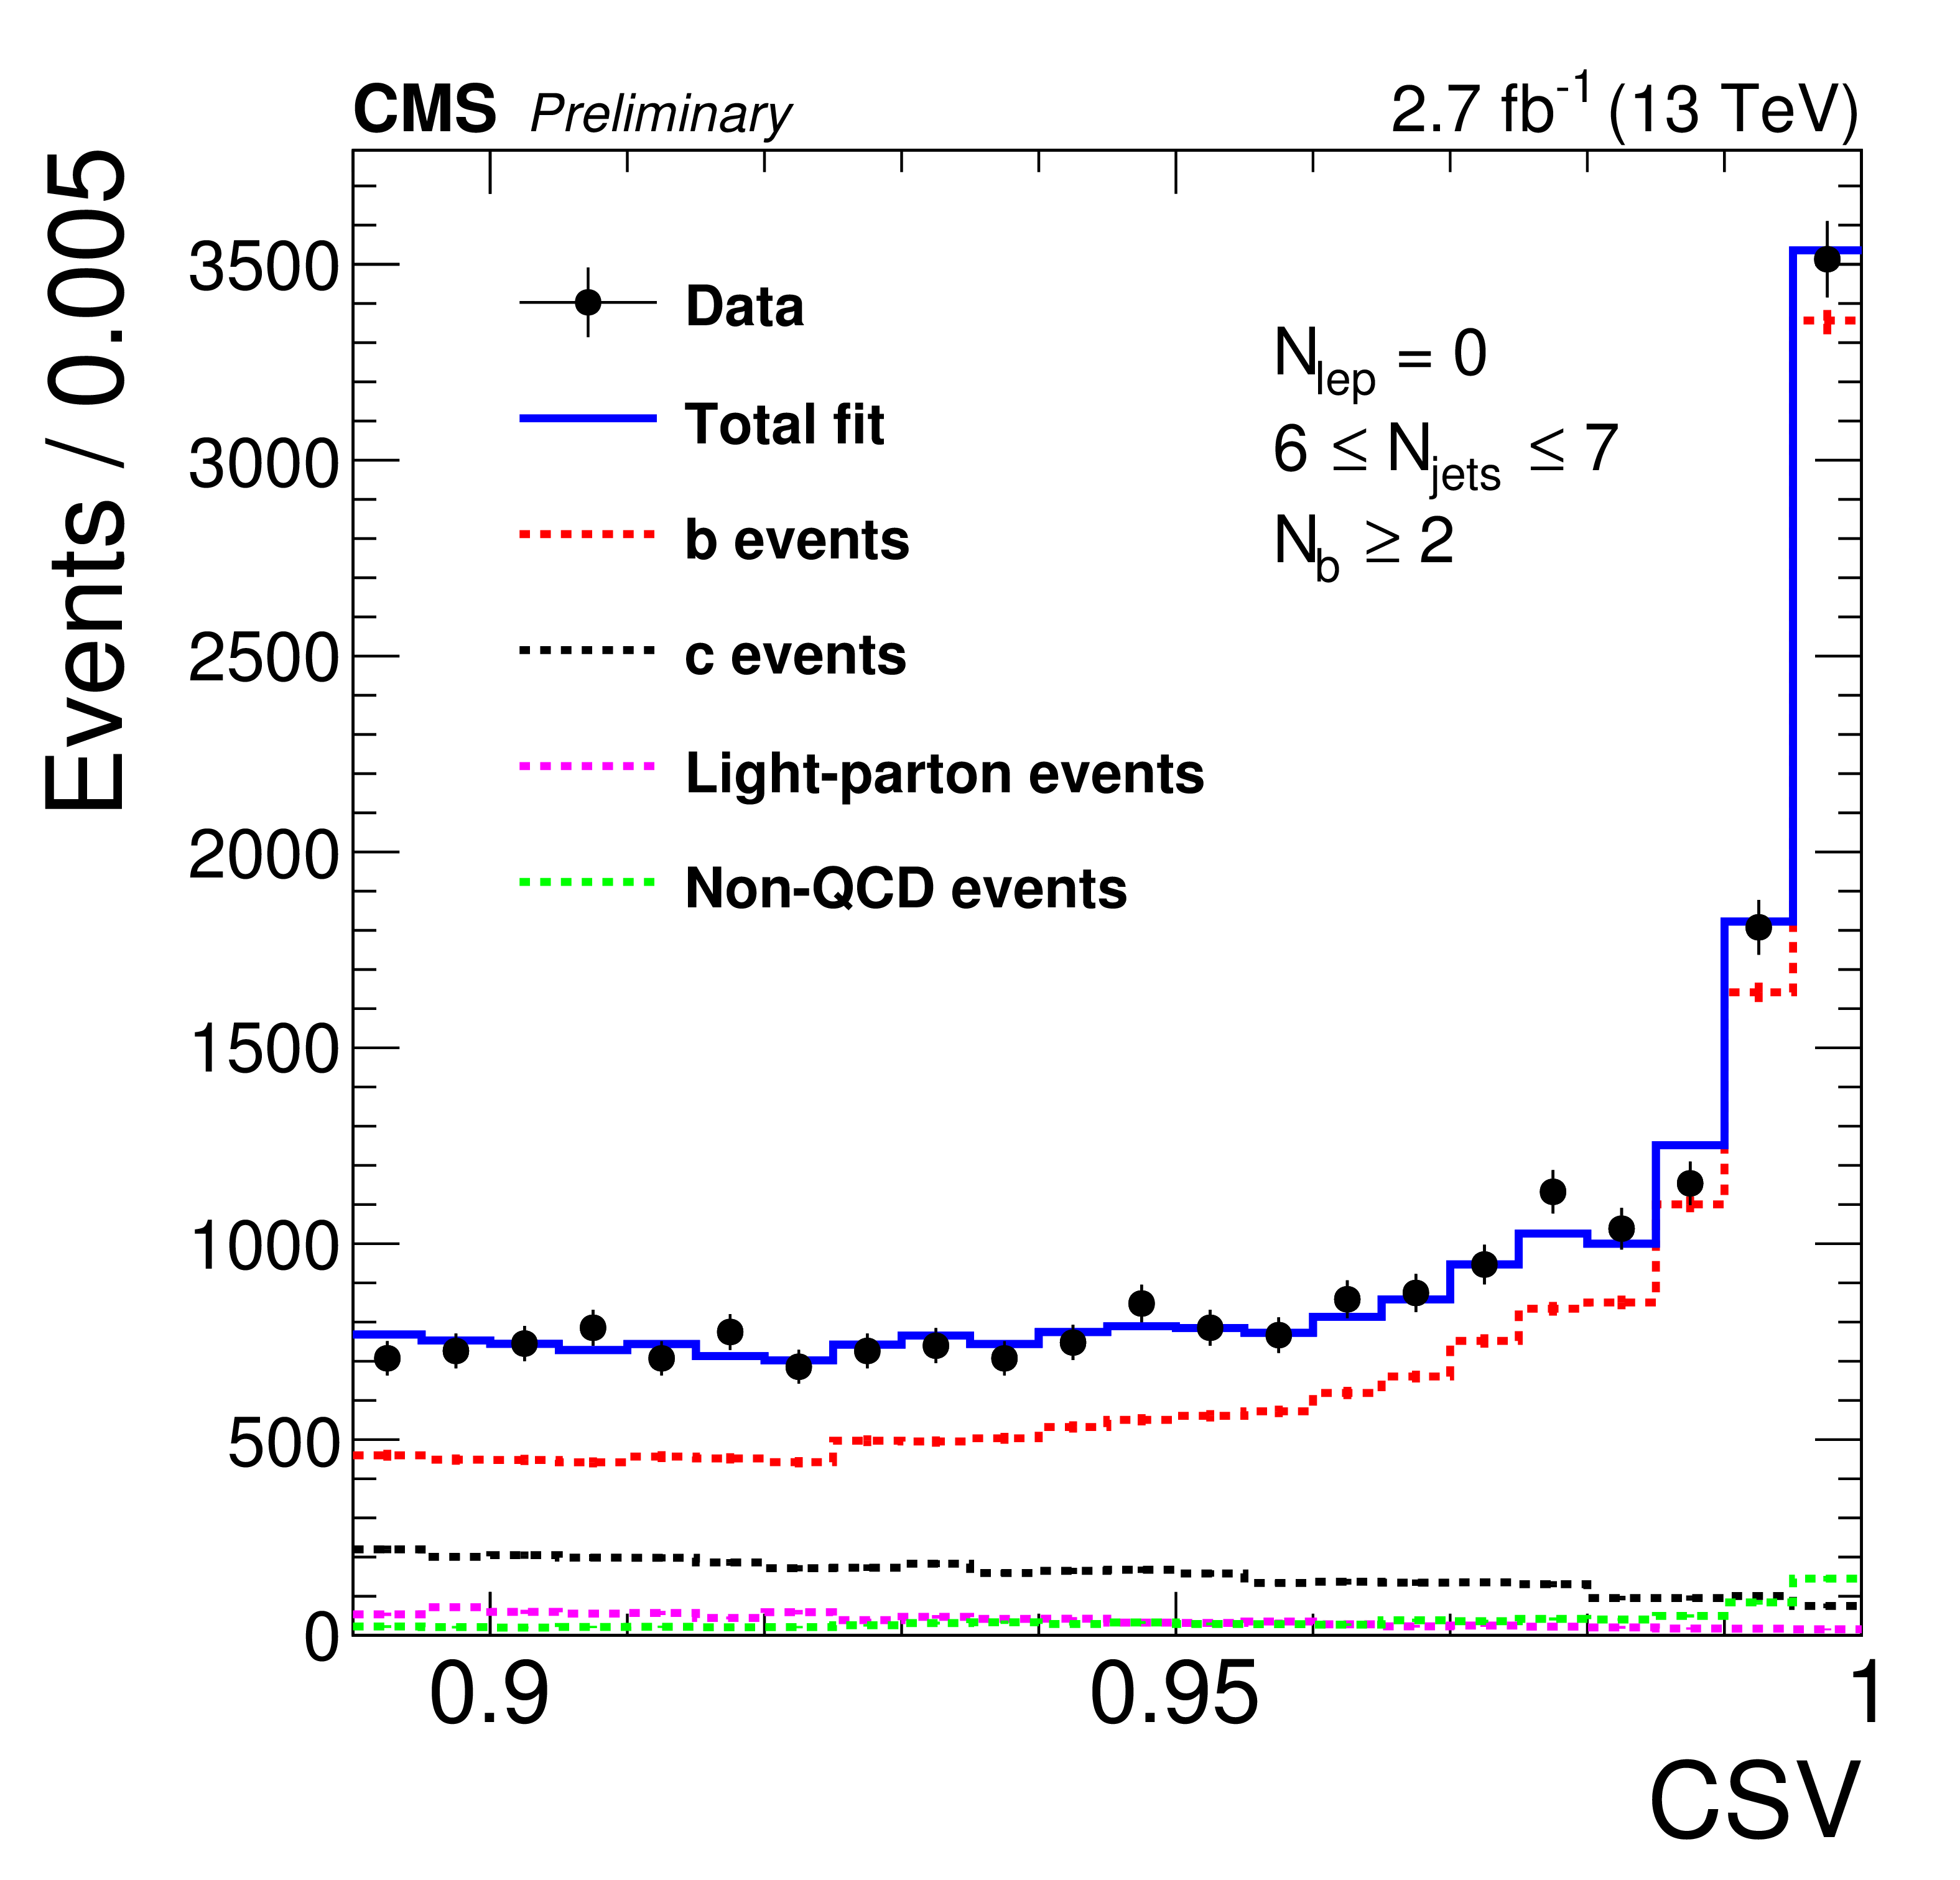
Figure 1:
Fit to the CSV distribution in data in the CSV $> $ 0.89 region for $ {H_{\mathrm {T}}} >$ 1.5 TeV , $N_\text {b}\geq$ 2, and 6 $ \leq N_{\textrm {jet}} \leq $ 7. Error bars indicate the statistical uncertainties in the simulated samples (most of which are smaller than the line width) and the data. |
png pdf |
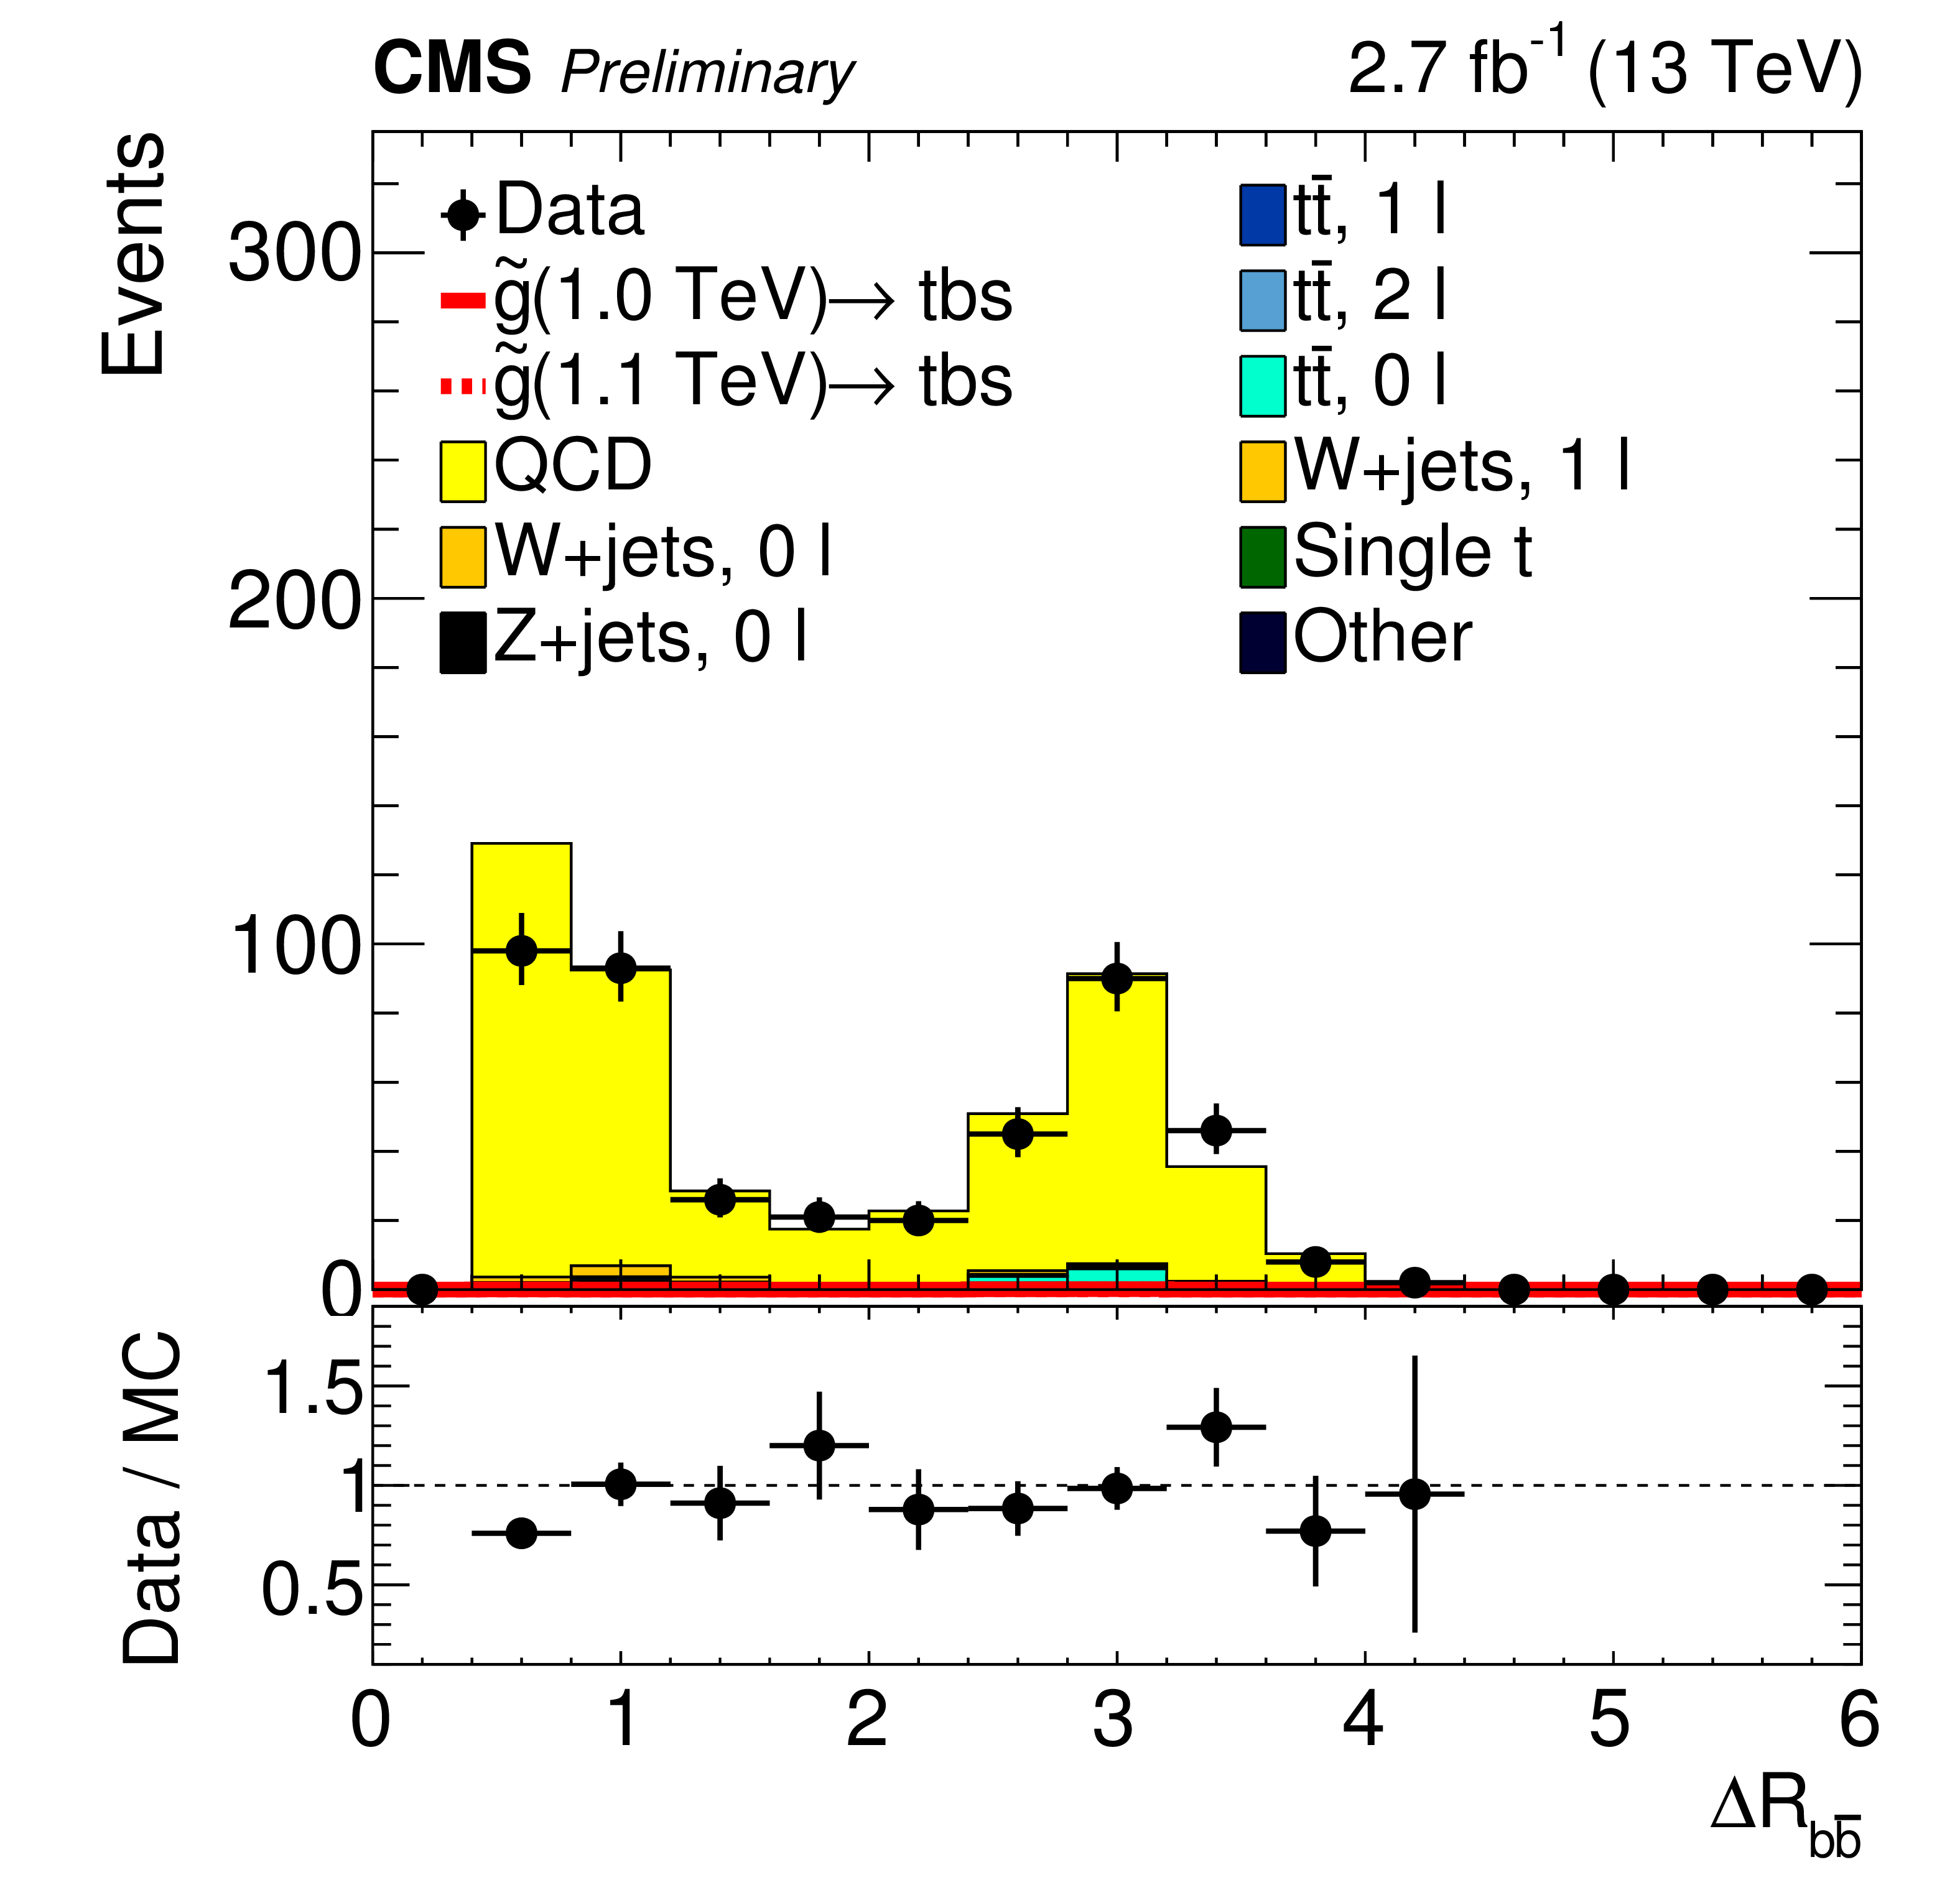
Figure 2-a:
Distributions of $\Delta R_{ { {\mathrm {b}} {\overline {\mathrm {b}}} } }$ after normalization in the $\Delta R_{ { {\mathrm {b}} {\overline {\mathrm {b}}} } } \geq$ 2.4 region for selections of $N_{\textrm {jet}} =$ 4-5 (a) and $N_{\textrm {jet}} =$ 6-7 (b). Events are required to have zero leptons, with $M_\text {J}> $ 500 GeV and $ {N_{\textrm {b}}}=$ 2. As shown by the red lines, the contribution from signal events is negligible for the gluino masses considered here. |
png pdf |
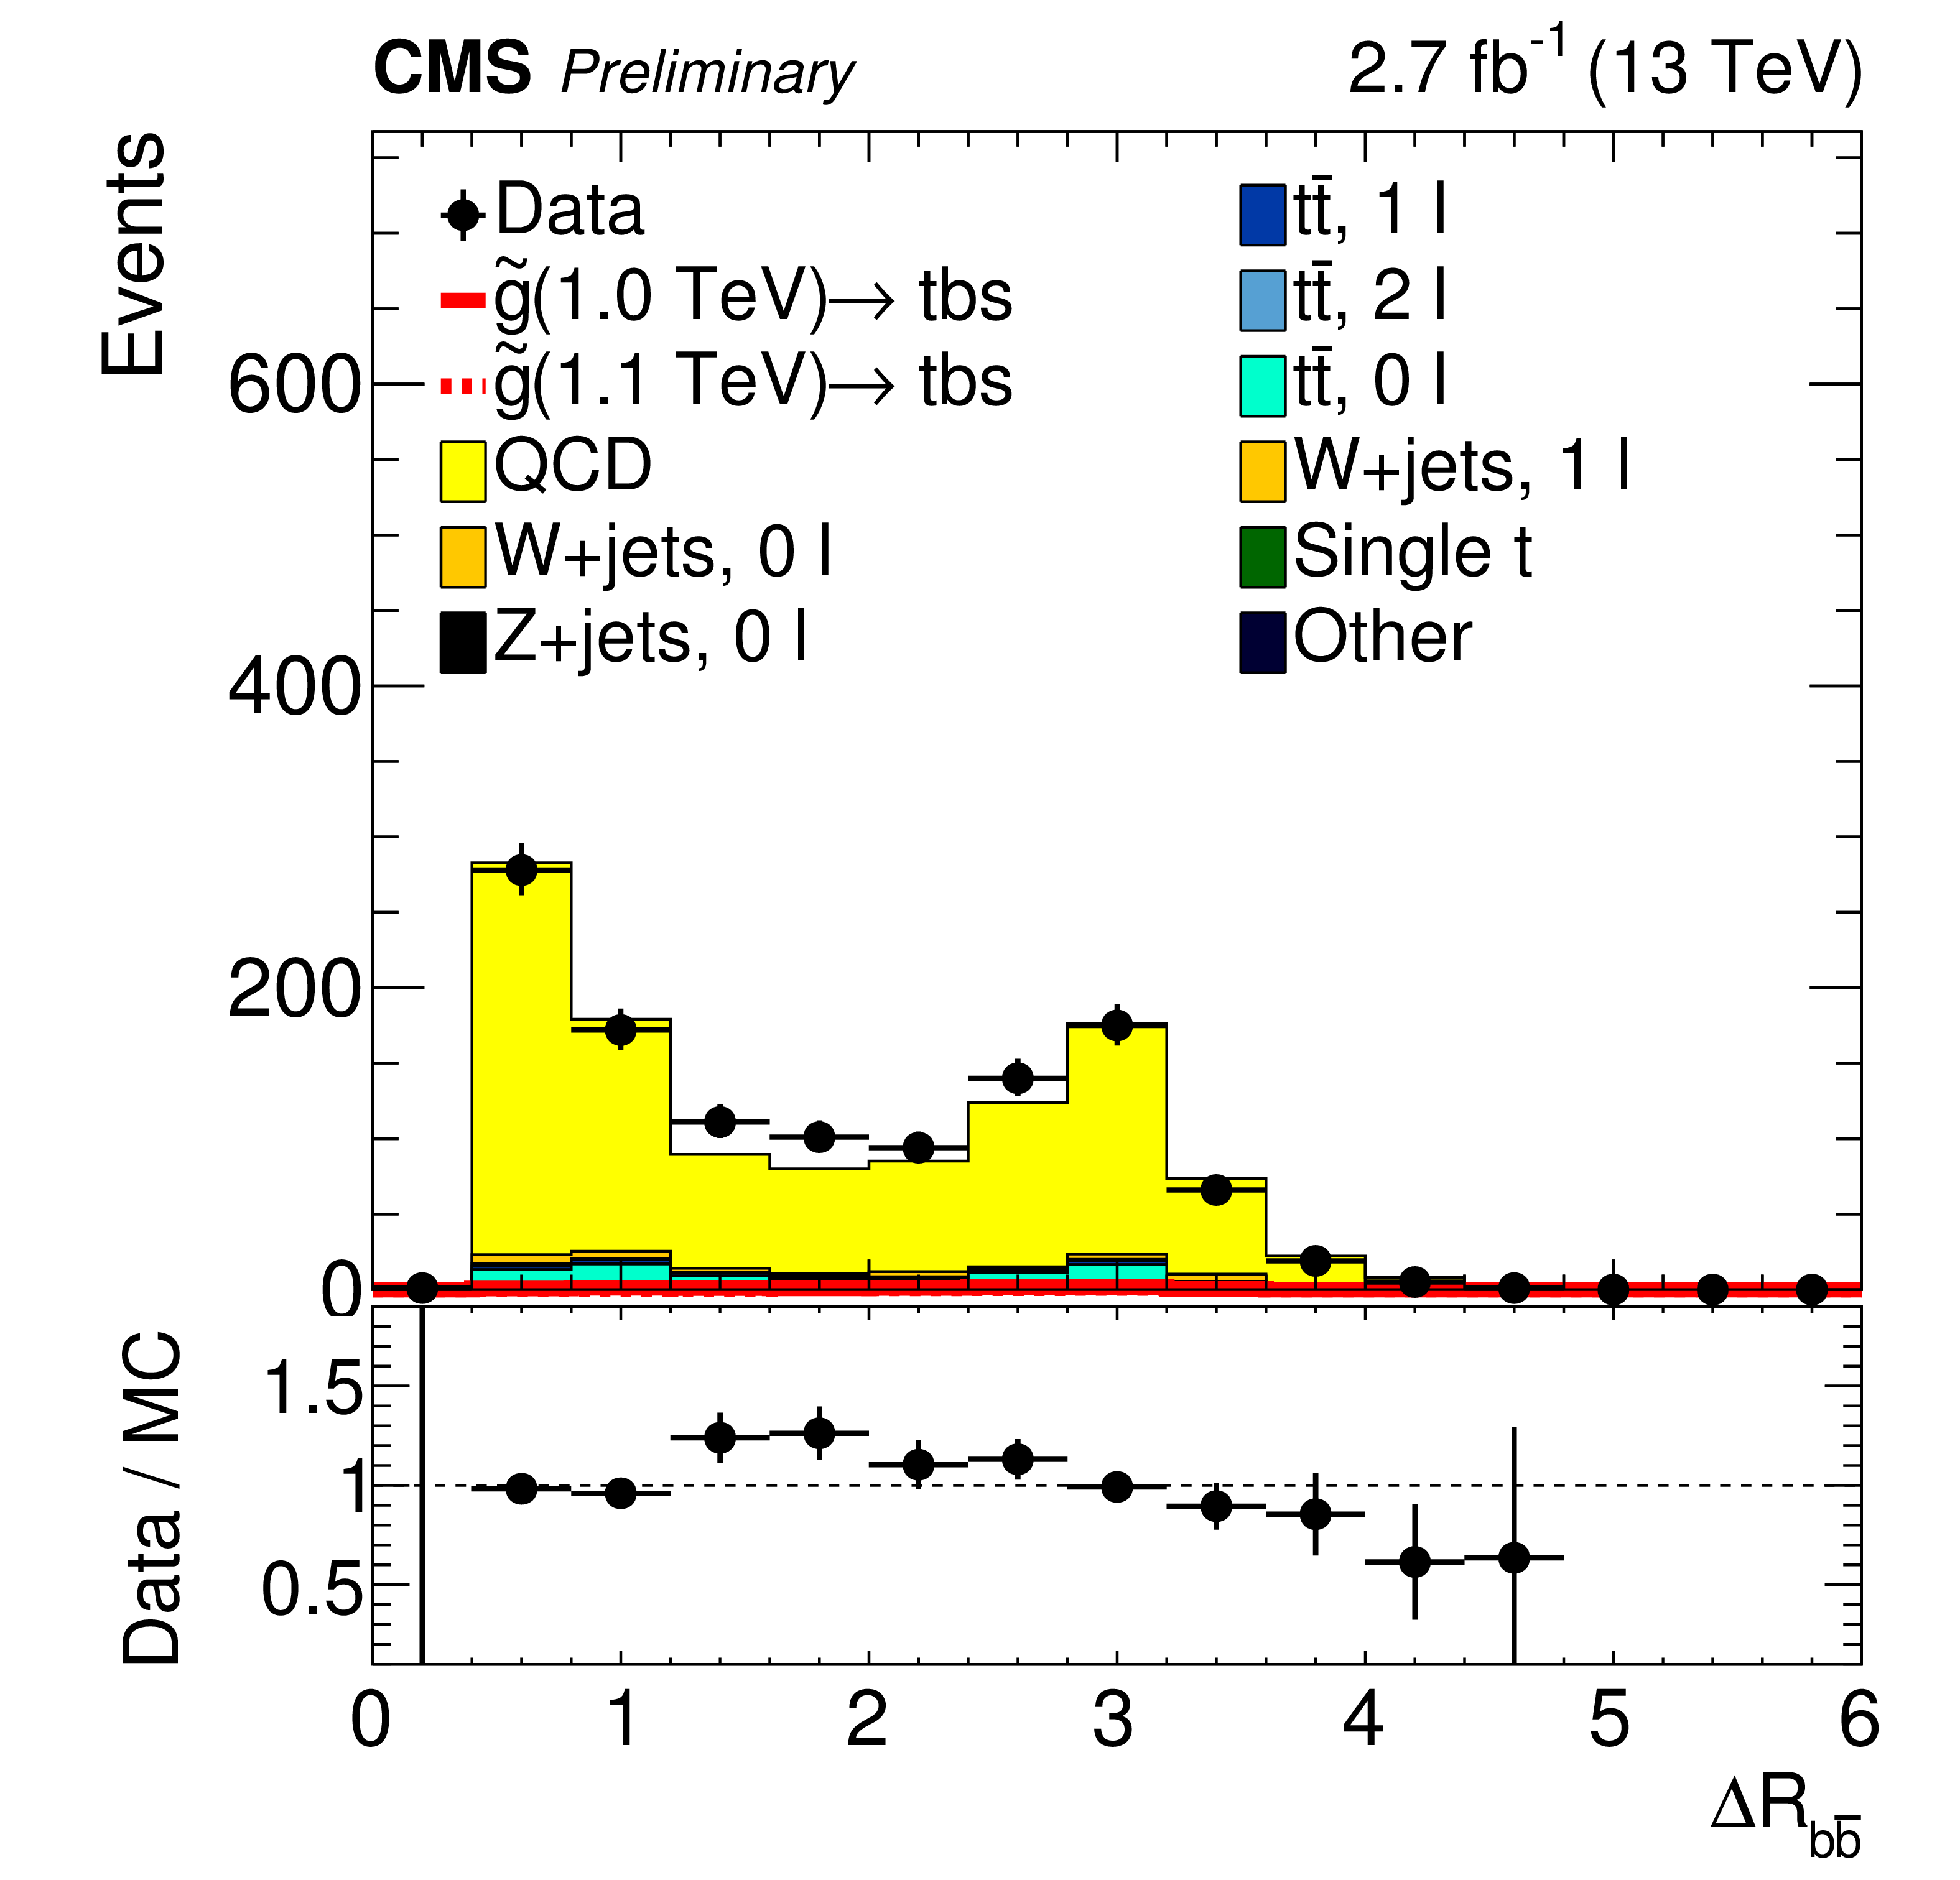
Figure 2-b:
Distributions of $\Delta R_{ { {\mathrm {b}} {\overline {\mathrm {b}}} } }$ after normalization in the $\Delta R_{ { {\mathrm {b}} {\overline {\mathrm {b}}} } } \geq$ 2.4 region for selections of $N_{\textrm {jet}} =$ 4-5 (a) and $N_{\textrm {jet}} =$ 6-7 (b). Events are required to have zero leptons, with $M_\text {J}> $ 500 GeV and $ {N_{\textrm {b}}}=$ 2. As shown by the red lines, the contribution from signal events is negligible for the gluino masses considered here. |
png pdf |
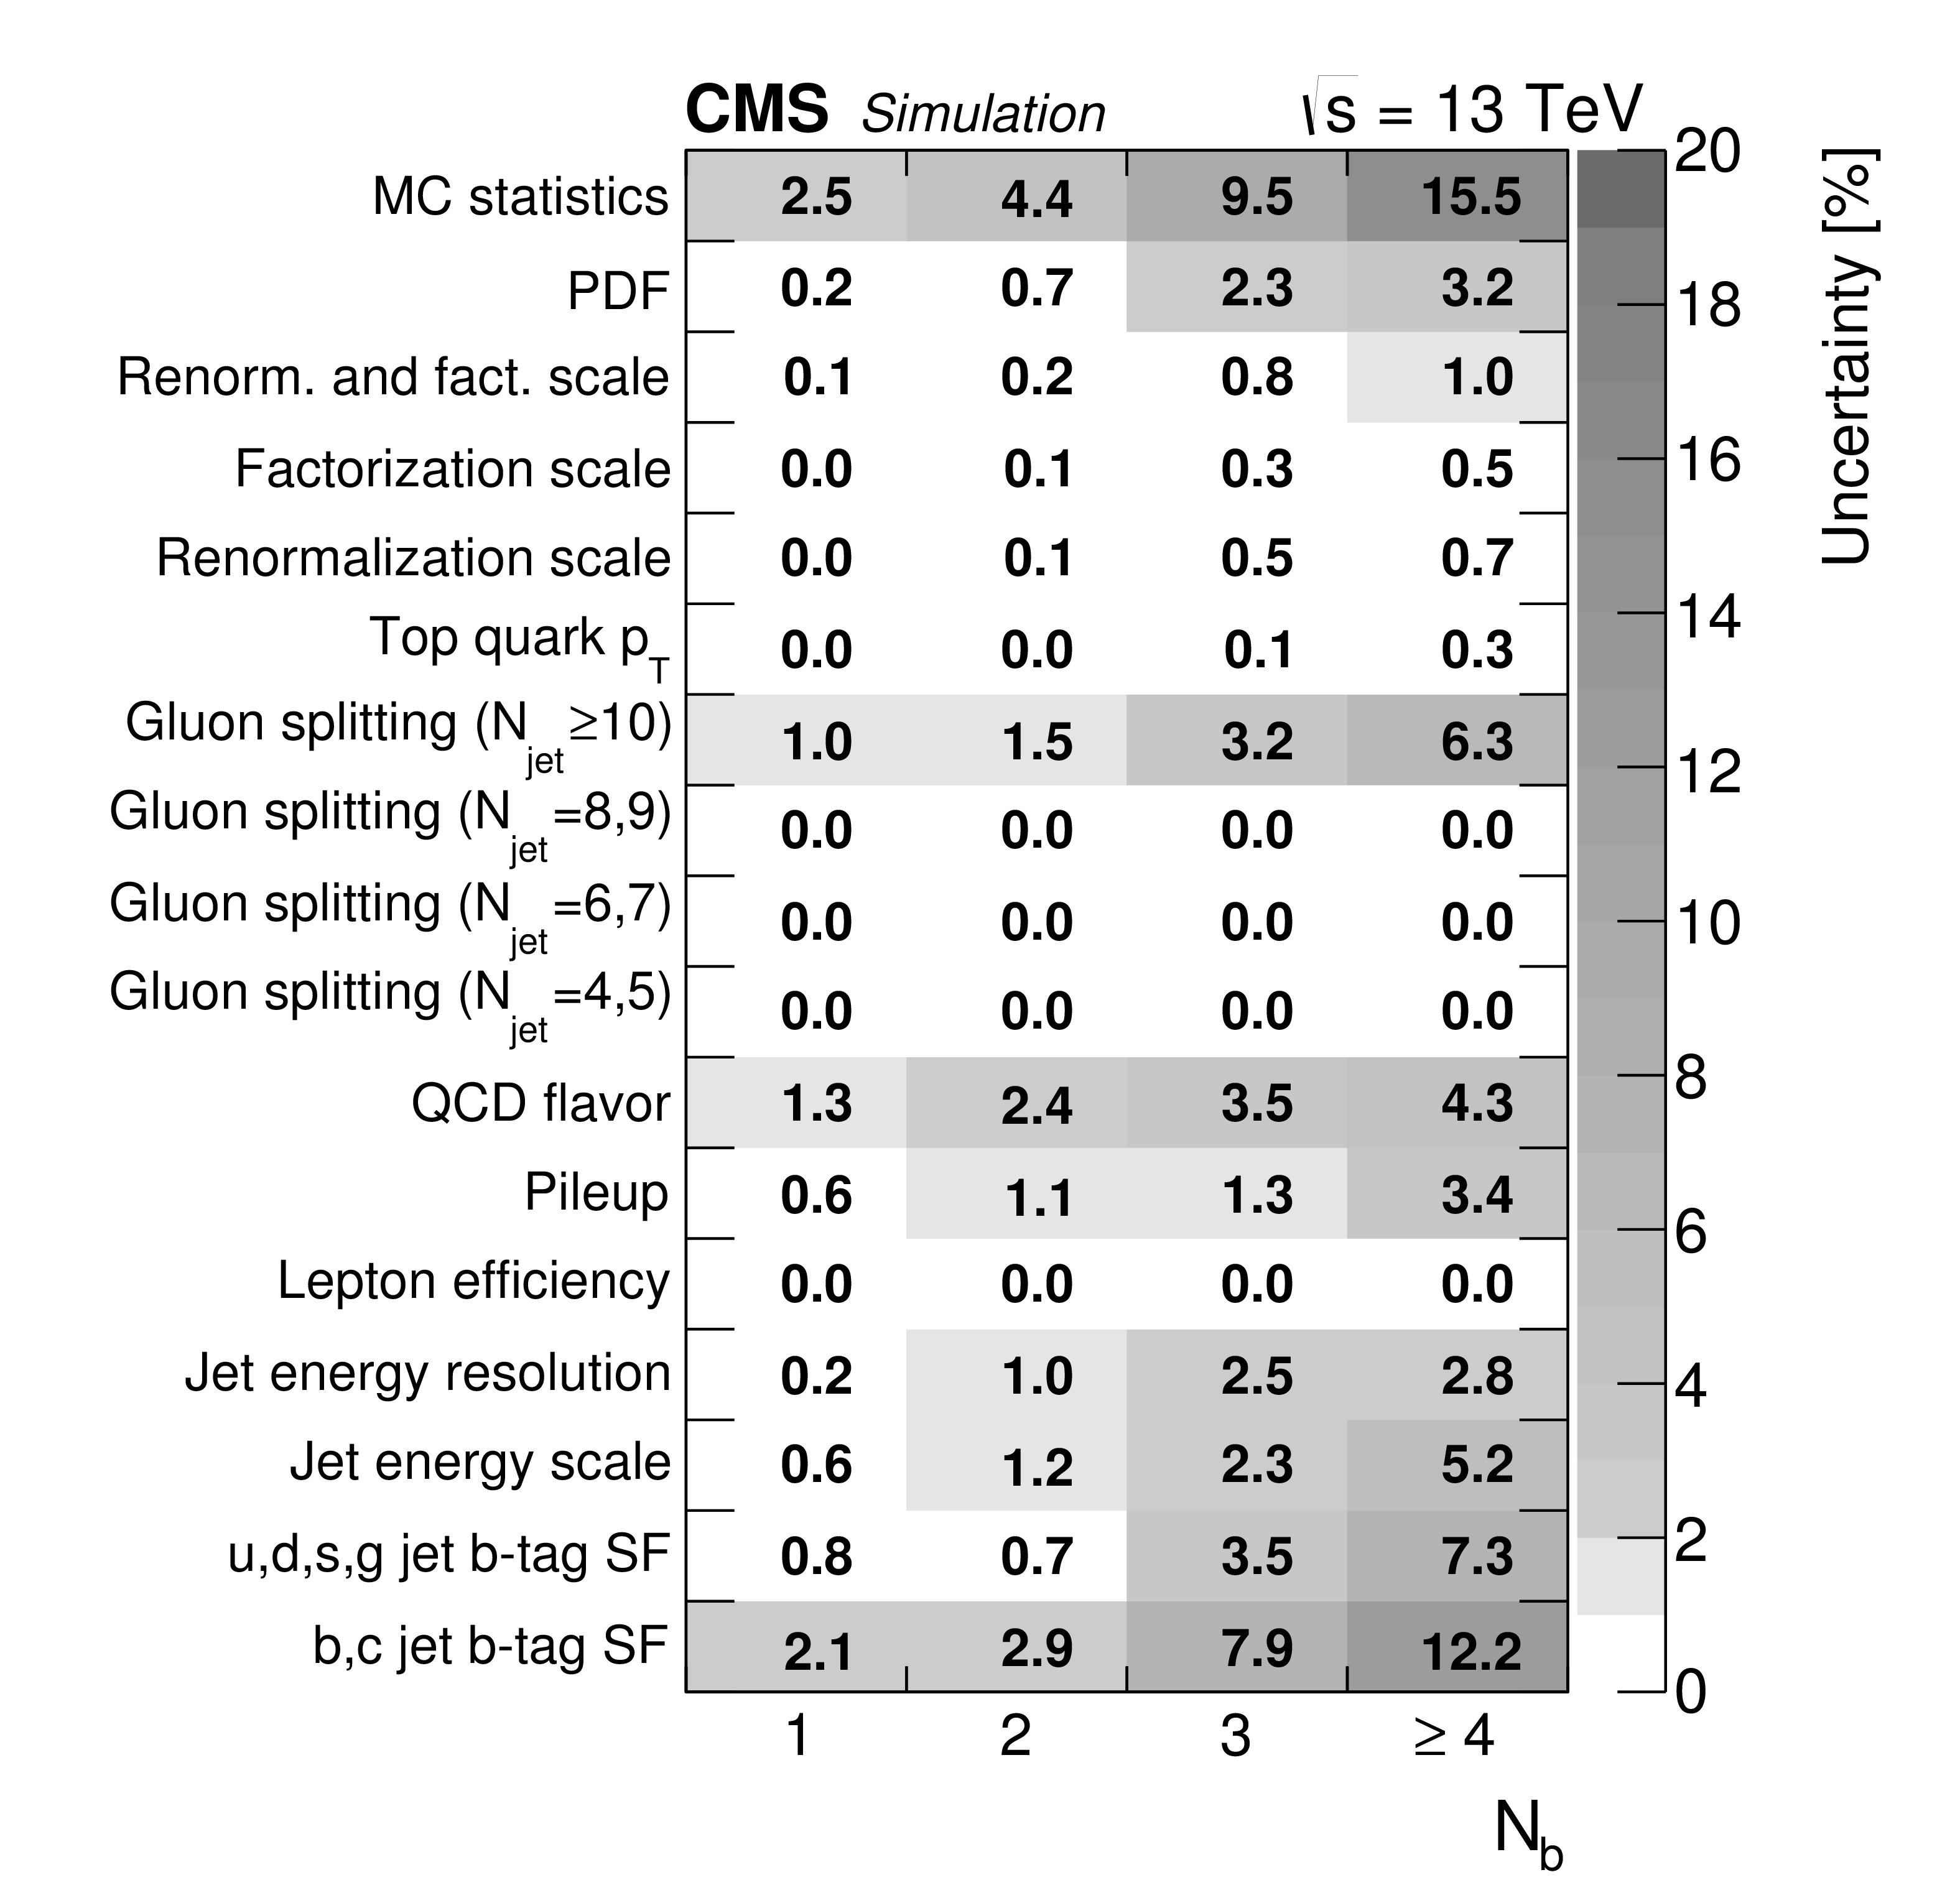
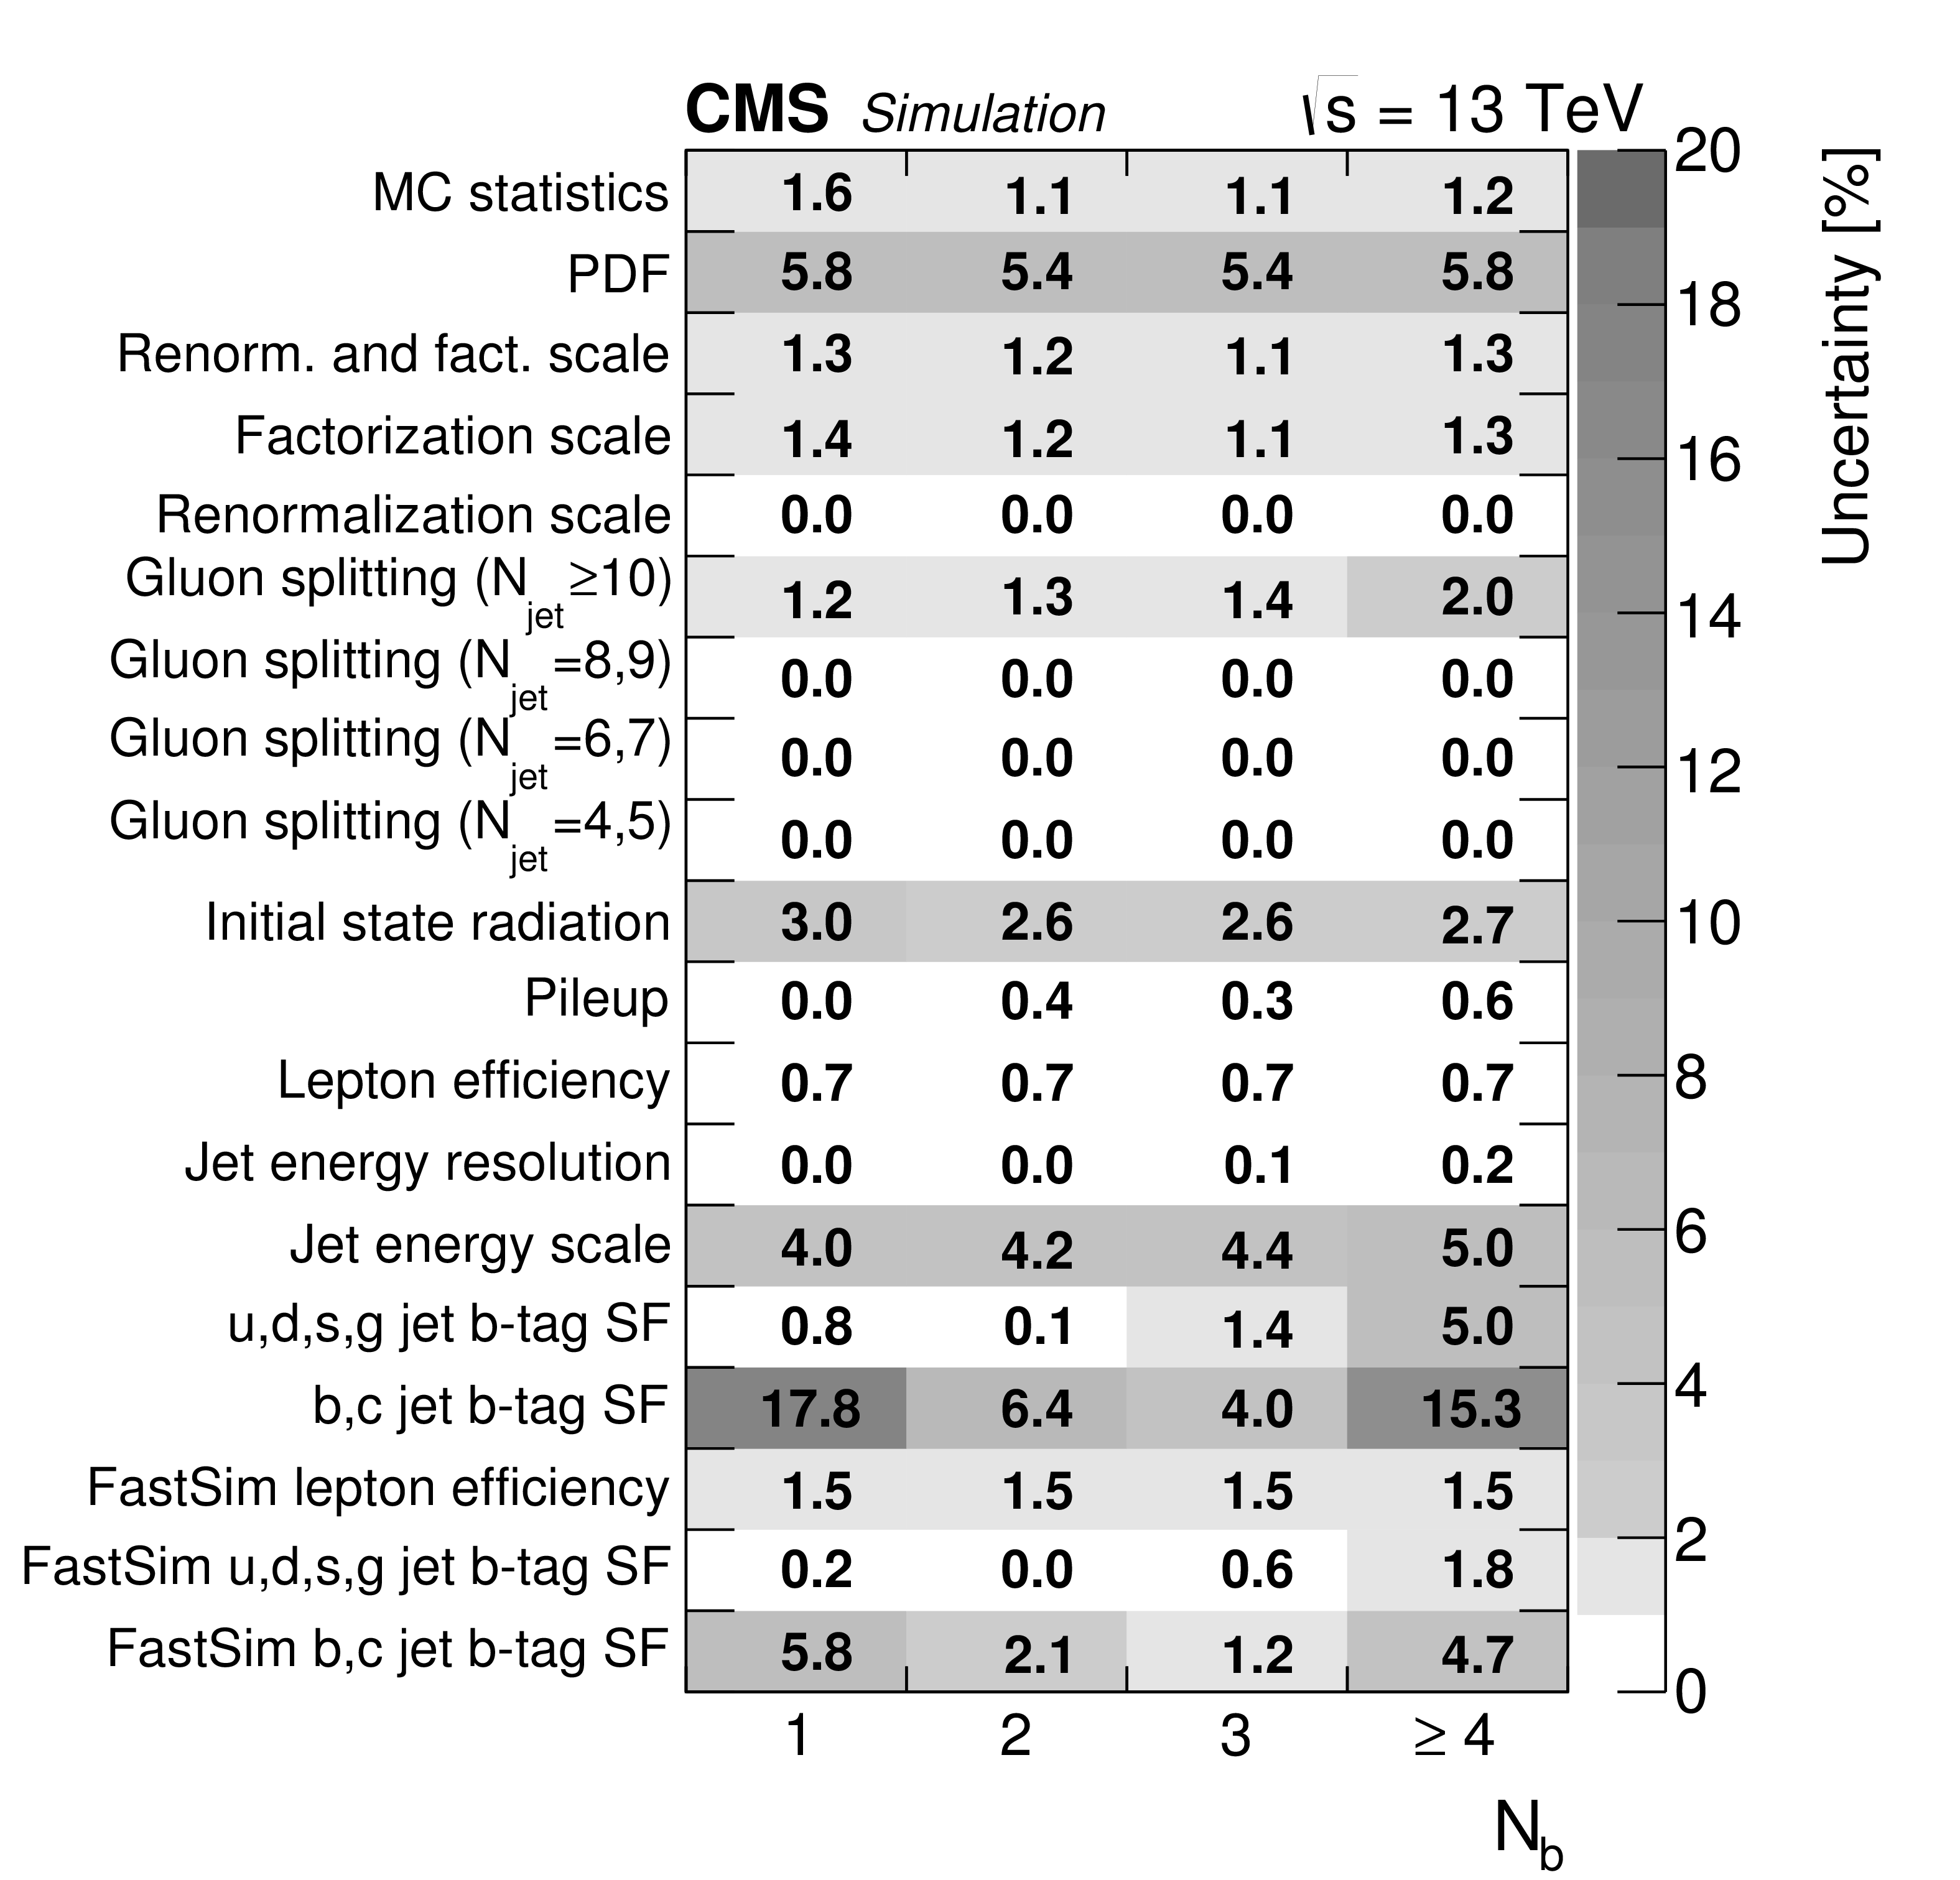
Figure 3-a:
Background systematic uncertainties in the fit regions with the best signal sensitivity. The selection used in the top plot is $N_\text {lep} =$ 0, $N_\text {jet} \geq $ 10, $ {H_{\mathrm {T}}} > $ 1.5 TeV , and $M_\text {J} > $ 800 GeV and the selection used in the bottom plot is $N_\text {lep} = $ 1, $N_\text {jet} \geq $ 8, $ {H_{\mathrm {T}}} > $ 1.2 TeV, and $M_\text {J} > $ 800 GeV. |

png pdf |
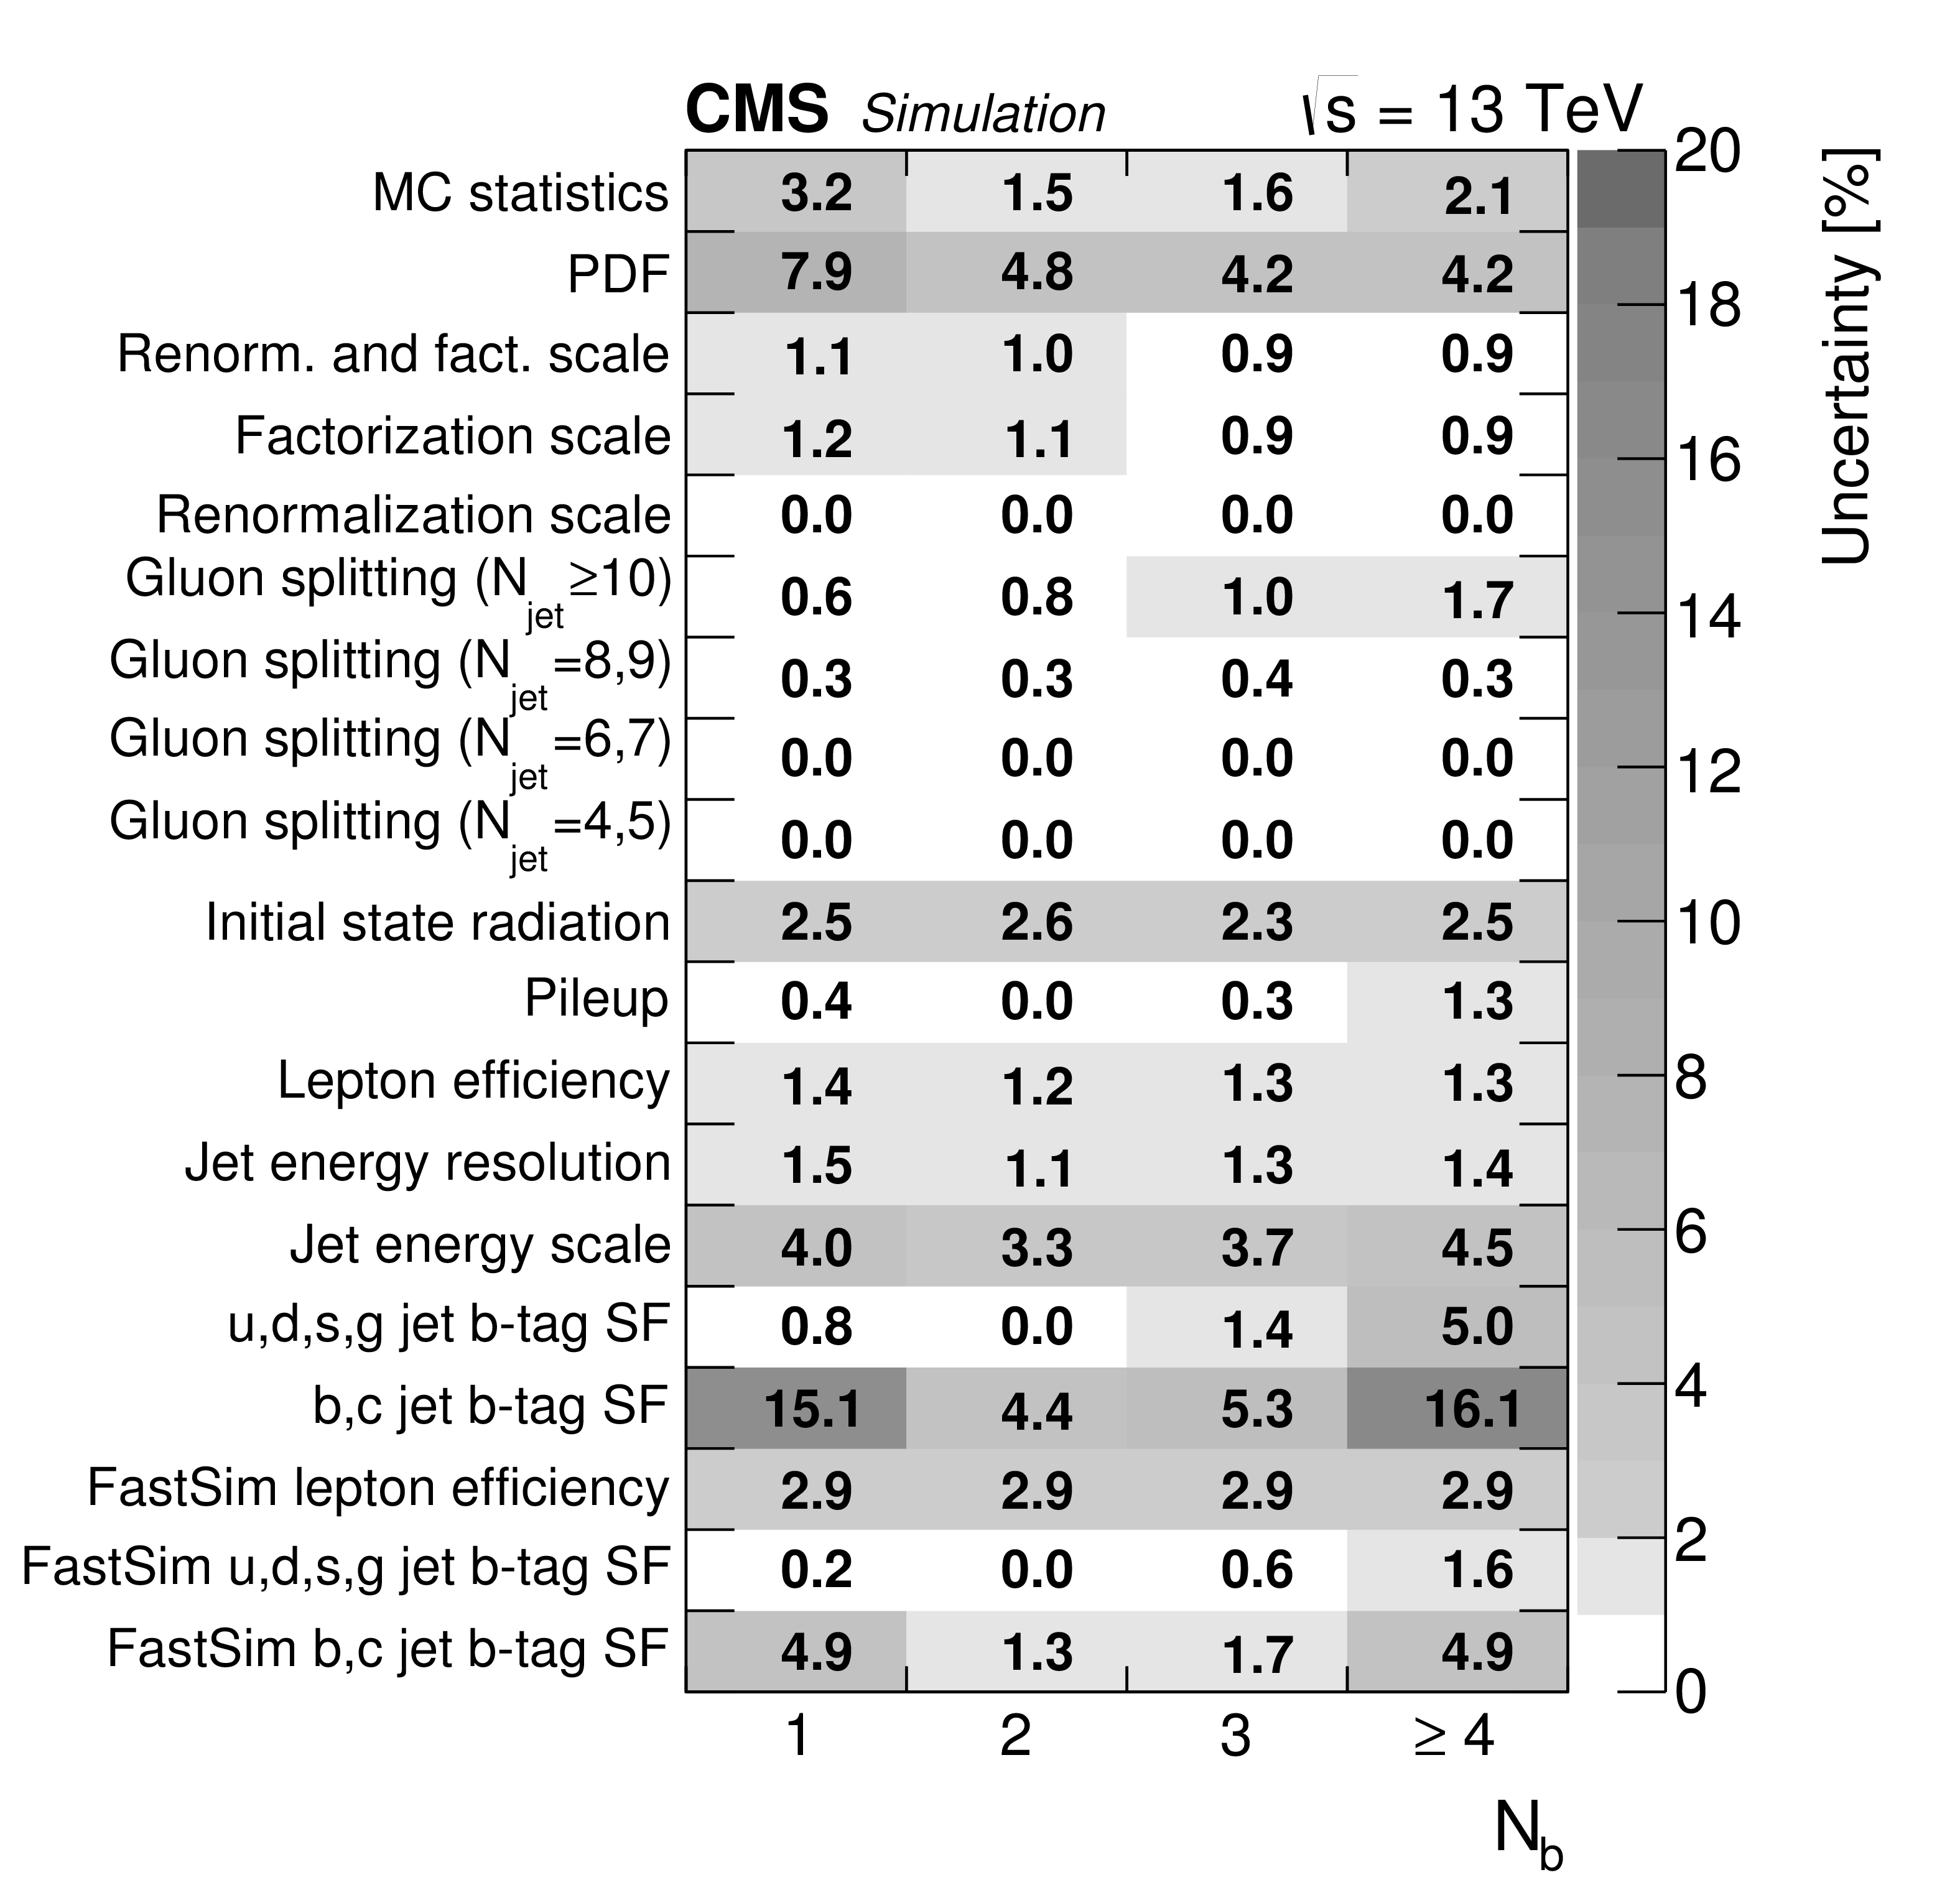
Figure 3-b:
Background systematic uncertainties in the fit regions with the best signal sensitivity. The selection used in the top plot is $N_\text {lep} =$ 0, $N_\text {jet} \geq $ 10, $ {H_{\mathrm {T}}} > $ 1.5 TeV , and $M_\text {J} > $ 800 GeV and the selection used in the bottom plot is $N_\text {lep} = $ 1, $N_\text {jet} \geq $ 8, $ {H_{\mathrm {T}}} > $ 1.2 TeV, and $M_\text {J} > $ 800 GeV. |
png pdf |
Figure 4-a:
Signal systematic uncertainties for $m_{ \tilde{\mathrm{g}} } = $ 1200 GeV in the signal regions with the best signal sensitivity. The selection used in the top plot is $N_\text {lep} = $ 0, $N_\text {jet} \geq $ 10, $ {H_{\mathrm {T}}} > $ 1500 GeV , and $M_\text {J} > $ 800 GeV and the selection used in the bottom plot is $N_\text {lep} = $ 1, $N_\text {jet} \geq $ 8, $ {H_{\mathrm {T}}} > $ 1200 GeV , and $M_\text {J} > $ 800 GeV. |
png pdf |
Figure 4-b:
Signal systematic uncertainties for $m_{ \tilde{\mathrm{g}} } = $ 1200 GeV in the signal regions with the best signal sensitivity. The selection used in the top plot is $N_\text {lep} = $ 0, $N_\text {jet} \geq $ 10, $ {H_{\mathrm {T}}} > $ 1500 GeV , and $M_\text {J} > $ 800 GeV and the selection used in the bottom plot is $N_\text {lep} = $ 1, $N_\text {jet} \geq $ 8, $ {H_{\mathrm {T}}} > $ 1200 GeV , and $M_\text {J} > $ 800 GeV. |
png pdf |
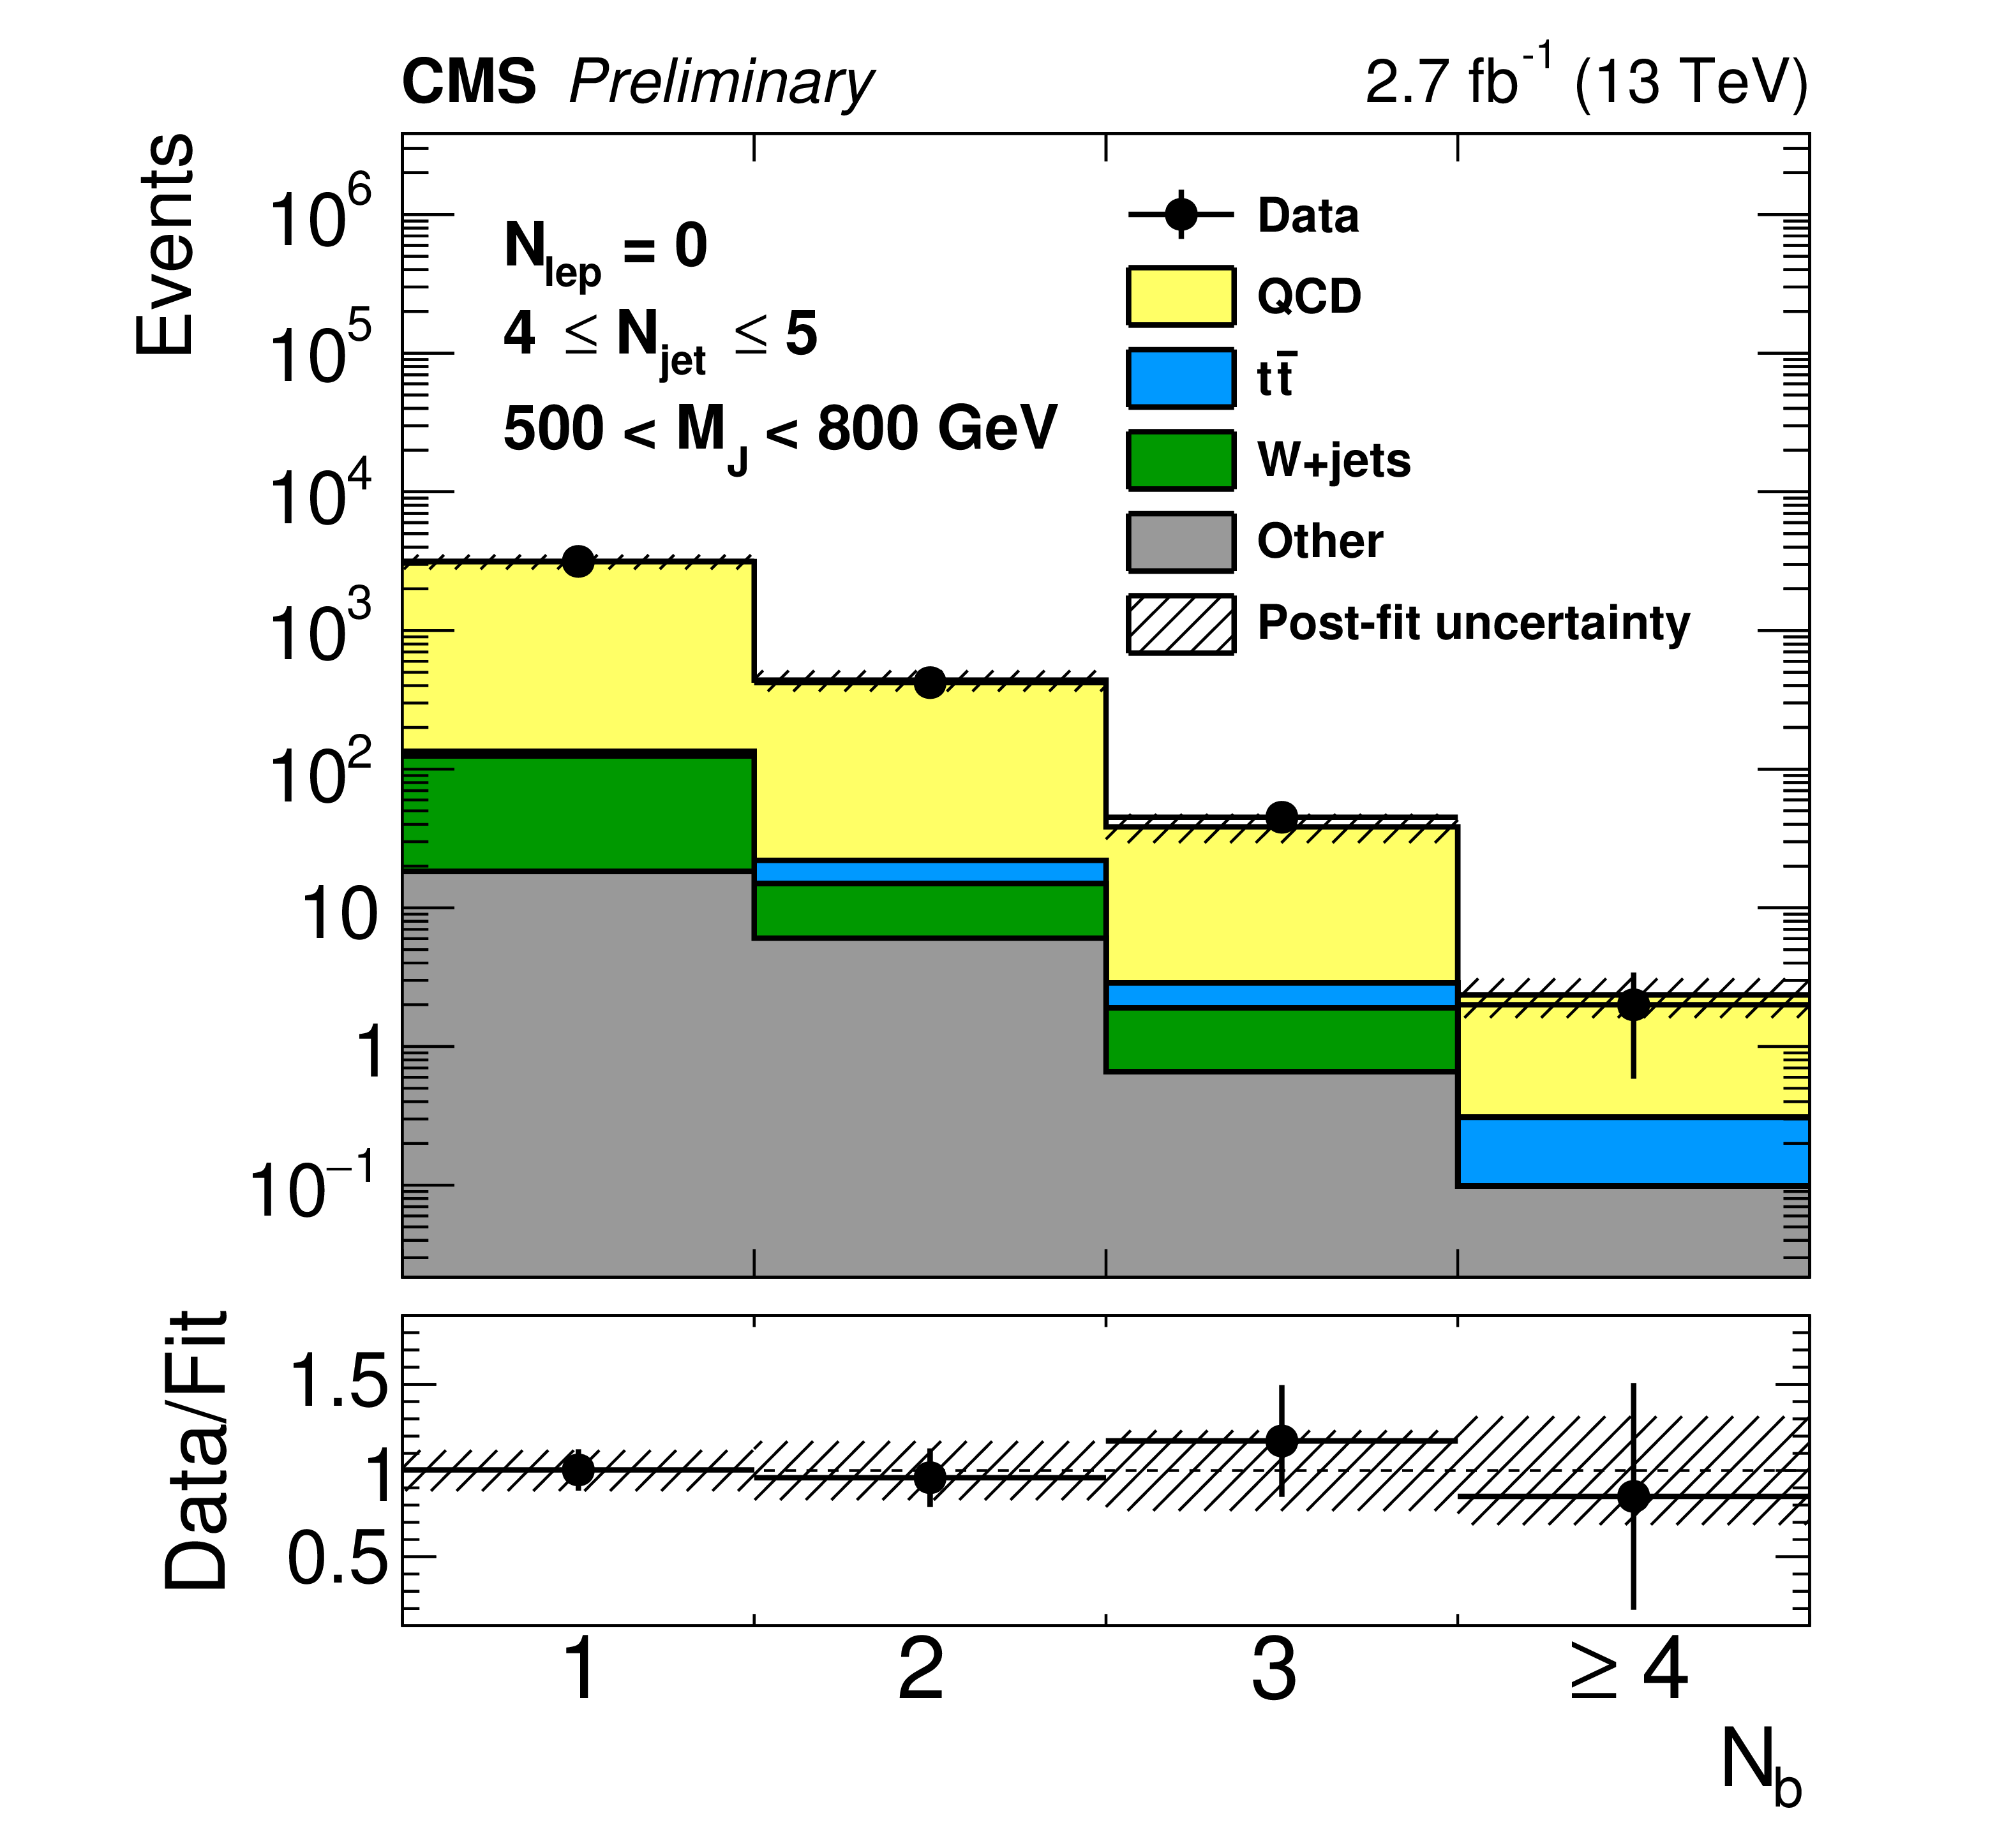
Figure 5-a:
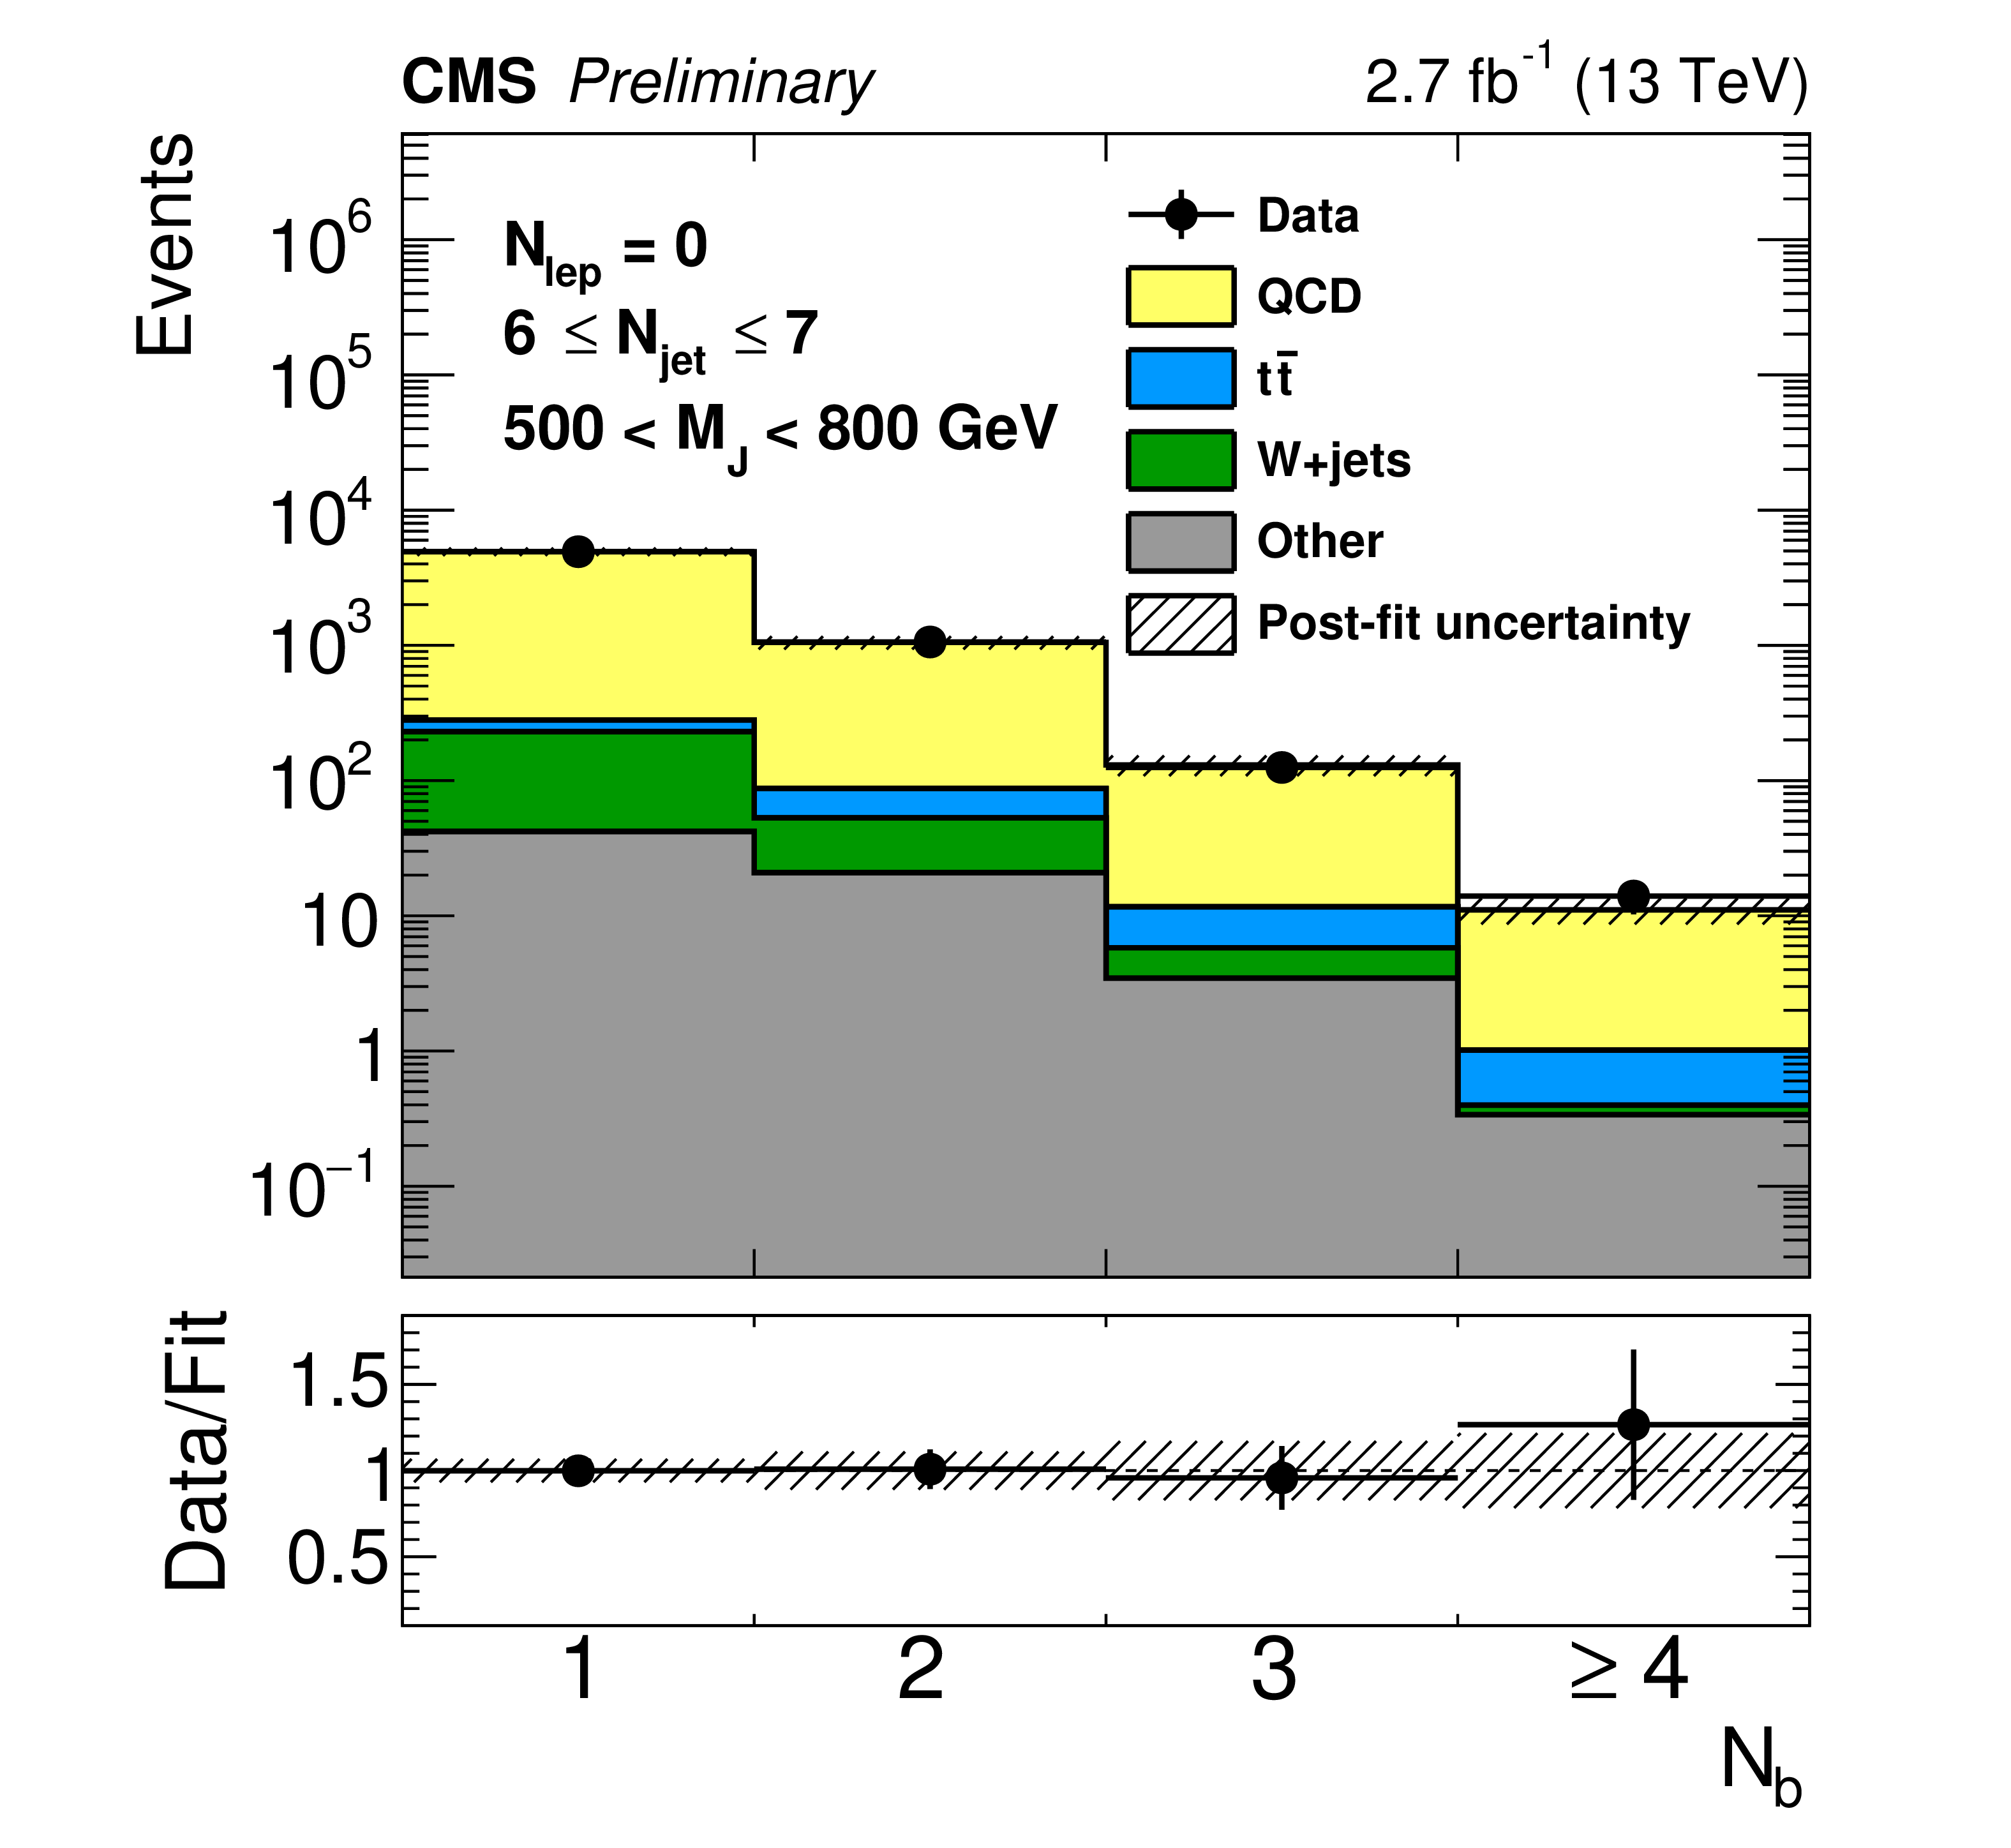
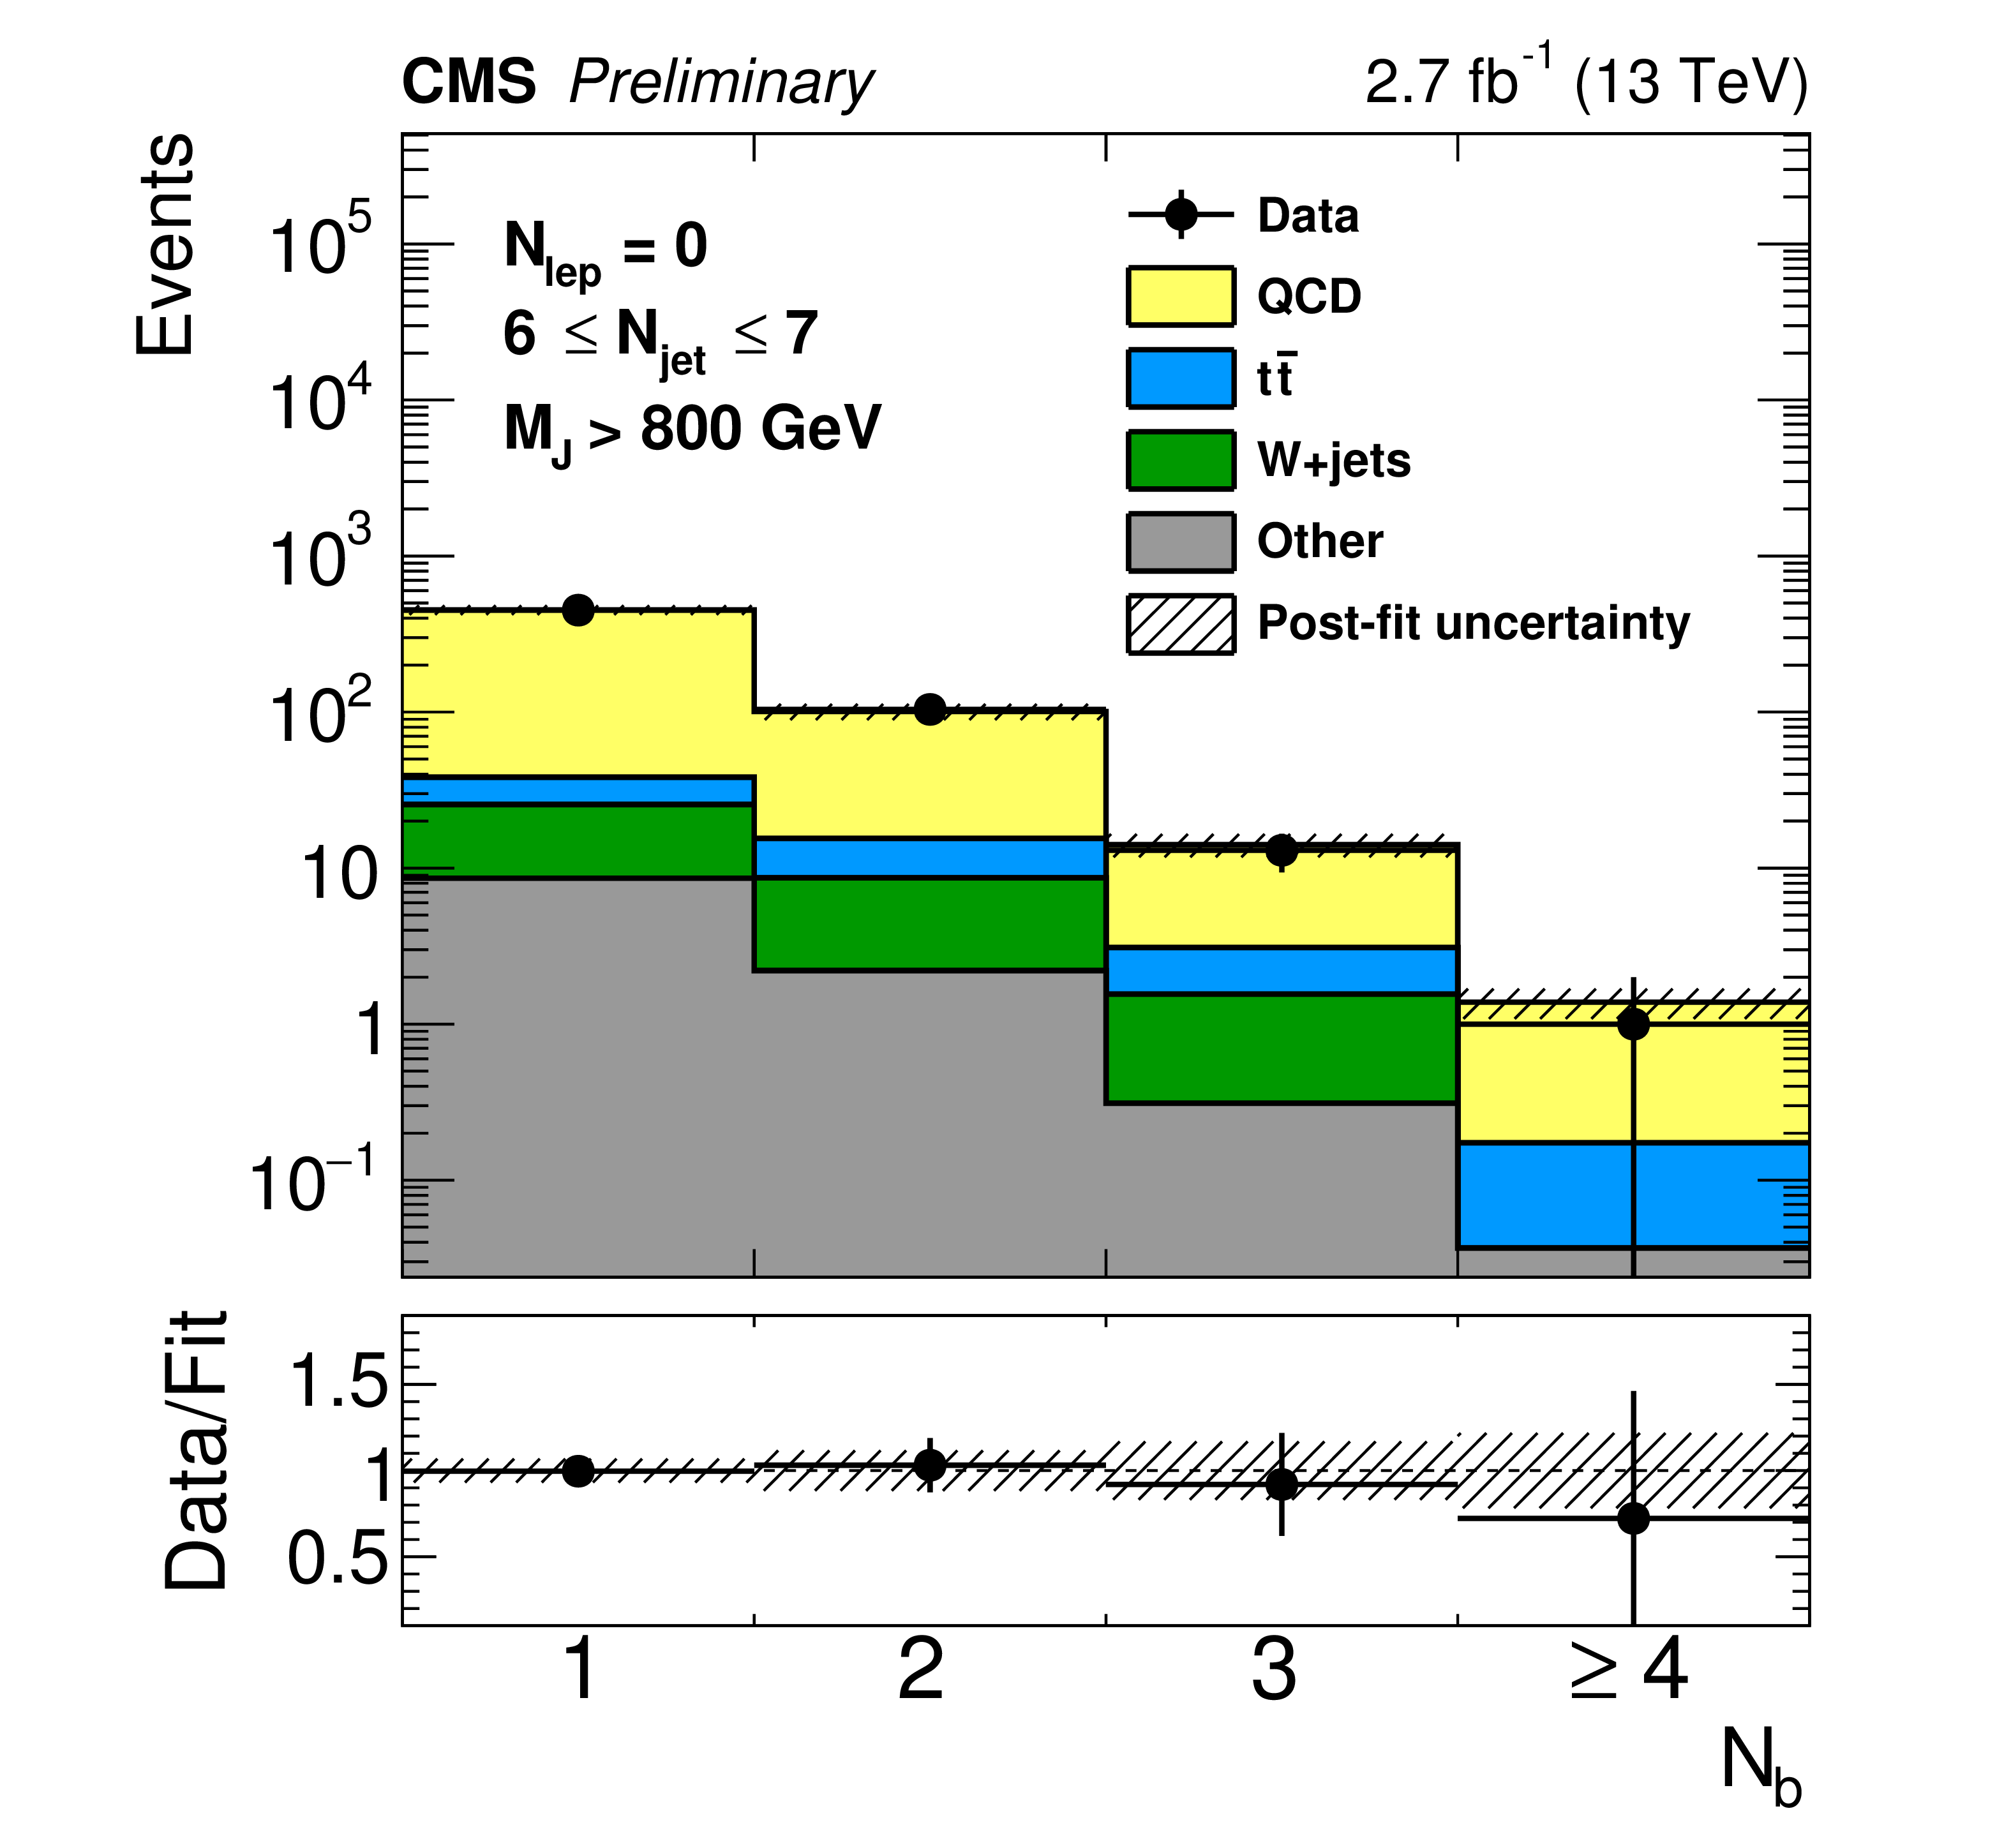
Fit to data in the validation regions with $N_\text {lep}= $ 0. Plots in the left column require 500 $ < M_\text {J} < $ 800 GeV, while $ M_\text {J} > $ 800 GeV is required in the right column. The top row shows the 4 $ \leq N_\text {jet} \leq $ 5 region, and the bottom row shows the 6 $ \leq N_\text {jet} \leq $ 7 region. The uncertainty displayed in the ratio plot as error bars reflects data statistics only. |
png pdf |
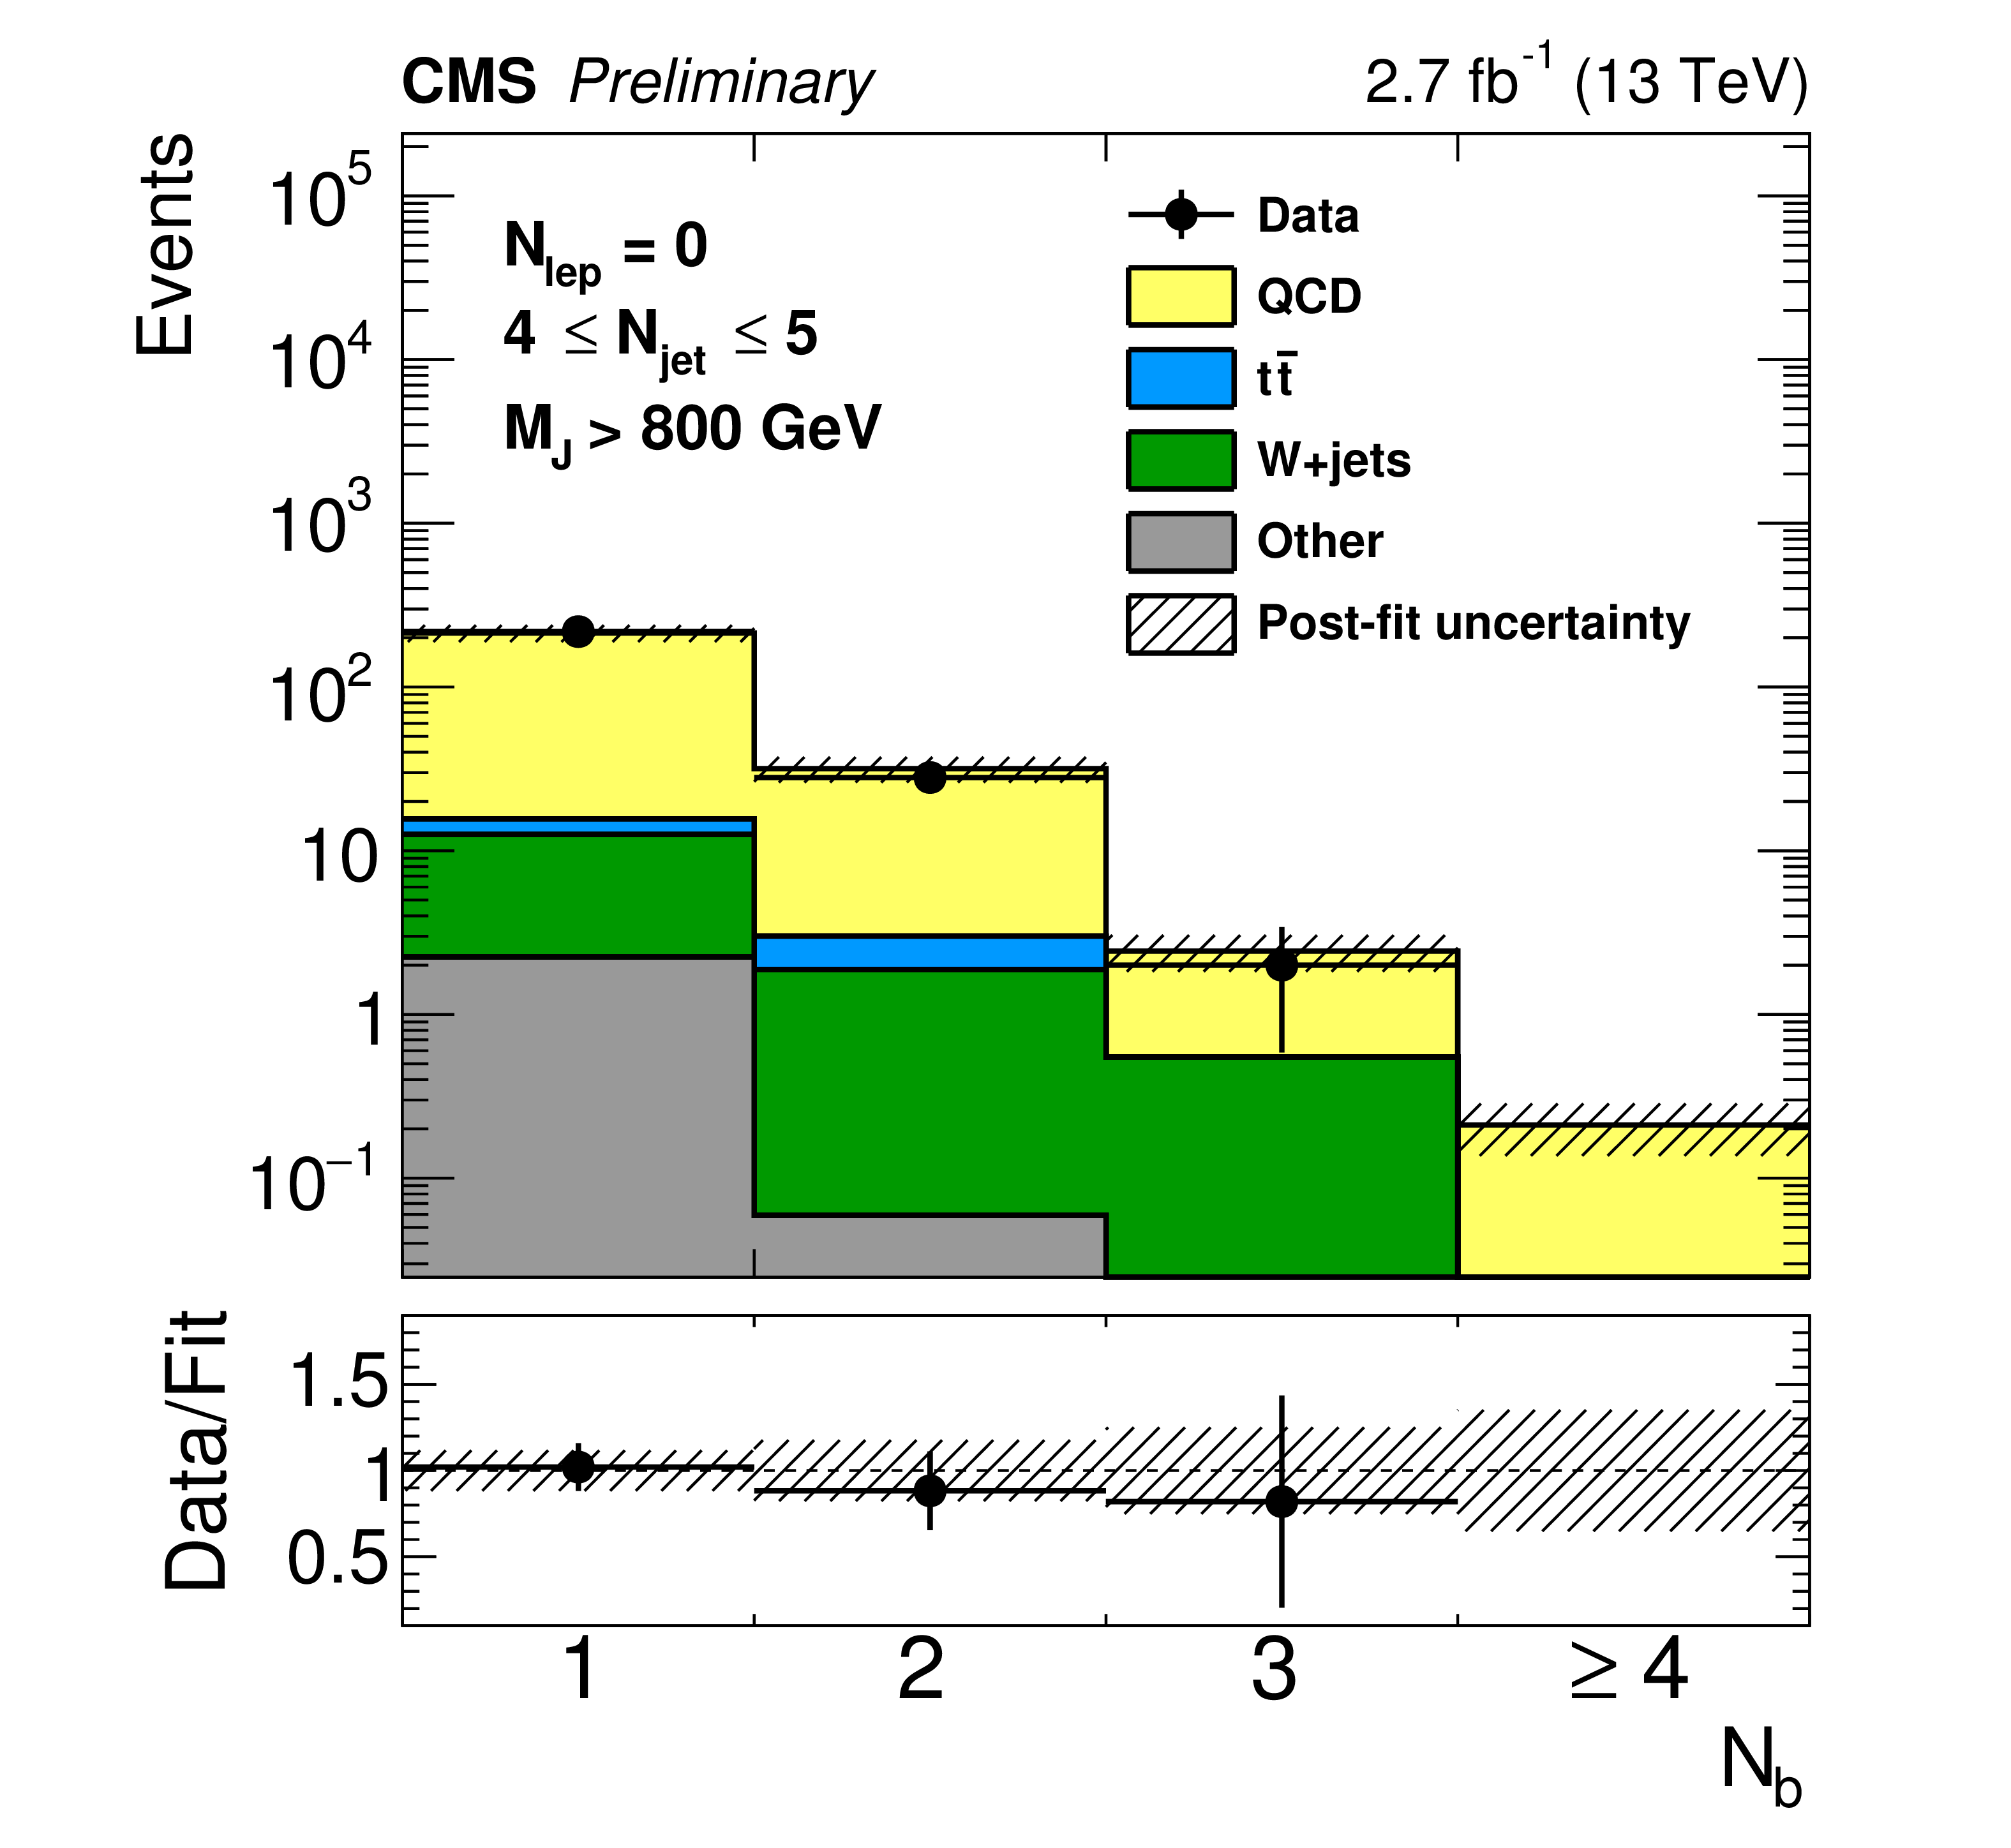
Figure 5-b:
Fit to data in the validation regions with $N_\text {lep}= $ 0. Plots in the left column require 500 $ < M_\text {J} < $ 800 GeV, while $ M_\text {J} > $ 800 GeV is required in the right column. The top row shows the 4 $ \leq N_\text {jet} \leq $ 5 region, and the bottom row shows the 6 $ \leq N_\text {jet} \leq $ 7 region. The uncertainty displayed in the ratio plot as error bars reflects data statistics only. |
png pdf |
Figure 5-c:
Fit to data in the validation regions with $N_\text {lep}= $ 0. Plots in the left column require 500 $ < M_\text {J} < $ 800 GeV, while $ M_\text {J} > $ 800 GeV is required in the right column. The top row shows the 4 $ \leq N_\text {jet} \leq $ 5 region, and the bottom row shows the 6 $ \leq N_\text {jet} \leq $ 7 region. The uncertainty displayed in the ratio plot as error bars reflects data statistics only. |
png pdf |
Figure 5-d:
Fit to data in the validation regions with $N_\text {lep}= $ 0. Plots in the left column require 500 $ < M_\text {J} < $ 800 GeV, while $ M_\text {J} > $ 800 GeV is required in the right column. The top row shows the 4 $ \leq N_\text {jet} \leq $ 5 region, and the bottom row shows the 6 $ \leq N_\text {jet} \leq $ 7 region. The uncertainty displayed in the ratio plot as error bars reflects data statistics only. |

png pdf |
Figure 6-a:
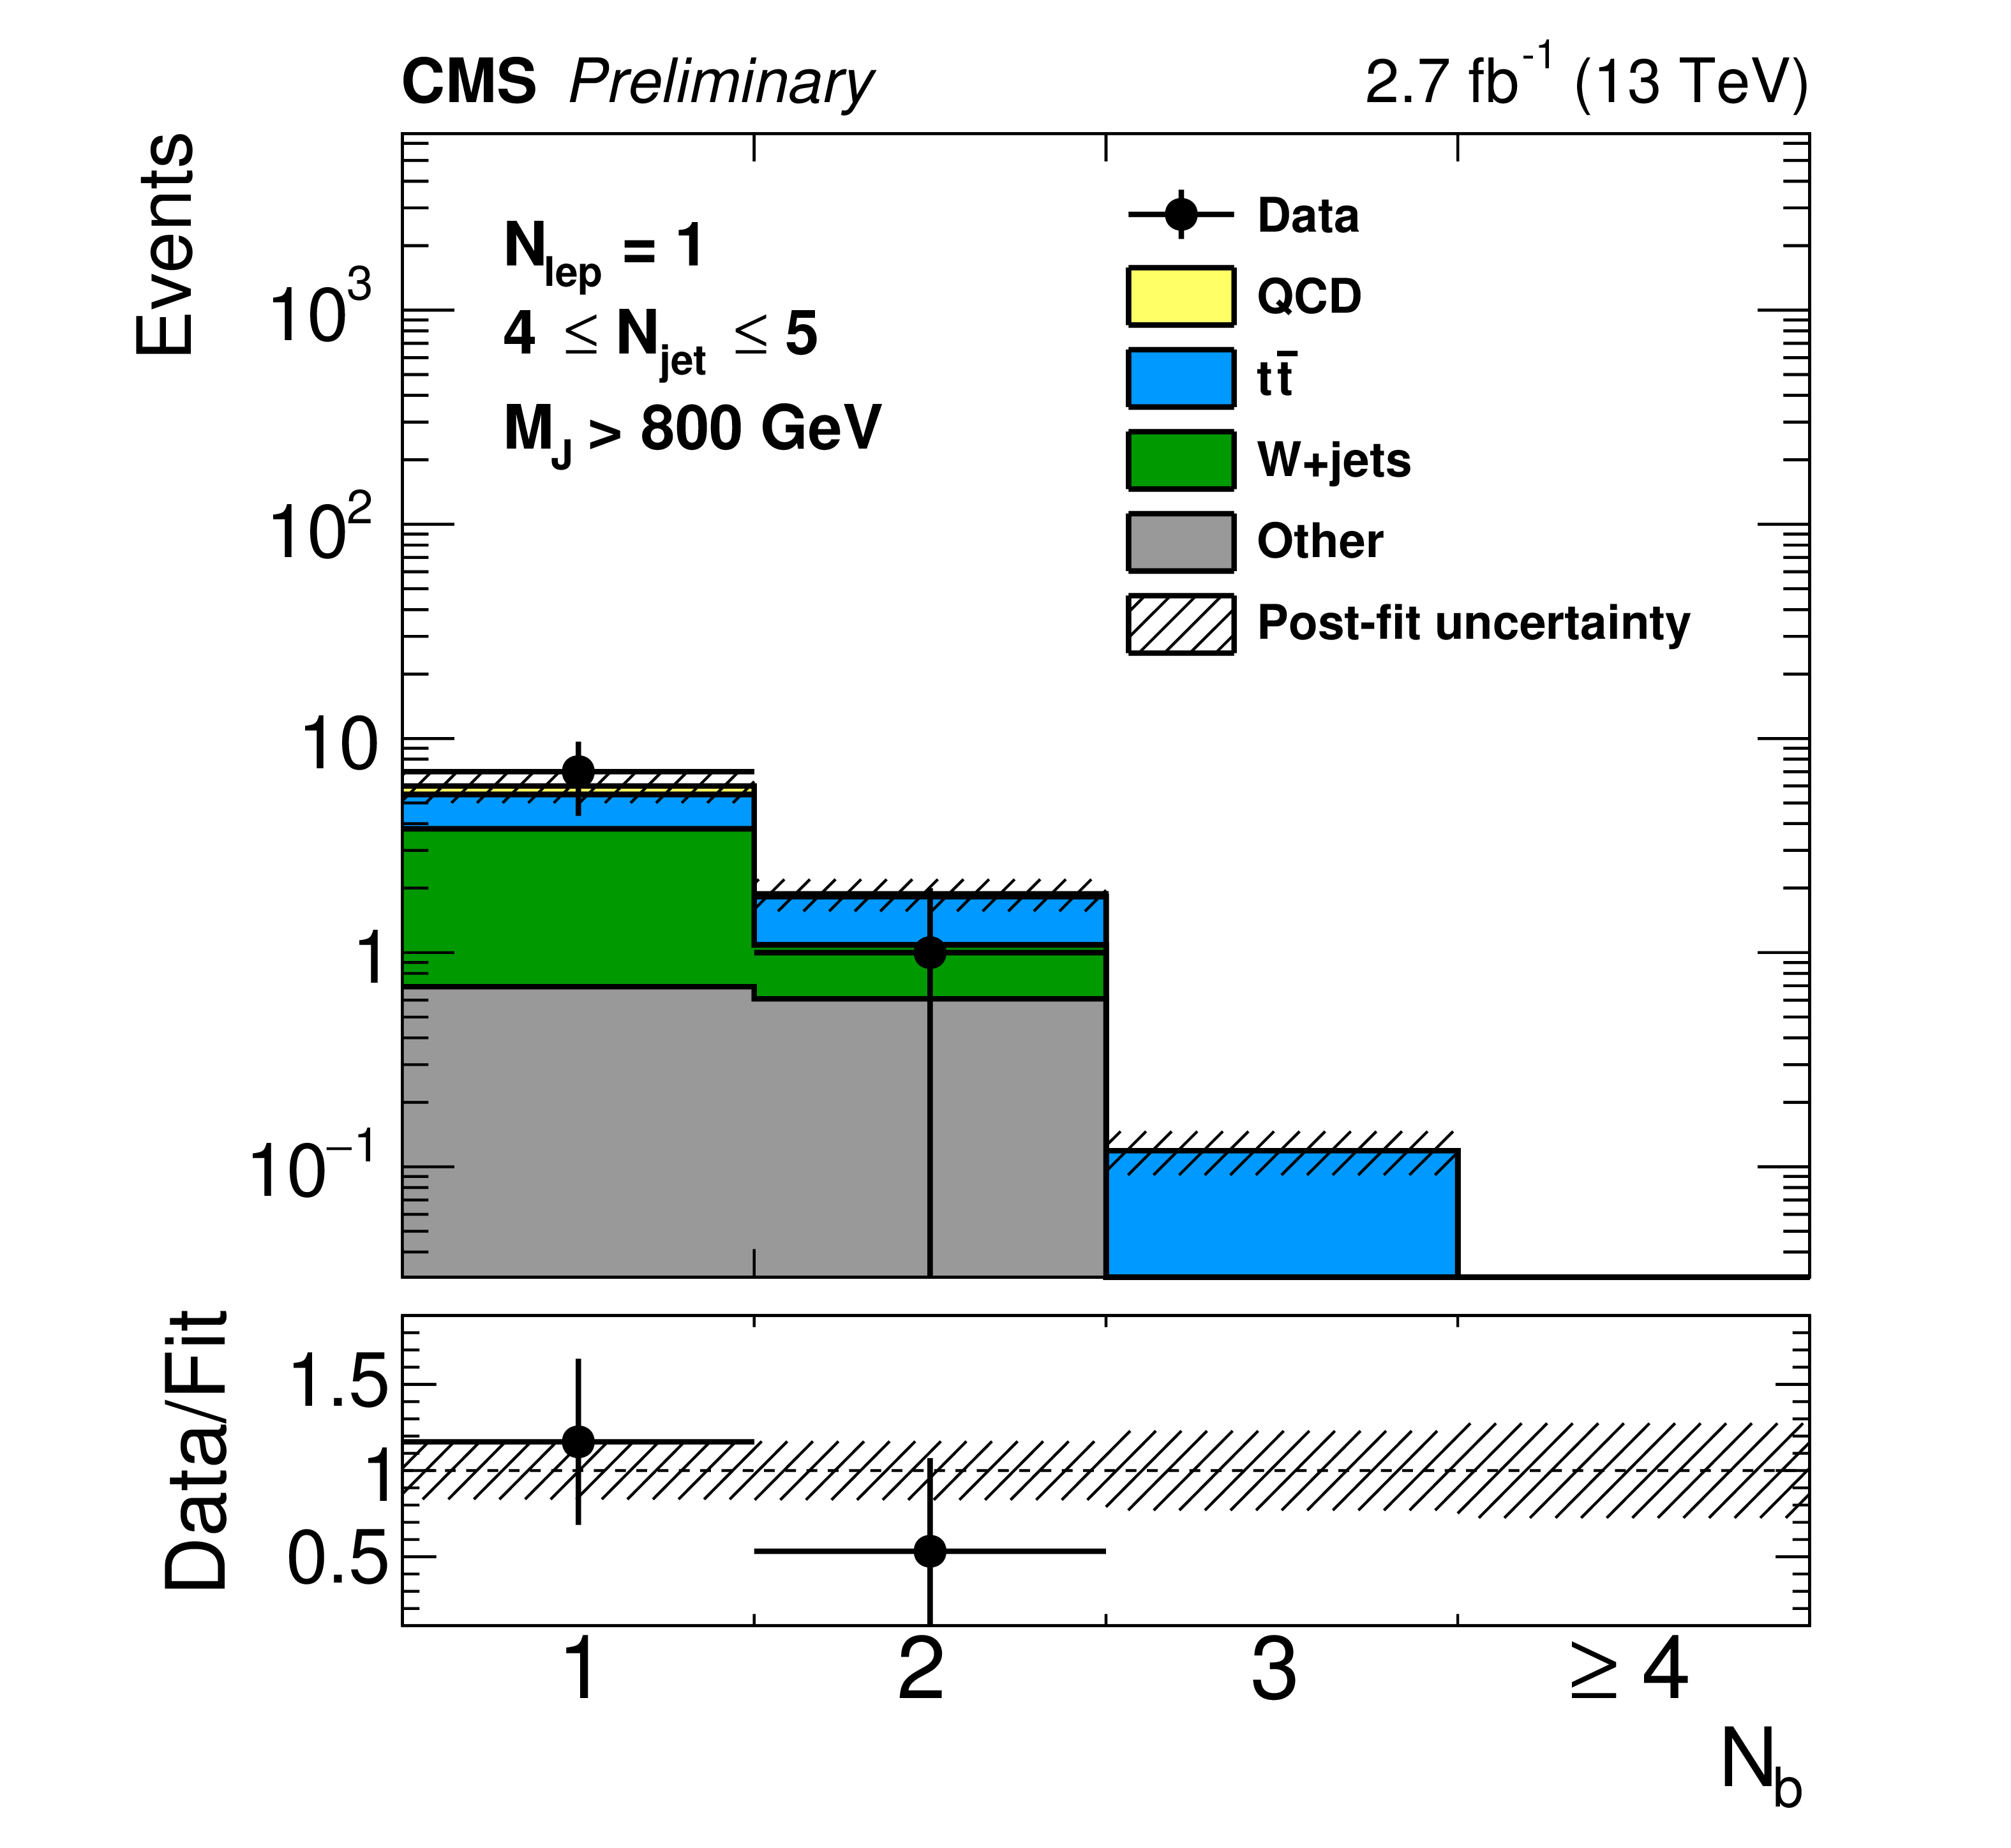
Fit to data in the validation regions with $N_\text {lep}=$ 1. Plot (a) requires 500 $ < M_\text {J} < $ 800 GeV , while $M_\text {J}> $ 800 GeV is required on plot (b). The uncertainty displayed in the ratio plot as error bars reflects data statistics only. |
png pdf |
Figure 6-b:
Fit to data in the validation regions with $N_\text {lep}=$ 1. Plot (a) requires 500 $ < M_\text {J} < $ 800 GeV , while $M_\text {J}> $ 800 GeV is required on plot (b). The uncertainty displayed in the ratio plot as error bars reflects data statistics only. |

png pdf |
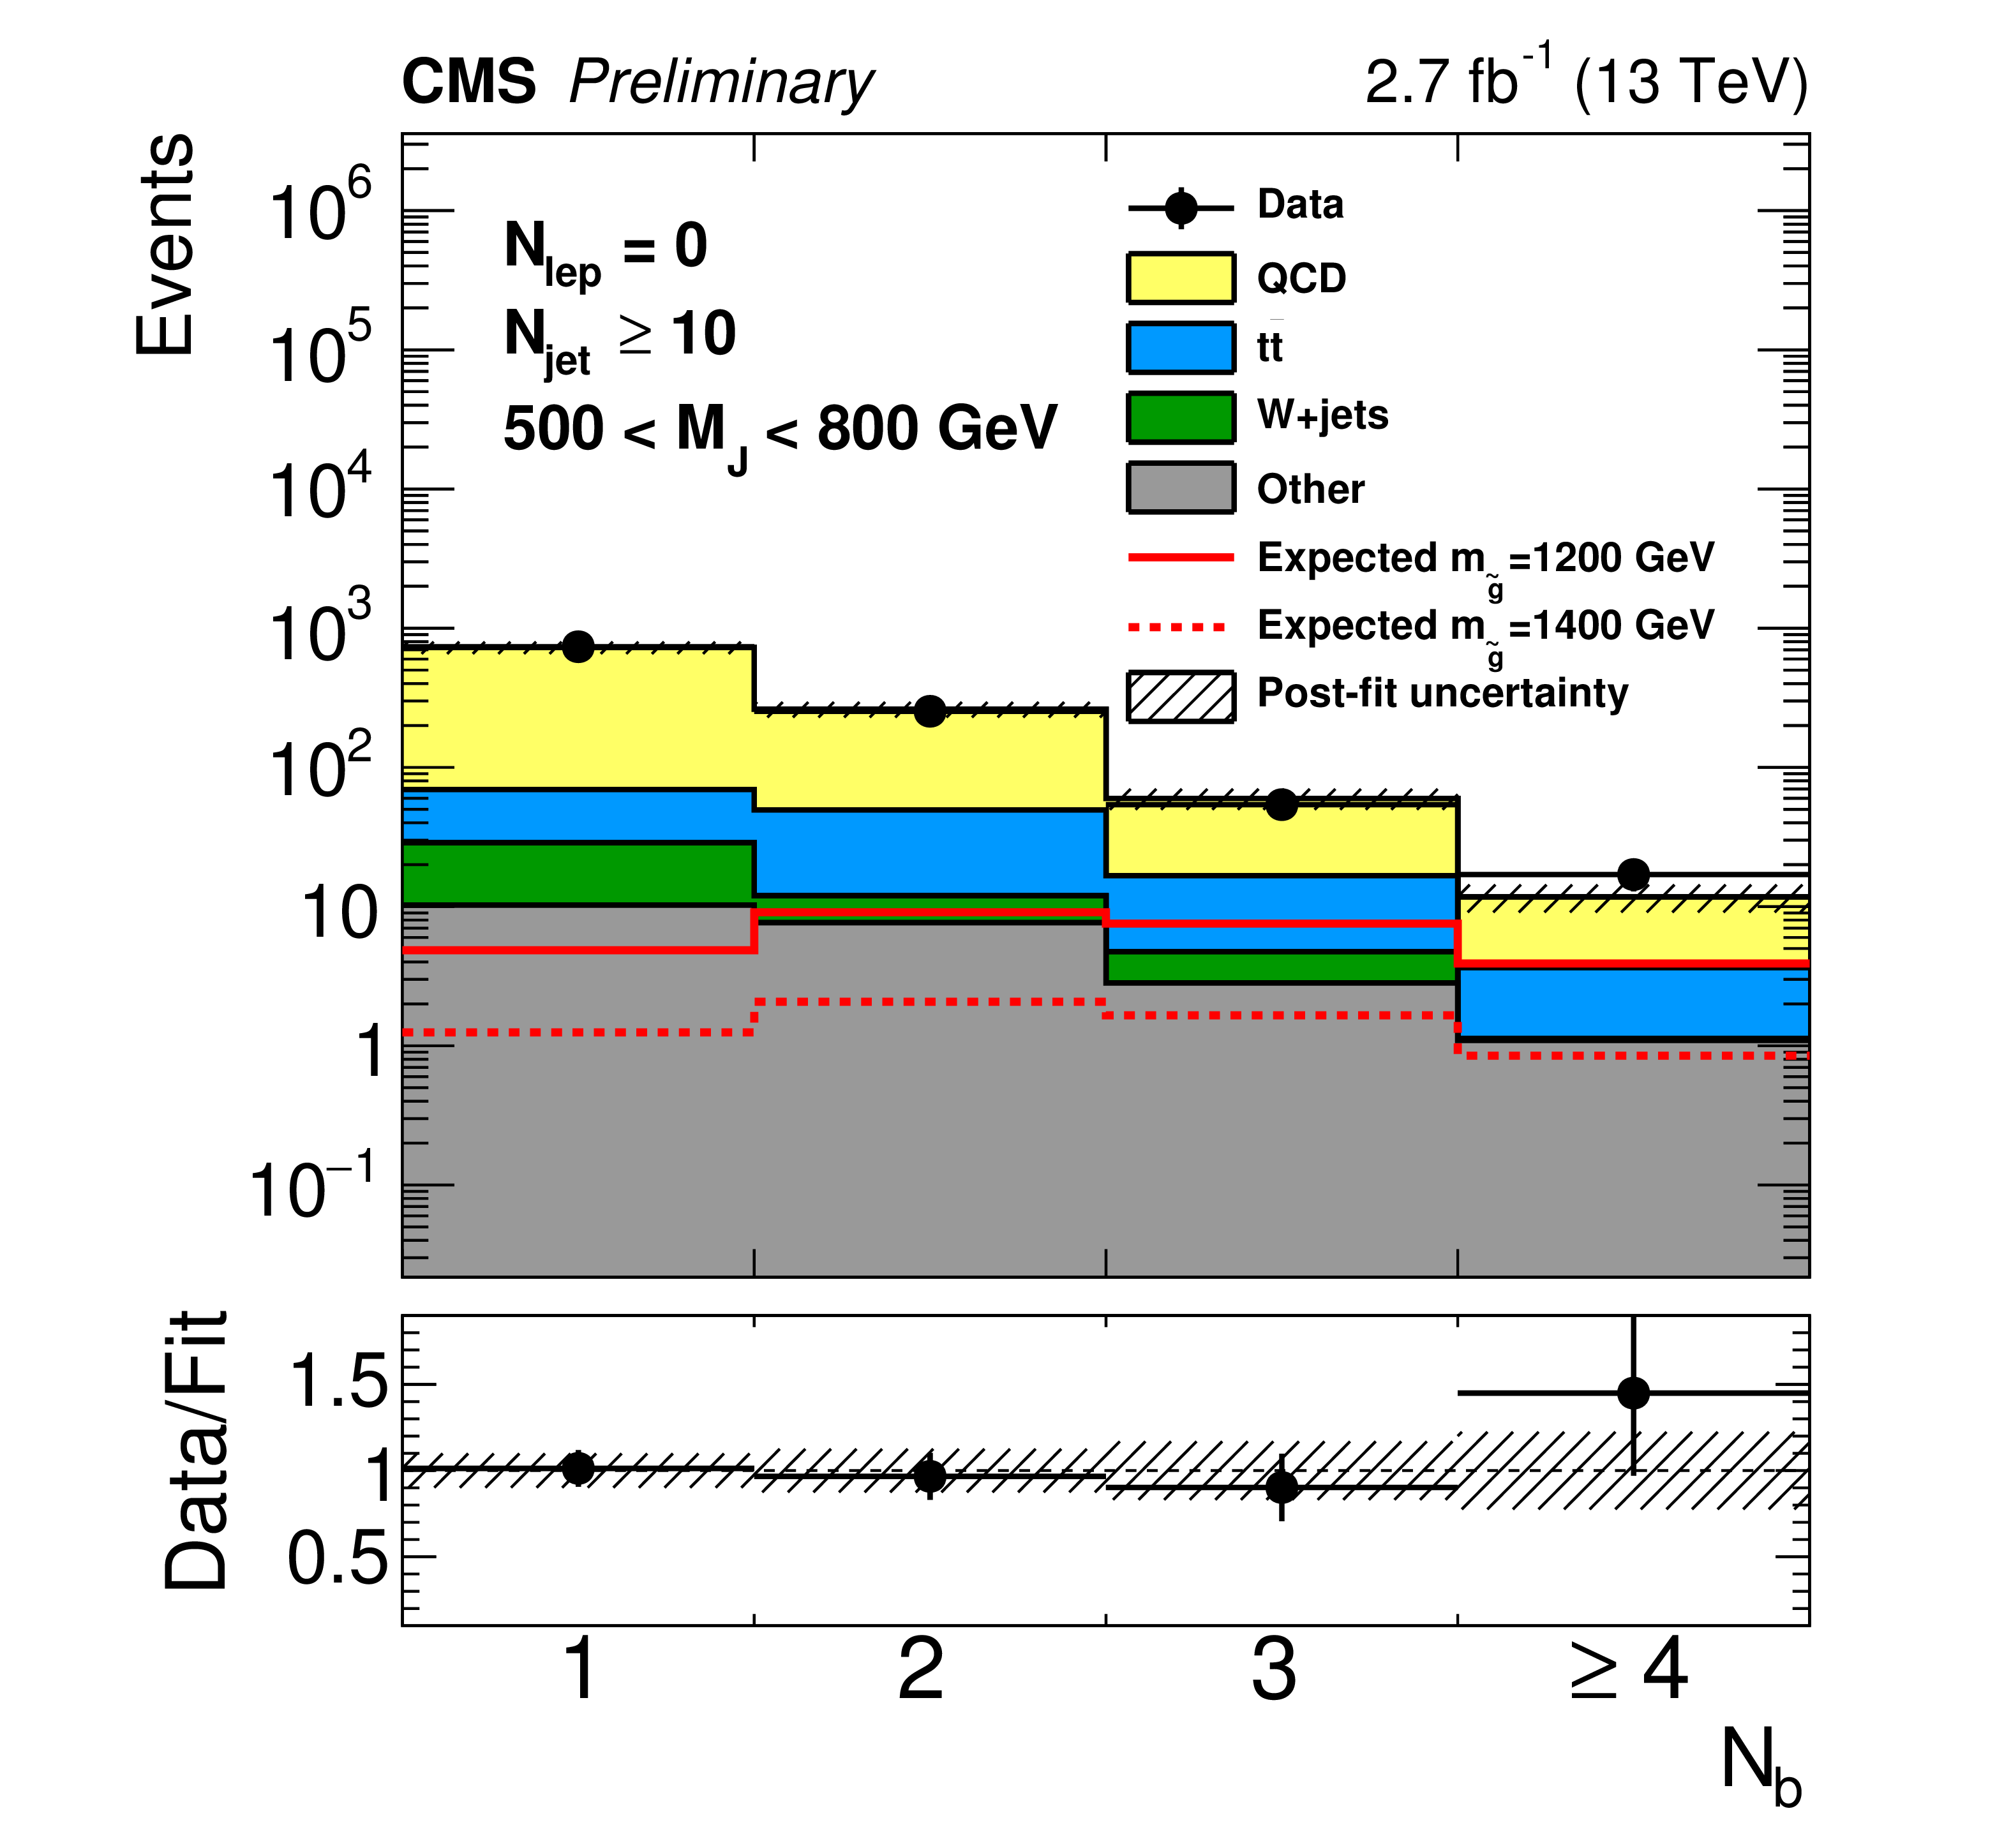
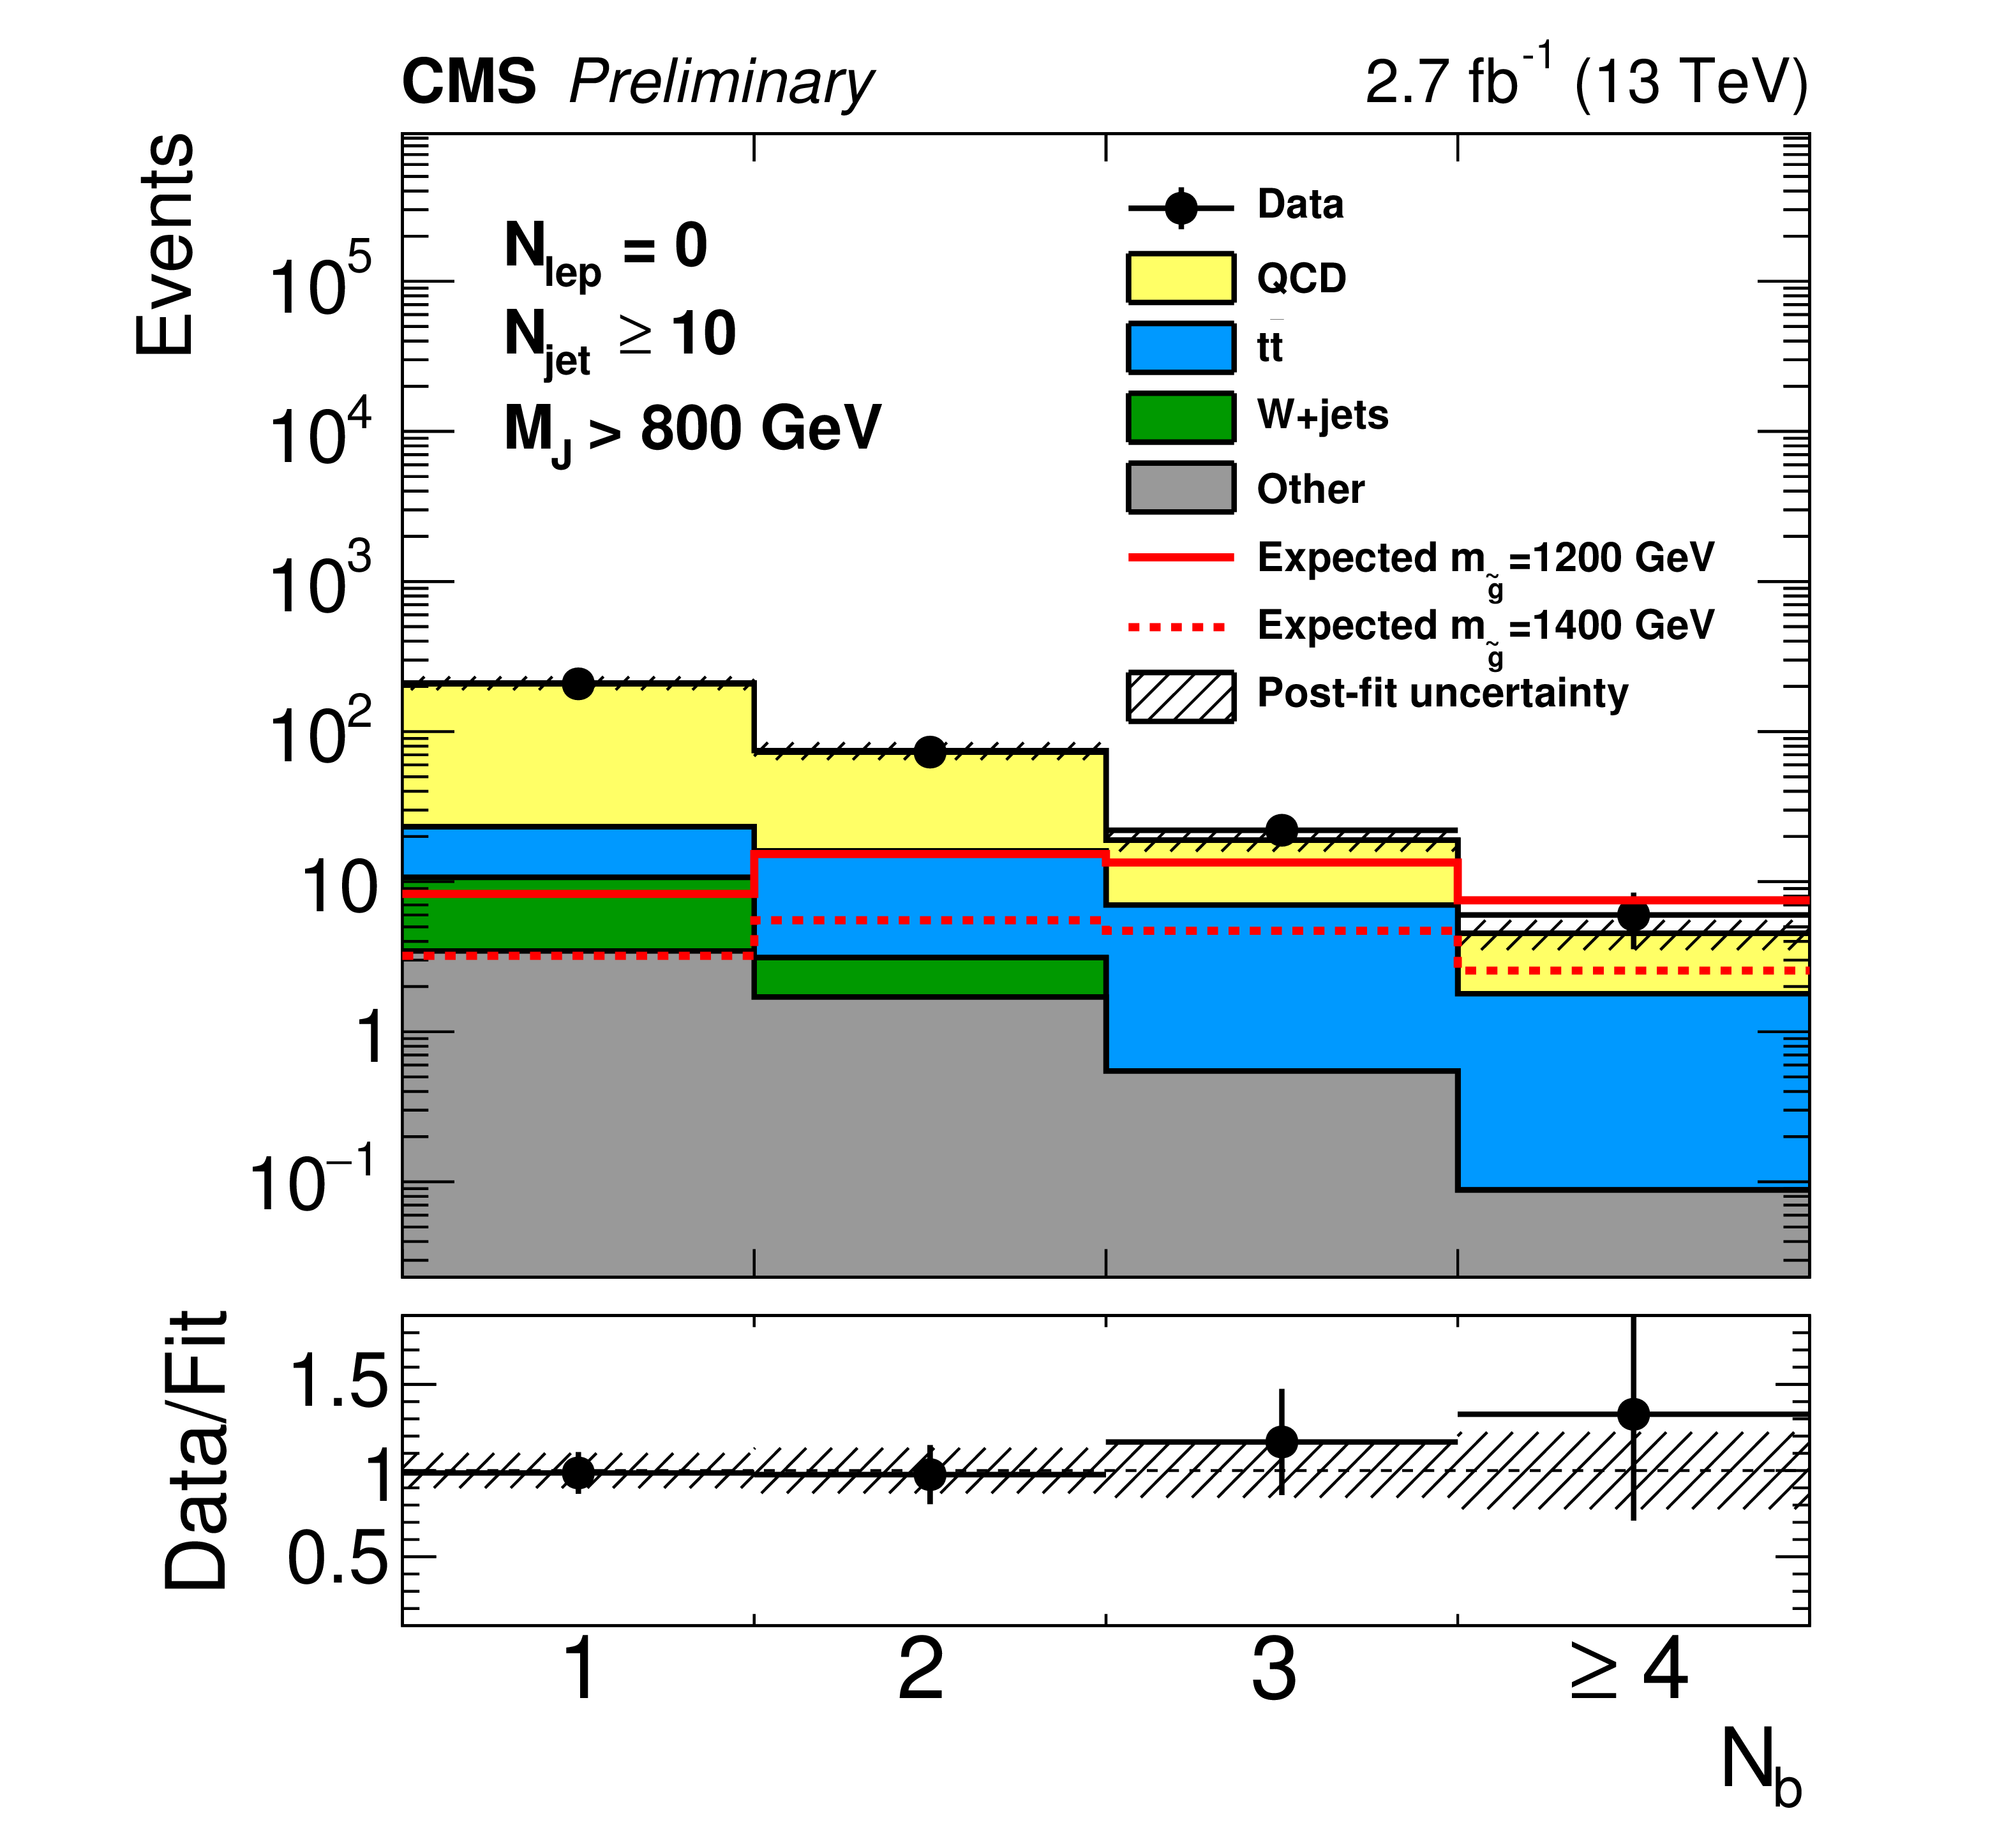
Figure 7-a:
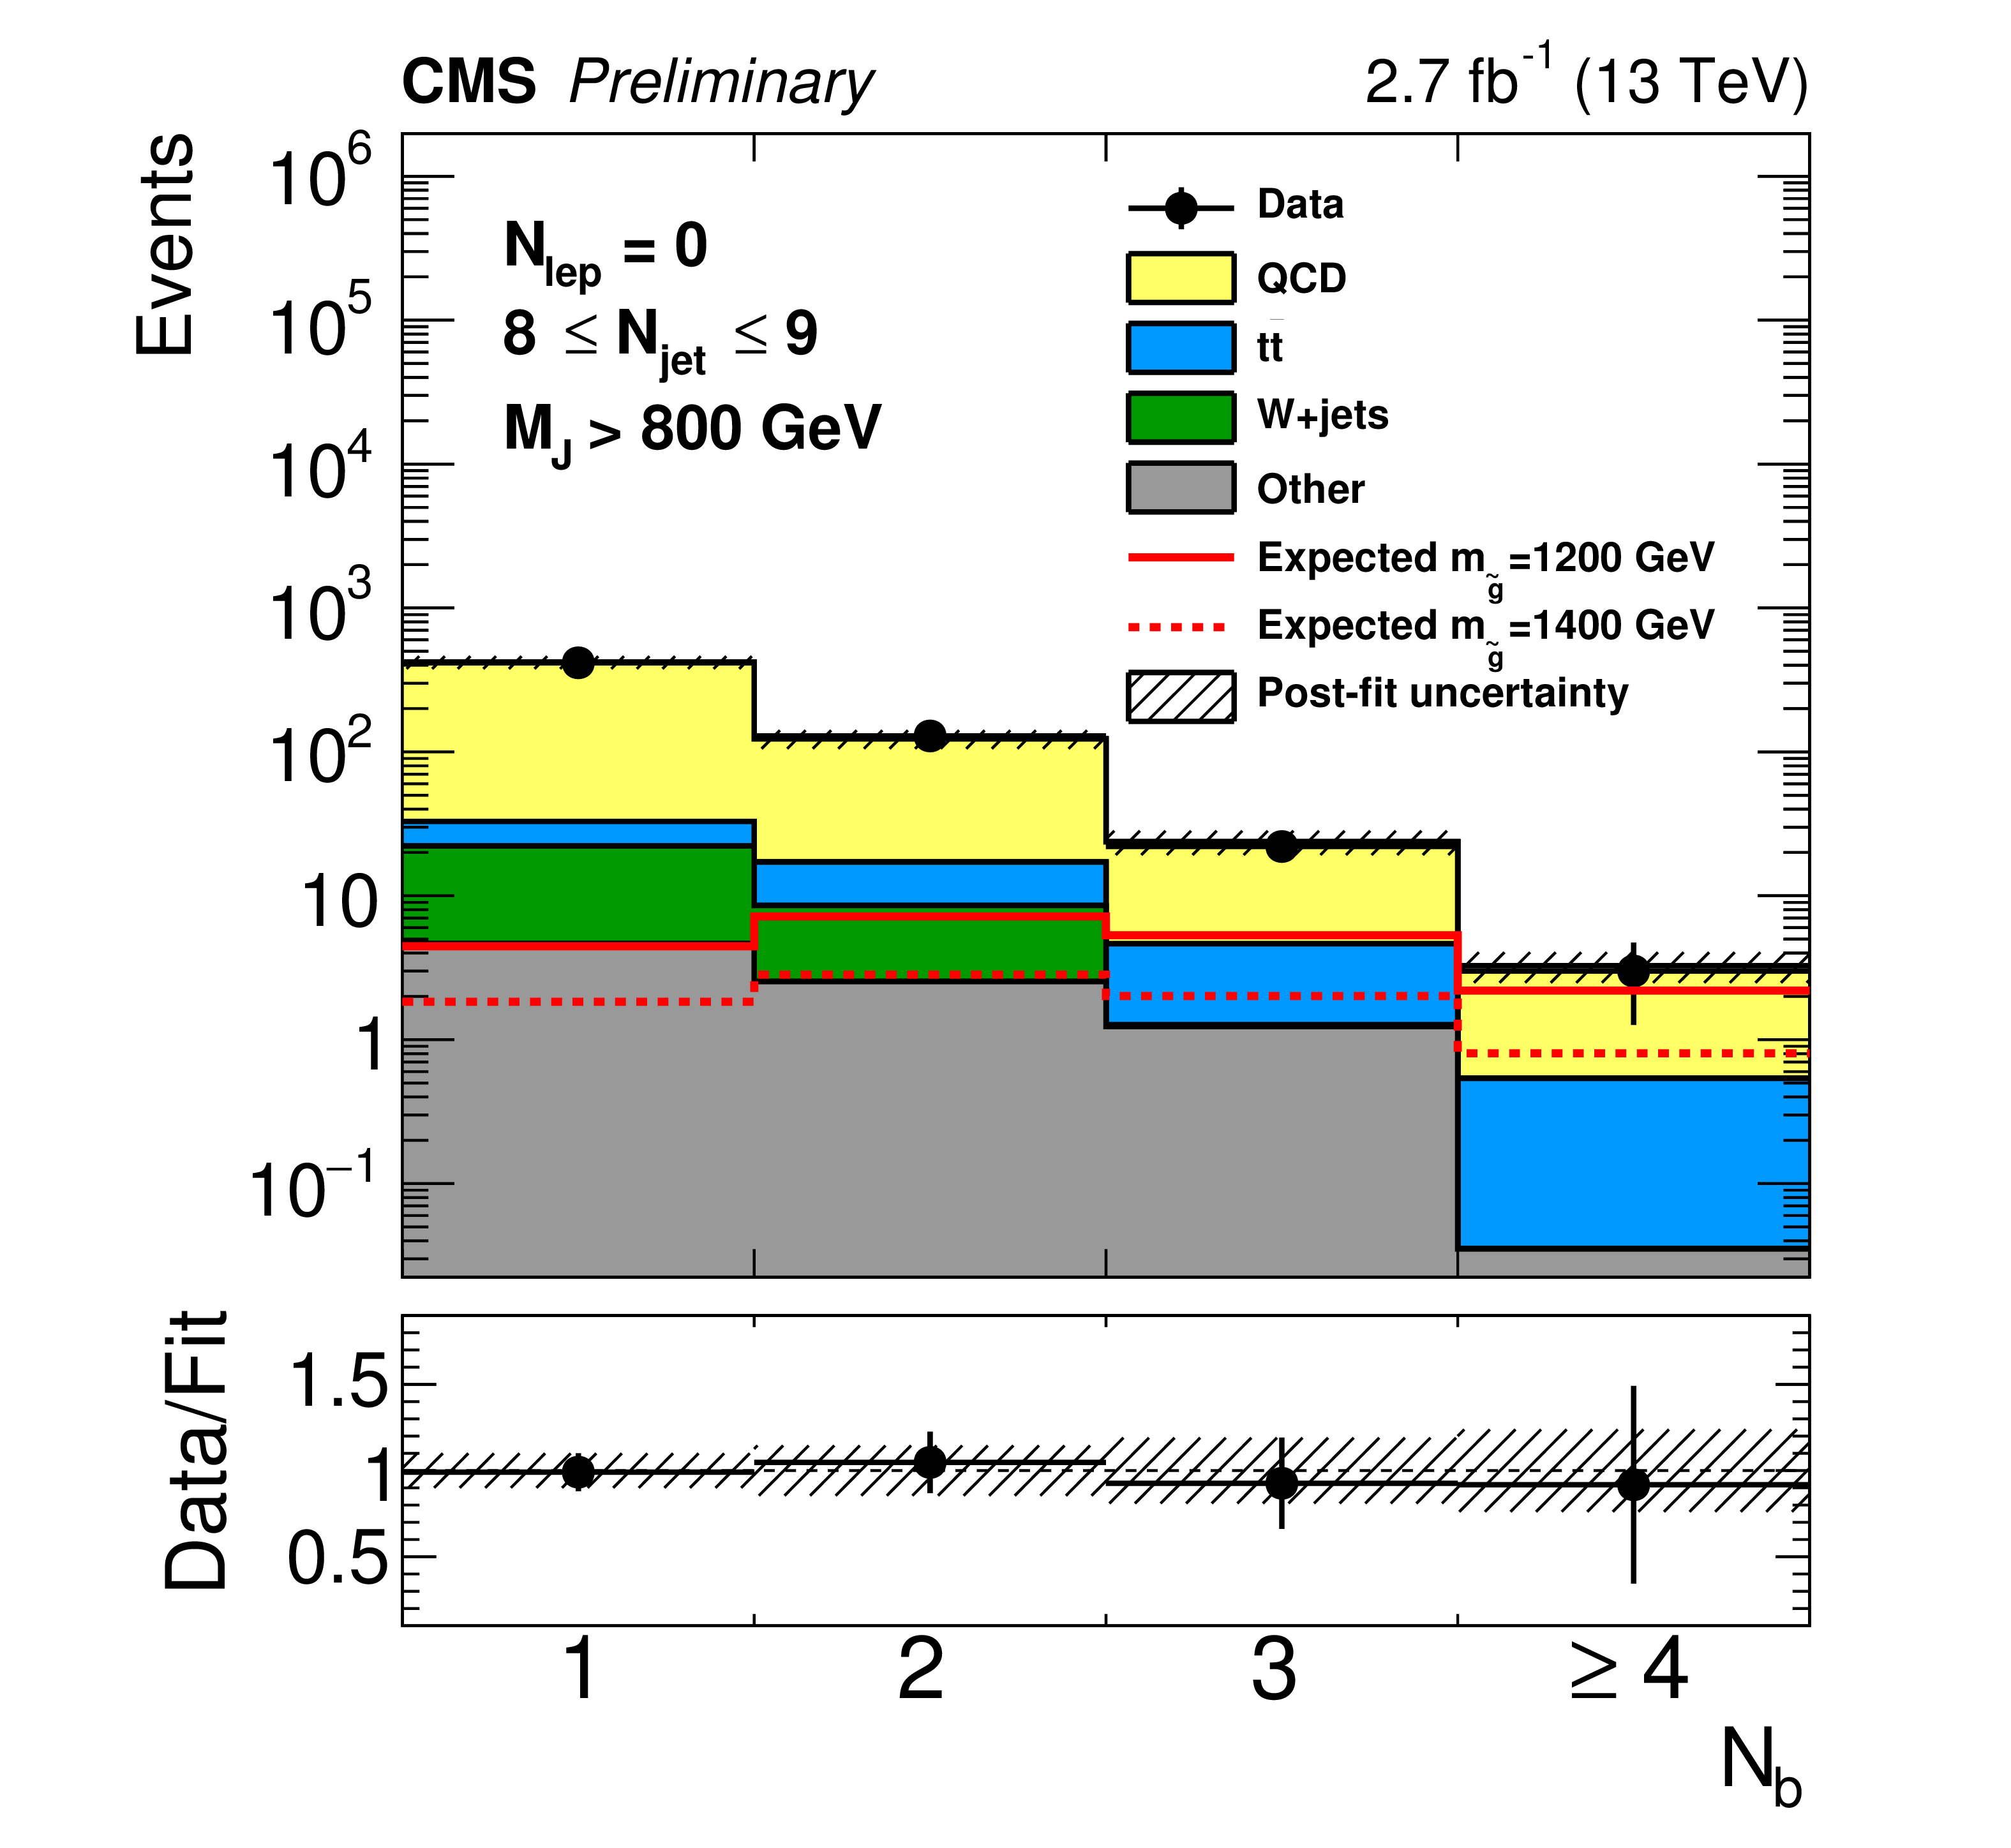
The post-fit $N_\text {b}$ distributions in the 0-lepton signal region. Plots in the left column require 500 $ < M_\text {J} < $ 800 GeV, while $M_\text {J}> $ 800 GeV is required in the right column. The top row shows the 8 $ \leq N_\text {jet} \leq $ 9 signal region, and the bottom row shows the $N_\text {jet} \geq $ 10 signal region. The uncertainty displayed in the ratio plot as error bars reflects data statistics only. |
png pdf |
Figure 7-b:
The post-fit $N_\text {b}$ distributions in the 0-lepton signal region. Plots in the left column require 500 $ < M_\text {J} < $ 800 GeV, while $M_\text {J}> $ 800 GeV is required in the right column. The top row shows the 8 $ \leq N_\text {jet} \leq $ 9 signal region, and the bottom row shows the $N_\text {jet} \geq $ 10 signal region. The uncertainty displayed in the ratio plot as error bars reflects data statistics only. |
png pdf |
Figure 7-c:
The post-fit $N_\text {b}$ distributions in the 0-lepton signal region. Plots in the left column require 500 $ < M_\text {J} < $ 800 GeV, while $M_\text {J}> $ 800 GeV is required in the right column. The top row shows the 8 $ \leq N_\text {jet} \leq $ 9 signal region, and the bottom row shows the $N_\text {jet} \geq $ 10 signal region. The uncertainty displayed in the ratio plot as error bars reflects data statistics only. |
png pdf |
Figure 7-d:
The post-fit $N_\text {b}$ distributions in the 0-lepton signal region. Plots in the left column require 500 $ < M_\text {J} < $ 800 GeV, while $M_\text {J}> $ 800 GeV is required in the right column. The top row shows the 8 $ \leq N_\text {jet} \leq $ 9 signal region, and the bottom row shows the $N_\text {jet} \geq $ 10 signal region. The uncertainty displayed in the ratio plot as error bars reflects data statistics only. |
png pdf |
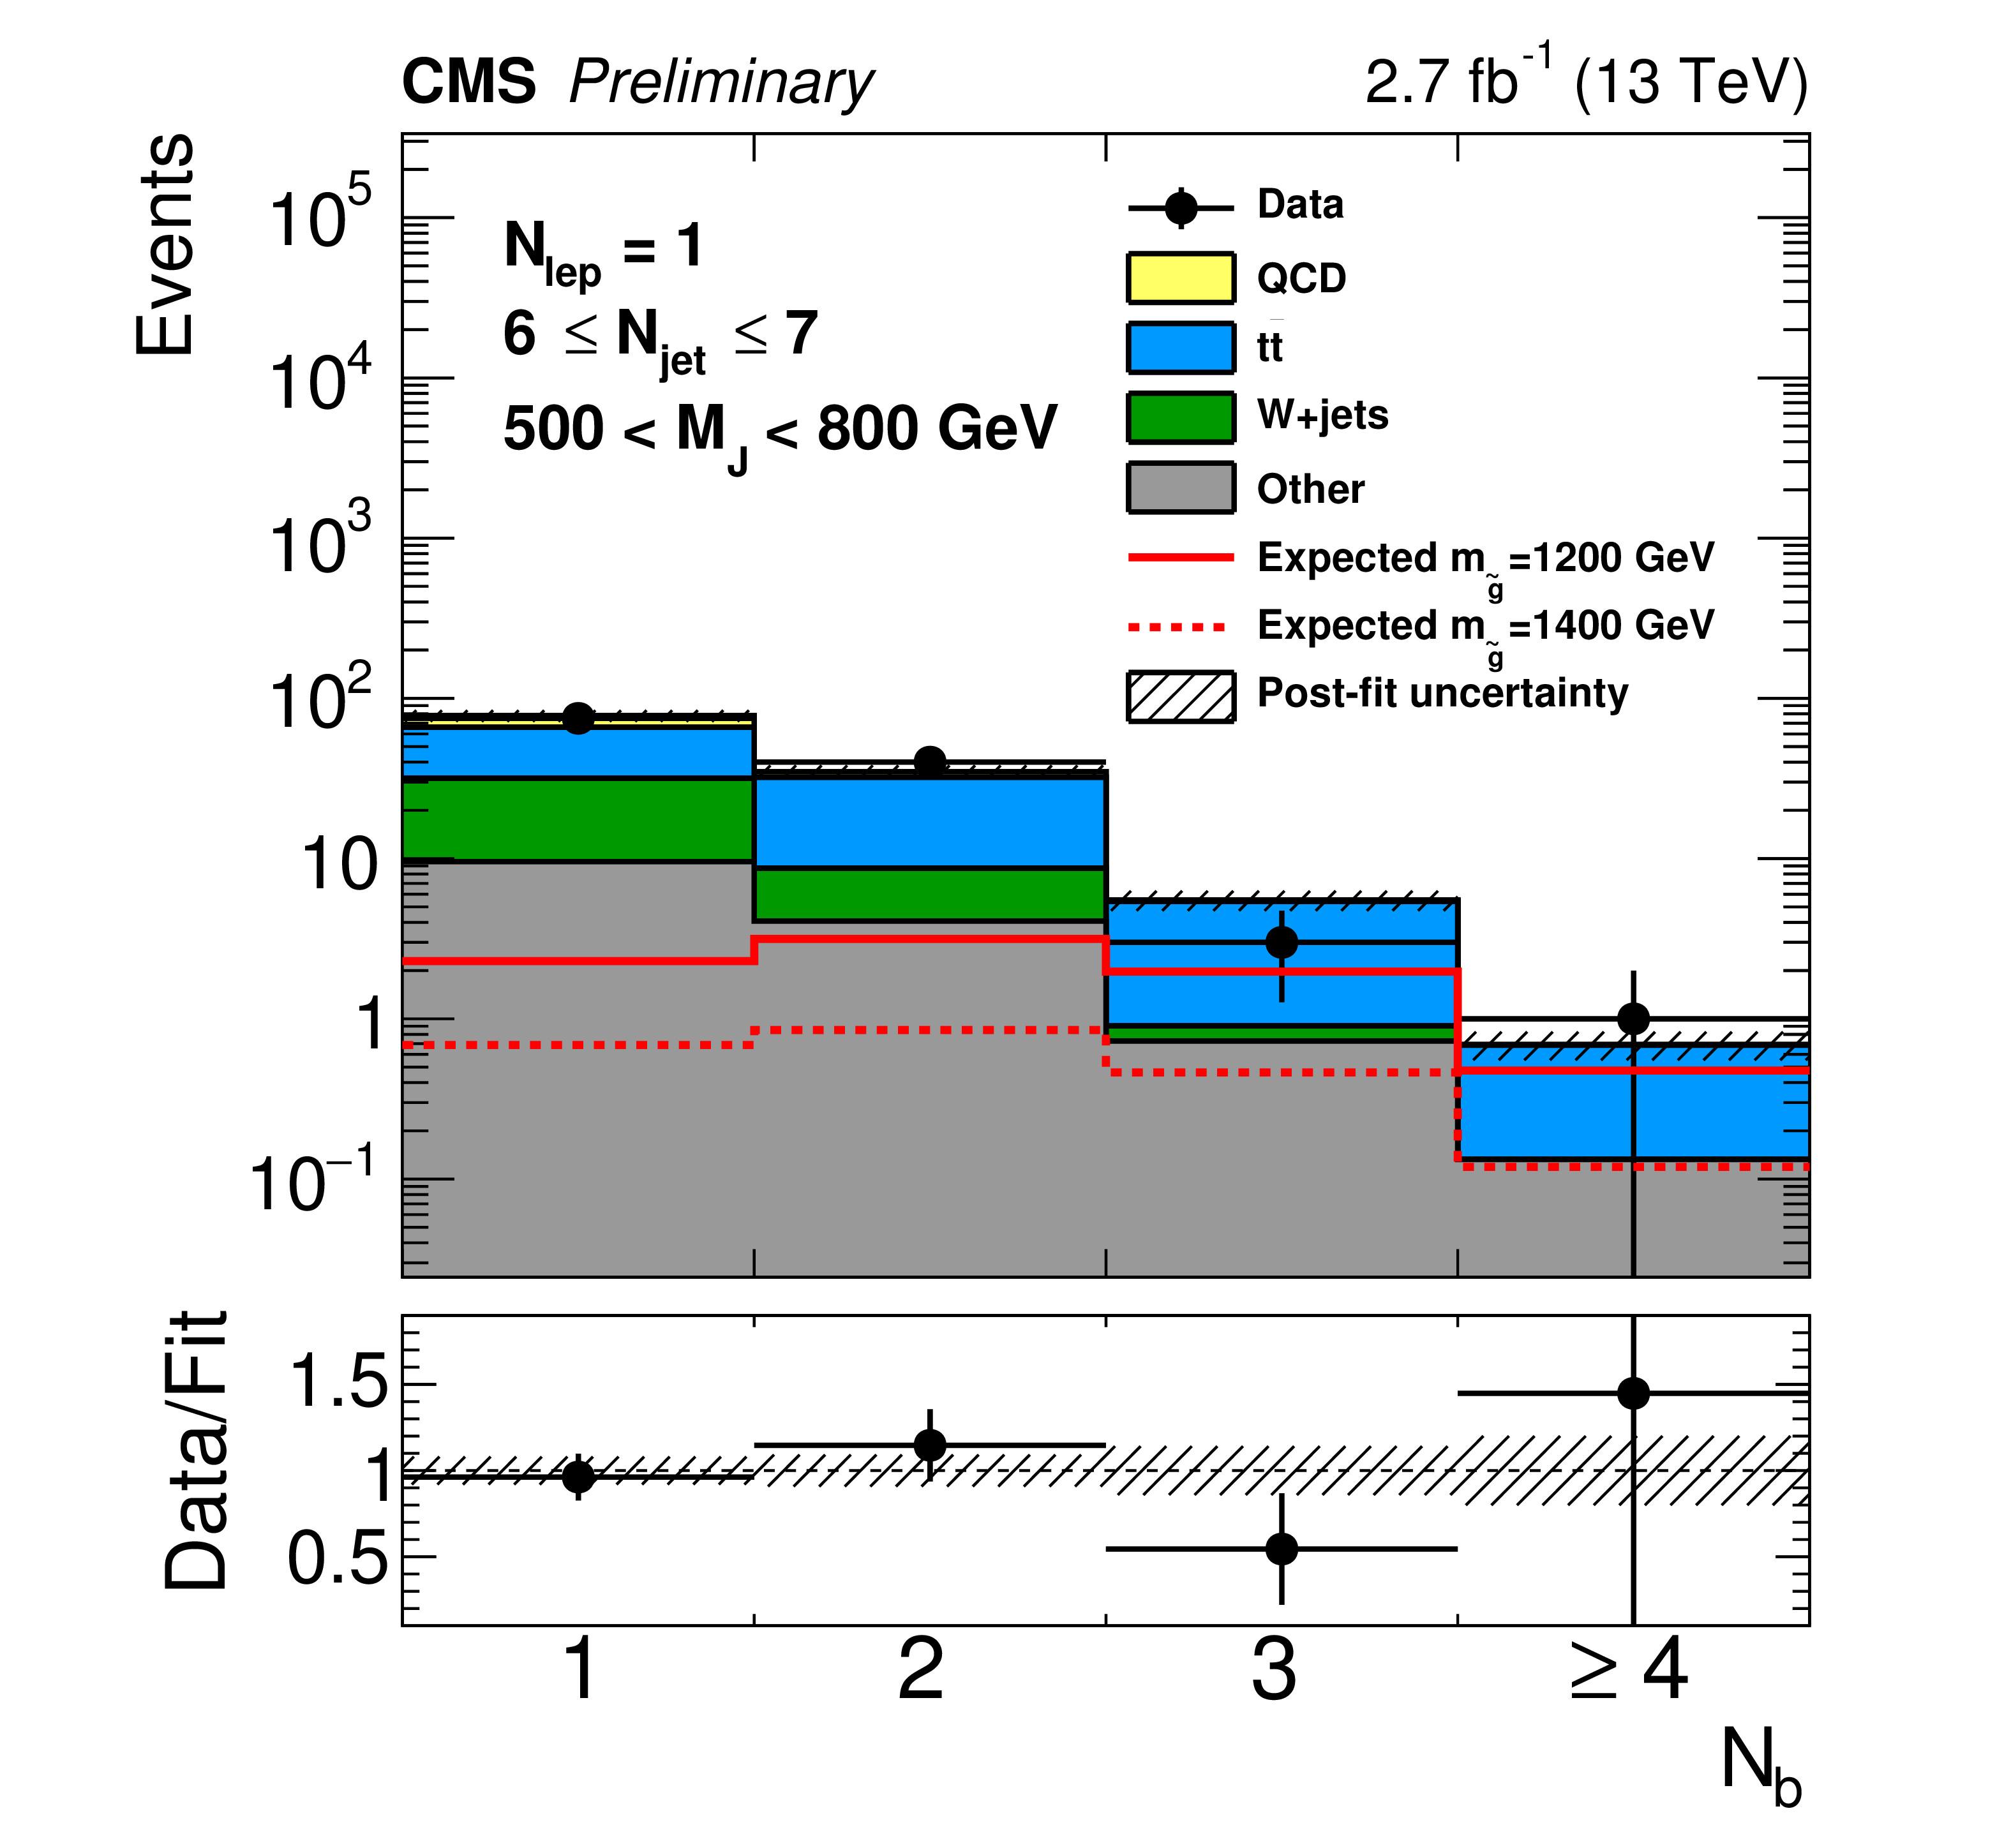
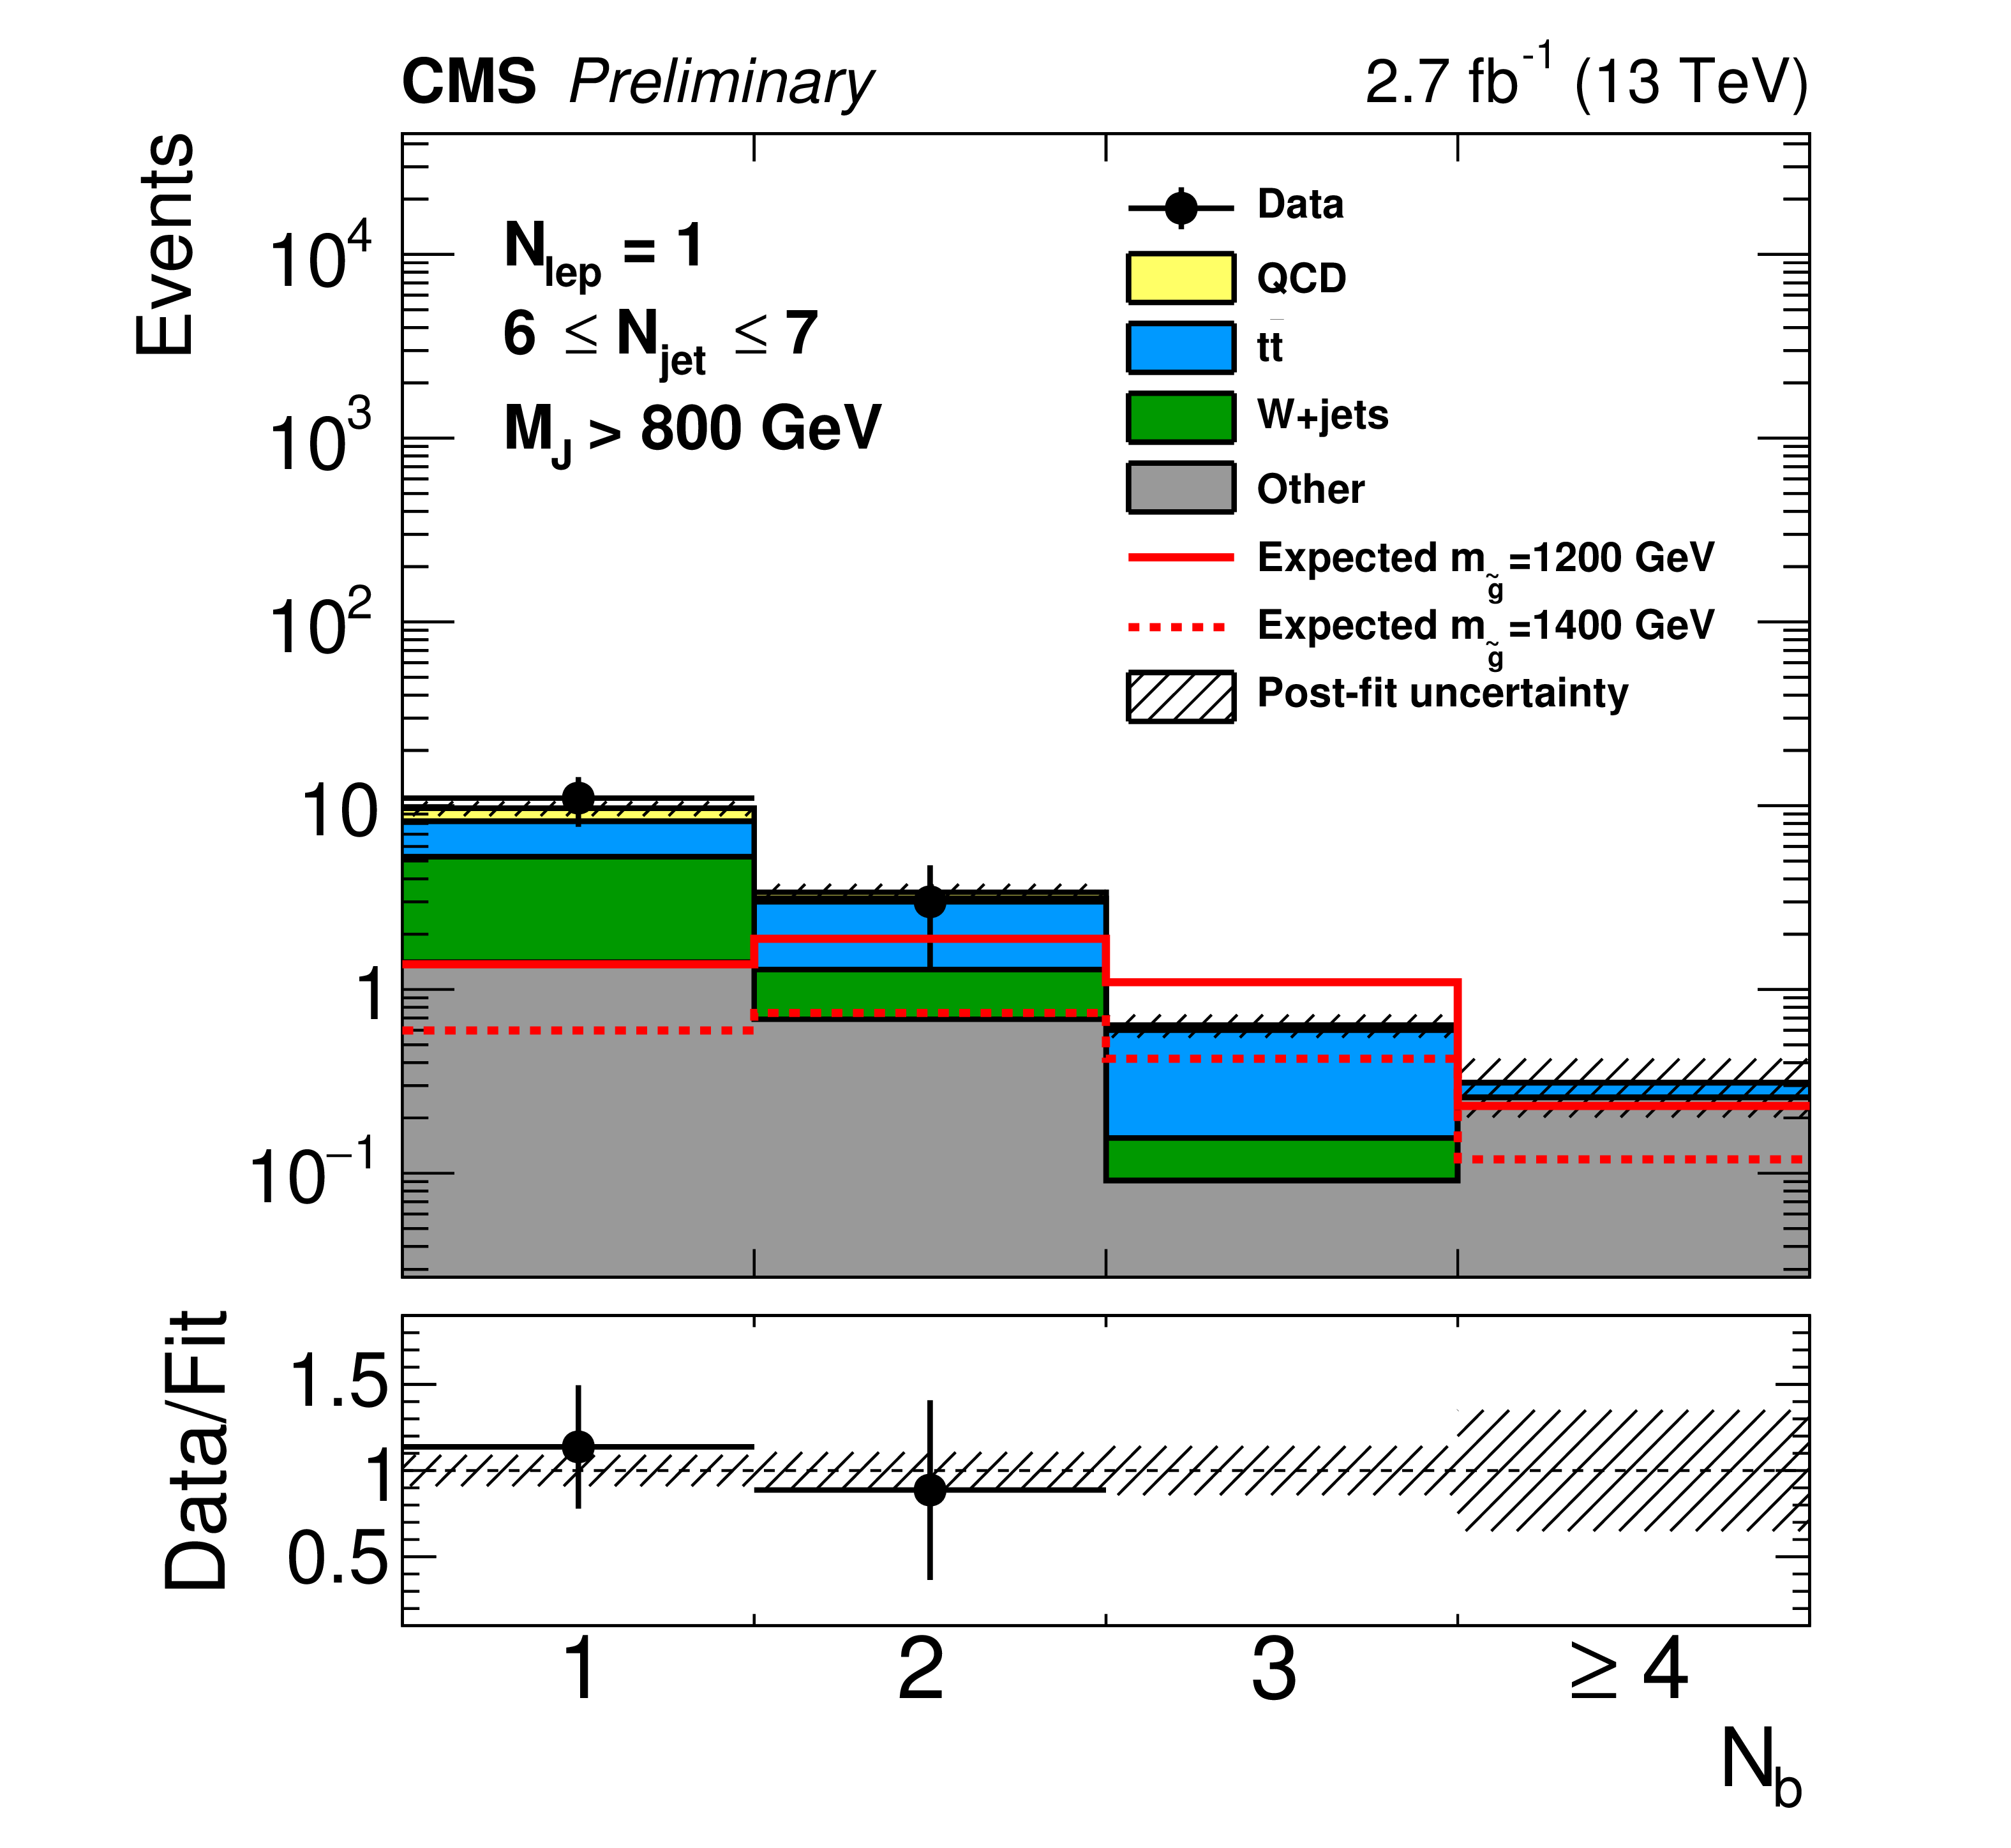
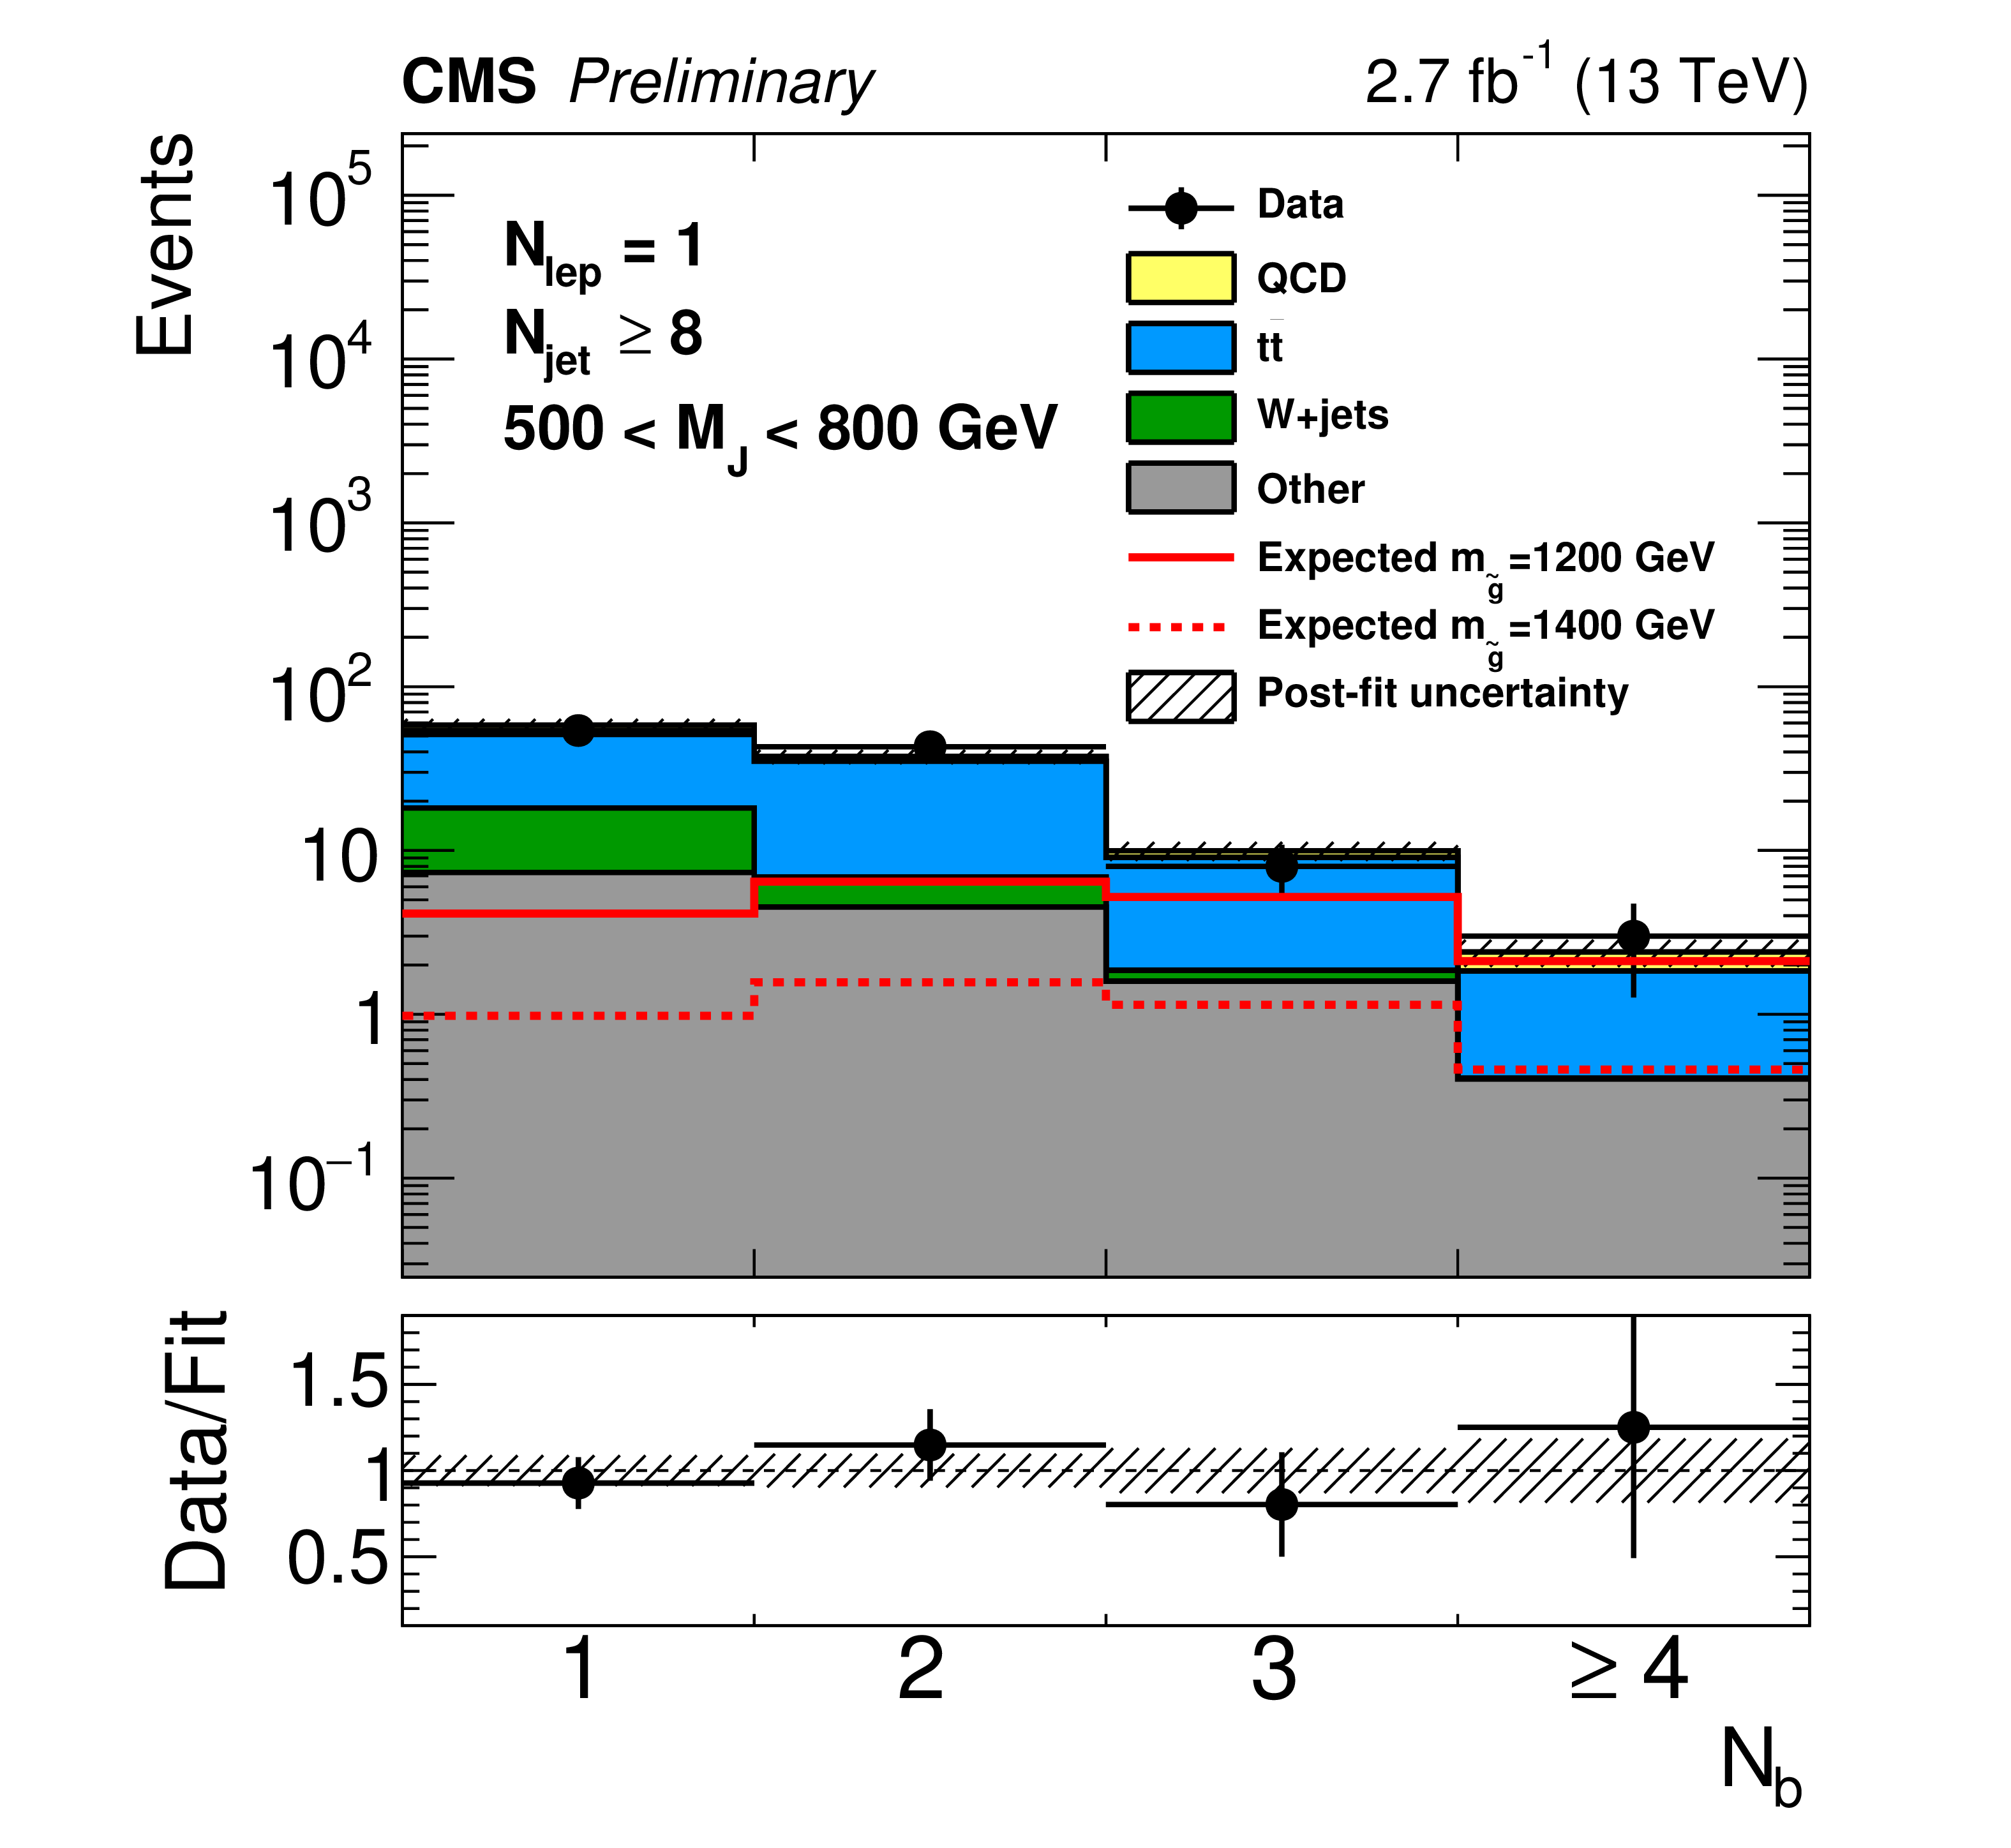
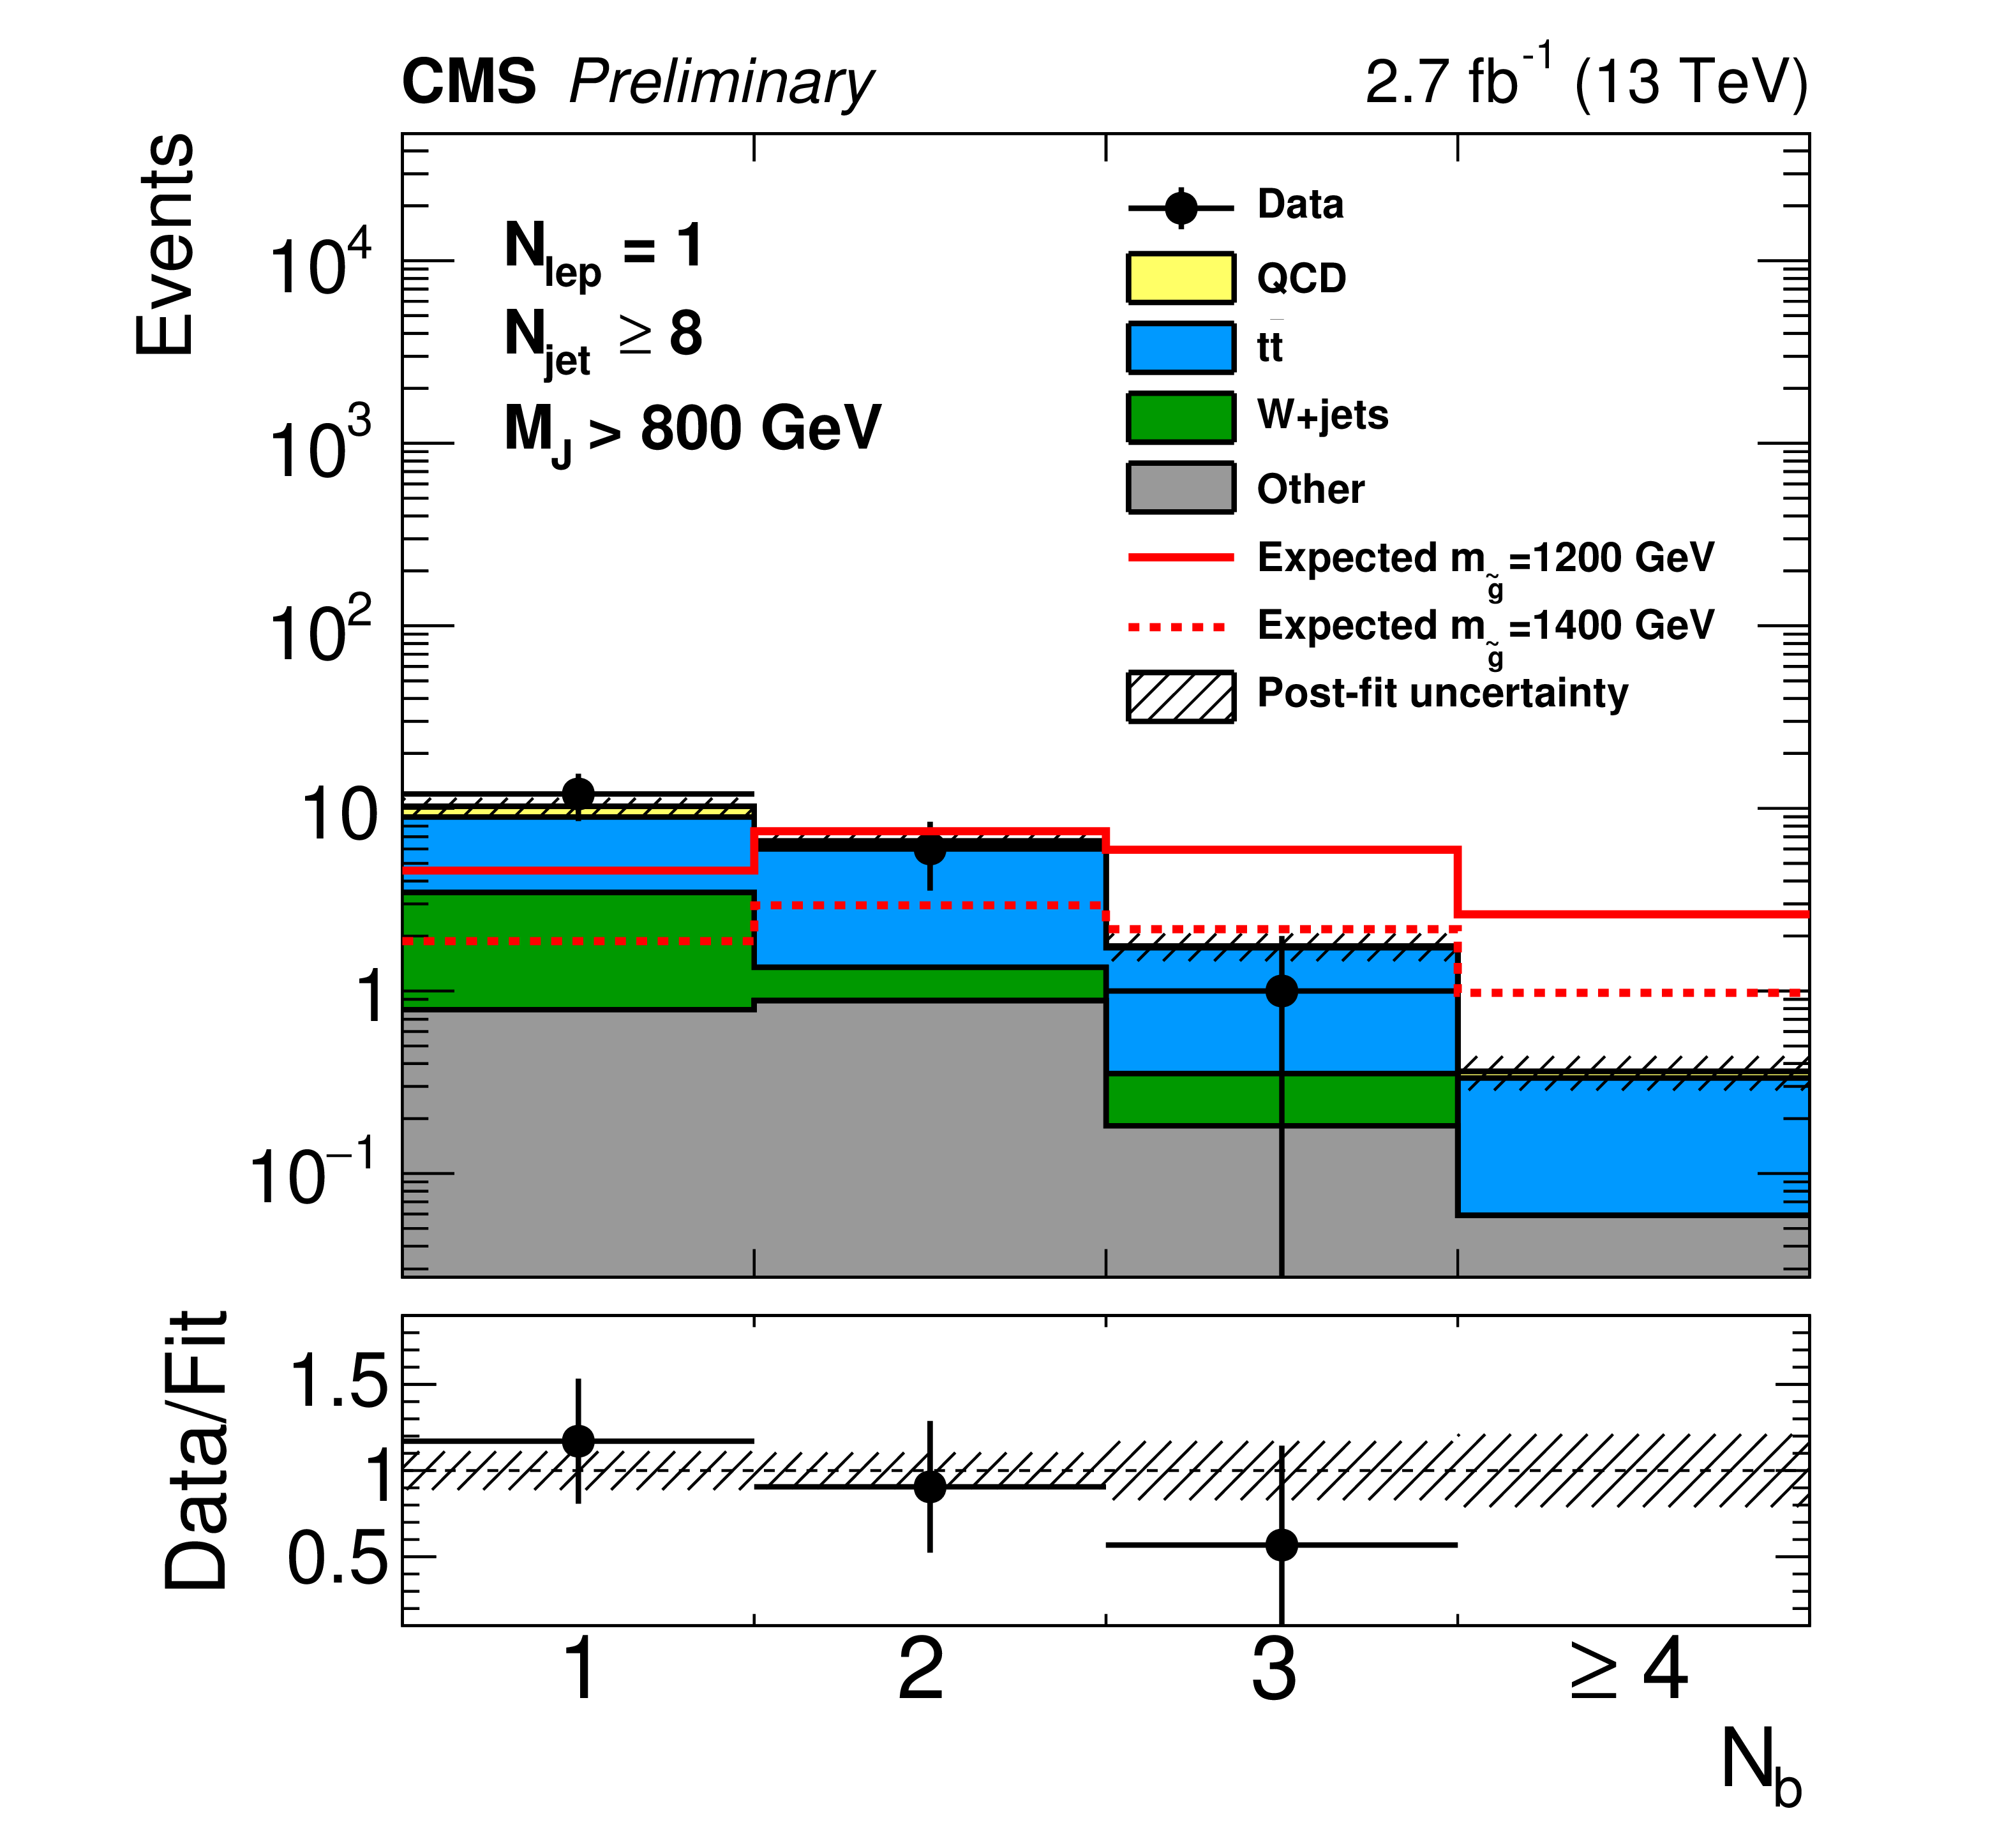
Figure 8-a:
The post-fit $N_\text {b}$ distributions in the 1-lepton signal region. Plots in the left column require 500 $ < M_\text {J} < $ 80 GeV , while $M_\text {J} > $ 800 GeV is required in the right column. The top row shows the 6 $ \leq N_\text {jet} \leq $ 7 signal region, and the bottom row shows the $N_\text {jet} \geq $ 8 signal region. The uncertainty displayed in the ratio plot as error bars reflects data statistics only. |
png pdf |
Figure 8-b:
The post-fit $N_\text {b}$ distributions in the 1-lepton signal region. Plots in the left column require 500 $ < M_\text {J} < $ 80 GeV , while $M_\text {J} > $ 800 GeV is required in the right column. The top row shows the 6 $ \leq N_\text {jet} \leq $ 7 signal region, and the bottom row shows the $N_\text {jet} \geq $ 8 signal region. The uncertainty displayed in the ratio plot as error bars reflects data statistics only. |
png pdf |
Figure 8-c:
The post-fit $N_\text {b}$ distributions in the 1-lepton signal region. Plots in the left column require 500 $ < M_\text {J} < $ 80 GeV , while $M_\text {J} > $ 800 GeV is required in the right column. The top row shows the 6 $ \leq N_\text {jet} \leq $ 7 signal region, and the bottom row shows the $N_\text {jet} \geq $ 8 signal region. The uncertainty displayed in the ratio plot as error bars reflects data statistics only. |
png pdf |
Figure 8-d:
The post-fit $N_\text {b}$ distributions in the 1-lepton signal region. Plots in the left column require 500 $ < M_\text {J} < $ 80 GeV , while $M_\text {J} > $ 800 GeV is required in the right column. The top row shows the 6 $ \leq N_\text {jet} \leq $ 7 signal region, and the bottom row shows the $N_\text {jet} \geq $ 8 signal region. The uncertainty displayed in the ratio plot as error bars reflects data statistics only. |

png pdf |
Figure 9:
Cross section upper limits at 95% CL compared to the gluino pair production cross section (magenta). The expected limits (black solid line) and their $\pm$ 1 standard deviation (green) and $\pm$ 2 standard deviation (yellow) limits are shown. The observed limit is displayed as a black solid line with dots. |
| Tables | |
png pdf |
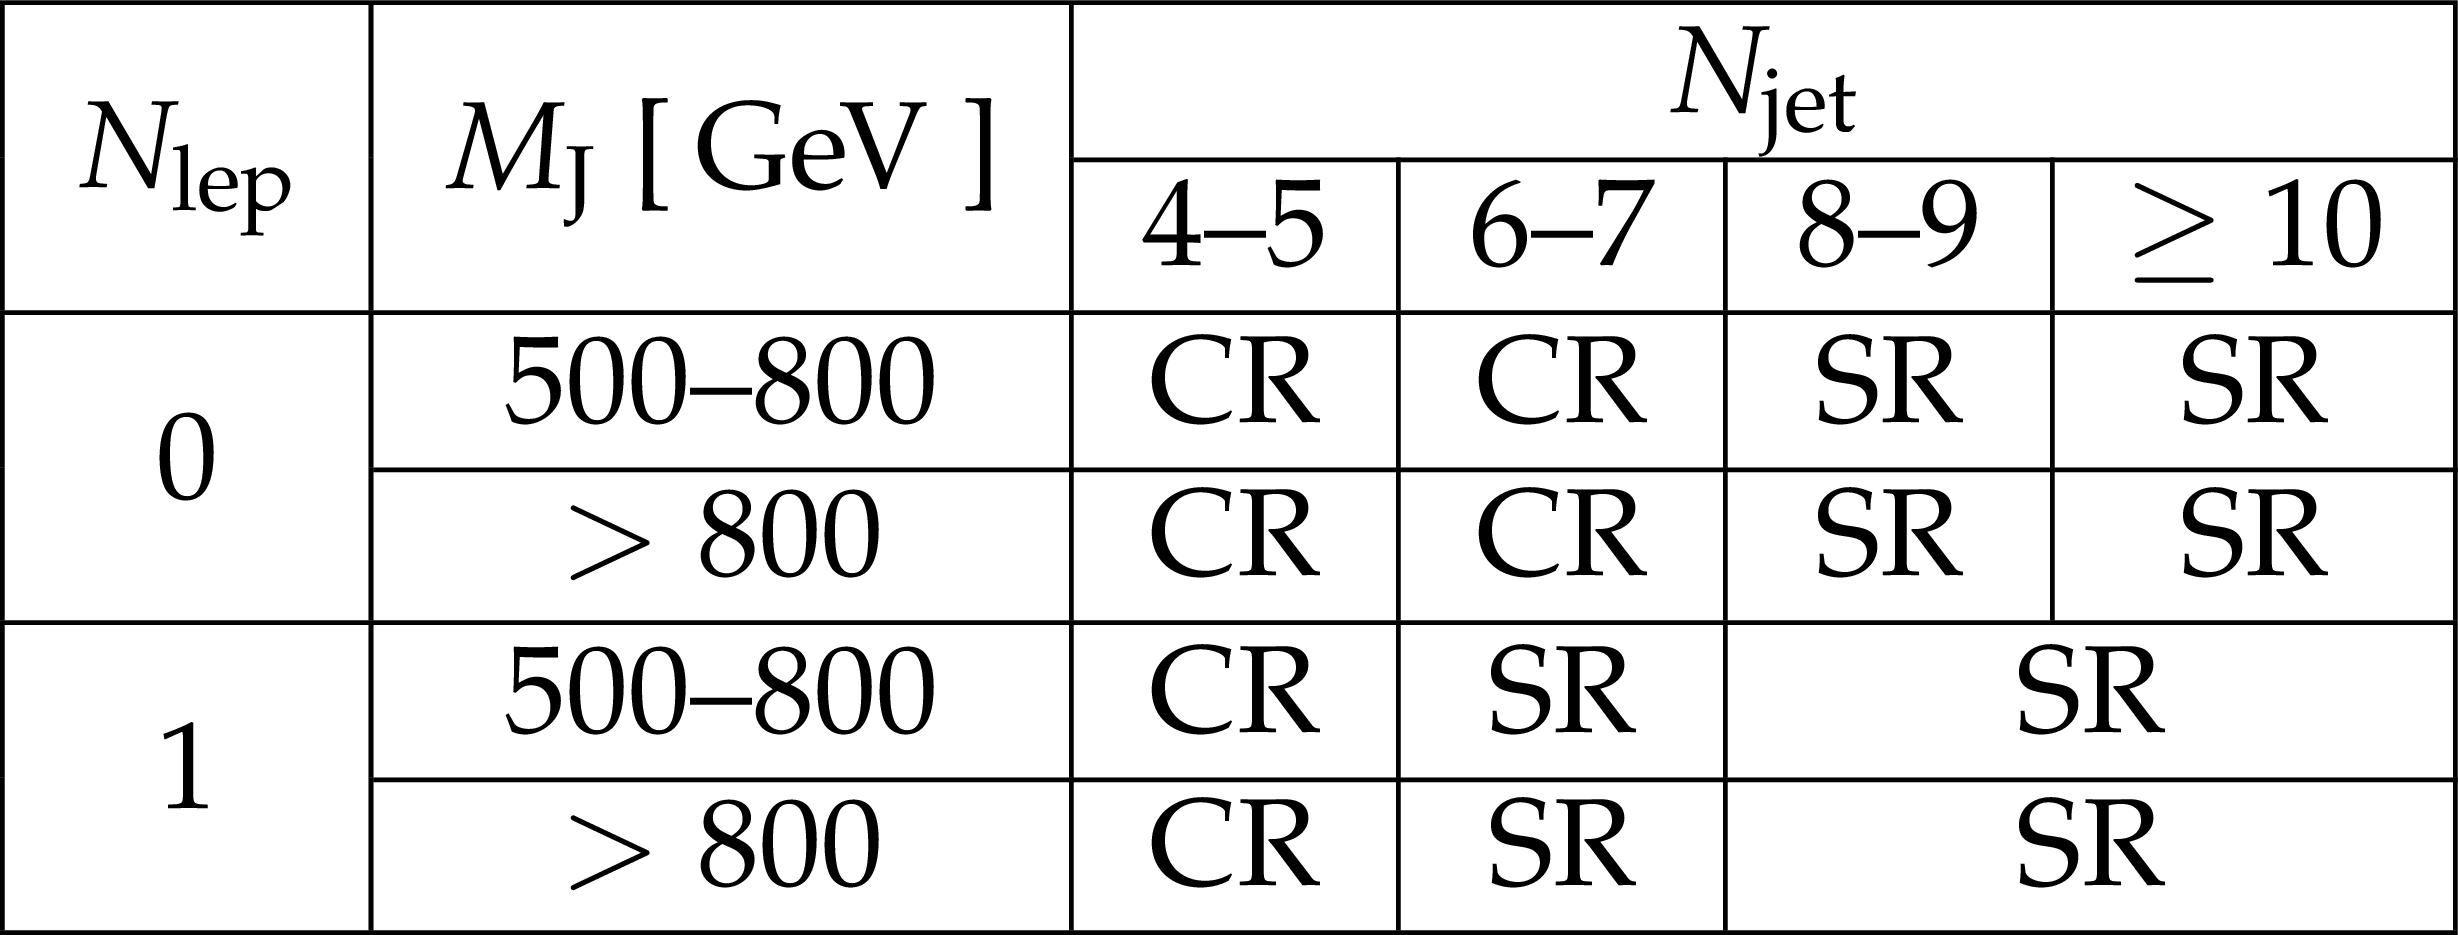
Table 1:
A representation of the bins of the analysis after the baseline selection. The bins labeled ``CR'' are background dominated and serve as a control region for the fit, while the bins labeled ``SR'' correspond to signal regions. Even within the high $N_\text {jet}$ and $M_\text {J}$ bins, events with $ {N_{\textrm {b}}} \le $ 2 are background dominated and act as control regions for the fit. |
png pdf |
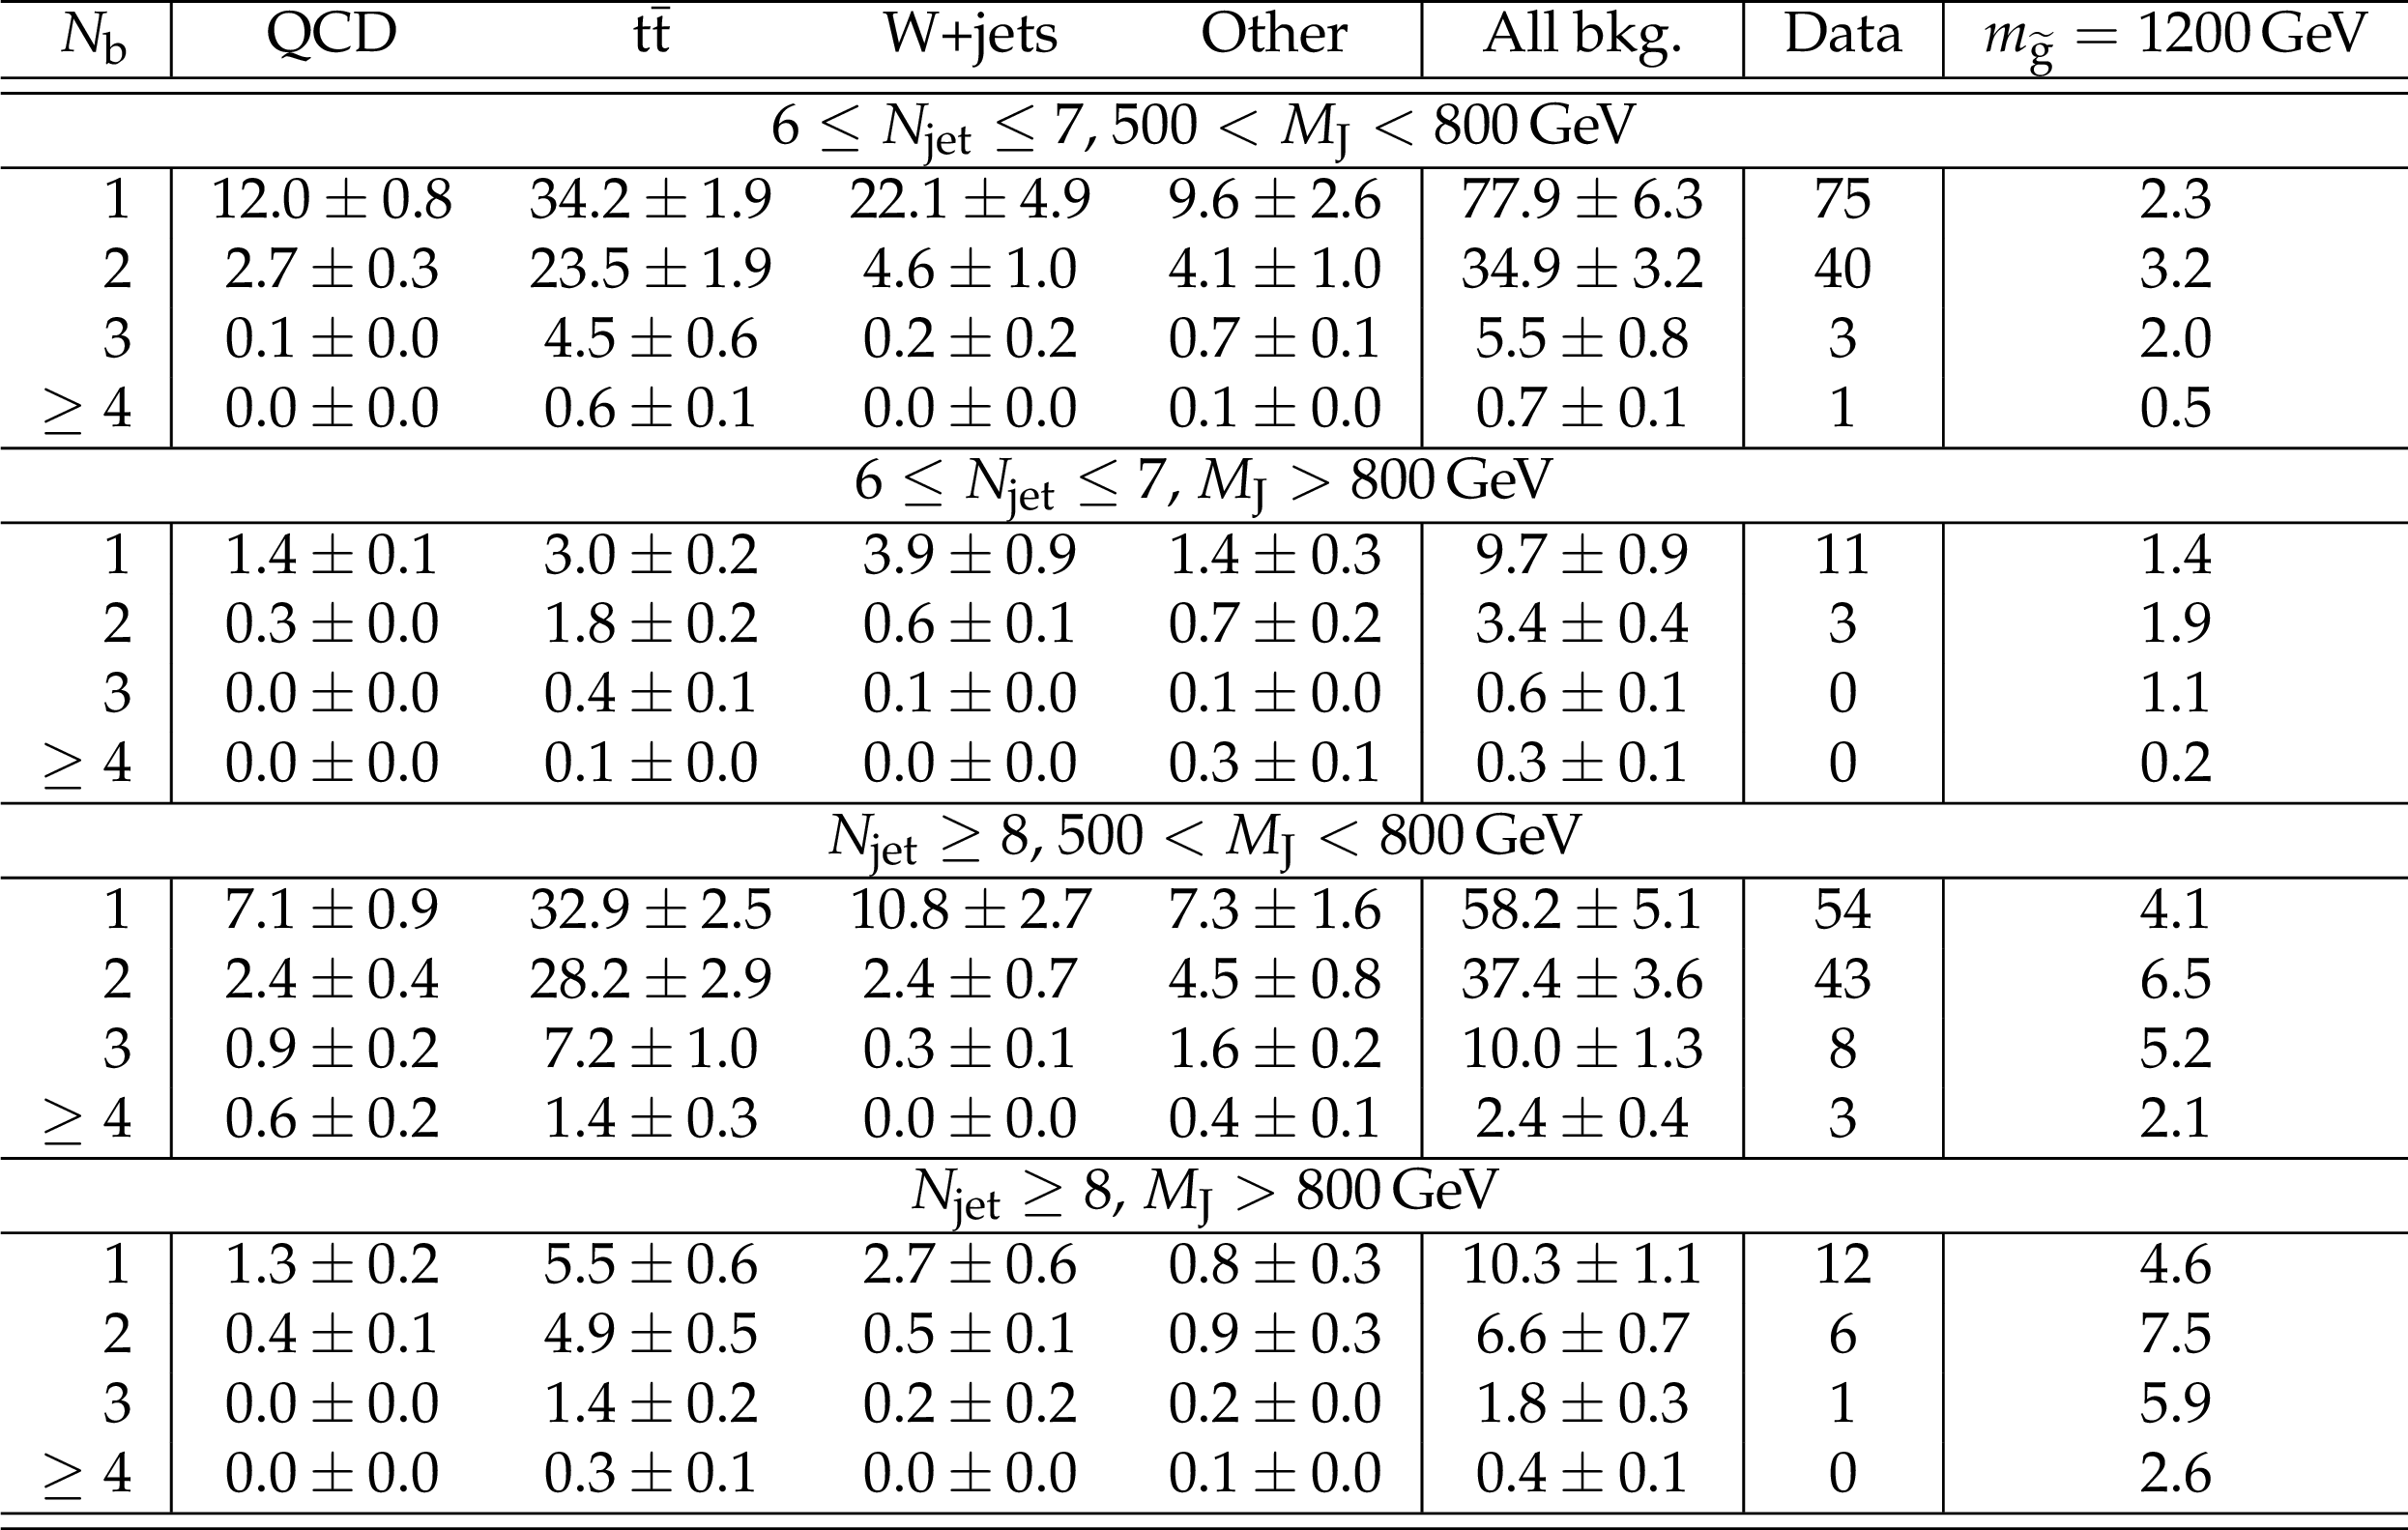
Table 2:
Post-fit normalization of backgrounds, data, and expected yields for a gluino with $m_{ \tilde{\mathrm{g}}}=$ 1200 GeV in events with $N_\text {lep}=$ 0 and $ {H_{\mathrm {T}}} > $ 1500 GeV. Systematic uncertainties are included. |
png pdf |
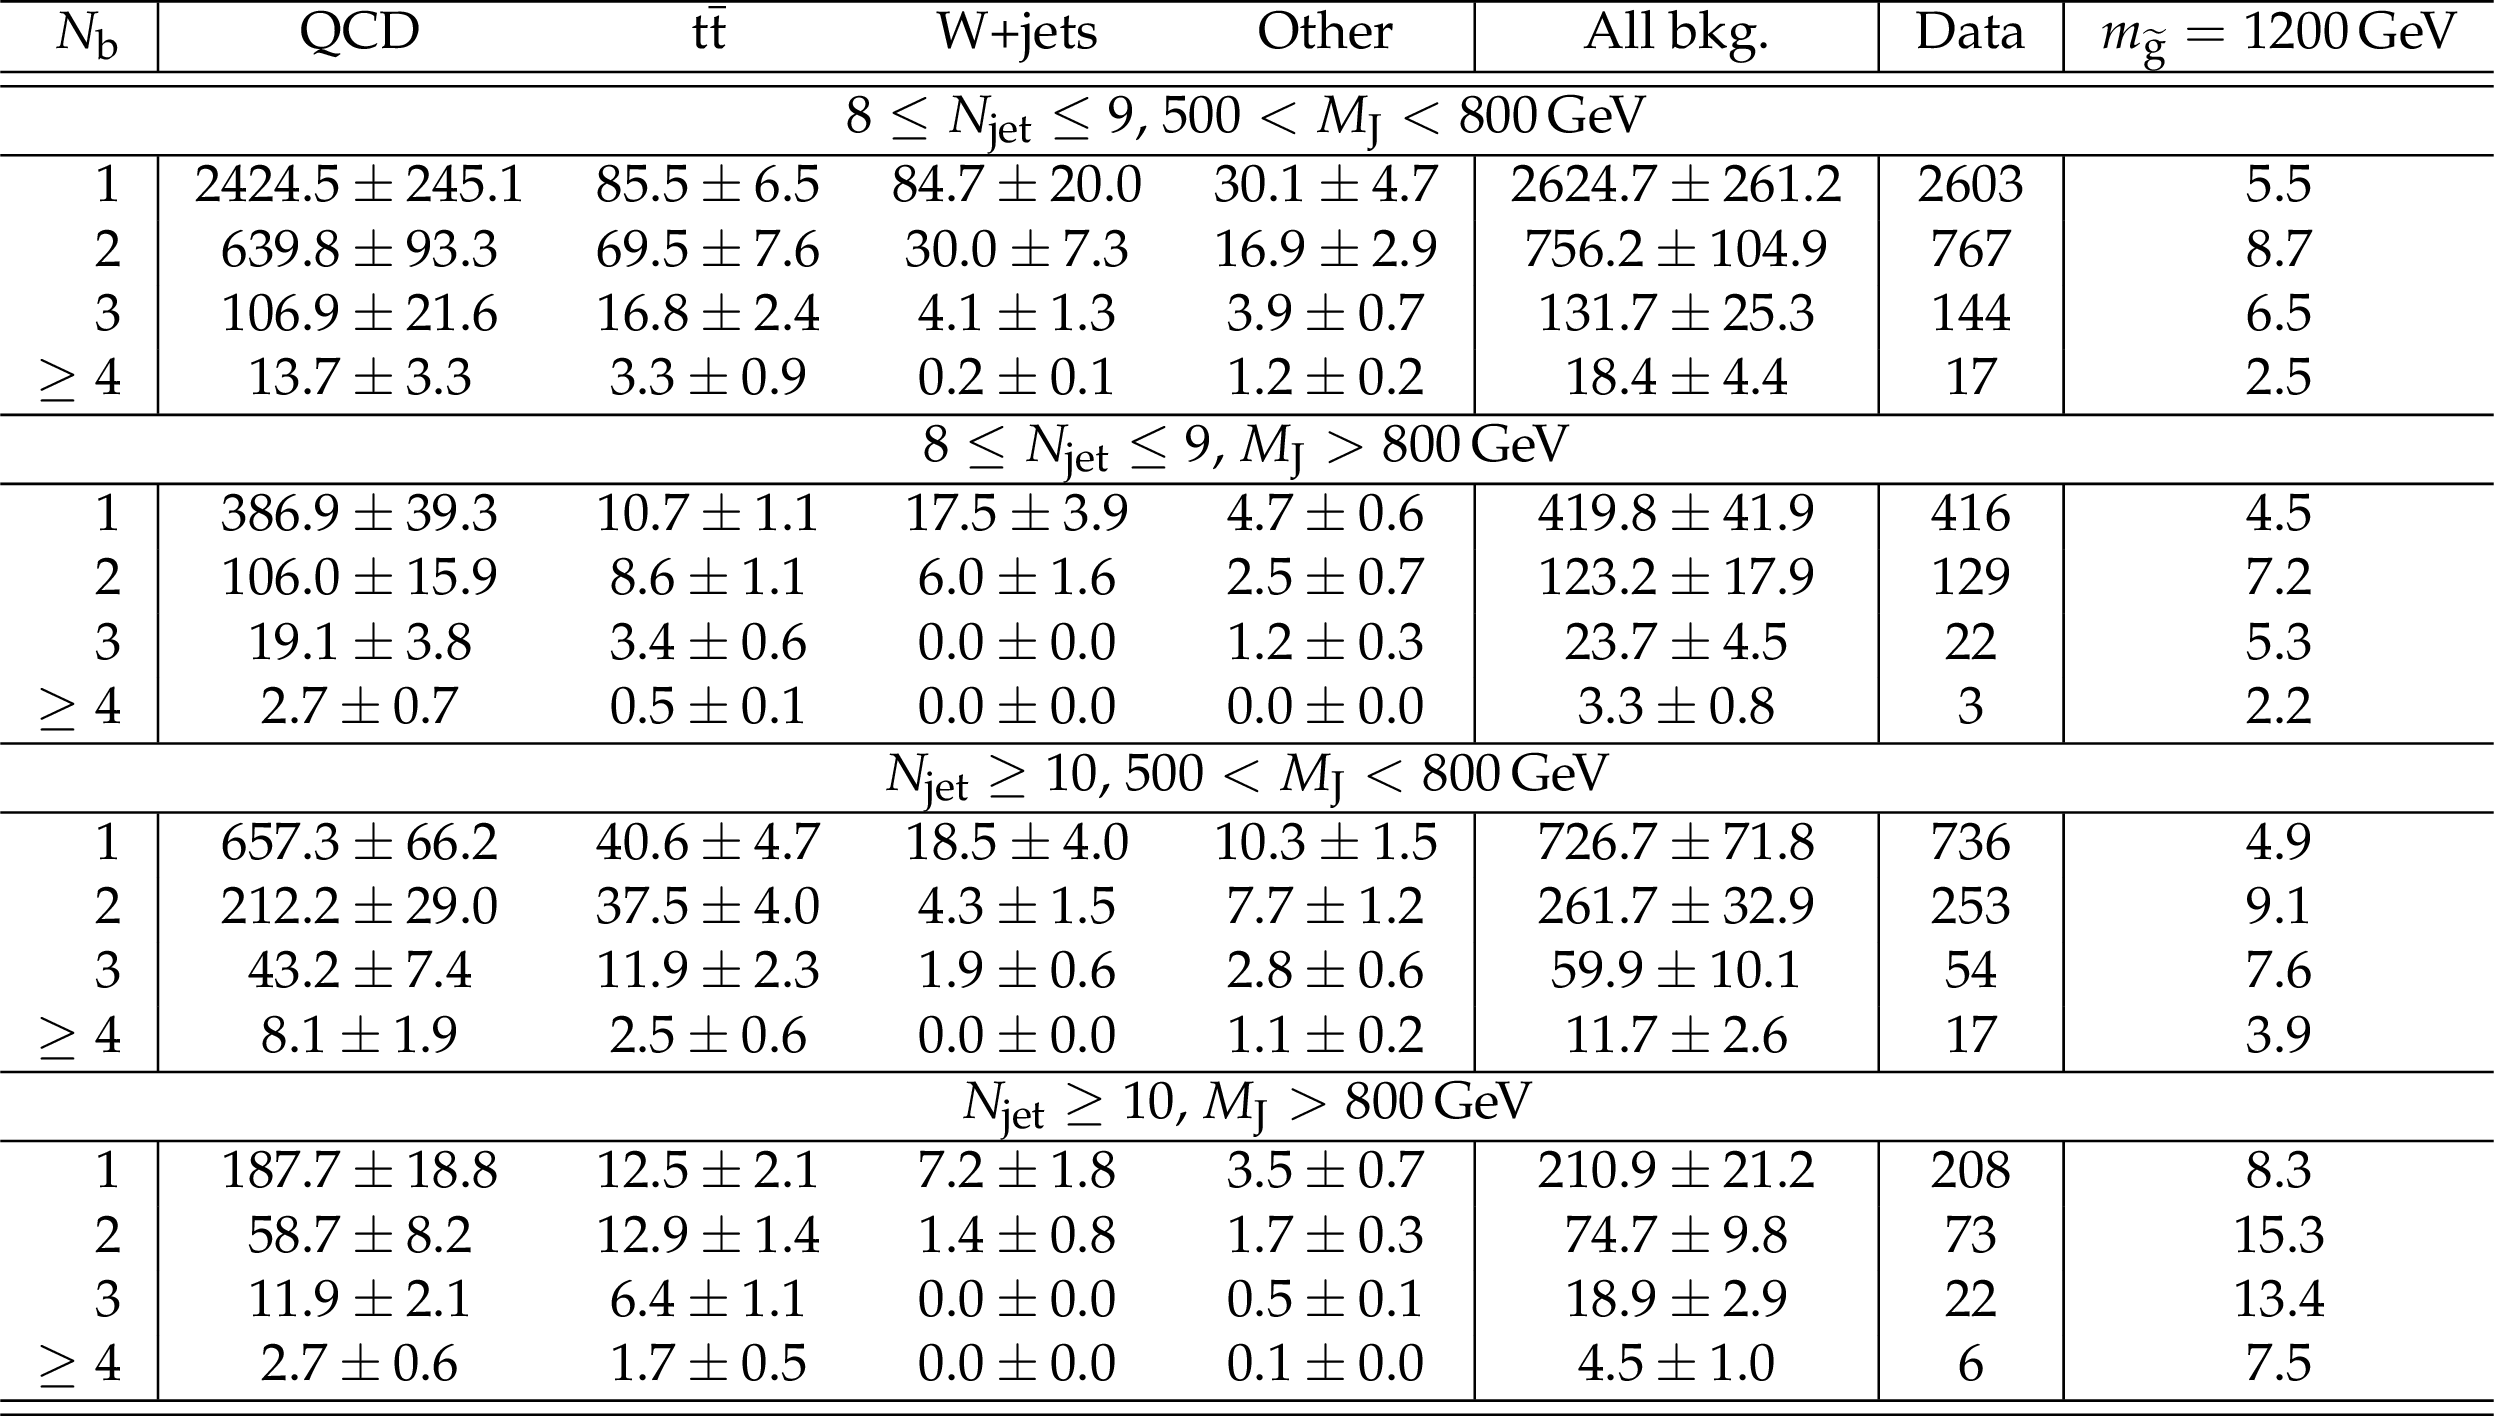
Table 3:
Post-fit normalization of backgrounds, data, and expected yields for a gluino with $m_{ \tilde{\mathrm{g}}}= $ 1200 GeV in events with $N_\text {lep}= $ 1 and $ {H_{\mathrm {T}}} > $ 1200 GeV. Systematic uncertainties are included. |
| Summary |
| A search has been performed for new physics in high multiplicity final states with zero or one reconstructed lepton. The data used in this analysis were collected by the CMS experiment at $ \sqrt{s} = $ 13 TeV and correspond to an integrated luminosity of 2.7 fb$^{-1}$. The results of the search are interpreted in the context of $R$-parity-violating supersymmetry with a model in which the gluino decays exclusively to $\mathrm{t }\mathrm{b }\mathrm{s}$. No significant excesses are observed, and cross section limits have been set at 95% confidence level. These limits correspond to the exclusion of gluino masses of $m_{\tilde{\mathrm{g}}} < $ 1360 GeV within this scenario. |
| References | ||||
| 1 | G. Bertone, D. Hooper, and J. Silk | Particle dark matter: Evidence, candidates and constraints | PR 405 (2005) 279 | hep-ph/0404175 |
| 2 | E. Witten | Dynamical Breaking of Supersymmetry | Nucl. Phys. B 188 (1981) 513 | |
| 3 | S. Dimopoulos and H. Georgi | Softly Broken Supersymmetry and SU(5) | Nucl. Phys. B 193 (1981) 150 | |
| 4 | P. Ramond | Dual theory for free fermions | PRD 3 (1971) 2415 | |
| 5 | Y. A. Golfand and E. P. Likhtman | Extension of the algebra of Poincar$ \'e $ group generators and violation of P invariance | JEPTL 13 (1971)323 | |
| 6 | A. Neveu and J. H. Schwarz | Factorizable dual model of pions | Nucl. Phys. B 31 (1971) 86 | |
| 7 | D. V. Volkov and V. P. Akulov | Possible universal neutrino interaction | JEPTL 16 (1972)438 | |
| 8 | J. Wess and B. Zumino | A Lagrangian model invariant under supergauge transformations | PLB 49 (1974) 52 | |
| 9 | J. Wess and B. Zumino | Supergauge transformations in four dimensions | Nucl. Phys. B 70 (1974) 39 | |
| 10 | P. Fayet | Supergauge invariant extension of the Higgs mechanism and a model for the electron and its neutrino | Nucl. Phys. B 90 (1975) 104 | |
| 11 | H. P. Nilles | Supersymmetry, supergravity and particle physics | Phys. Rep. 110 (1984) 1 | |
| 12 | G. R. Farrar and P. Fayet | Phenomenology of the Production, Decay, and Detection of New Hadronic States Associated with Supersymmetry | PLB 76 (1978) 575 | |
| 13 | R. Barbier et al. | R-parity violating supersymmetry | PR 420 (2005) 1 | hep-ph/0406039 |
| 14 | L. E. Ibanez and G. G. Ross | Discrete gauge symmetries and the origin of baryon and lepton number conservation in supersymmetric versions of the standard model | Nucl. Phys. B 368 (1992) 3 | |
| 15 | C. Cs\'aki, Y. Grossman, and B. Heidenreich | Minimal flavor violation supersymmetry: A natural theory for R-parity violation | PRD 85 (2012) 095009 | 1111.1239 |
| 16 | J. A. Evans, Y. Kats, D. Shih, and M. J. Strassler | Toward Full LHC Coverage of Natural Supersymmetry | JHEP 07 (2014) 101 | 1310.5758 |
| 17 | J. A. Evans | A Swarm of Bs | JHEP 08 (2014) 073 | 1402.4481 |
| 18 | CMS Collaboration | Search for three-jet resonances in pp collisions at $ \sqrt{s}=7 $~TeV | PLB 718 (2012) 329 | CMS-EXO-11-060 1208.2931 |
| 19 | CMS Collaboration | Search for Three-Jet Resonances in $ pp $ Collisions at $ \sqrt{s}=7 $~TeV | PRL 107 (2011) 101801 | CMS-EXO-11-001 1107.3084 |
| 20 | CMS Collaboration | Searches for light- and heavy-flavour three-jet resonances in pp collisions at $ \sqrt{s} = 8 $ TeV | PLB 730 (2014) 193 | CMS-EXO-12-049 1311.1799 |
| 21 | CMS Collaboration | Searches for $ R $-parity-violating supersymmetry in pp collisions at $ \sqrt{s} $ = 8$ TeV $ in final states with 0--4 leptons | Submitted to PRD | CMS-SUS-14-003 1606.08076 |
| 22 | A. Hook, E. Izaguirre, M. Lisanti, and J. G. Wacker | High Multiplicity Searches at the LHC Using Jet Masses | PRD 85 (2012) 055029 | 1202.0558 |
| 23 | T. Cohen, E. Izaguirre, M. Lisanti, and H. K. Lou | Jet Substructure by Accident | JHEP 03 (2013) 161 | 1212.1456 |
| 24 | S. El Hedri, A. Hook, M. Jankowiak, and J. G. Wacker | Learning How to Count: A High Multiplicity Search for the LHC | JHEP 08 (2013) 136 | 1302.1870 |
| 25 | ATLAS Collaboration | Search for massive supersymmetric particles decaying to many jets using the ATLAS detector in pp collisions at $ \sqrt{s} = 8 $ TeV | PRD 91 (2015) 112016 | 1502.05686 |
| 26 | ATLAS Collaboration | Search for new phenomena in final states with large jet multiplicities and missing transverse momentum at $ \sqrt{s}=8 $ TeV proton-proton collisions using the ATLAS experiment | JHEP 10 (2013) 130, , [Erratum: JHEP 01 (2014) 109] | 1308.1841 |
| 27 | CMS Collaboration | Search for supersymmetry in pp collisions at $ \sqrt{s} $ = 13 TeV in the single-lepton final state using the sum of masses of large-radius jets | CMS-SUS-15-007 1605.04608 |
|
| 28 | GEANT4 Collaboration | GEANT4: A Simulation toolkit | NIMA 506 (2003) 250 | |
| 29 | J. Alwall et al. | The automated computation of tree-level and next-to-leading order differential cross sections, and their matching to parton shower simulations | JHEP 07 (2014) 079 | 1405.0301 |
| 30 | S. Frixione, P. Nason, and C. Oleari | Matching NLO QCD computations with parton shower simulations: the POWHEG method | JHEP 11 (2007) 070 | 0709.2092 |
| 31 | T. Sj\"ostrand, S. Mrenna, and P. Z. Skands | A Brief Introduction to PYTHIA 8.1 | CPC 178 (2008) 852 | 0710.3820 |
| 32 | CMS Collaboration | The fast simulation of the CMS detector at LHC | J. Phys. Conf. Ser. 331 (2011) 032049 | |
| 33 | CMS Collaboration | Particle-Flow Event Reconstruction in CMS and Performance for Jets, Taus, and Missing $ E_T $ | CDS | |
| 34 | CMS Collaboration | Commissioning of the Particle-Flow Reconstruction in Minimum-Bias and Jet Events from pp Collisions at 7 TeV | CDS | |
| 35 | M. Cacciari, G. P. Salam, and G. Soyez | The anti-$ k_\text{t} $ jet clustering algorithm | JHEP 04 (2008) 063 | 0802.1189 |
| 36 | M. Cacciari, G. P. Salam, and G. Soyez | FastJet user manual | EPJC 72 (2012) 1896 | 1111.6097 |
| 37 | CMS Collaboration | Identification of b quark jets at the CMS Experiment in the LHC Run 2 | CMS-PAS-BTV-15-001 | CMS-PAS-BTV-15-001 |
| 38 | CMS Collaboration | Measurement of $ B\overline{B} $ angular correlations based on secondary vertex reconstruction at $ \sqrt{s}=7 $~TeV | JHEP 03 (2011) 1103 | CMS-BPH-10-010 1102.3194 |
| 39 | R. J. Barlow and C. Beeston | Fitting using finite Monte Carlo samples | CPC 77 (1993) 219 | |
| 40 | NNPDF Collaboration | A determination of parton distributions with faithful uncertainty estimation | Nucl. Phys. B 809 (2009) 1, , [Erratum: Nucl. Phys.B816,293(2009)] | 0808.1231 |
| 41 | NNPDF Collaboration | Parton distributions for the LHC Run II | JHEP 04 (2015) 040 | 1410.8849 |
| 42 | CMS Collaboration | CMS Luminosity Measurement for the 2015 Data Taking Period | CMS-PAS-LUM-15-001 | CMS-PAS-LUM-15-001 |
| 43 | CMS Collaboration | Jet energy scale and resolution in the CMS experiment in pp collisions at 8 TeV | CDS | |
| 44 | P. D. Dauncey, M. Kenzie, N. Wardle, and G. J. Davies | Handling uncertainties in background shapes | JINST 10 (2015) P04015 | 1408.6865 |
| 45 | G. Cowan, K. Cranmer, E. Gross, and O. Vitells | Asymptotic formulae for likelihood-based tests of new physics | EPJC 71 (2011) 1554, , [Erratum: Eur. Phys. J.C73,2501(2013)] | 1007.1727 |
| 46 | M. Kramer et al. | Supersymmetry production cross sections in $ pp $ collisions at $ \sqrt{s}=7 $ TeV | 1206.2892 | |
|
|
Compact Muon Solenoid LHC, CERN |
|

|

|

|

|

|