

Compact Muon Solenoid
LHC, CERN
| CMS-PAS-SUS-16-021 | ||
| Search for new physics in final states with two opposite-sign, same-flavor leptons, jets, and missing transverse momentum in pp collisions at $\sqrt{s} =$ 13 TeV | ||
| CMS Collaboration | ||
| August 2016 | ||
| Abstract: A search is presented for physics beyond the standard model in final states with two opposite-sign, same-flavor leptons, jets, and missing transverse momentum. The data sample corresponds to an integrated luminosity of 12.9 fb$^{-1}$ of proton-proton collisions at $\sqrt{s}= $ 13 TeV collected with the CMS detector at the LHC in 2016. The analysis uses the invariant mass of the lepton pair, searching for a kinematic edge or a resonant-like excess compatible with the Z boson mass. The search for a kinematic edge targets strong production while the resonance search targets both strongly and electroweakly produced new physics. Both search modes use several event categories in order to increase the sensitivity to new physics. These categories are based on several observables related to the lepton pair and the hadronic system in order to optimize signal efficiency and background rejection. A fit is employed to search for a possible kinematic edge position in the strong, non-resonant search. In addition, signal regions are included for which excesses were reported by the ATLAS and CMS collaborations using $\sqrt{s}= $ 8 TeV and $\sqrt{s}= $ 13 TeV data. The observations in all signal regions are consistent with the expectations from the standard model, and the results are interpreted in the context of simplified models of supersymmetry. | ||
| Links: CDS record (PDF) ; inSPIRE record ; CADI line (restricted) ; | ||
| Figures & Tables | Summary | Additional Figures & Tables | References | CMS Publications |
|---|
| Additional information on efficiencies needed for reinterpretation of these results are available here. |
| Figures | |
png pdf |
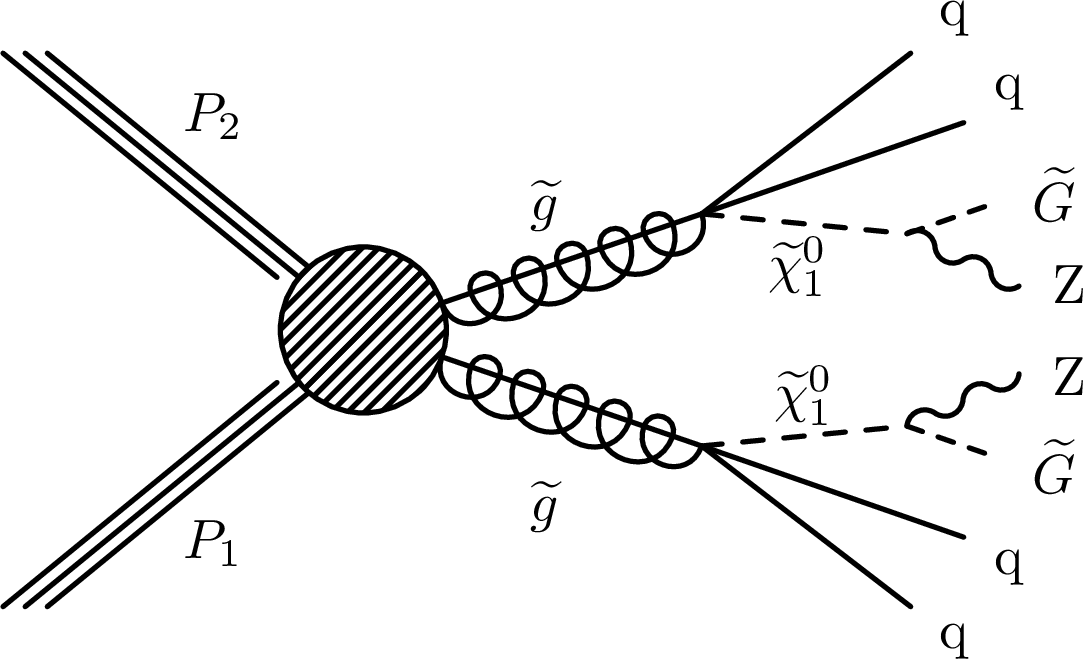
Figure 1-a:
Diagrams for gluino and $\tilde{ \mathrm{b} }$ pair production and decays realized in the simplified models (a,b). The GMSB model targeted by the strong on-Z search is shown on (a). On (b), the slepton-edge model features characteristic edges in the $m_{\ell \ell }$ spectrum given by the mass difference of the $\tilde{ \chi }^0_2$ and $\tilde{ \chi }^0_1 $. The electroweak production model EWK-WZ (bottom) shows the production of a $\tilde{ \chi }^0_2$ together with a $\tilde{ \chi }^{\pm}_1 $, resulting in a final state with a Z, and a W boson and two $\tilde{ \chi }^0_1$s. |

png pdf |
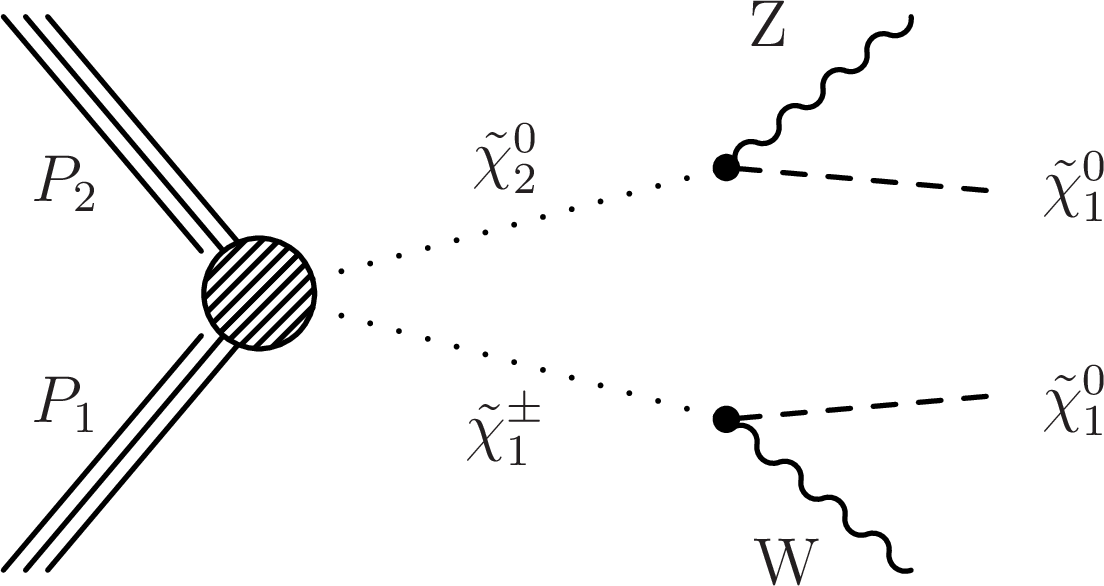
Figure 1-b:
Diagrams for gluino and $\tilde{ \mathrm{b} }$ pair production and decays realized in the simplified models (a,b). The GMSB model targeted by the strong on-Z search is shown on (a). On (b), the slepton-edge model features characteristic edges in the $m_{\ell \ell }$ spectrum given by the mass difference of the $\tilde{ \chi }^0_2$ and $\tilde{ \chi }^0_1 $. The electroweak production model EWK-WZ (bottom) shows the production of a $\tilde{ \chi }^0_2$ together with a $\tilde{ \chi }^{\pm}_1 $, resulting in a final state with a Z, and a W boson and two $\tilde{ \chi }^0_1$s. |
png pdf |
Figure 1-c:
Diagrams for gluino and $\tilde{ \mathrm{b} }$ pair production and decays realized in the simplified models (a,b). The GMSB model targeted by the strong on-Z search is shown on (a). On (b), the slepton-edge model features characteristic edges in the $m_{\ell \ell }$ spectrum given by the mass difference of the $\tilde{ \chi }^0_2$ and $\tilde{ \chi }^0_1 $. The electroweak production model EWK-WZ (bottom) shows the production of a $\tilde{ \chi }^0_2$ together with a $\tilde{ \chi }^{\pm}_1 $, resulting in a final state with a Z, and a W boson and two $\tilde{ \chi }^0_1$s. |
png pdf |
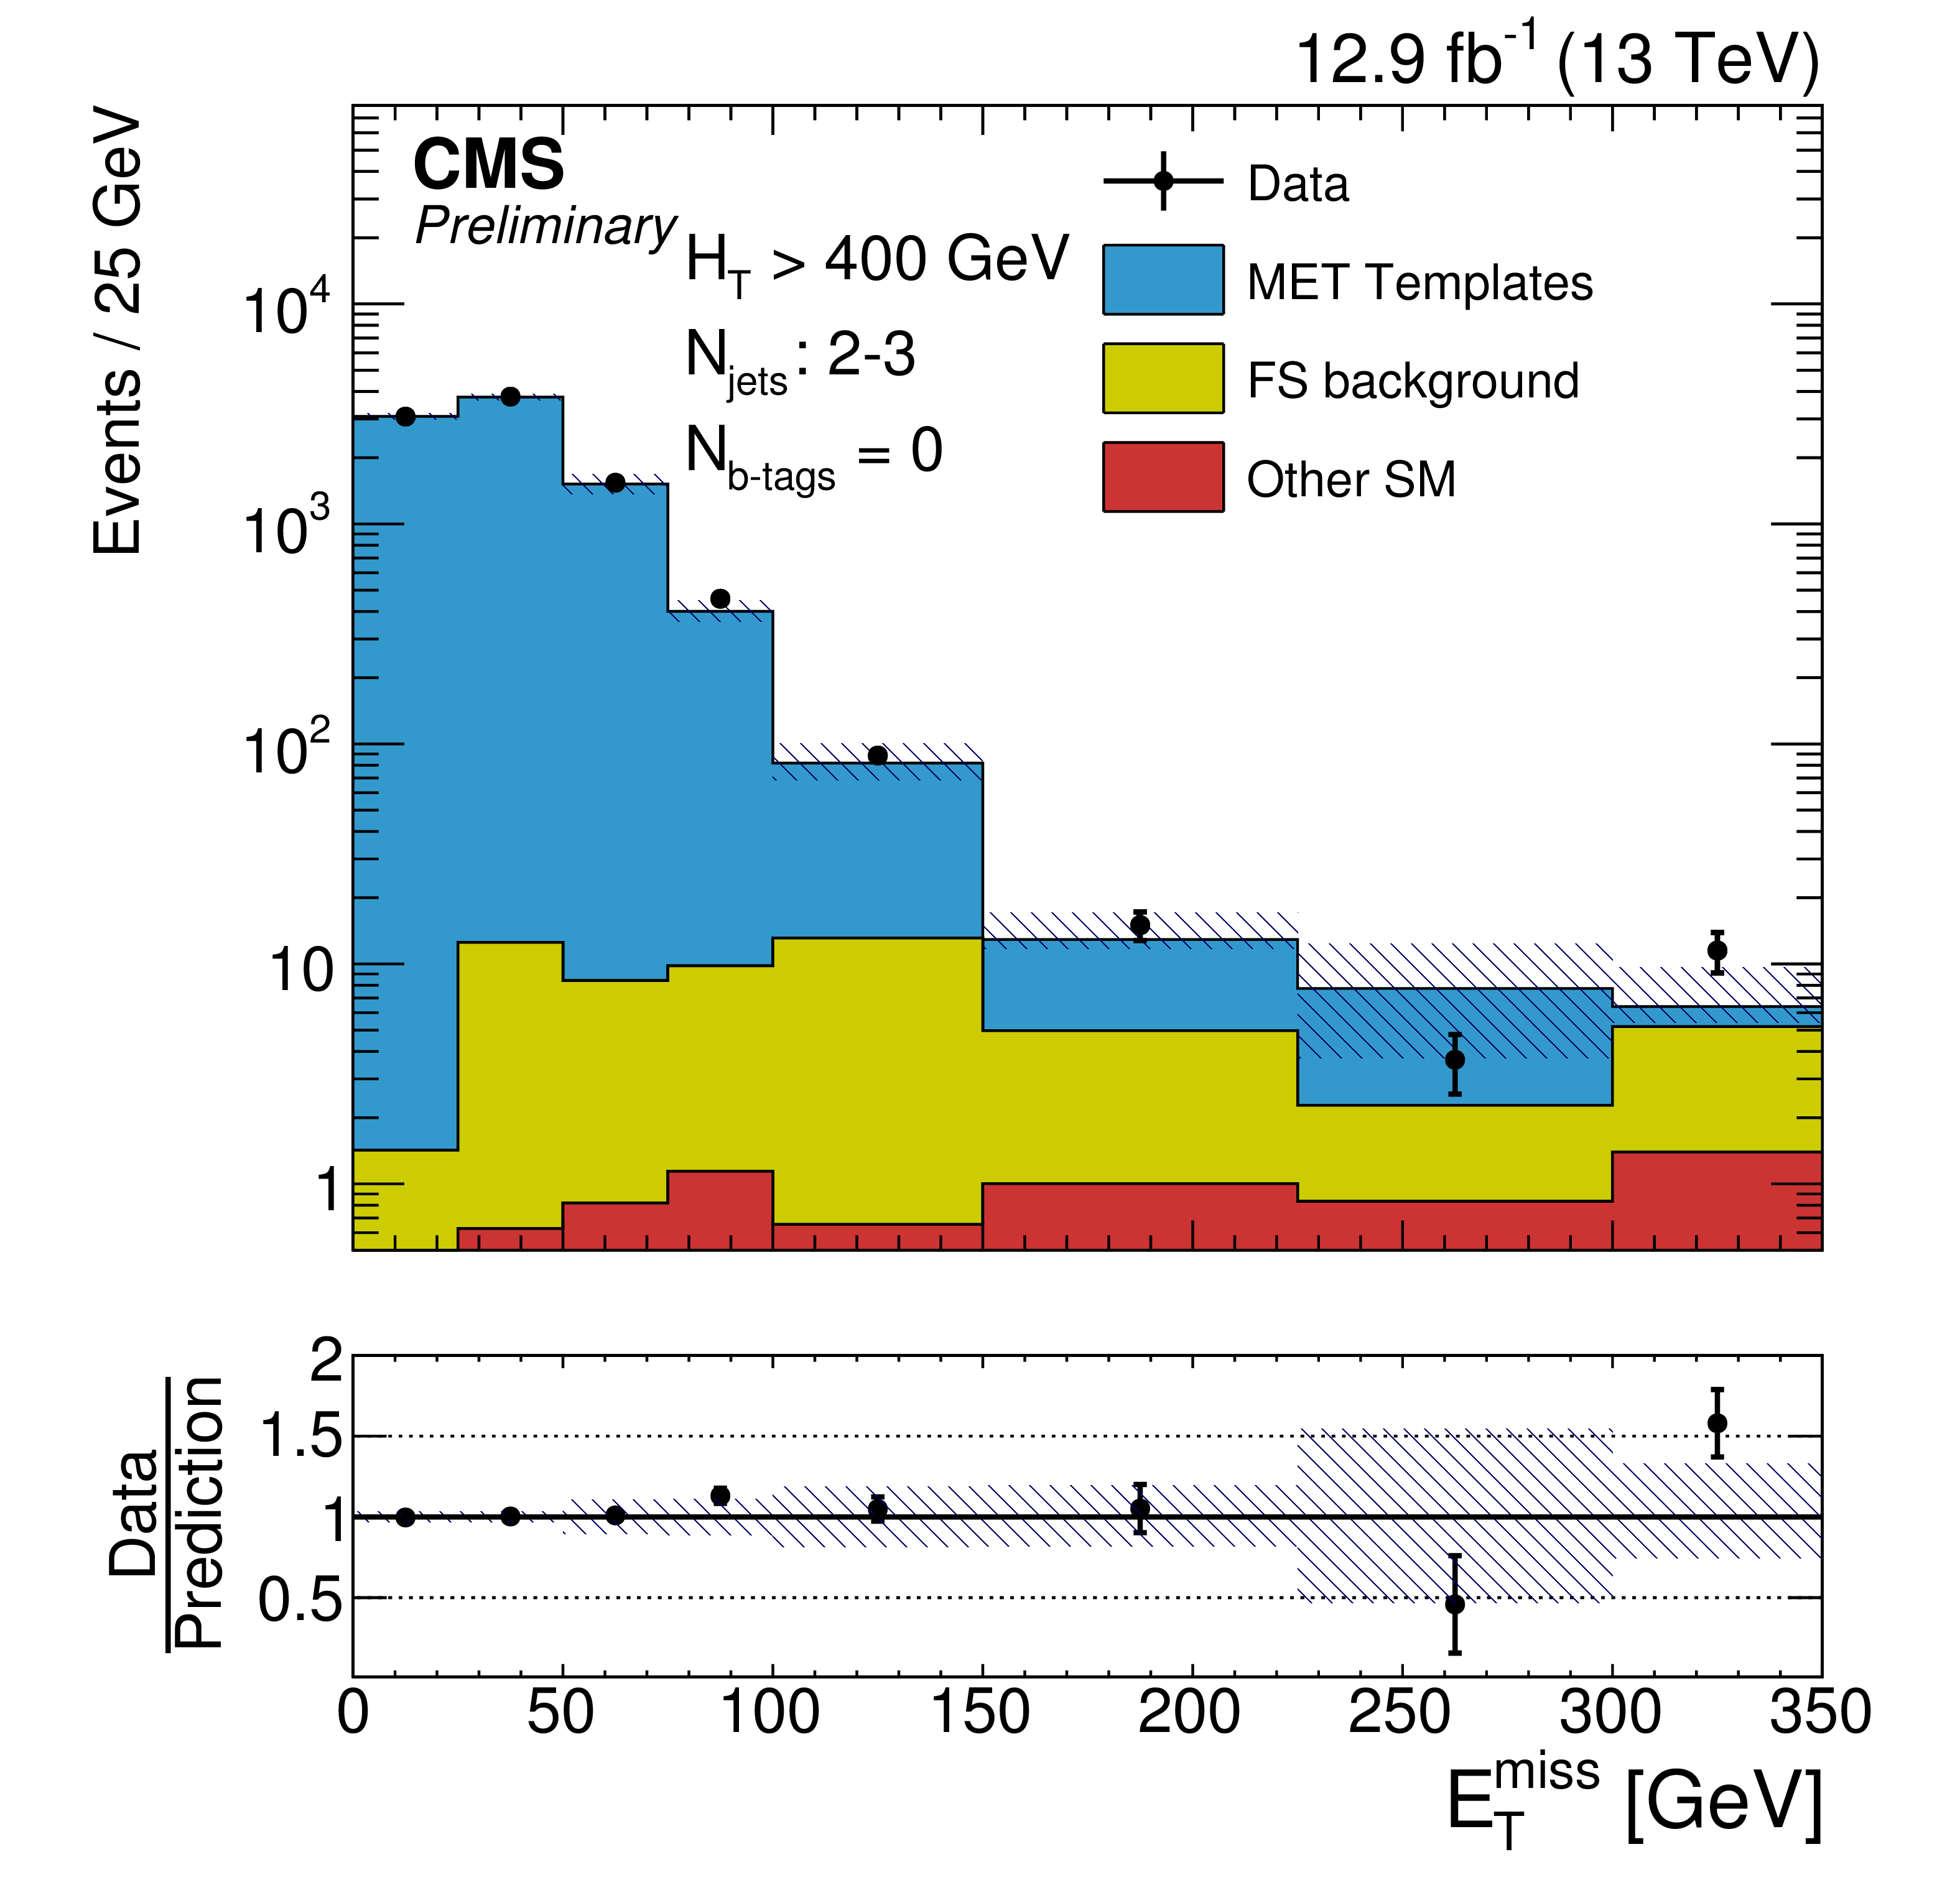
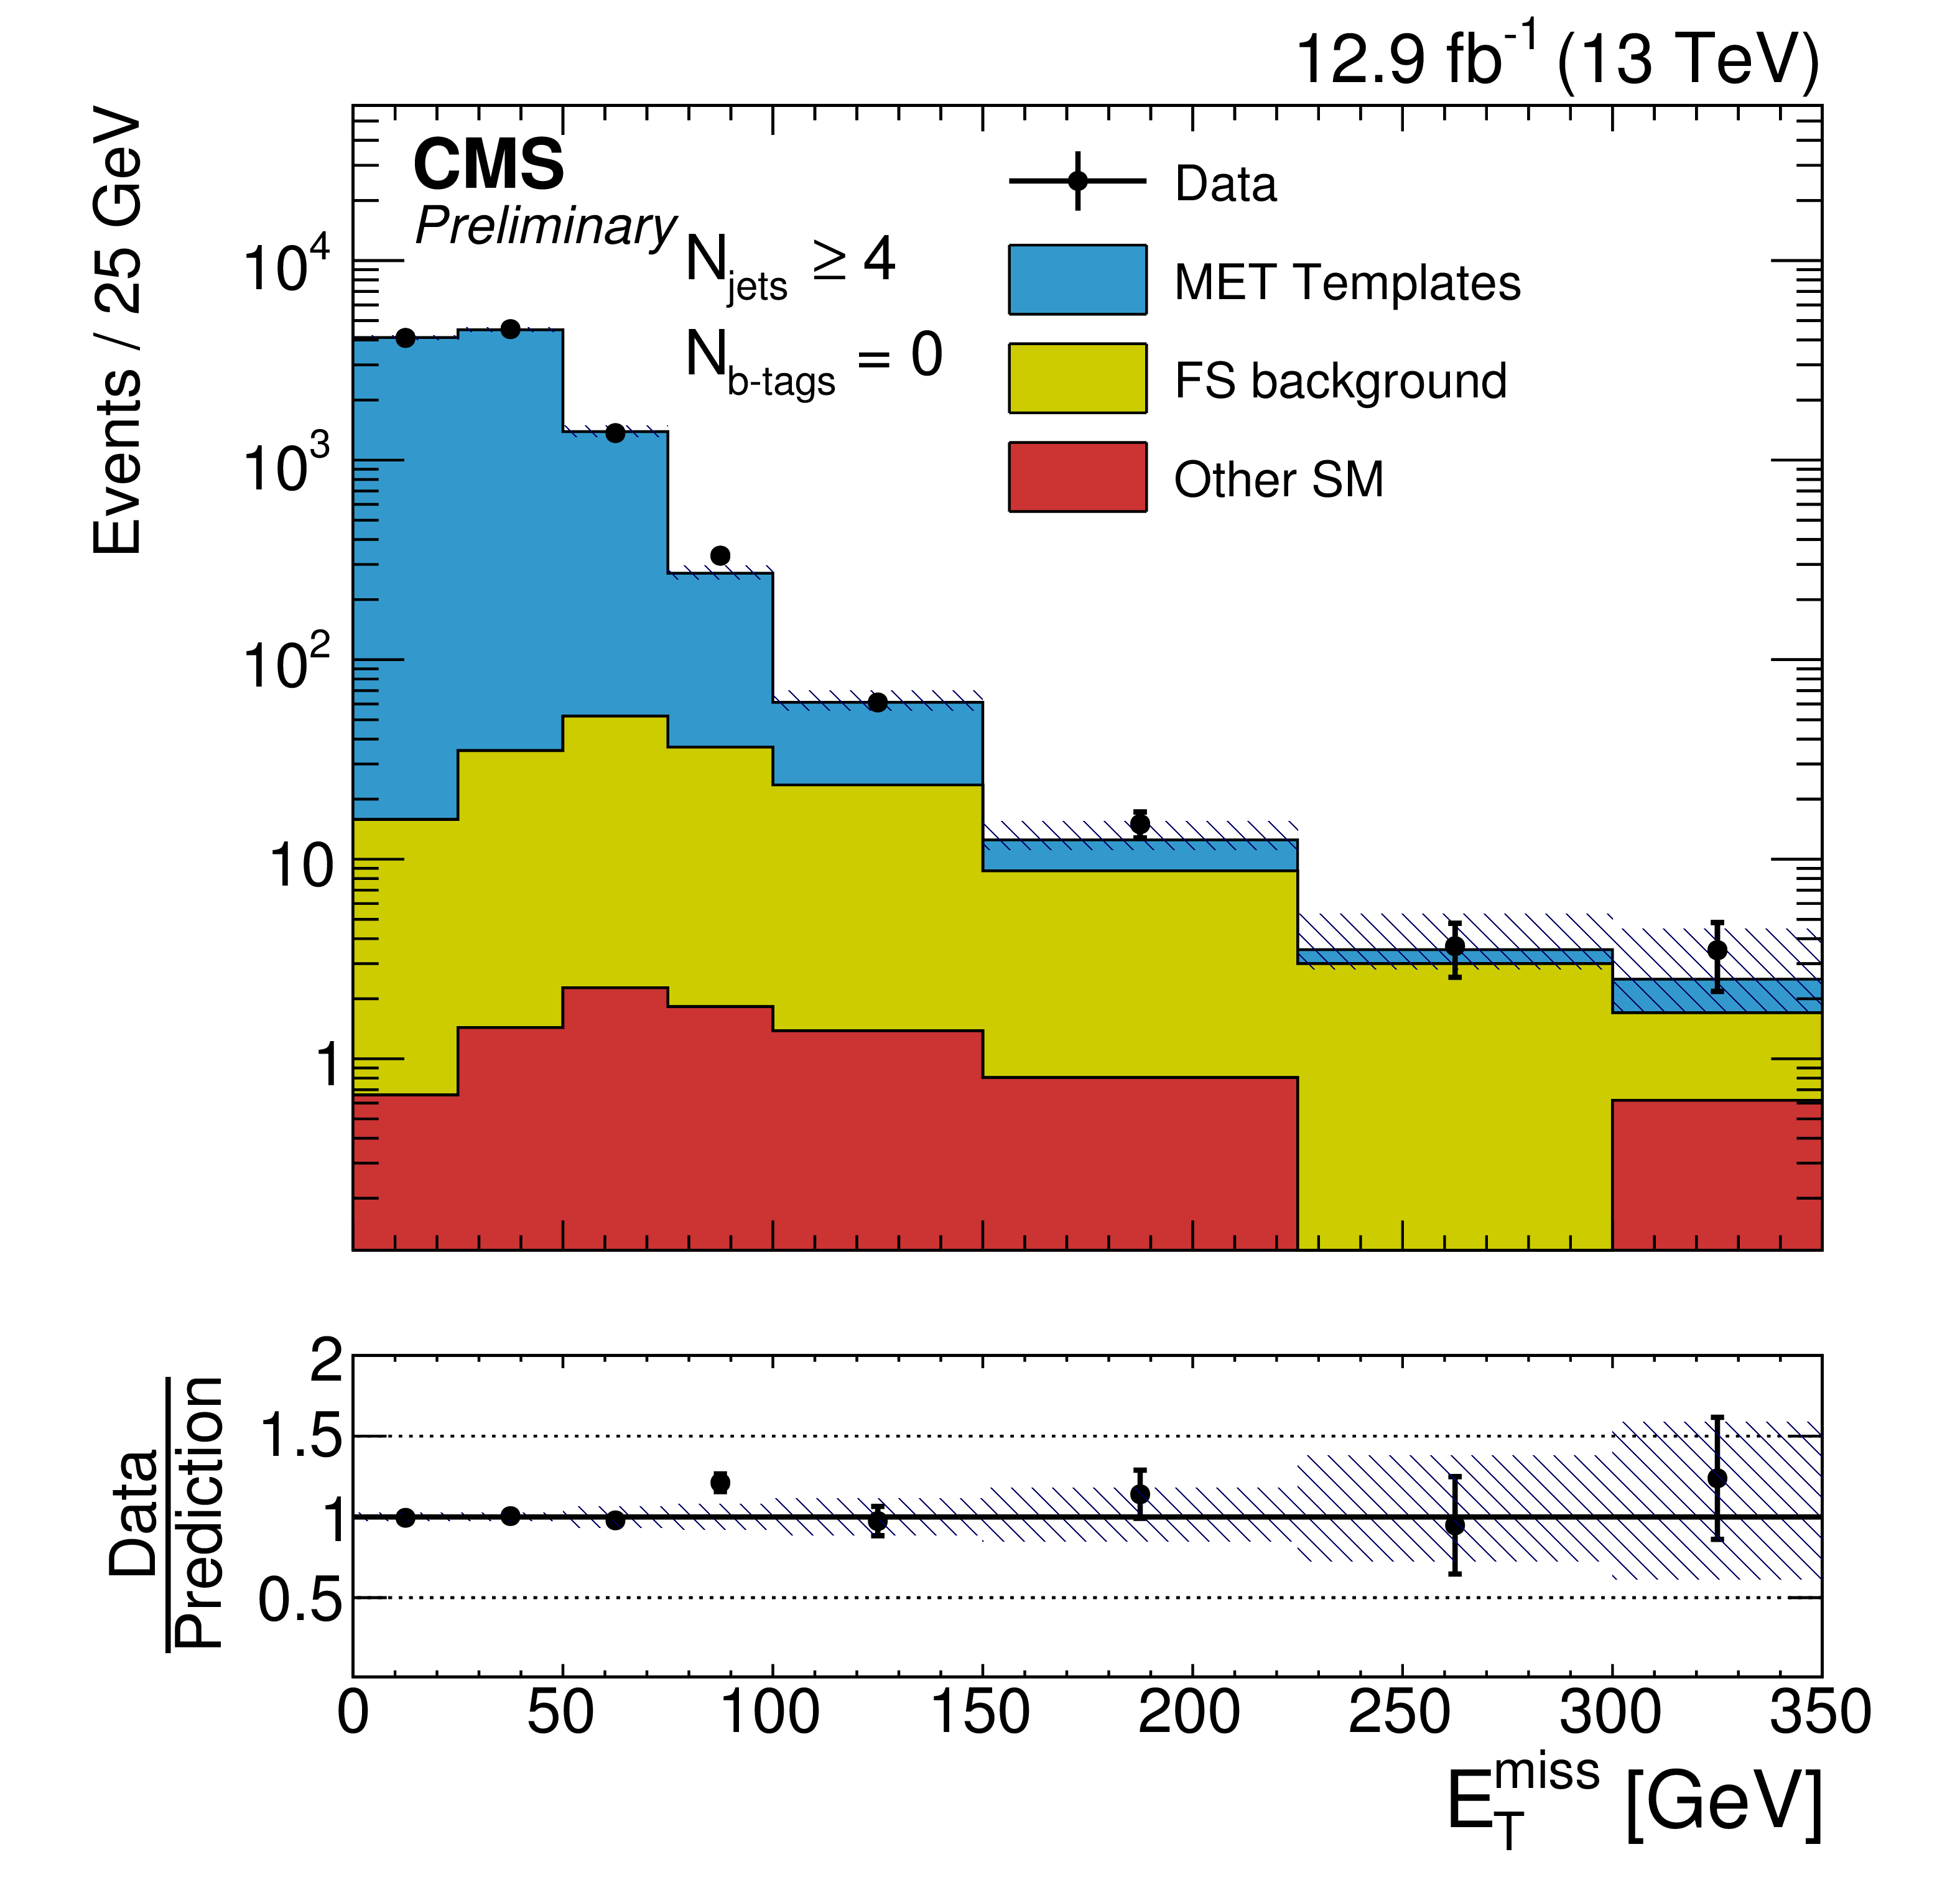
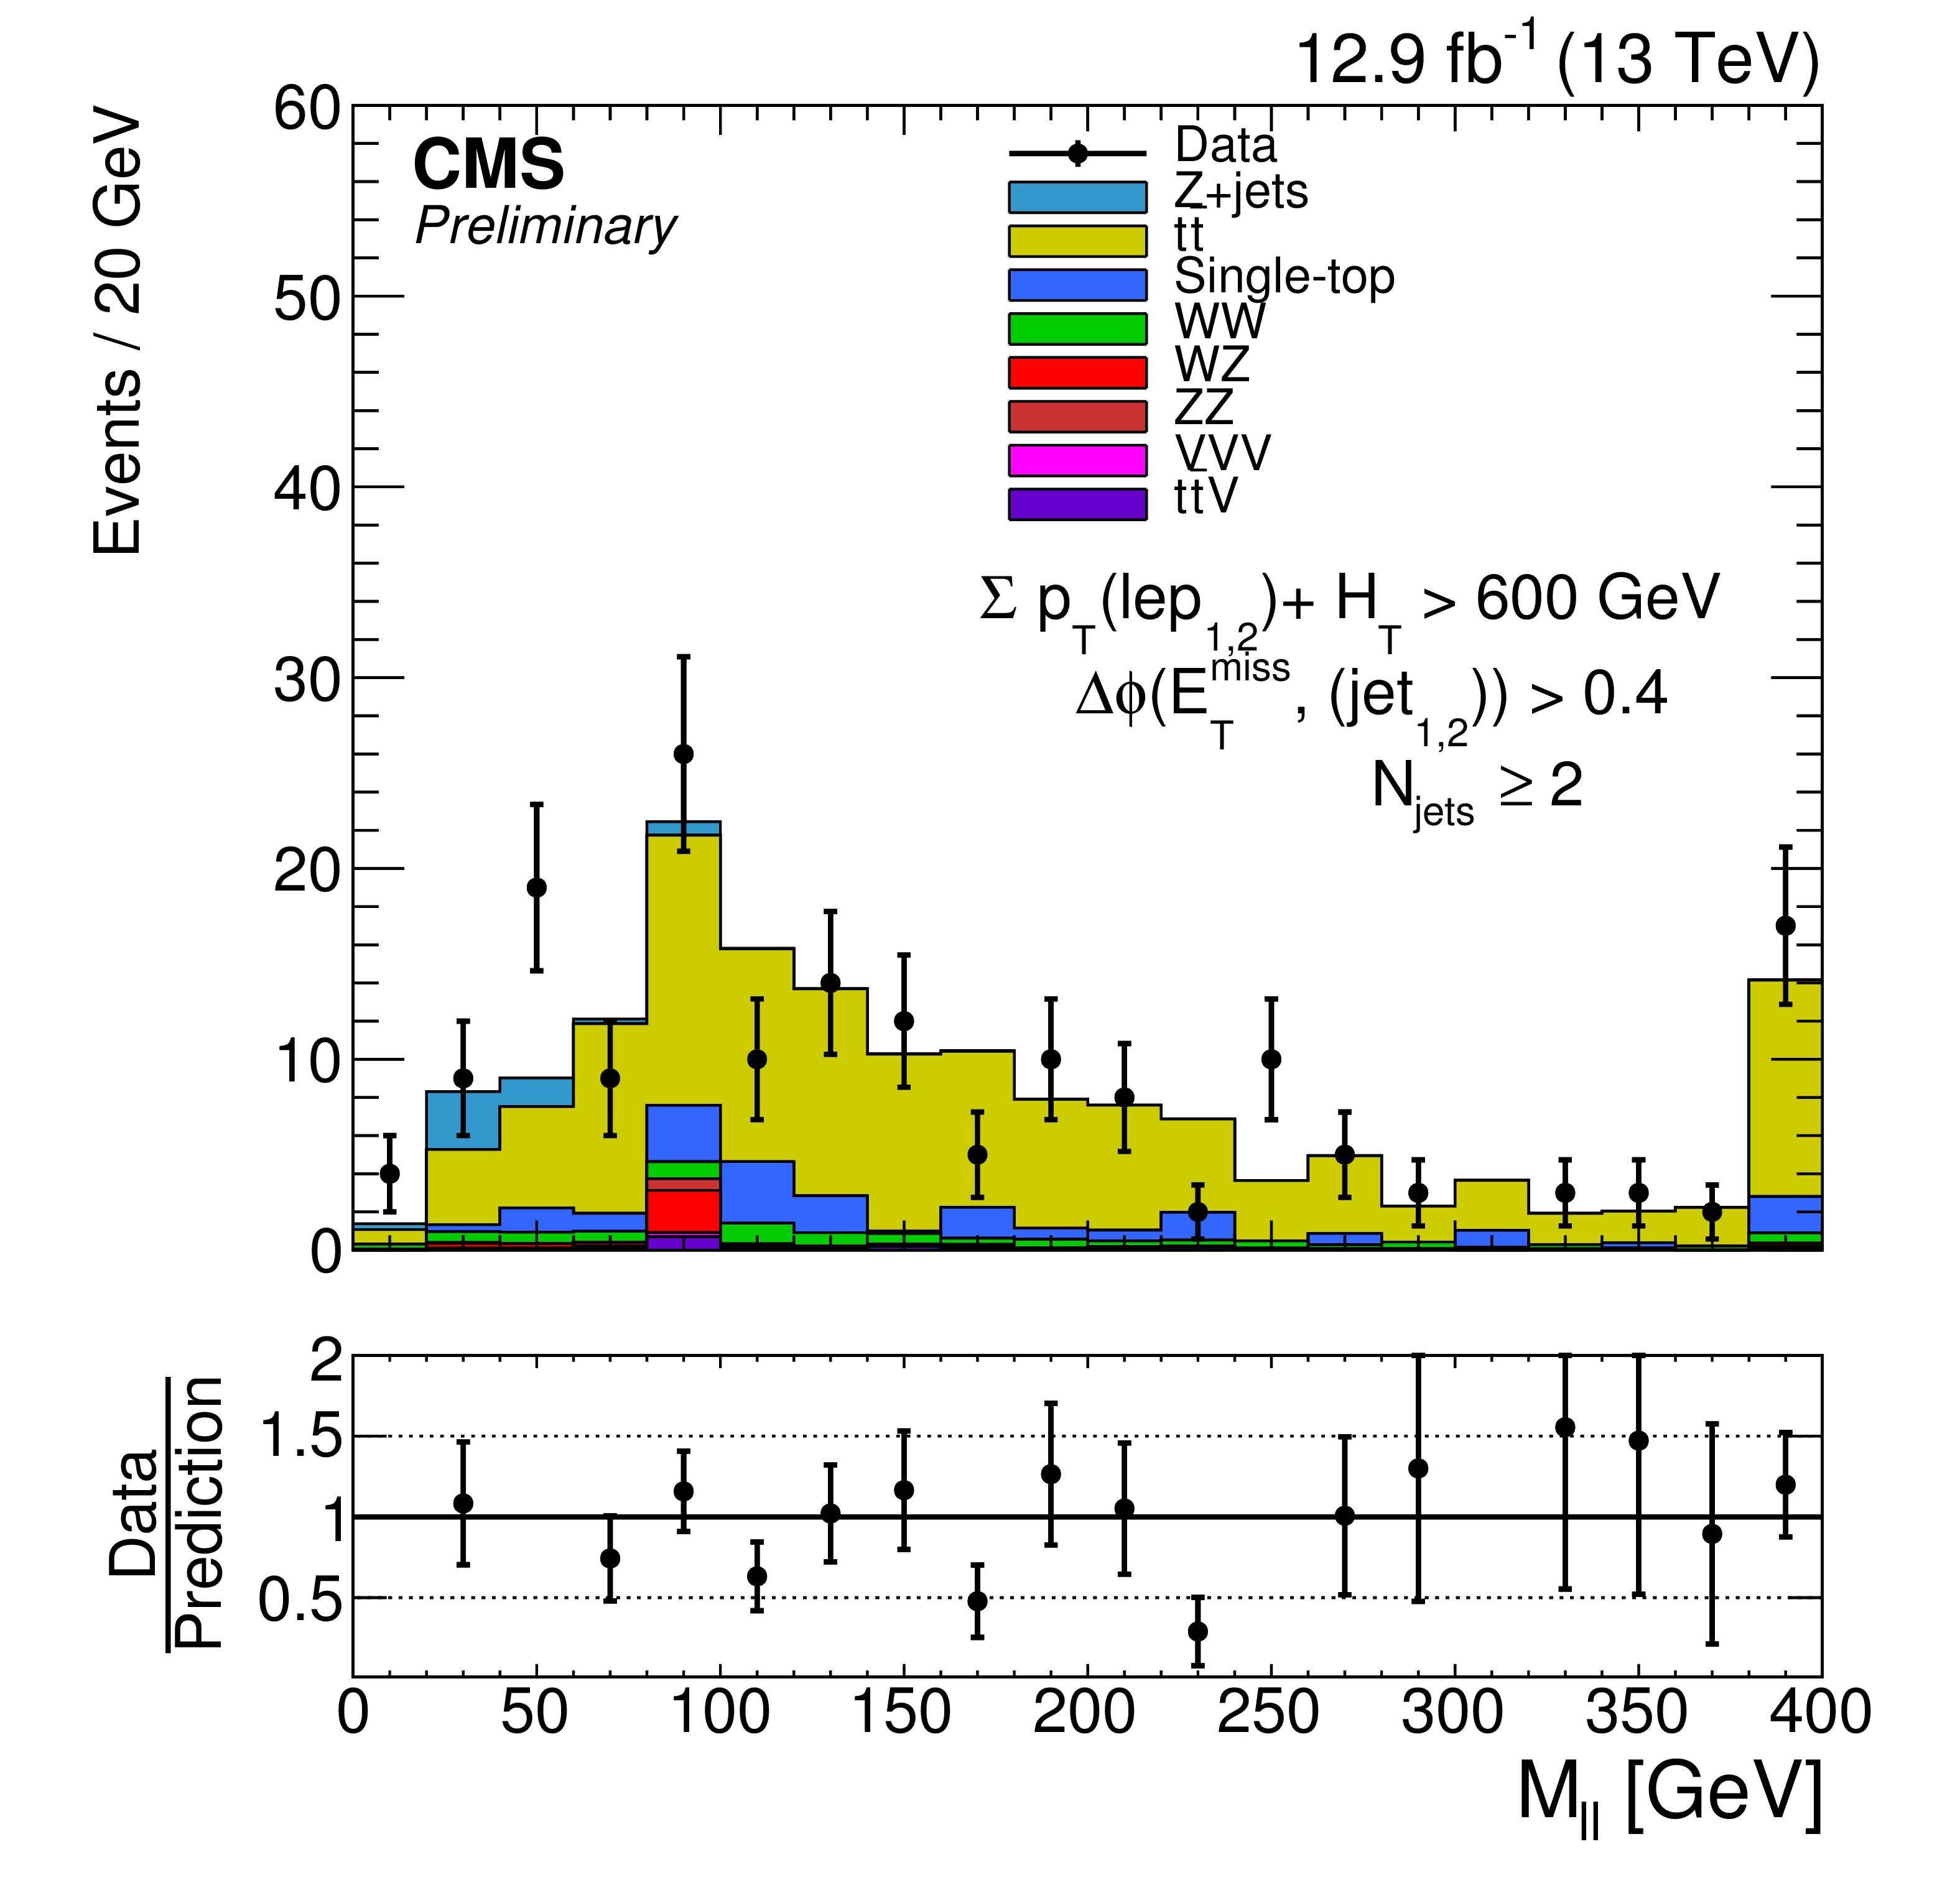
Figure 2-a:
The ${E_{\mathrm {T}}^{\text {miss}}}$ distribution is shown for data vs. the data-driven predictions in the on-Z signal regions and the ATLAS-like signal region. The plots on the left show the values when requiring N$\mathrm {_{b-jets}} =$ 0, and the plots on the right show the values when requiring N$\mathrm {_{b-jets}} \geq $ 1. The bottom plot shows the ATLAS-like signal region. See Table 5 for yields. |
png pdf |
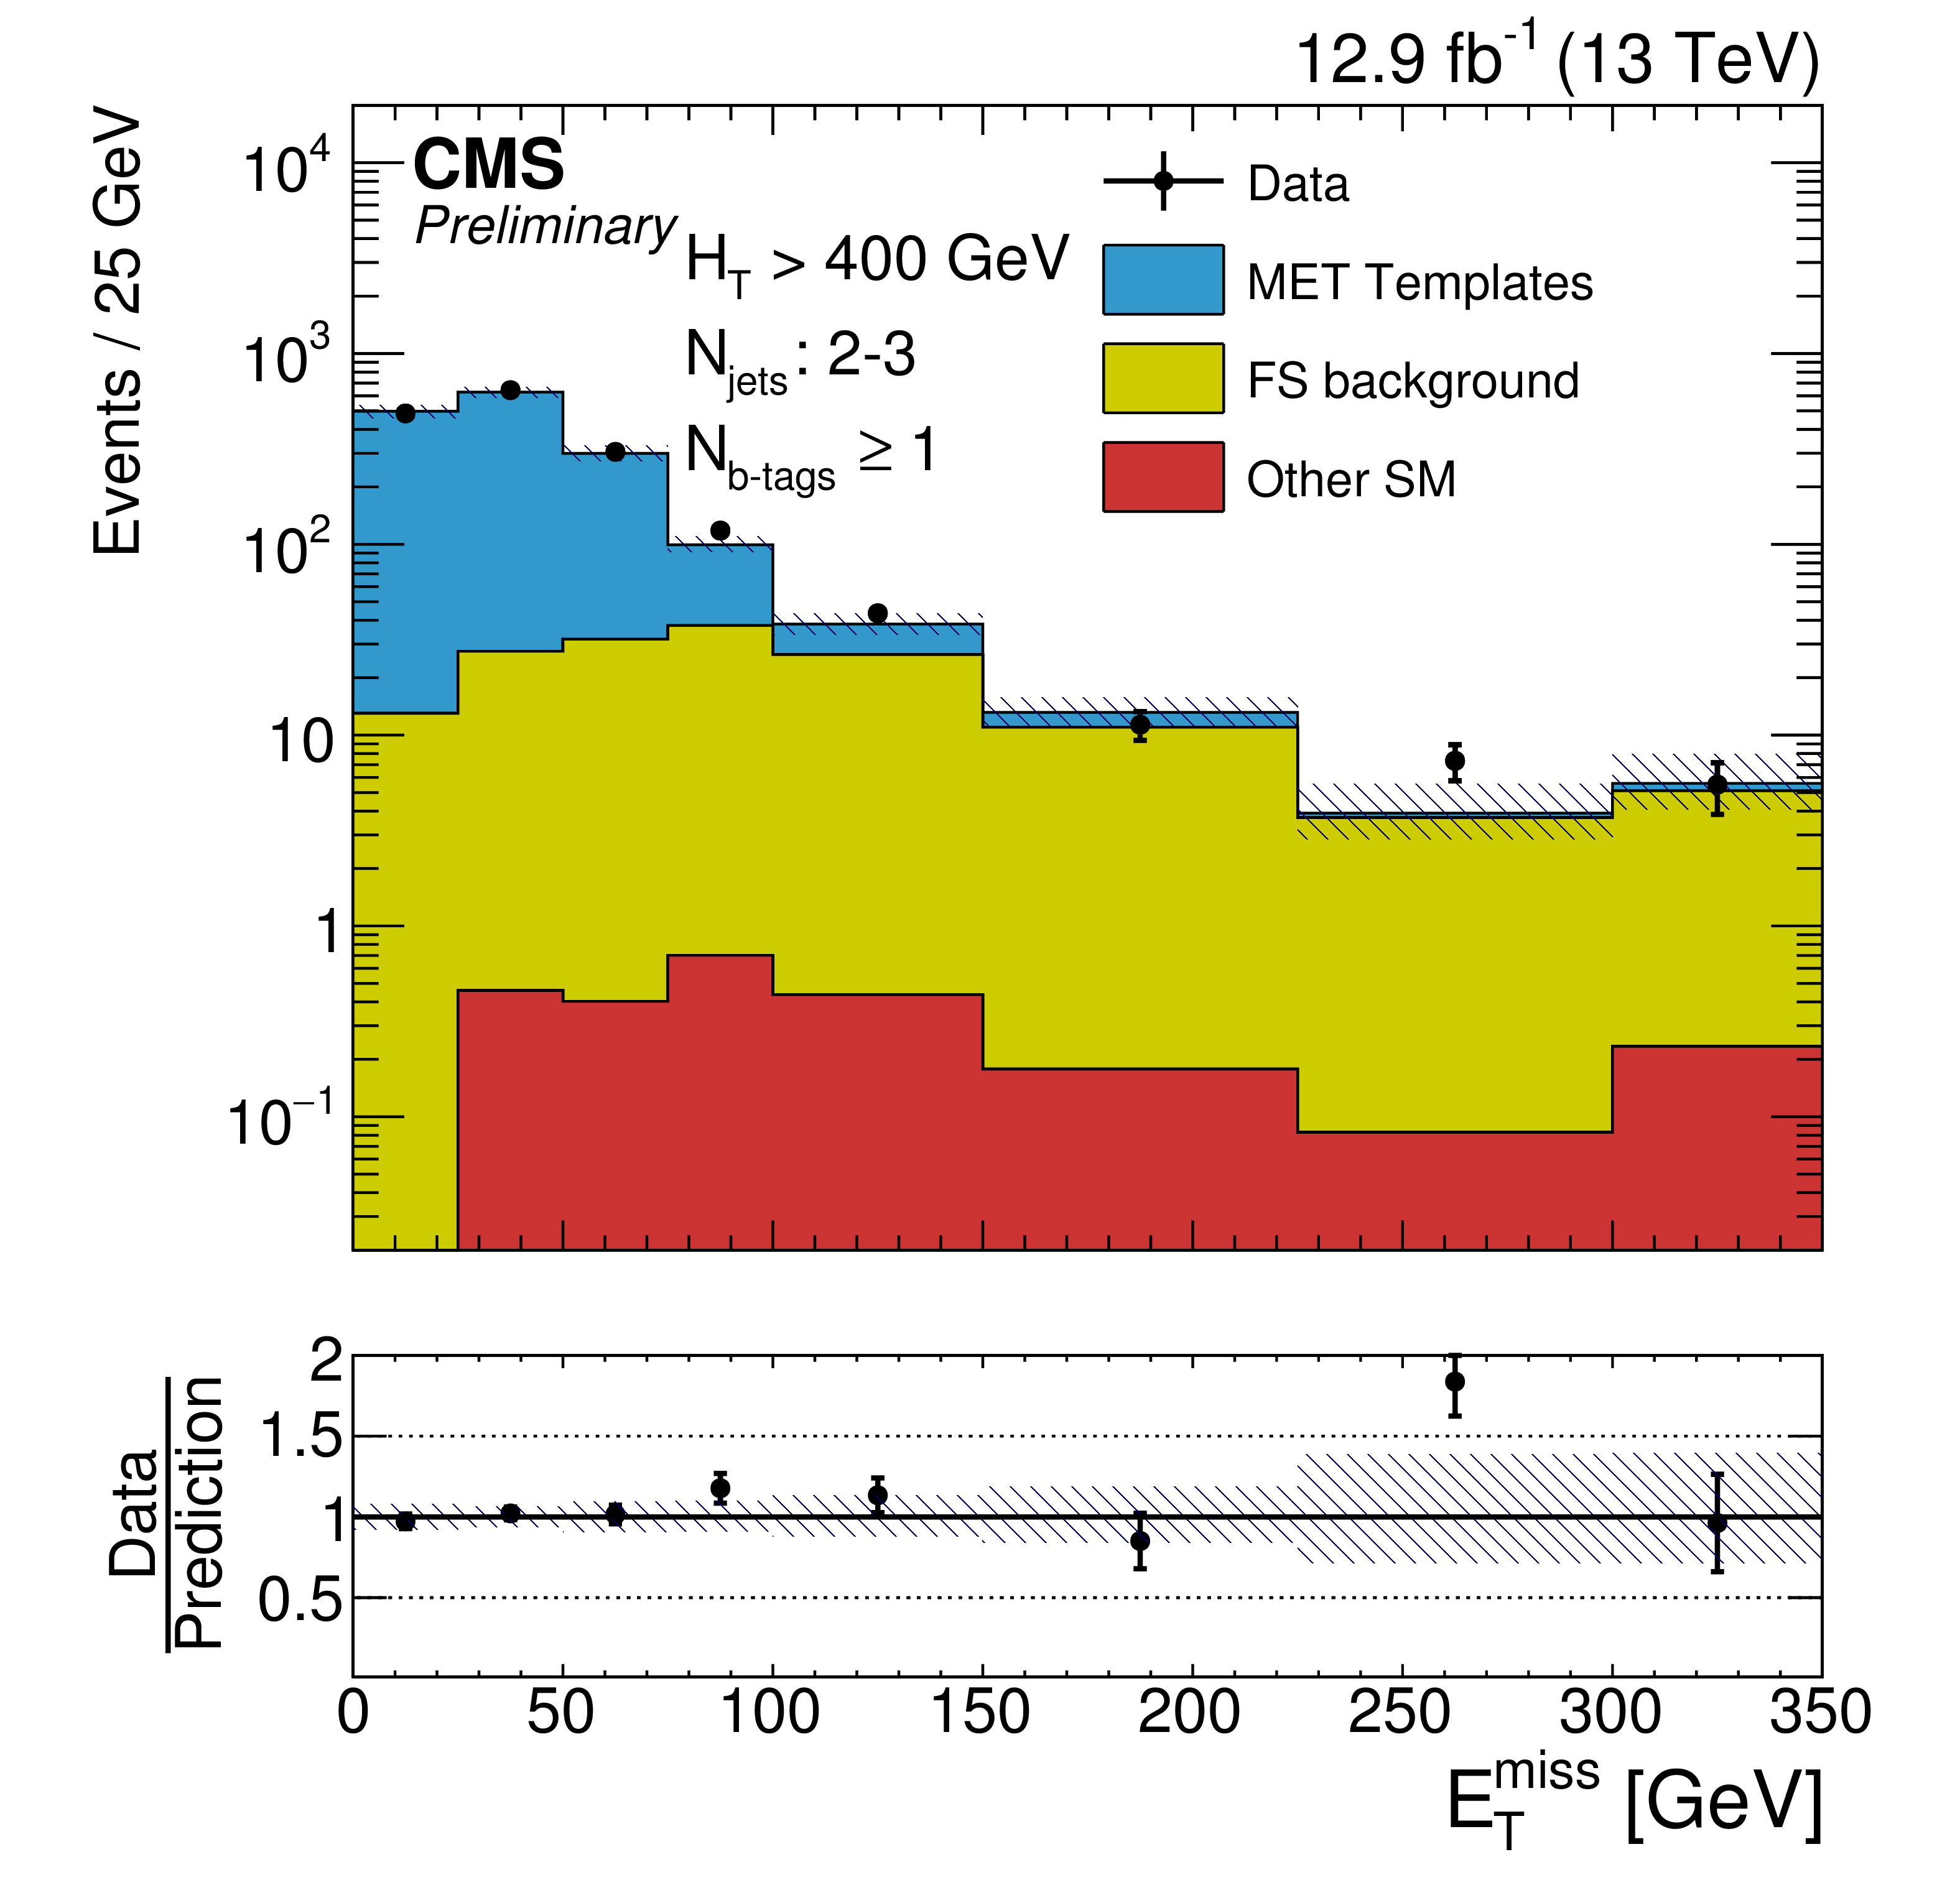
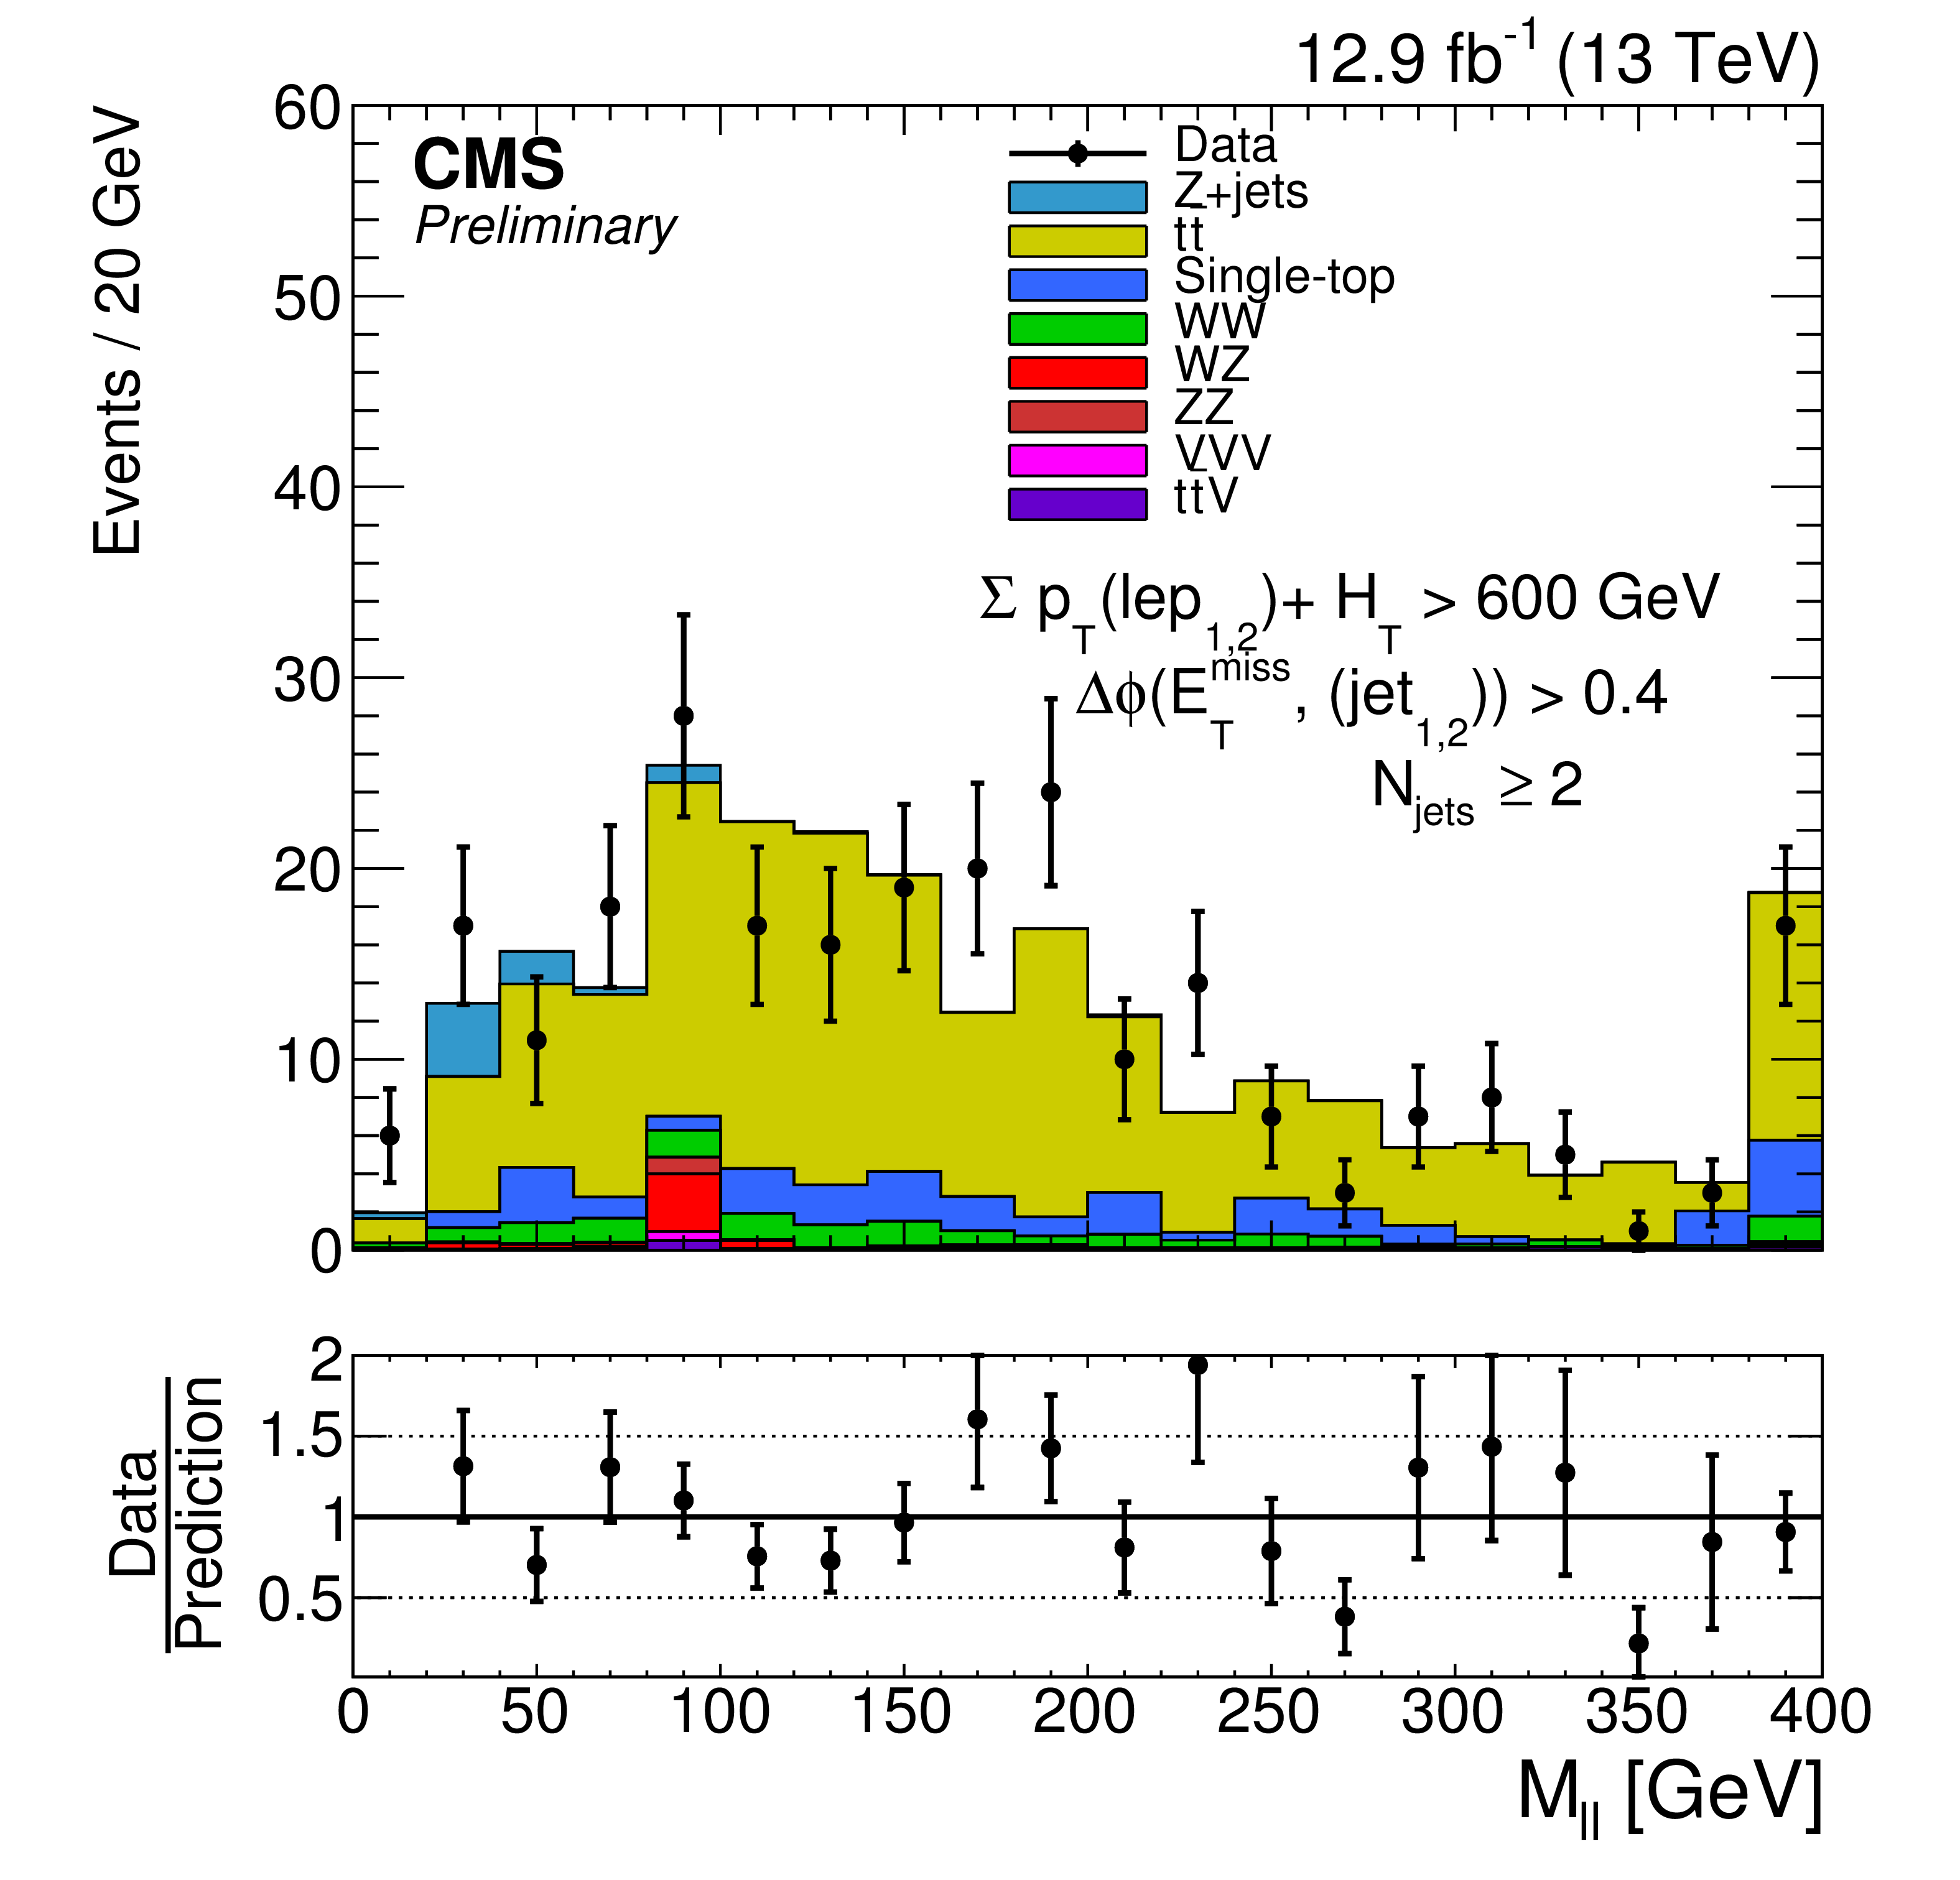
Figure 2-b:
The ${E_{\mathrm {T}}^{\text {miss}}}$ distribution is shown for data vs. the data-driven predictions in the on-Z signal regions and the ATLAS-like signal region. The plots on the left show the values when requiring N$\mathrm {_{b-jets}} =$ 0, and the plots on the right show the values when requiring N$\mathrm {_{b-jets}} \geq $ 1. The bottom plot shows the ATLAS-like signal region. See Table 5 for yields. |
png pdf |
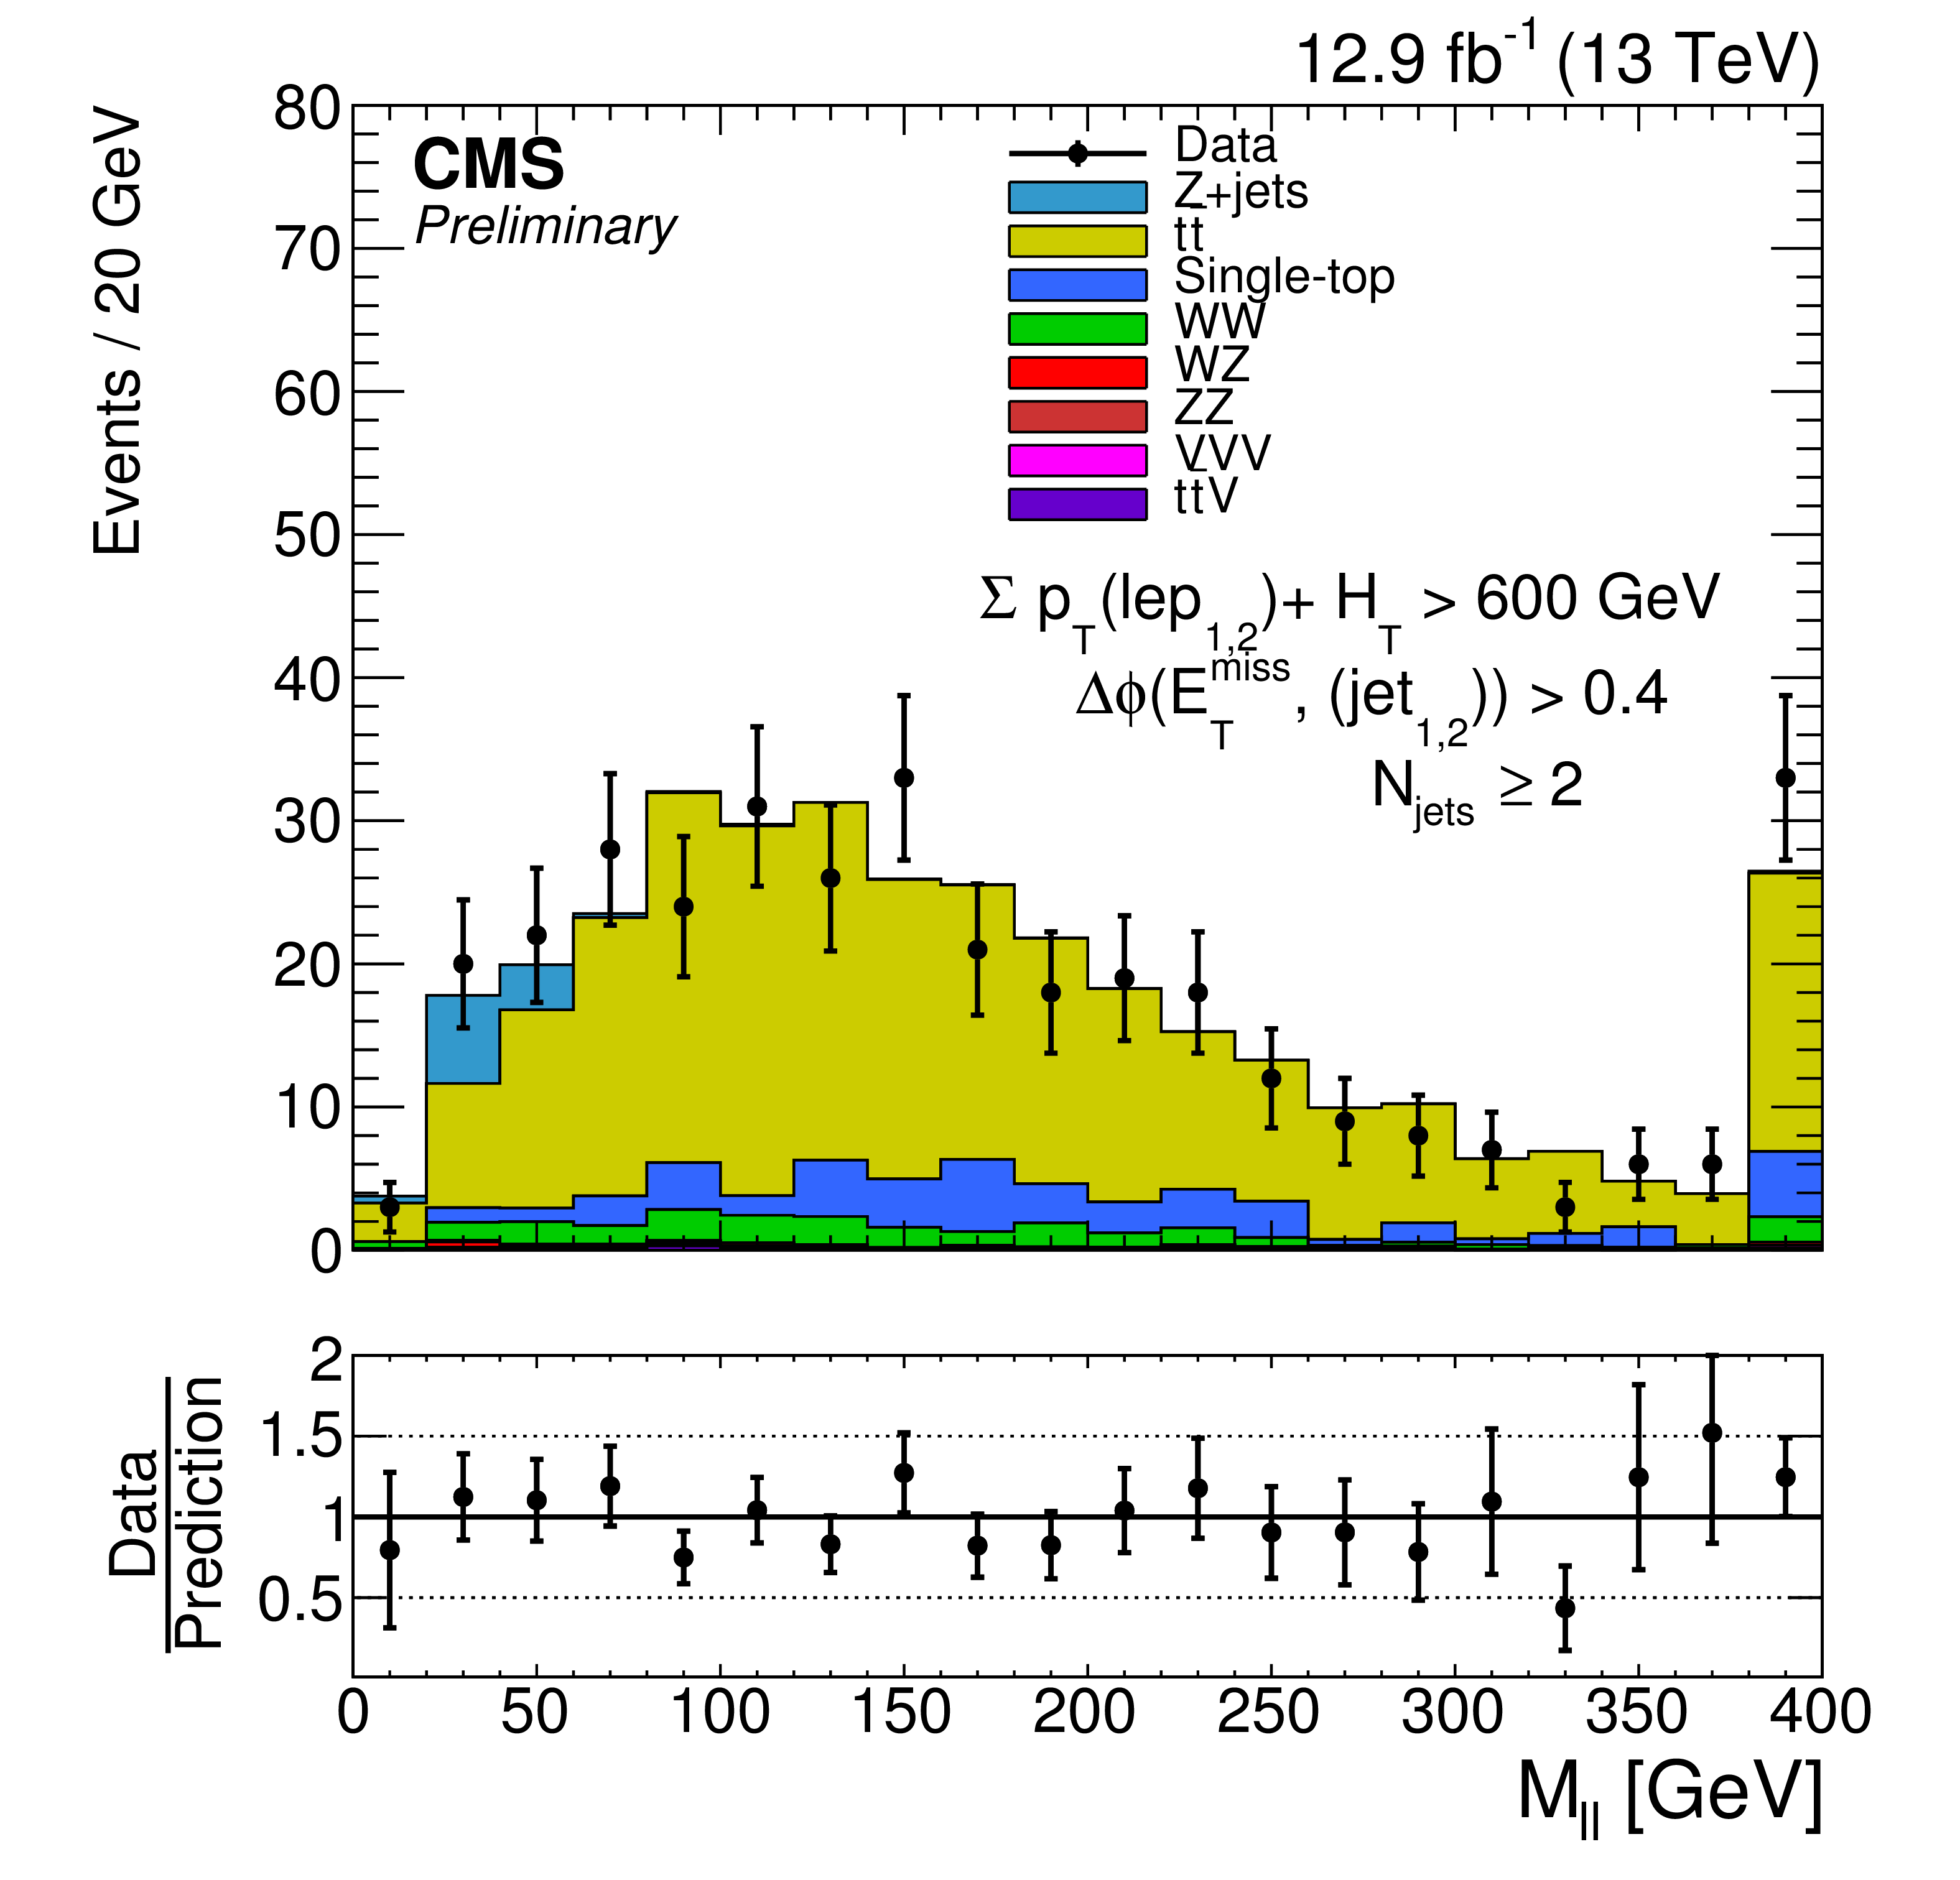
Figure 2-c:
The ${E_{\mathrm {T}}^{\text {miss}}}$ distribution is shown for data vs. the data-driven predictions in the on-Z signal regions and the ATLAS-like signal region. The plots on the left show the values when requiring N$\mathrm {_{b-jets}} =$ 0, and the plots on the right show the values when requiring N$\mathrm {_{b-jets}} \geq $ 1. The bottom plot shows the ATLAS-like signal region. See Table 5 for yields. |

png pdf |
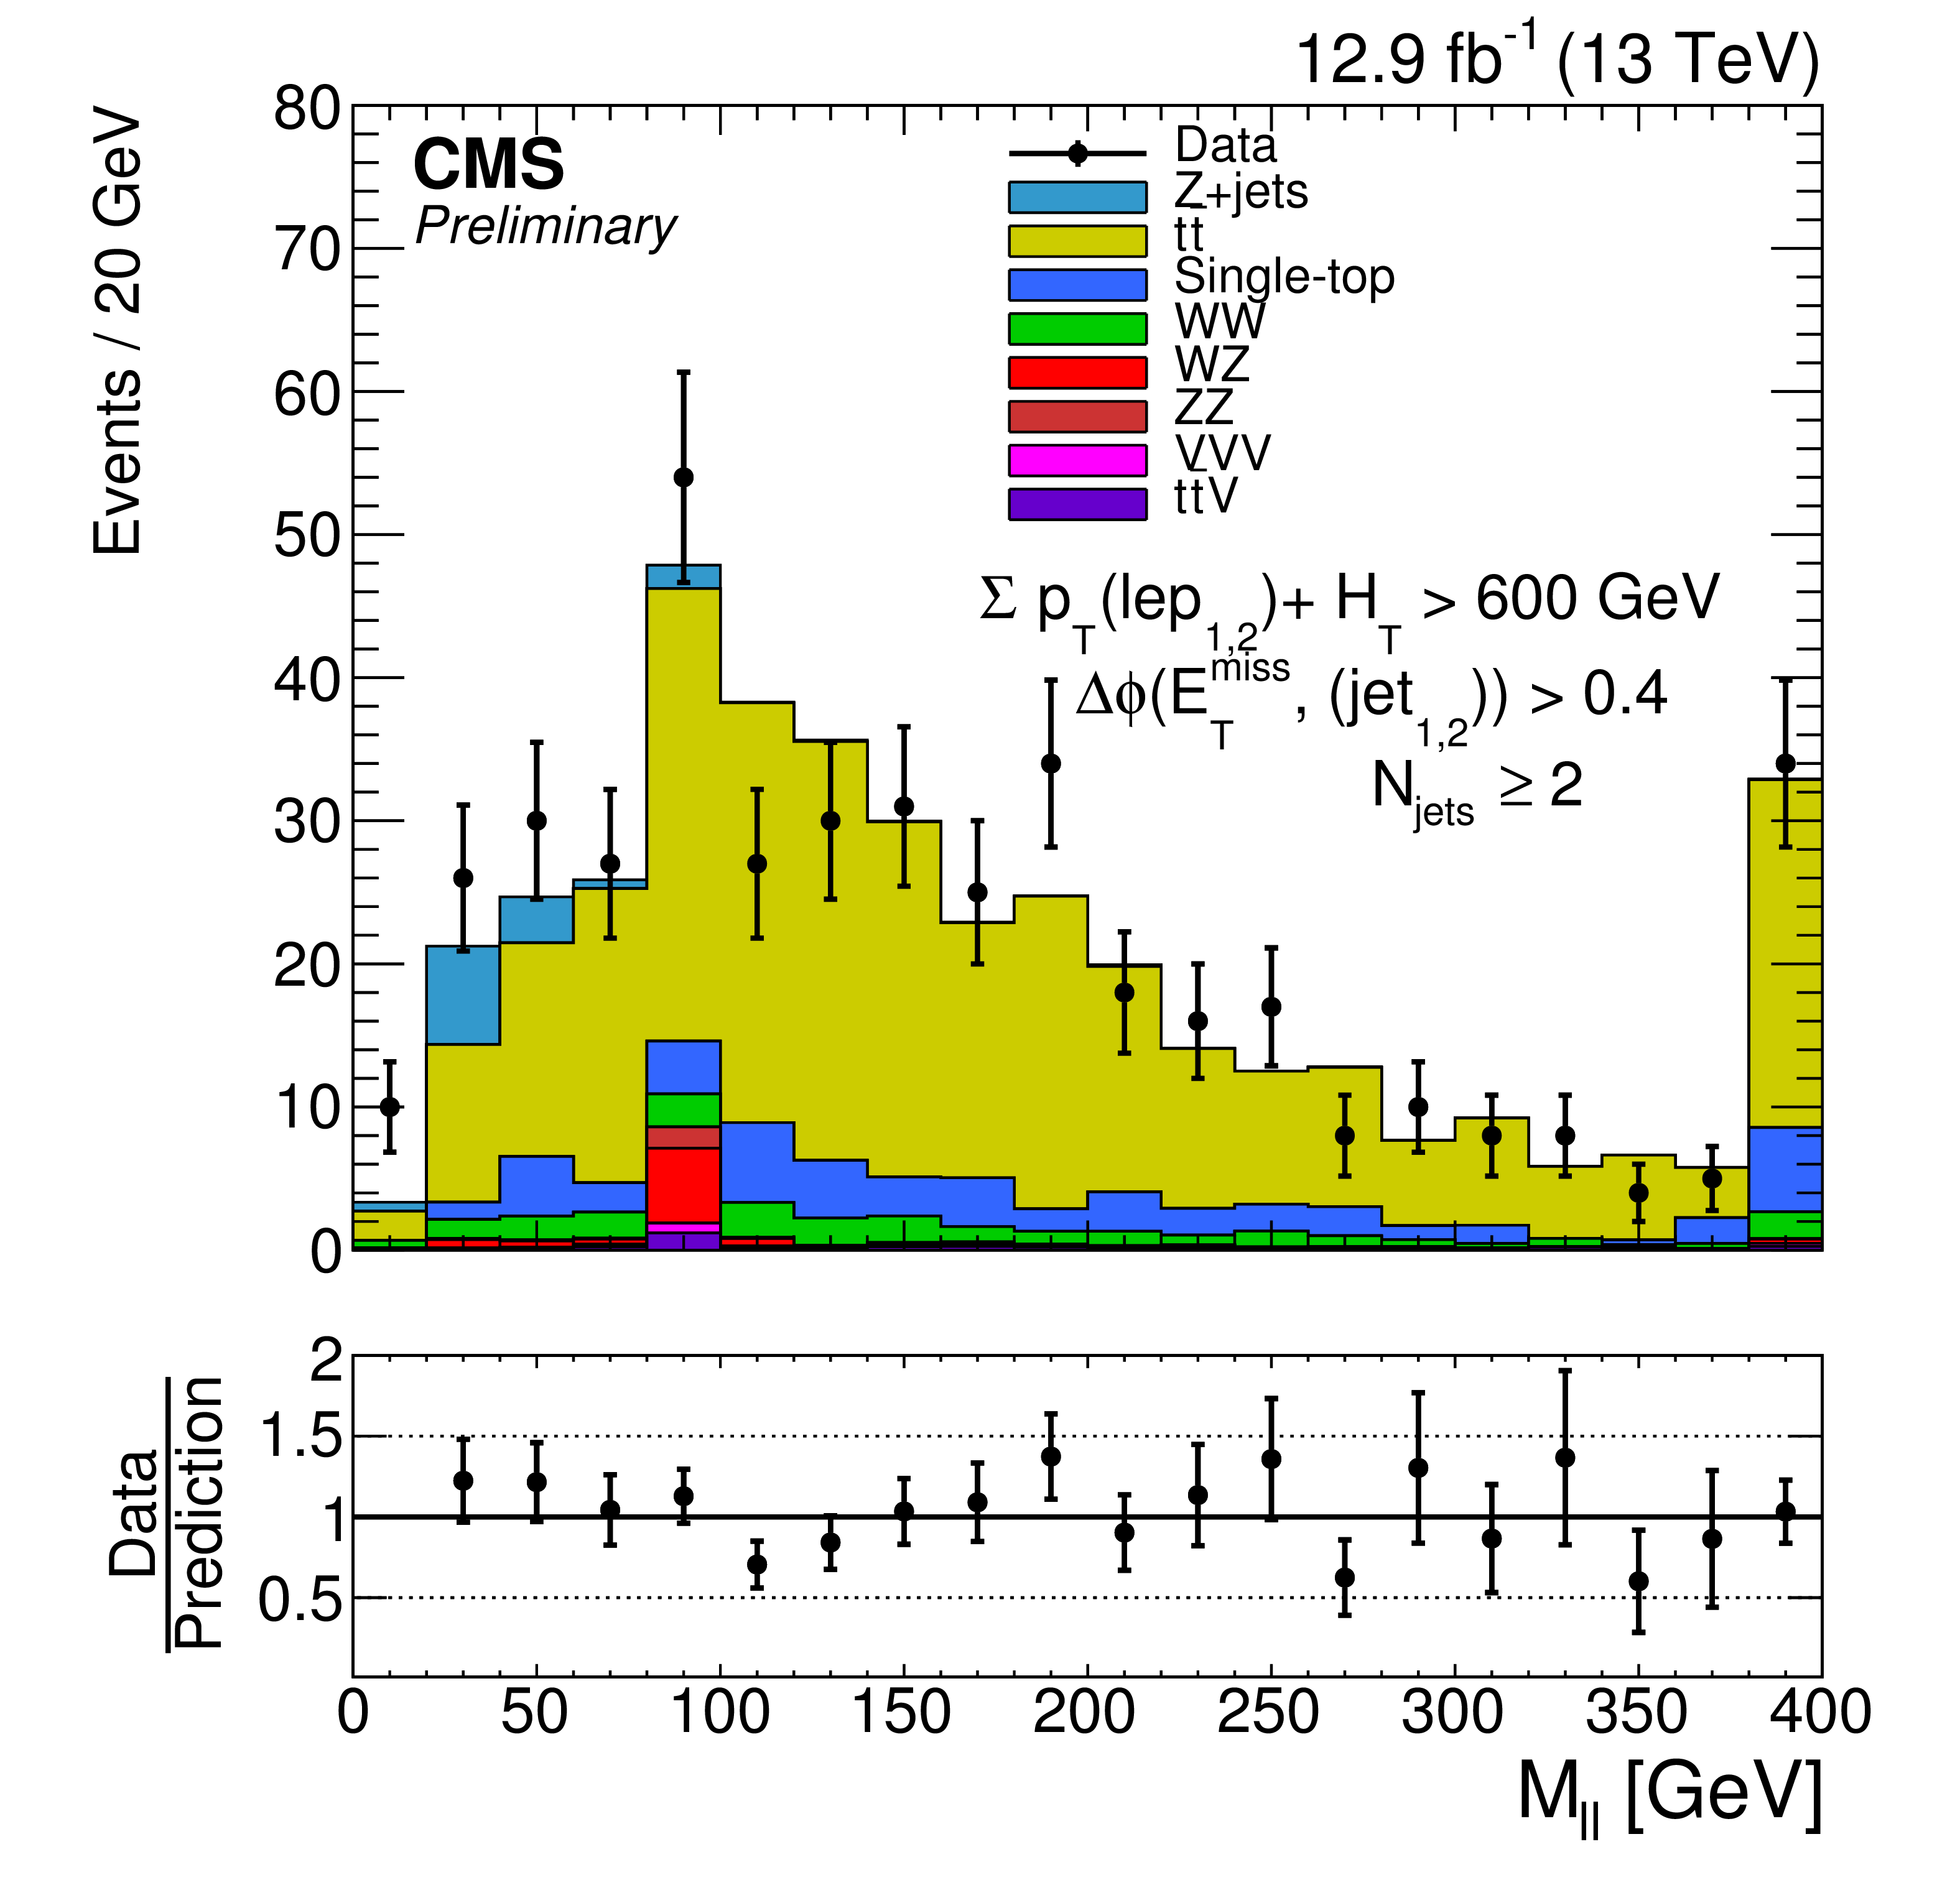
Figure 2-d:
The ${E_{\mathrm {T}}^{\text {miss}}}$ distribution is shown for data vs. the data-driven predictions in the on-Z signal regions and the ATLAS-like signal region. The plots on the left show the values when requiring N$\mathrm {_{b-jets}} =$ 0, and the plots on the right show the values when requiring N$\mathrm {_{b-jets}} \geq $ 1. The bottom plot shows the ATLAS-like signal region. See Table 5 for yields. |

png pdf |
Figure 2-e:
The ${E_{\mathrm {T}}^{\text {miss}}}$ distribution is shown for data vs. the data-driven predictions in the on-Z signal regions and the ATLAS-like signal region. The plots on the left show the values when requiring N$\mathrm {_{b-jets}} =$ 0, and the plots on the right show the values when requiring N$\mathrm {_{b-jets}} \geq $ 1. The bottom plot shows the ATLAS-like signal region. See Table 5 for yields. |
png pdf |
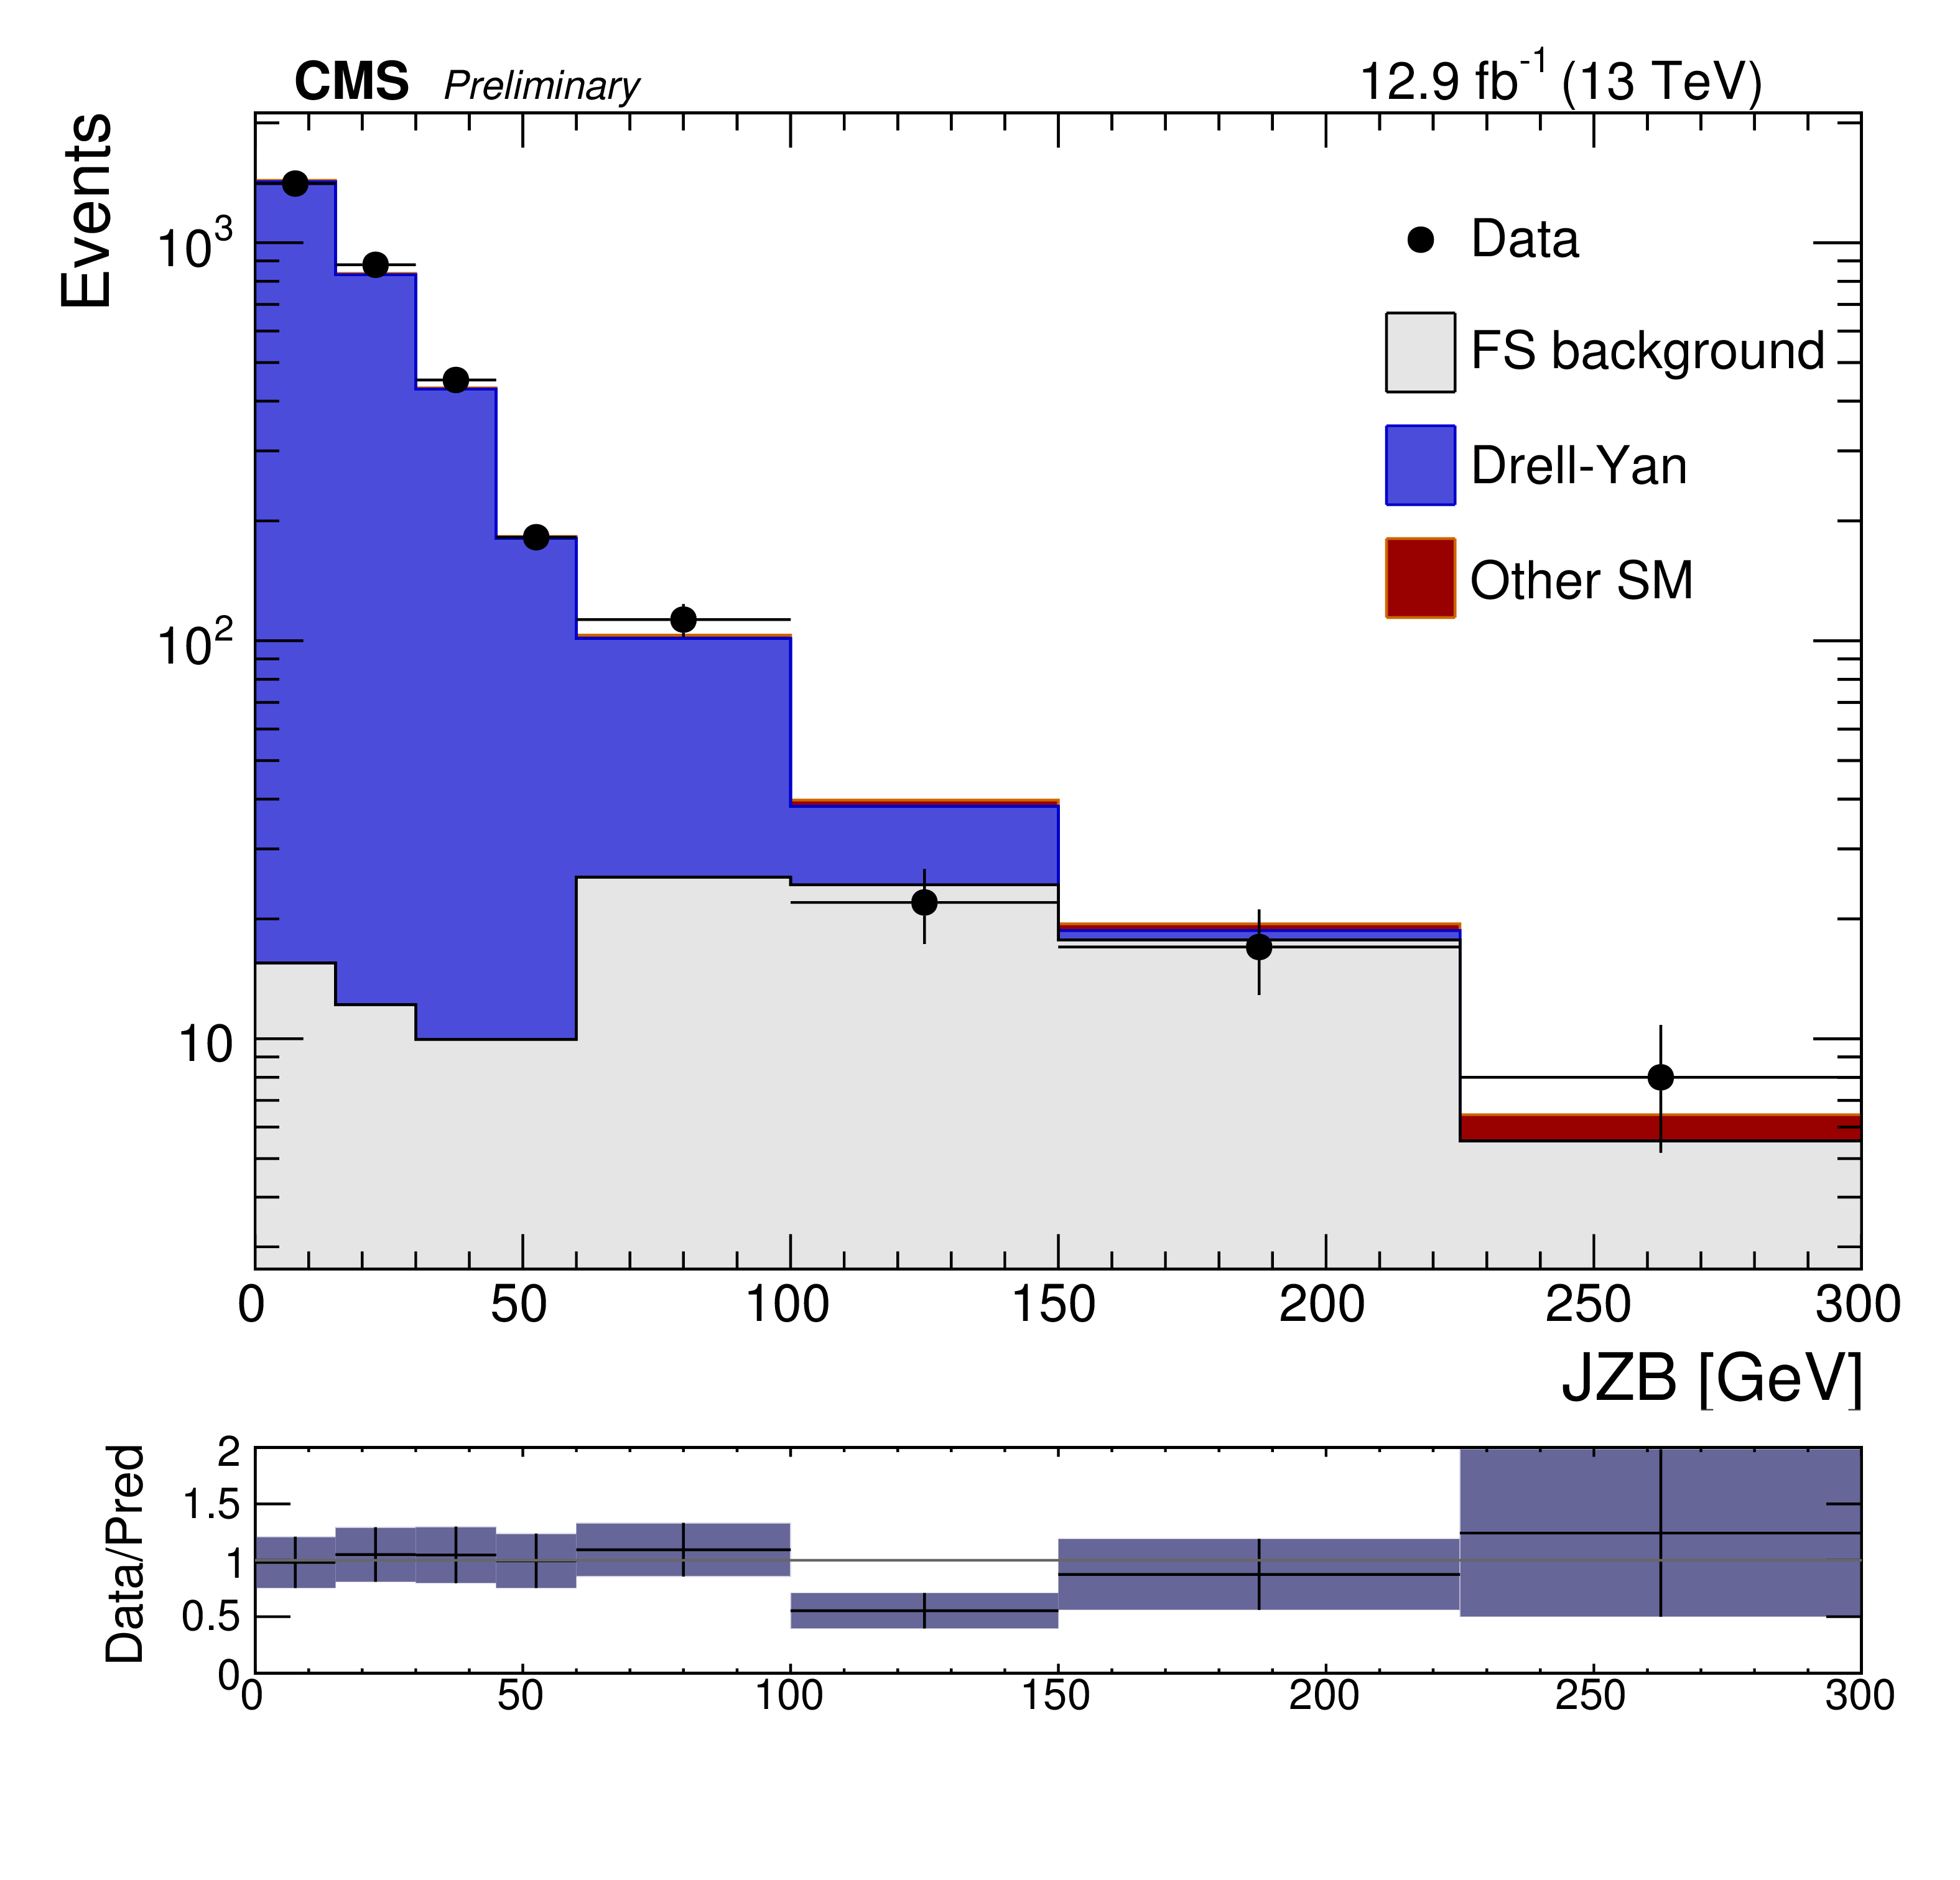
Figure 3:
${\mathrm {JZB}}$ spectrum for 12.9 fb$^{-1}$ of collision data. Flavor symmetric backgrounds are shown in the gray histogram, the DY prediction using the negative ${\mathrm {JZB}}$ in blue and the observed data in black markers. The uncertainties on the background prediction are included in the ratio. |
png pdf |
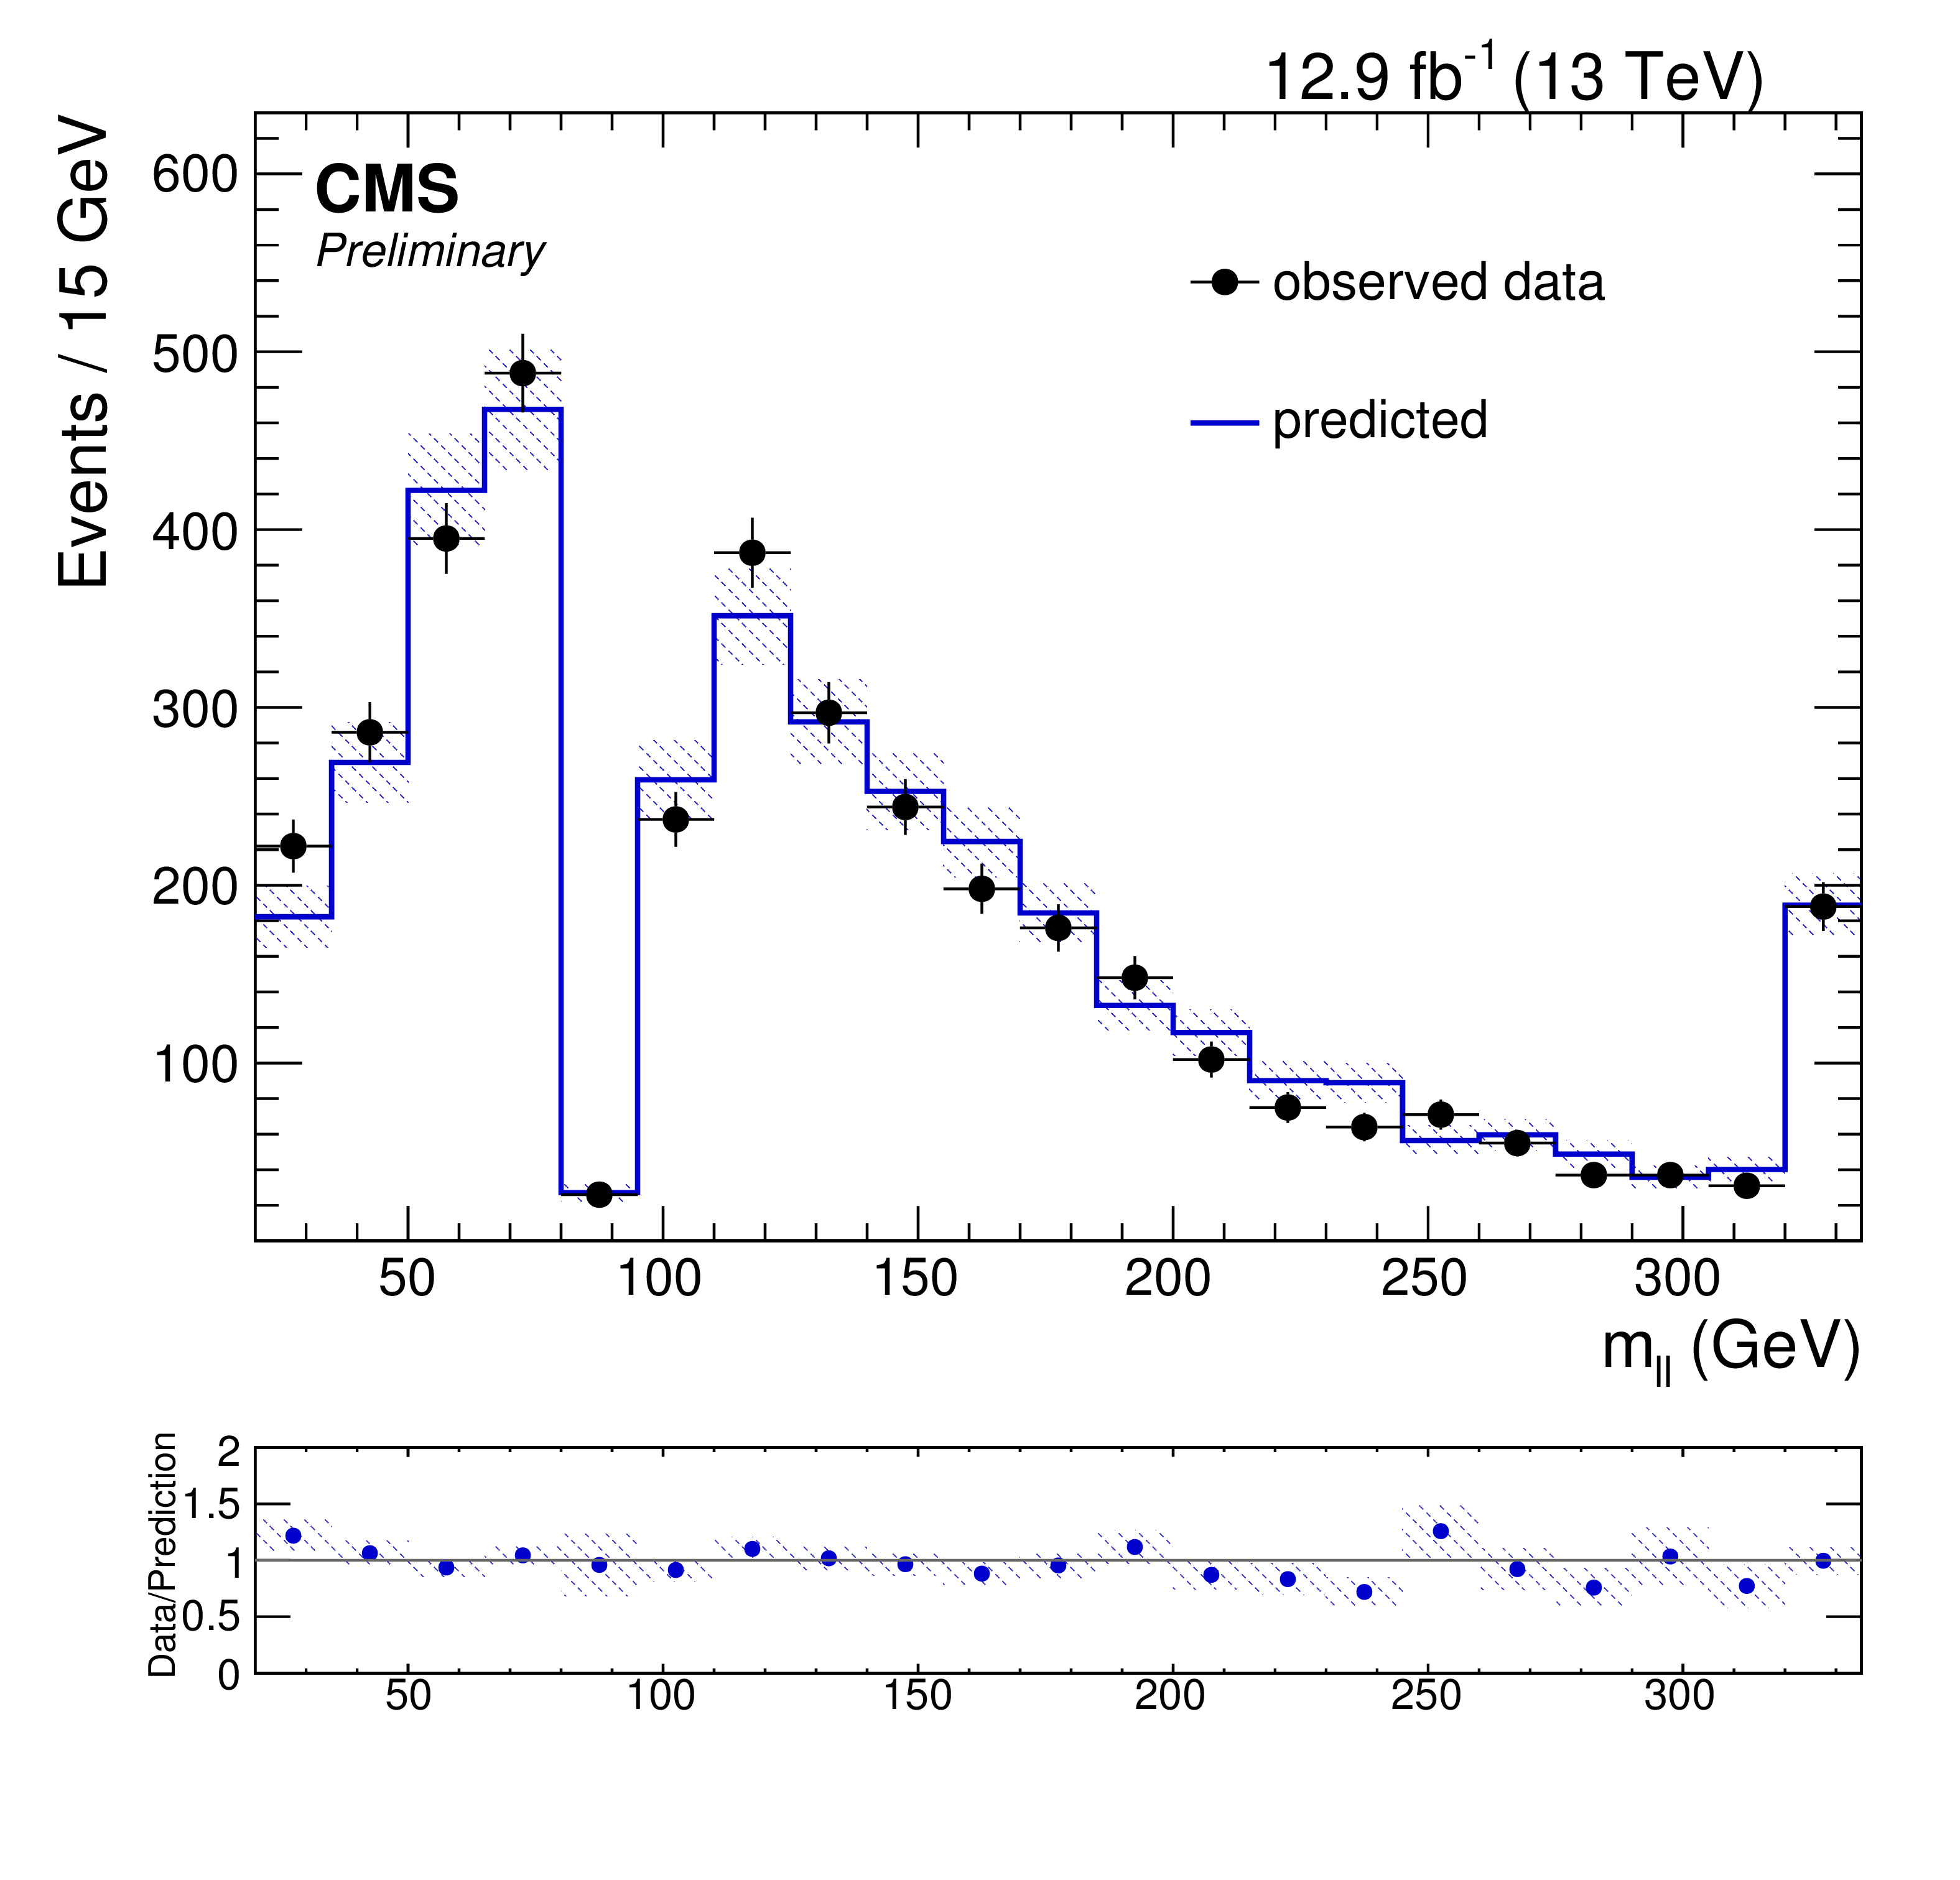
Figure 4-a:
Overview of the results in the strong search shown in the $m_{\ell \ell }$ spectrum of the two leptons. The left plot shows the region with ${\mathrm {t}\overline {\mathrm {t}}} $-like events while the right shows events which are classified as non- ${\mathrm {t}\overline {\mathrm {t}}} $-like. The region left of the empty bin corresponds to the low mass region, the region right of it to high-mass. |
png pdf |
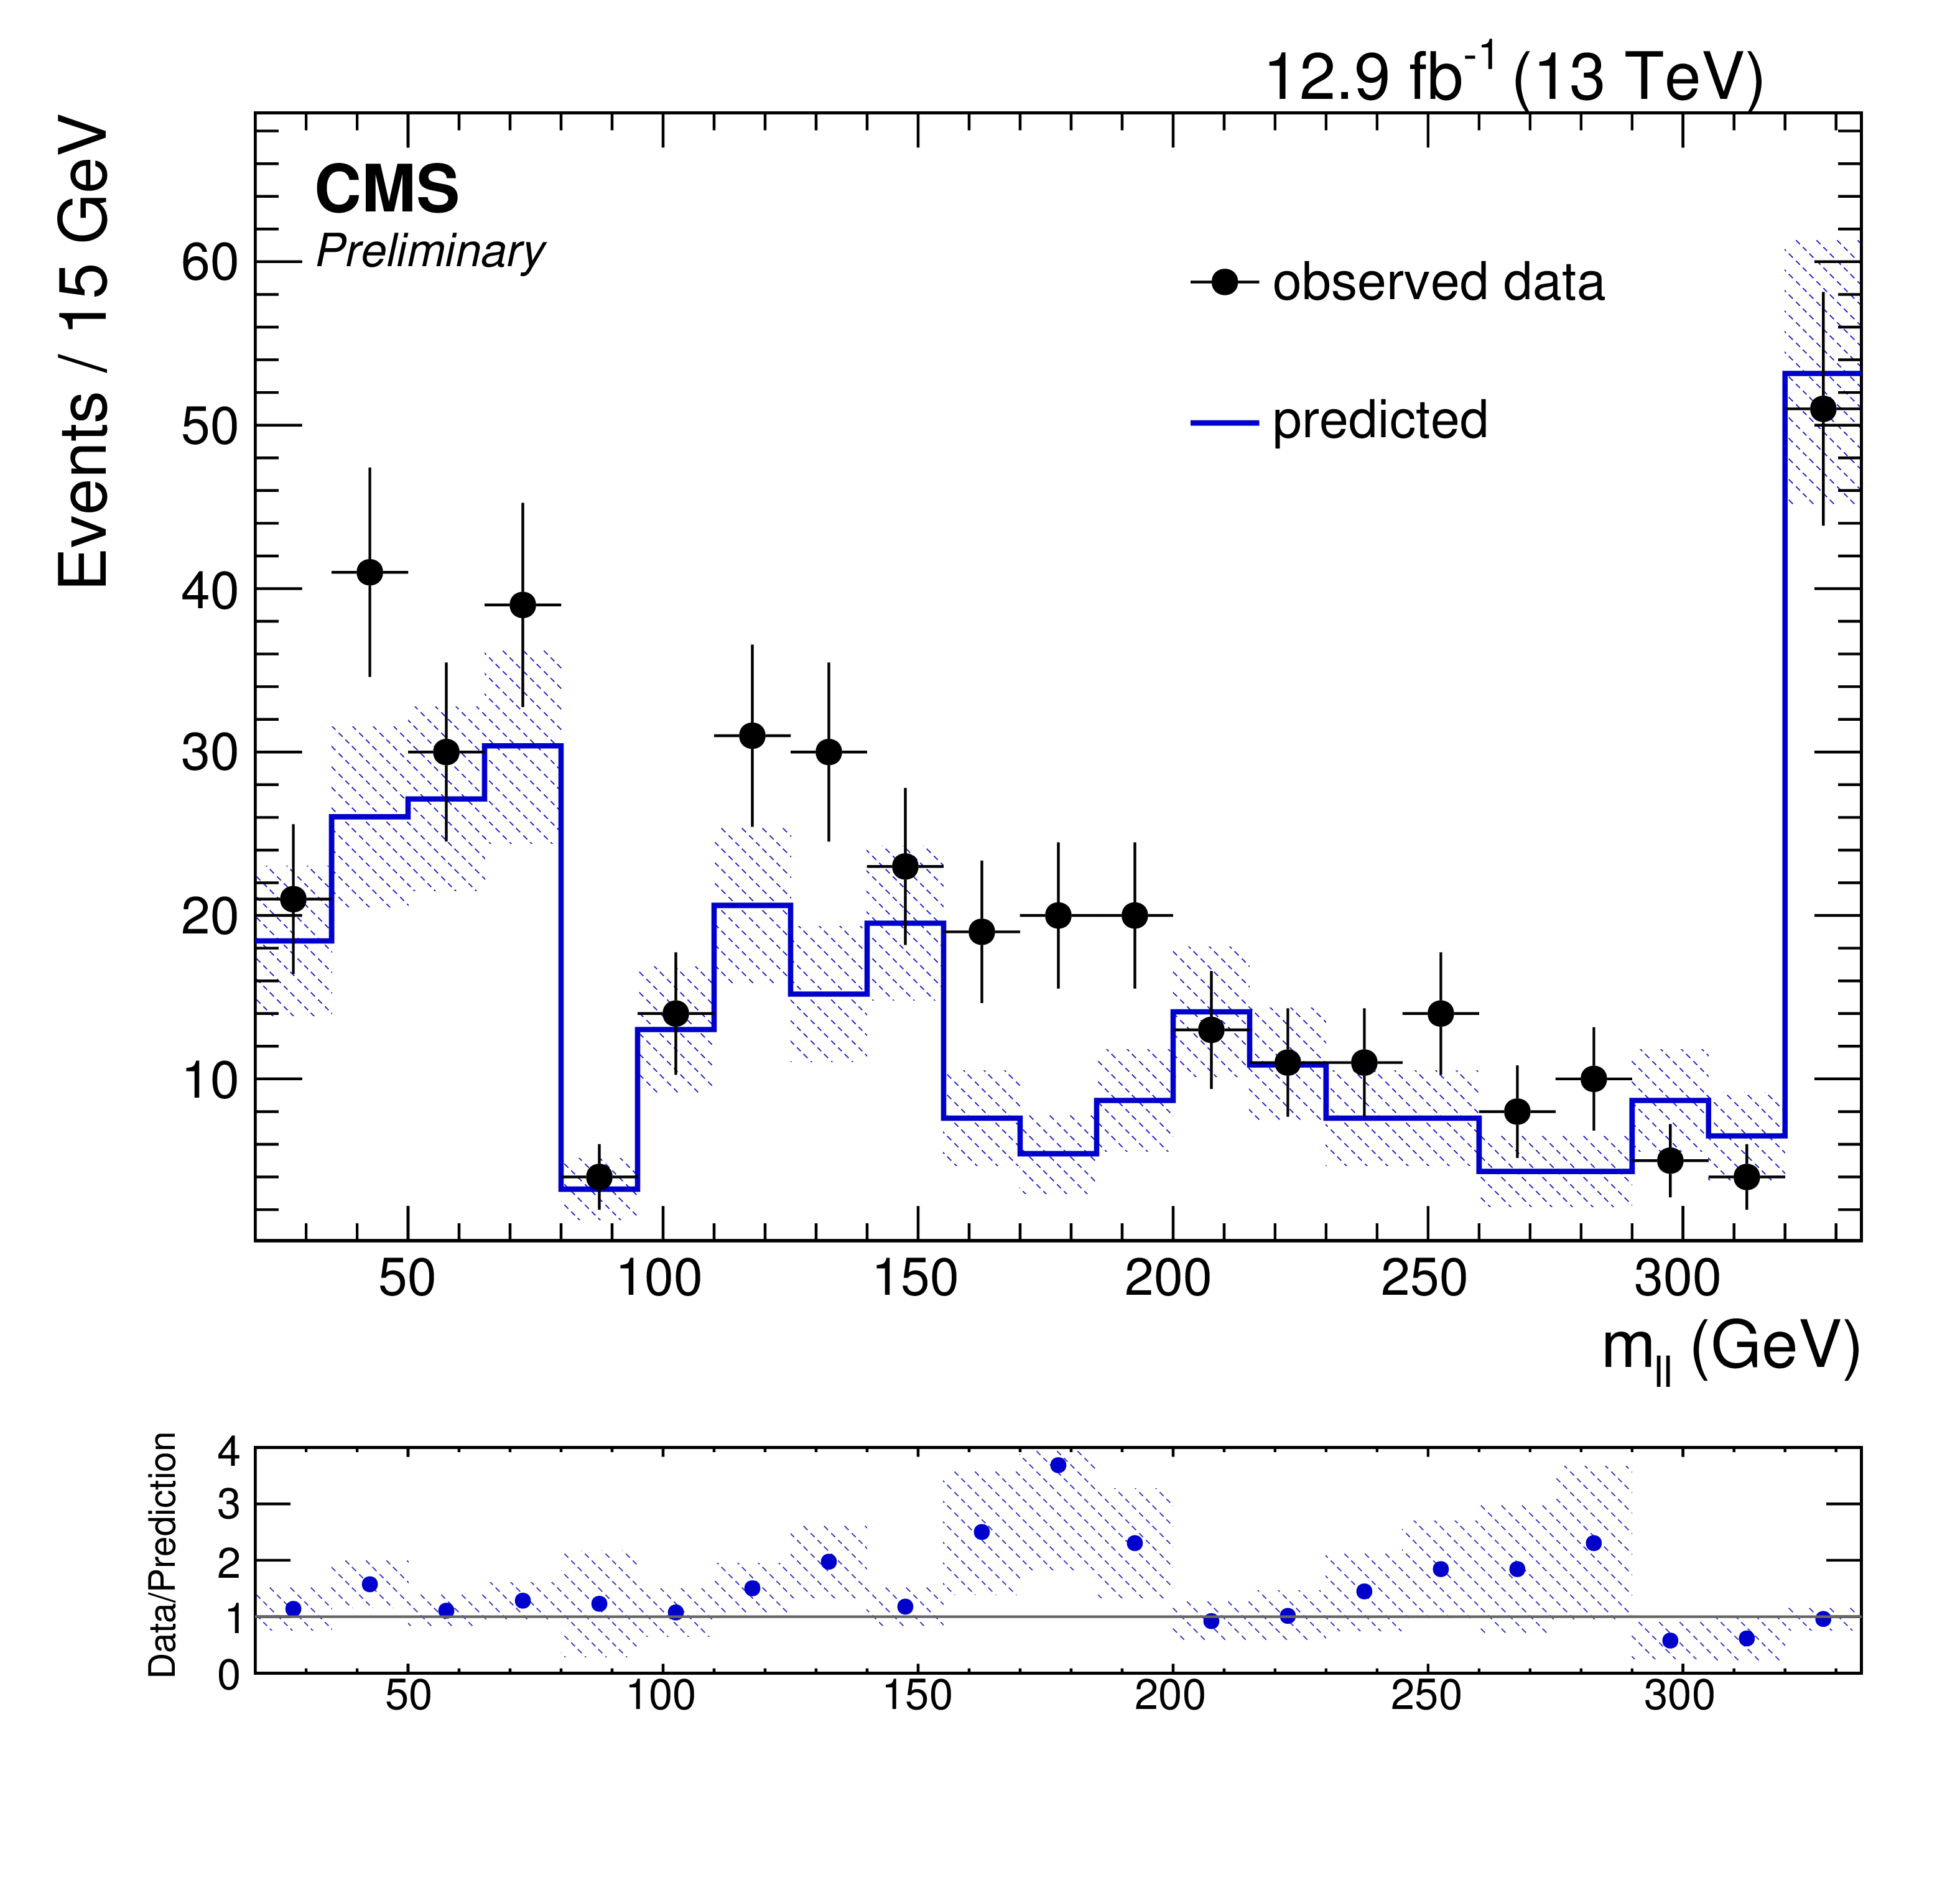
Figure 4-b:
Overview of the results in the strong search shown in the $m_{\ell \ell }$ spectrum of the two leptons. The left plot shows the region with ${\mathrm {t}\overline {\mathrm {t}}} $-like events while the right shows events which are classified as non- ${\mathrm {t}\overline {\mathrm {t}}} $-like. The region left of the empty bin corresponds to the low mass region, the region right of it to high-mass. |
png pdf |
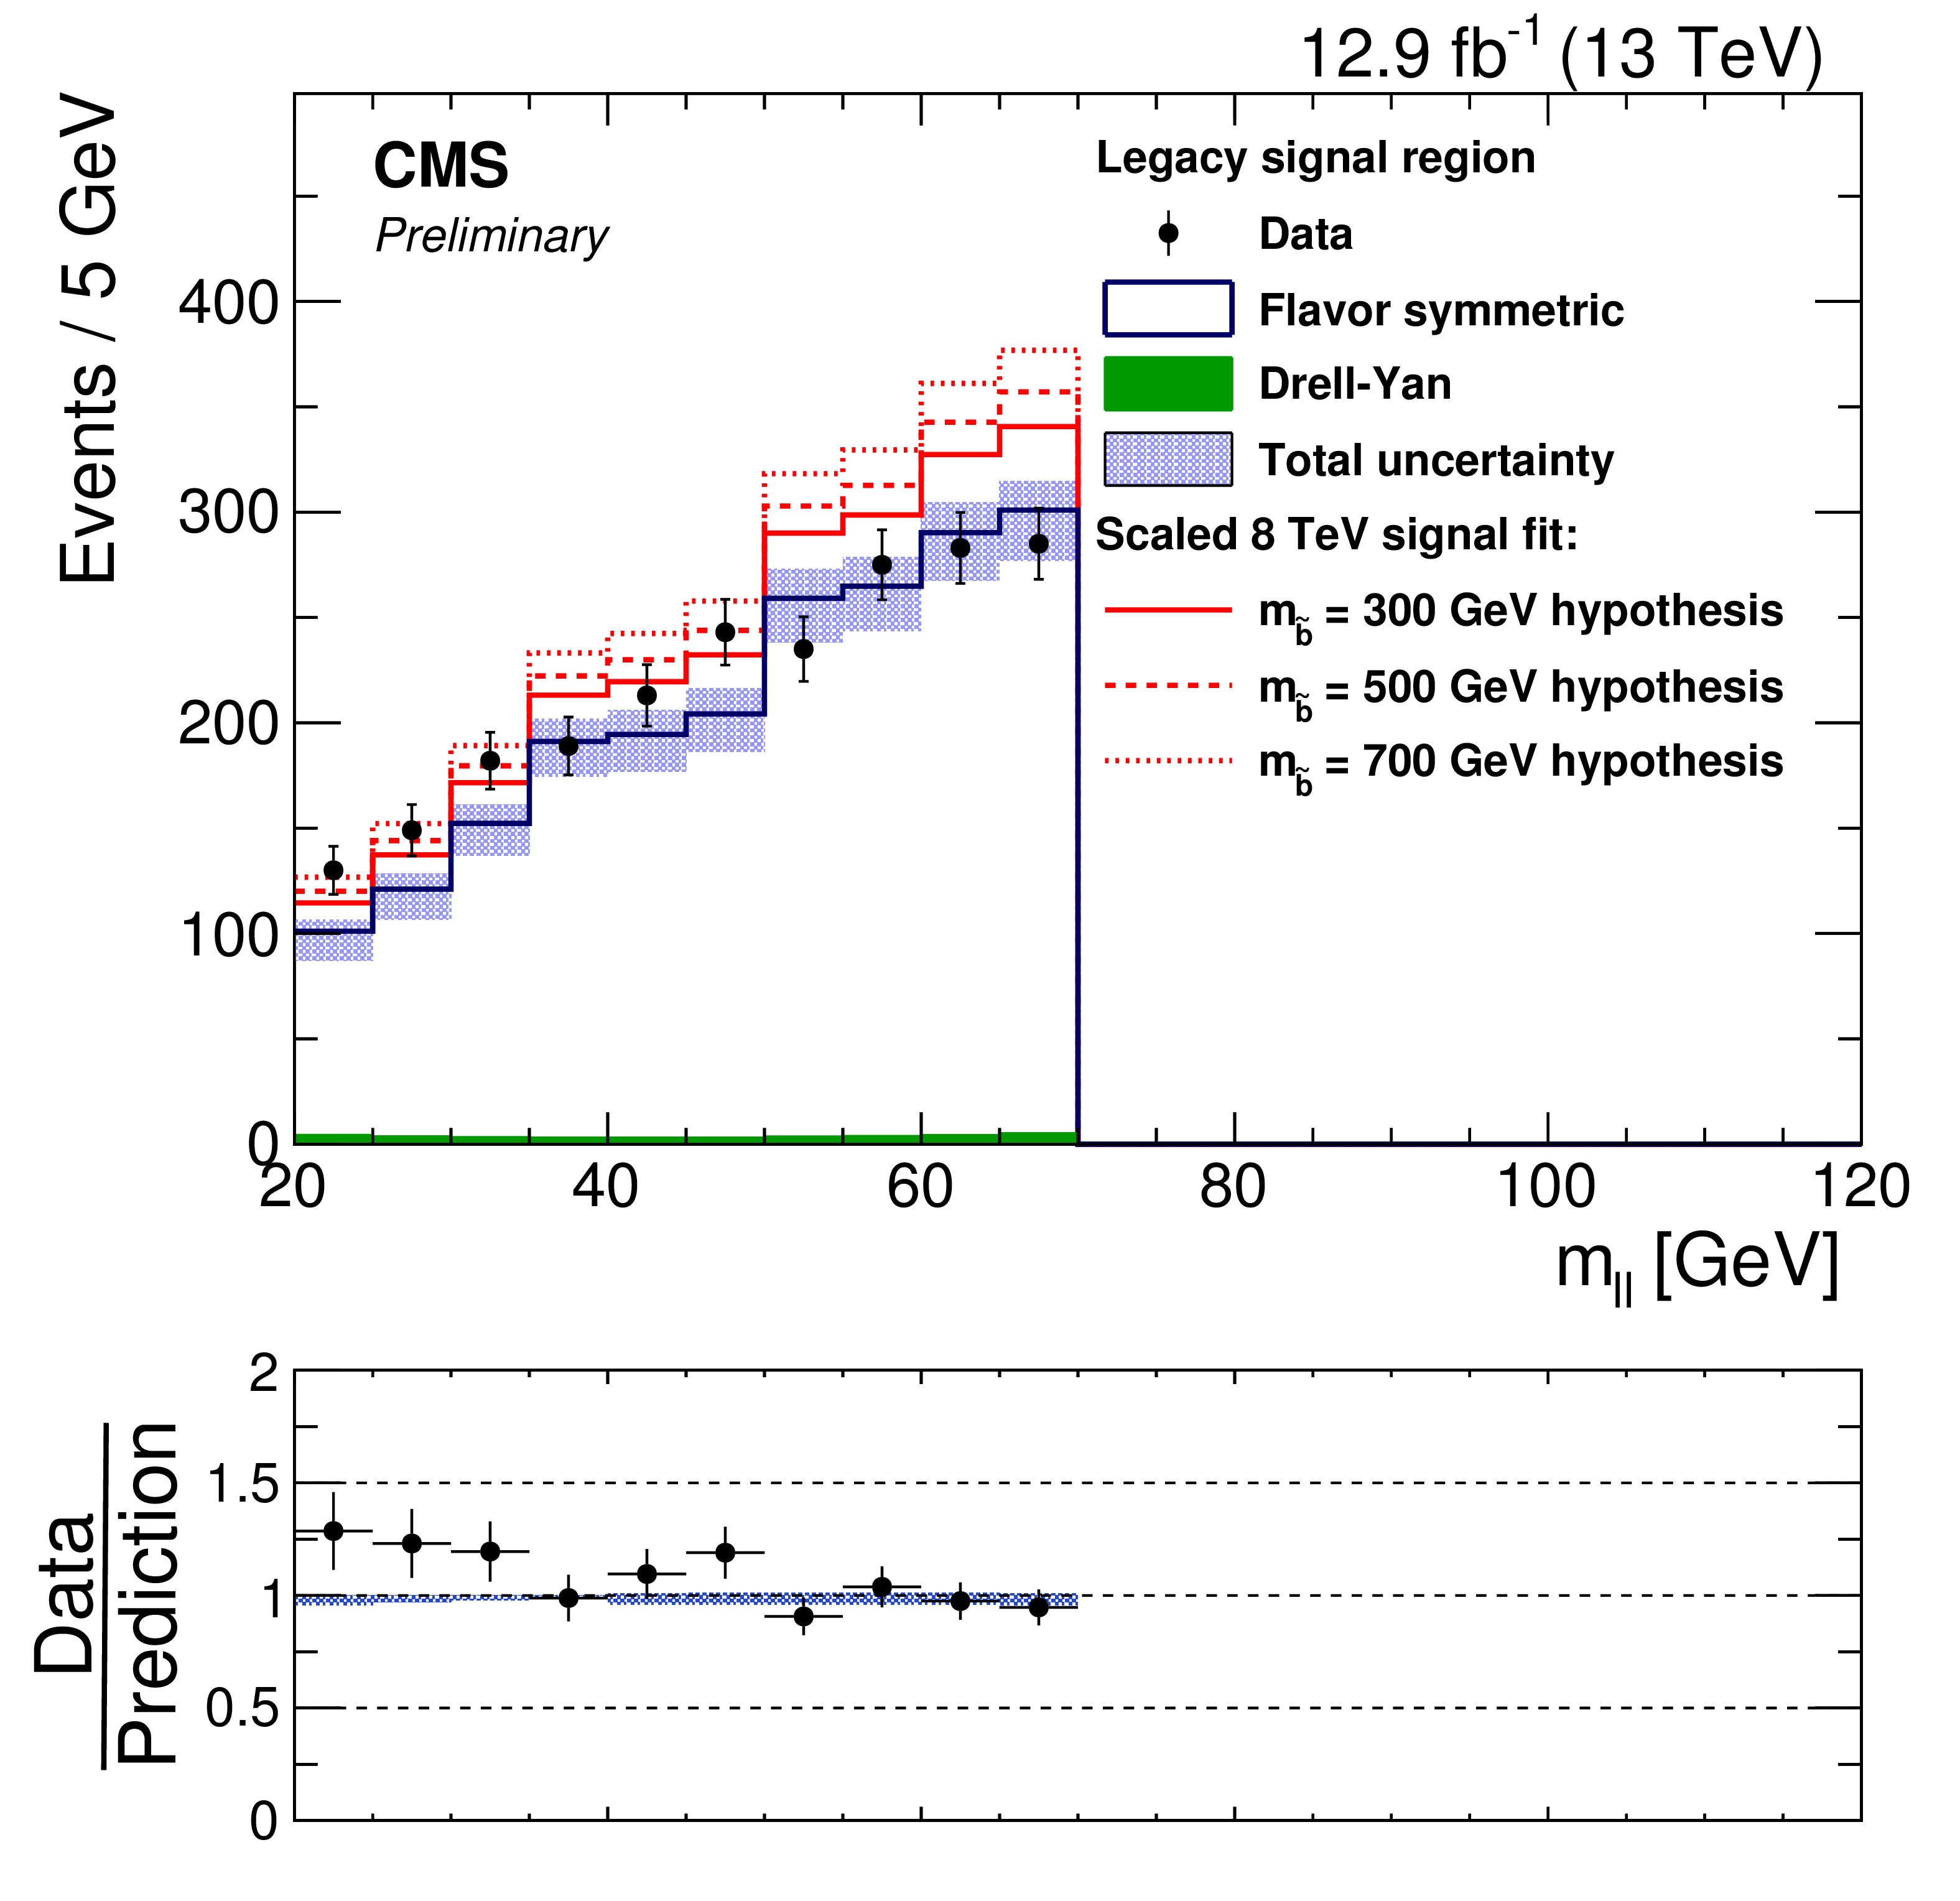
Figure 5:
The $m_{\ell \ell }$ distribution is shown for the region where CMS reported an excess in Run 1. Data is displayed as black points, while the total background is shown as a solid blue line surrounded by a shaded blue band for the total uncertainty. The DY background contribution is shown in green. The signal shape measured by CMS with 8 TeV data has been overlaid on top of the background prediction. It has been normalized to the size of the excess observed at 8 TeV scaled by the ratio of integrated luminosity and cross section for three different sbottom mass hypothesis. |
png pdf |
Figure 6-a:
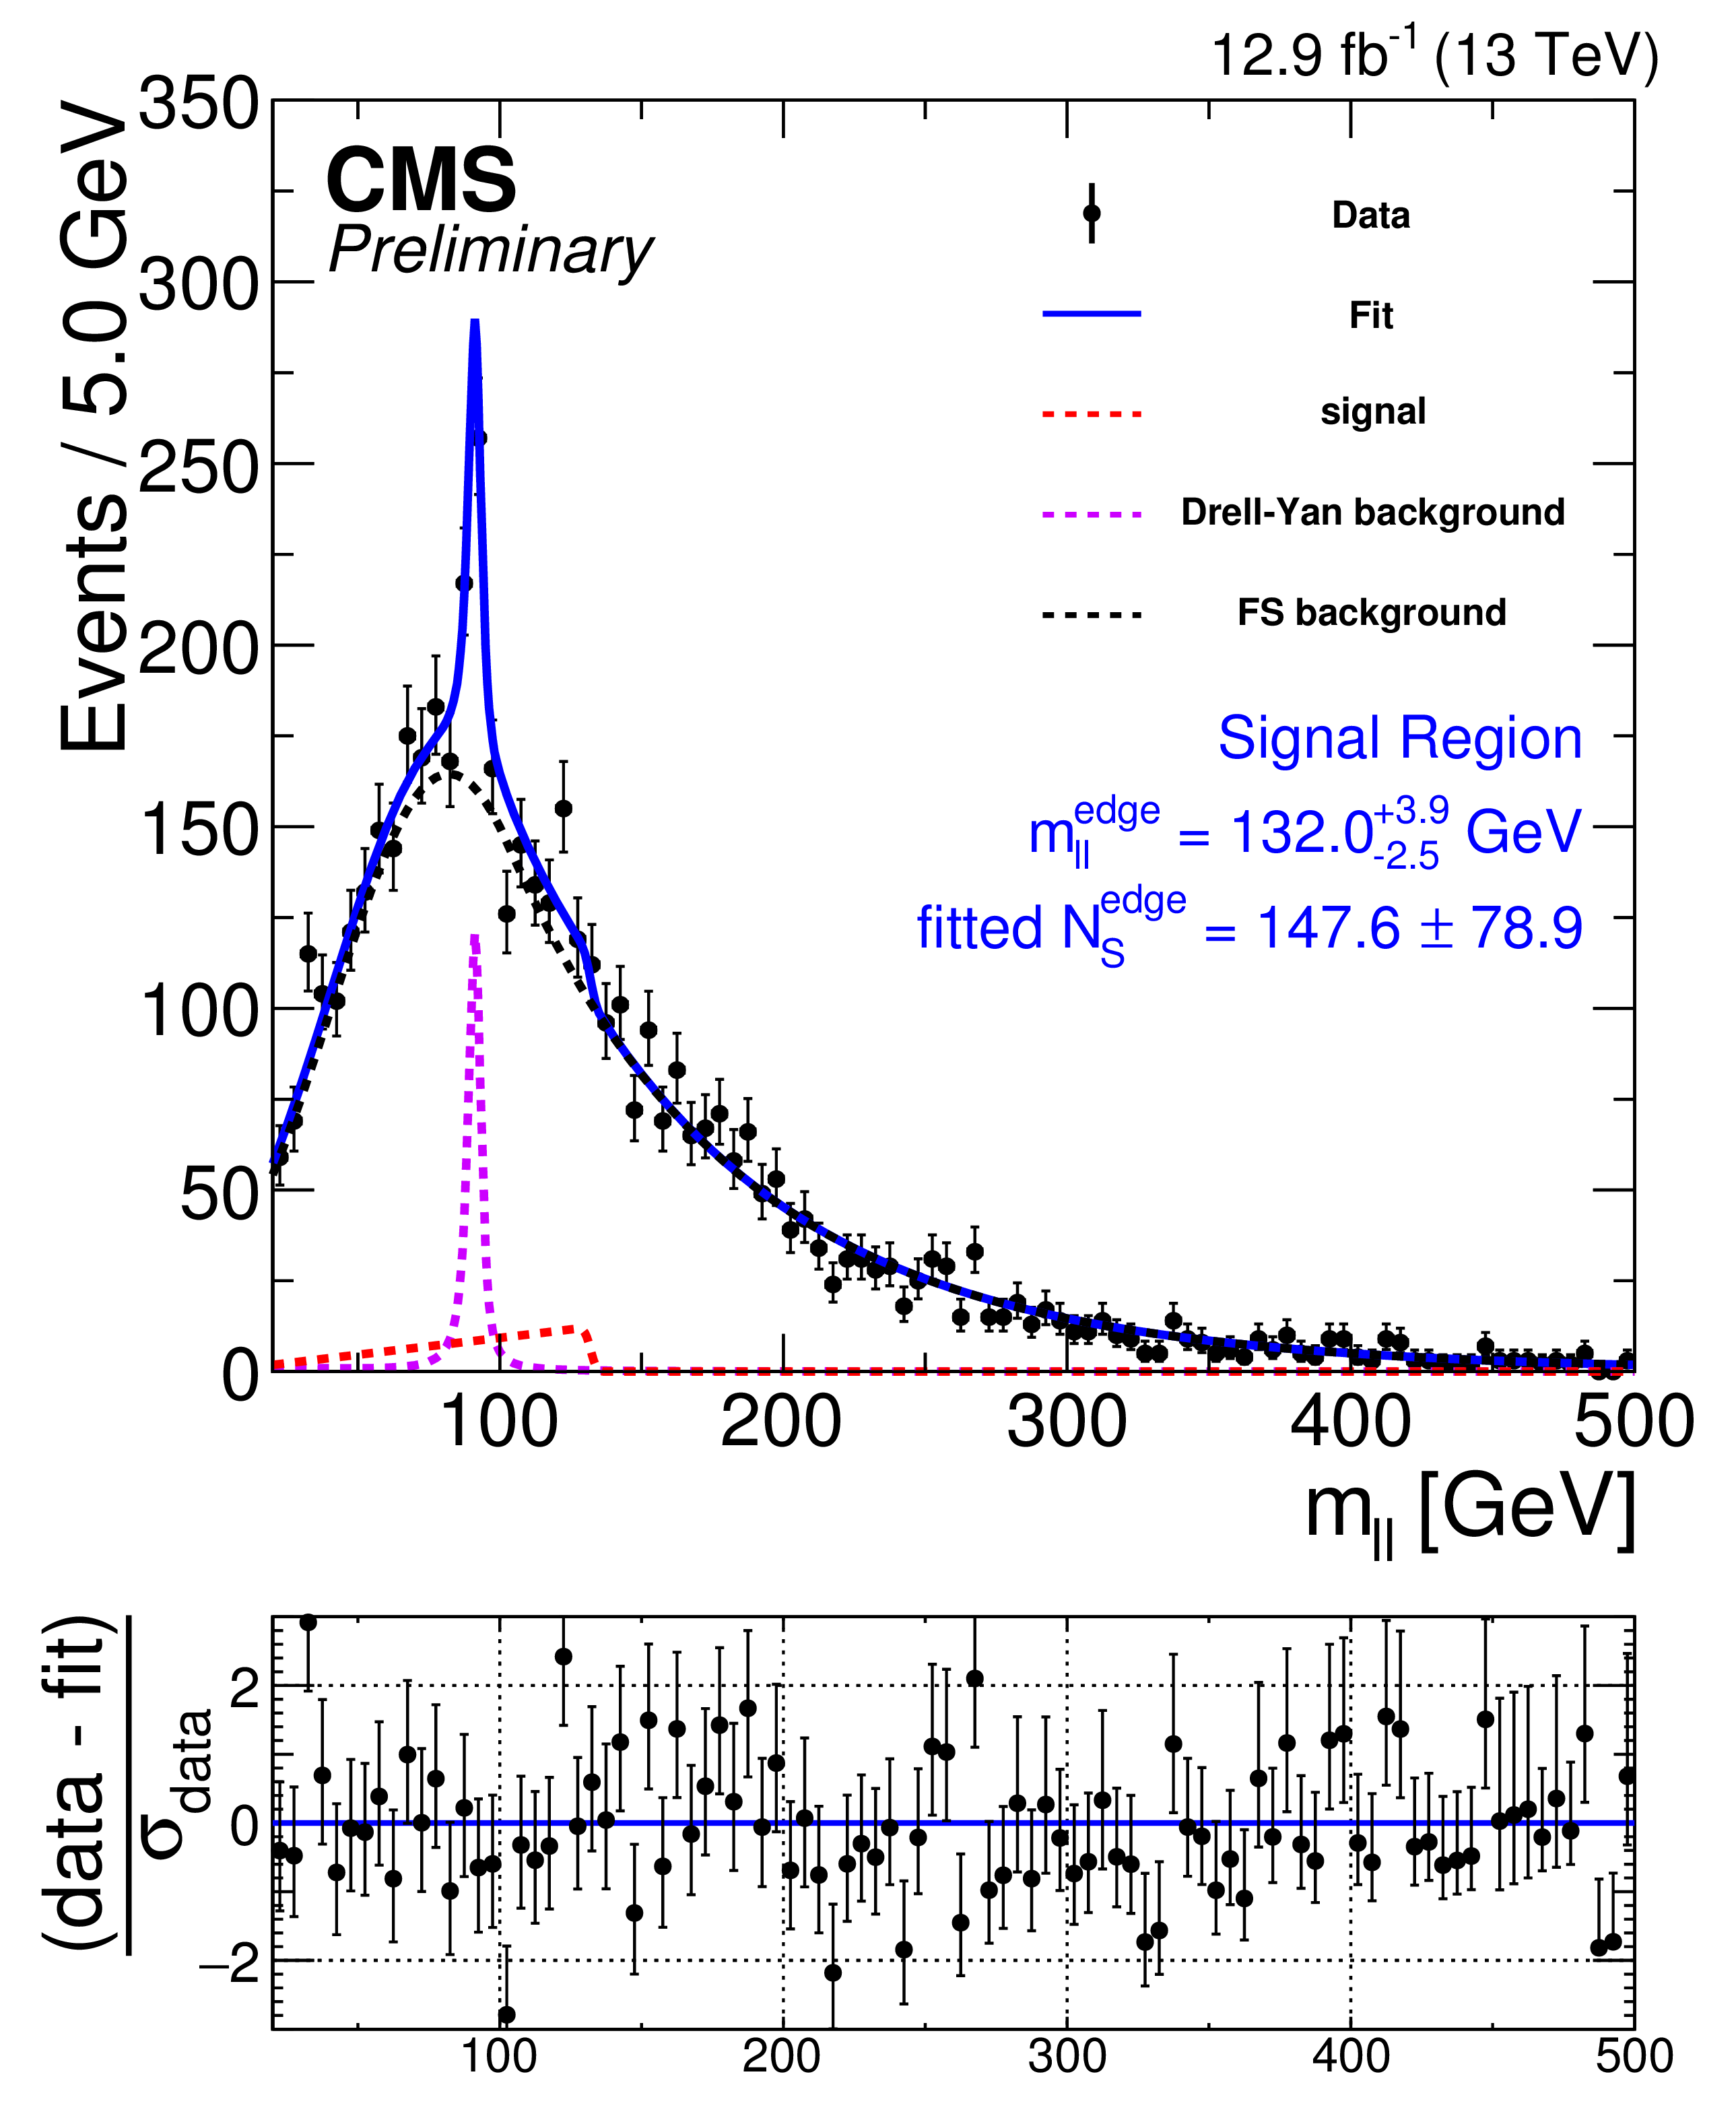
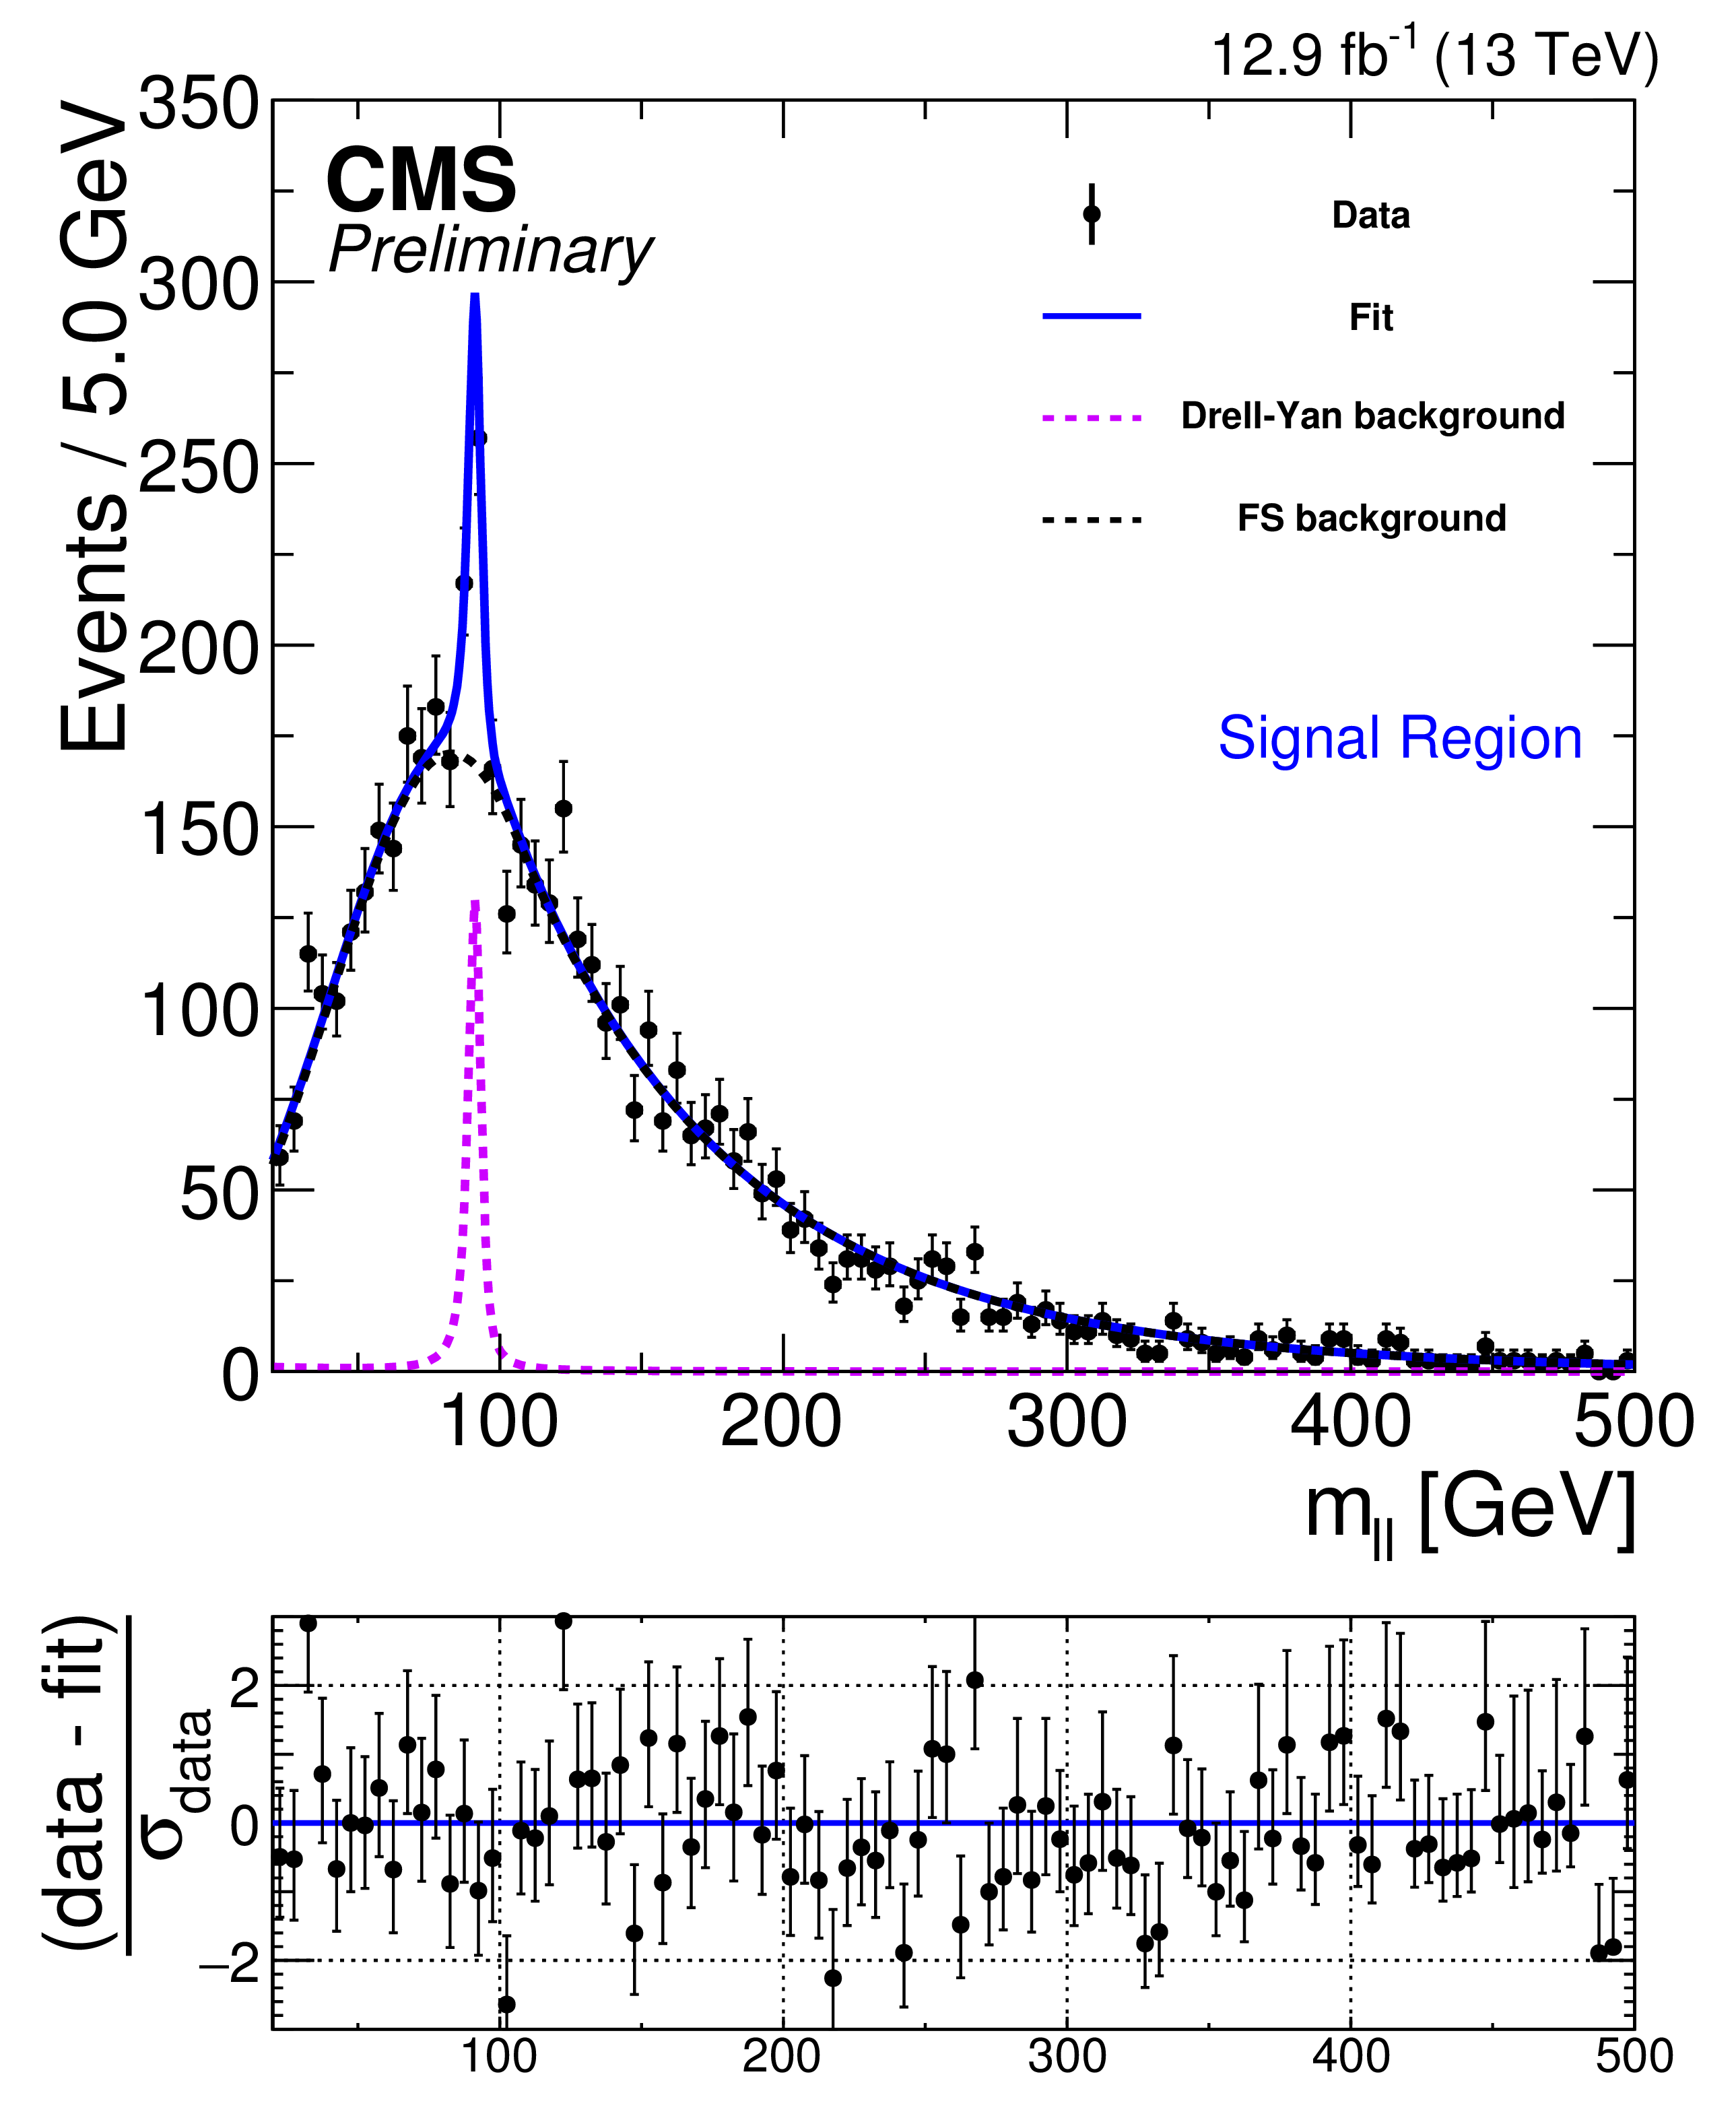
Fit results for the signal-plus-background hypothesis in comparison with the measured dilepton mass distributions, in the baseline signal region, projected on the same-flavor (a) and opposite-flavor (b) event samples. The combined fit shape is shown as a blue, solid line. The individual fit components are indicated by dashed lines. The flavor-symmetric (FS) background is displayed with a black dashed line. The Drell-Yan (DY) background is displayed with a purple dashed line. The extracted signal component is displayed with a red dashed line. |

png pdf |
Figure 6-b:
Fit results for the signal-plus-background hypothesis in comparison with the measured dilepton mass distributions, in the baseline signal region, projected on the same-flavor (a) and opposite-flavor (b) event samples. The combined fit shape is shown as a blue, solid line. The individual fit components are indicated by dashed lines. The flavor-symmetric (FS) background is displayed with a black dashed line. The Drell-Yan (DY) background is displayed with a purple dashed line. The extracted signal component is displayed with a red dashed line. |

png pdf |
Figure 7:
Distribution of ${E_{\mathrm {T}}^{\text {miss}}}$ in the electroweak search region. The three final bins correspond to the final search regions used for the interpretation of the results. |
png pdf root |
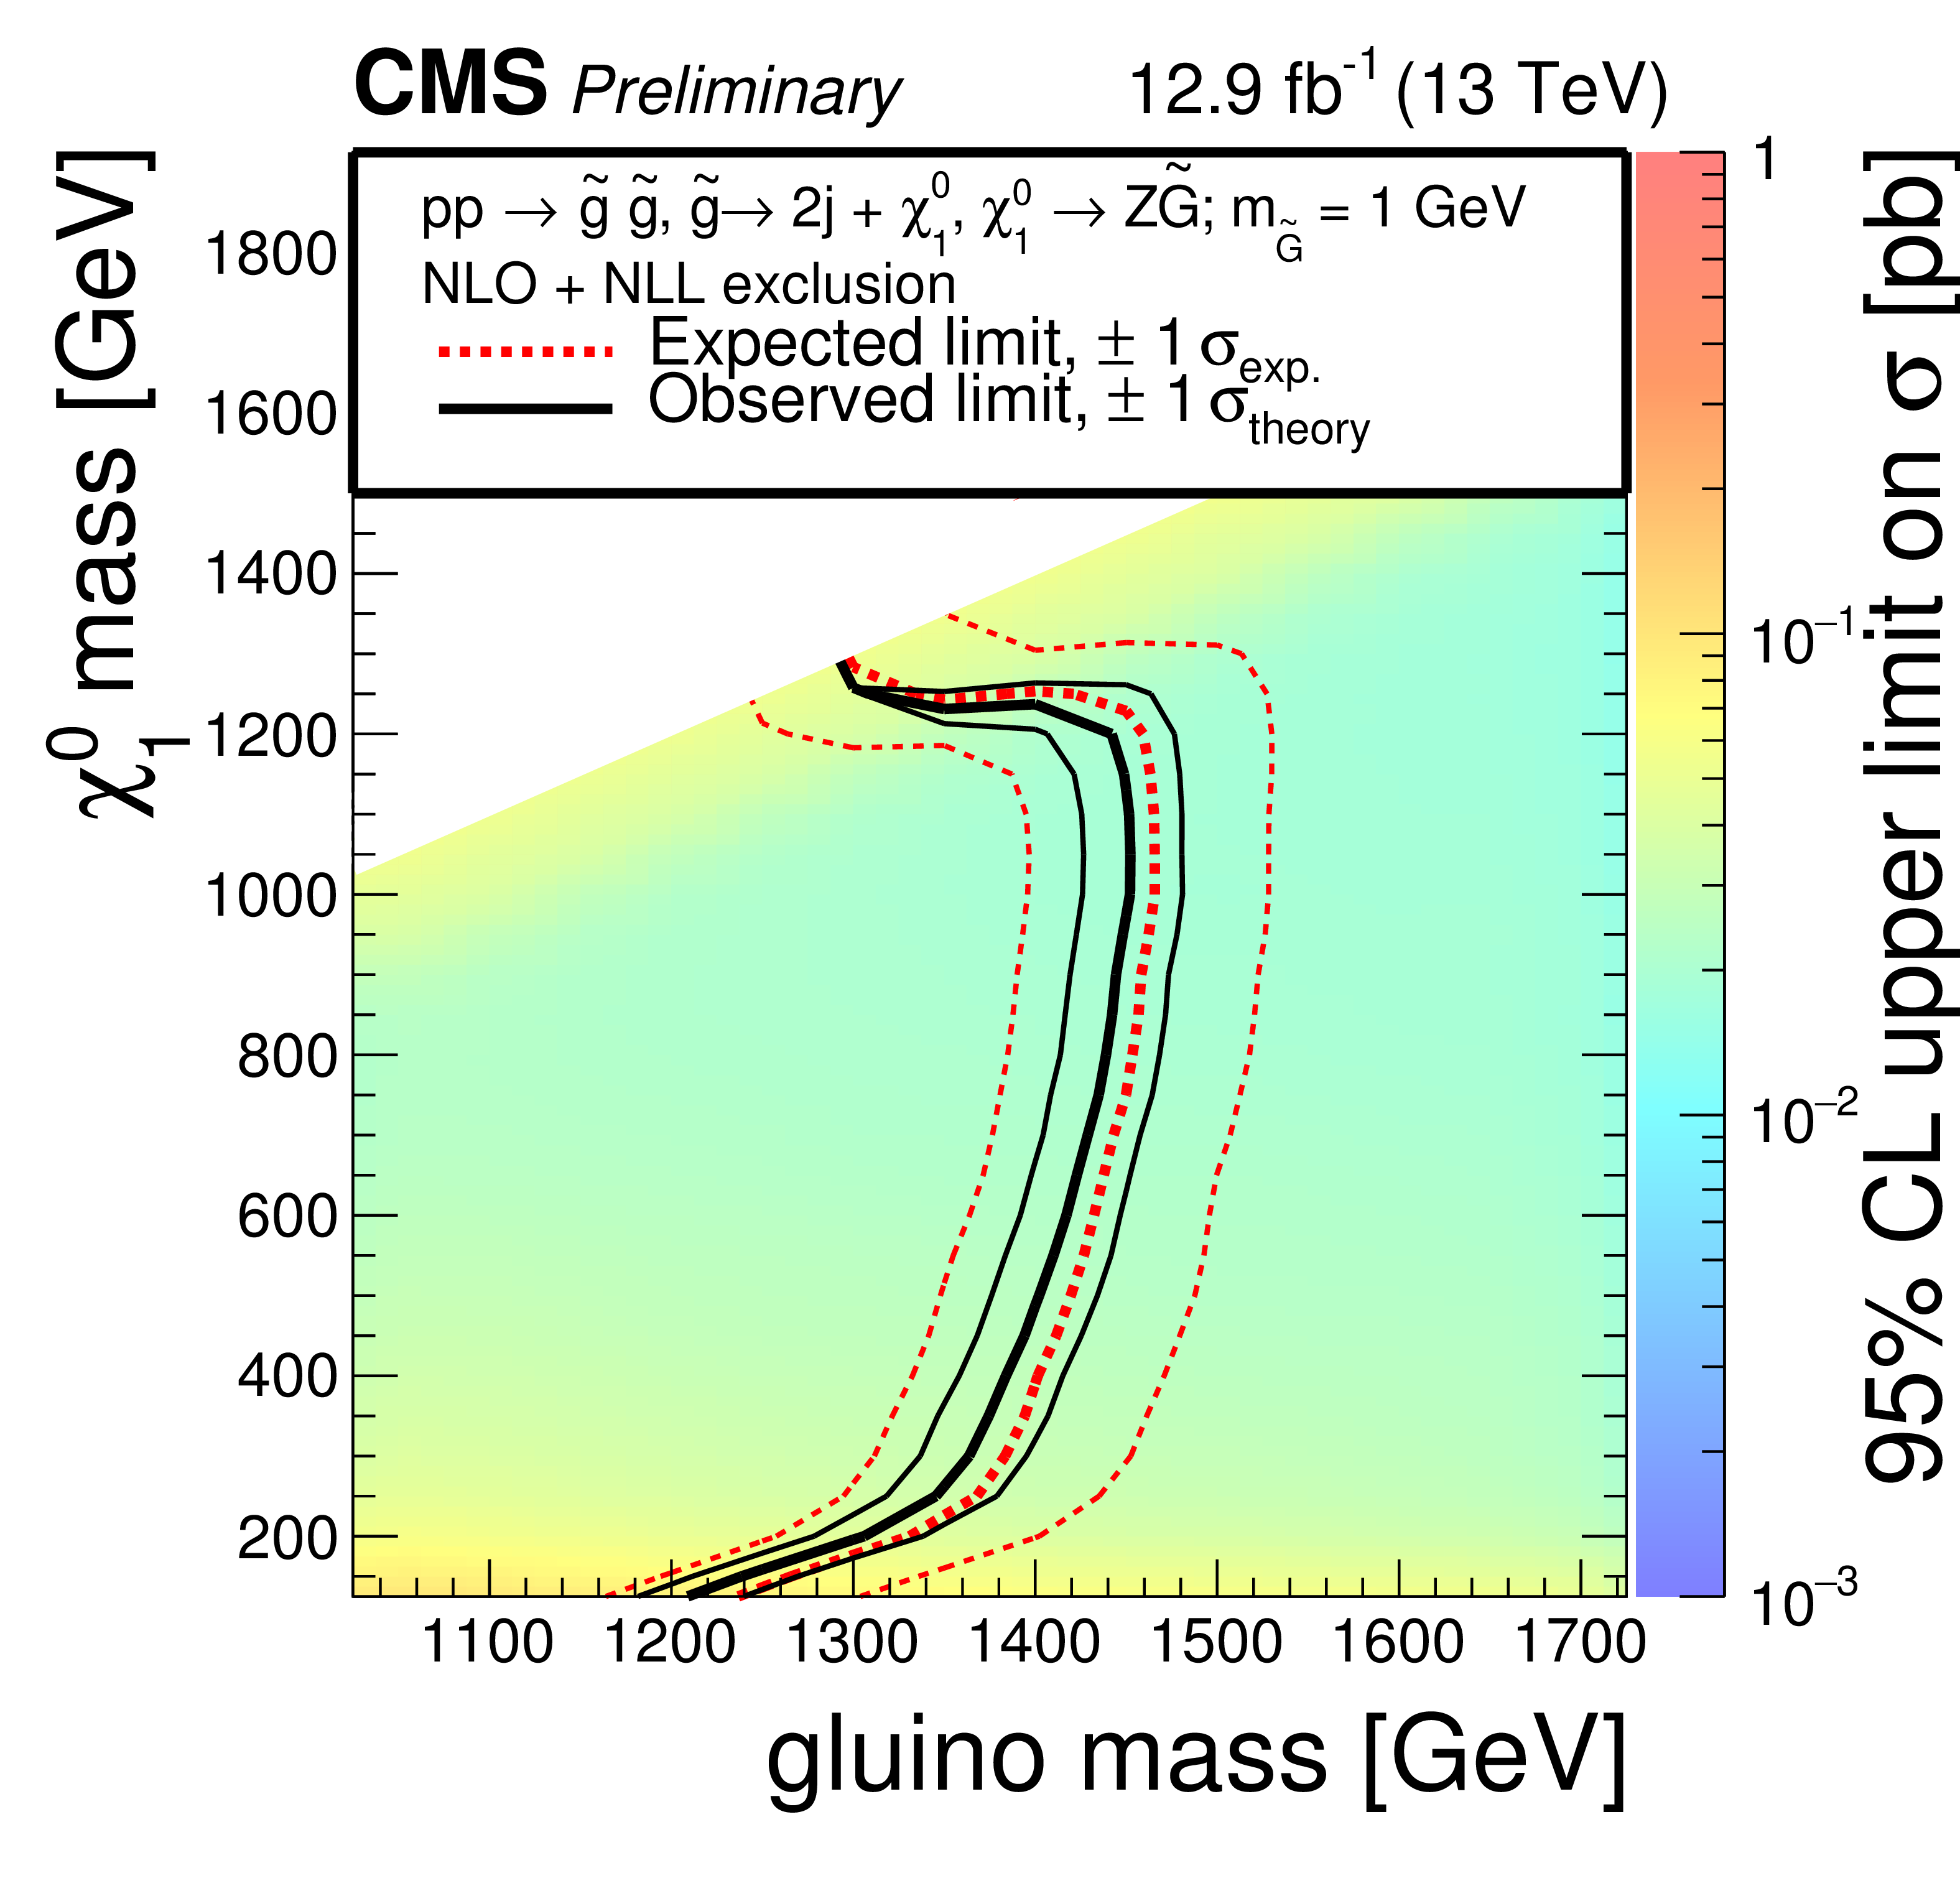
Figure 8:
Cross section upper limits and exclusions contours at 95% CL with the results of the on-Z search interpreted in the GMSB model. The region to the left of the red dotted (black solid) line shows the masses which are excluded by the expected (observed) limit. |
png pdf root |
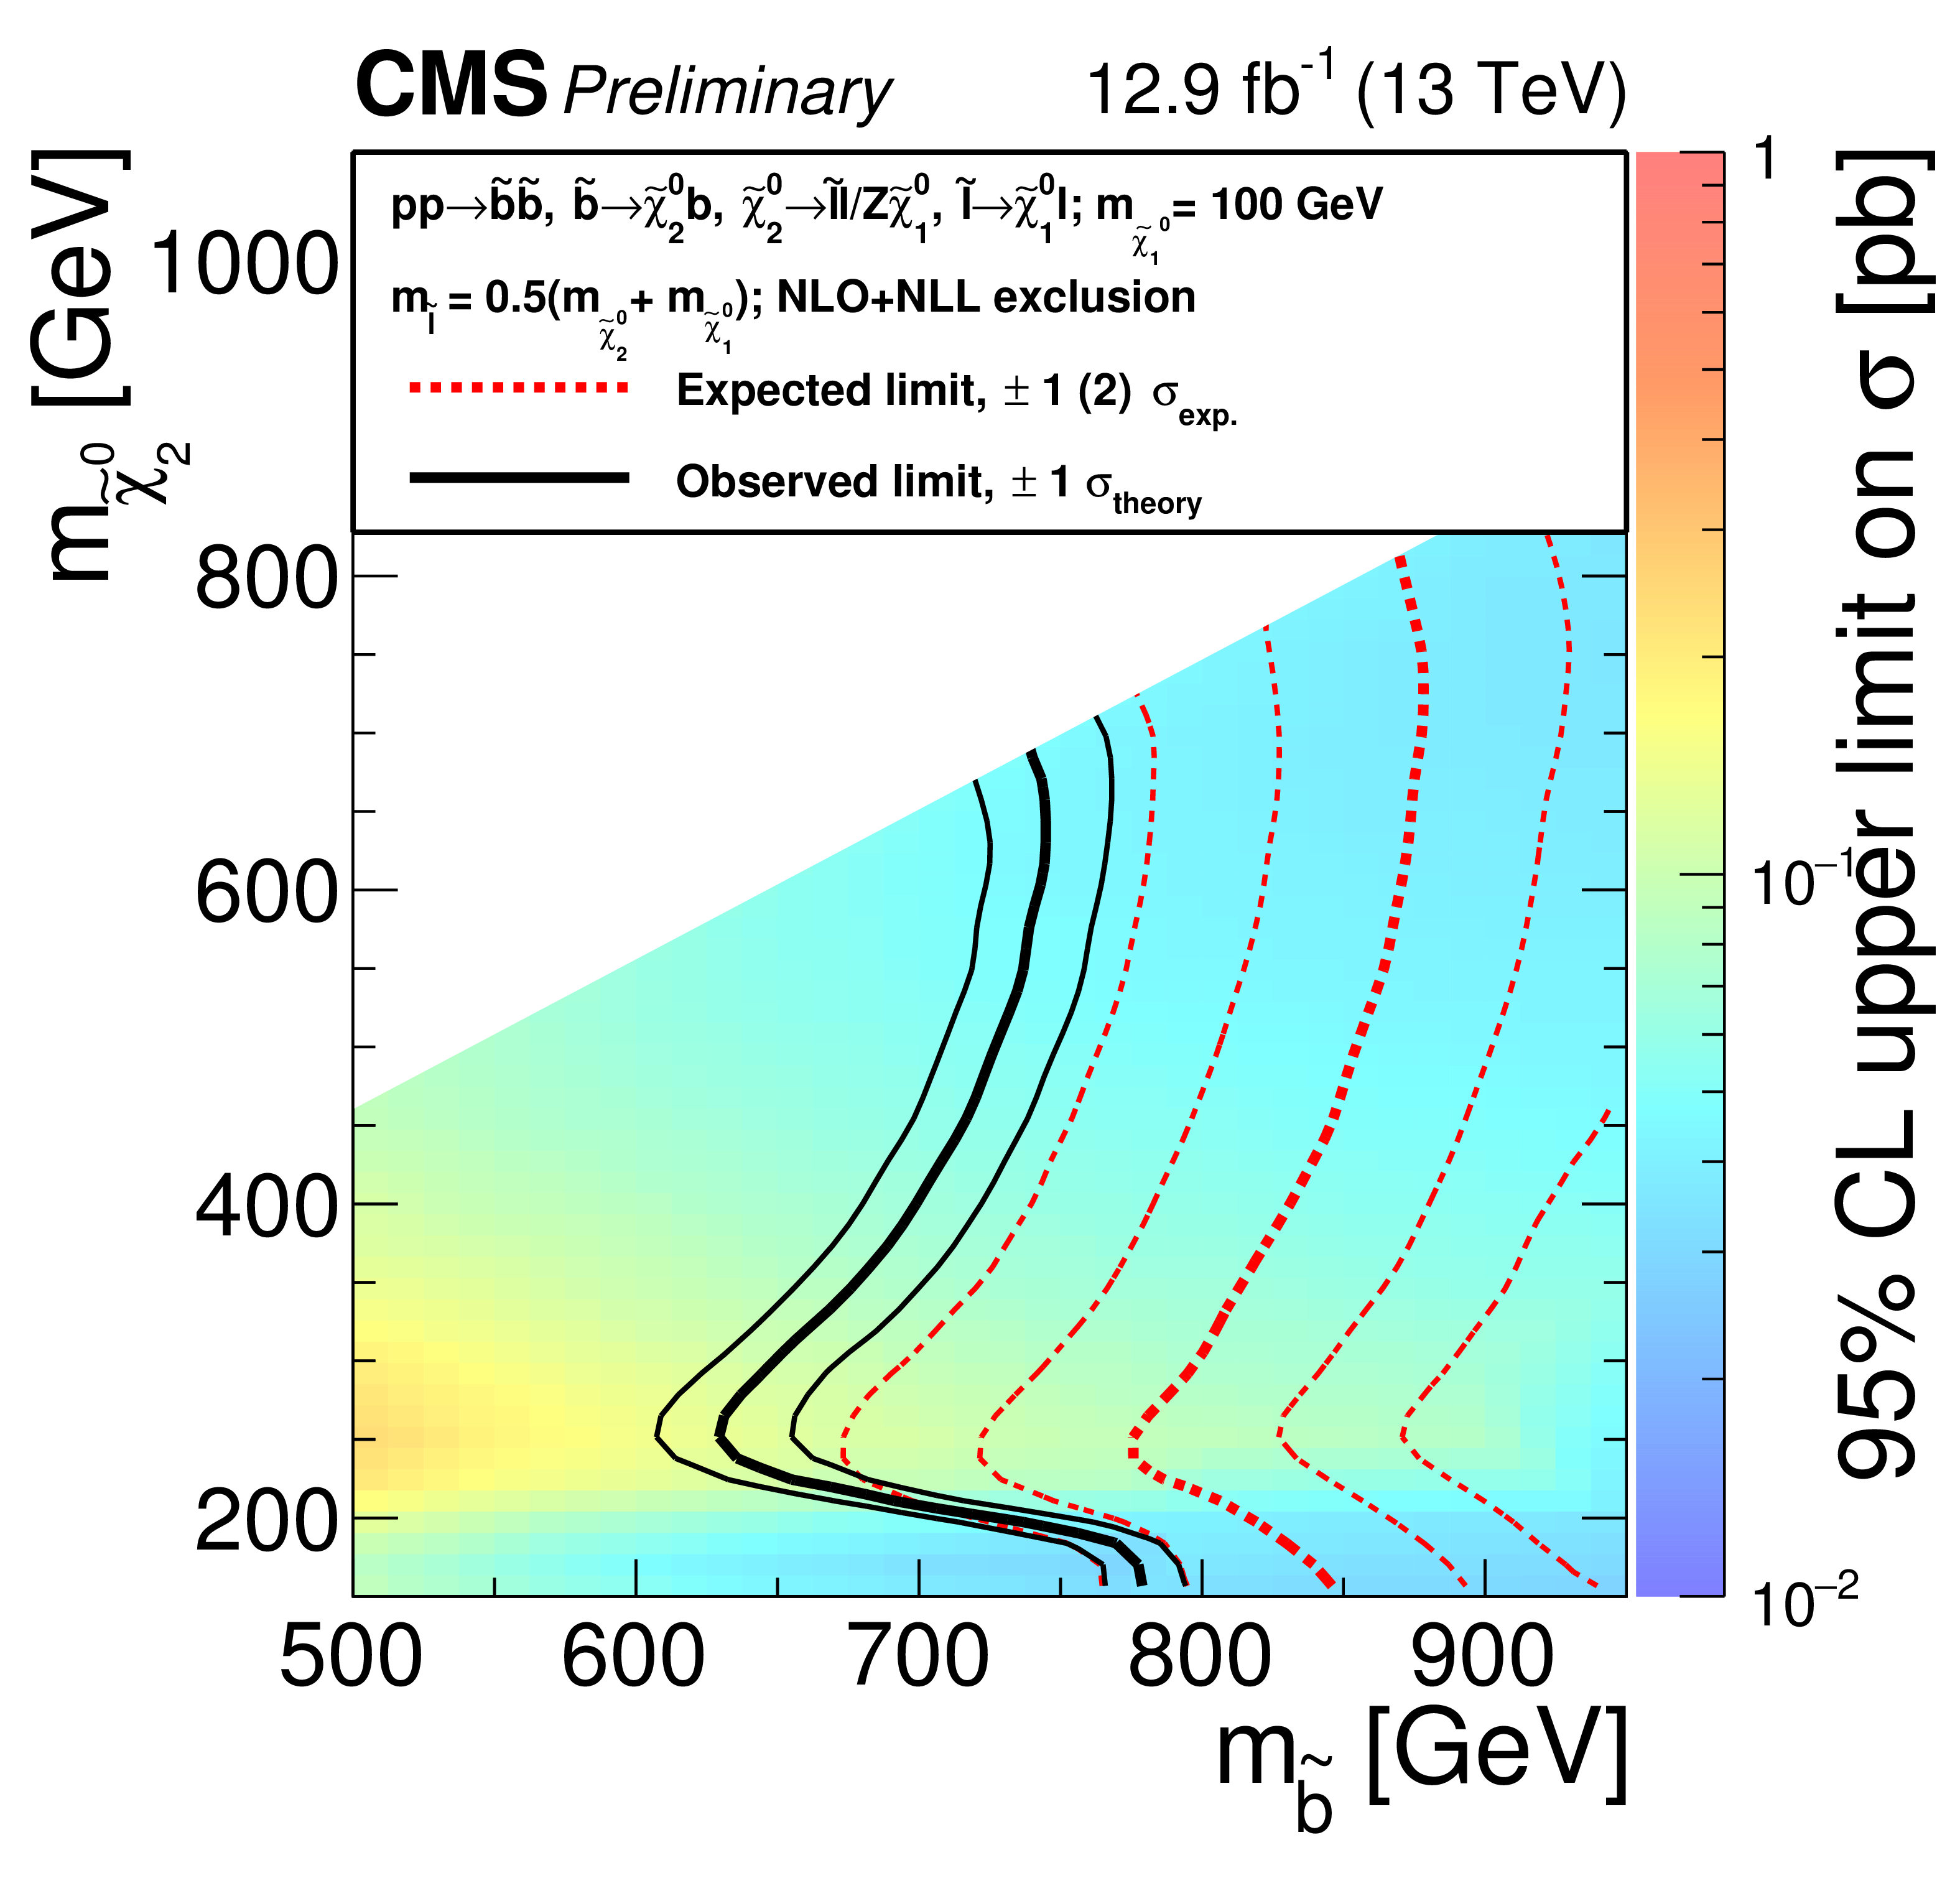
Figure 9:
Cross section upper limits and exclusion contours at 95% CL with the results of the edge search interpreted in the slepton-edge model. The region to the left of the red dotted (black solid) line shows the masses which are excluded by the expected (observed) limit. |
png pdf root |
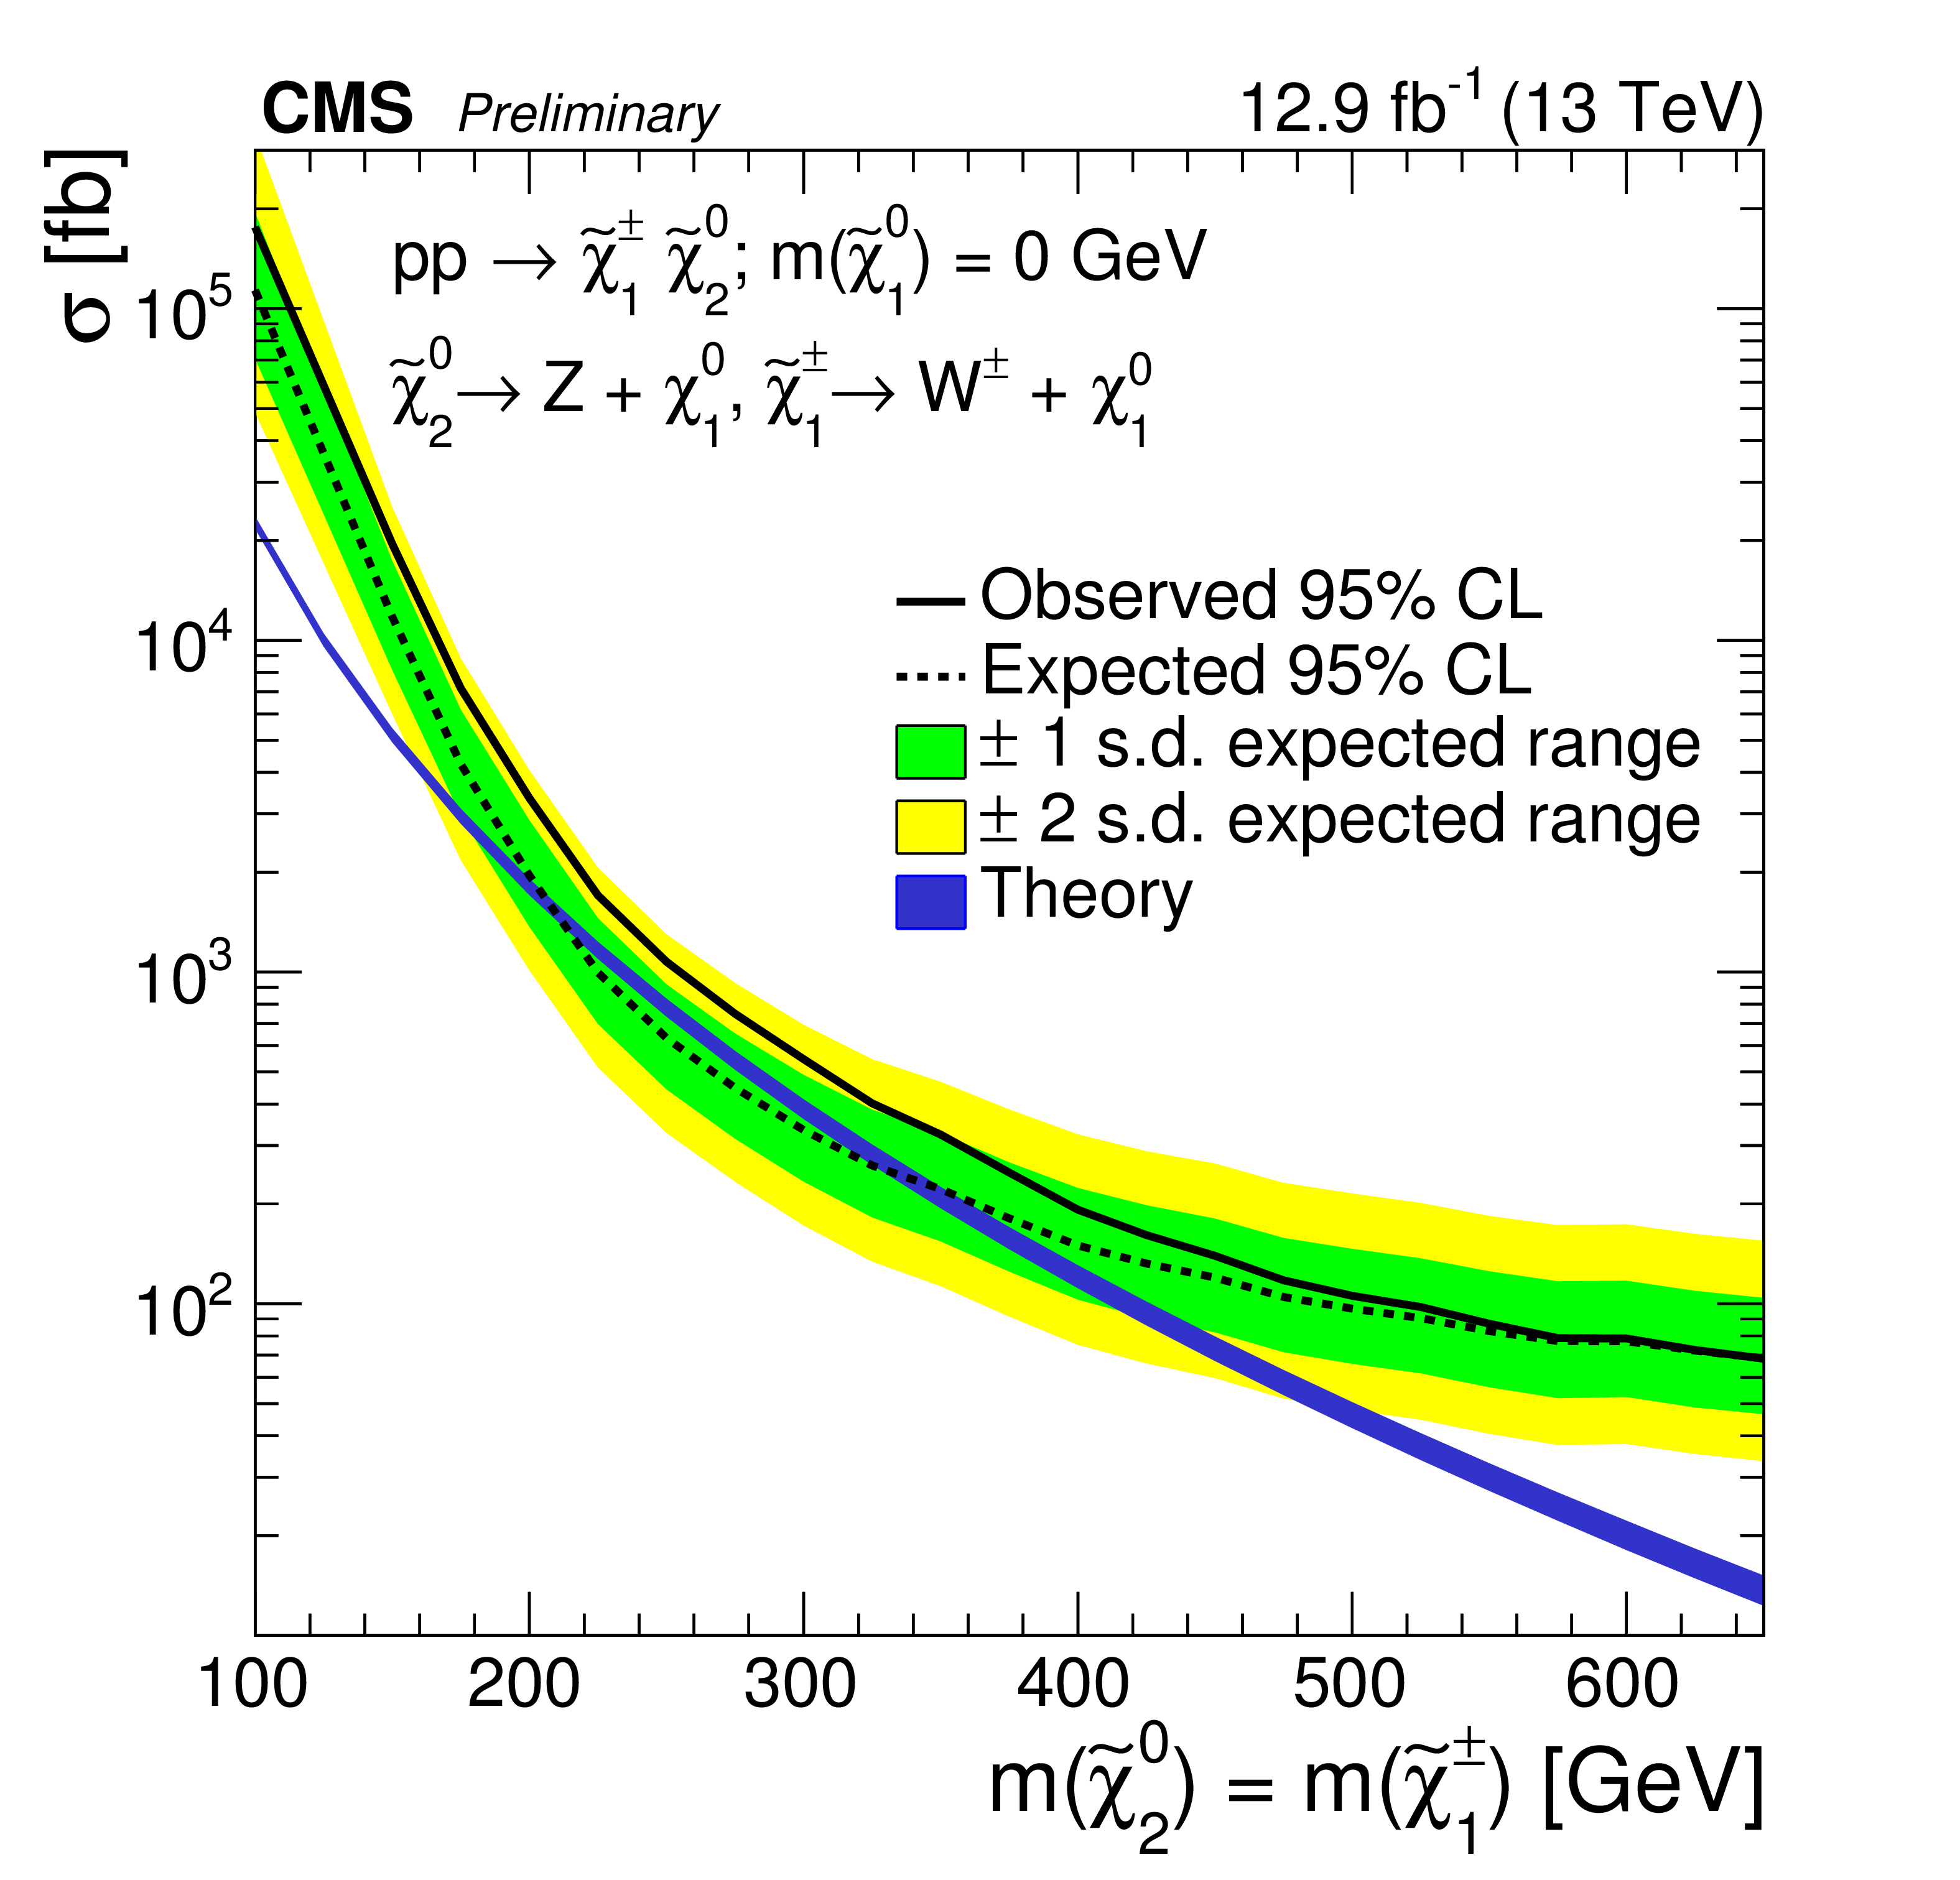
Figure 10:
Cross section upper limits and exclusion lines at 95% CL for the search for electroweak production where the mass of the $\tilde{ \chi }^0_1$ has been set to 0 GeV. Regions where the black dotted line reaches below the theoretical cross section (blue band) are expected to be excluded. The observed upper limit on the cross section is shown in a black solid line. |
| Tables | |
png pdf |
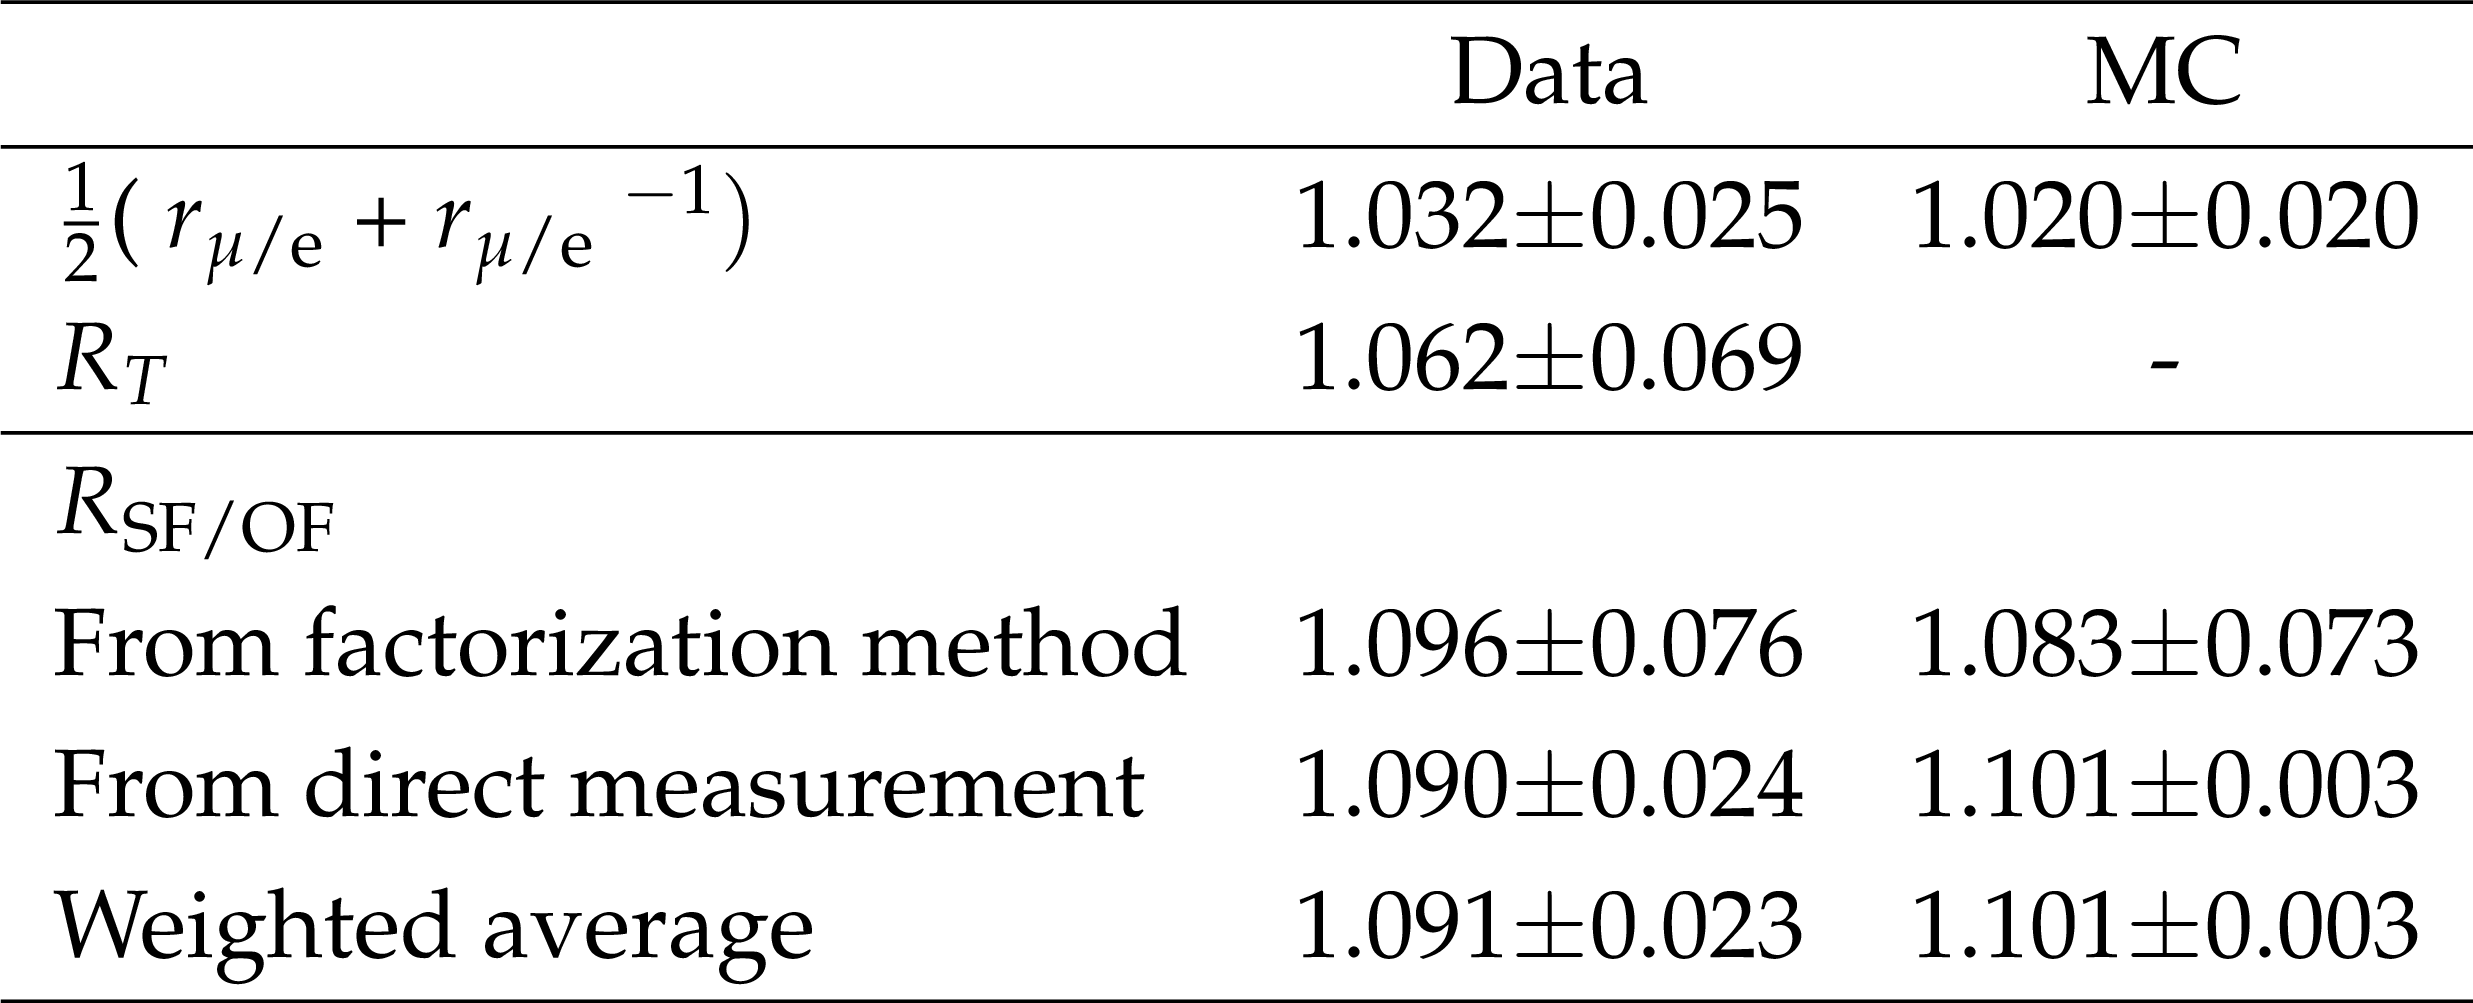
Table 1:
Summary of $R_{SF/OF}$ values obtained in data and simulation using the direct and factorized methods, and the final combination by weighting the two results according to their uncertainties. |
png pdf |
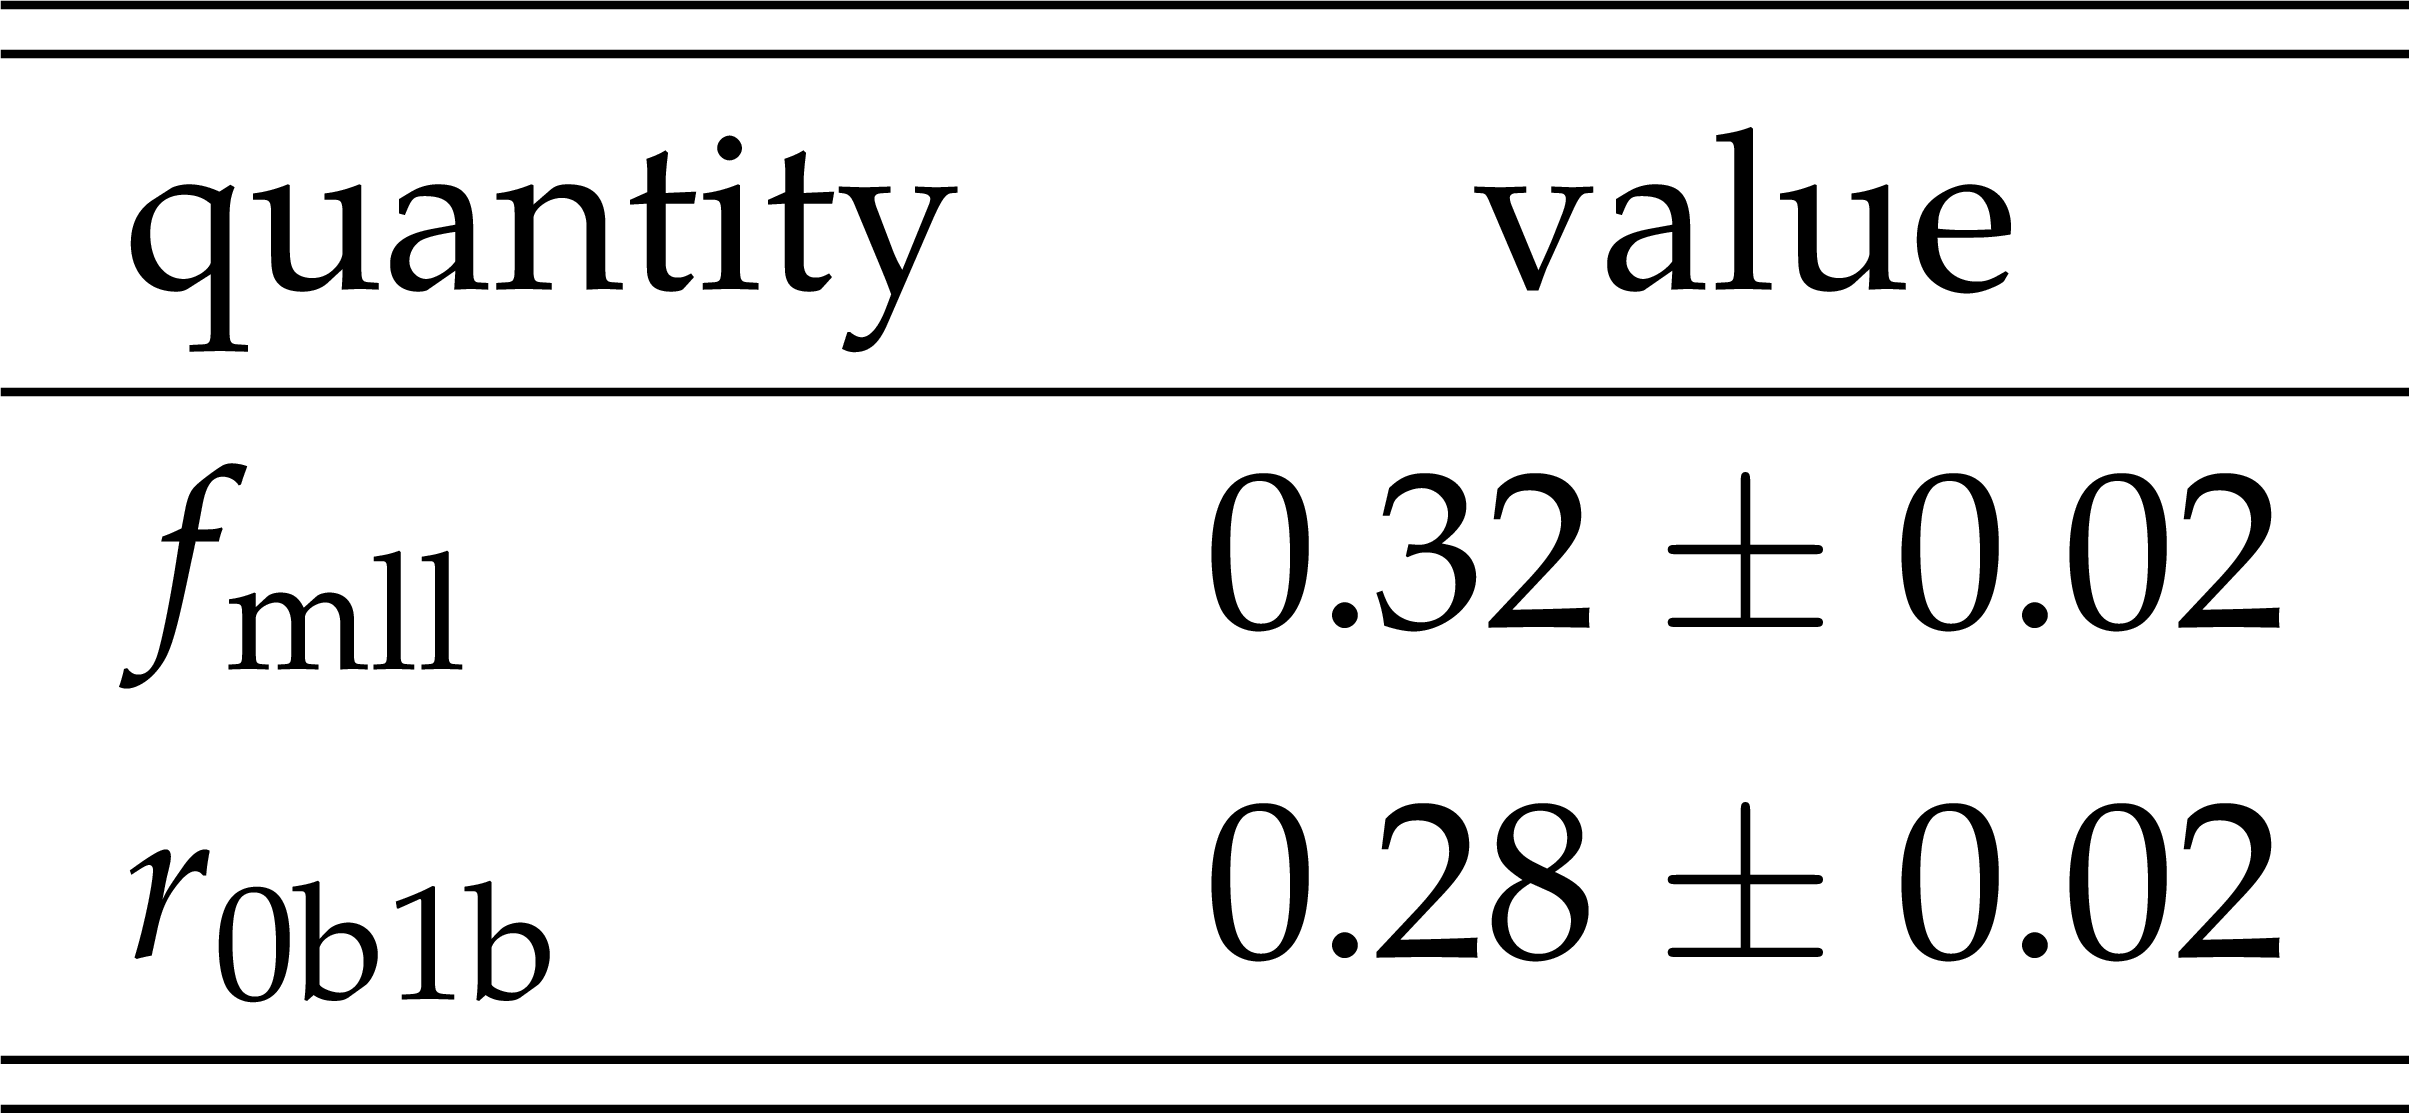
Table 2:
Measured values of $f_{\mathrm {mll}}$ and $r_{\mathrm {0b1b}}$. Values are obtained from MC simulation after validating them on collision data. |
png pdf |
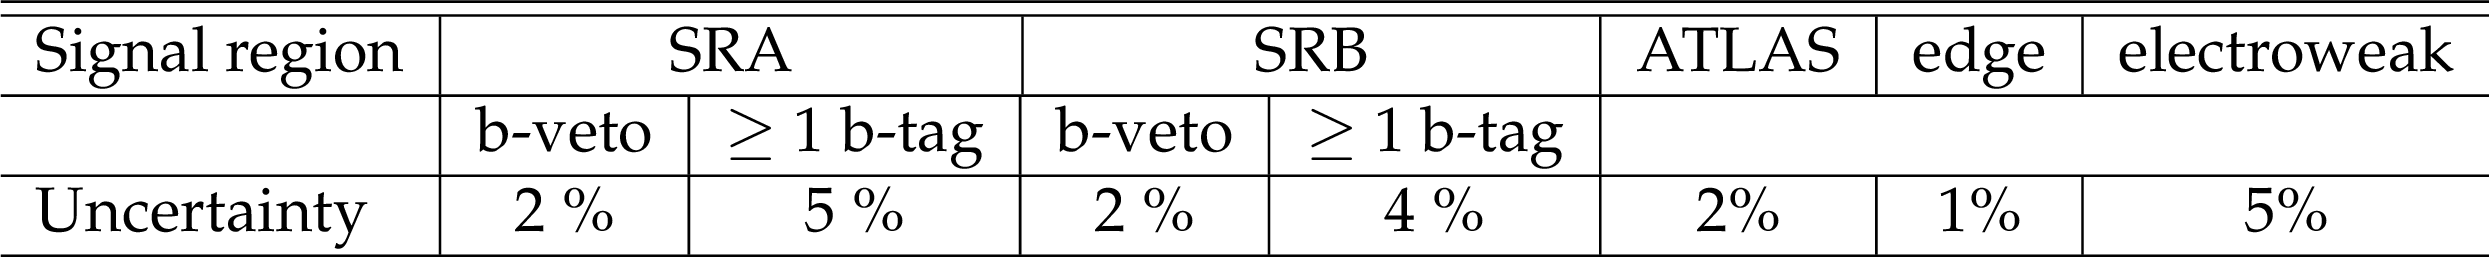
Table 3:
Statistical uncertainties in the normalization of the ${E_{\mathrm {T}}^{\text {miss}}} $ template prediction in the ${E_{\mathrm {T}}^{\text {miss}}} < $ 50 GeV range (50-100 GeV for the electroweak signal region), for each signal region. These are taken as a systematic uncertainty in the background prediction. The definitions of SRA, SRB, and ATLAS SR are found in Section 5.1 and Table 5. |
png pdf |
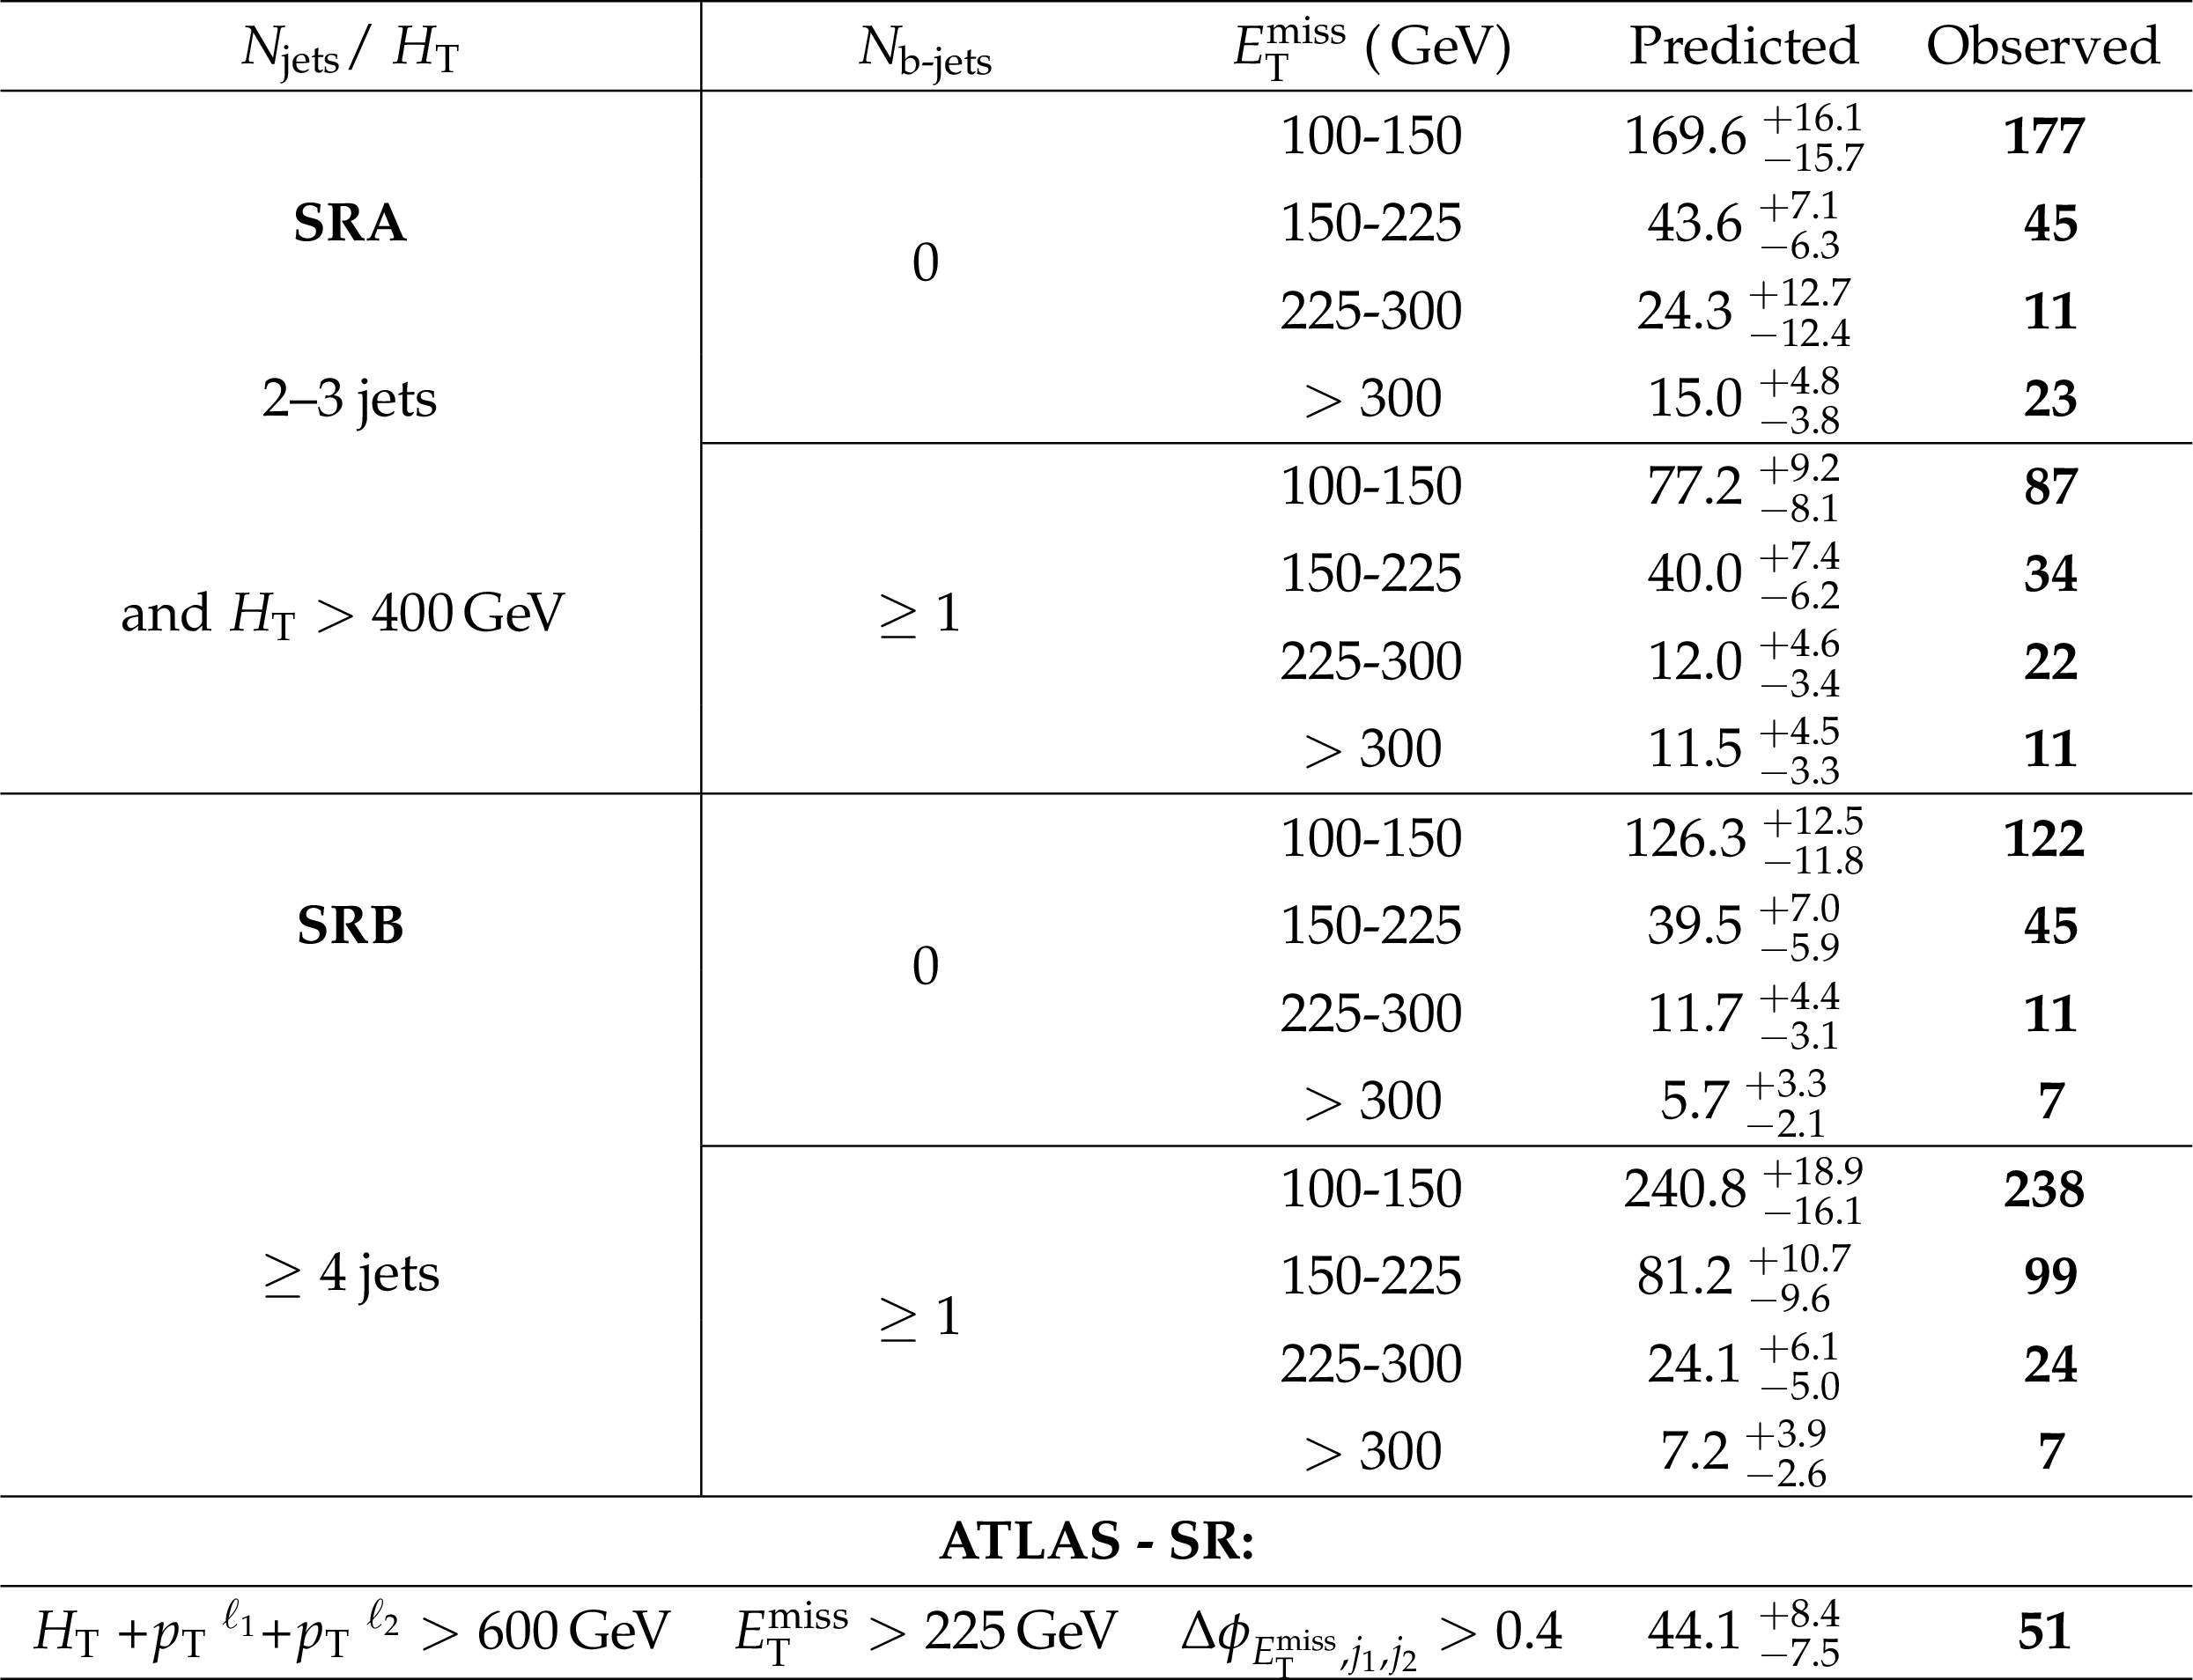
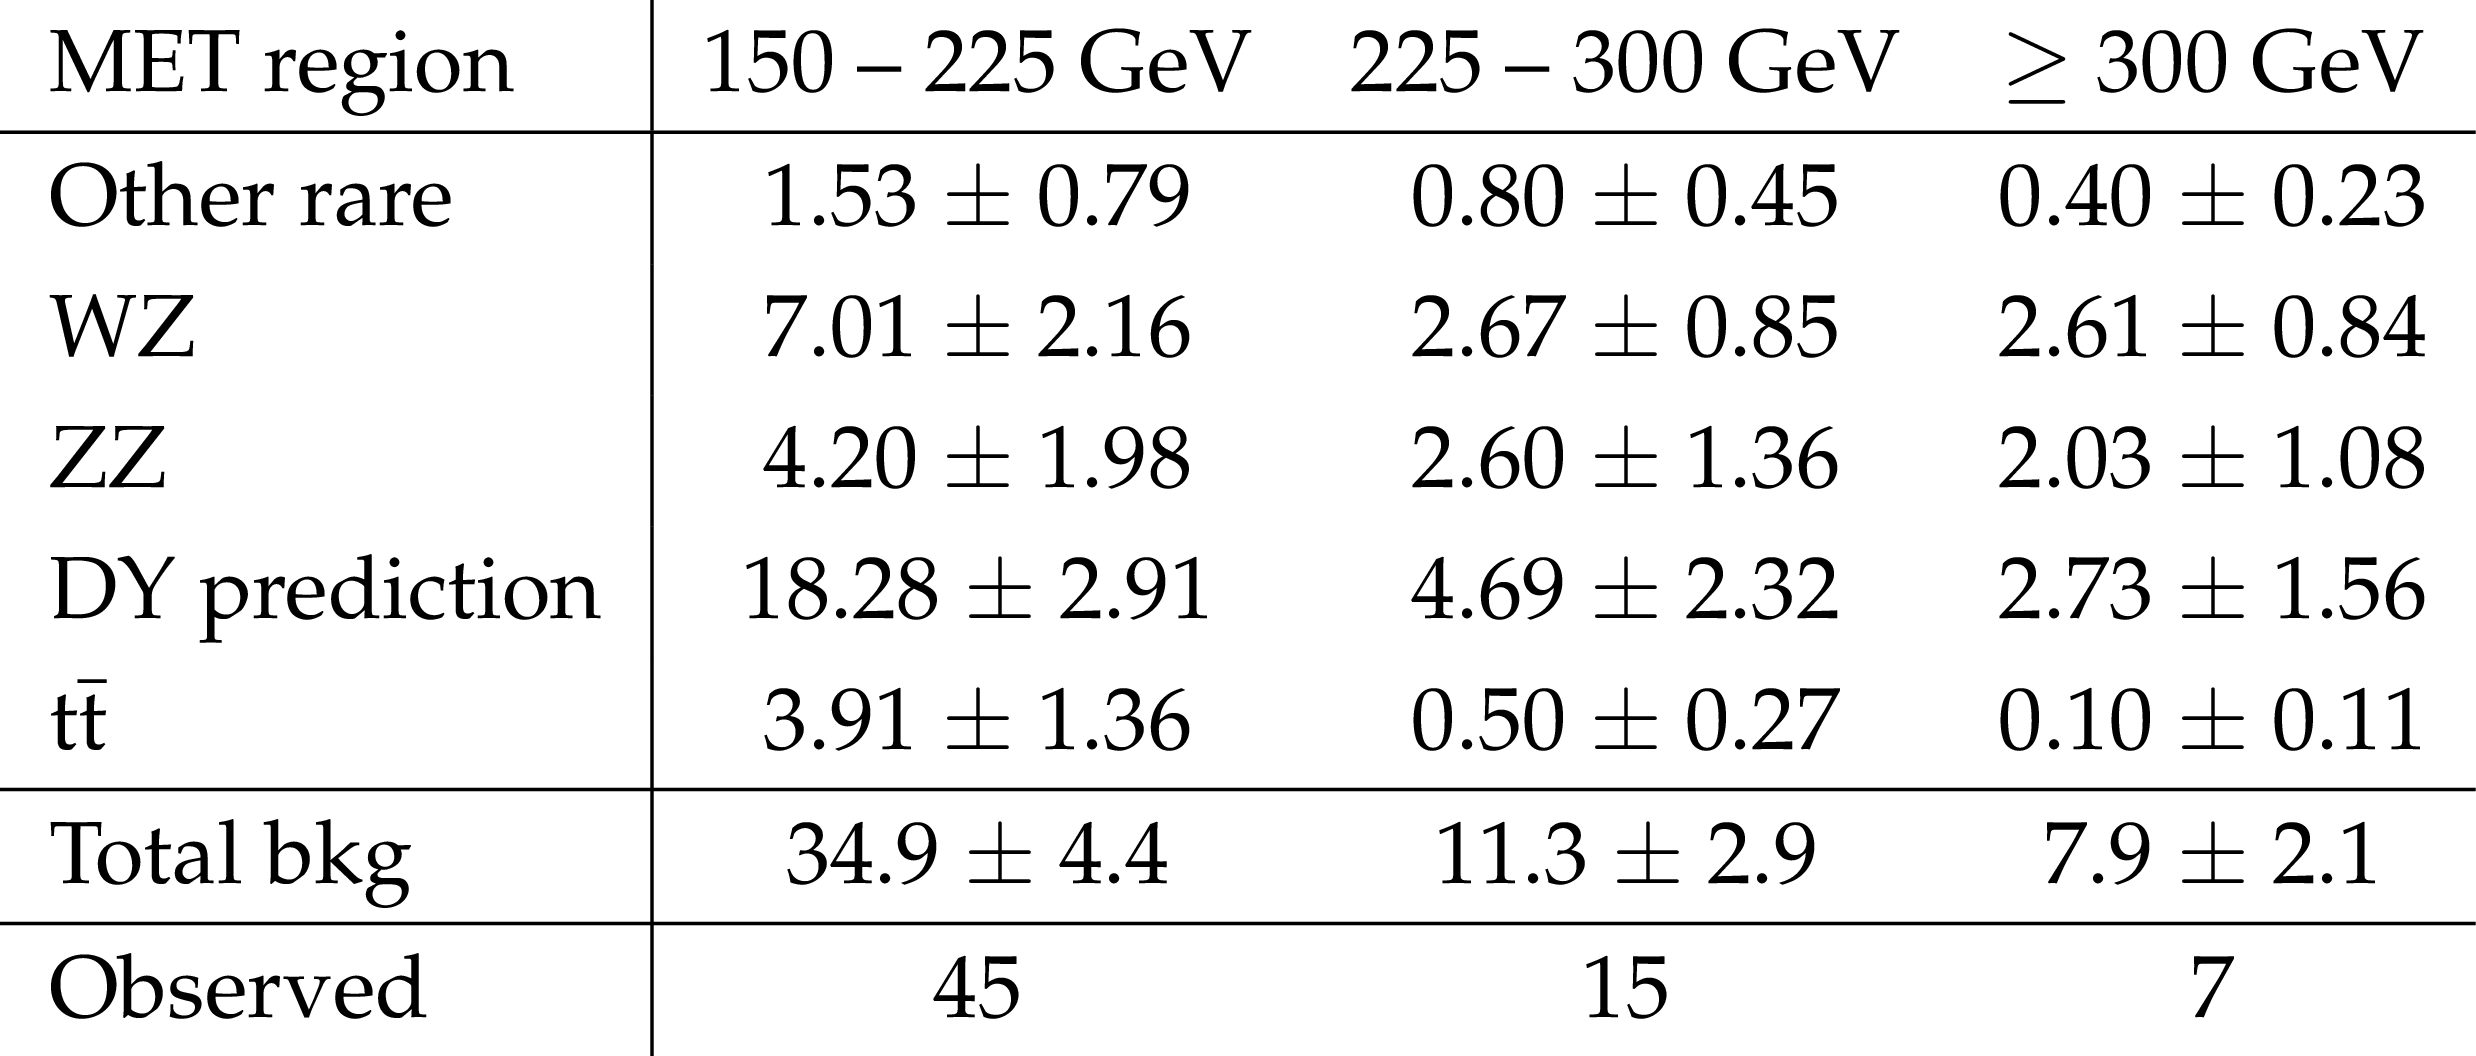
Table 5:
Results for the strong on-Z search, binned as a function of ${H_{\mathrm {T}}}$, the jet multiplicity, the b jet multiplicity, and the missing transverse momentum. In the ATLAS SR an additional requirement is imposed on the angle between the ${E_{\mathrm {T}}^{\text {miss}}}$ and the two leading jets $\Delta \phi _{ {E_{\mathrm {T}}^{\text {miss}}} ,j_1,j_2} > $ 0.4 and the $p_{\text {T}}$ thresholds of the leading (subleading) leptons are increased to 50 (25) GeV. |
png pdf |
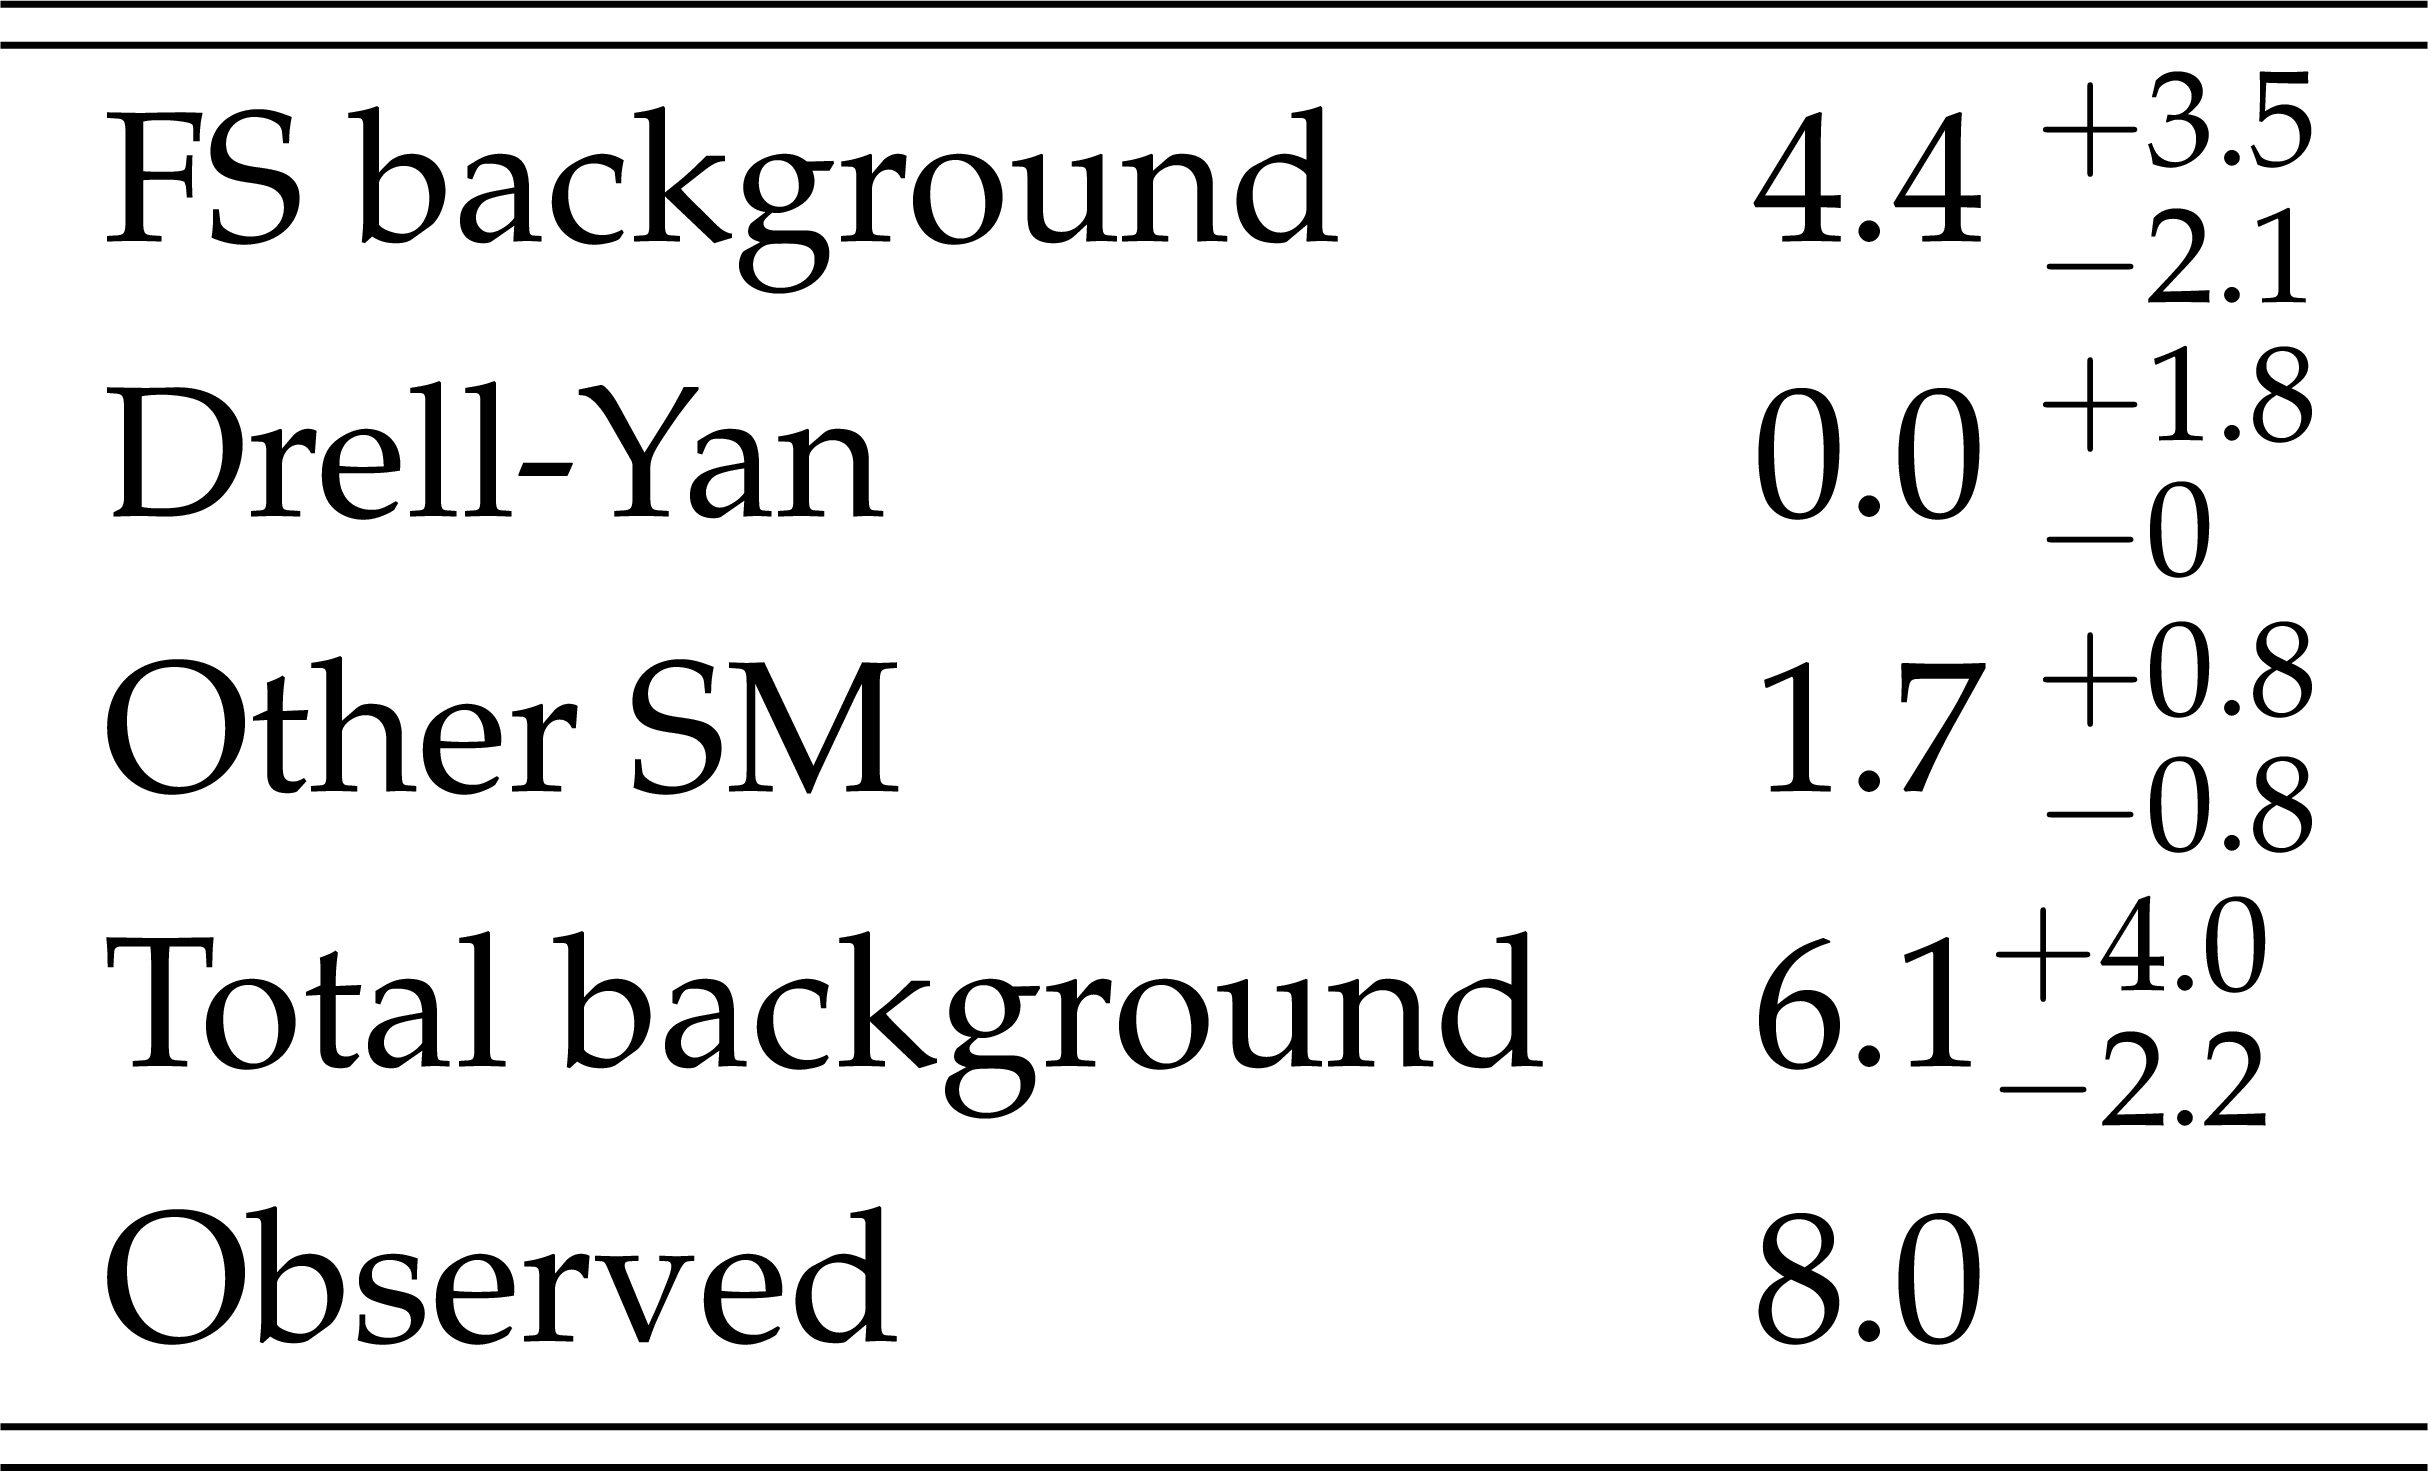
Table 6:
Results in the ATLAS signal region using the ${\mathrm {JZB}}$ DY-prediction method. |
png pdf |
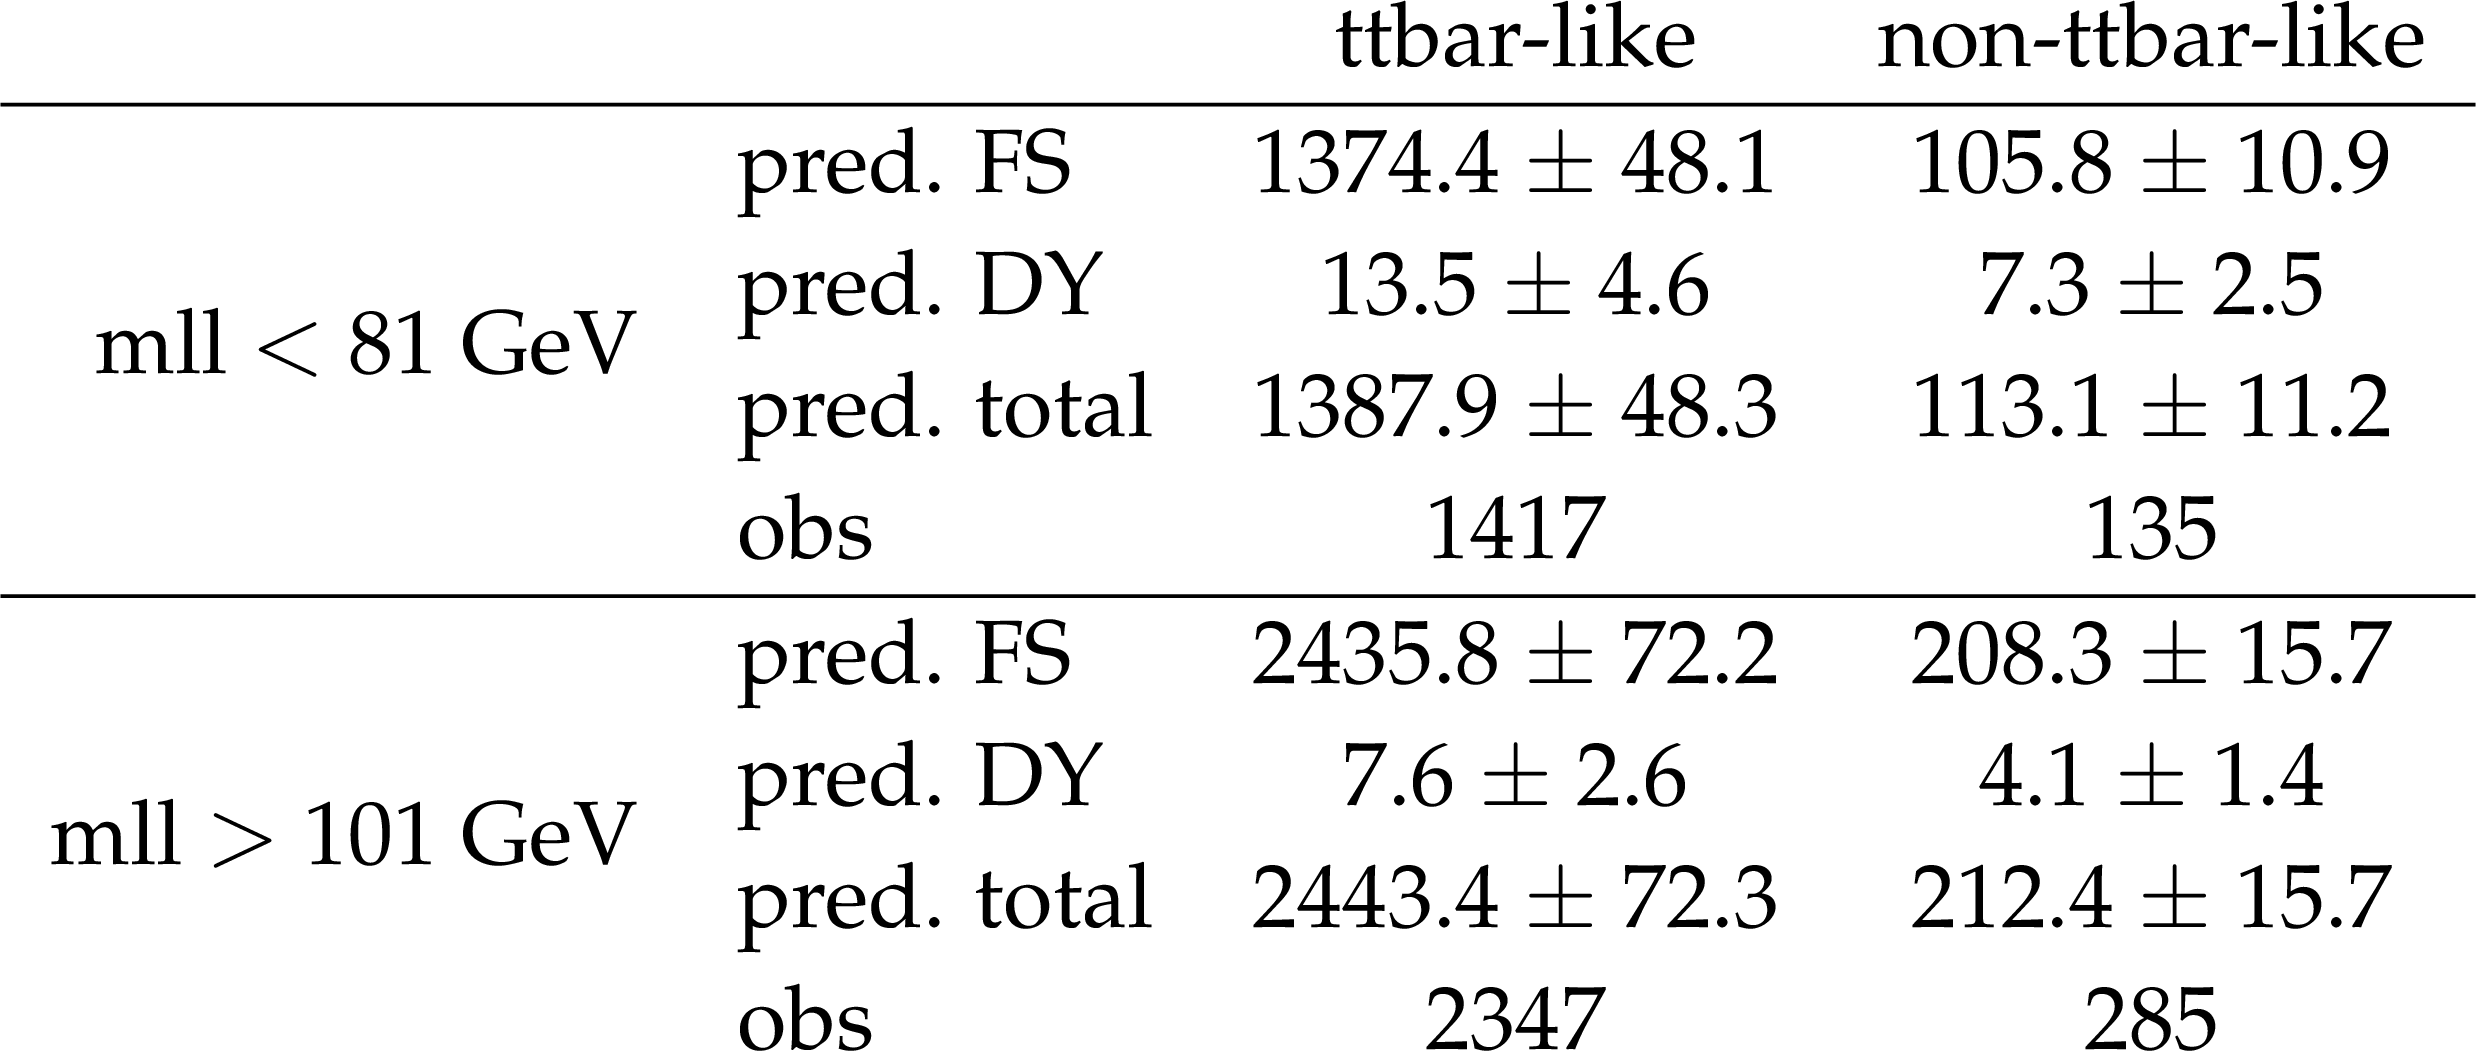
Table 7:
Predicted and observed results for the edge search in the four $m_{\ell \ell }$ versus $NLL$ regions for 12.9 fb$^{-1}$ of data. |
png pdf |
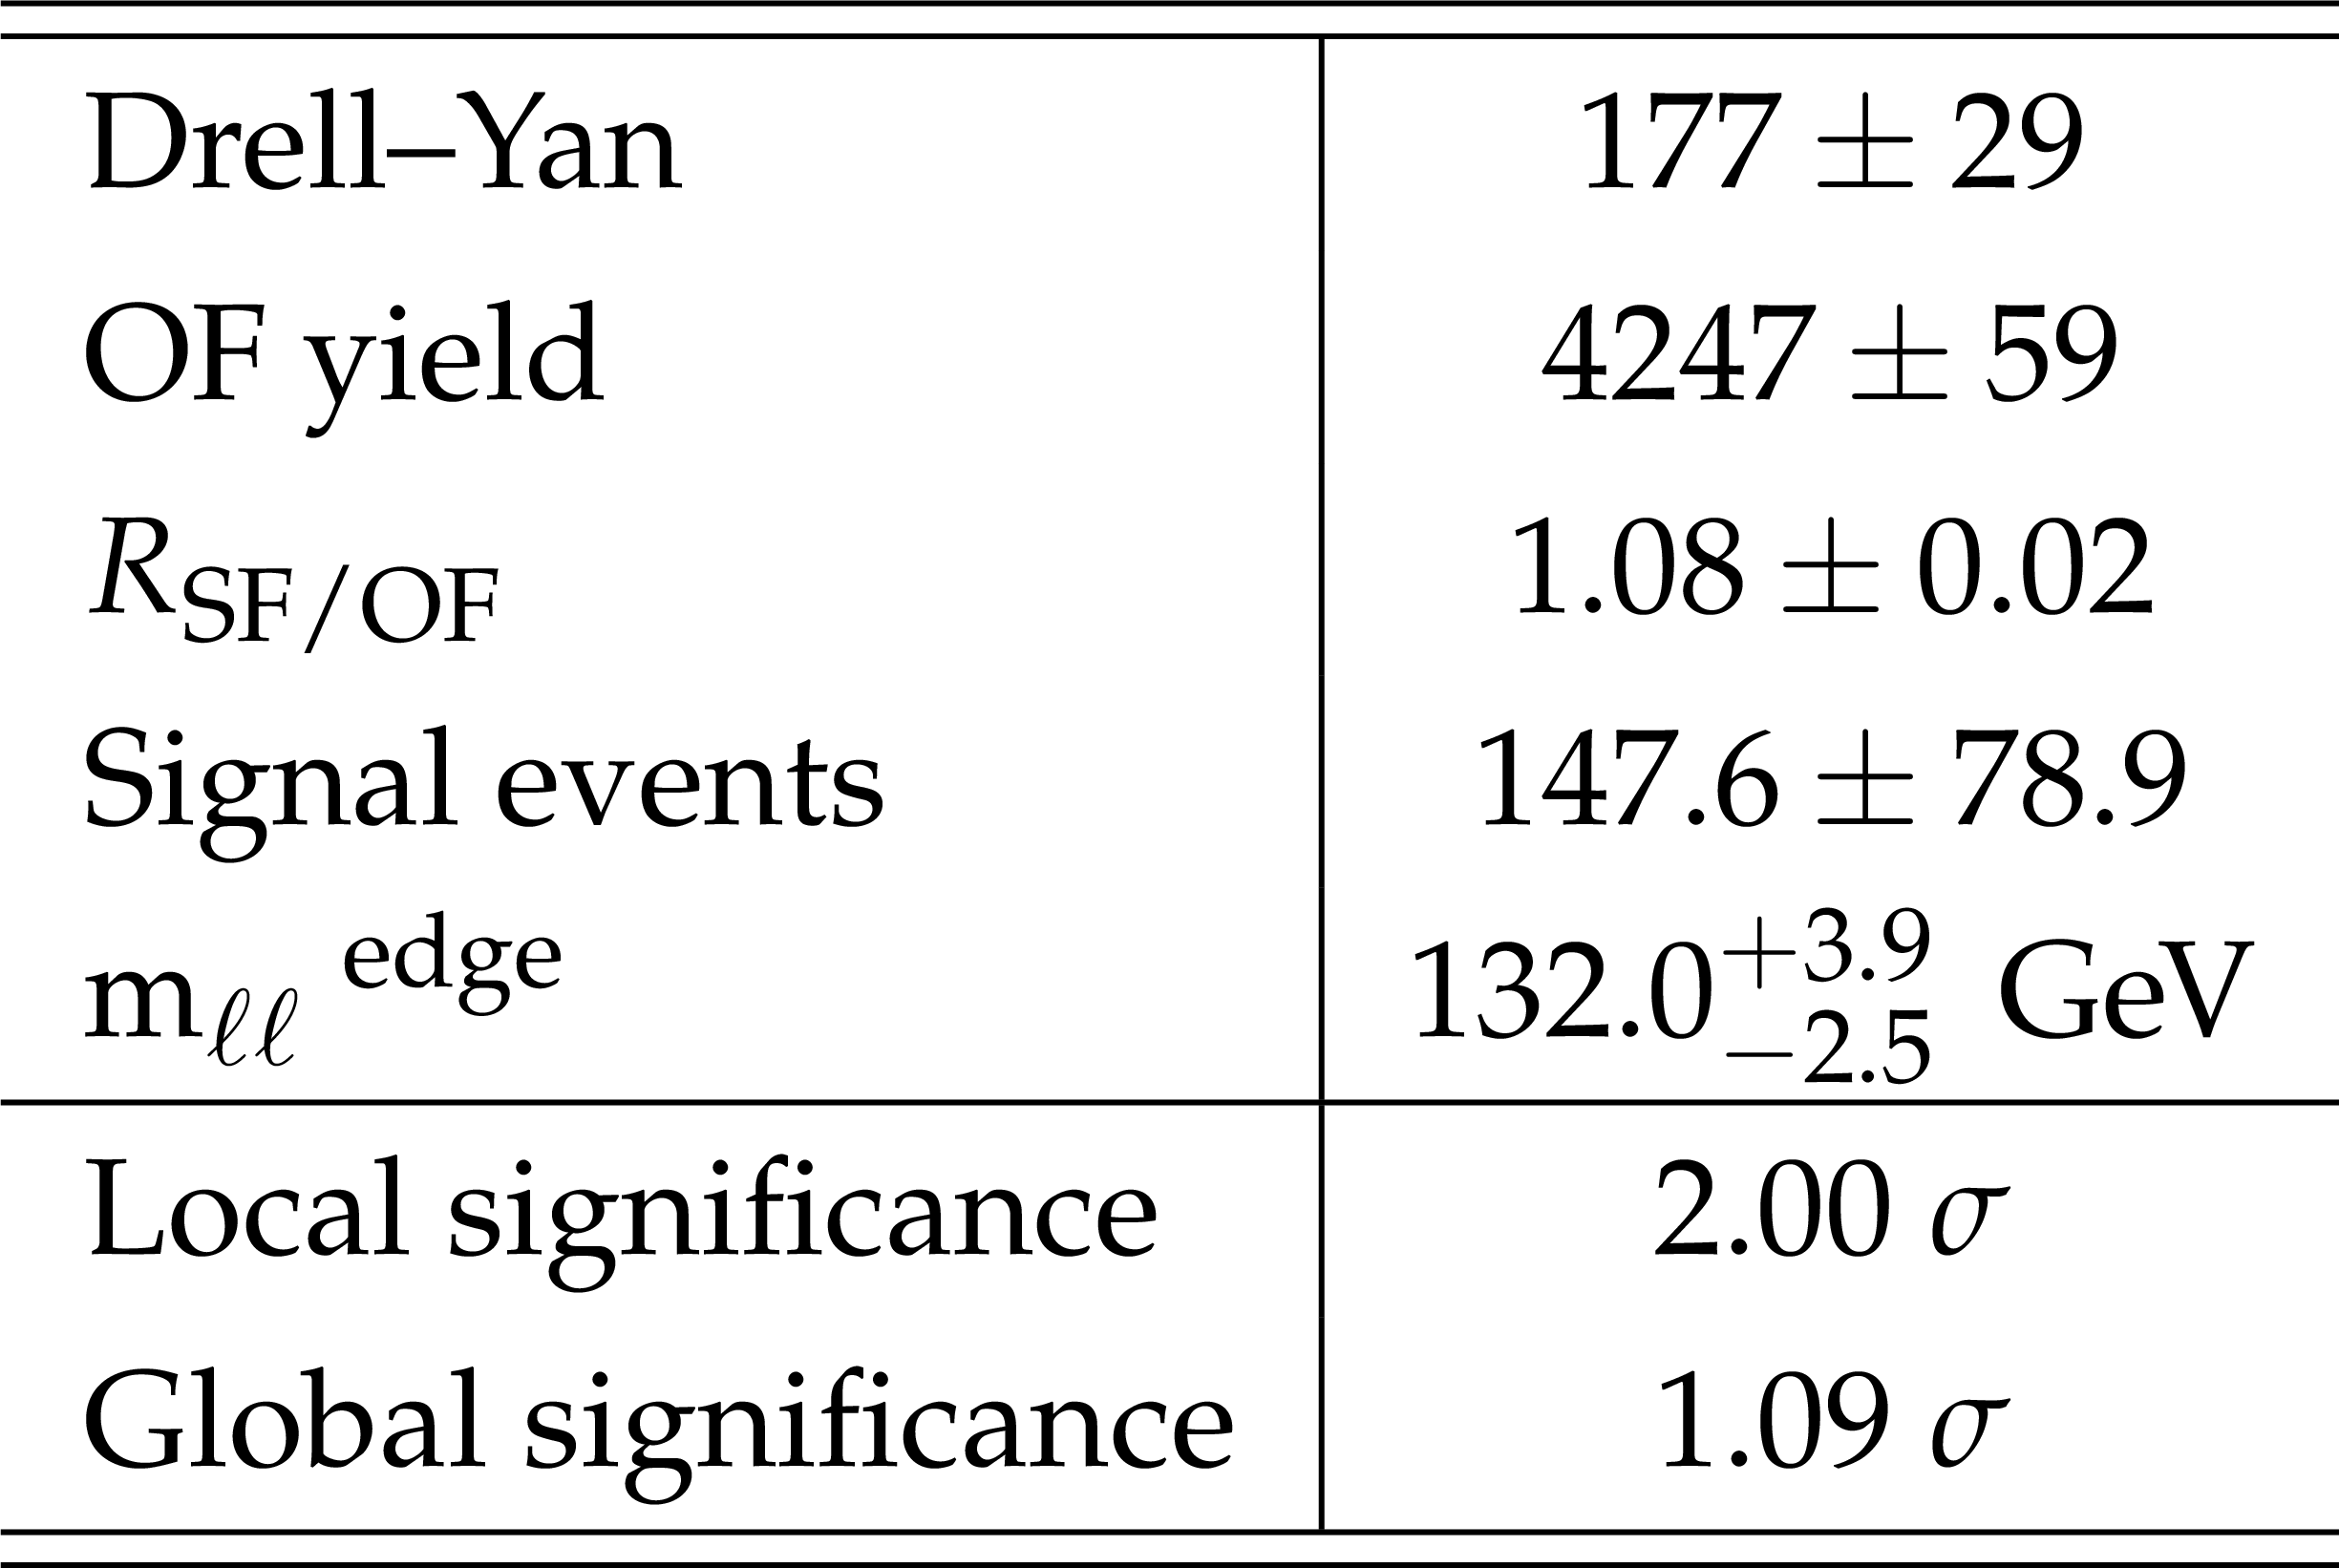
Table 8:
Results of the unbinned maximum likelihood fit for event yields in the signal region. The quoted uncertainties are calculated using the MINOS [47] program and account for both statistical and systematic sources. |
png pdf |
Table 9:
Observations and predicted background yields for the electroweak signal regions for 12.9 fb$^{-1}$. |
png pdf |
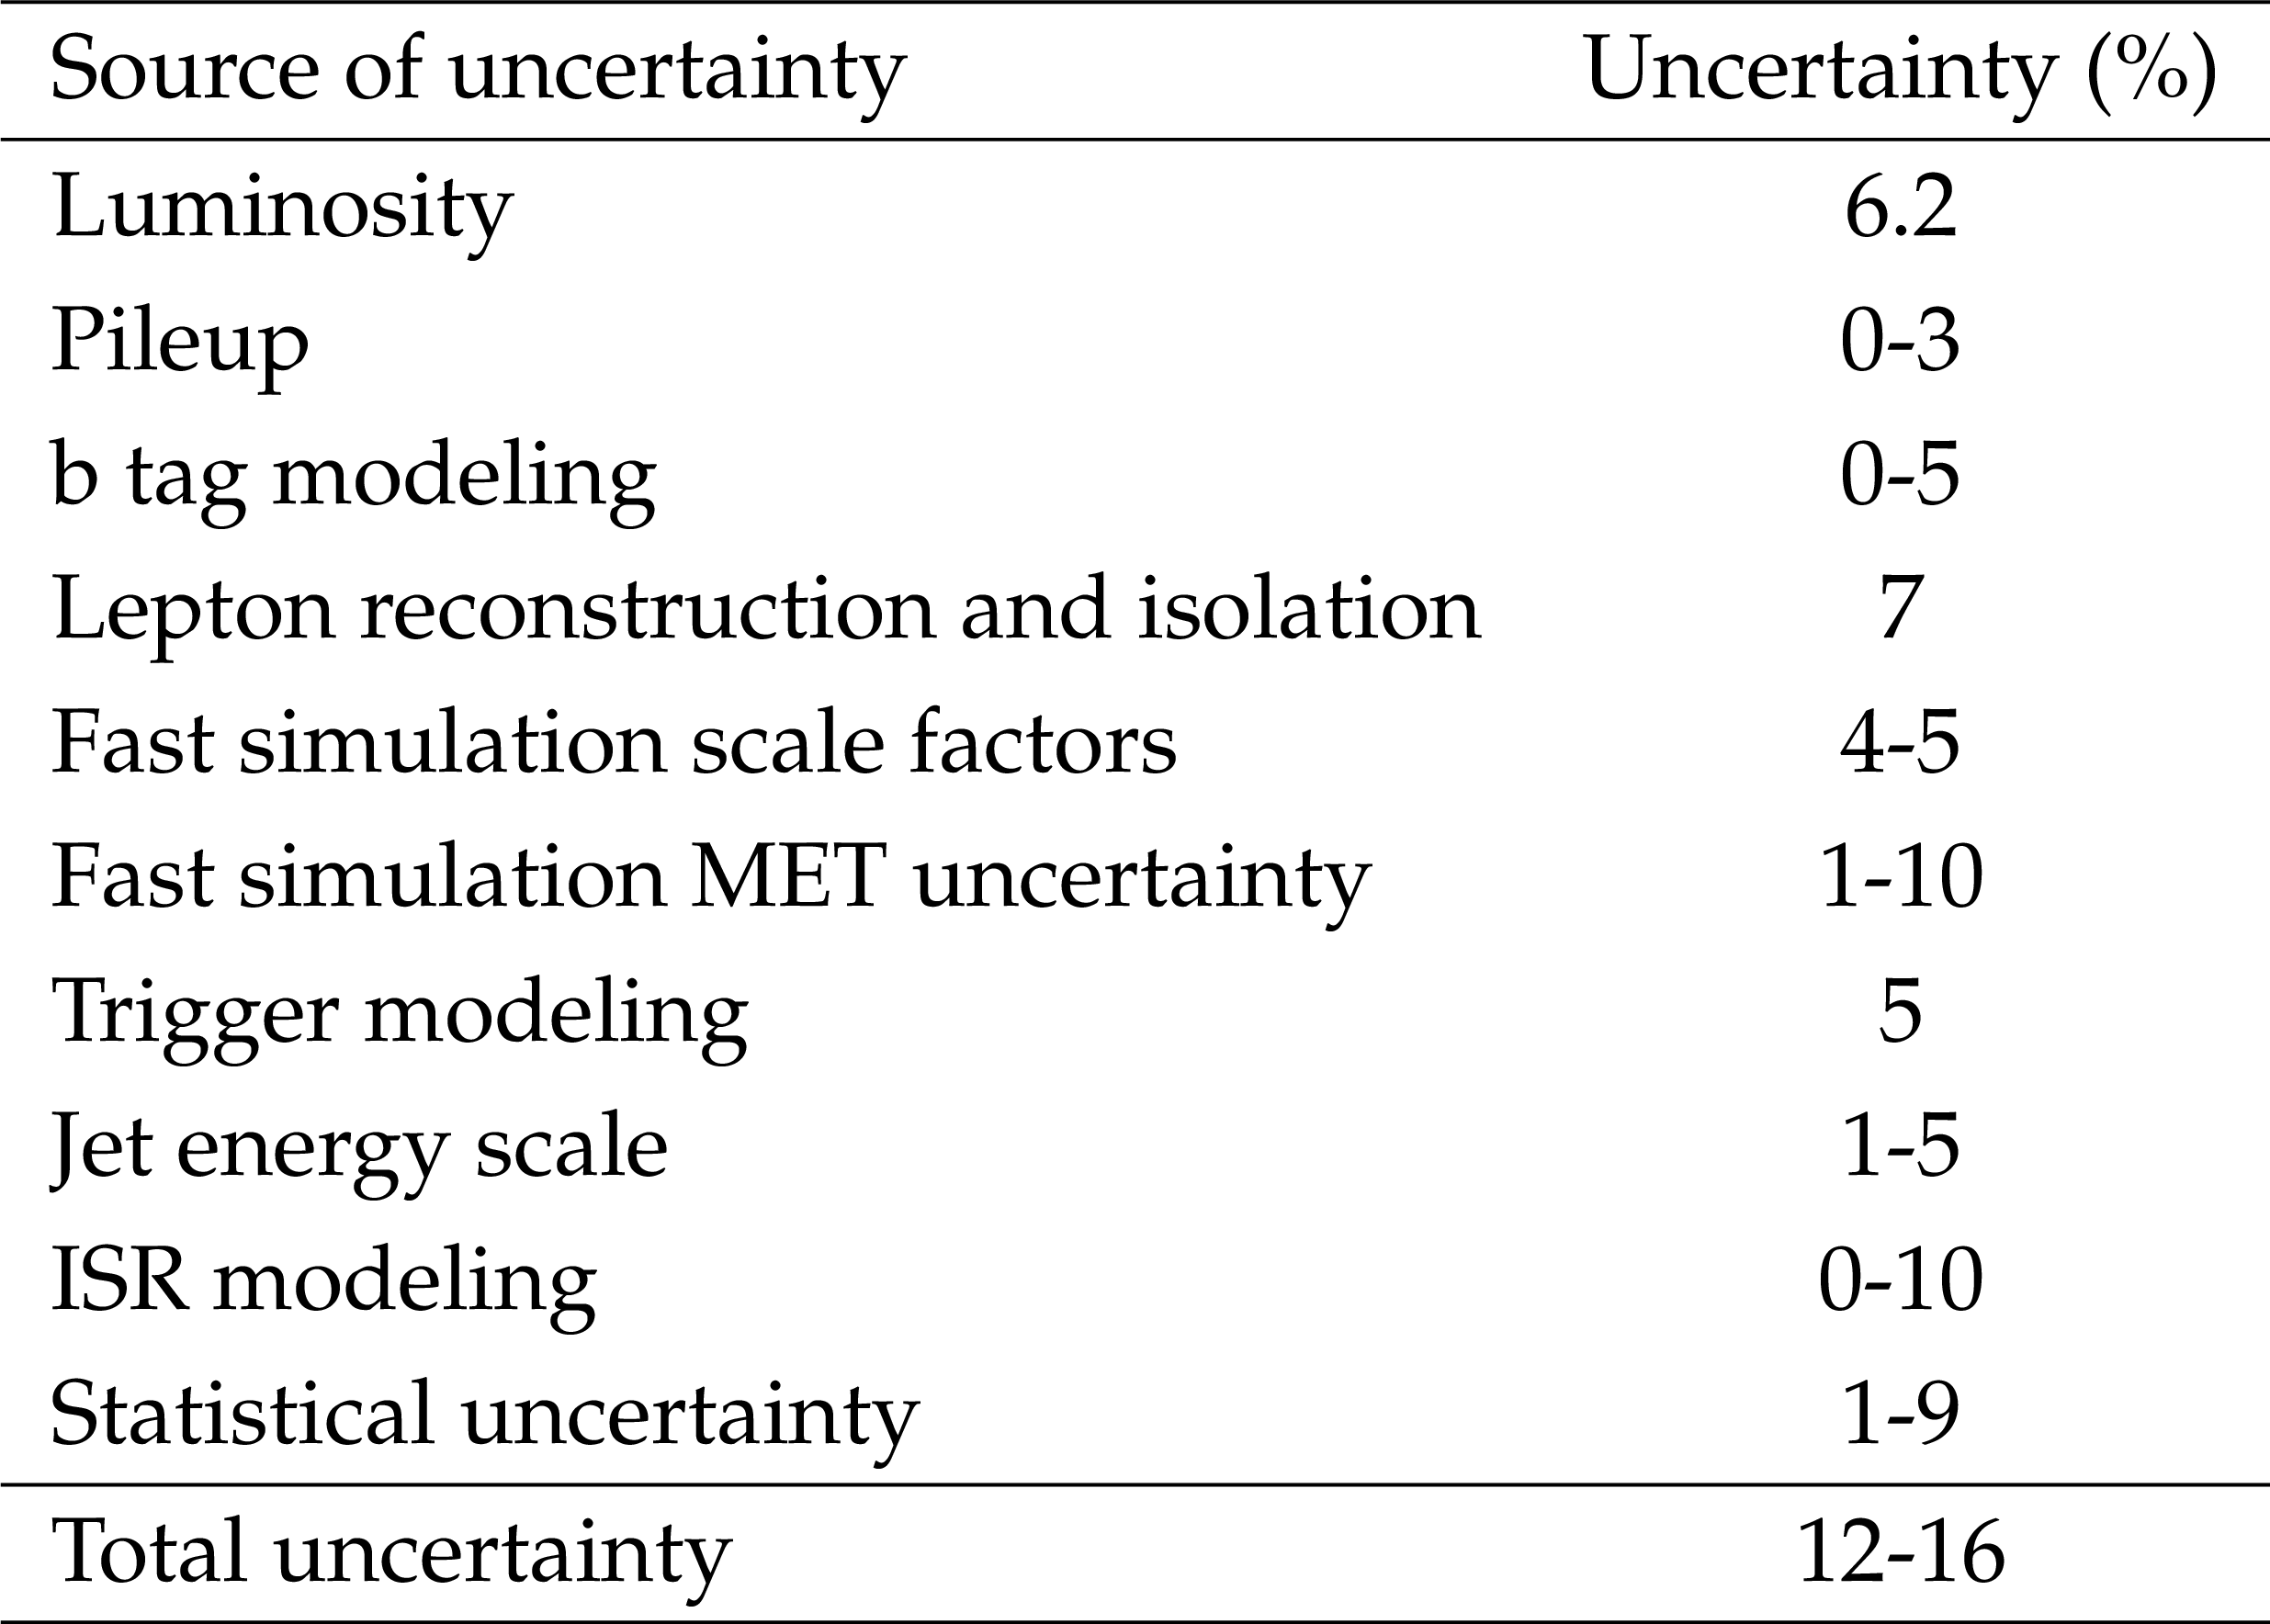
Table 10:
List of systematic uncertainties taken into account for the signal yields and typical values. |
| Summary |
| A search for physics beyond the standard model has been presented in the opposite-sign, same-flavor lepton; jets; and $E_{\mathrm{T}}^{\text{miss}}$ final state using a data sample of pp collisions collected with the CMS detector in 2016 at a center-of-mass energy of 13 TeV, corresponding to an integrated luminosity of 12.9 fb$^{-1}$. Searches are performed for signals that either produce a kinematic edge in the dilepton invariant mass, or use dilepton systems whose invariant mass is compatible with the decay of a Z boson. Comparing the observation to estimates for SM backgrounds obtained from data control samples, no statistically significant evidence for a signal has been observed. The search for strongly produced new physics containing an on-shell Z boson is interpreted in a model of gauge-mediated supersymmetry breaking, where the Z bosons are produced in decay chains initiated through gluino pair production, and where the branching ratios have been fixed to 100% to produce the desired topology. Gluino masses below 1300 TeV for high and low neutralino masses, and 1500 TeV for medium neutralino masses have been excluded, extending the previous exclusion limits derived from a similar analysis at 13 TeV by almost 200 GeV. The search for an edge-like kinematic feature is interpreted in a simplified model based on bottom squark pair production, where dilepton mass edges are produced in decay chains containing the two lightest neutralinos and a slepton, where again the branching ratios have been fixed to produce the desired topology. Bottom squark masses below 800 and 625 GeV have been excluded, depending on the ${{\tilde{\chi}^0_2}} $ mass. These limits extend previous exclusion limits by about 150 GeV depending also on the ${{\tilde{\chi}^0_2}} $ mass. The electroweak search has been interpreted in simplified models of chargino-neutralino production and neutralino-neutralino production where the neutralino decays to a Z boson and the LSP and the chargino decays to a W boson and the LSP. The search is sensitive to neutralino and chargino masses between 200 GeV and about 330 GeV, however due to a slight excess of the observation over the predicted estimates, the observed limit does not exclude any mass in the considered range. The two event selections where excesses of 2.6 and 3.0$\sigma$ significance had been observed by the CMS and ATLAS collaborations in their respective 8 TeV results have been explored finding good agreement between the observation and the background prediction estimates. |
| Additional Figures | |
png pdf |
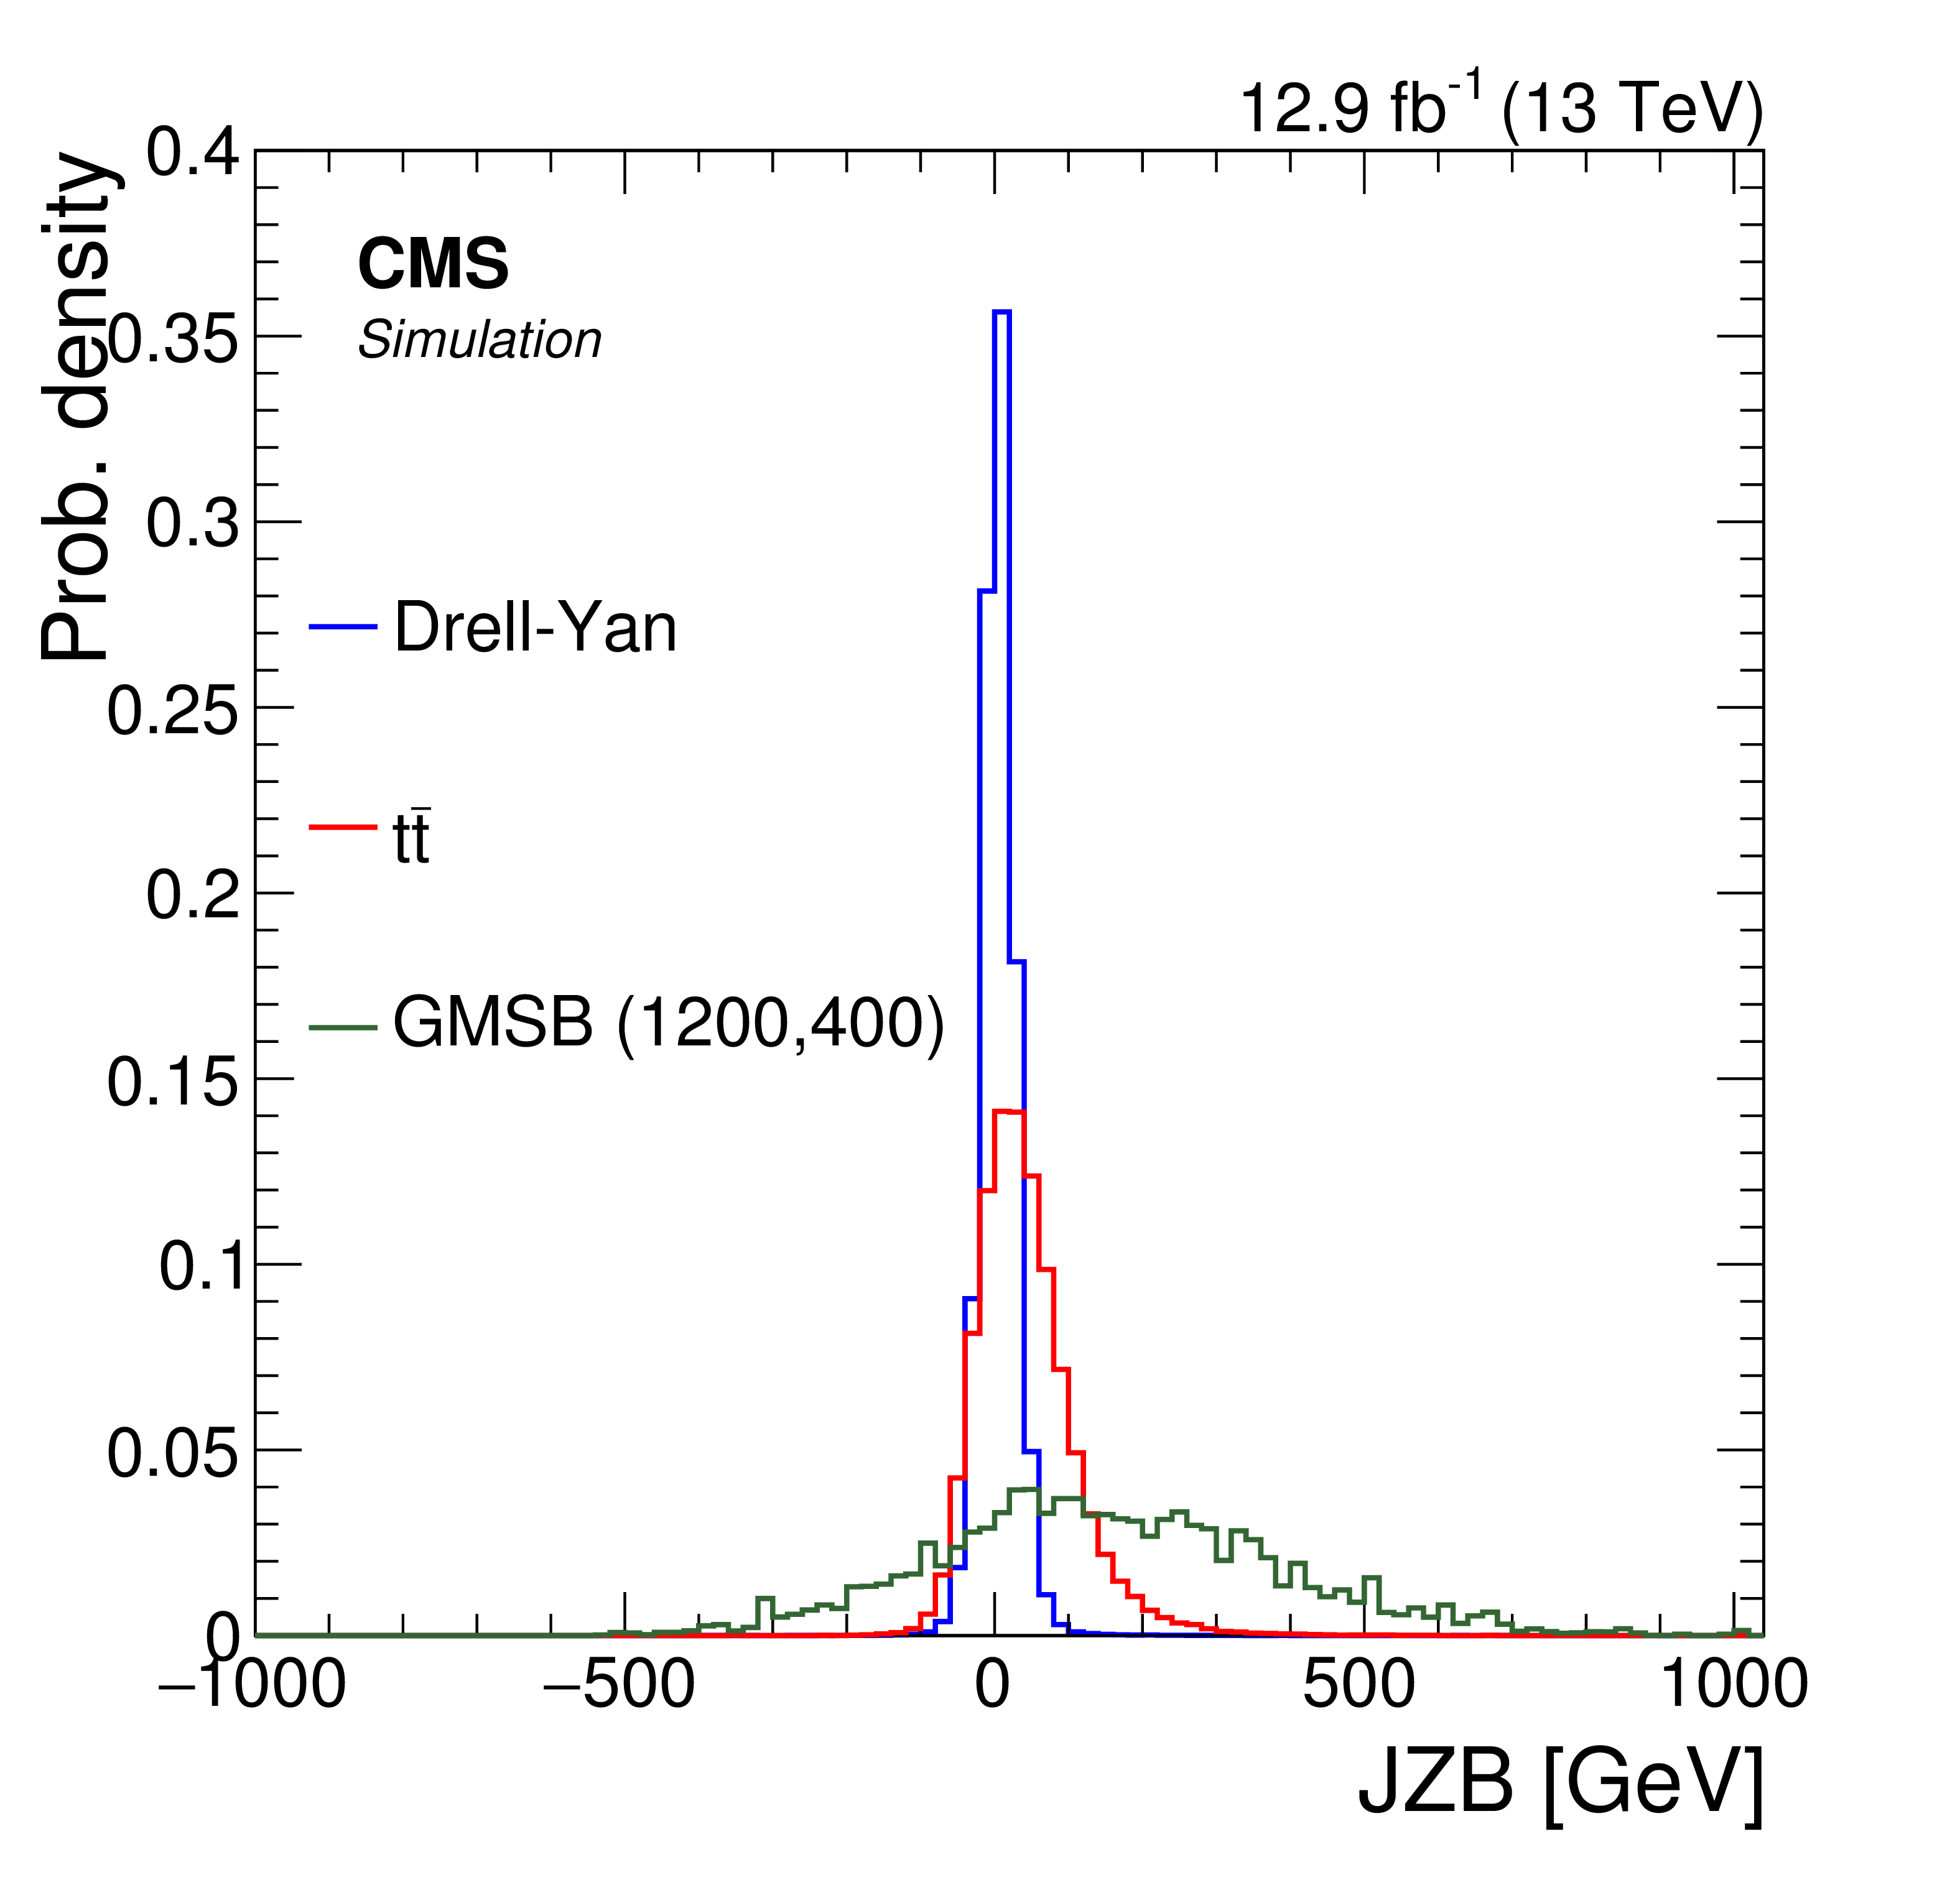
Additional Figure 1:
The JZB distribution is shown for the DY+jets process, the top-antitop production process, and for a signal point corresponding to the GMSB scenario. The JZB variable is distributed symmetrically around the center for the DY+jets process, while the other two processes, containing genuine $ {E_{\mathrm {T}}^{\text {miss}}} $, shift to higher values of this variable. |
png pdf |
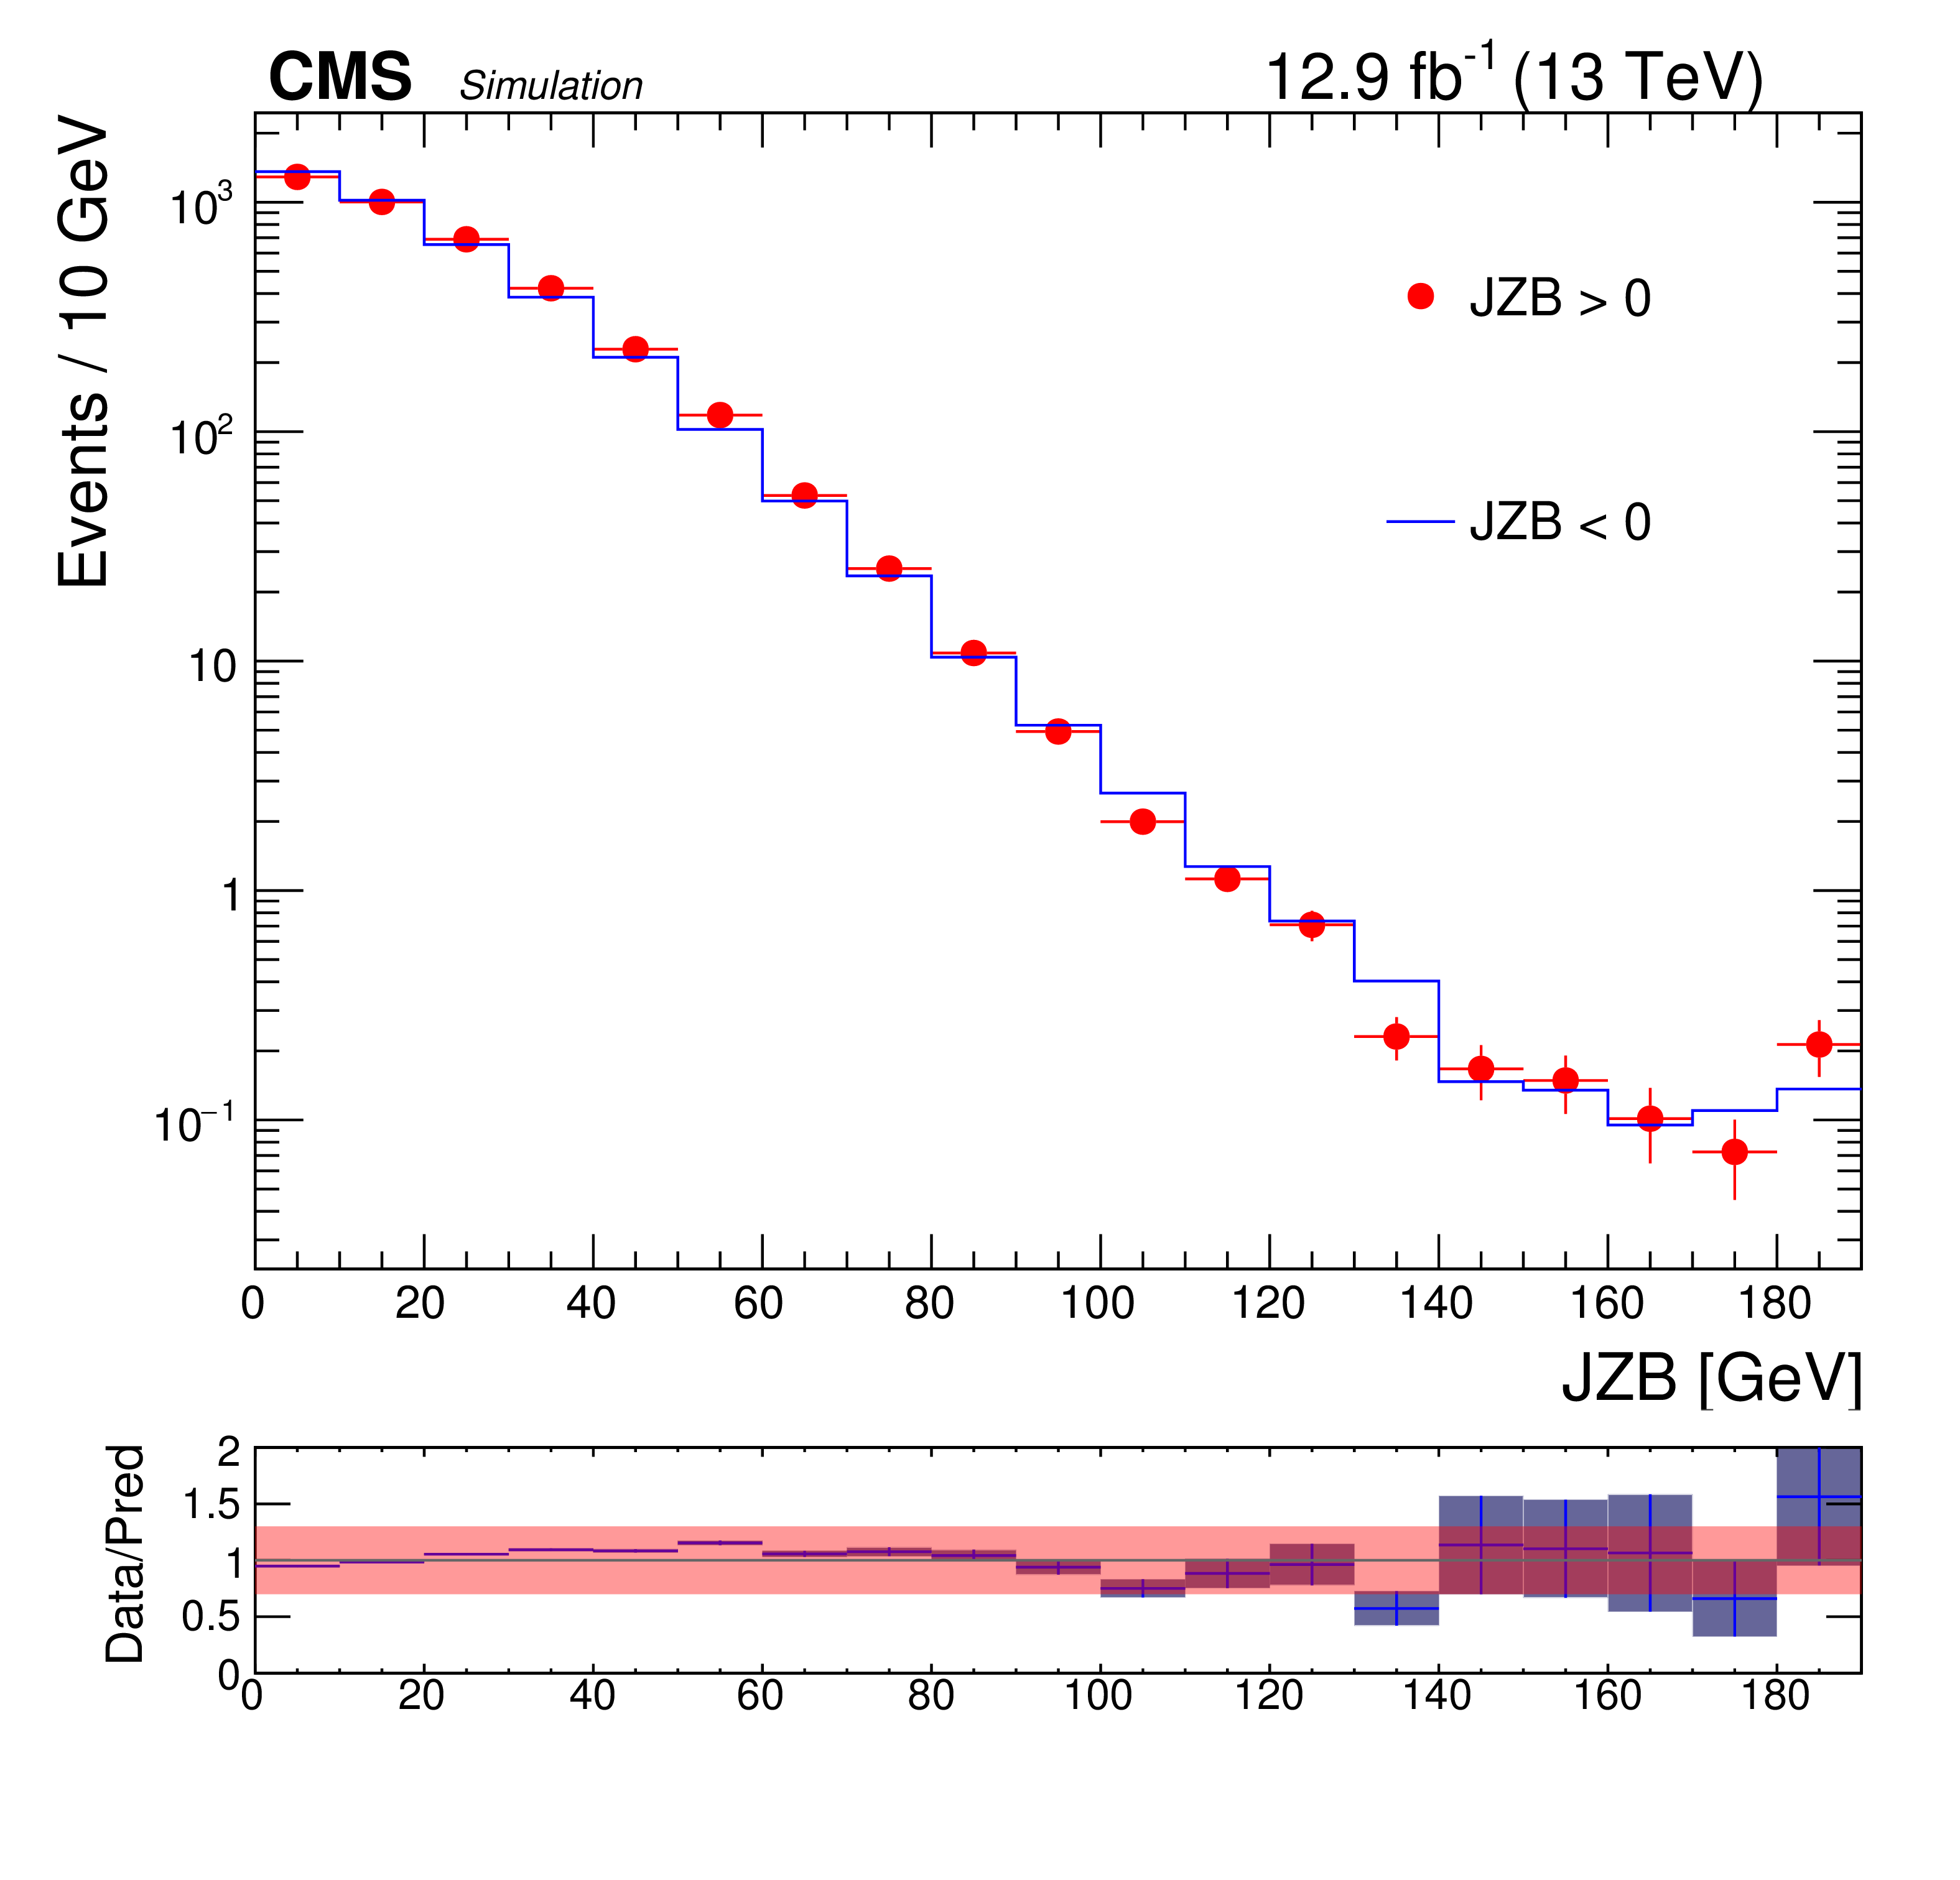
Additional Figure 2:
The observed JZB distribution for the signal region (JZB $>$ 0) is confronted with the prediction from the control region (JZB $<$ 0) for simulated events with DY+Jets and other processes with a Z boson. The lower panel shows the ratio between both distributions. The solid blue boxes indicate the statistical uncertainty on the ratio. A 30% systematic uncertainty (red band) has been assessed to this method to cover residual differences in the tails of the distribution. |

png pdf |
Additional Figure 3:
The observed JZB distribution for the signal region (JZB $>$ 0) is confronted with the prediction from the control region (JZB $<$ 0) for simulated events including all SM backgrounds. The FS background prediction is obtained from different flavor events and corrected for efficiency differences. The remaining rare SM backgrounds are obtained from MC simulation. The uncertainty in the ratio plot includes both the systematic and statistical uncertainties for the background prediction. |
png pdf |
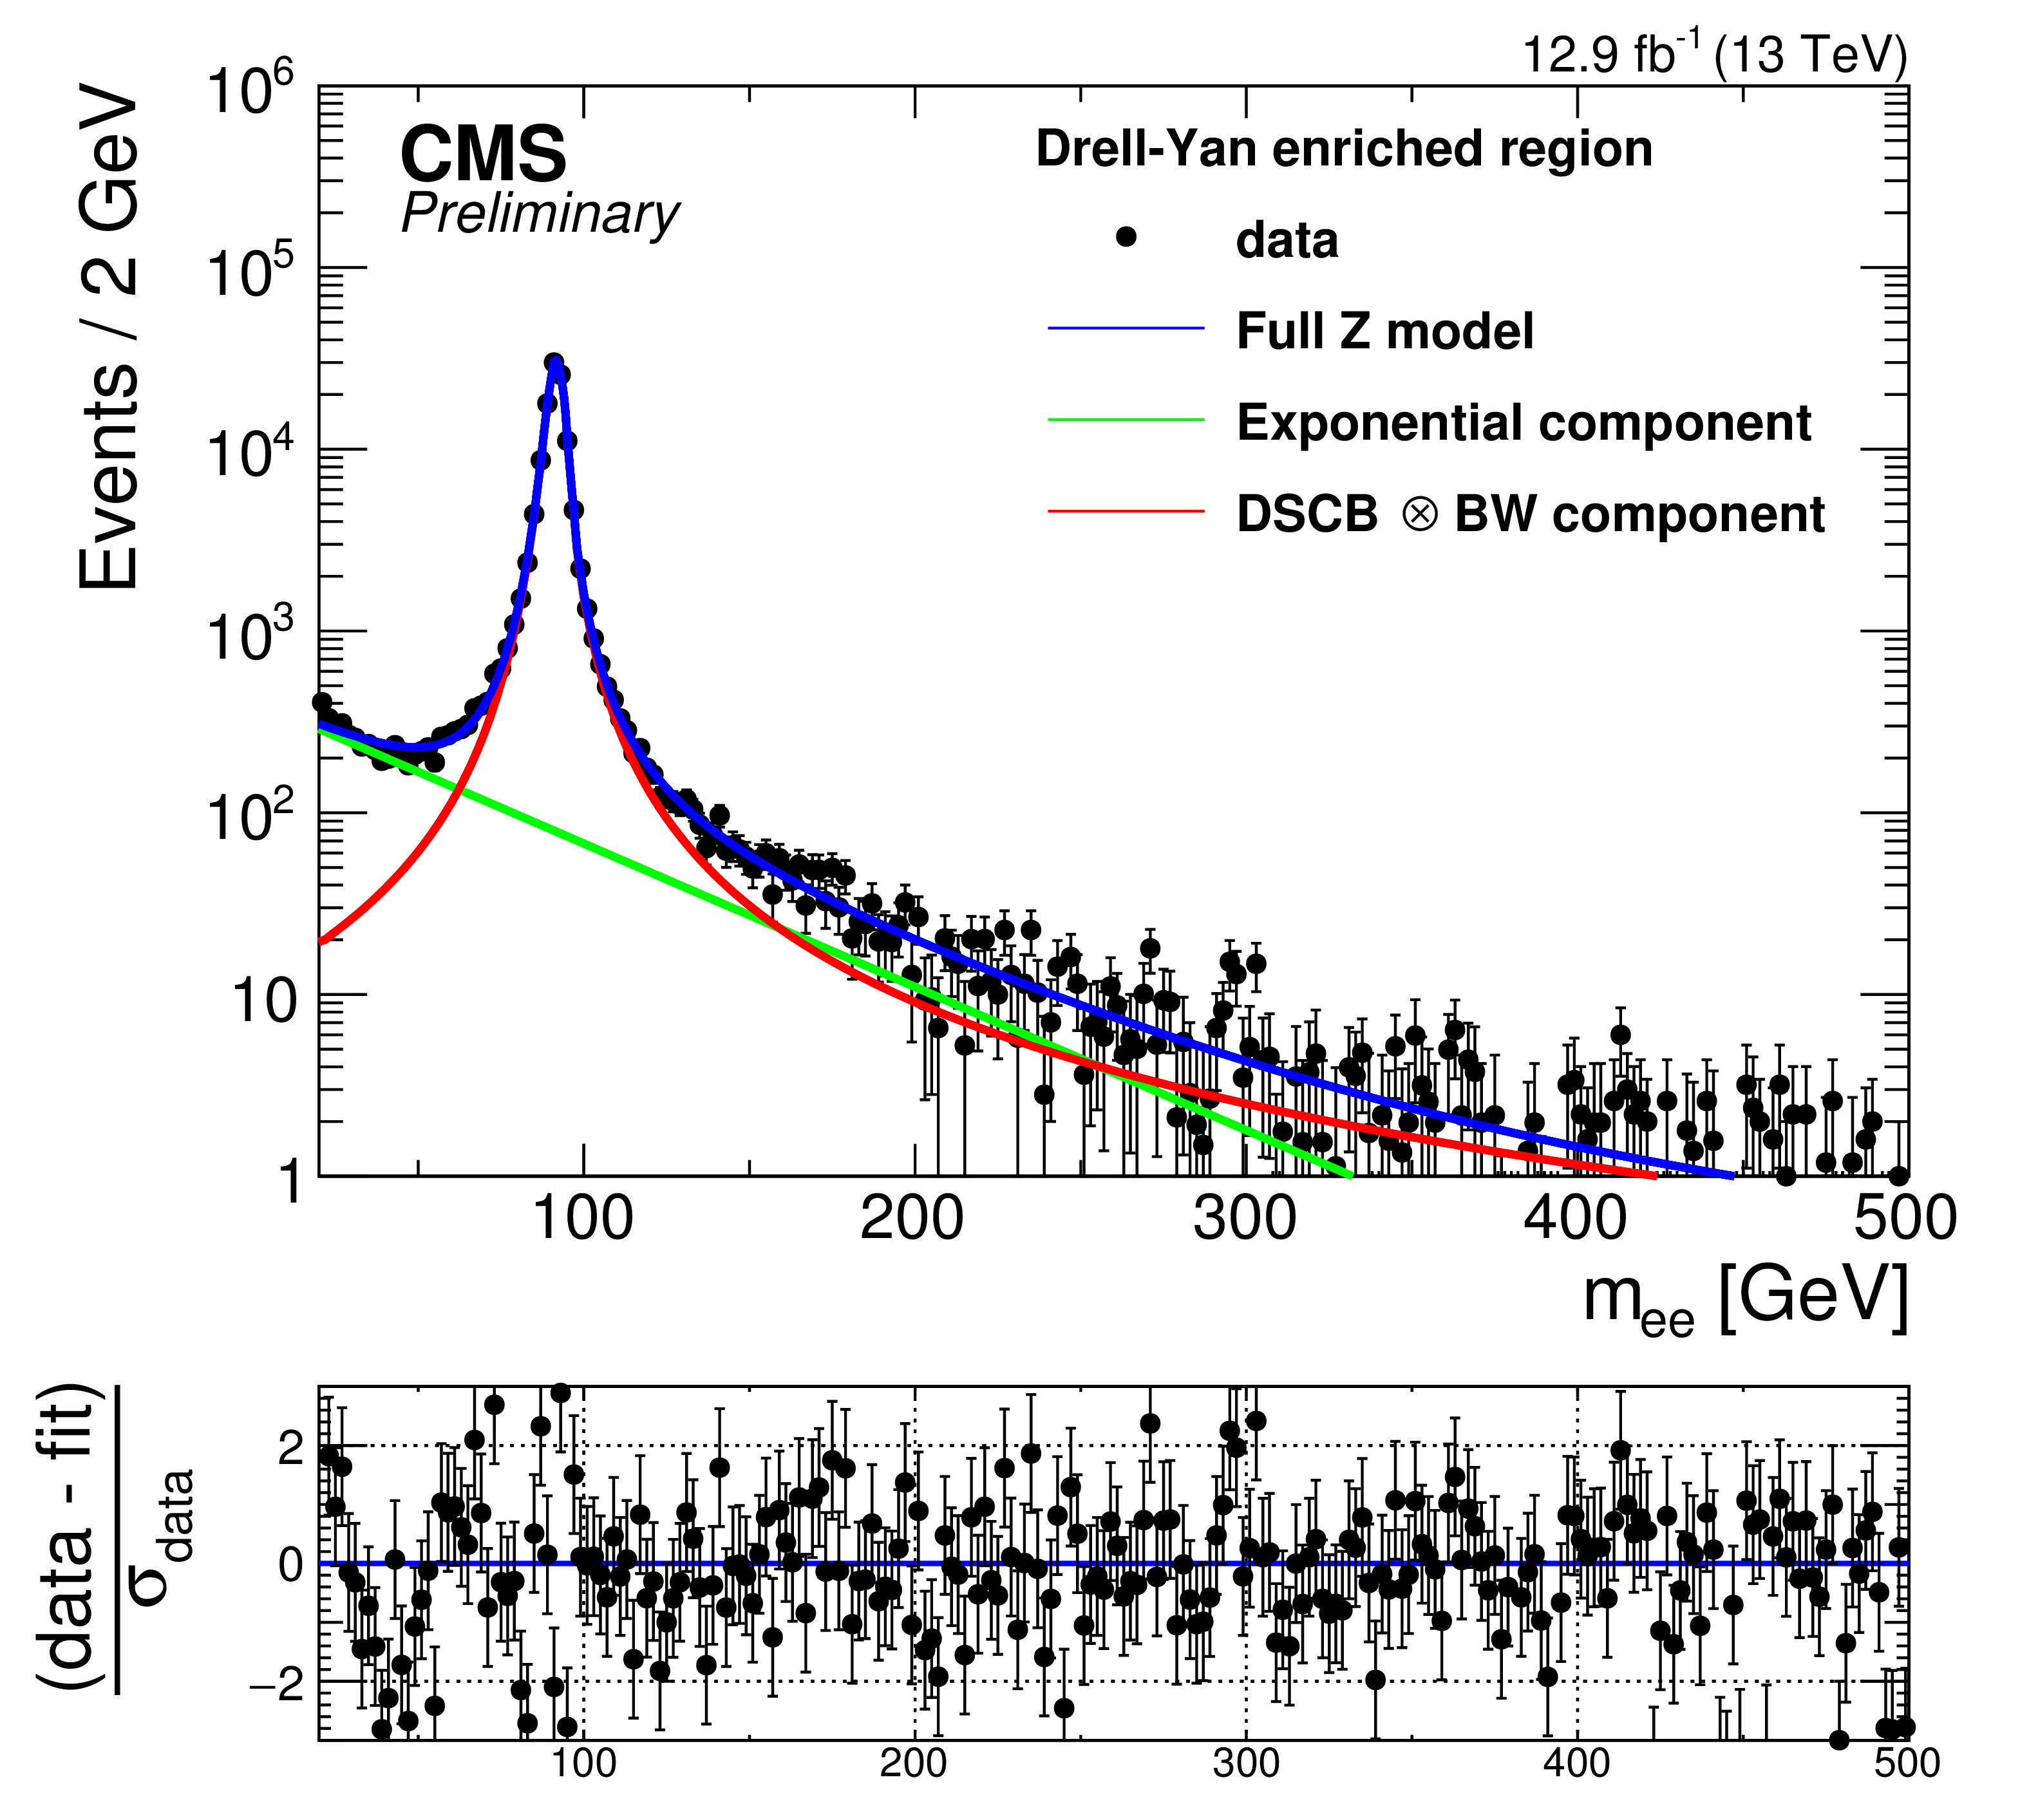
Additional Figure 4-a:
Fitted shape for backgrounds containing a Z boson for dielectron events (a) and dimuon events (b). The fitted shape consists of an exponential (green) and a Breit-wigner convolved with a double-sided Crystal-Ball (red), whose sum (blue) describes the backgrounds containing a Z boson. |
png pdf |
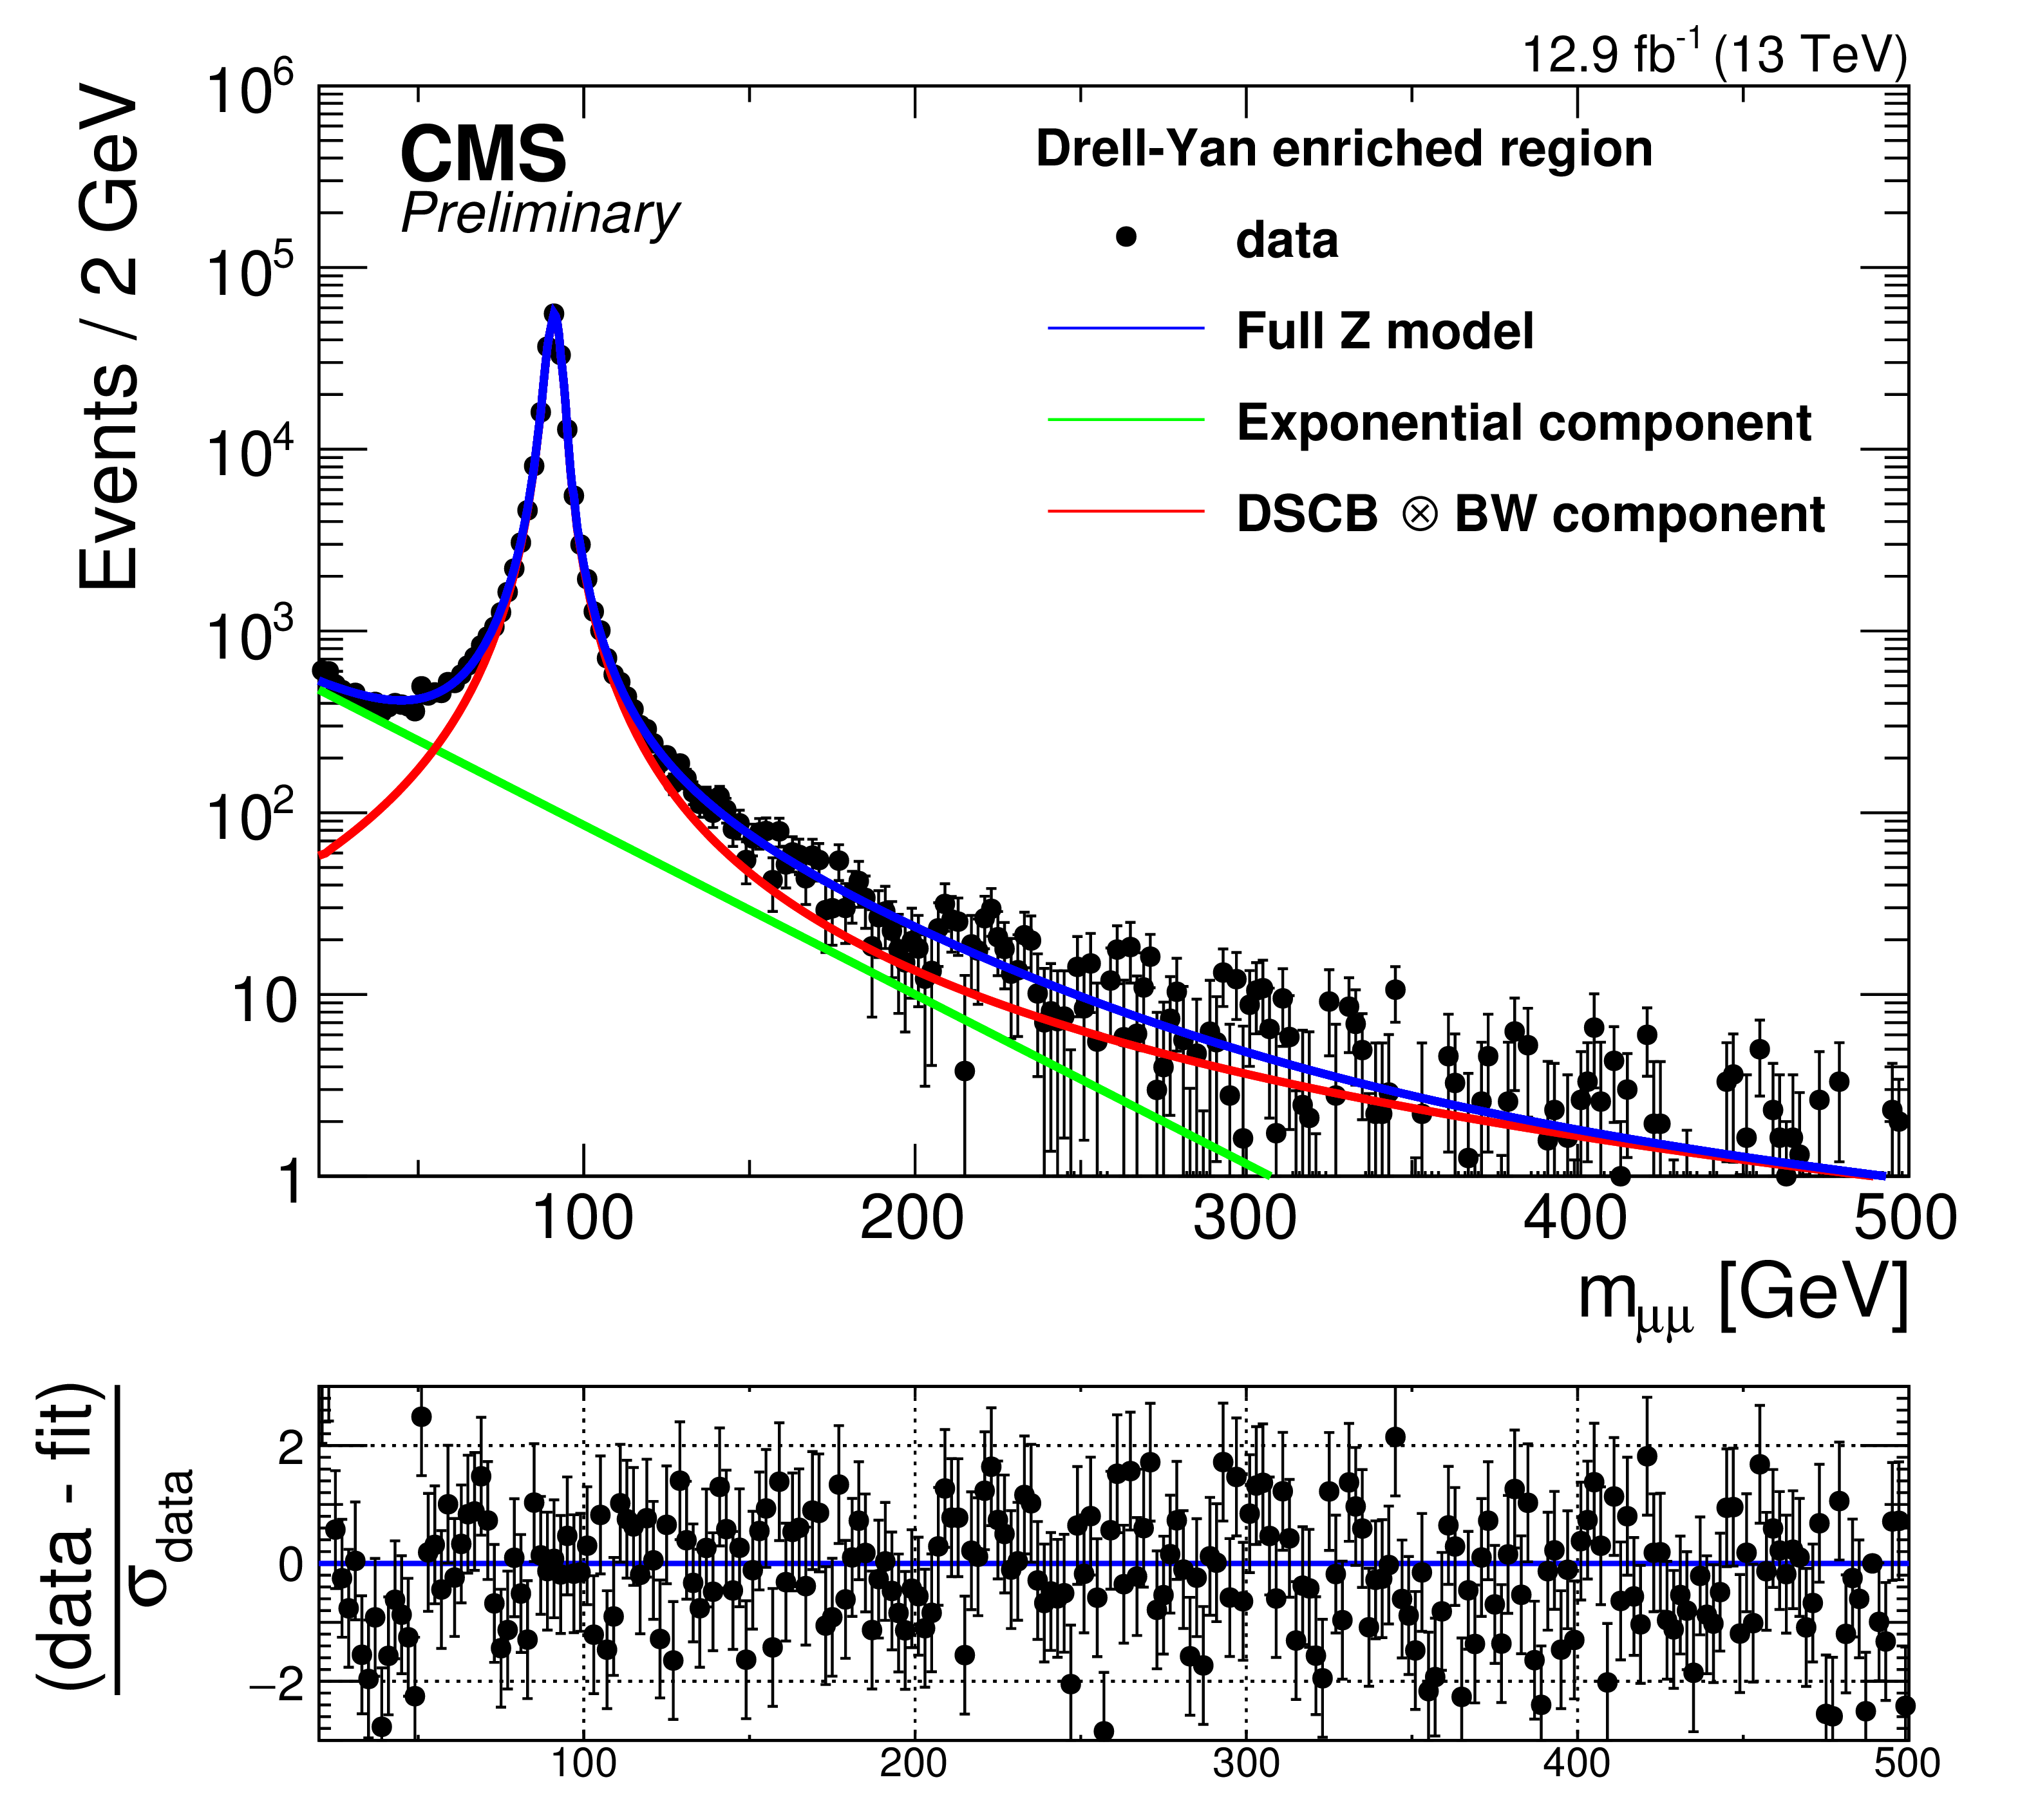
Additional Figure 4-b:
Fitted shape for backgrounds containing a Z boson for dielectron events (a) and dimuon events (b). The fitted shape consists of an exponential (green) and a Breit-wigner convolved with a double-sided Crystal-Ball (red), whose sum (blue) describes the backgrounds containing a Z boson. |
png pdf |
Additional Figure 5-a:
Result of fit in signal region for same-flavor (a) and opposite-flavor (b) events for data evaluating the null hypothesis. |

png pdf |
Additional Figure 5-b:
Result of fit in signal region for same-flavor (a) and opposite-flavor (b) events for data evaluating the null hypothesis. |
png pdf |
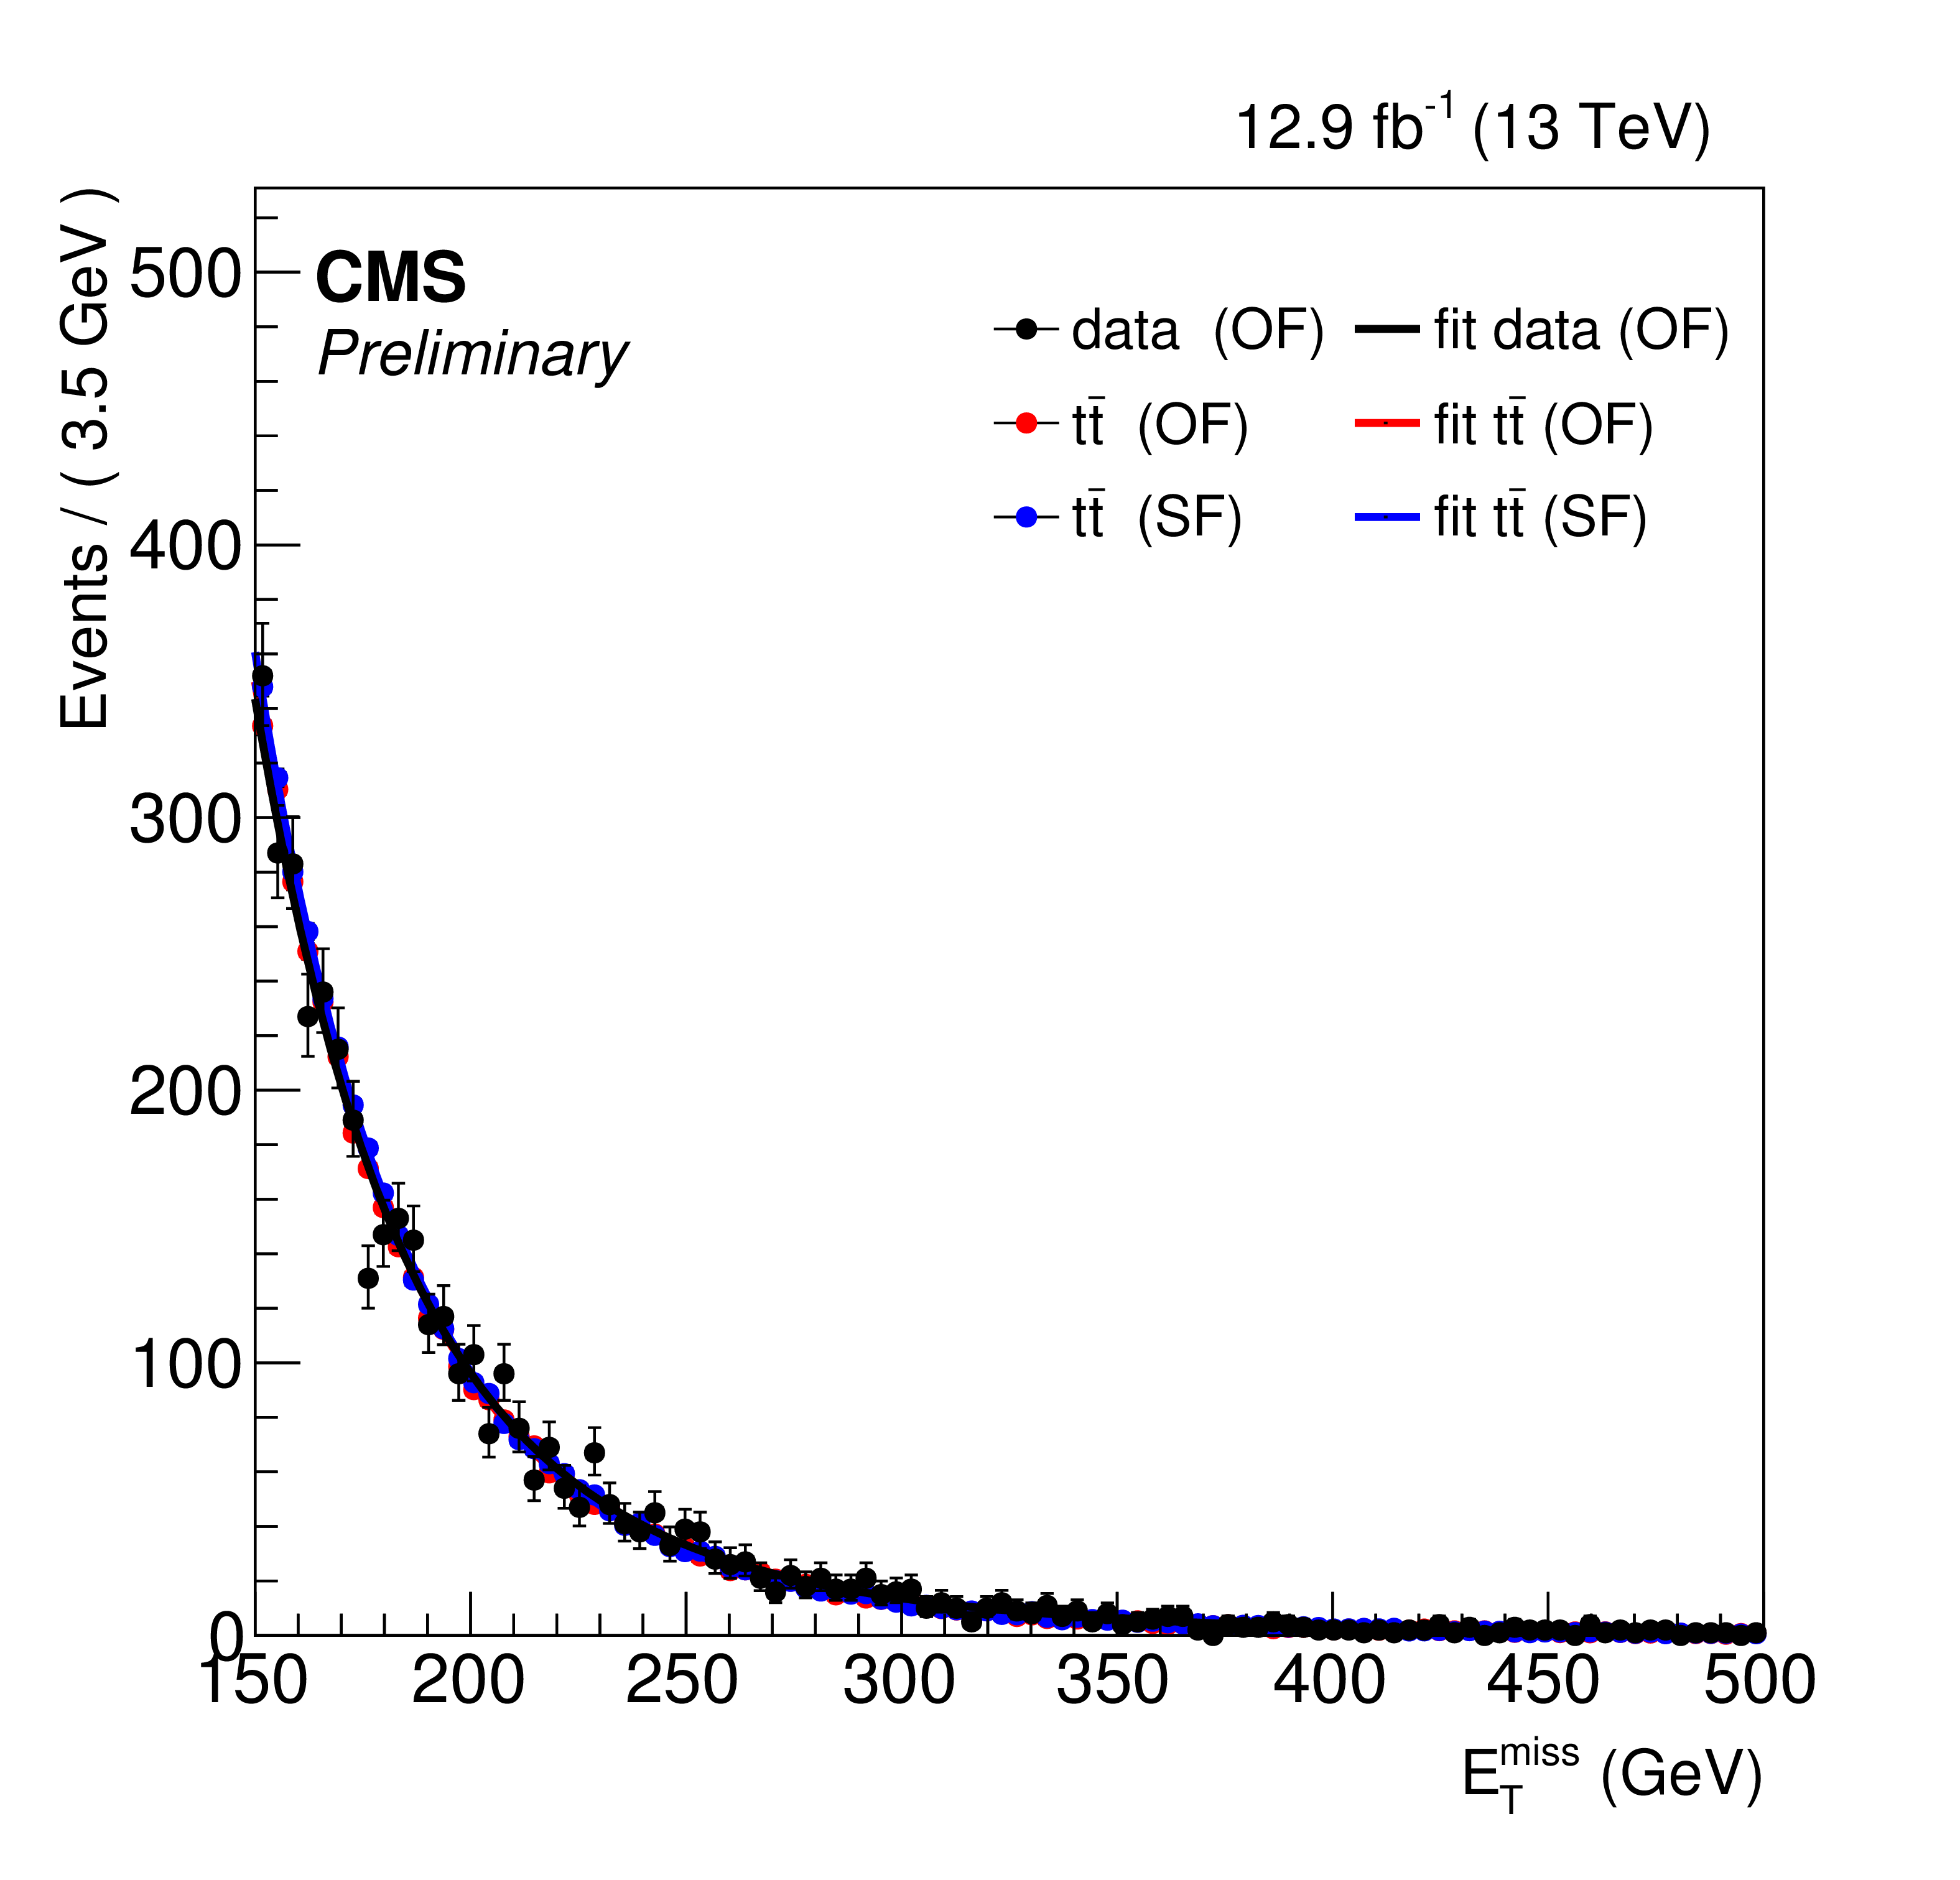
Additional Figure 6-a:
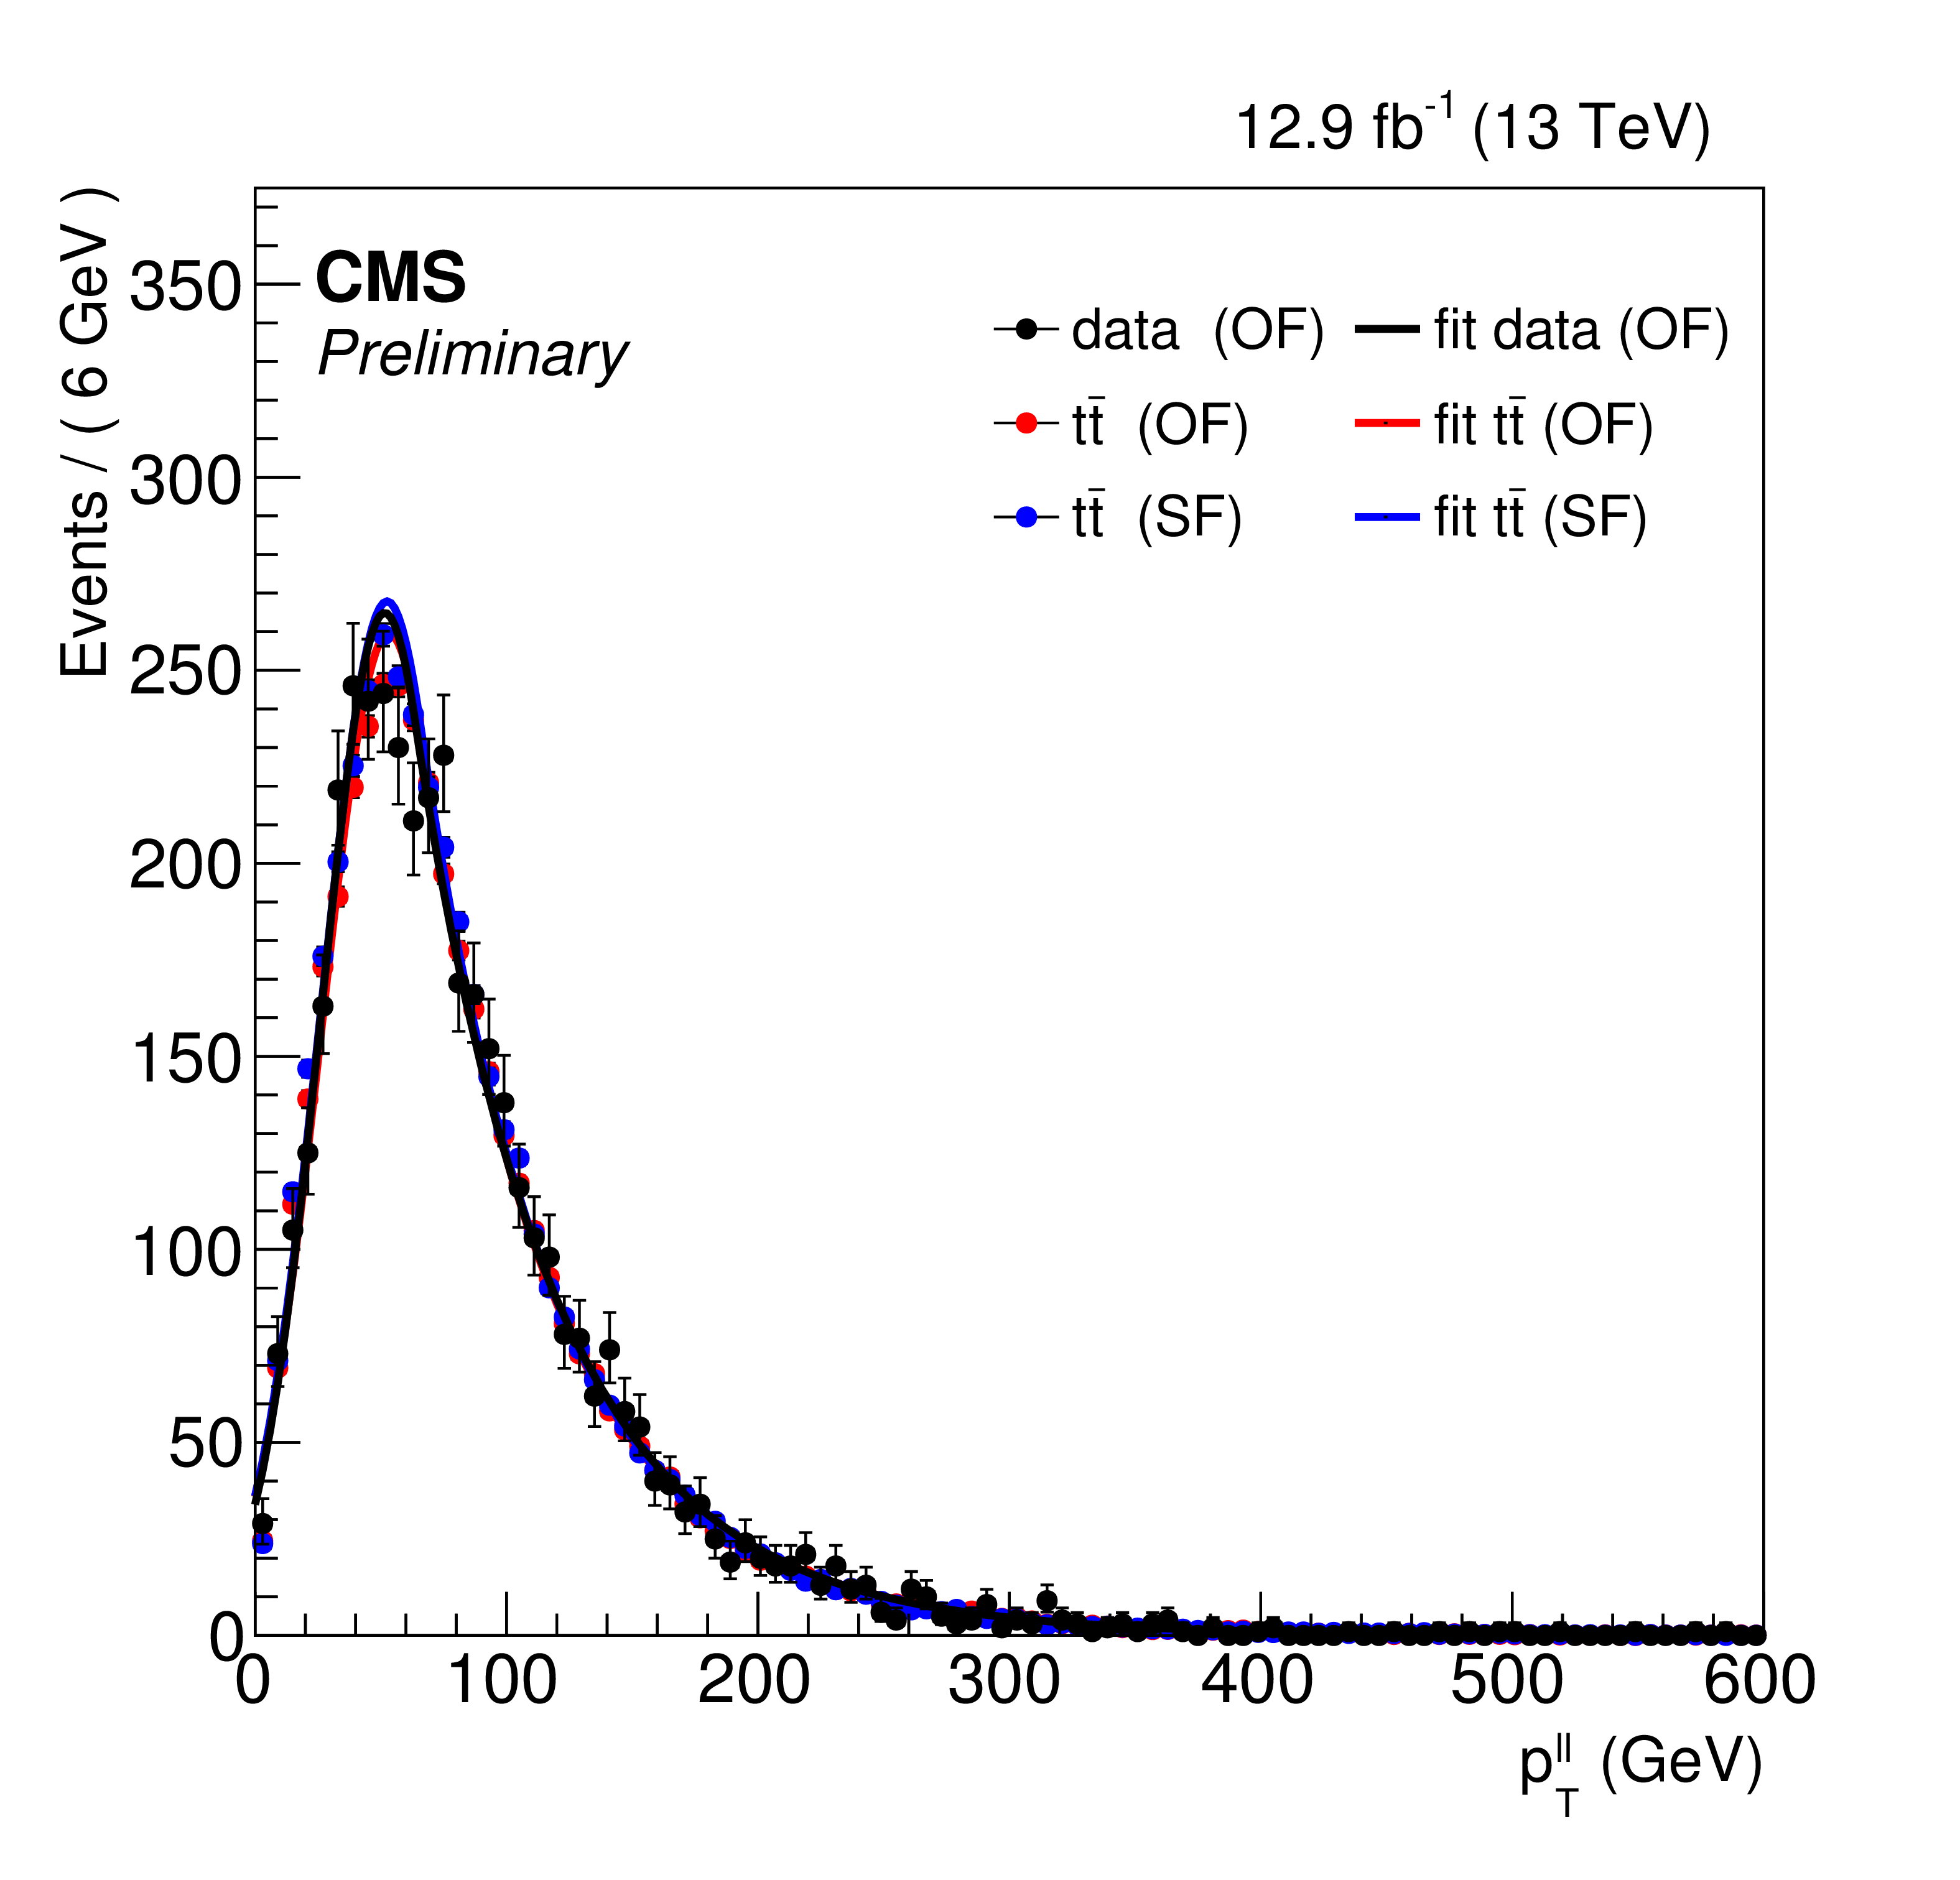
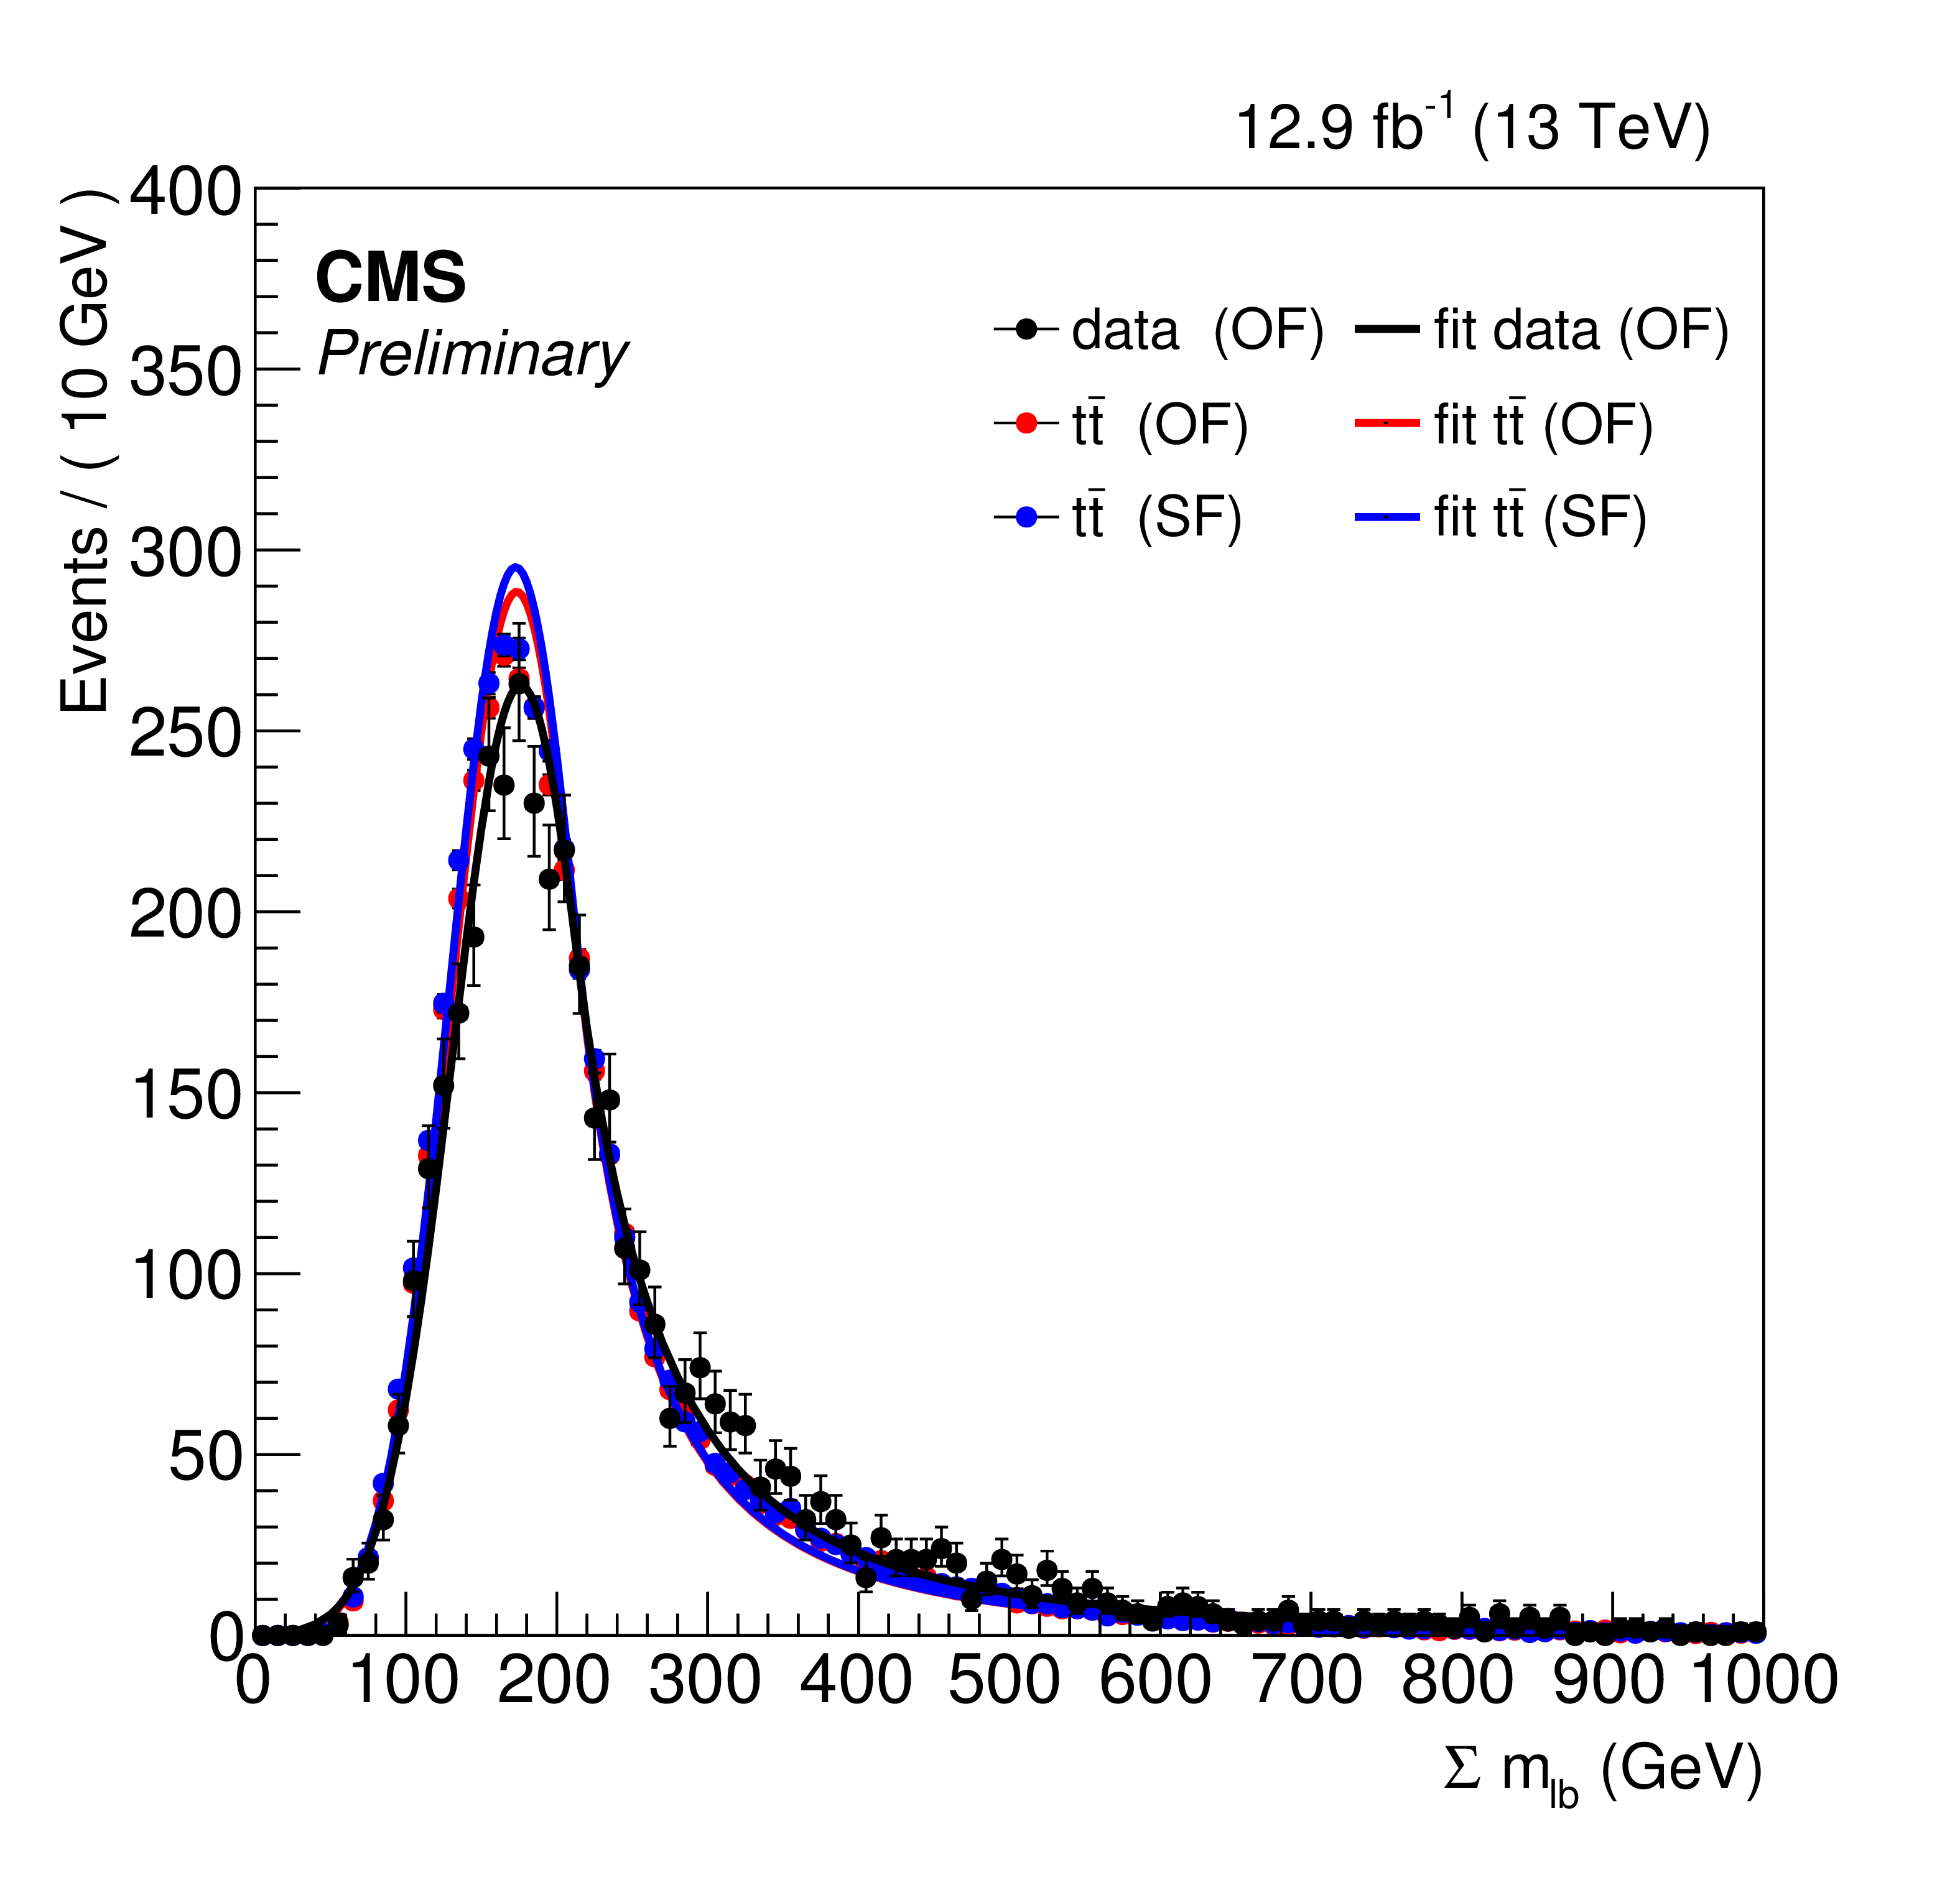
PDFs for the four input variables to the likelihood discriminant: $ {E_{\mathrm {T}}^{\text {miss}}} $ (a), di-lepton ${p_{\mathrm {T}}}$ (b), $|\Delta \phi |$ between the leptons (c), and $\Sigma m_{\ell \text {b}}$ (d). Data in the OF region is shown in black, MC simulation in the OF sample is shown in blue, and MC simulation in the SF is shown in red. |
png pdf |
Additional Figure 6-b:
PDFs for the four input variables to the likelihood discriminant: $ {E_{\mathrm {T}}^{\text {miss}}} $ (a), di-lepton ${p_{\mathrm {T}}}$ (b), $|\Delta \phi |$ between the leptons (c), and $\Sigma m_{\ell \text {b}}$ (d). Data in the OF region is shown in black, MC simulation in the OF sample is shown in blue, and MC simulation in the SF is shown in red. |
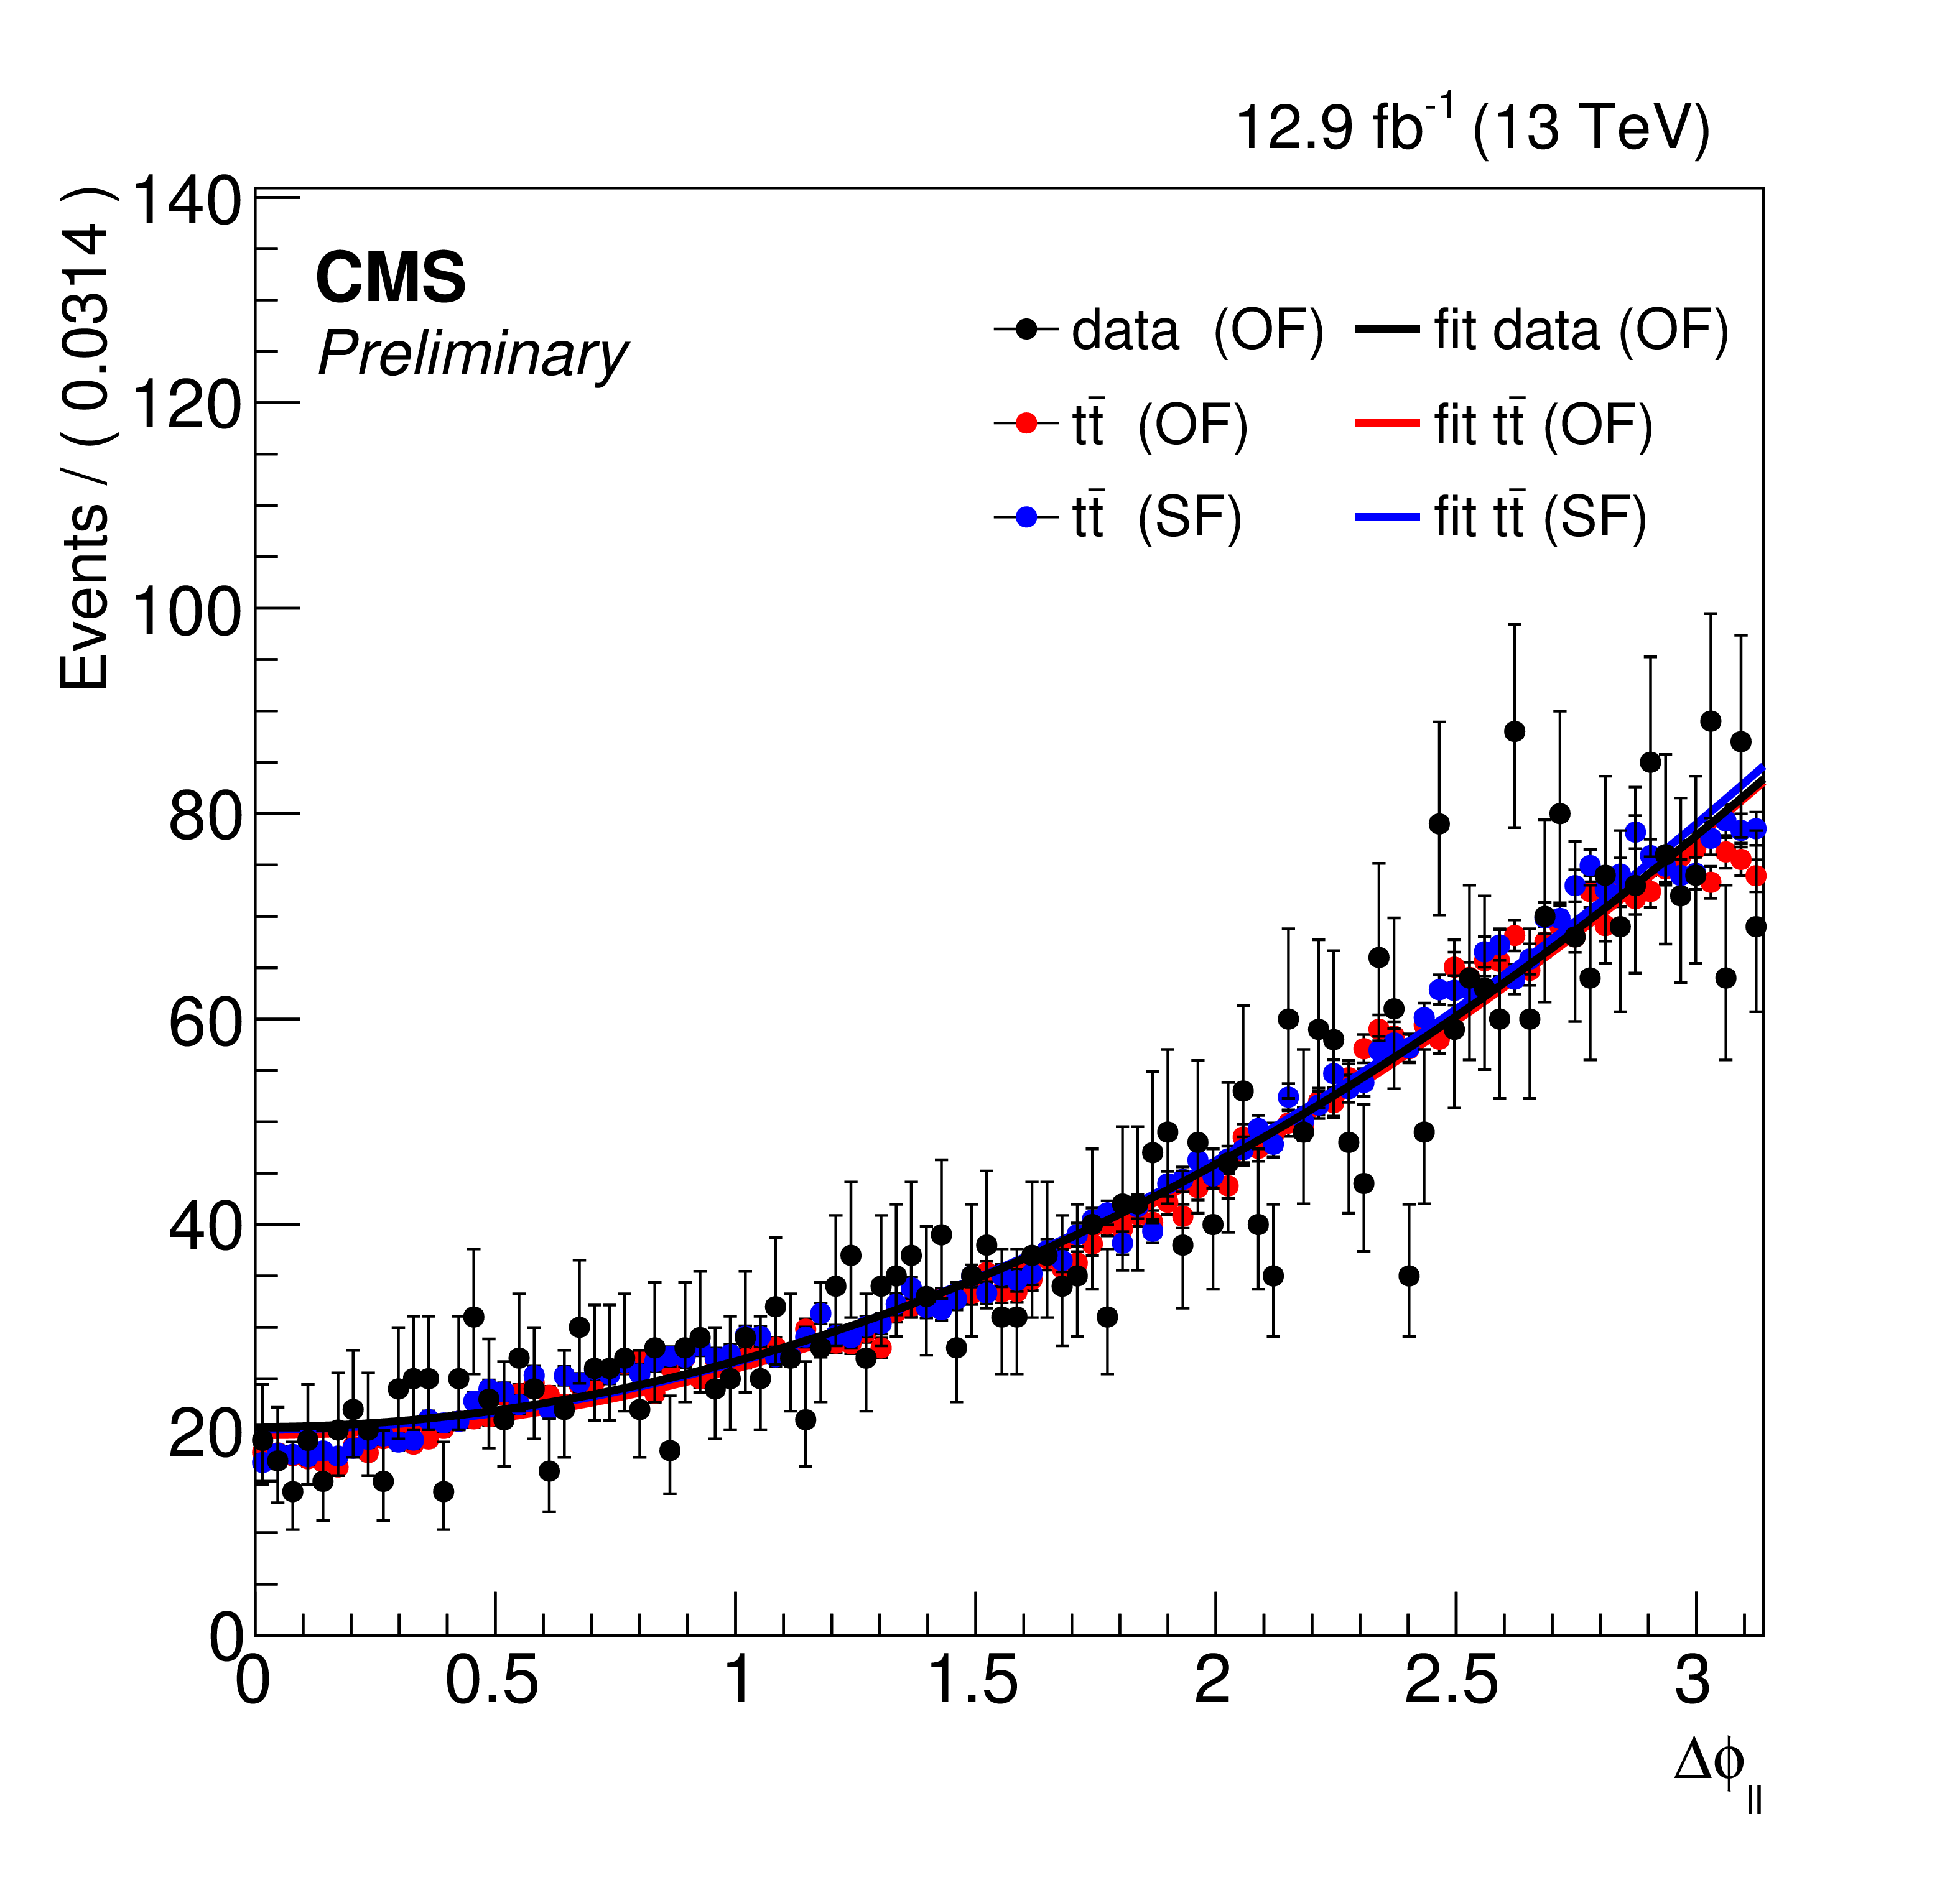
png pdf |
Additional Figure 6-c:
PDFs for the four input variables to the likelihood discriminant: $ {E_{\mathrm {T}}^{\text {miss}}} $ (a), di-lepton ${p_{\mathrm {T}}}$ (b), $|\Delta \phi |$ between the leptons (c), and $\Sigma m_{\ell \text {b}}$ (d). Data in the OF region is shown in black, MC simulation in the OF sample is shown in blue, and MC simulation in the SF is shown in red. |
png pdf |
Additional Figure 6-d:
PDFs for the four input variables to the likelihood discriminant: $ {E_{\mathrm {T}}^{\text {miss}}} $ (a), di-lepton ${p_{\mathrm {T}}}$ (b), $|\Delta \phi |$ between the leptons (c), and $\Sigma m_{\ell \text {b}}$ (d). Data in the OF region is shown in black, MC simulation in the OF sample is shown in blue, and MC simulation in the SF is shown in red. |
png pdf |
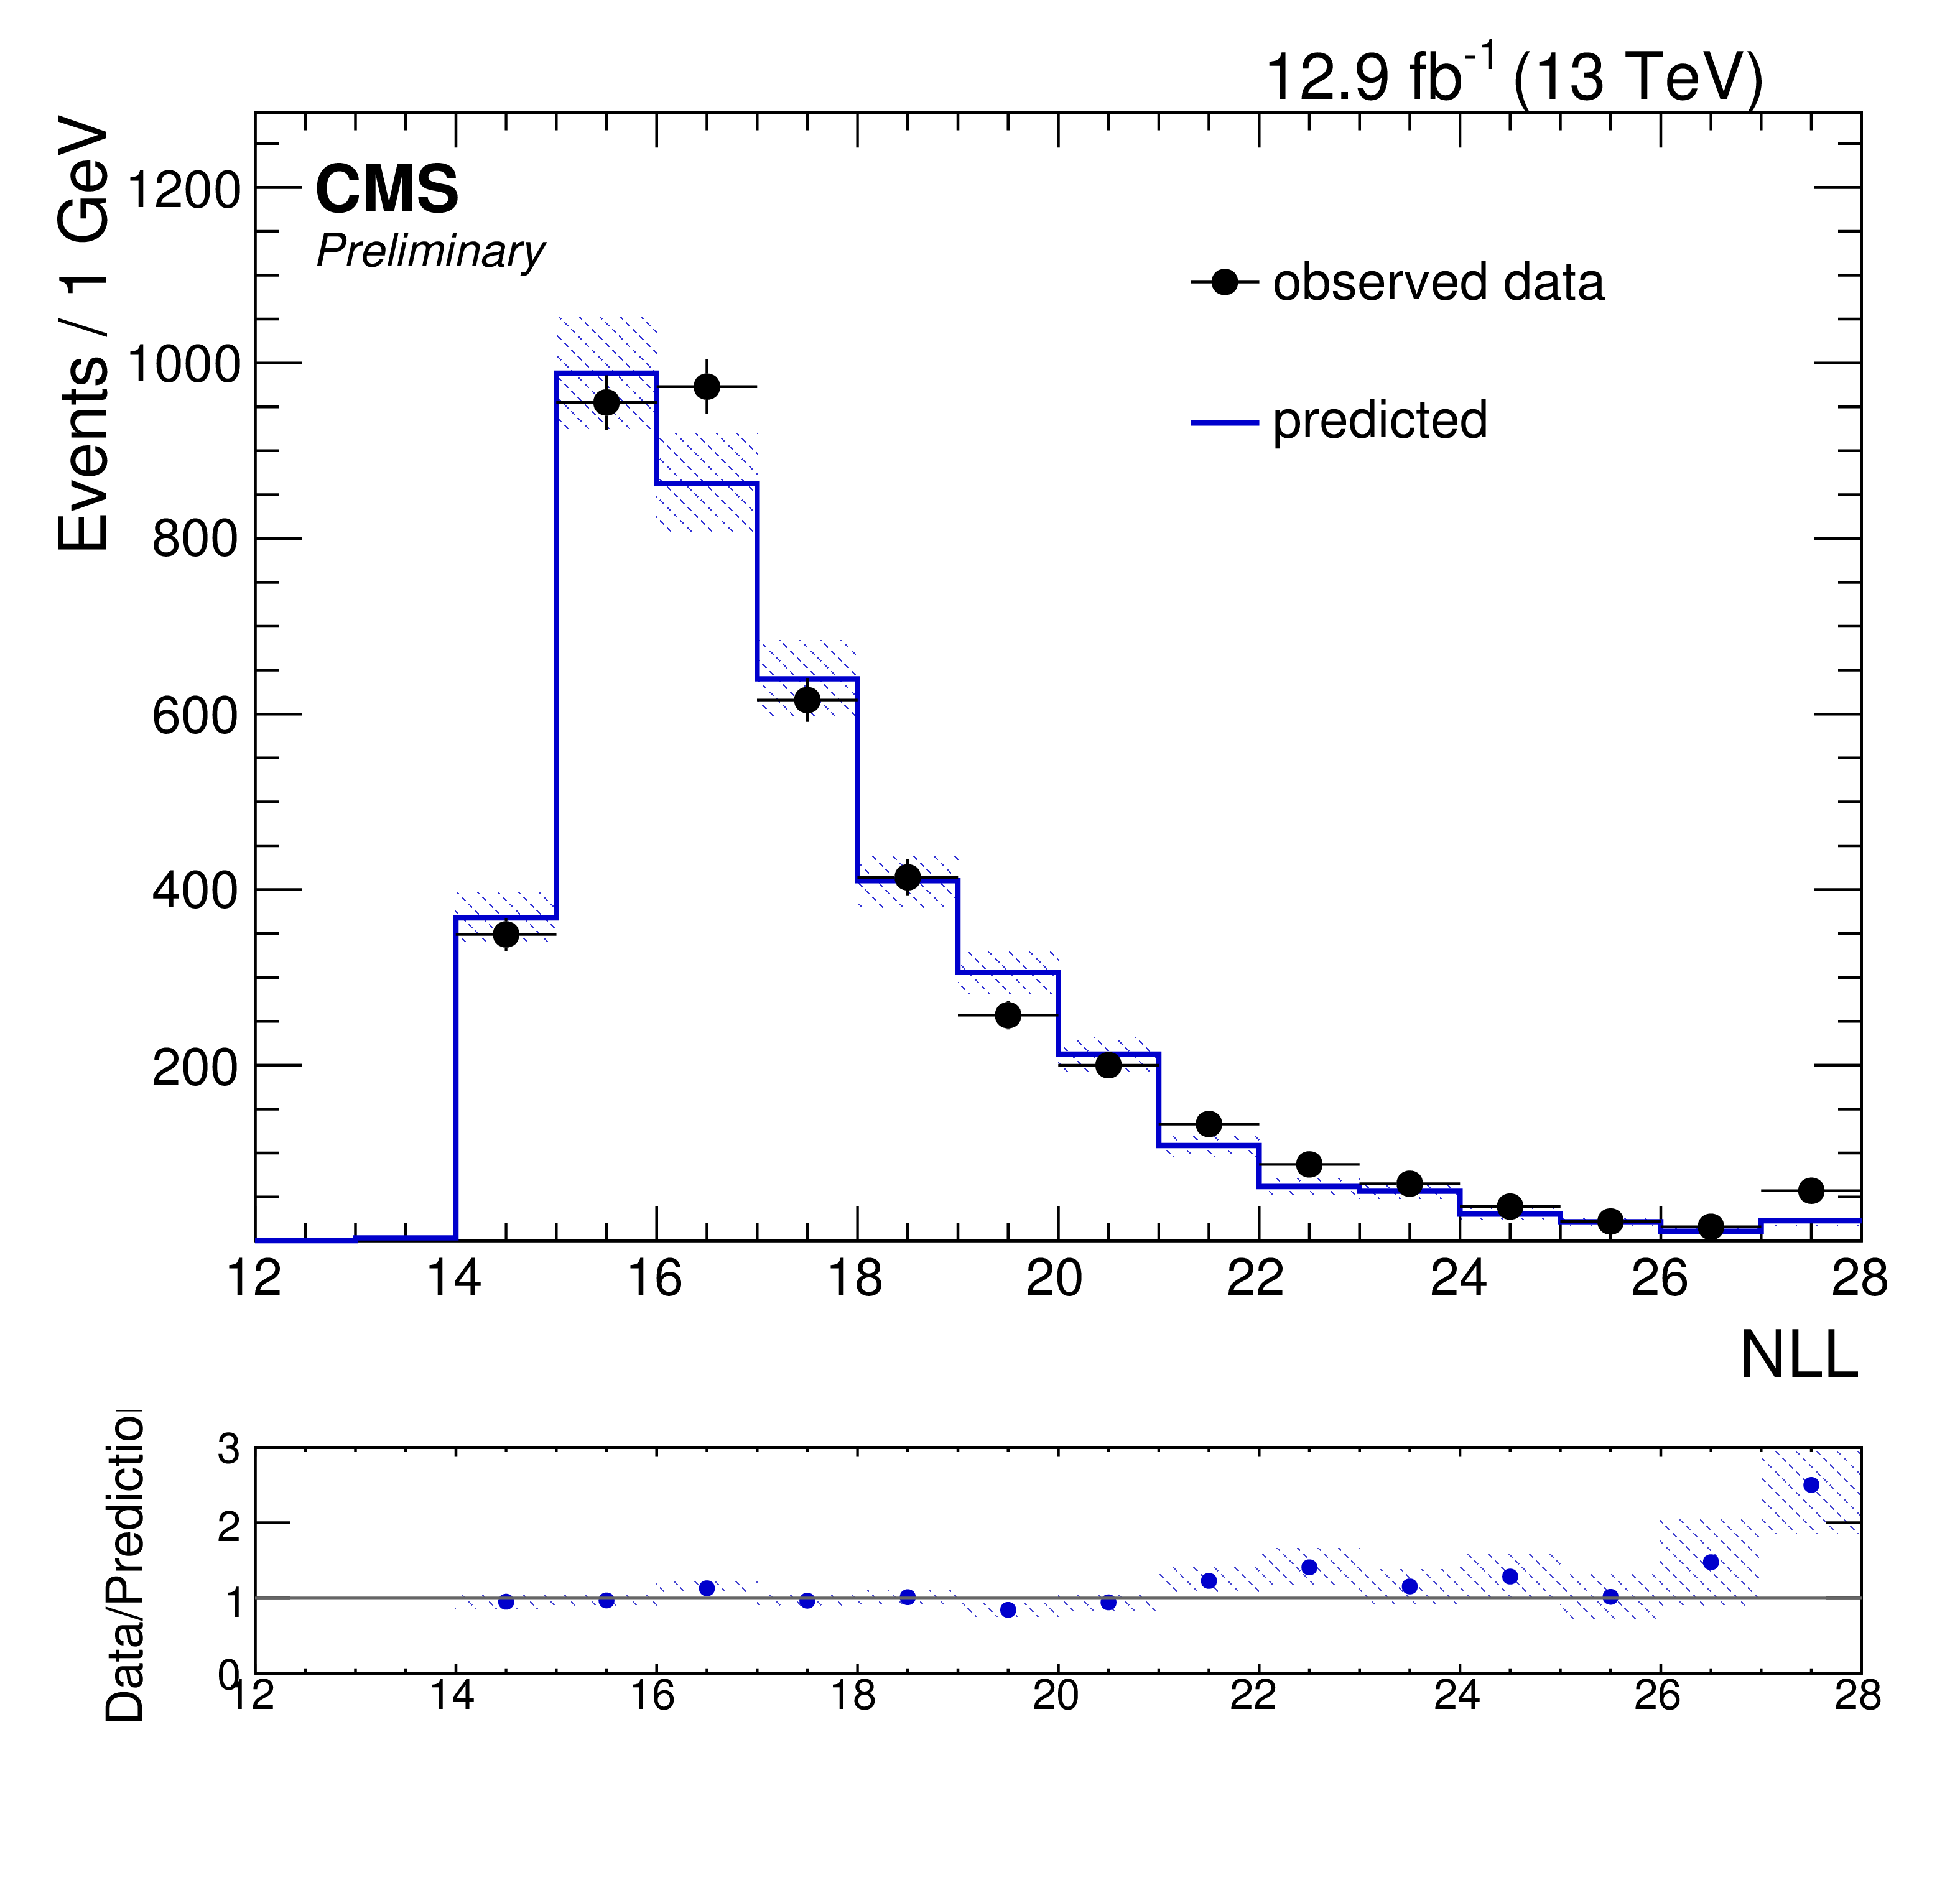
Additional Figure 7:
Likelihood discriminator distribution in the region $ {E_{\mathrm {T}}^{\text {miss}}} > $ 150 GeV and at least two jets. Observed data from same-flavor events (black markers) are compared to the prediction from events with opposite-flavor (blue line). The dashed band indicated the total statistical and systematic uncertainty in the ratio. |
png pdf |
Additional Figure 8:
Dilepton mass distribution in the ATLAS-like signal region for ee events. Observed data (black markers) are compared to the prediction from MC. The MC backgrounds are normalized in the e$\mu $ region. |
png pdf |
Additional Figure 9:
Dilepton mass distribution in the ATLAS-like signal region for $\mu \mu $ events. Observed data (black markers) are compared to the prediction from MC. The MC backgrounds are normalized in the e$\mu $ region. |
png pdf |
Additional Figure 10:
Dilepton mass distribution in the ATLAS-like signal region for e$\mu $ events. Observed data (black markers) are compared to the prediction from MC. The MC backgrounds are normalized in the e$\mu $ region. |
png pdf |
Additional Figure 11:
Dilepton mass distribution in the ATLAS-like signal region for ee+$\mu \mu $ events. Observed data (black markers) are compared to the prediction from MC. The MC backgrounds are normalized in the e$\mu $ region. |
| Additional Tables | |

png pdf |
Additional Table 1:
Number of events sequentially passing the selection criteria of the region SRB with at least one b-tagged jet, for the GMSB signal model with masses 1400 GeV and 200 GeV for the gluino and the neutralino, respectively. The signal sample used to interpret the results of the on-Z search was generated with a requirement that at least one Z boson in the event decays to a lepton pair (ee, $\mu \mu $ or $\tau \tau $). The branching ratio for this requirement is already included in the event yield shown in this table. |
png pdf |
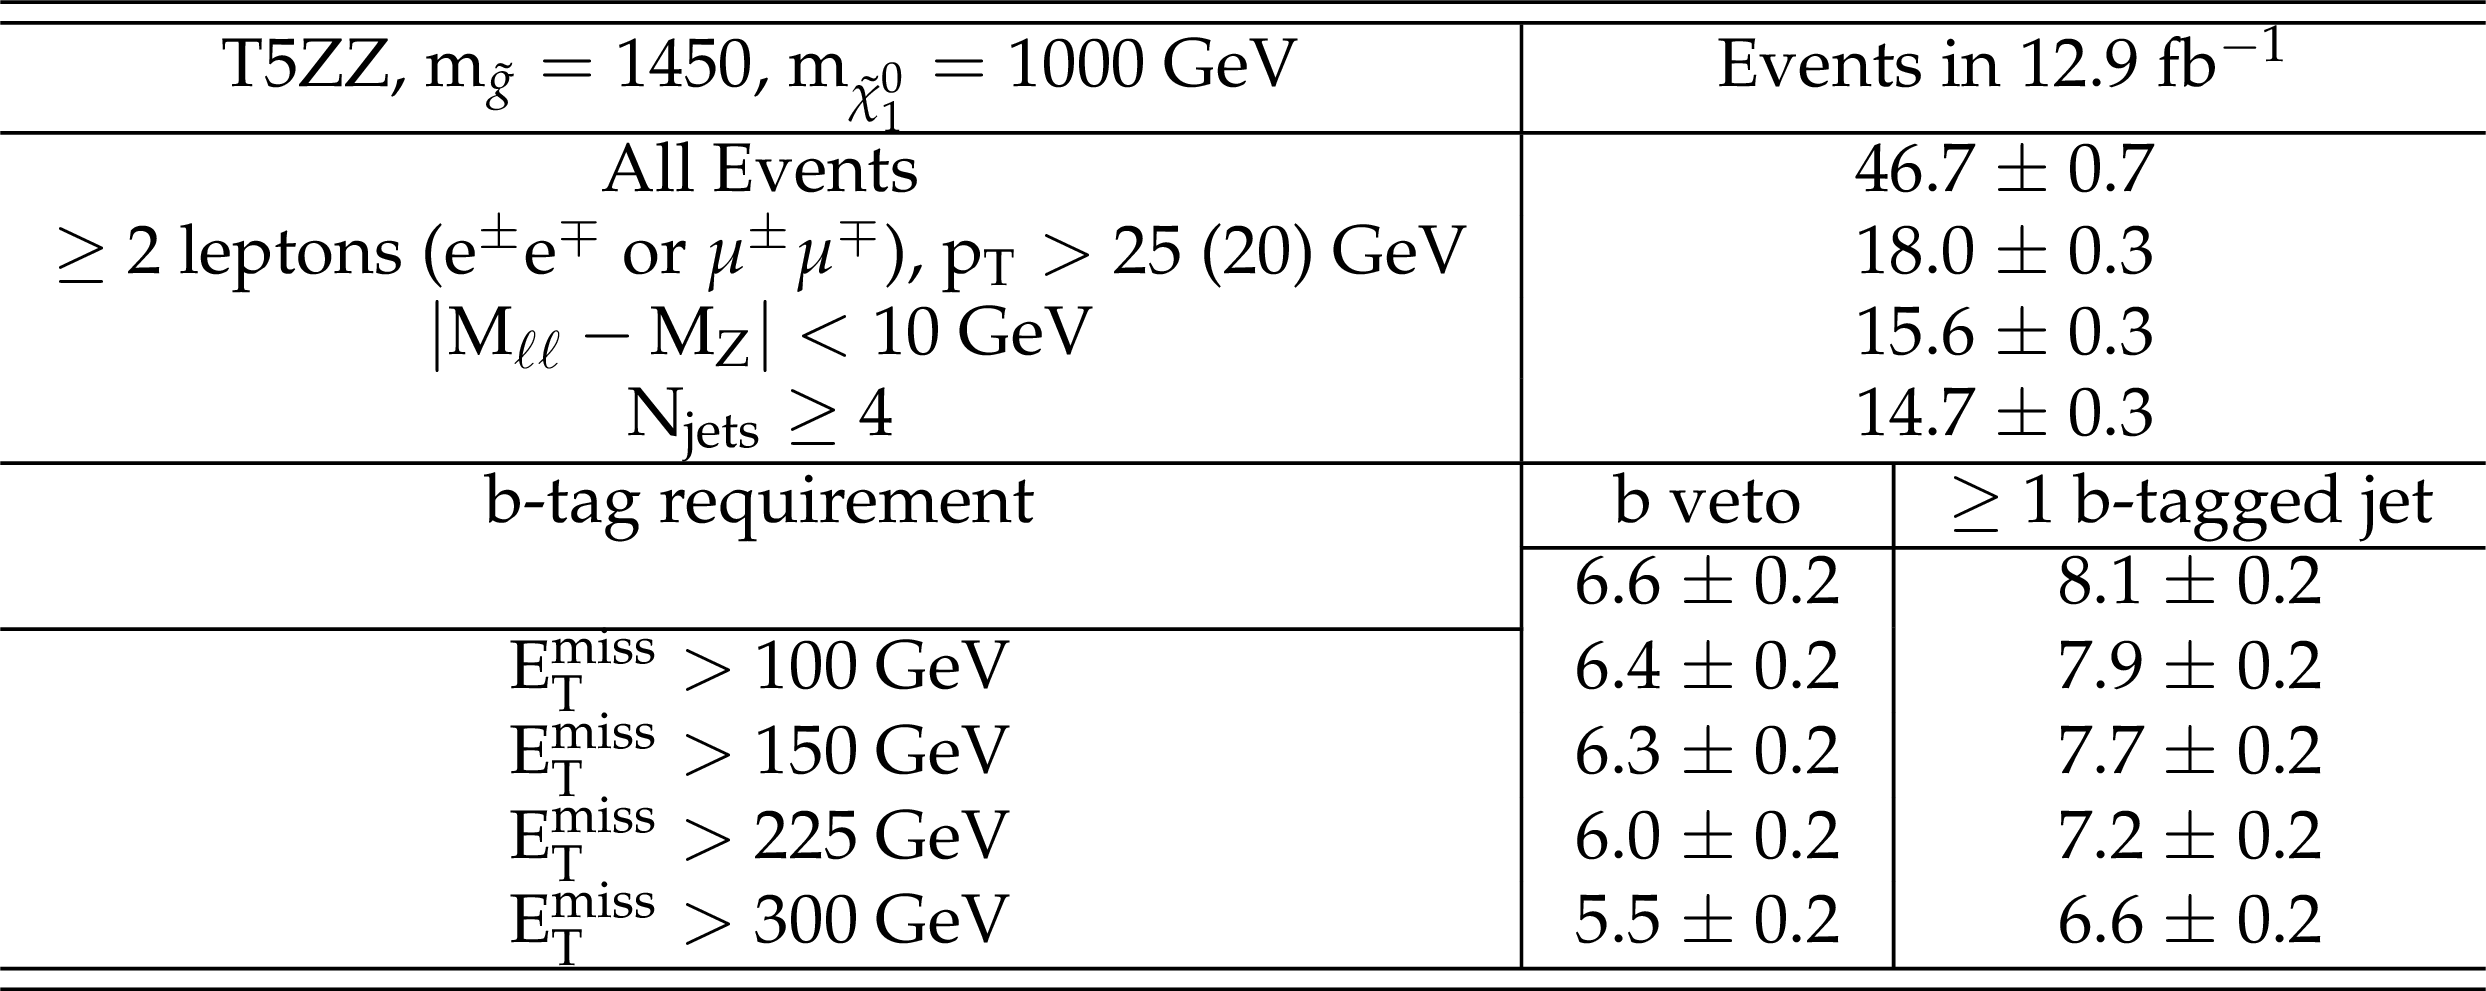
Additional Table 2:
Number of events sequentially passing the selection criteria of the region SRB with at least one b-tagged jet, for the GMSB signal model with masses 1450 GeV and 1000 GeV for the gluino and the neutralino, respectively. The signal sample used to interpret the results of the on-Z search was generated with a requirement that at least one Z boson in the event decays to a lepton pair (ee, $\mu \mu $ or $\tau \tau $). The branching ratio for this requirement is already included in the event yield shown in this table. |

png pdf |
Additional Table 3:
Number of events sequentially passing the selection criteria of the ATLAS-like region, for the GMSB signal model with masses 1400 GeV and 200 GeV for the gluino and the neutralino, respectively. The signal sample used to interpret the results of the on-Z search was generated with a requirement that at least one Z boson in the event decays to a lepton pair (ee, $\mu \mu $ or $\tau \tau $). The branching ratio for this requirement is already included in the event yield shown in this table. |

png pdf |
Additional Table 4:
Number of events sequentially passing the selection criteria of the ATLAS-like region, for the GMSB signal model with masses 1450 GeV and 1000 GeV for the gluino and the neutralino, respectively. The signal sample used to interpret the results of the on-Z search was generated with a requirement that at least one Z boson in the event decays to a lepton pair (ee, $\mu \mu $ or $\tau \tau $). The branching ratio for this requirement is already included in the event yield shown in this table. |

png pdf |
Additional Table 5:
Cut flow table for the edge signal model for a mass point at $m_{\tilde{b}}= $ 700 GeV and $m_{\tilde{\chi }_{2}^{0}}= $ 175 GeV. Expected dilepton events refers to luminosity$\times $cross section$\times $branching ratio. |
png pdf |
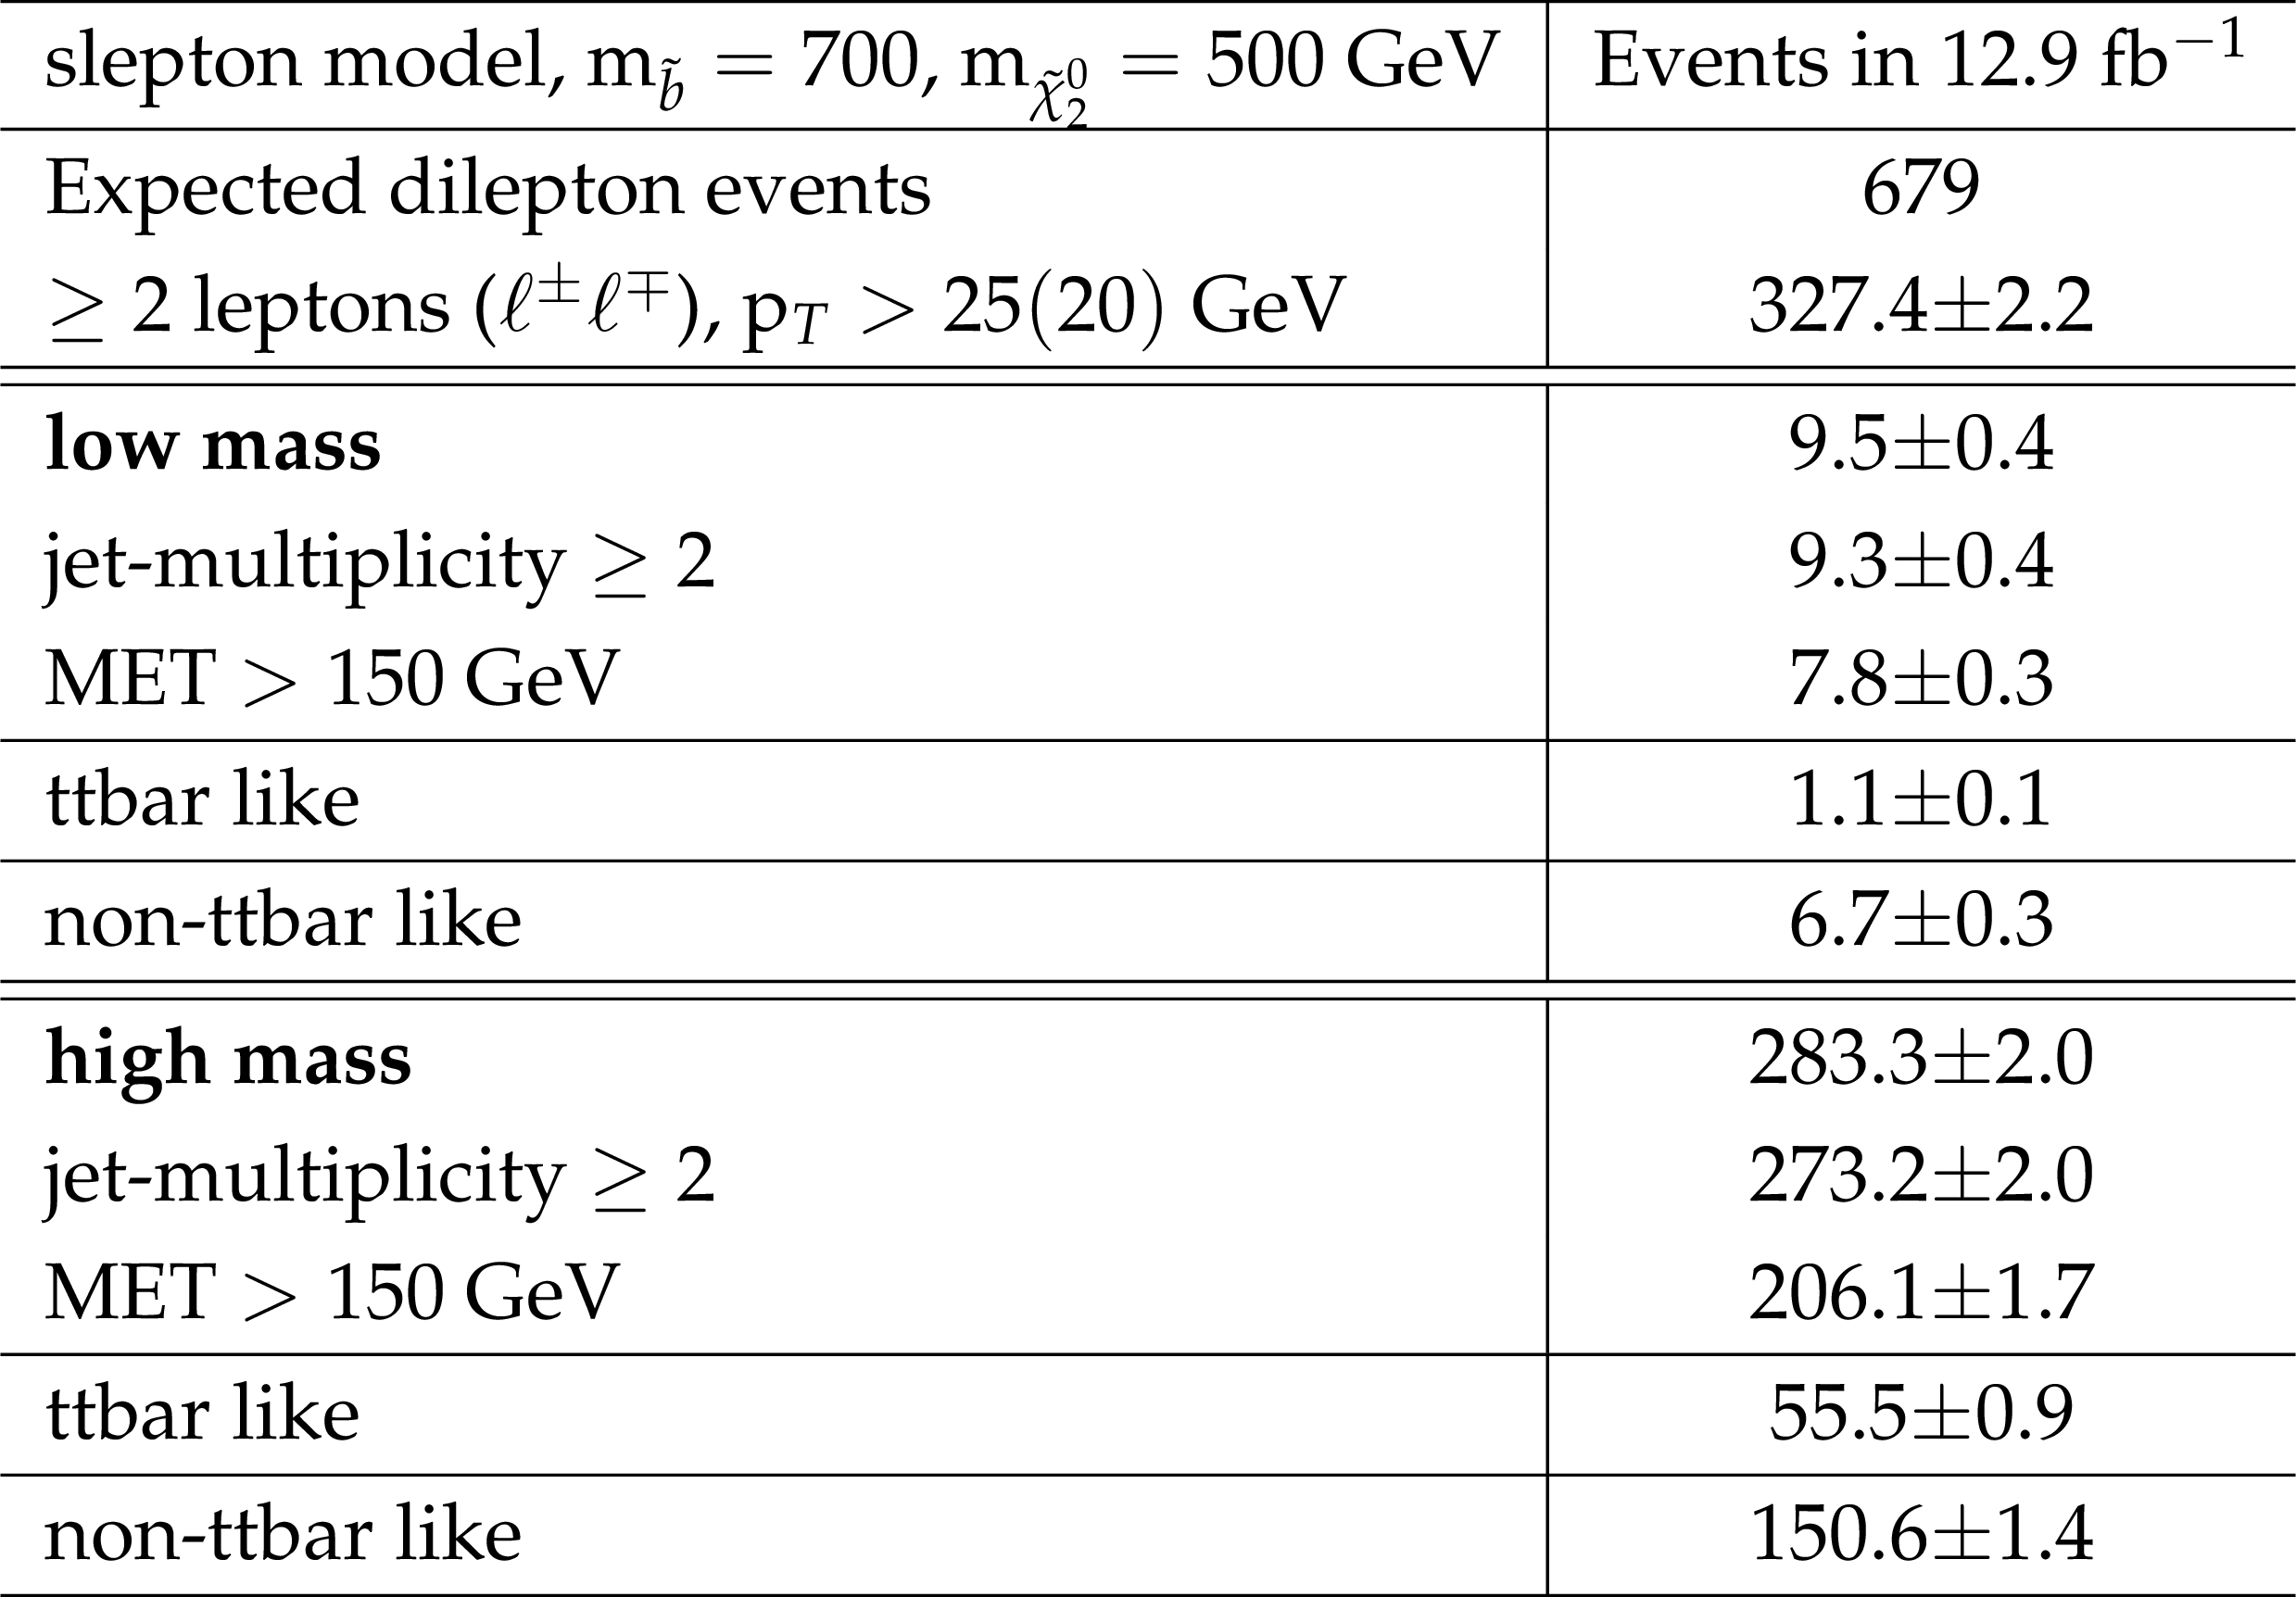
Additional Table 6:
Cut flow table for the edge signal model for a mass point at $m_{\tilde{b}}= $ 700 GeV and $m_{\tilde{\chi }_{2}^{0}}= $ 500 GeV. Expected dilepton events refers to luminosity$\times $cross section$\times $branching ratio. |

png pdf |
Additional Table 7:
Cut flow table for the edge signal model for a mass point at $m_{\tilde{b}}= $ 750 GeV and $m_{\tilde{\chi }_{2}^{0}}= $ 300 GeV. Expected dilepton events refers to luminosity$\times $cross section$\times $branching ratio. |
png pdf |
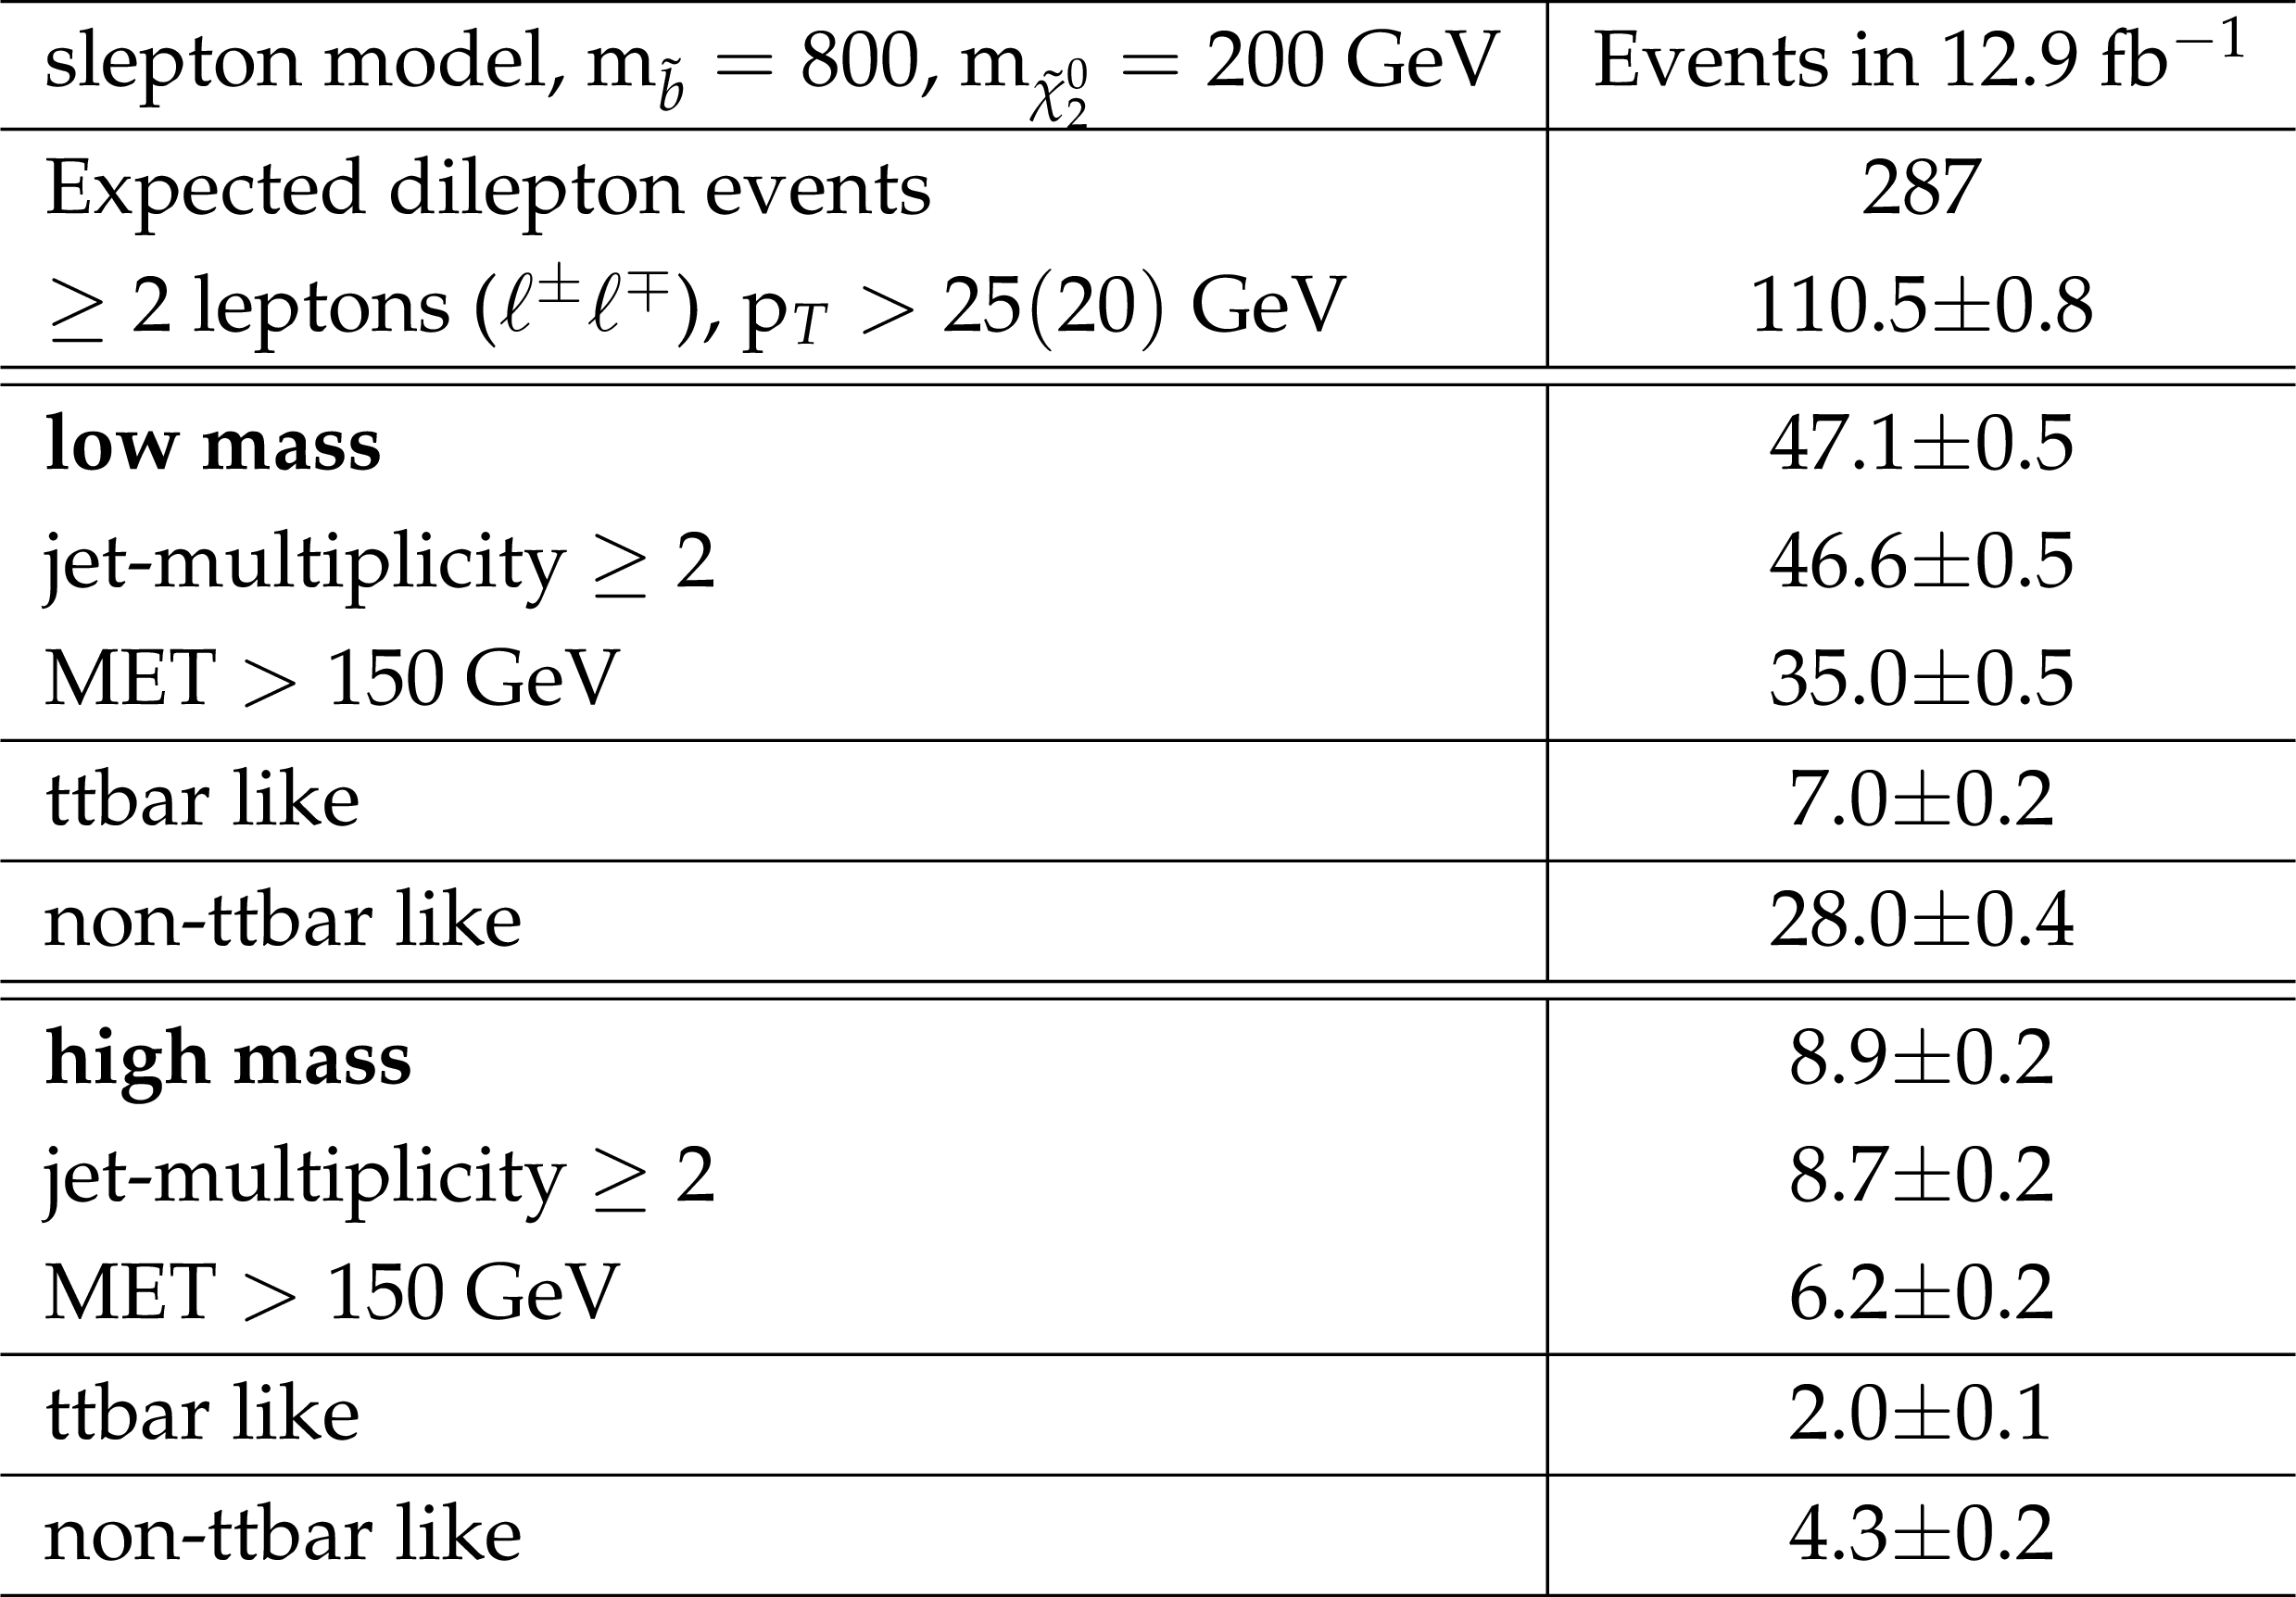
Additional Table 8:
Cut flow table for the edge signal model for a mass point at $m_{\tilde{b}}= $ 800 GeV and $m_{\tilde{\chi }_{2}^{0}}= $ 200 GeV. Expected dilepton events refers to luminosity$\times $cross section$\times $branching ratio. |

png pdf |
Additional Table 9:
Cut flow table for the edge signal model for a mass point at $m_{\tilde{b}}= $ 800 GeV and $m_{\tilde{\chi }_{2}^{0}}= $ 600 GeV. Expected dilepton events refers to luminosity$\times $cross section$\times $branching ratio. |
png pdf |
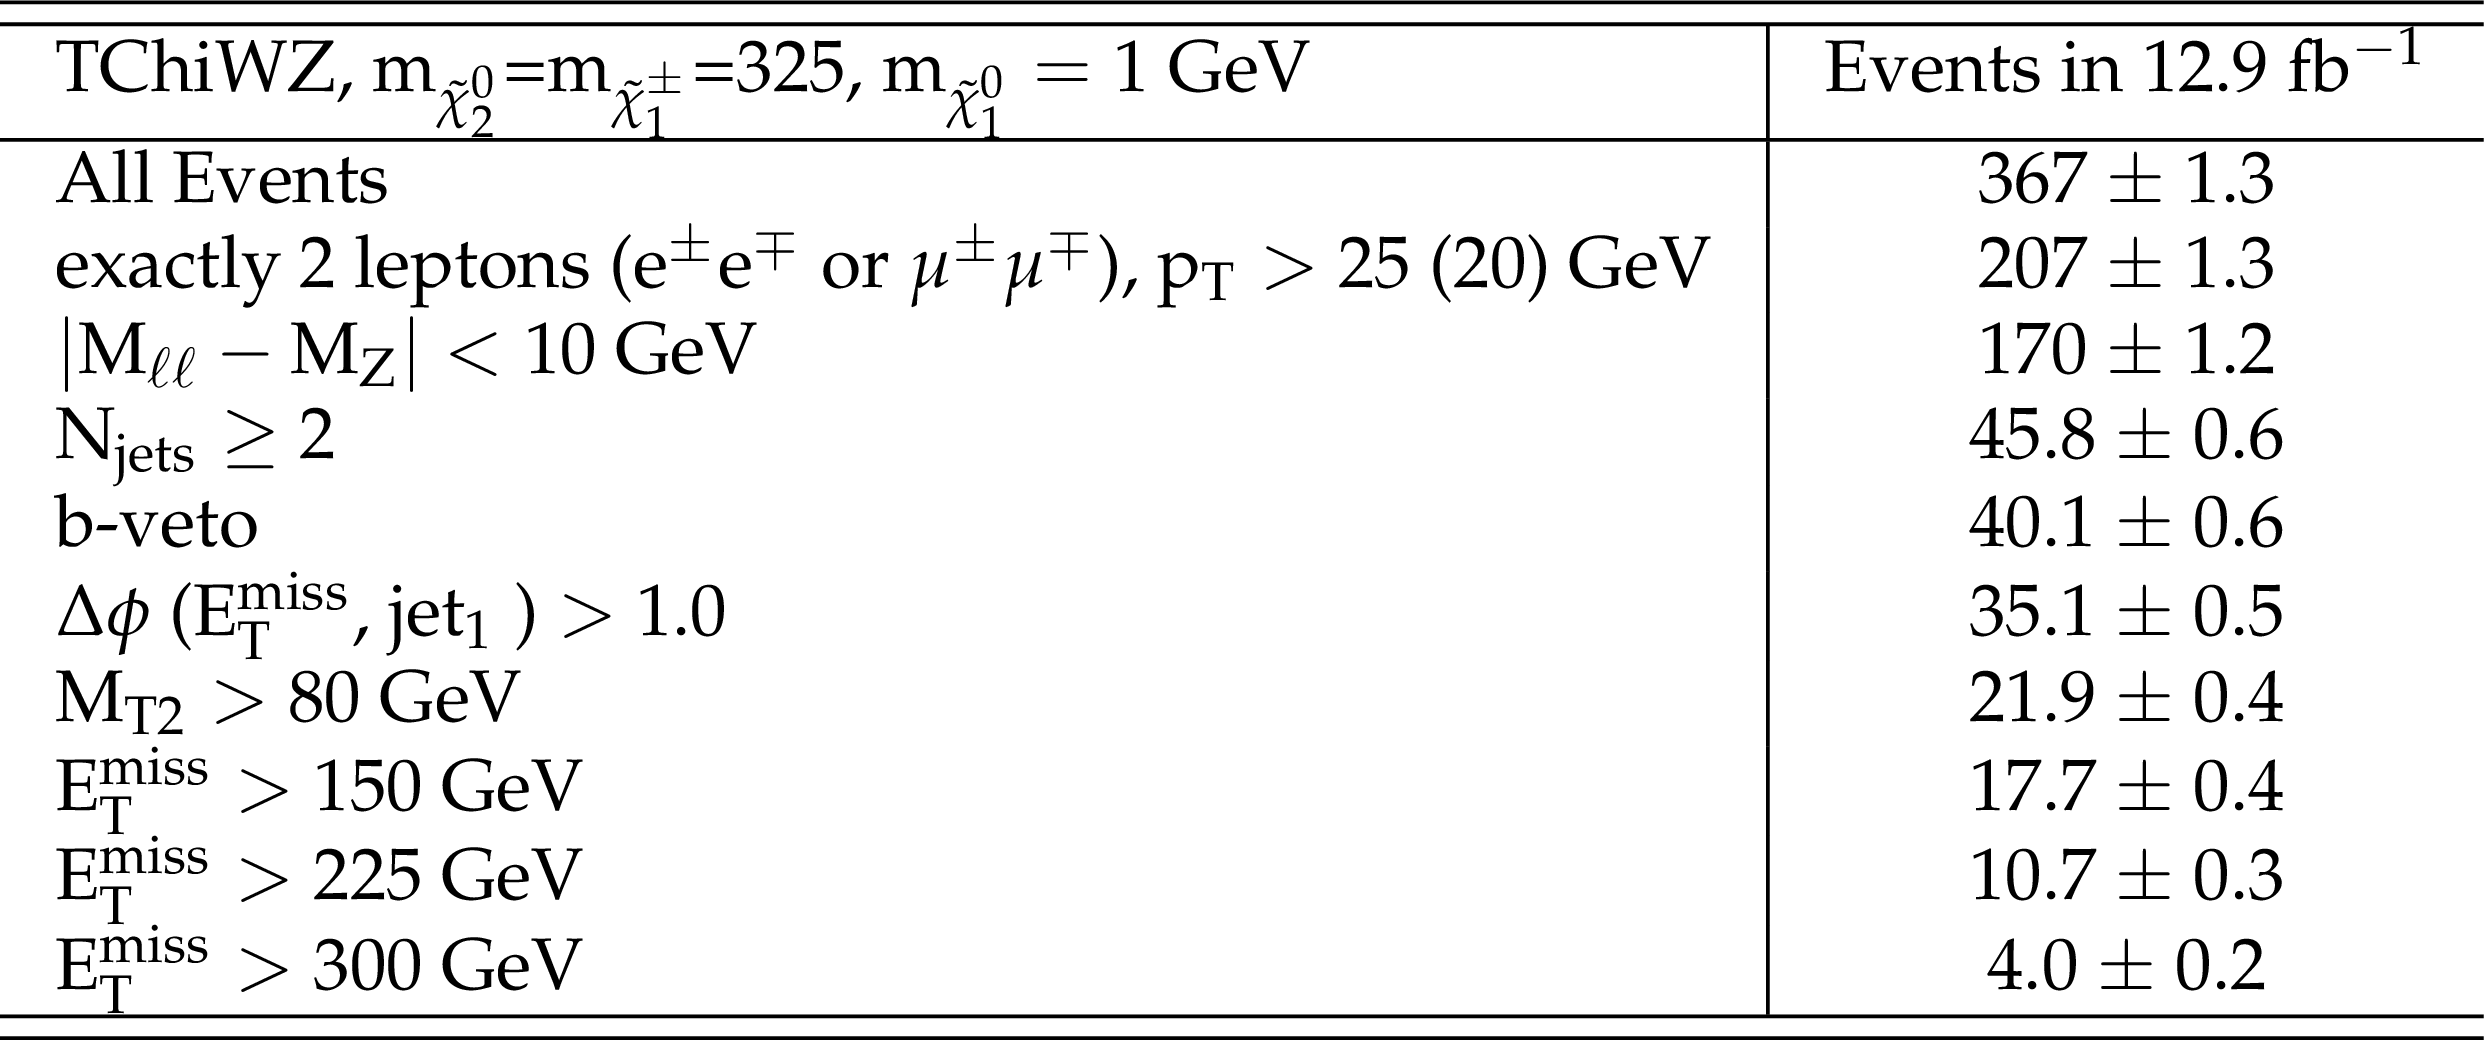
Additional Table 10:
Number of events sequentially passing the selection criteria of the electroweak signal region, for the EWK-WZ signal model with masses 325 GeV and 0 GeV for the neutralino and the LSP, respectively. The signal sample used to interpret the results of the electroweak search was generated with a requirement that the Z boson in the event decays to a lepton pair (ee, $\mu \mu $ or $\tau \tau $). The branching ratio for this requirement is already included in the event yield shown in this table. |
png pdf |
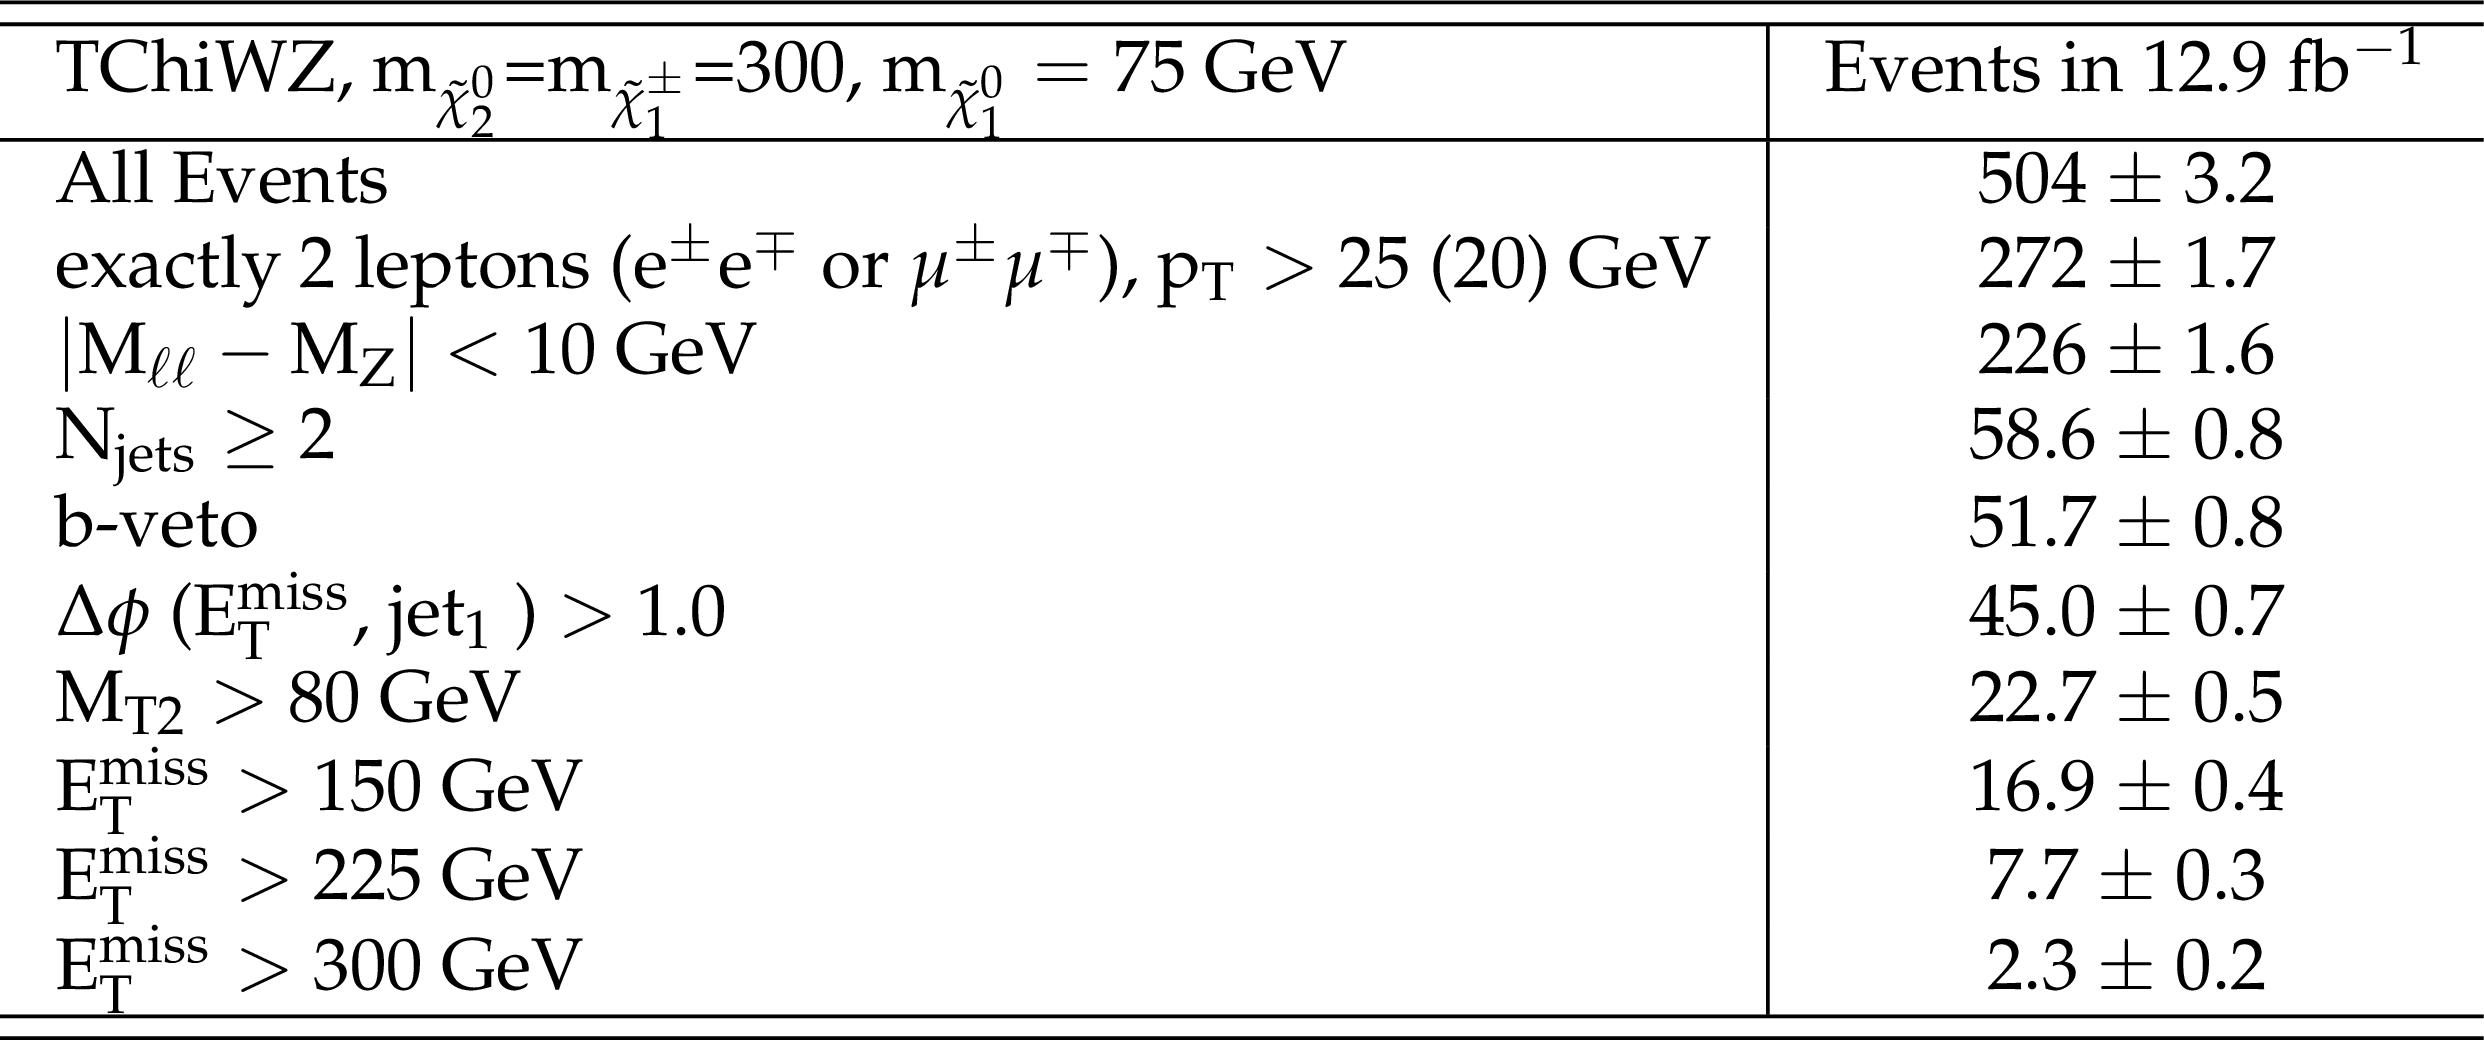
Additional Table 11:
Number of events sequentially passing the selection criteria of the electroweak signal region, for the EWK-WZ signal model with masses 300 GeV and 75 GeV for the neutralino and the LSP, respectively. The signal sample used to interpret the results of the electroweak search was generated with a requirement that the Z boson in the event decays to a lepton pair (ee, $\mu \mu $ or $\tau \tau $). The branching ratio for this requirement is already included in the event yield shown in this table. |
| Macro for calculating the nll variable and the RooWorkSpace with the fitted pdfs used for the calculation. Observed and expected upper limits, and exclusion contours for the GMSB model: root file. Observed and expected upper limits, exclusion contours, efficiencies and uncertainties for the slepton-edge model: root file. Observed and expected upper limits, and exclusion lines for the EWK-WZ model: root file. |
| References | ||||
| 1 | P. Ramond | Dual theory for free fermions | PRD 3 (1971) 2415 | |
| 2 | Y. A. Golfand and E. P. Likhtman | Extension of the algebra of Poincar$ \'e $ group generators and violation of P invariance | JEPTL 13 (1971)323 | |
| 3 | A. Neveu and J. H. Schwarz | Factorizable dual model of pions | Nucl. Phys. B 31 (1971) 86 | |
| 4 | D. V. Volkov and V. P. Akulov | Possible universal neutrino interaction | JEPTL 16 (1972)438 | |
| 5 | J. Wess and B. Zumino | A Lagrangian model invariant under supergauge transformations | PLB 49 (1974) 52 | |
| 6 | J. Wess and B. Zumino | Supergauge transformations in four dimensions | Nucl. Phys. B 70 (1974) 39 | |
| 7 | P. Fayet | Supergauge invariant extension of the Higgs mechanism and a model for the electron and its neutrino | Nucl. Phys. B 90 (1975) 104 | |
| 8 | H. P. Nilles | Supersymmetry, supergravity and particle physics | Phys. Rep. 110 (1984) 1 | |
| 9 | G. R. Farrar and P. Fayet | Phenomenology of the Production, Decay, and Detection of New Hadronic States Associated with Supersymmetry | PLB 76 (1978) 575 | |
| 10 | A. Buras, J. Ellis, M. Gaillard, and D. Nanopoulos | Aspects of the grand unification of strong, weak and electromagnetic interactions | Nuclear Physics B 135 (1978), no. 1, 66 | |
| 11 | H. Haber and G. Kane | The search for supersymmetry: Probing physics beyond the standard model | Physics Reports 117 (1985), no. 2, 75 | |
| 12 | H. Nilles | Supersymmetry, supergravity and particle physics | Physics Reports 110 (1984), no. 1, 1 | |
| 13 | I. Hinchliffe et al. | Precision SUSY measurements at CERN LHC | PRD55 (1997) 5520 | hep-ph/9610544 |
| 14 | CMS Collaboration | Search for Physics Beyond the Standard Model in Events with Two Leptons, Jets, and Missing Transverse Momentum in pp Collisions at $ \sqrt{s} = 8 $ TeV | JHEP 04 (2015) 124 | CMS-SUS-14-014 1502.06031 |
| 15 | CMS Collaboration | Search for new physics in final states with two opposite-sign, same-flavor leptons, jets and missing transverse momentum in pp collisions at $ \sqrt{s} = 13 $ TeV | CMS-SUS-15-011 1607.00915 |
|
| 16 | ATLAS Collaboration | Search for supersymmetry in events containing a same-flavour opposite-sign dilepton pair, jets, and large missing transverse momentum in $ \sqrt{s}=8 $ TeV pp collisions with the ATLAS detector | EPJC 75 (2015) 318 | 1503.03290 |
| 17 | ATLAS Collaboration | A search for Supersymmetry in events containing a leptonically decaying $ Z $ boson, jets, and missing transverse momentum in $ \sqrt{s}=13 $TeV $ pp $ collisions with the ATLAS detector | Technical Report ATLAS-CONF-2015-082, CERN | |
| 18 | CMS Collaboration | The CMS experiment at the CERN LHC | JINST 3 (2008) S08004 | CMS-00-001 |
| 19 | CMS Collaboration | Performance of electron reconstruction and selection with the CMS detector in proton-proton collisions at $ \sqrt{s} =8 $ TeV | JINST 10 (2015) P06005 | CMS-EGM-13-001 1502.02701 |
| 20 | CMS Collaboration | Particle-Flow Event Reconstruction in CMS and Performance for Jets, Taus, and MET | CDS | |
| 21 | CMS Collaboration | Commissioning of the Particle-flow Event Reconstruction with the first LHC collisions recorded in the CMS detector | CDS | |
| 22 | M. Cacciari, G. P. Salam, and G. Soyez | The anti-$ k_t $ jet clustering algorithm | JHEP 04 (2008) 063 | 0802.1189 |
| 23 | M. Cacciari, G. P. Salam, and G. Soyez | FastJet user manual | EPJC 72 (2012) 1896 | 1111.6097 |
| 24 | M. Cacciari and G. P. Salam | Dispelling the N$ ^3 $ myth for the $ k_t $ jet-finder | PLB 641 (2006) 57 | hep-ph/0512210 |
| 25 | CMS Collaboration | Determination of Jet Energy Calibration and Transverse Momentum Resolution in CMS | JINST 6 (2011) P11002 | CMS-JME-10-011 1107.4277 |
| 26 | M. Cacciari and G. P. Salam | Pileup subtraction using jet areas | PLB 659 (2008) 119 | 0707.1378 |
| 27 | CMS Collaboration | Identification of b quark jets at the CMS Experiment in the LHC Run 2 | Technical Report CMS-PAS-BTV-15-001 | |
| 28 | J. Alwall et al. | The automated computation of tree-level and next-to-leading order differential cross sections, and their matching to parton shower simulations | JHEP 07 (2014) 079 | 1405.0301 |
| 29 | S. Alioli, P. Nason, C. Oleari, and E. Re | NLO single-top production matched with shower in POWHEG: s- and t-channel contributions | JHEP 09 (2009) 111 | 0907.4076 |
| 30 | E. Re | Single-top Wt-channel production matched with parton showers using the POWHEG method | EPJC 71 (2011) 1547 | 1009.2450 |
| 31 | R. Gavin, Y. Li, F. Petriello, and S. Quackenbush | FEWZ 2.0: A code for hadronic Z production at next-to-next-to-leading order | CPC 182 (2011) 2388--2403 | 1011.3540 |
| 32 | R. Gavin, Y. Li, F. Petriello, and S. Quackenbush | W Physics at the LHC with FEWZ 2.1 | CPC 184 (2013) 208--214 | 1201.5896 |
| 33 | M. Czakon and A. Mitov | Top++: A Program for the Calculation of the Top-Pair Cross-Section at Hadron Colliders | CPC 185 (2014) 2930 | 1112.5675 |
| 34 | C. Borschensky et al. | Squark and gluino production cross sections in pp collisions at $ \sqrt{s} $ = 13, 14, 33 and 100 TeV | EPJC 74 (2014), no. 12 | 1407.5066 |
| 35 | J. Alwall et al. | The automated computation of tree-level and next-to-leading order differential cross sections, and their matching to parton shower simulations | JHEP 07 (2014) 079 | 1405.0301 |
| 36 | S. Frixione, P. Nason, and C. Oleari | Matching NLO QCD computations with Parton Shower simulations: the POWHEG method | JHEP 11 (2007) 070 | 0709.2092 |
| 37 | T. Sjostrand, S. Mrenna, and P. Z. Skands | A Brief Introduction to PYTHIA 8.1 | CPC 178 (2008) 852--867 | 0710.3820 |
| 38 | NNPDF Collaboration | Parton distributions for the LHC Run II | JHEP 04 (2015) 040 | 1410.8849 |
| 39 | GEANT4 Collaboration | GEANT4 --- a simulation toolkit | NIMA 506 (2003) 250 | |
| 40 | S. Abdullin et al. | The fast simulation of the CMS detector at LHC | J. Phys. Conf. Ser. 331 (2011) 032049 | |
| 41 | S. P. Martin | A Supersymmetry primer | , [Adv. Ser. Direct. High Energy Phys.18,1(1998)] | hep-ph/9709356 |
| 42 | C. G. Lester and D. J. Summers | Measuring masses of semiinvisibly decaying particles pair produced at hadron colliders | PLB 463 (1999) 99 | hep-ph/9906349 |
| 43 | A. Barr, C. Lester, and P. Stephens | A variable for measuring masses at hadron colliders when missing energy is expected; m T 2 : the truth behind the glamour | JPG 29 (2003) 2343 | hep-ph/0304226 |
| 44 | CMS Collaboration | Search for physics beyond the standard model in events with a Z boson, jets, and missing transverse energy in pp collisions at $ \sqrt{s} = 7 $ TeV | Physics Letters B 716 (2012) 260 | |
| 45 | M. J. Oreglia | PhD thesis, Stanford University, 1980 SLAC Report SLAC-R-236, see Appendix D | ||
| 46 | Particle Data Group, J. Beringer et al. | Review of Particle Physics | PRD 86 (2012) 010001 | |
| 47 | F. James and M. Roos | Minuit: A System for Function Minimization and Analysis of the Parameter Errors and Correlations | CPC 10 (1975) 343 | |
| 48 | T. Junk | Confidence level computation for combining searches with small statistics | NIMA 434 (1999) 435 | hep-ex/9902006 |
| 49 | A. L. Read | Presentation of search results: the $ CL_s $ technique | JPG 28 (2002) 2693 | |
| 50 | ATLAS and CMS Collaborations | Procedure for the LHC Higgs boson search combination in summer 2011 | CMS-NOTE-2011-005 | |
| 51 | G. Cowan, K. Cranmer, E. Gross, and O. Vitells | Asymptotic formulae for likelihood-based tests of new physics | EPJC 71 (2011) 1554 | 1007.1727 |
|
|
Compact Muon Solenoid LHC, CERN |
|

|

|

|

|

|