

Compact Muon Solenoid
LHC, CERN
| CMS-PAS-SUS-16-025 | ||
| Search for new physics in the compressed mass spectra scenario using events with two soft opposite-sign leptons and missing transverse momentum at $\sqrt{s}= $ 13 TeV | ||
| CMS Collaboration | ||
| August 2016 | ||
|
Abstract:
A search for new physics in events with two low-momentum opposite-sign leptons and missing transverse momentum is presented using 12.9 fb$^{-1}$ of data collected at 13 TeV in 2016. The observed data yields are compatible with the predictions for standard model processes. The results are interpreted in the context of supersymmetry with compressed mass spectra, described in the form of simplified models. In the first model the lightest chargino ($\tilde{\chi}_1^{\pm}$) and the second-lightest neutralino ($\tilde{\chi}_2^{0}$) are pair produced and degenerate in mass, and decay to the lightest neutralino and a virtual W and Z boson, respectively. At 95% confidence level, $\tilde{\chi}_1^{\pm}$/$\tilde{\chi}_2^{0}$ masses are excluded up to 165 GeV for a mass difference of 7.5 GeV with respect to the lightest neutralino. Previously such a scenario had only been constrained by LEP experiments. The results are also interpreted in a simplified model of top squark pair production for the case that the mass difference between the top squark and the lightest neutralino is below the mass of the W boson. This document has been revised with respect to the version dated August 6, 2016. | ||
| Links: CDS record (PDF) ; inSPIRE record ; CADI line (restricted) ; | ||
| Additional information on efficiencies needed for reinterpretation of these results are available here. |
| Figures | |
png pdf |
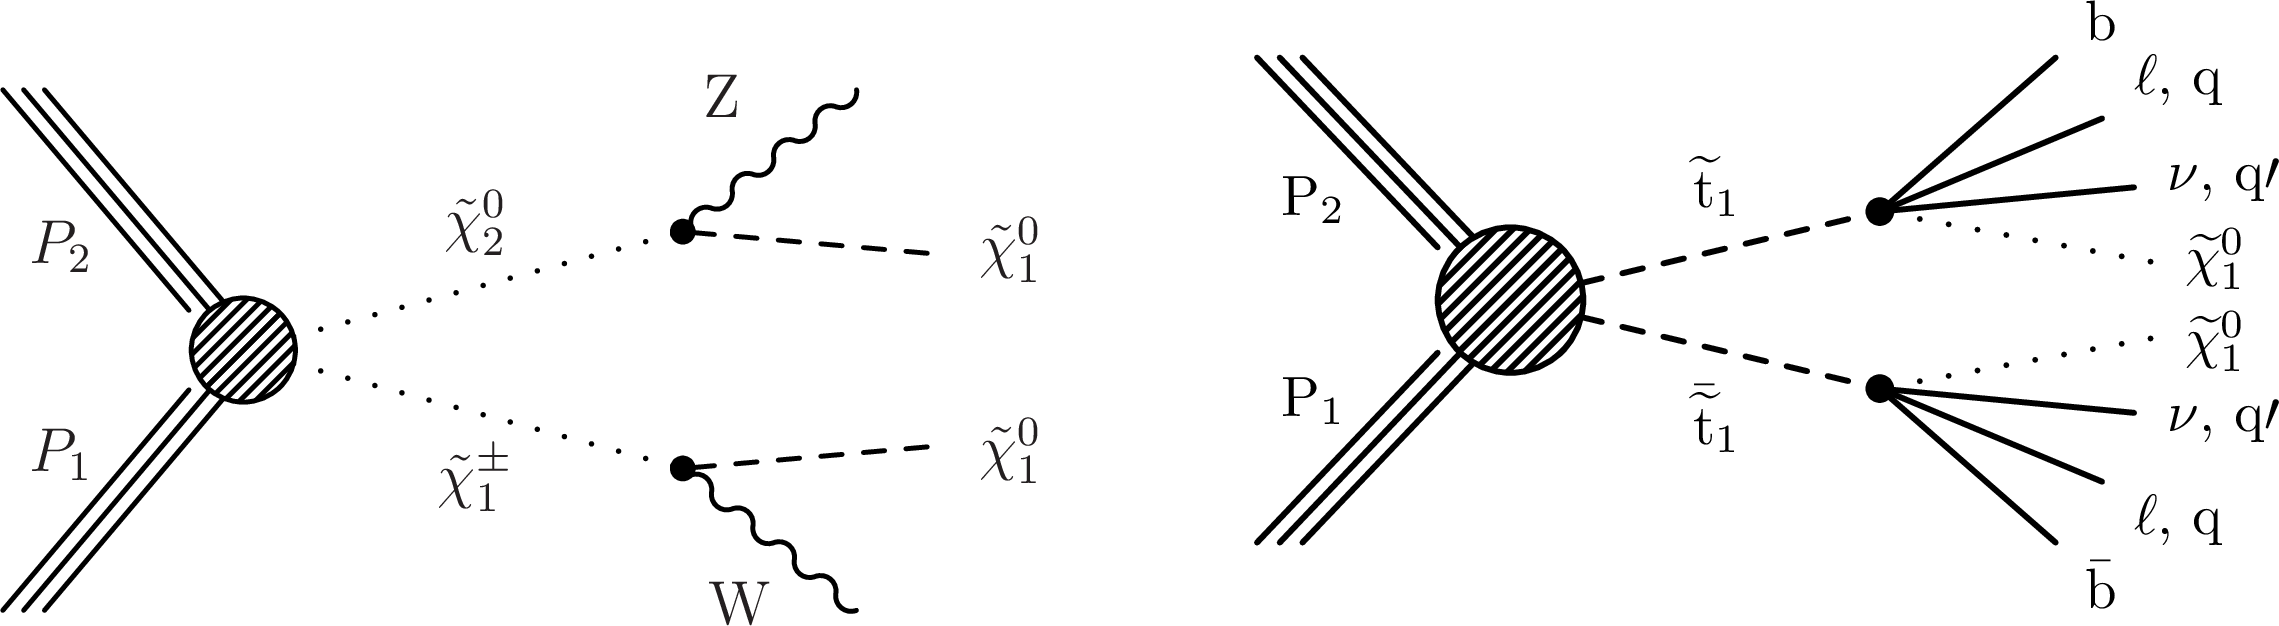
Figure 1:
Left: electroweakino pair production. Right: $\tilde{ \mathrm{ t } }$ four-body decay. The model used to interpret the results represents a simplified version of the four body decay in which the top quark decay width is neglected. |

png pdf |
Figure 1-a:
Electroweakino pair production. |

png pdf |
Figure 1-b:
$\tilde{ \mathrm{ t } }$ four-body decay. The model used to interpret the results represents a simplified version of the four body decay in which the top quark decay width is neglected. |
png pdf |
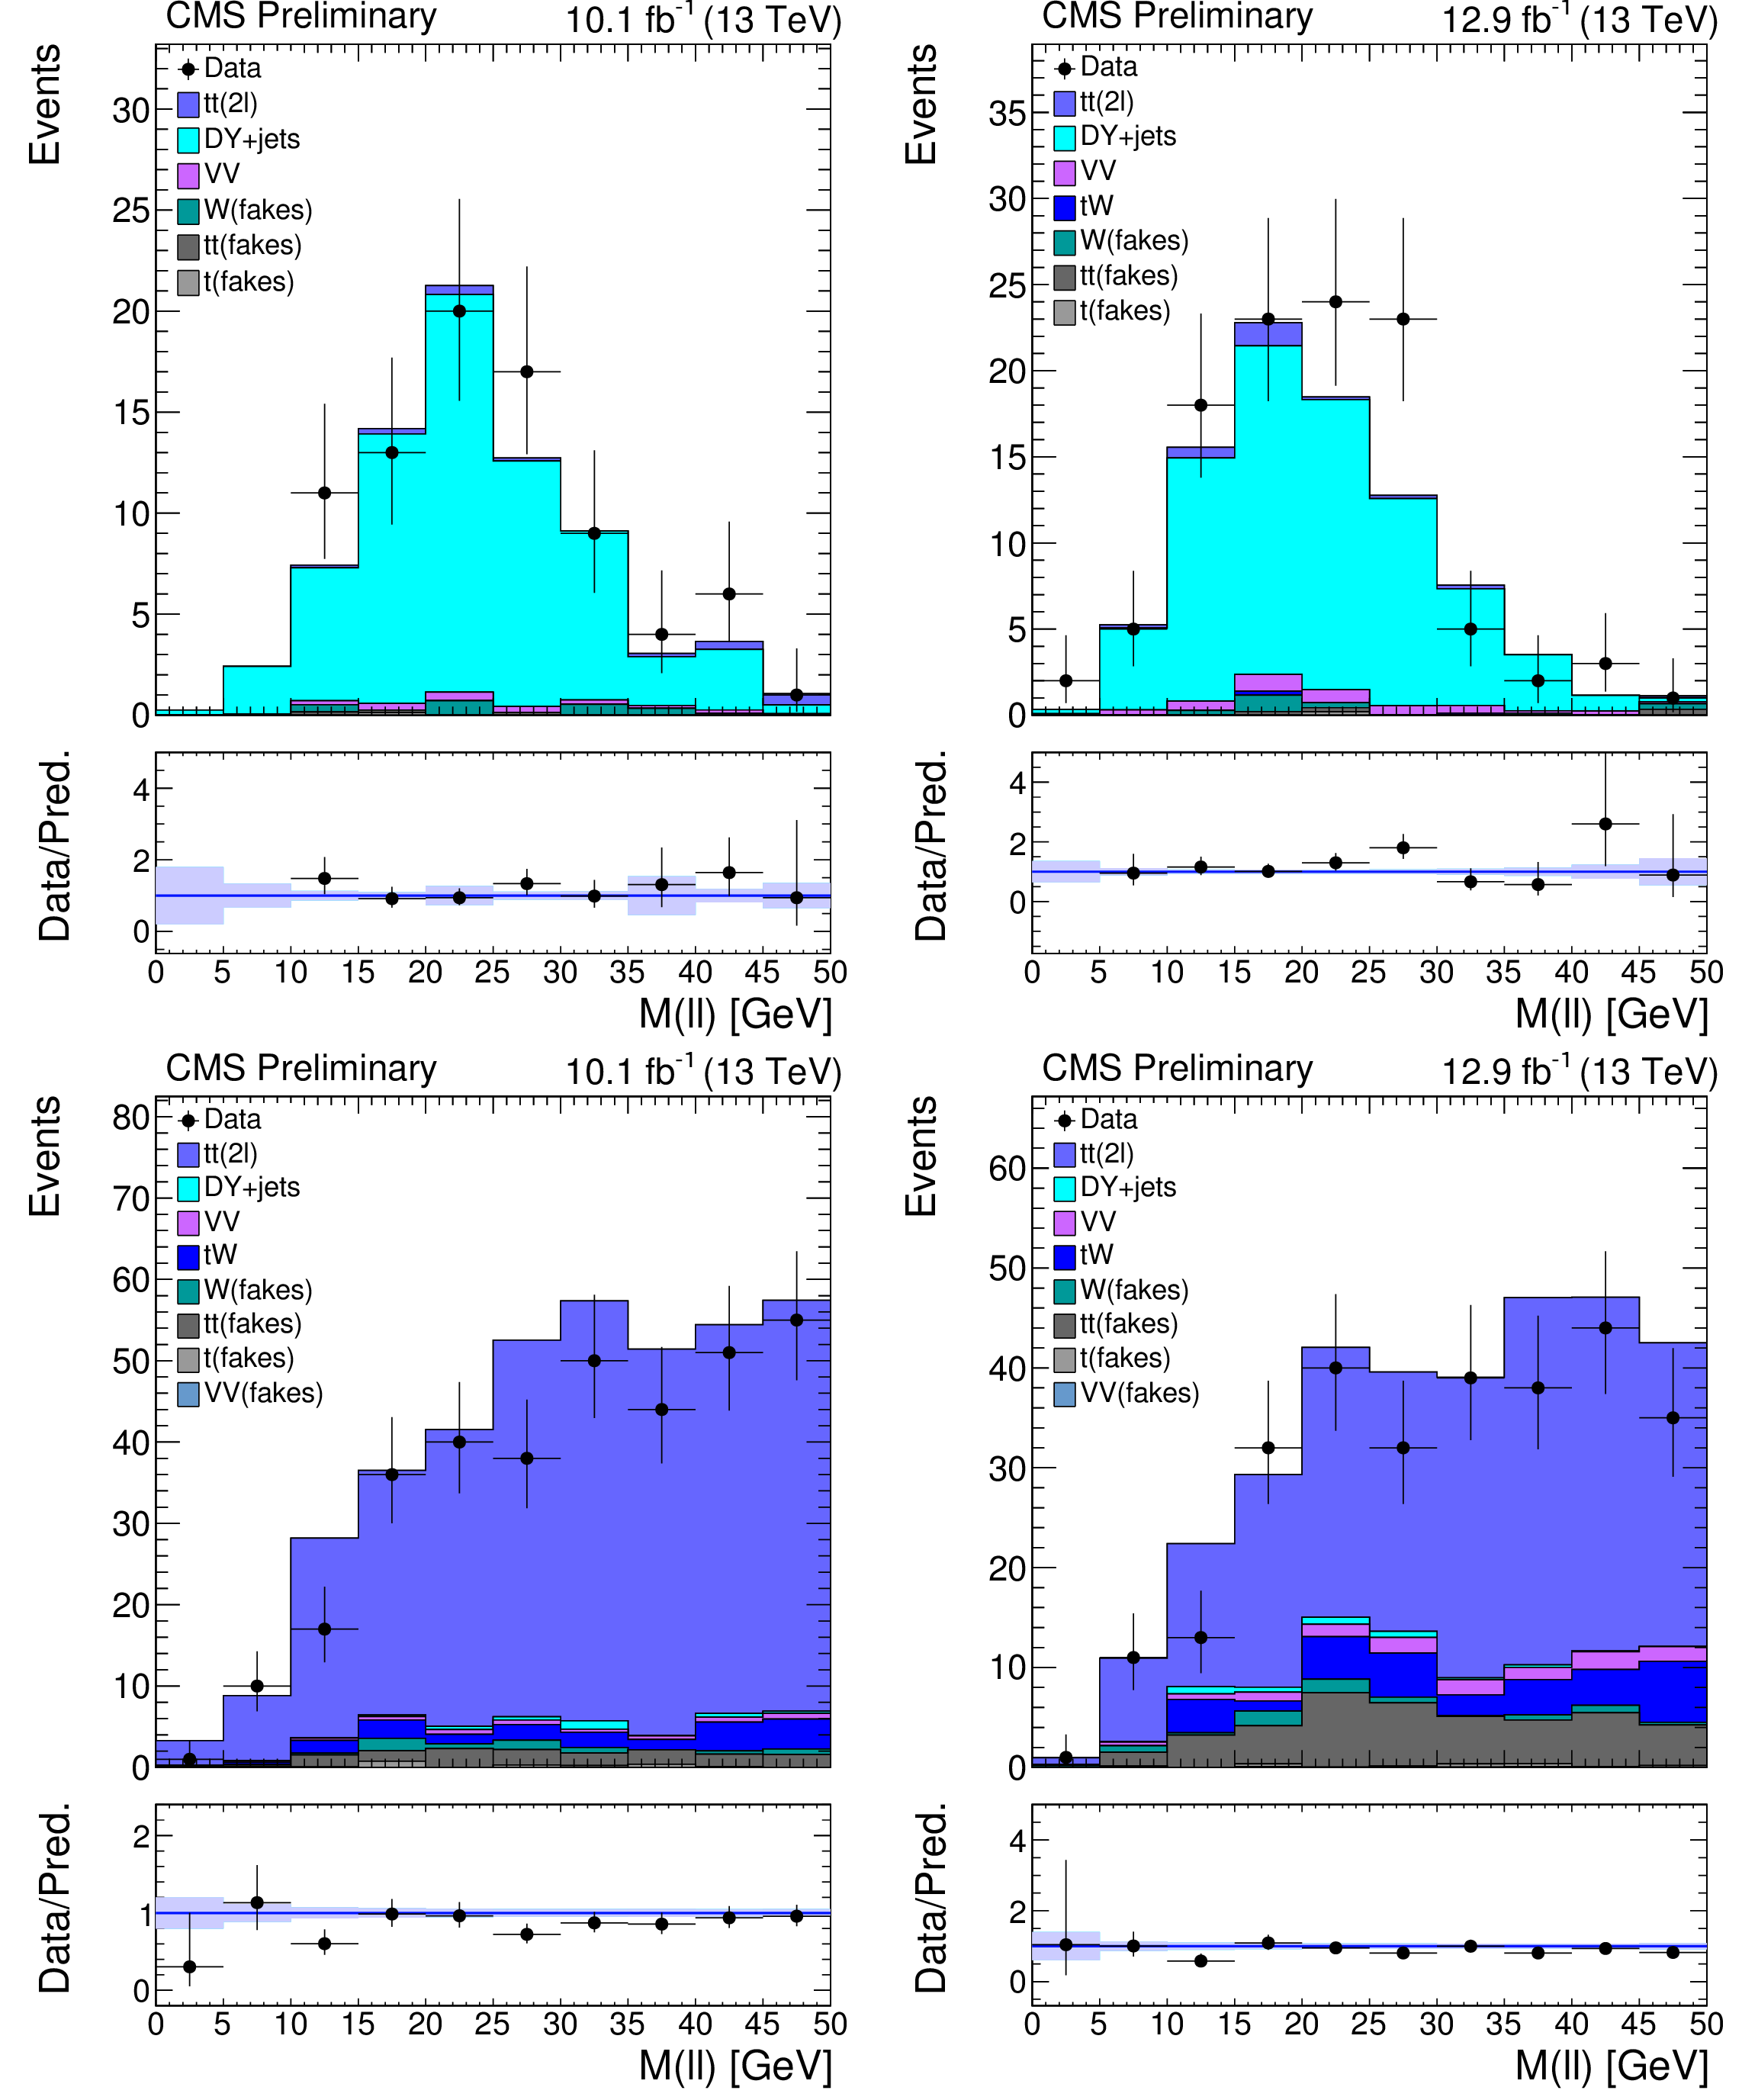
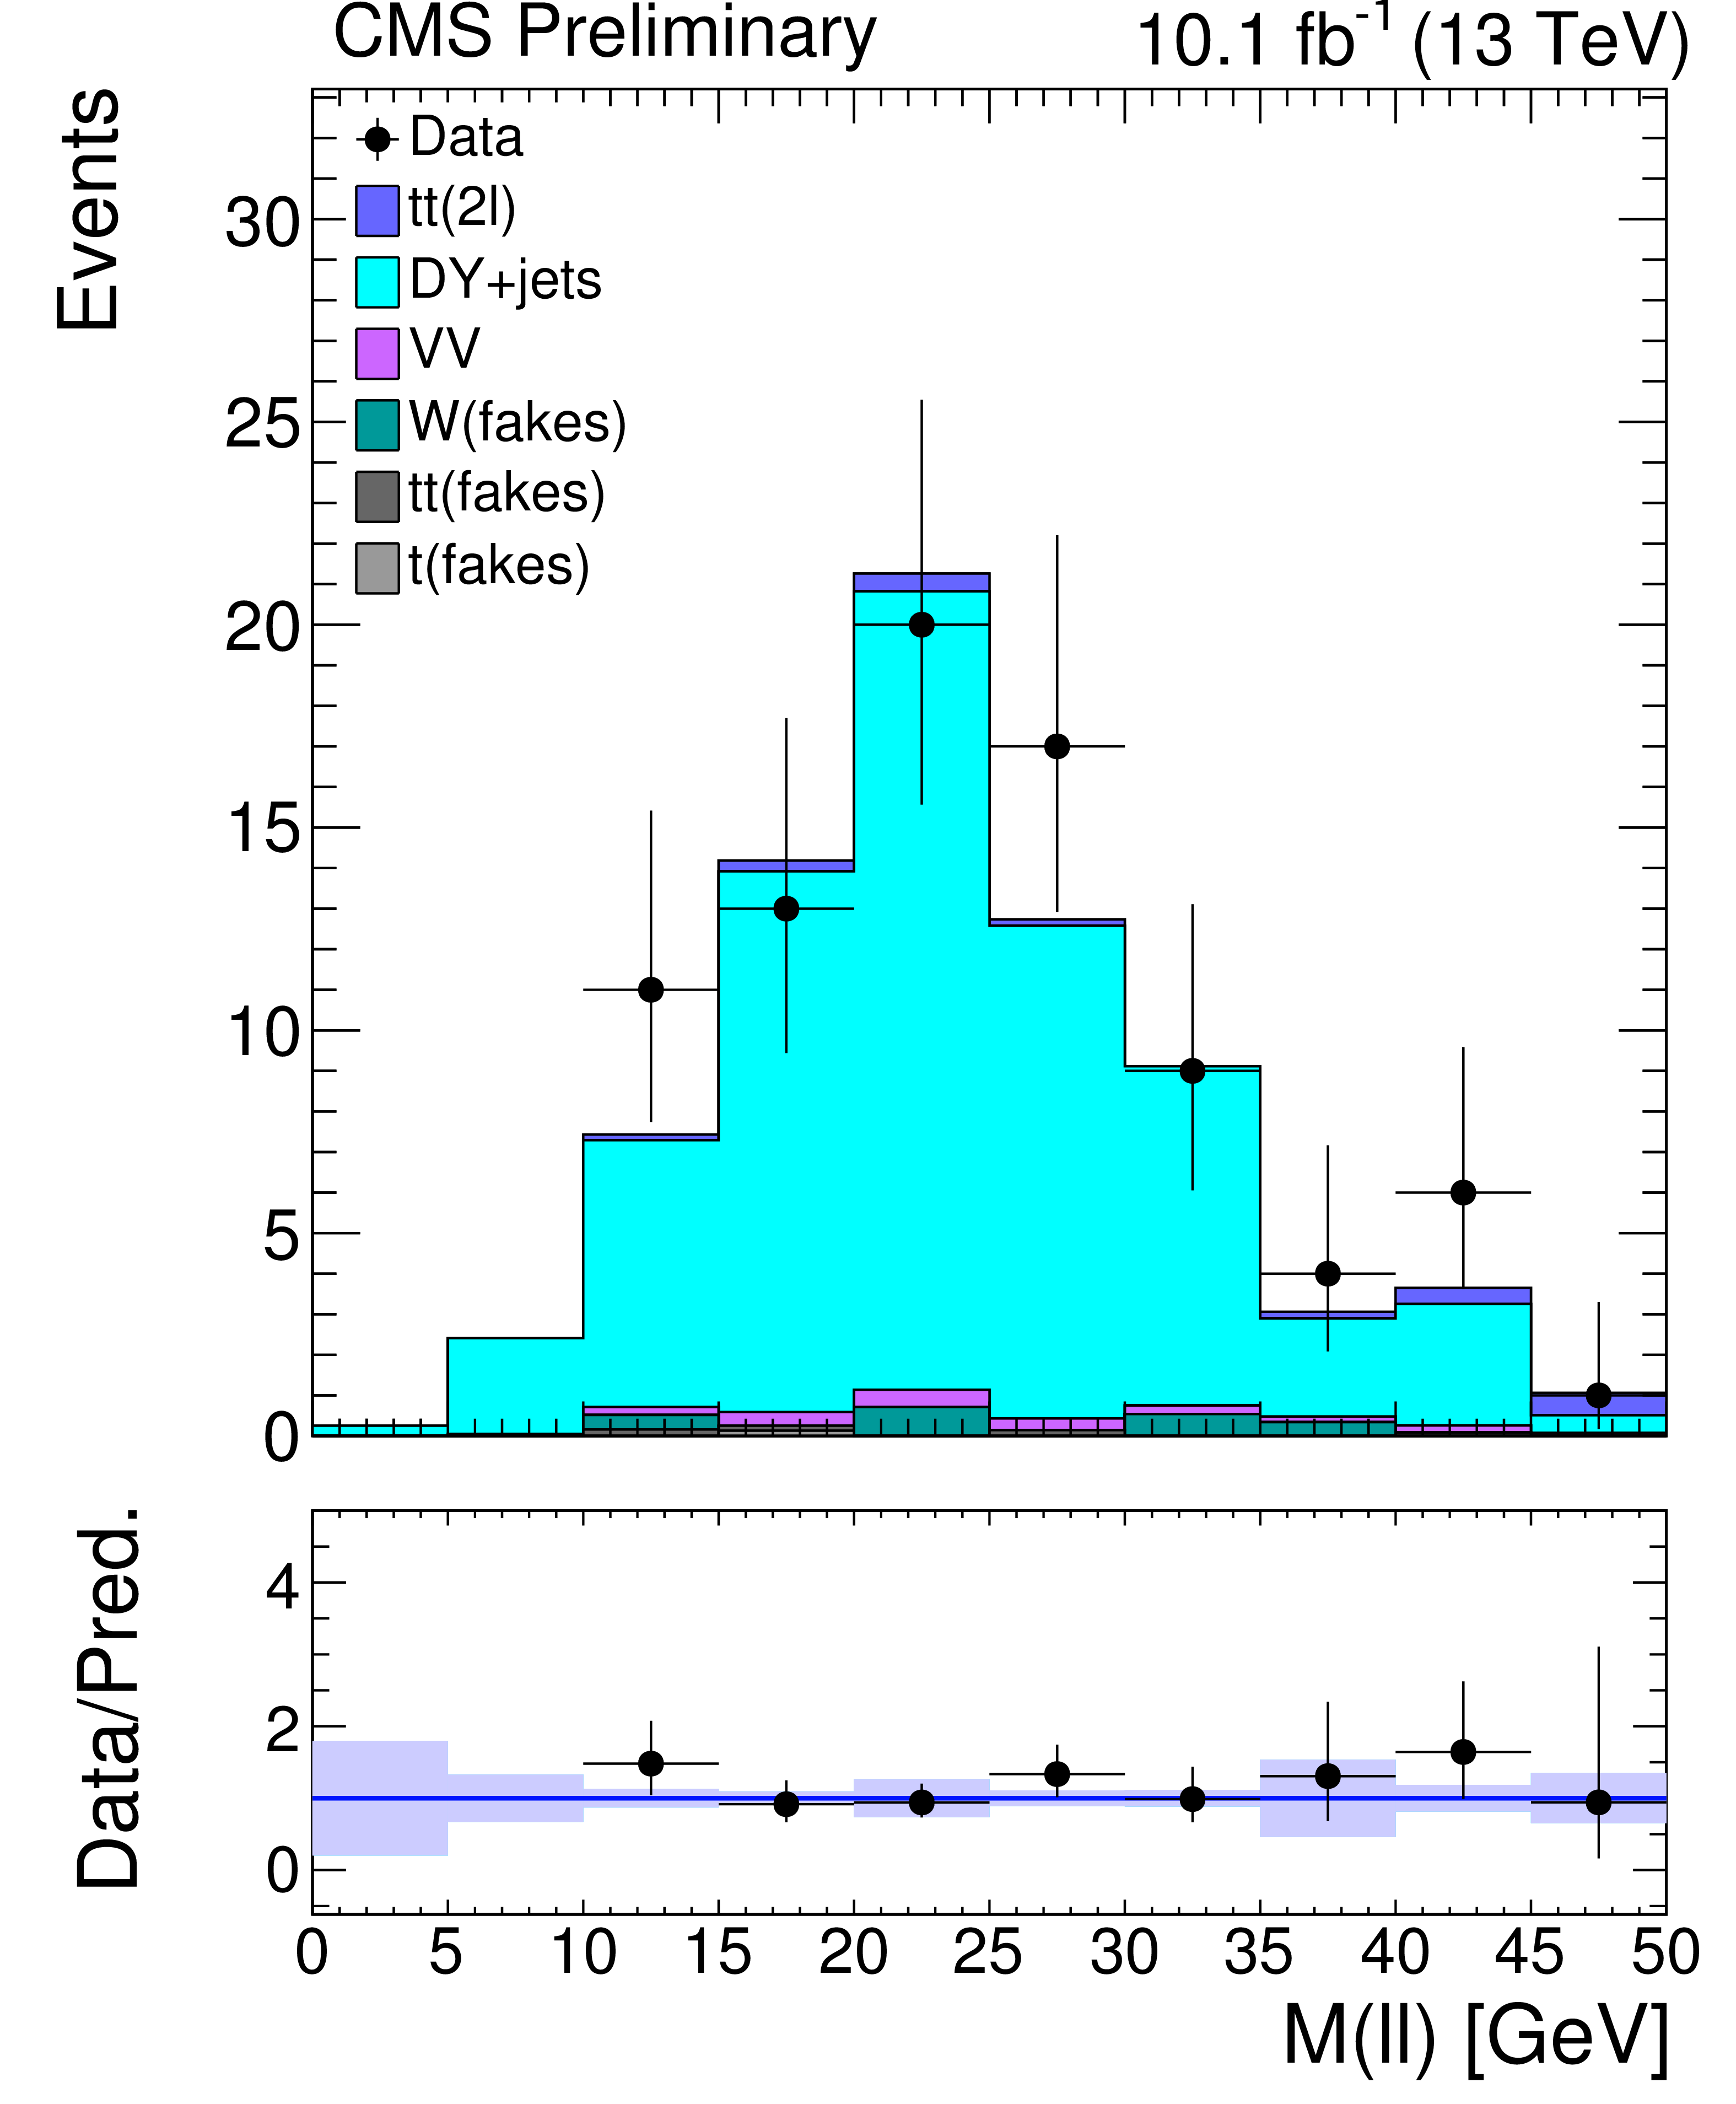
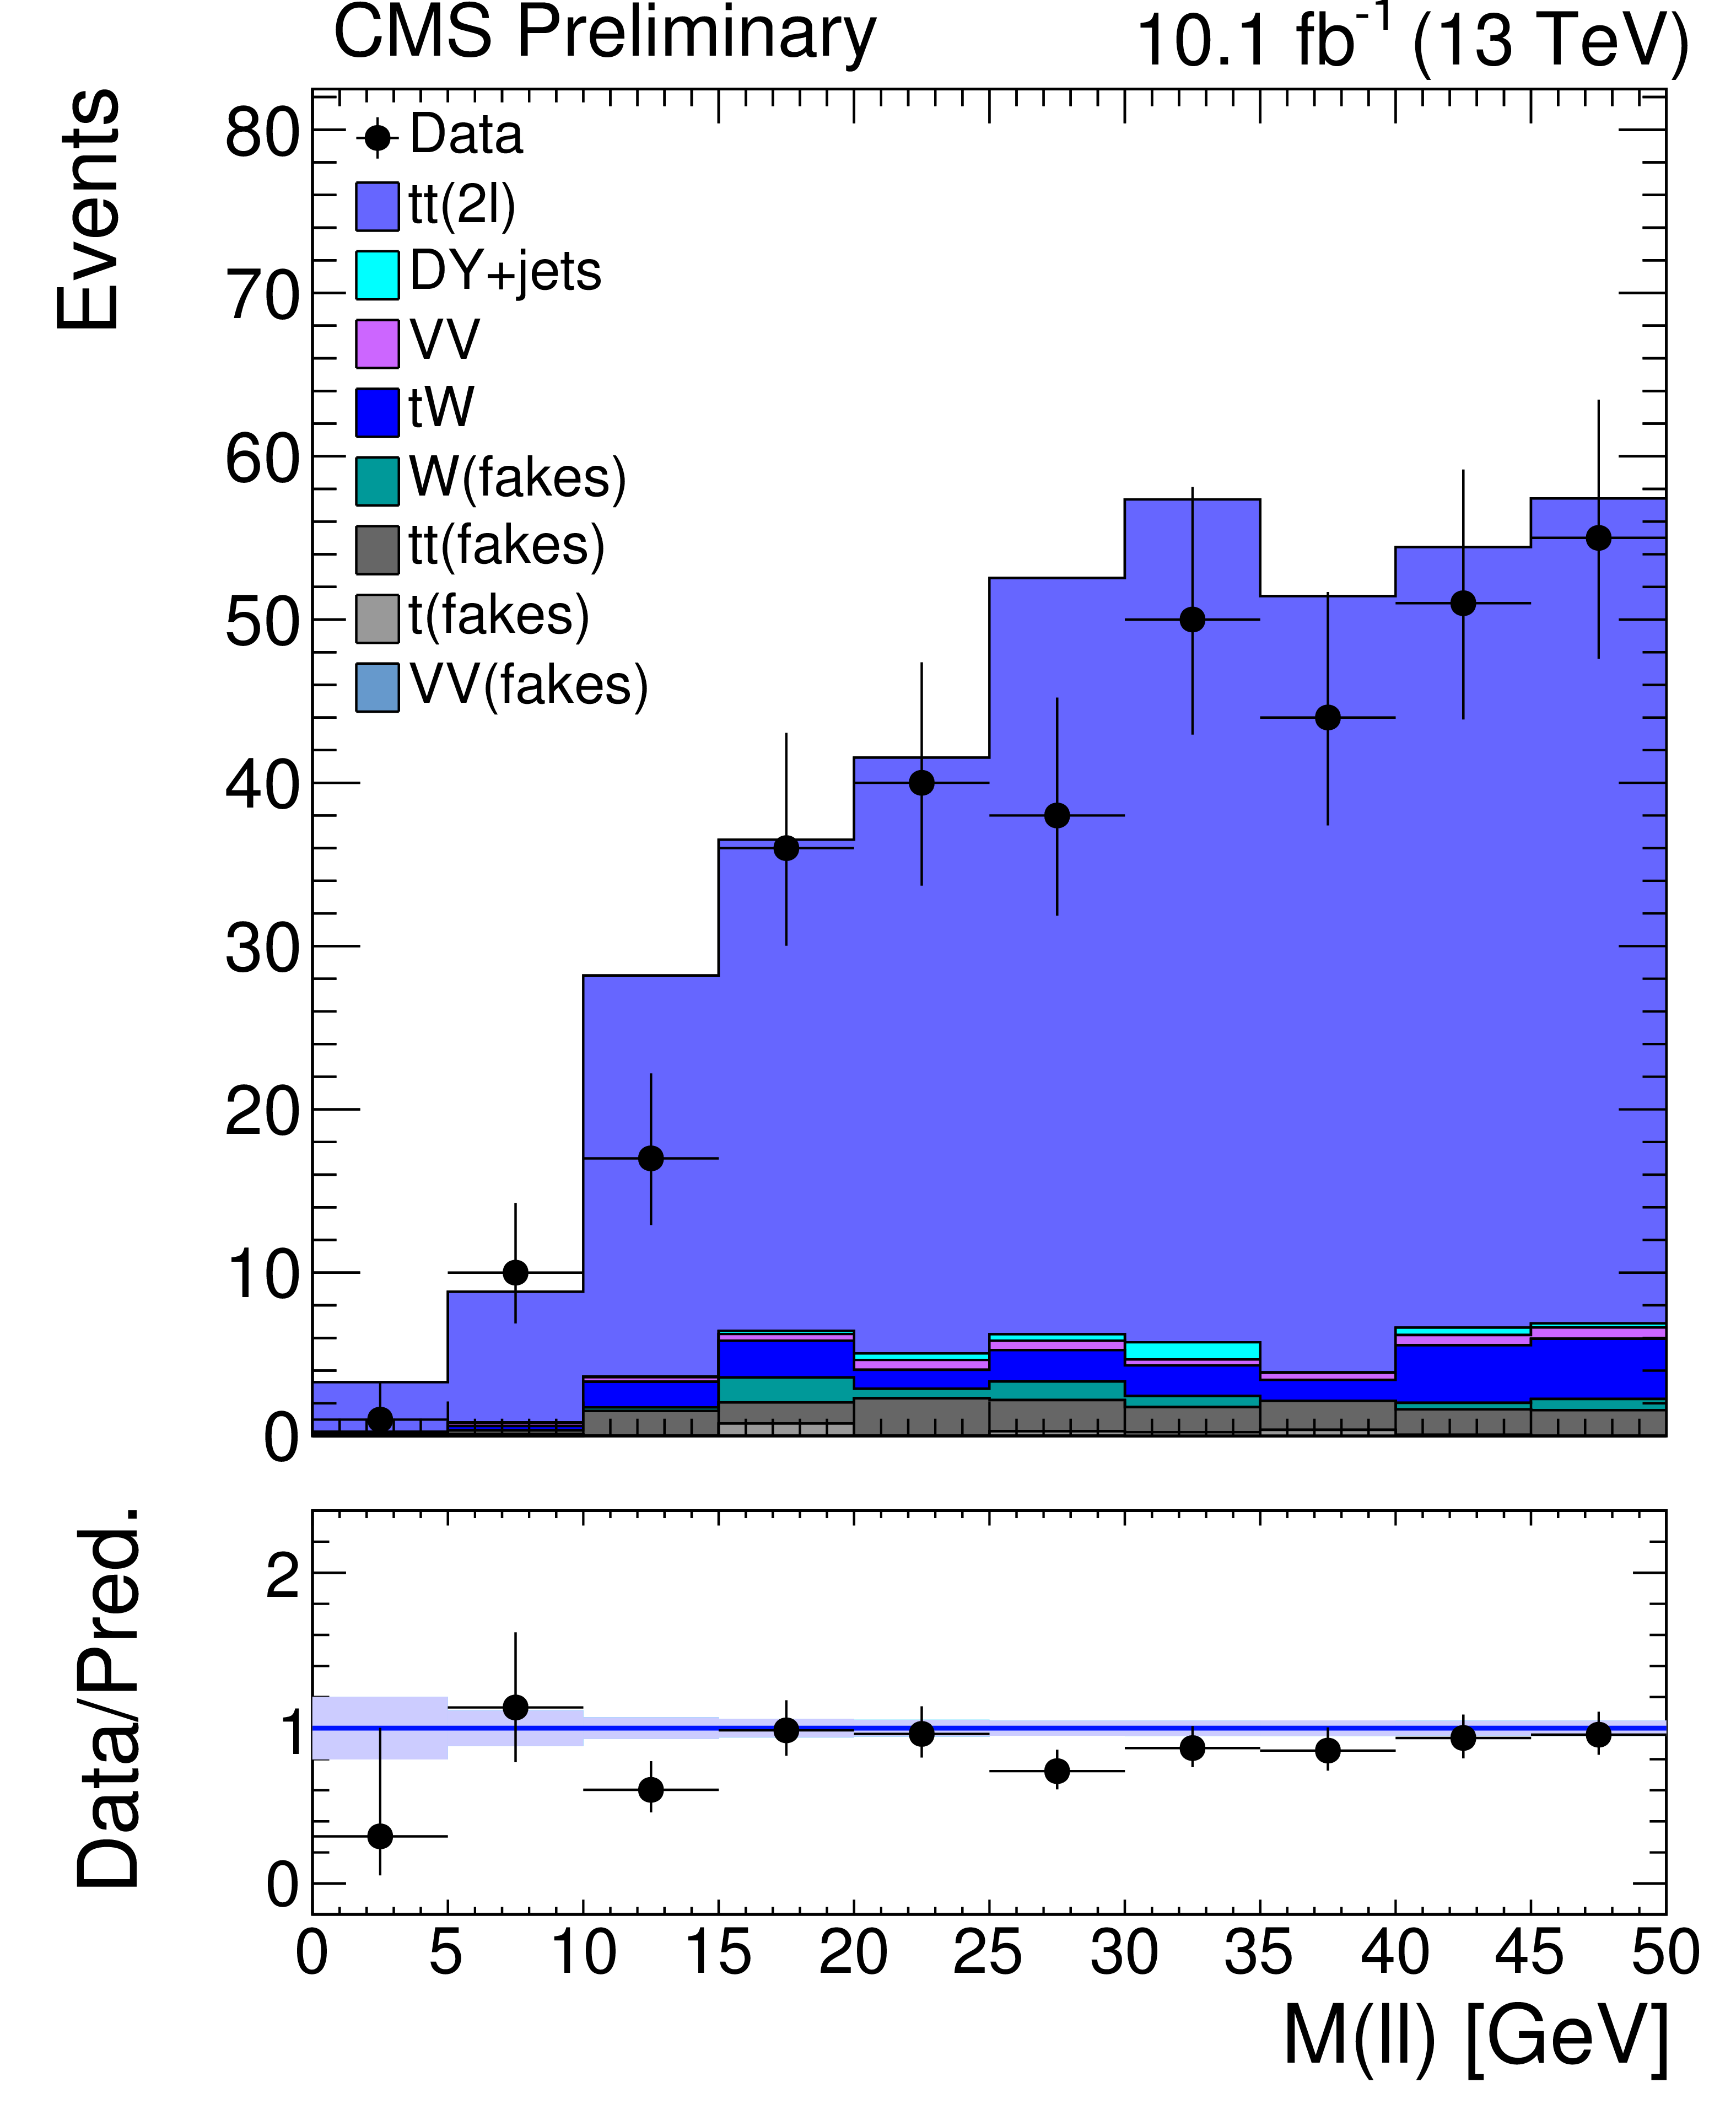
Figure 2:
M$(\ell \ell )$ distributions for DY+jets (top) and $ {\mathrm{ t } {}\mathrm{ \bar{t} } } $ (bottom) control regions. Left: control regions with low $ {E_{\mathrm {T}}^{\text {miss}}} $. Right: control regions with high $ {E_{\mathrm {T}}^{\text {miss}}} $. The bands in data/prediction ratio reflect the statistical uncertainty on the simulation. |
png pdf |
Figure 2-a:
M$(\ell \ell )$ distribution for the DY+jets control region with low $ {E_{\mathrm {T}}^{\text {miss}}} $. The bands in data/prediction ratio reflect the statistical uncertainty on the simulation. |

png pdf |
Figure 2-b:
M$(\ell \ell )$ distribution for the DY+jets control region with high $ {E_{\mathrm {T}}^{\text {miss}}} $. The bands in data/prediction ratio reflect the statistical uncertainty on the simulation. |
png pdf |
Figure 2-c:
M$(\ell \ell )$ distribution for the $ {\mathrm{ t } {}\mathrm{ \bar{t} } } $ control region with low $ {E_{\mathrm {T}}^{\text {miss}}} $. The bands in data/prediction ratio reflect the statistical uncertainty on the simulation. |

png pdf |
Figure 2-d:
M$(\ell \ell )$ distribution for the $ {\mathrm{ t } {}\mathrm{ \bar{t} } } $ control region with high $ {E_{\mathrm {T}}^{\text {miss}}} $. The bands in data/prediction ratio reflect the statistical uncertainty on the simulation. |

png pdf |
Figure 3:
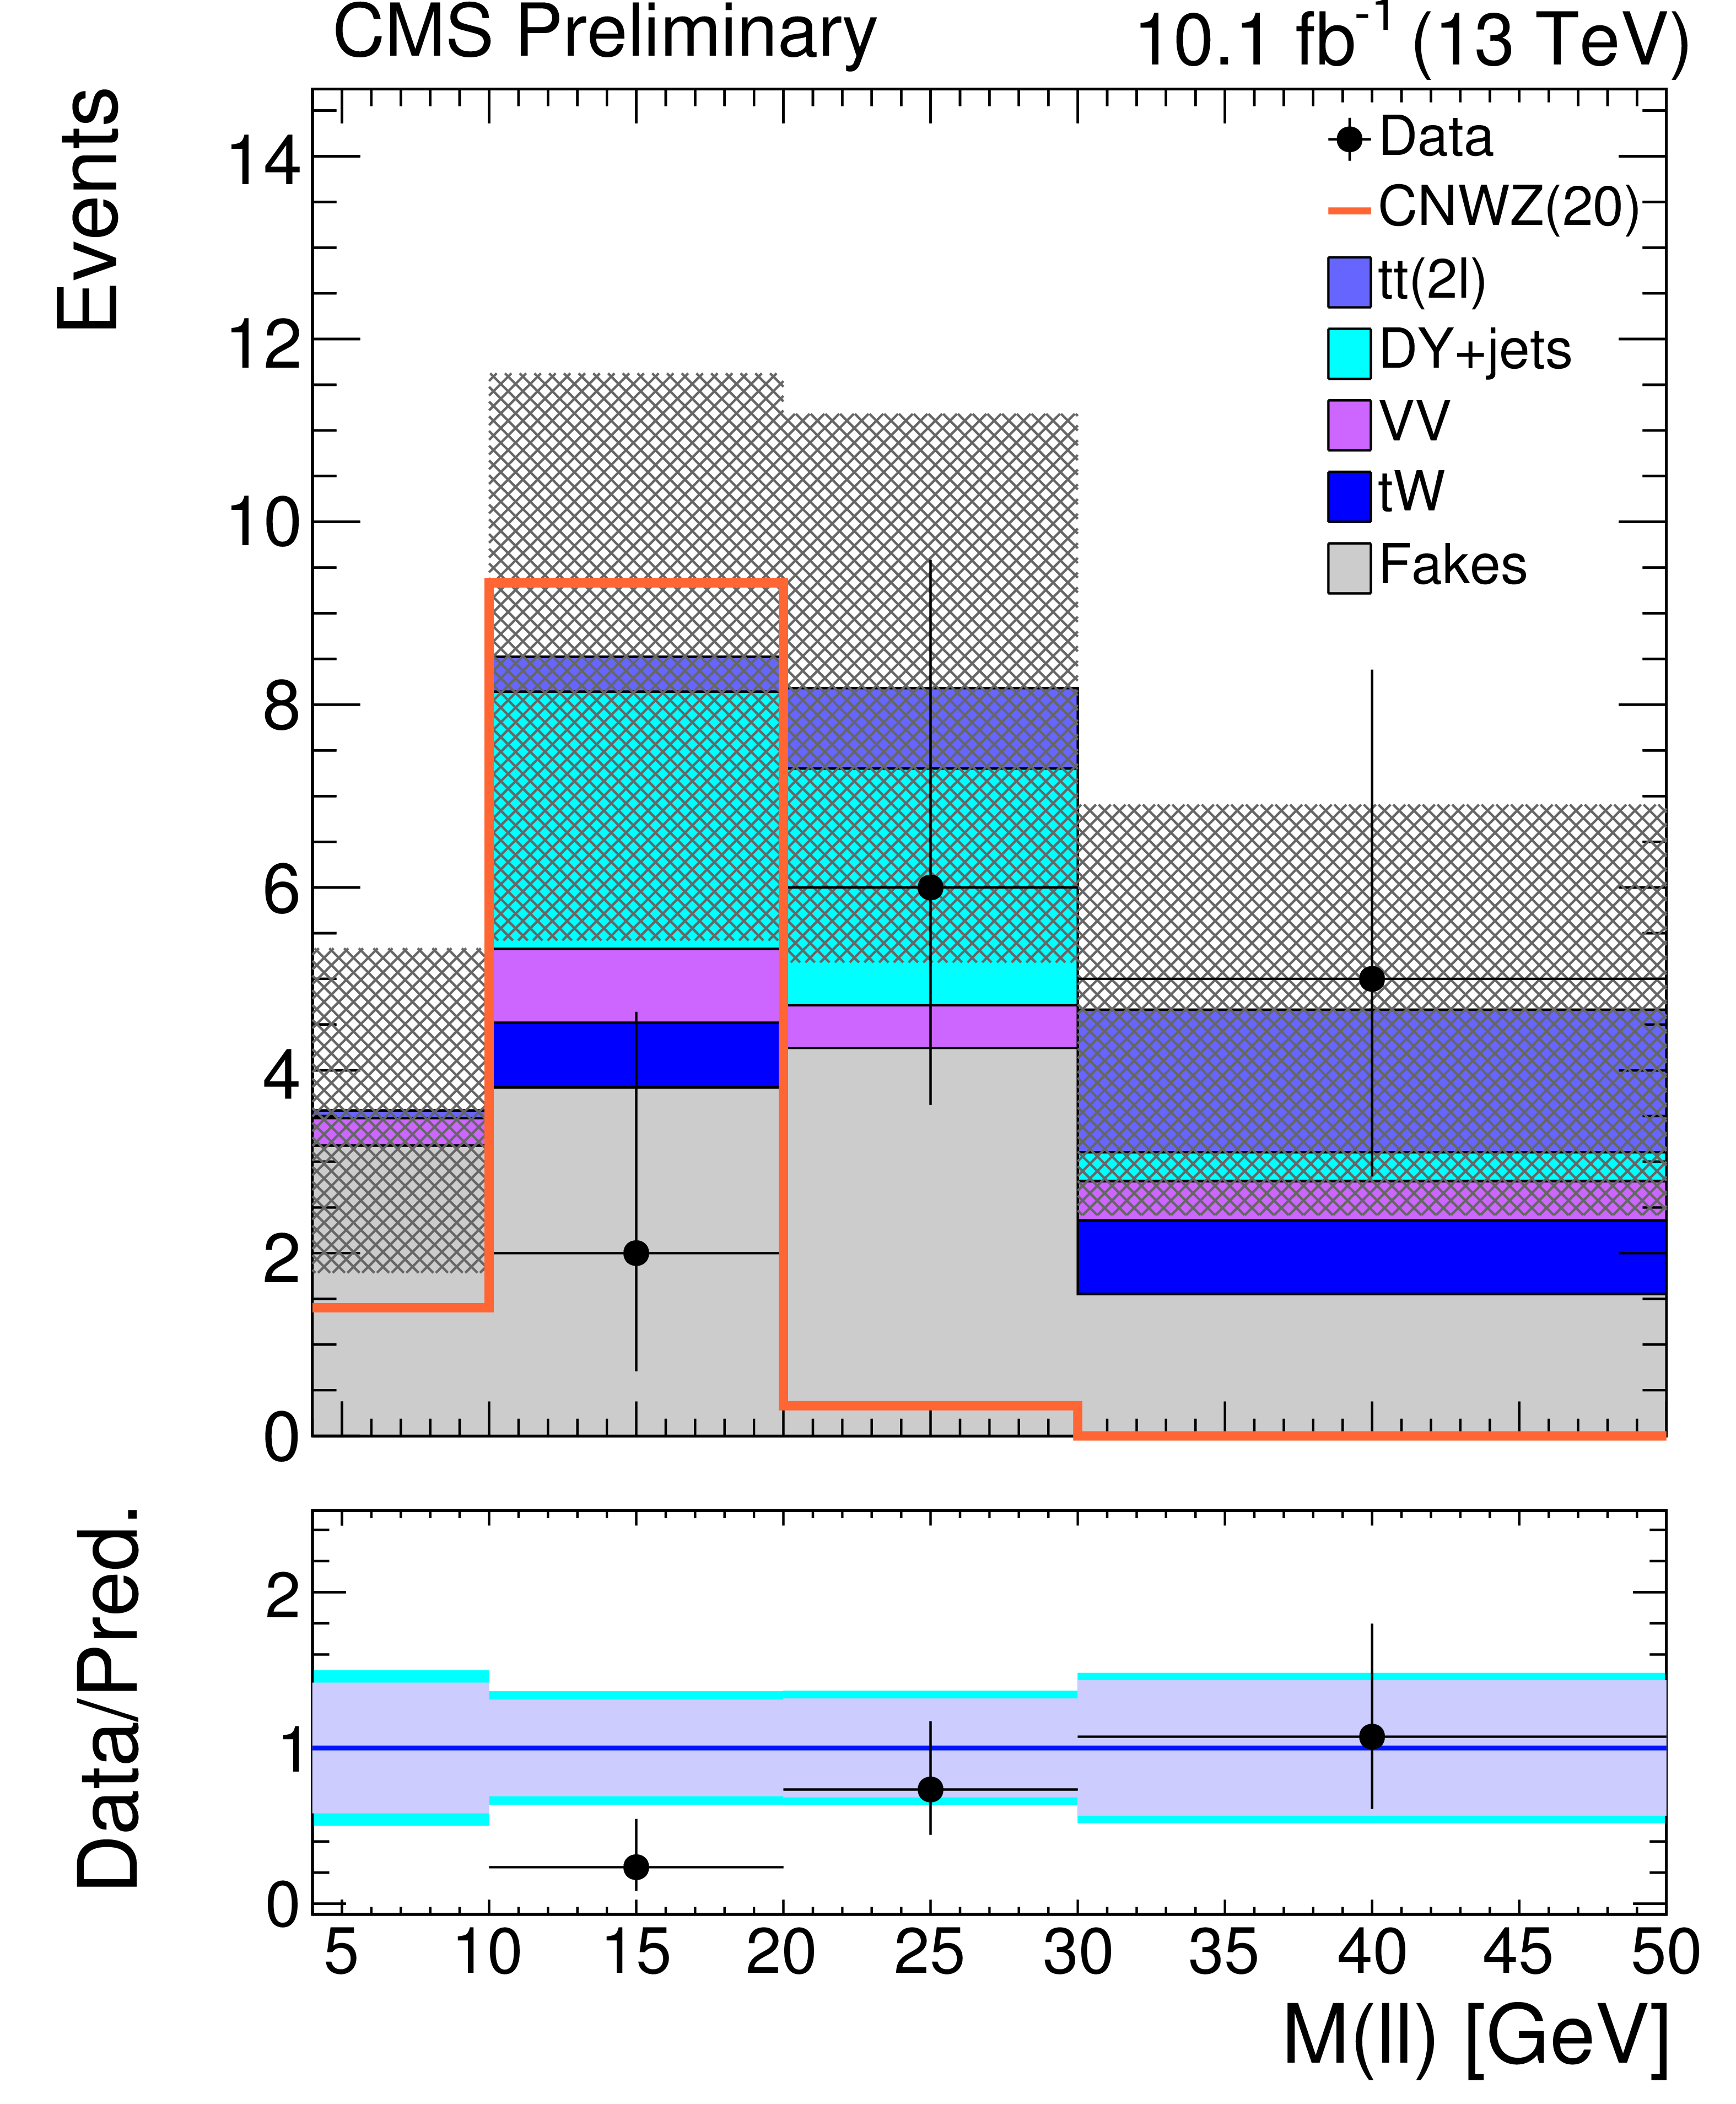
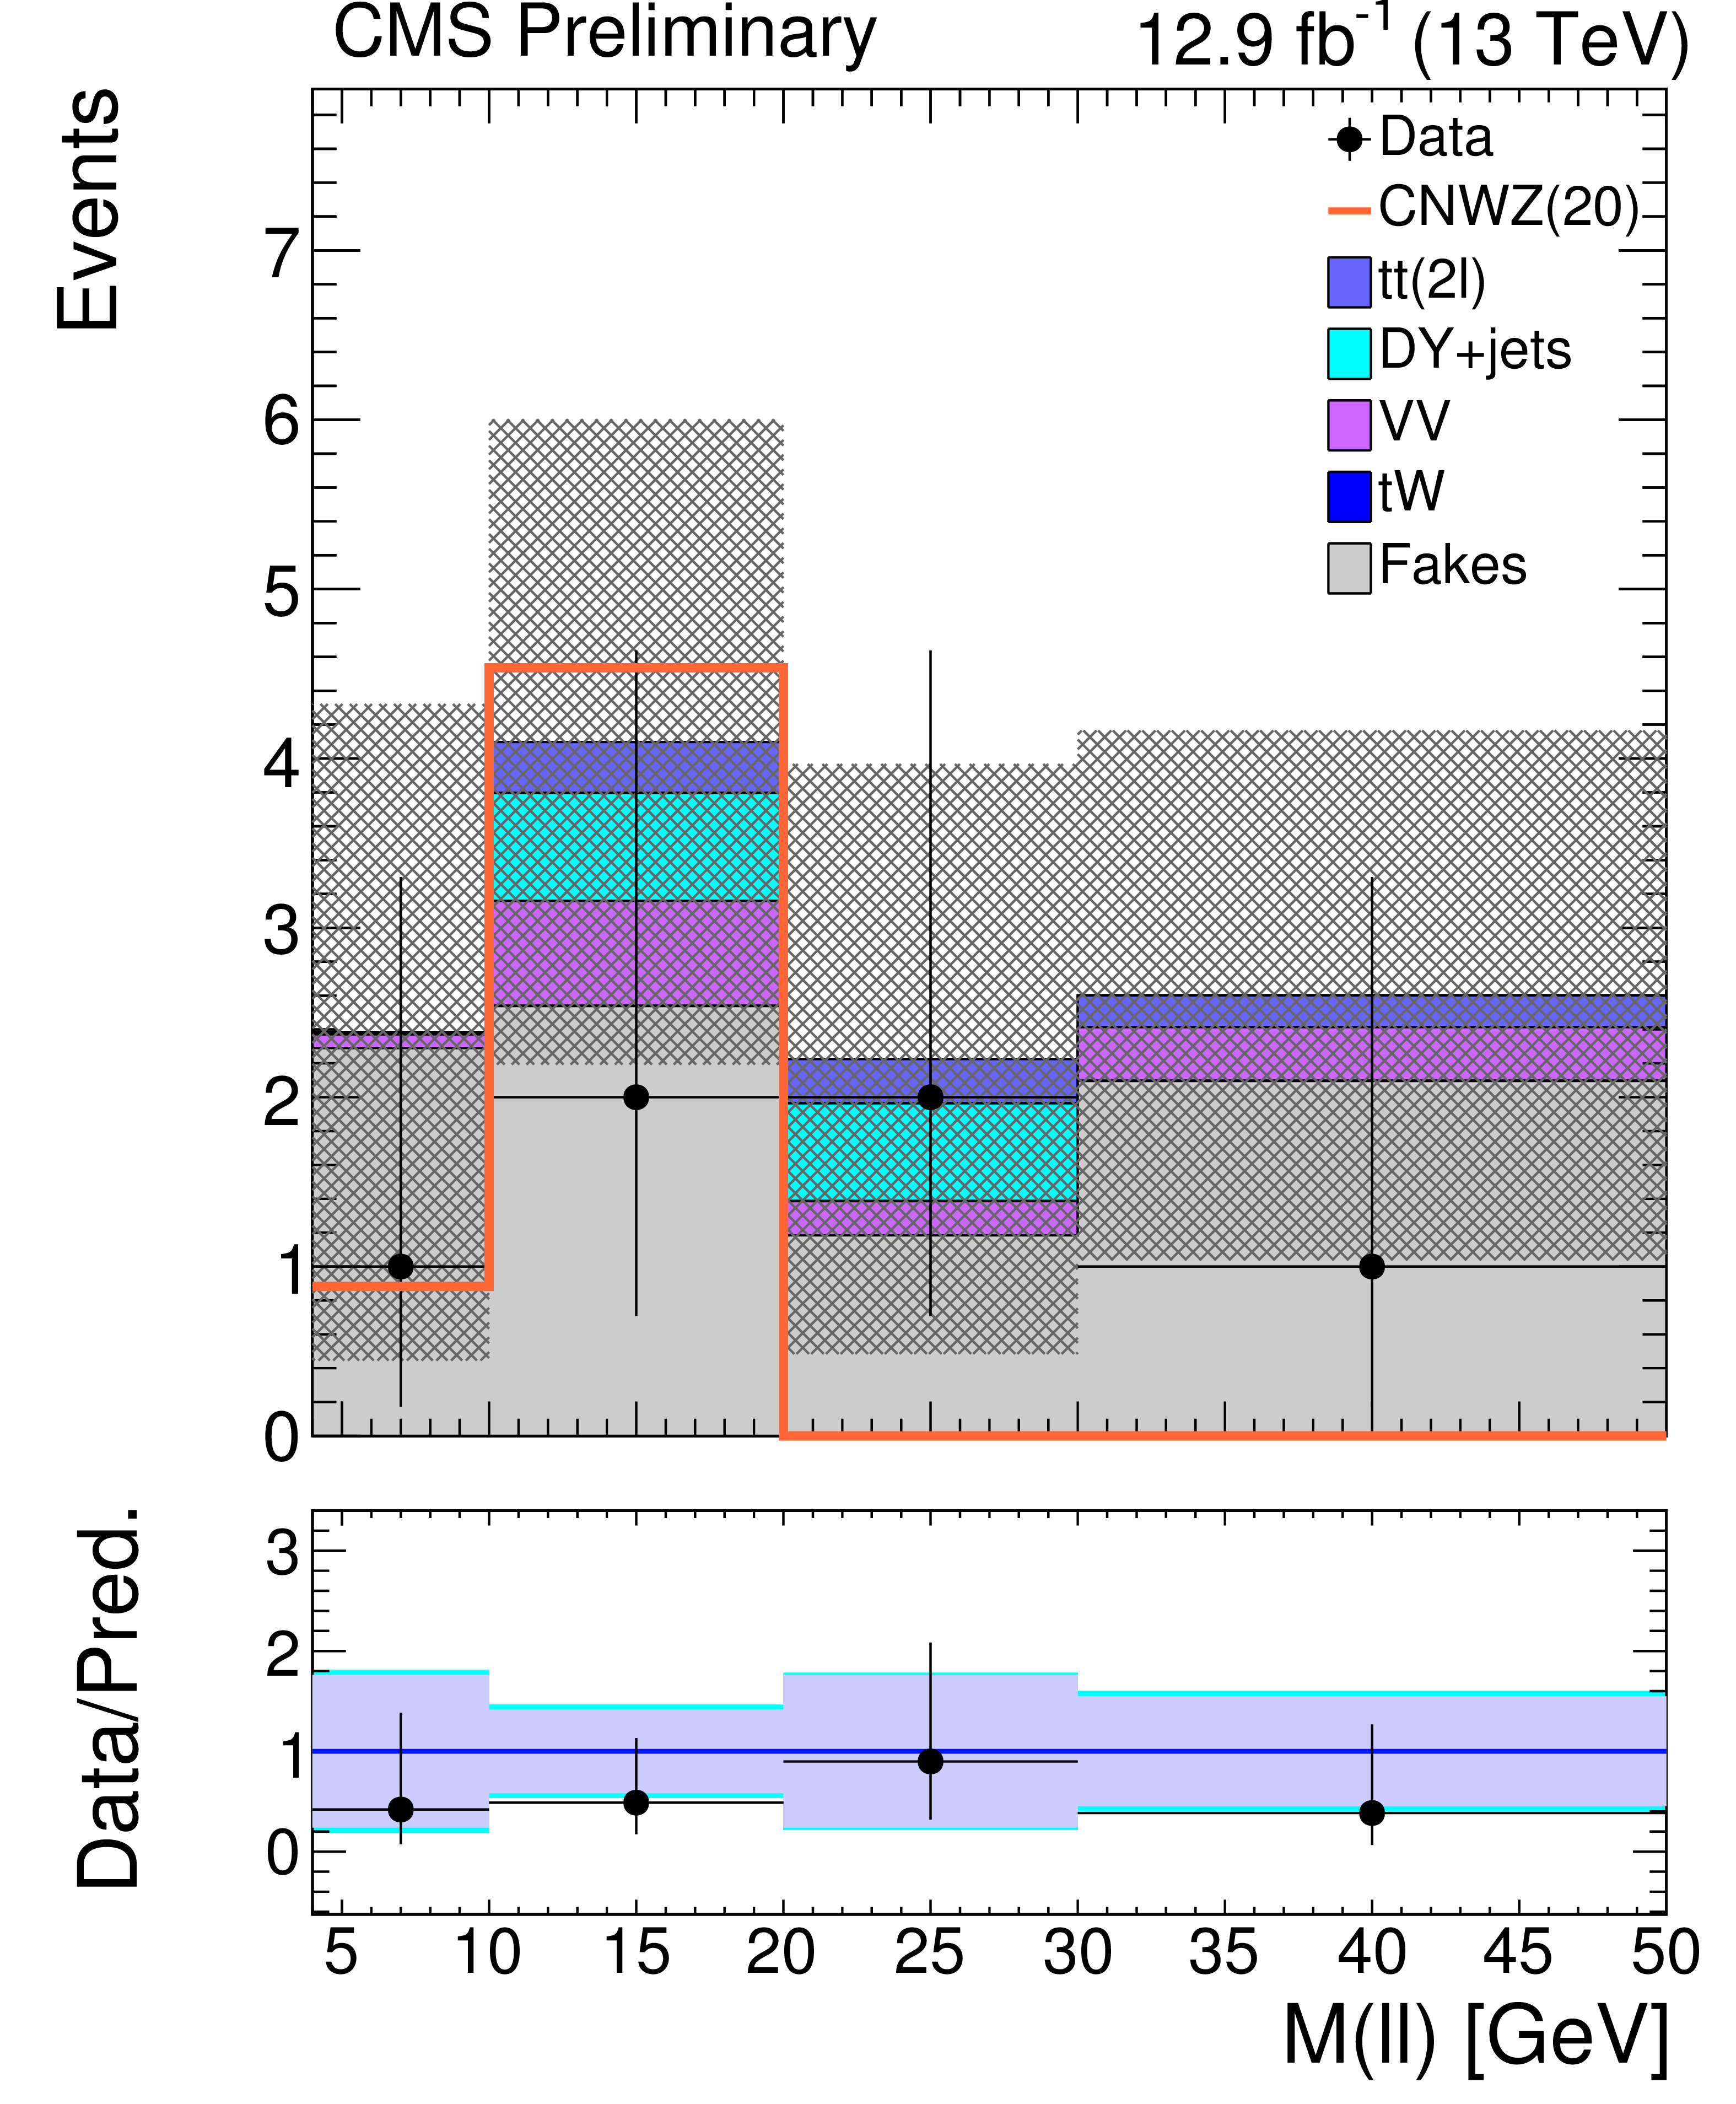
Dilepton mass distributions in data, compared with the SM predictions, in electroweakino-like signal region for two $ {E_{\mathrm {T}}^{\text {miss}}} $ ranges: 125 $< {E_{\mathrm {T}}^{\text {miss}}} <$ 200 GeV (muon channel) (left) and $ {E_{\mathrm {T}}^{\text {miss}}} > $ 200 GeV (muon and electron channels) (right) for 10.1 fb$^{-1}$ and 12.9 fb$^{-1}$ of integrated luminosity, respectively. The shaded grey band in the SM prediction is the total uncertainty, calculated from the statistical uncertainties in the data application regions and the systematic uncertainty for each SM background yield. In the ratio plot the light purple band indicates the statistical uncertainty, while the light cyan band includes both statistical and systematic uncertainties. The signal corresponding to $\tilde{\chi}^0 _2\tilde{\chi}^{\pm} _1 \rightarrow \tilde{\chi}^0 _1\tilde{\chi}^0 _1 \mathrm{ZW^{*}}$ for a $\tilde{\chi}^0 _2$ mass of 100 GeV and a difference ($\Delta m$) between $\tilde{\chi}^{0} _2$ and $\tilde{\chi}^{0} _1$ of 20 GeV is superimposed. |
png pdf |
Figure 3-a:
Dilepton mass distribution in data, compared with the SM predictions, in electroweakino-like signal region125 $< {E_{\mathrm {T}}^{\text {miss}}} <$ 200 GeV (muon channel), for 10.1 fb$^{-1}$ of integrated luminosity. The shaded grey band in the SM prediction is the total uncertainty, calculated from the statistical uncertainties in the data application regions and the systematic uncertainty for each SM background yield. In the ratio plot the light purple band indicates the statistical uncertainty, while the light cyan band includes both statistical and systematic uncertainties. The signal corresponding to $\tilde{\chi}^0 _2\tilde{\chi}^{\pm} _1 \rightarrow \tilde{\chi}^0 _1\tilde{\chi}^0 _1 \mathrm{ZW^{*}}$ for a $\tilde{\chi}^0 _2$ mass of 100 GeV and a difference ($\Delta m$) between $\tilde{\chi}^{0} _2$ and $\tilde{\chi}^{0} _1$ of 20 GeV is superimposed. |
png pdf |
Figure 3-b:
Dilepton mass distributions in data, compared with the SM predictions, in electroweakino-like signal region for $ {E_{\mathrm {T}}^{\text {miss}}} > $ 200 GeV (muon and electron channels) for 12.9 fb$^{-1}$ of integrated luminosity, respectively. The shaded grey band in the SM prediction is the total uncertainty, calculated from the statistical uncertainties in the data application regions and the systematic uncertainty for each SM background yield. In the ratio plot the light purple band indicates the statistical uncertainty, while the light cyan band includes both statistical and systematic uncertainties. The signal corresponding to $\tilde{\chi}^0 _2\tilde{\chi}^{\pm} _1 \rightarrow \tilde{\chi}^0 _1\tilde{\chi}^0 _1 \mathrm{ZW^{*}}$ for a $\tilde{\chi}^0 _2$ mass of 100 GeV and a difference ($\Delta m$) between $\tilde{\chi}^{0} _2$ and $\tilde{\chi}^{0} _1$ of 20 GeV is superimposed. |

png pdf |
Figure 4:
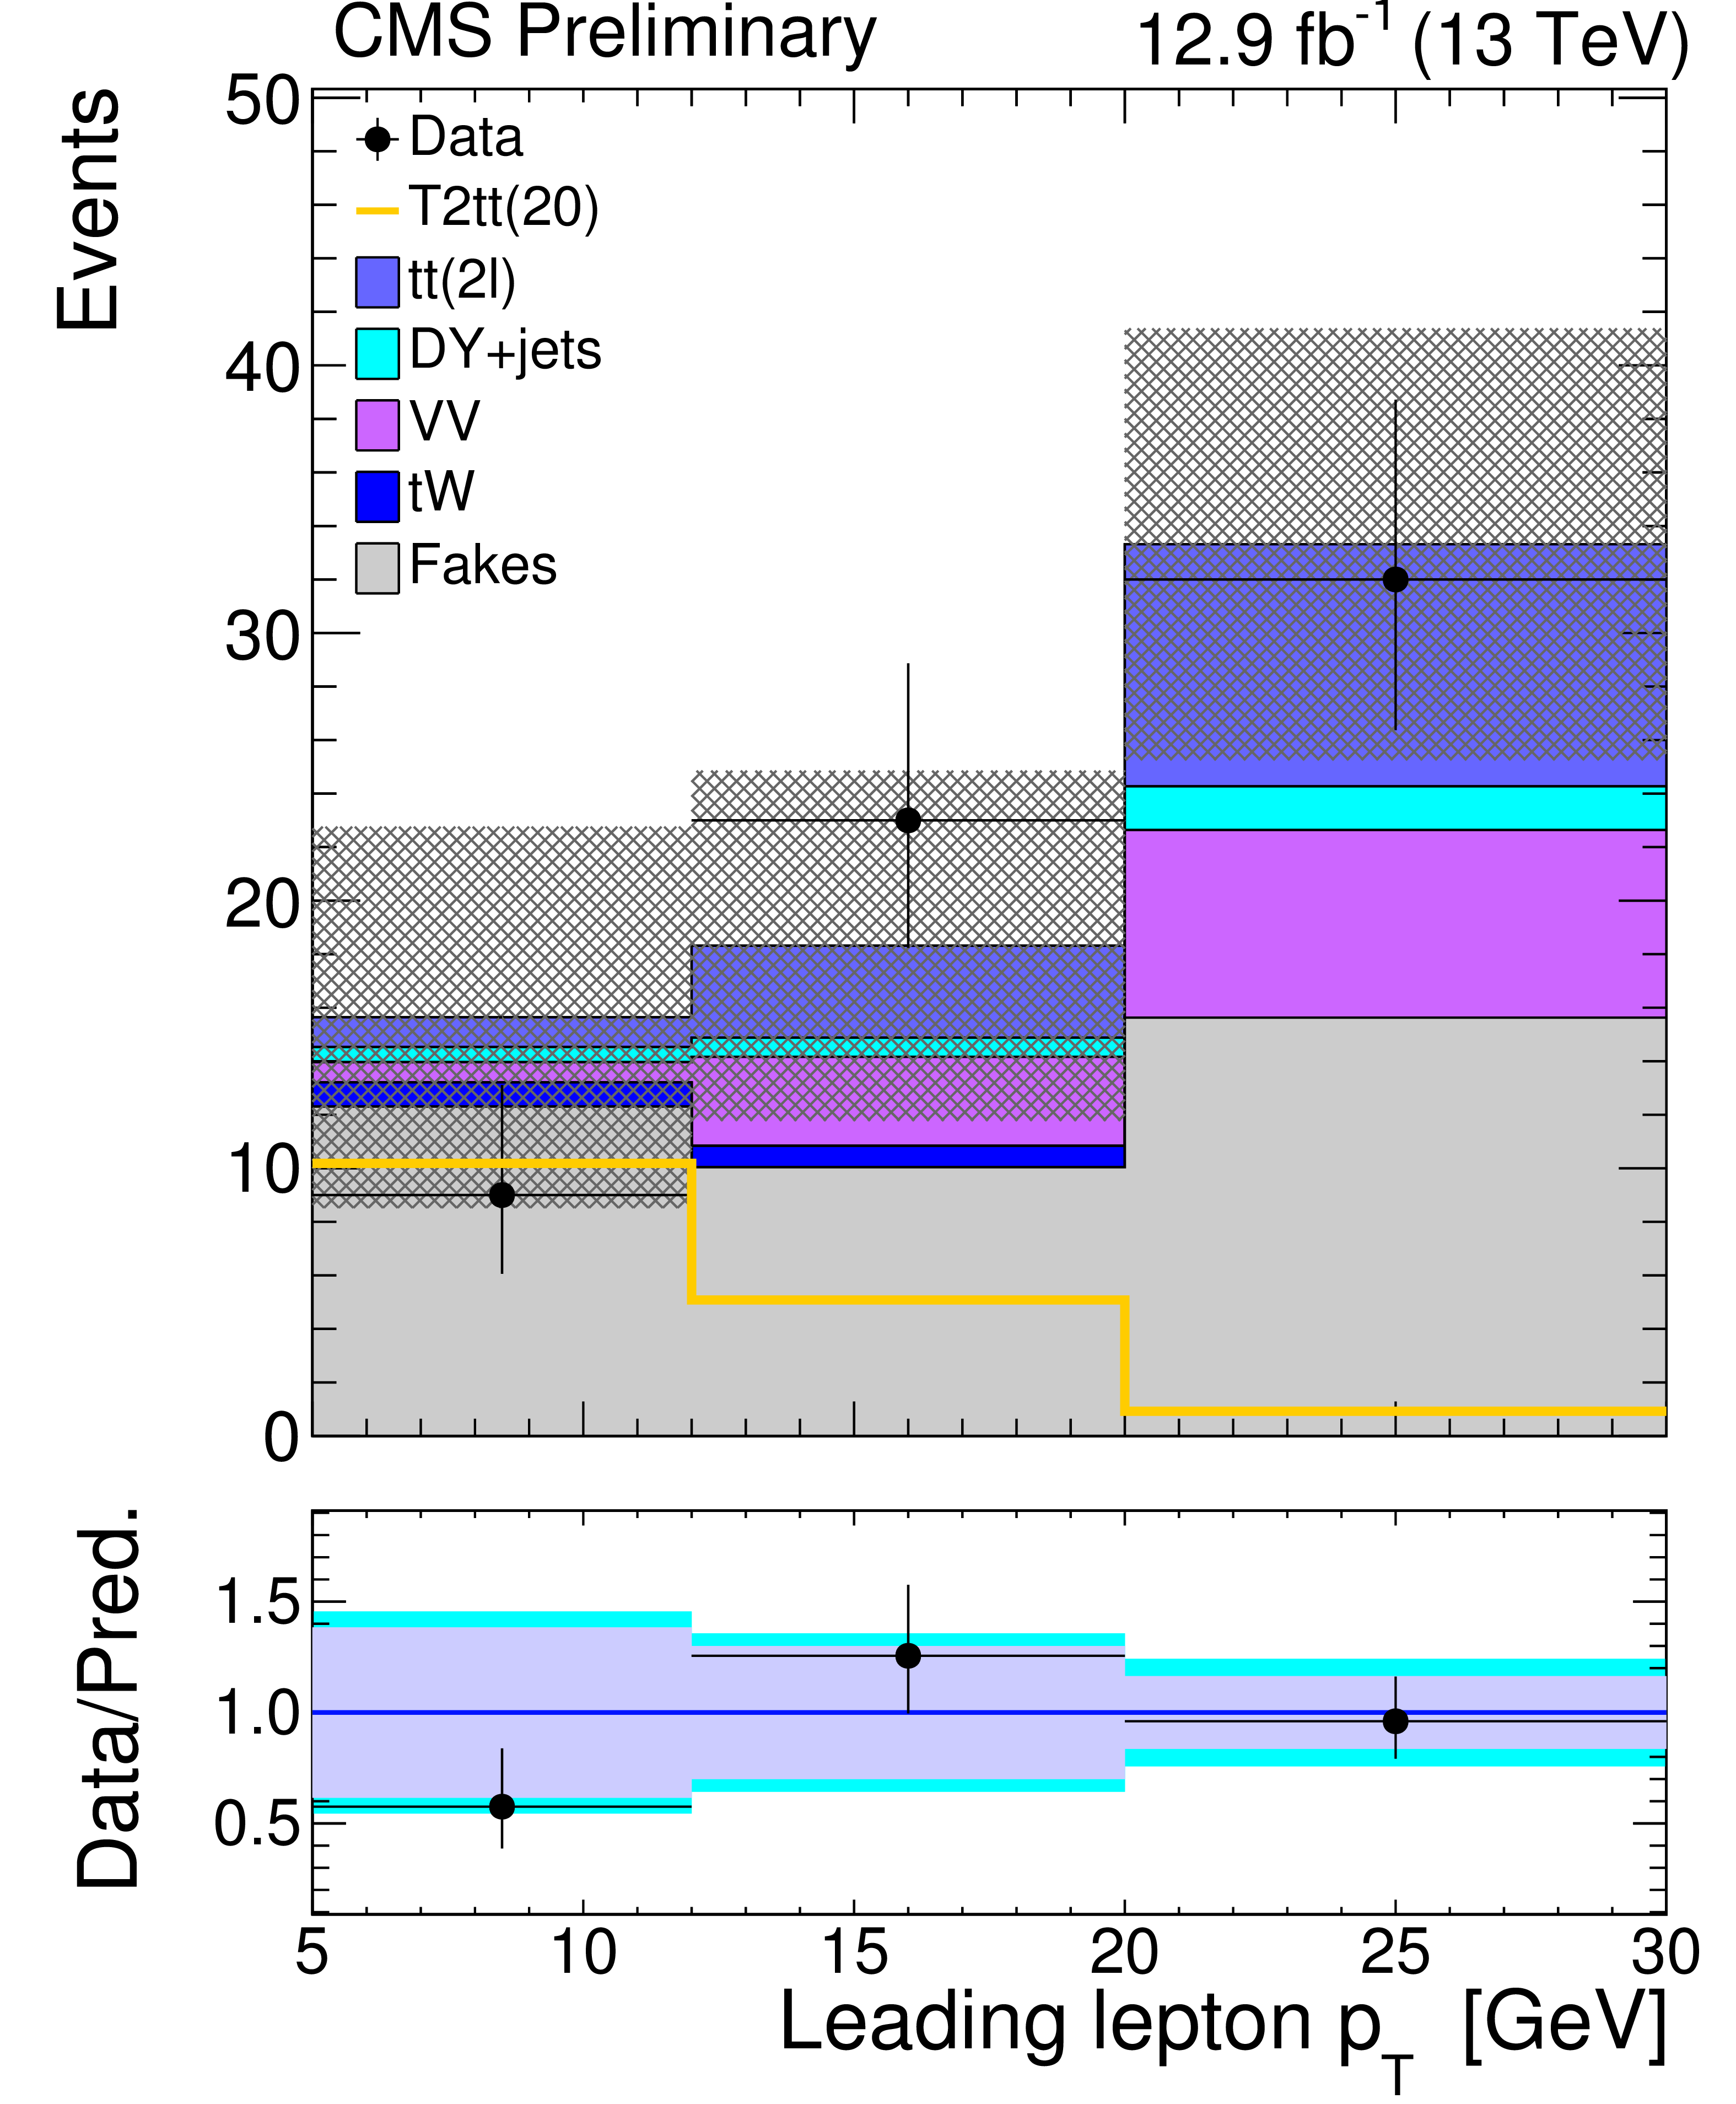
$ {p_{\mathrm {T}}} $ distributions for the leading lepton in data, compared with the SM predictions, in $\tilde{ \mathrm{ t } } $-like signal region for two $ {E_{\mathrm {T}}^{\text {miss}}} $ ranges: 125 $< {E_{\mathrm {T}}^{\text {miss}}} <$ 200 GeV (muon channel) (left) and $ {E_{\mathrm {T}}^{\text {miss}}} >$ 200 GeV (muon and electron channels) (right) for 10.1 fb$^{-1}$ and 12.9 fb$^{-1}$ of integrated luminosity, respectively. The shaded grey band in the SM prediction is the total uncertainty, calculated from the statistical uncertainties in the data application regions and the systematic uncertainty for each SM background yield. In the ratio plot the light purple band indicates the statistical uncertainty, while the light cyan band includes both statistical and systematic uncertainties. The signal corresponds to the model of $\tilde{ \mathrm{ t } }$ pair production described in the text, where the $\tilde{ \mathrm{ t } }$ mass is 350 GeV and $\Delta m(\tilde{ \mathrm{ t } },\tilde{\chi}^{0} _1)$ is 20 GeV. |

png pdf |
Figure 4-a:
$ {p_{\mathrm {T}}} $ distribution for the leading lepton in data, compared with the SM predictions, in $\tilde{ \mathrm{ t } } $-like signal region for 125 $< {E_{\mathrm {T}}^{\text {miss}}} <$ 200 GeV (muon channel) for 10.1 fb$^{-1}$ of integrated luminosity, respectively. The shaded grey band in the SM prediction is the total uncertainty, calculated from the statistical uncertainties in the data application regions and the systematic uncertainty for each SM background yield. In the ratio plot the light purple band indicates the statistical uncertainty, while the light cyan band includes both statistical and systematic uncertainties. The signal corresponds to the model of $\tilde{ \mathrm{ t } }$ pair production described in the text, where the $\tilde{ \mathrm{ t } }$ mass is 350 GeV and $\Delta m(\tilde{ \mathrm{ t } },\tilde{\chi}^{0} _1)$ is 20 GeV. |
png pdf |
Figure 4-b:
$ {p_{\mathrm {T}}} $ distributions for the leading lepton in data, compared with the SM predictions, in $\tilde{ \mathrm{ t } } $-like signal region for $ {E_{\mathrm {T}}^{\text {miss}}} >$ 200 GeV (muon and electron channels) for 12.9 fb$^{-1}$ of integrated luminosity, respectively. The shaded grey band in the SM prediction is the total uncertainty, calculated from the statistical uncertainties in the data application regions and the systematic uncertainty for each SM background yield. In the ratio plot the light purple band indicates the statistical uncertainty, while the light cyan band includes both statistical and systematic uncertainties. The signal corresponds to the model of $\tilde{ \mathrm{ t } }$ pair production described in the text, where the $\tilde{ \mathrm{ t } }$ mass is 350 GeV and $\Delta m(\tilde{ \mathrm{ t } },\tilde{\chi}^{0} _1)$ is 20 GeV. |
png pdf |
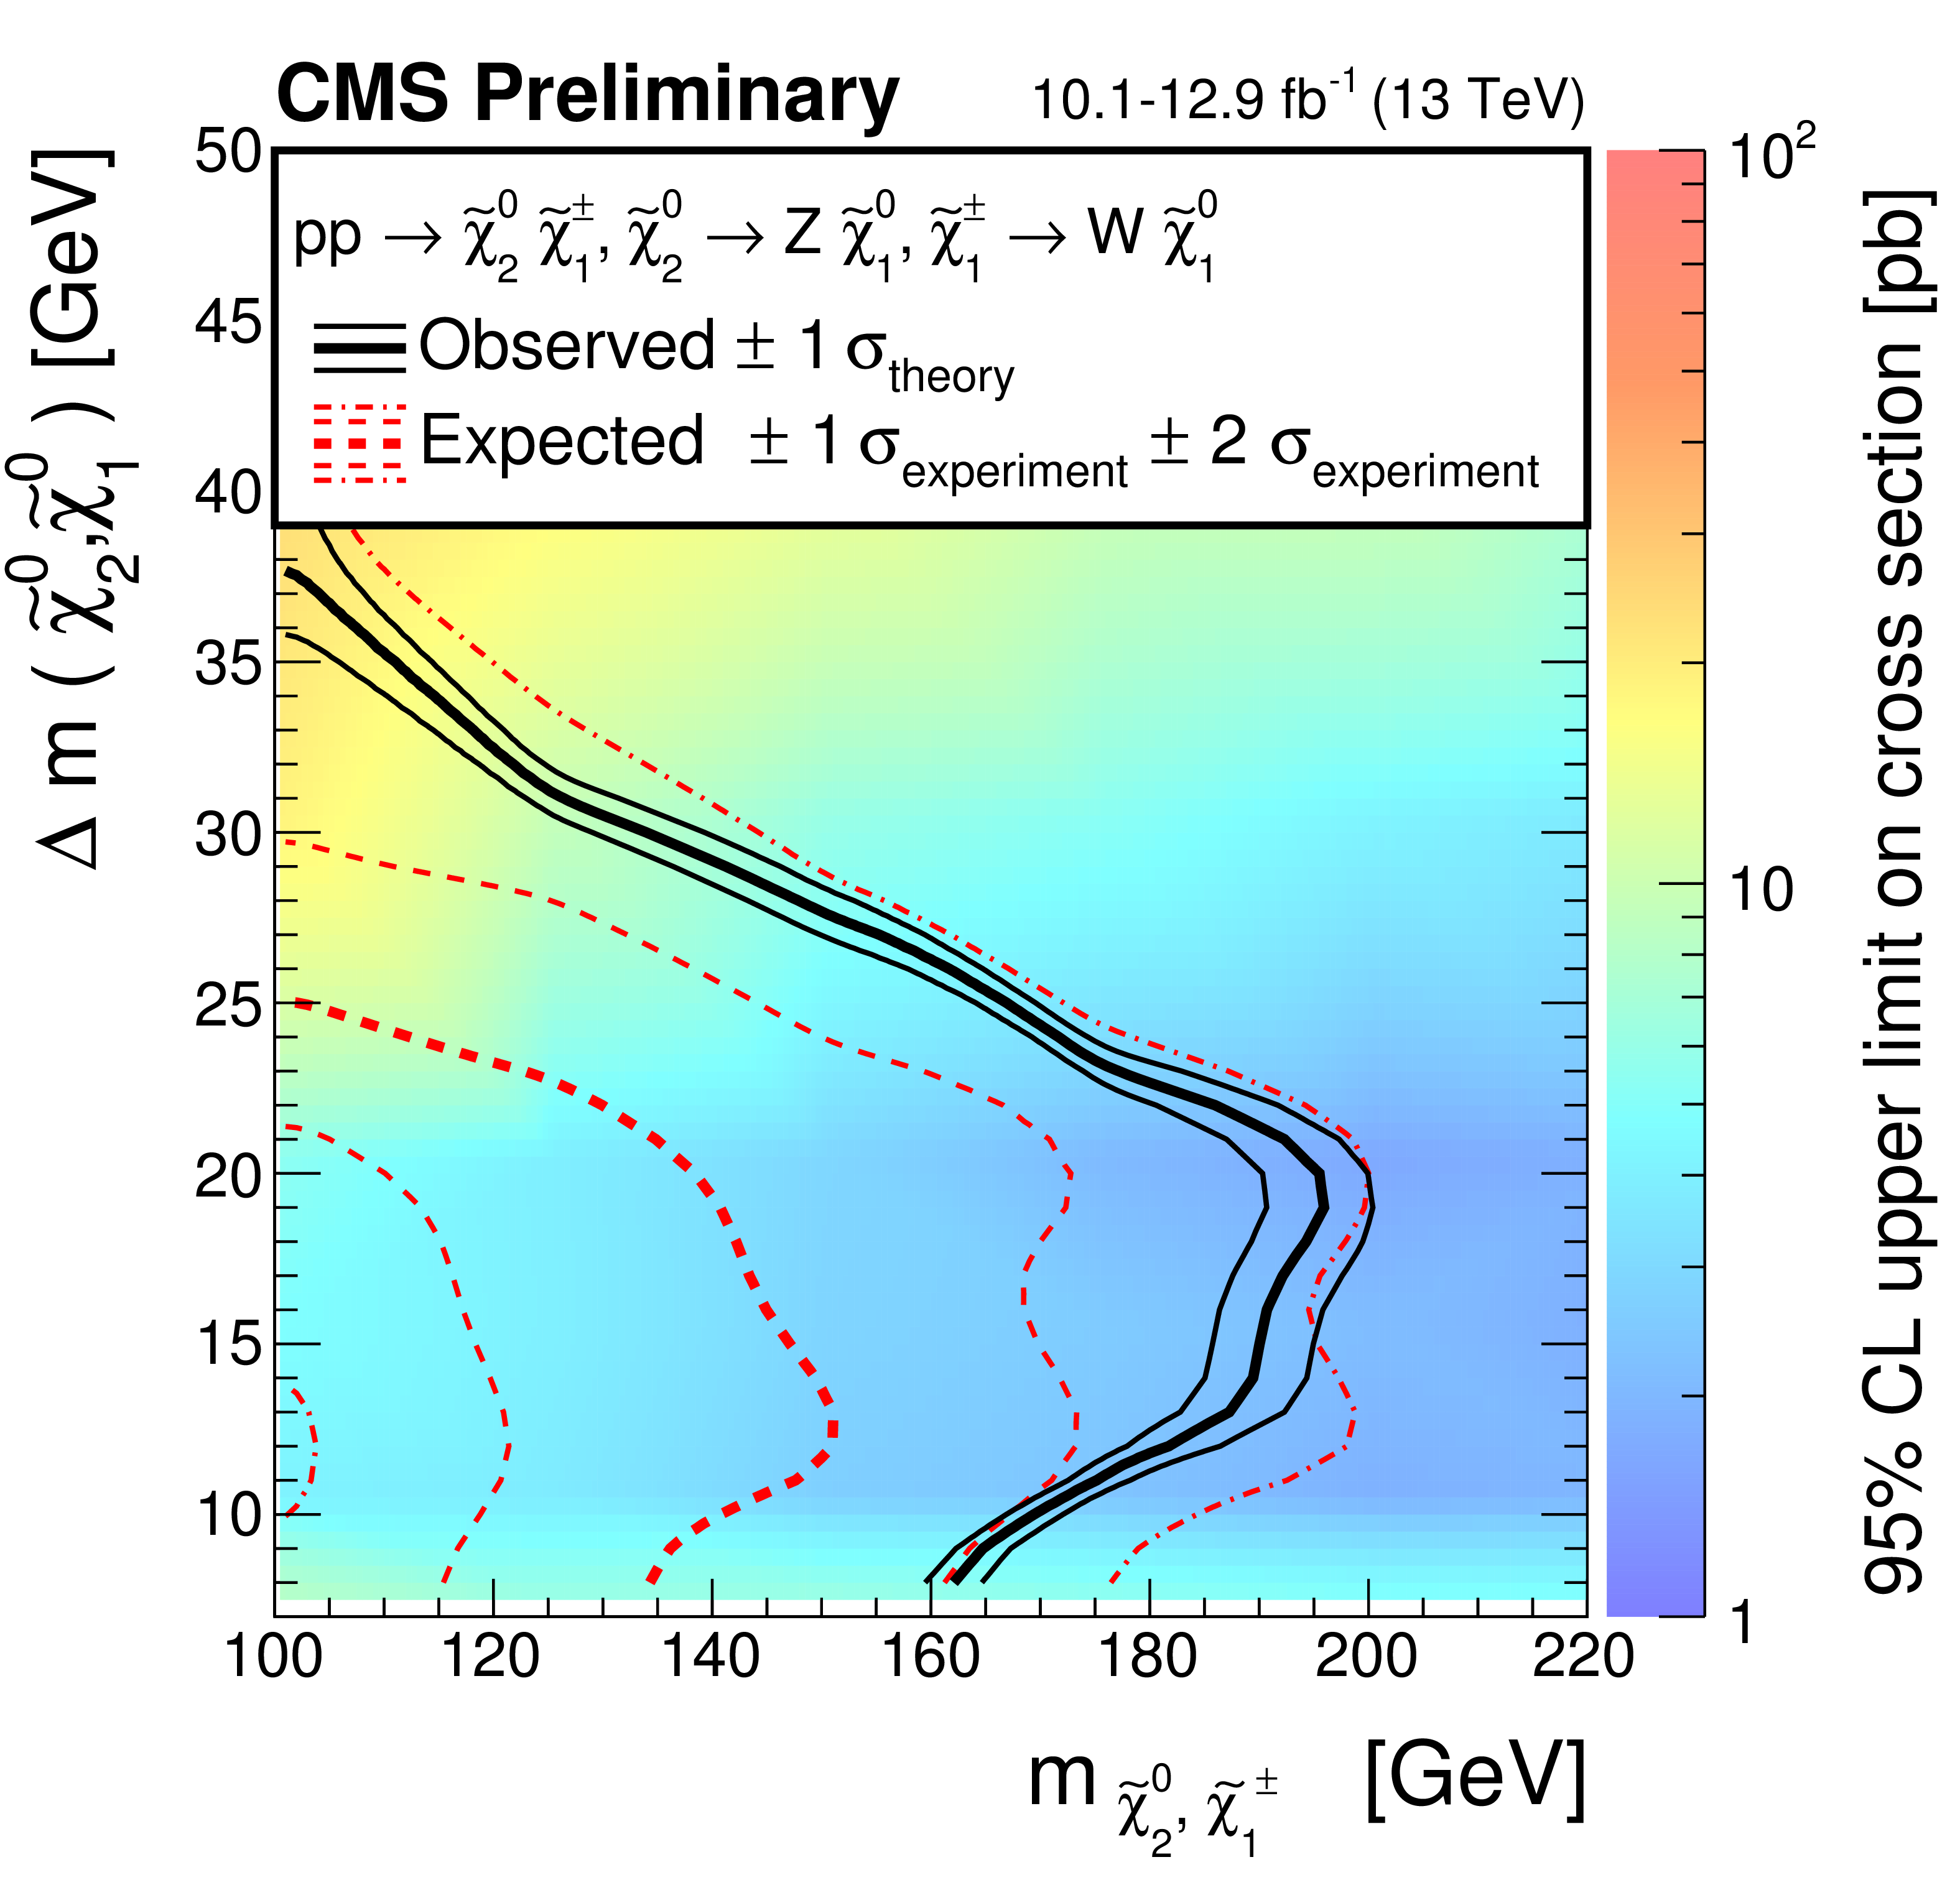
Figure 5:
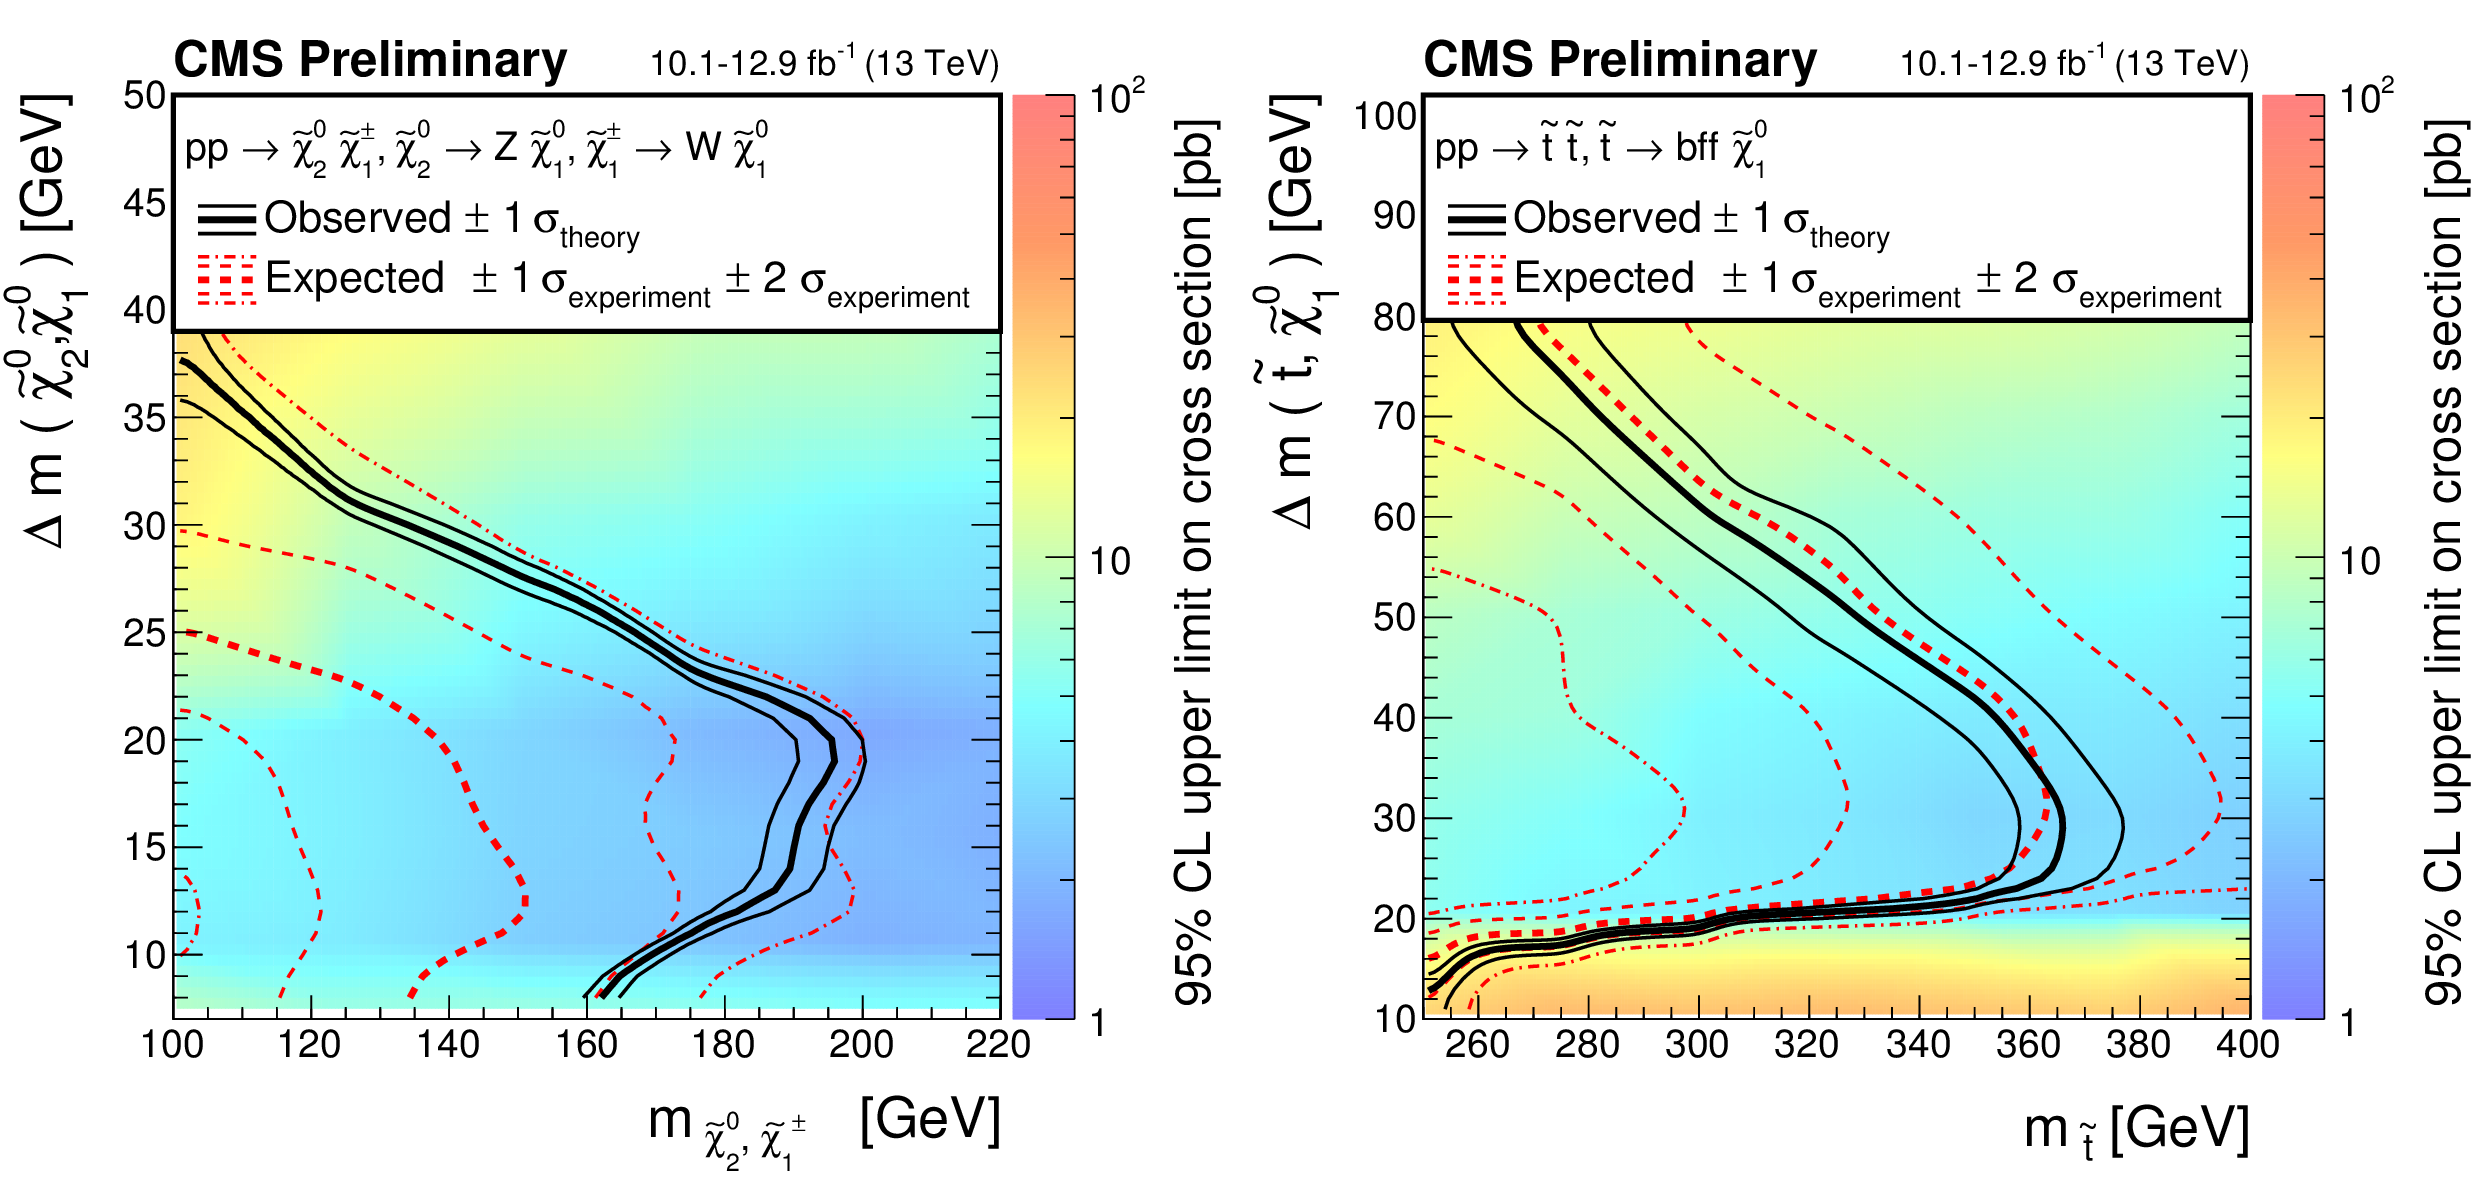
The observed exclusion contours (black curves) assuming the NLO+NLL cross sections, with the corresponding 1 standard deviation uncertainties for electroweak (left) and $\tilde{ \mathrm{ t } }$ (right) searches. The dashed (red) curves present the expected limits with 1 and 2 standard deviation experimental uncertainties. Results are based on a simplified model of $\tilde{\chi}^0 _2\tilde{\chi}^{\pm} _1\rightarrow \tilde{\chi}^0 _1\tilde{\chi}^0 _1 \mathrm{ Z^{*}W^{*} } $ process with a pure Wino production cross section in the electroweak analysis, while a simplified model of the $\tilde{ \mathrm{ t } }$ pair production, followed by the $\tilde{\mathrm{t}} \rightarrow \mathrm{ ffb } \tilde{\chi}^0 _1$ decay is used for the $\tilde{ \mathrm{ t } }$ analysis. Data corresponds to an integrated luminosity ranging from 10.1 fb$^{-1}$ to 12.9 fb$^{-1}$. |
png pdf |
Figure 5-a:
The observed exclusion contours (black curves) assuming the NLO+NLL cross sections, with the corresponding 1 standard deviation uncertainties for the electroweak search. The dashed (red) curves present the expected limits with 1 and 2 standard deviation experimental uncertainties. Results are based on a simplified model of $\tilde{\chi}^0 _2\tilde{\chi}^{\pm} _1\rightarrow \tilde{\chi}^0 _1\tilde{\chi}^0 _1 \mathrm{ Z^{*}W^{*} } $ process with a pure Wino production cross section in the electroweak analysis, while a simplified model of the $\tilde{ \mathrm{ t } }$ pair production, followed by the $\tilde{\mathrm{t}} \rightarrow \mathrm{ ffb } \tilde{\chi}^0 _1$ decay is used for the $\tilde{ \mathrm{ t } }$ analysis. Data corresponds to an integrated luminosity ranging from 10.1 fb$^{-1}$ to 12.9 fb$^{-1}$. |

png pdf |
Figure 5-b:
The observed exclusion contours (black curves) assuming the NLO+NLL cross sections, with the corresponding 1 standard deviation uncertainties for the $\tilde{ \mathrm{ t } }$ search. The dashed (red) curves present the expected limits with 1 and 2 standard deviation experimental uncertainties. Results are based on a simplified model of $\tilde{\chi}^0 _2\tilde{\chi}^{\pm} _1\rightarrow \tilde{\chi}^0 _1\tilde{\chi}^0 _1 \mathrm{ Z^{*}W^{*} } $ process with a pure Wino production cross section in the electroweak analysis, while a simplified model of the $\tilde{ \mathrm{ t } }$ pair production, followed by the $\tilde{\mathrm{t}} \rightarrow \mathrm{ ffb } \tilde{\chi}^0 _1$ decay is used for the $\tilde{ \mathrm{ t } }$ analysis. Data corresponds to an integrated luminosity ranging from 10.1 fb$^{-1}$ to 12.9 fb$^{-1}$. |
| Tables | |

png pdf |
Table 1:
Selection requirements for the signal regions. The subleading lepton $ {p_{\mathrm {T}}} $ threshold is reduced to 3.5 GeV for muons in the high $ {E_{\mathrm {T}}^{\text {miss}}} $ $\tilde{ \mathrm{ t } } $-like signal region. $Iso_{\text {rel}}$ and $Iso_{\text {abs}}$ are relative and absolue isolation. |
png pdf |
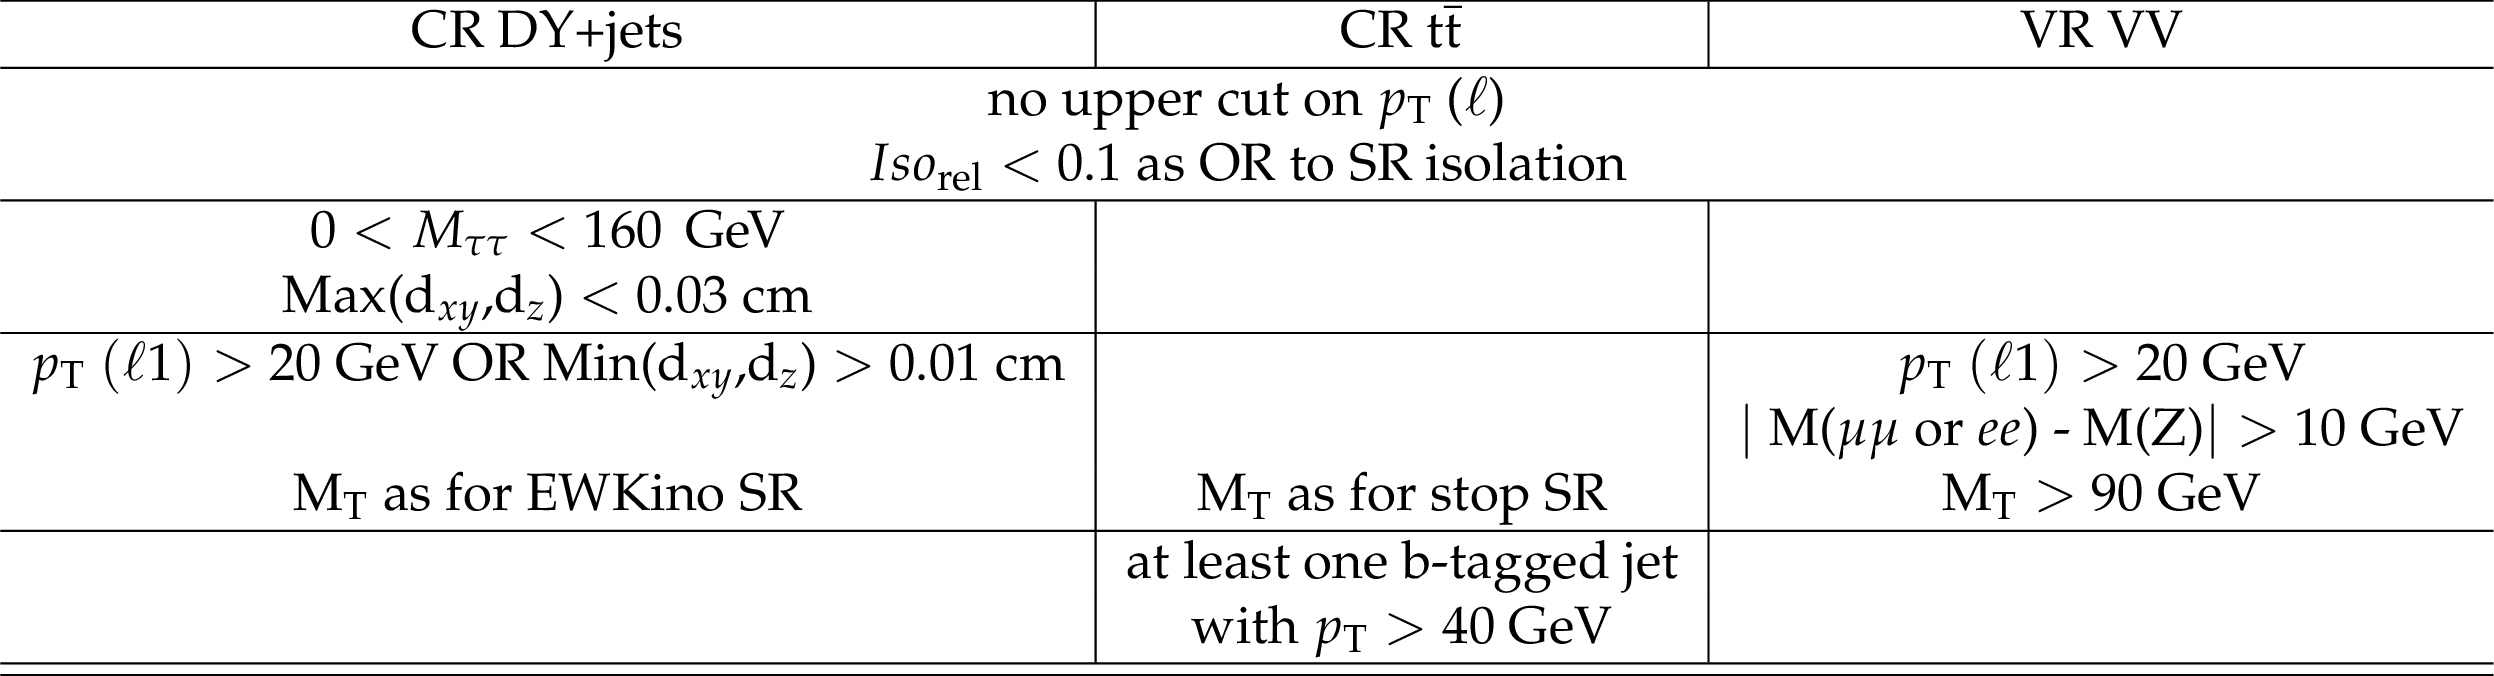
Table 2:
Summary of selection of control regions and the WW validation region (VR). |
png pdf |
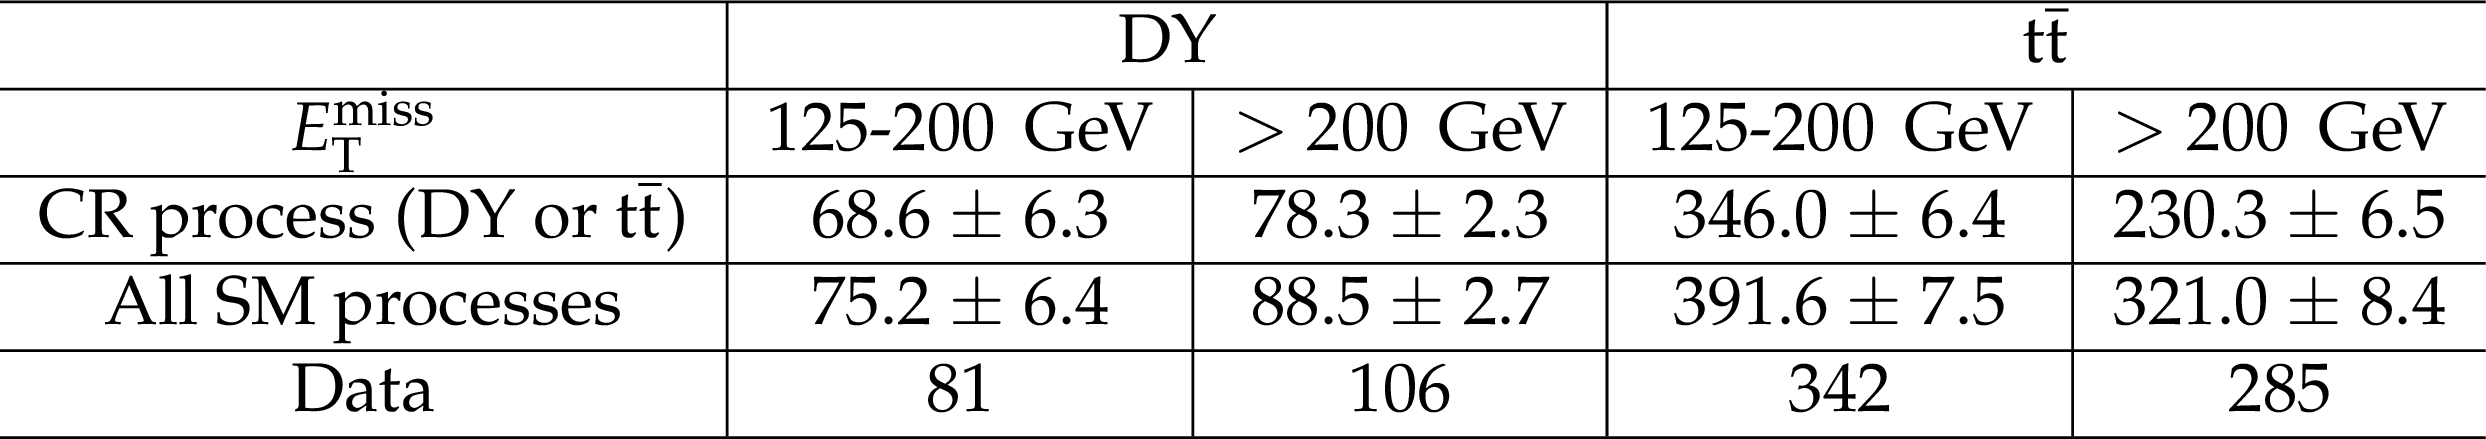
Table 3:
Data and simulation yields for the DY and $ {\mathrm{ t } {}\mathrm{ \bar{t} } } $ control regions corresponding to a integrated luminosity of 12.9 fb$^{-1}$ (high $ {E_{\mathrm {T}}^{\text {miss}}} $ region) and 10.1 fb$^{-1}$ (low $ {E_{\mathrm {T}}^{\text {miss}}} $ region). Uncertainties are statistical. |
png pdf |
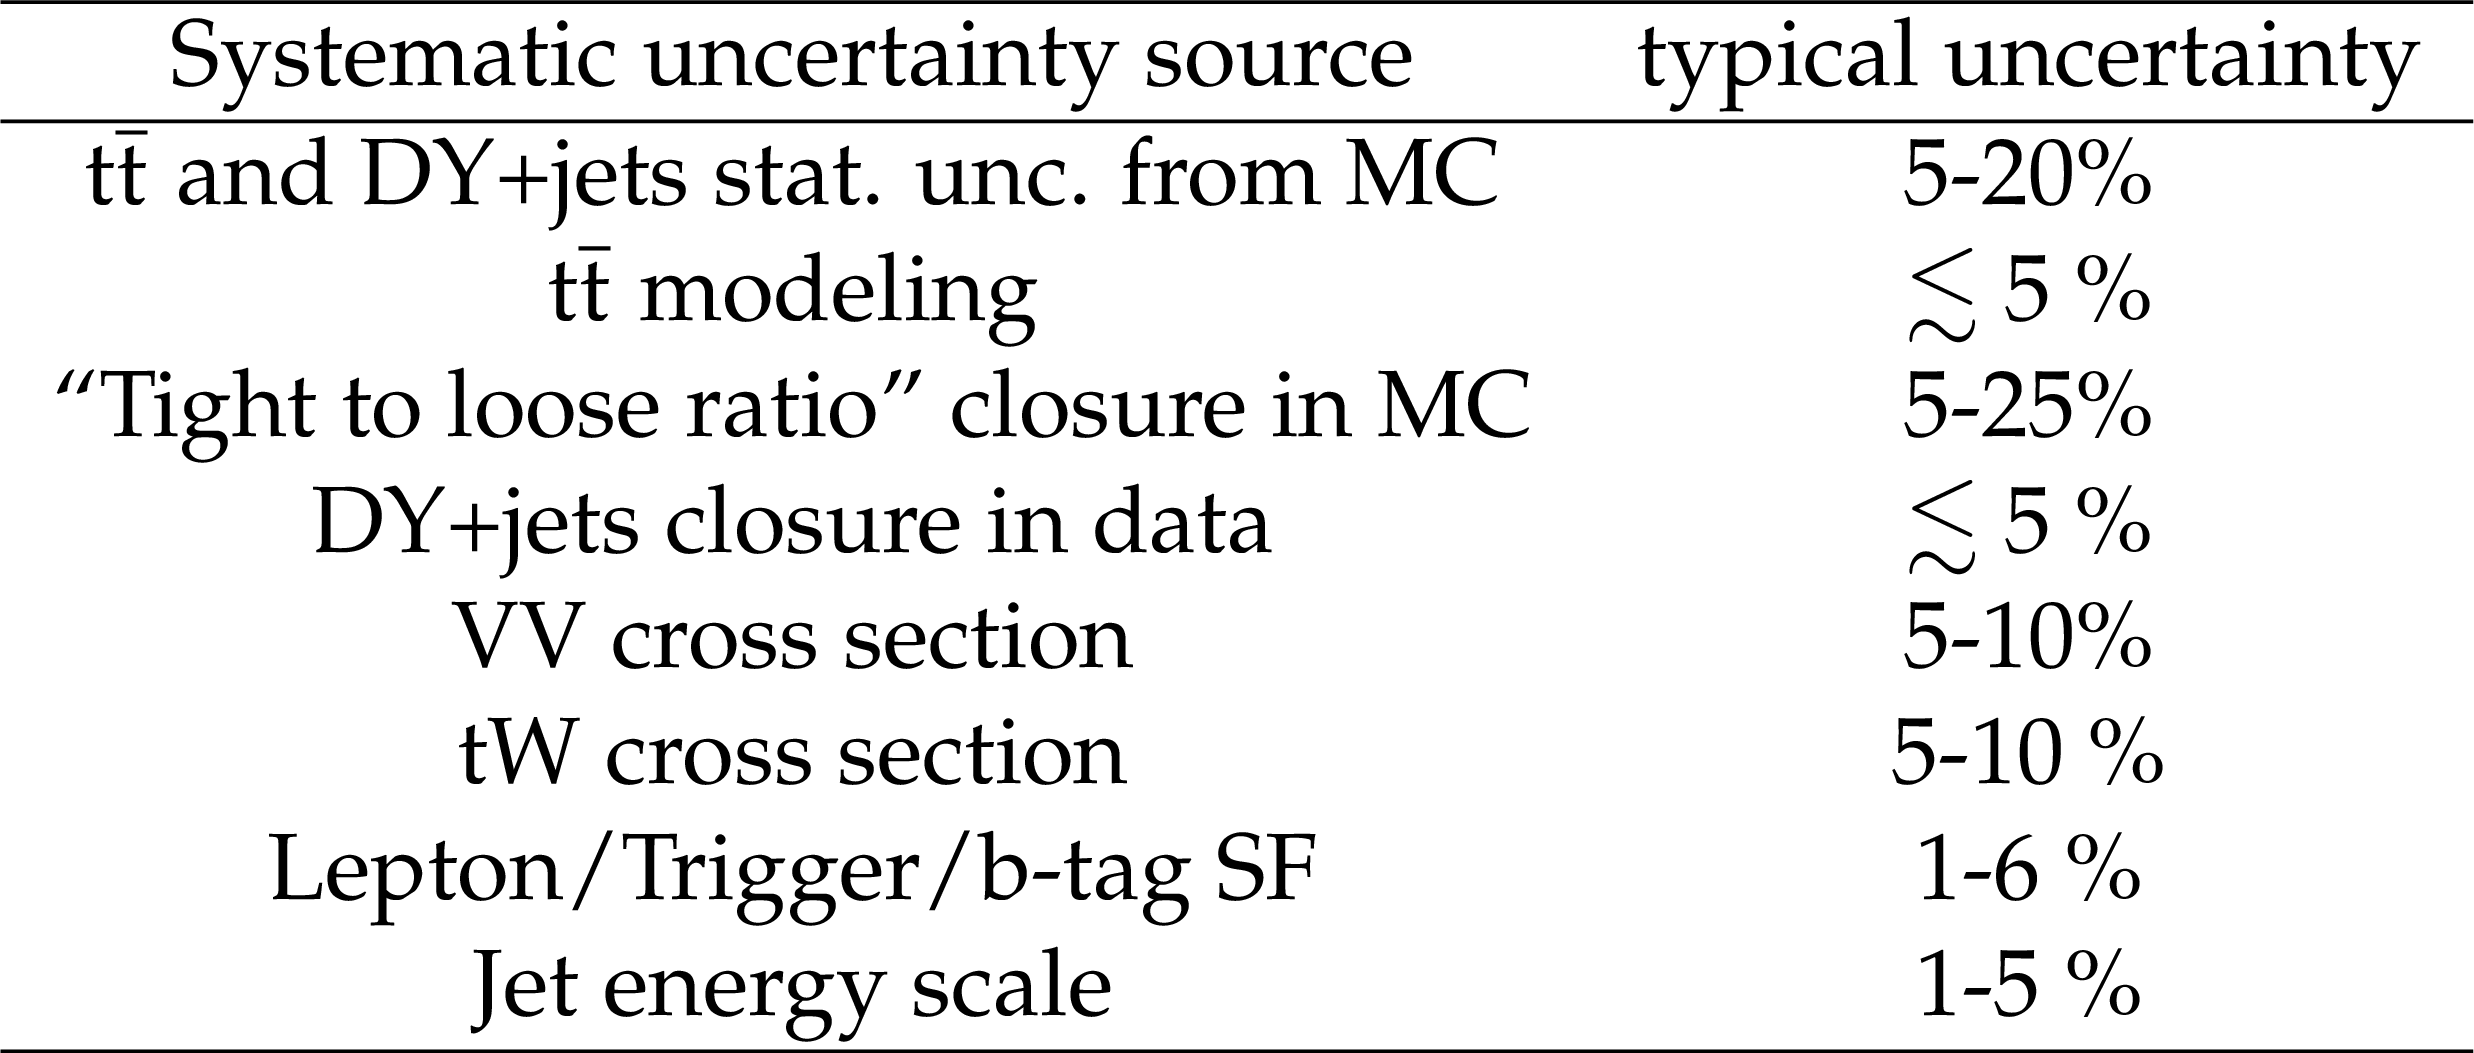
Table 4:
Typical relative uncertainties on the yields estimated with the background prediction methods in the signal region for each individual systematic uncertainty source. |
png pdf |
Table 5:
Predicted and data yields for electroweakino-like SR for 12.9 fb$^{-1}$ and 10.1 fb$^{-1}$ of integrated luminosity. Predicted yields and total uncertainties are reported. |

png pdf |
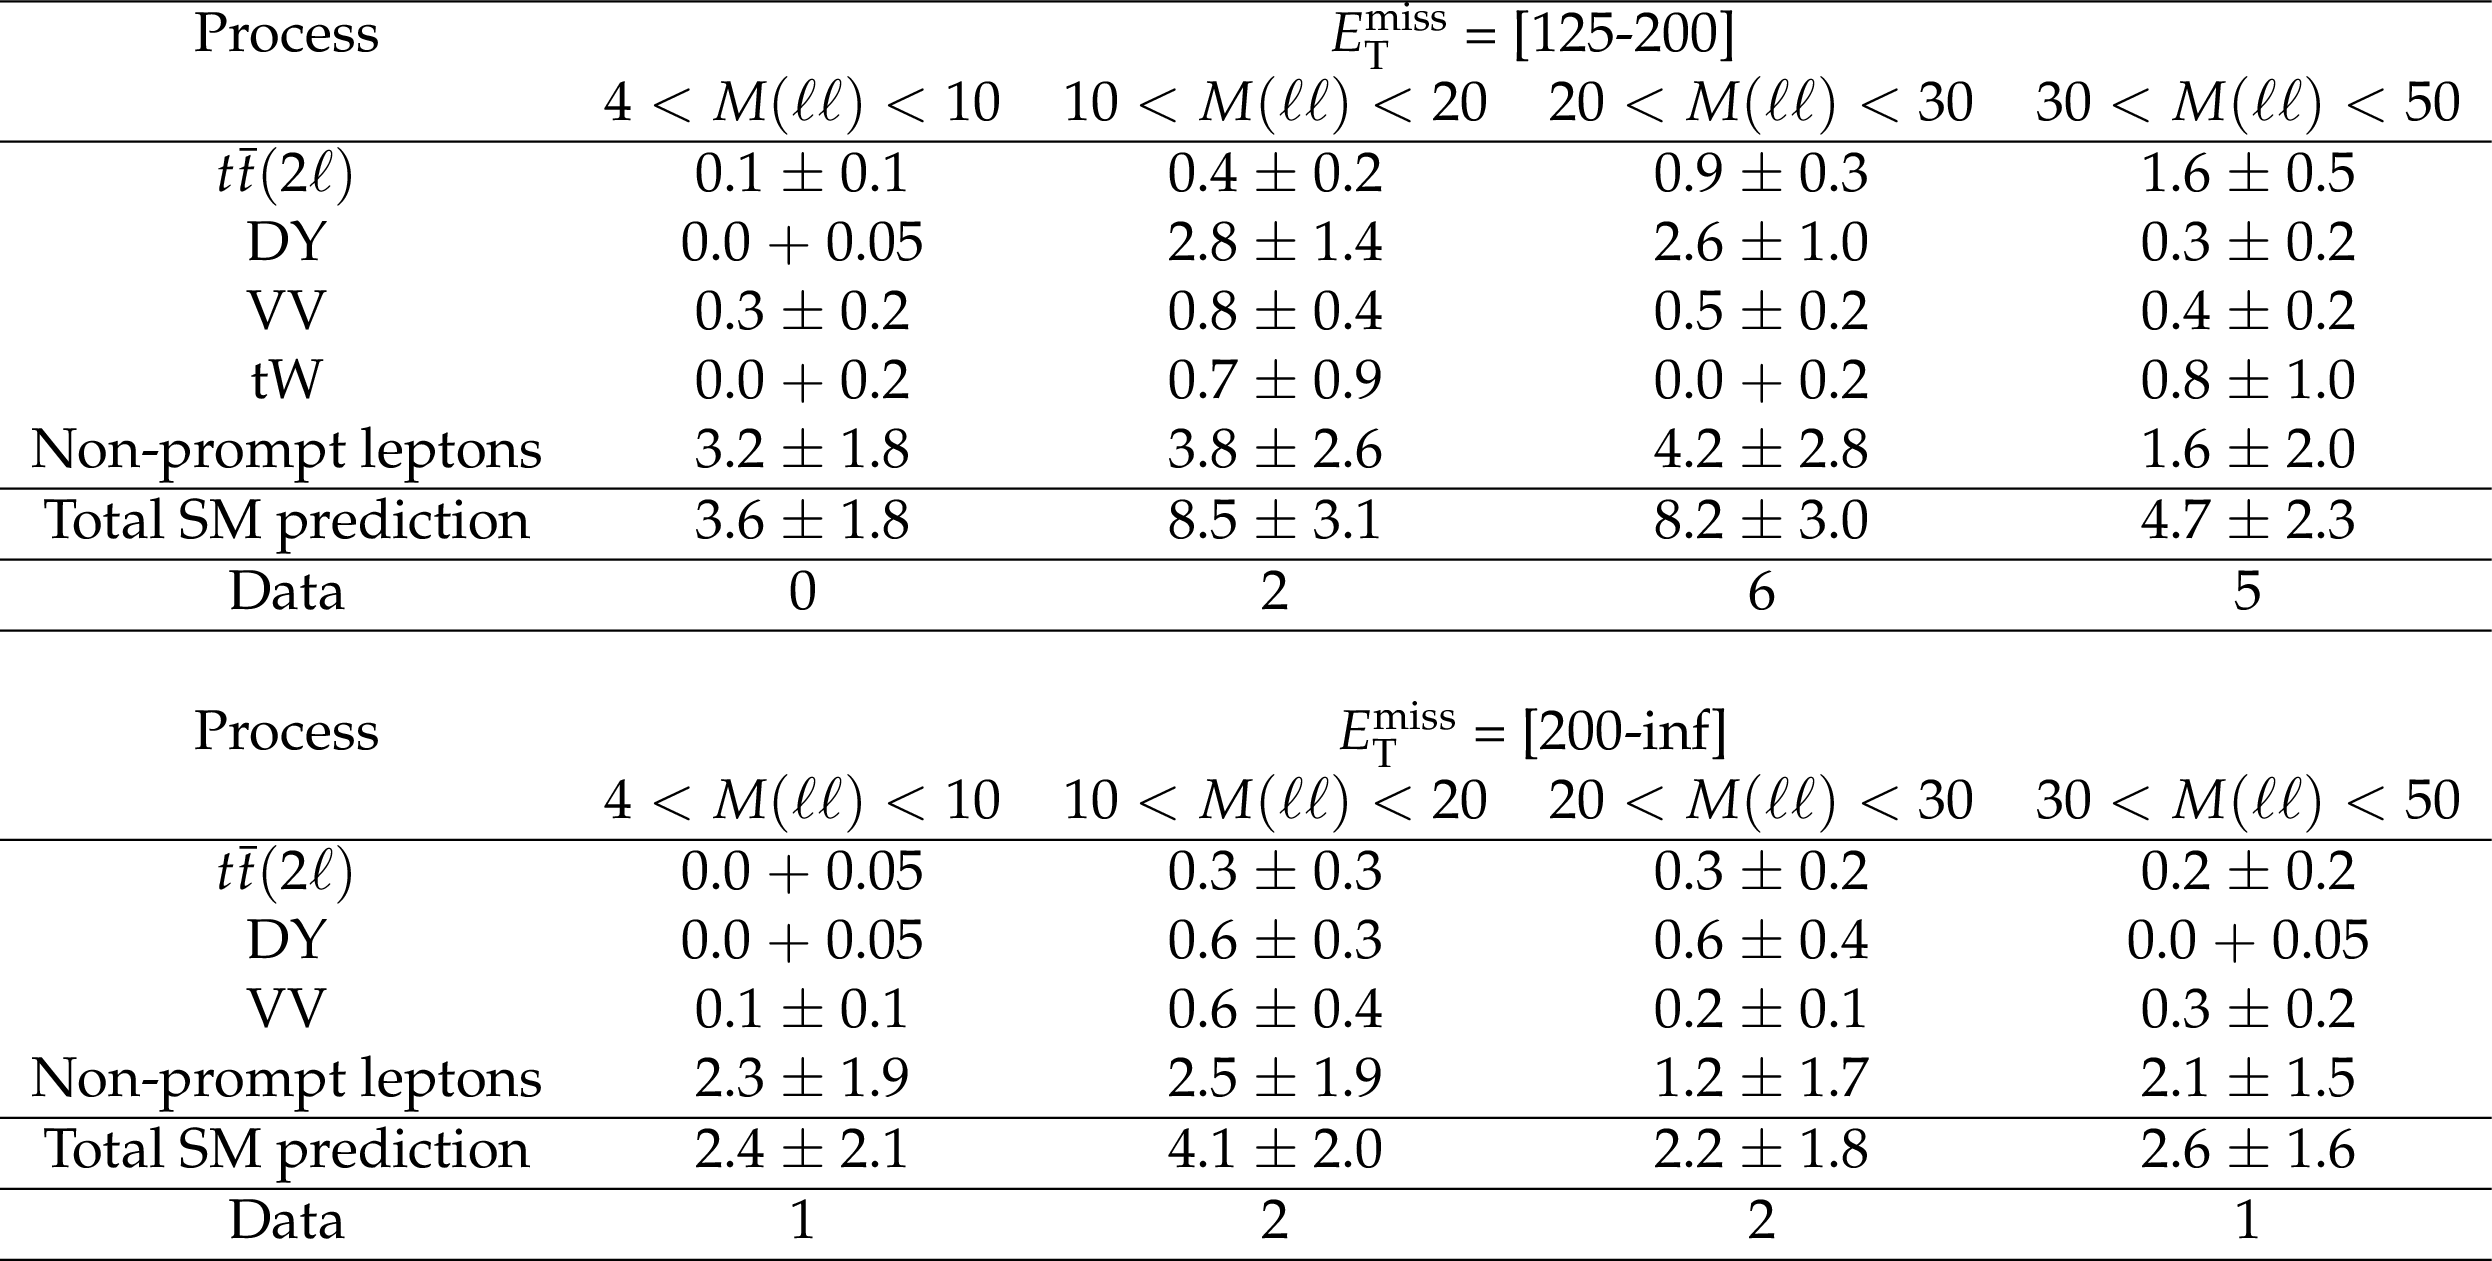
Table 6:
Predicted and data yields for $\tilde{ \mathrm{ t } } $-like SR for 12.9 fb$^{-1}$ and 10.1 fb$^{-1}$ of integrated luminosity. Predicted yields and total uncertainties are reported. |
| Summary |
| A search for new physics in events with two soft opposite-sign leptons and missing transverse energy is presented using the data collected at 13 TeV in 2016 corresponding to an integrated luminosity of up to 12.9 fb$^{-1}$. The data is consistent with the standard model expectations. The results are interpreted in the framework of supersymmetric simplified models targeting electroweakino mass-degenerate spectra and in terms of $\tilde{\mathrm{t}}$-$\tilde{\chi}^{0}_1$ mass-degenerate benchmarks. For the first time since LEP experiments a search probes the $\tilde{\chi}^{0}_2\tilde{\chi}^{\pm}_1\rightarrow \tilde{\chi}^{0}_1\tilde{\chi}^{0}_1 \mathrm{ Z^{*}W^{*}}$ process for mass differences ($\Delta m$) between $\tilde{\chi}^{0}_2$ and $\tilde{\chi}^{0}_1$ of less than 20 GeV. Assuming Wino production cross sections, $\tilde{\chi}^{0}_2$ masses up to 195 GeV for a $\Delta$m of 20 GeV and up to 165 GeV for a $\Delta m$ of 7.5 GeV are excluded. For the $\tilde{\mathrm{t}}$ four body decay, $\tilde{\mathrm{t}}$ masses of up to 360 GeV are excluded for a $\Delta m(\tilde{\mathrm{t}},\tilde{\chi}^{0}_1) =$ 30 GeV within the simplified model. |
| References | ||||
| 1 | S. Dimopoulos and H. Georgi | Softly broken supersymmetry and SU(5) | Nucl. Phys. B 193 (1981) 150 | |
| 2 | E. Witten | Dynamical breaking of supersymmetry | Nucl. Phys. B 188 (1981) 513 | |
| 3 | M. Dine, W. Fischler, and M. Srednicki | Supersymmetric technicolor | Nucl. Phys. B 189 (1981) 575 | |
| 4 | S. Dimopoulos and S. Raby | Supercolor | Nucl. Phys. B 192 (1981) 353 | |
| 5 | N. Sakai | Naturalness in supersymmetric GUTS | Z. Phys. C 11 (1981) 153 | |
| 6 | R. K. Kaul and P. Majumdar | Cancellation of quadratically divergent mass corrections in globally supersymmetric spontaneously broken gauge theories | Nucl. Phys. B 199 (1982) 36 | |
| 7 | G. F. Giudice, T. Han, K. Wang, and L.-T. Wang | Nearly degenerate gauginos and dark matter at the LHC | PRC 81 (2010) 115011 | 1004.4902 |
| 8 | H. Baer, A. Mustafayev, and X. Tata | Monojet plus soft dilepton signal from light higgsino pair production at LHC14 | PRD 90 (2014) 115007 | 1409.7058 |
| 9 | Z. Han, G. D. Kribs, A. Martin, and A. Menon | Hunting quasidegenerate Higgsinos | PRD 89 (2014) 075007 | 1401.1235 |
| 10 | ALEPH Collaboration | Search for charginos nearly mass degenerate with the lightest neutralino in e+ e- collisions at center-of-mass energies up to 209 GeV | PLB 533 (2002) 223 | hep-ex/0203020 |
| 11 | DELPHI Collaboration | Searches for supersymmetric particles in e+ e- collisions up to 208 GeV and interpretation of the results within the MSSM | EPJC 31 (2003) 421 | hep-ex/0311019 |
| 12 | L3 Collaboration | Searches for scalar quarks in $ e^{+} e^{-} $ interactions at $ \sqrt{s} $ = 189 GeV | PLB 471 (1999) 308 | hep-ex/9910020 |
| 13 | C. Bal\'azs, M. Carena, and C. E. M. Wagner | Dark matter, light stops and electroweak baryogenesis | PRD 70 (2004) 015007 | hep-ph/0403224 |
| 14 | CMS Collaboration | Search for supersymmetry in events with soft leptons, low jet multiplicity, and missing transverse energy in proton–proton collisions at $ \sqrt{s} $ = 8 TeV | PLB 759 (2016) 9 | CMS-SUS-14-021 1512.08002 |
| 15 | J. Alwall et al. | MadGraph5: going beyond | JHEP 06 (2011) 128 | 1106.0522 |
| 16 | NNPDF Collaboration | Parton distributions for the LHC Run II | JHEP 04 (2015) 040 | 1410.8849 |
| 17 | J. Alwall et al. | The automated computation of tree-level and next-to-leading order differential cross sections, and their matching to parton shower simulations | JHEP 07 (2014) 079 | 1405.0301 |
| 18 | P. Nason | A new method for combining NLO QCD with shower Monte Carlo algorithms | JHEP 11 (2004) 040 | hep-ph/0409146 |
| 19 | S. Frixione, P. Nason, and C. Oleari | Matching NLO QCD computations with parton shower simulations: the POWHEG method | JHEP 11 (2007) 070 | 0709.2092 |
| 20 | S. Alioli, P. Nason, C. Oleari, and E. Re | A general framework for implementing NLO calculations in shower Monte Carlo programs: the POWHEG BOX | JHEP 06 (2010) 043 | 1002.2581 |
| 21 | S. Alioli, P. Nason, C. Oleari, and E. Re | NLO single-top production matched with shower in POWHEG: $ s $- and $ t $-channel contributions | JHEP 09 (2009) 111, , [Erratum: JHEP \bf 02 (2010) 011] | 0907.4076 |
| 22 | E. Re | Single-top Wt-channel production matched with parton showers using the POWHEG method | EPJC 71 (2011) 1547 | 1009.2450 |
| 23 | T. Sj\"ostrand et al. | An Introduction to PYTHIA 8.2 | CPC 191 (2015) 159 | 1410.3012 |
| 24 | S. Agostinelli et al. | GEANT4 --- a simulation toolkit | Nucl. Instr. and Meth. A 506 (2003) 250 | |
| 25 | CMS Collaboration | The Fast Simulation of the CMS Detector at LHC | Technical Report 3, CERN | |
| 26 | R. Gr\"ober, M. M. M\"uhlleitner, E. Popenda, and A. Wlotzka | Light Stop Decays: Implications for LHC Searches | EPJC 75 (2015) 420 | 1408.4662 |
| 27 | CMS Collaboration | Particle-flow event reconstruction in CMS and performance for jets, taus, and $ E_{\mathrm{T}}^{\text{miss}} $ | CDS | |
| 28 | CMS Collaboration | Performance of CMS muon reconstruction in $ pp $ collision events at $ \sqrt{s}=7 $ TeV | JINST 7 (2012) P10002 | CMS-MUO-10-004 1206.4071 |
| 29 | CMS Collaboration | Studies of Higgs boson production in the four-lepton final state at $ \sqrt{s}=13 \mathrm{TeV} $ | CMS-PAS-HIG-15-004 | CMS-PAS-HIG-15-004 |
| 30 | M. Cacciari, G. P. Salam, and G. Soyez | The Anti-k(t) jet clustering algorithm | JHEP 04 (2008) 063 | 0802.1189 |
| 31 | CMS Collaboration | Identification of b quark jets at the CMS Experiment in the LHC Run 2 | CMS-PAS-BTV-15-001 | CMS-PAS-BTV-15-001 |
| 32 | CMS Collaboration | Search for new physics with same-sign isolated dilepton events with jets and missing transverse energy at the LHC | JHEP 06 (2011) 077 | CMS-SUS-10-004 1104.3168 |
| 33 | ATLAS Collaboration | Measurement of spin correlation in top-antitop quark events and search for top squark pair production in $ \mathrm{ p }\mathrm{ p } $ collisions at $ \sqrt{s} = $ 8 TeV using the ATLAS detector | PRL 114 (2015) 142001 | 1412.4742 |
| 34 | CMS Collaboration | Measurements of $ \mathrm{ t \bar{t} } $ spin correlations and top quark polarization using dilepton final states in pp collisions at $ \sqrt{s} $ = 8 TeV | PRD 93 (2016) 052007 | CMS-TOP-14-023 1601.01107 |
| 35 | B. Fuks, M. Klasen, D. R. Lamprea, and M. Rothering | Gaugino production in proton-proton collisions at a center-of-mass energy of 8 TeV | JHEP 10 (2012) 081 | 1207.2159 |
| 36 | B. Fuks, M. Klasen, D. R. Lamprea, and M. Rothering | Precision predictions for electroweak superpartner production at hadron colliders with Resummino | EPJC 73 (2013) 2480 | 1304.0790 |
| 37 | G. Cowan, K. Cranmer, E. Gross, and O. Vitells | Asymptotic formulae for likelihood-based tests of new physics | EPJC 71 (2011) 1554, , [Erratum: Eur. Phys. J.C73,2501(2013)] | 1007.1727 |
| 38 | T. Junk | Confidence level computation for combining searches with small statistics | Nucl. Instr. and Meth. A 434 (1999) 435 | hep-ex/9902006 |
| 39 | A. L. Read | Presentation of search results: the $ {CL}_s $ technique | JPG 28 (2002) 2693 | |
| 40 | ATLAS and CMS Collaborations | Procedure for the LHC Higgs boson search combination in Summer 2011 | CMS-NOTE-2011-005 | |
|
|
Compact Muon Solenoid LHC, CERN |
|

|

|

|

|

|