

Compact Muon Solenoid
LHC, CERN
| CMS-PAS-SUS-16-028 | ||
| Search for direct top squark pair production in the single lepton final state at $ \sqrt{s} = $ 13 TeV | ||
| CMS Collaboration | ||
| August 2016 | ||
| Abstract: A search for direct top squark pair production in pp collisions at $ \sqrt{s} = $ 13 TeV is performed using events with a single isolated lepton, jets, and large transverse momentum imbalance. This analysis closely follows the strategy of a similar search for the same signature in 2015, using data collected in 2016 at a center-of-mass energy of 13 TeV with the CMS detector and corresponding to an integrated luminosity of 12.9 fb$^{-1}$. No significant excess in data is observed above the expectation from standard model processes. Exclusion limits are set in the context of supersymmetric models with pair production of top squarks that decay either to a top quark and a neutralino or to a bottom quark and a chargino. | ||
| Links: CDS record (PDF) ; inSPIRE record ; CADI line (restricted) ; | ||
| Figures | |
png pdf |
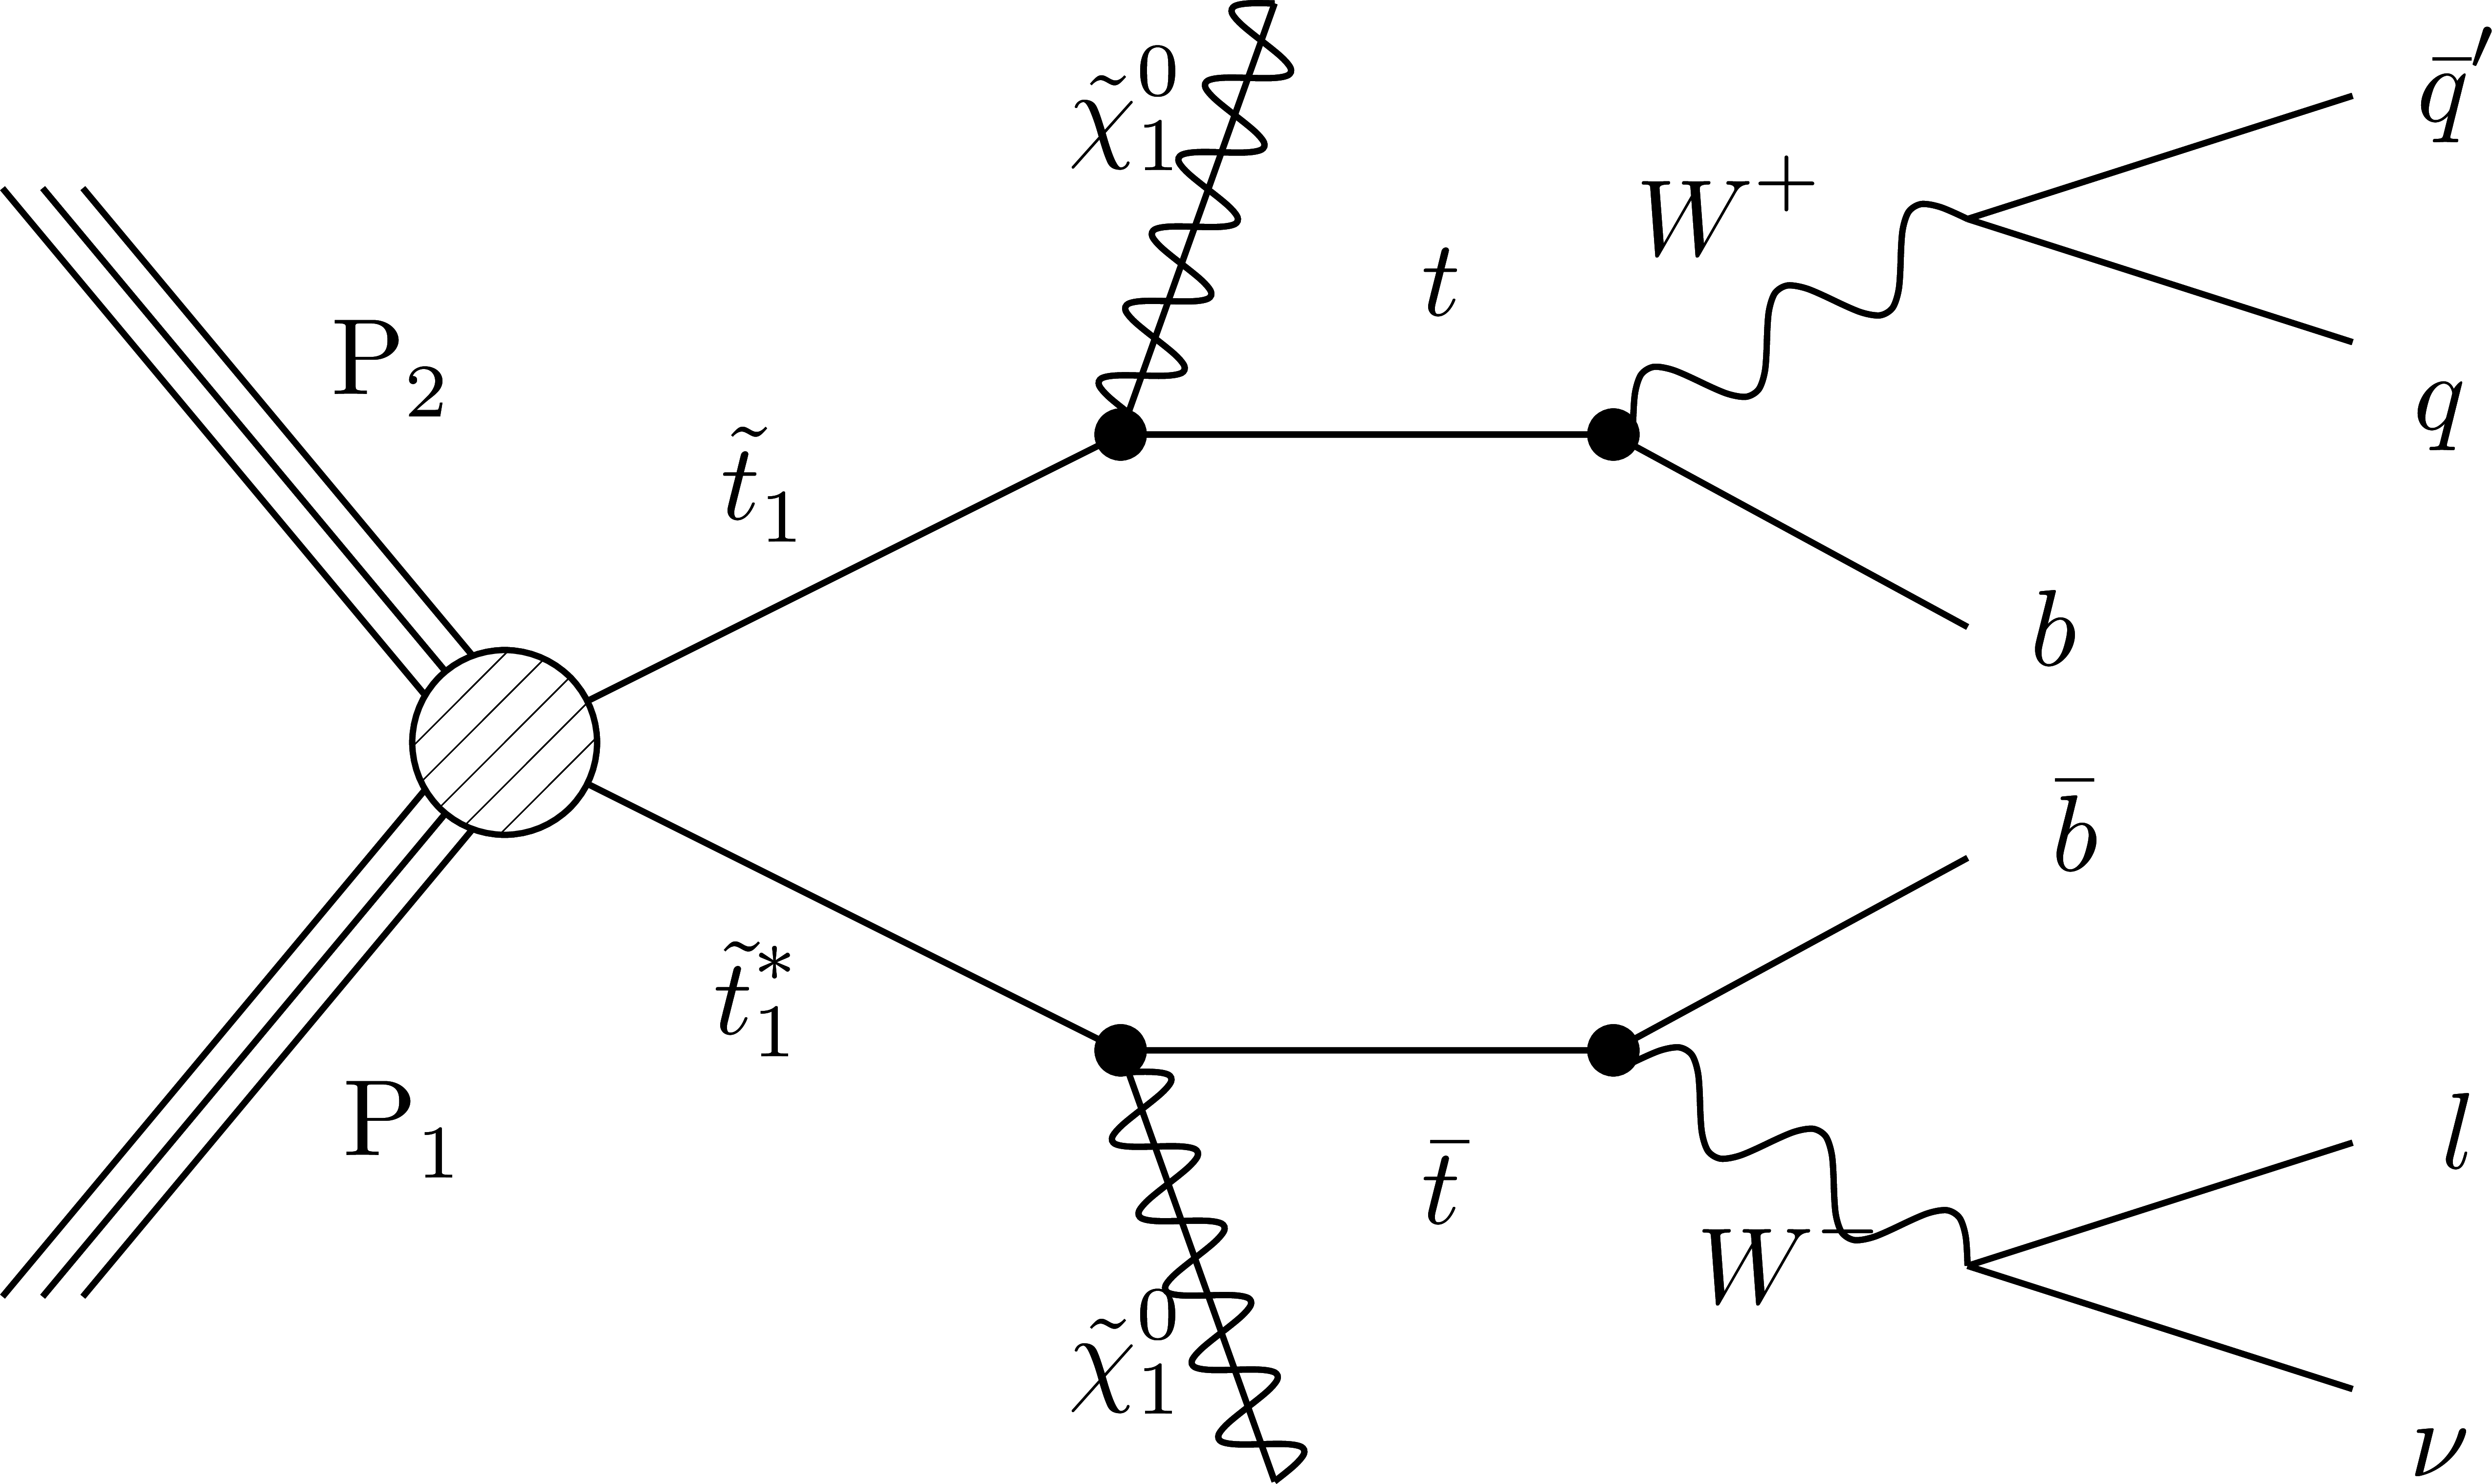
Figure 1-a:
Diagrams for the pair production of top squarks corresponding to the different decay modes. |
png pdf |
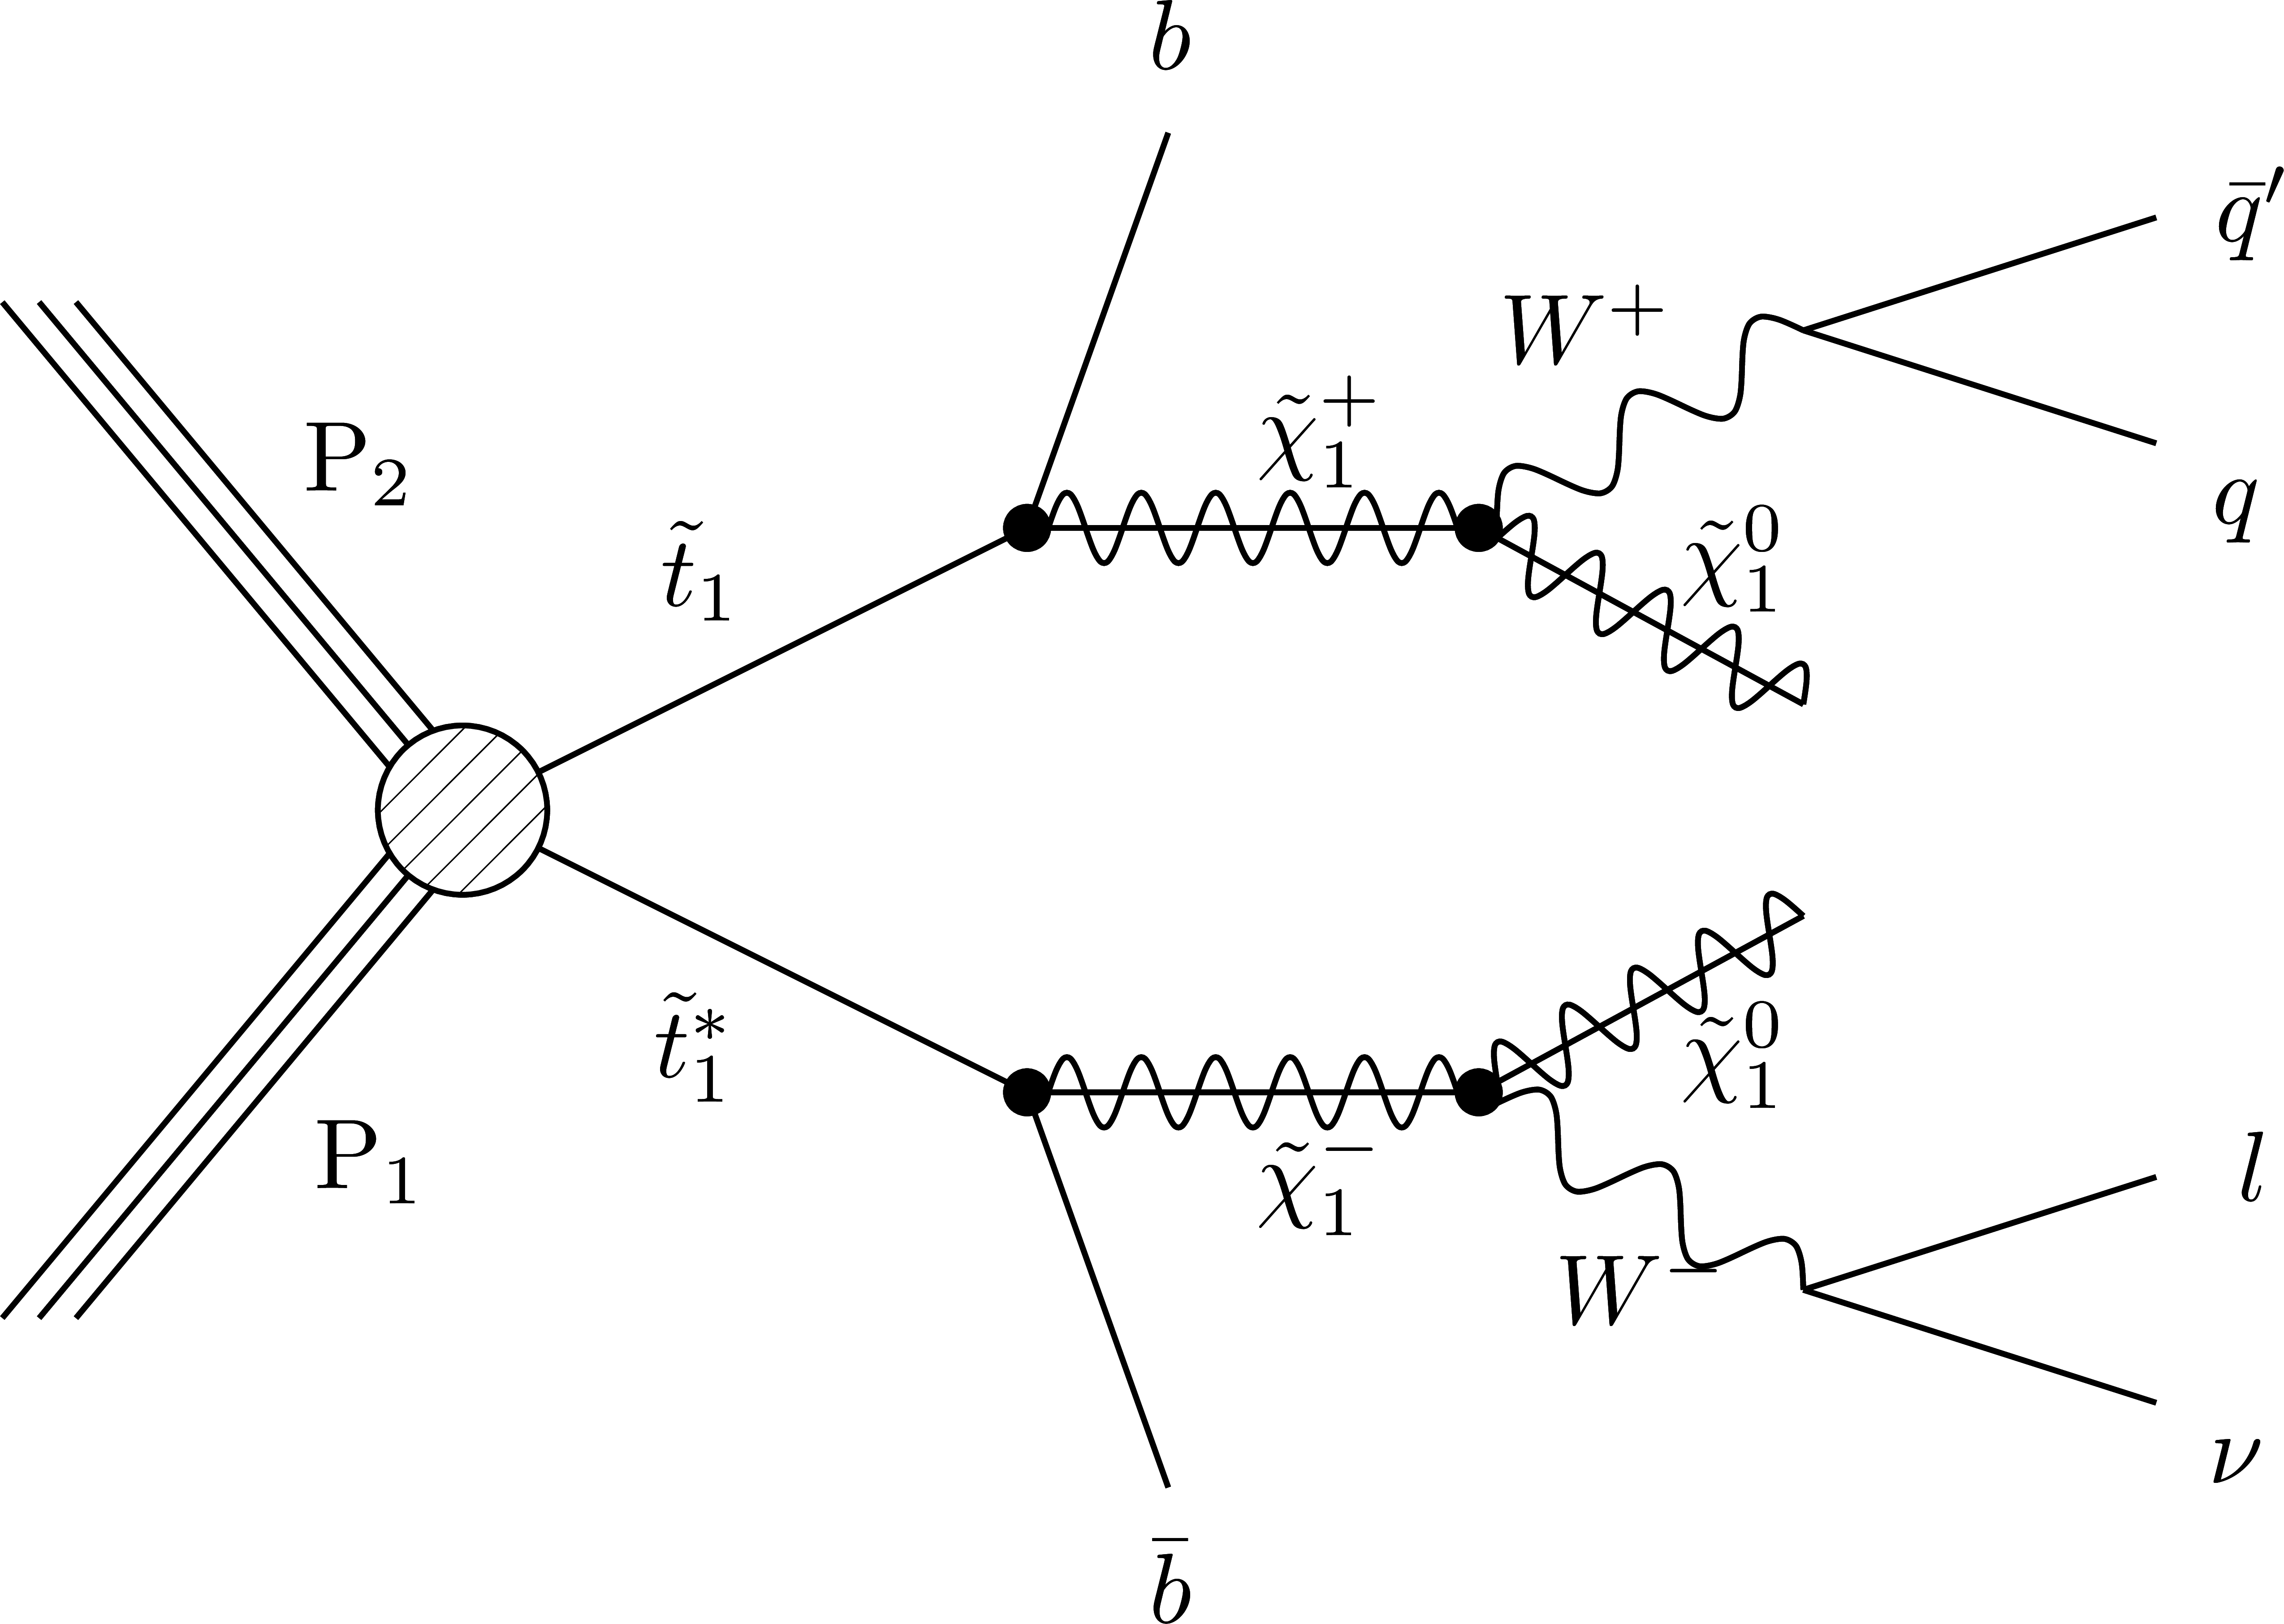
Figure 1-b:
Diagrams for the pair production of top squarks corresponding to the different decay modes. |
png pdf |
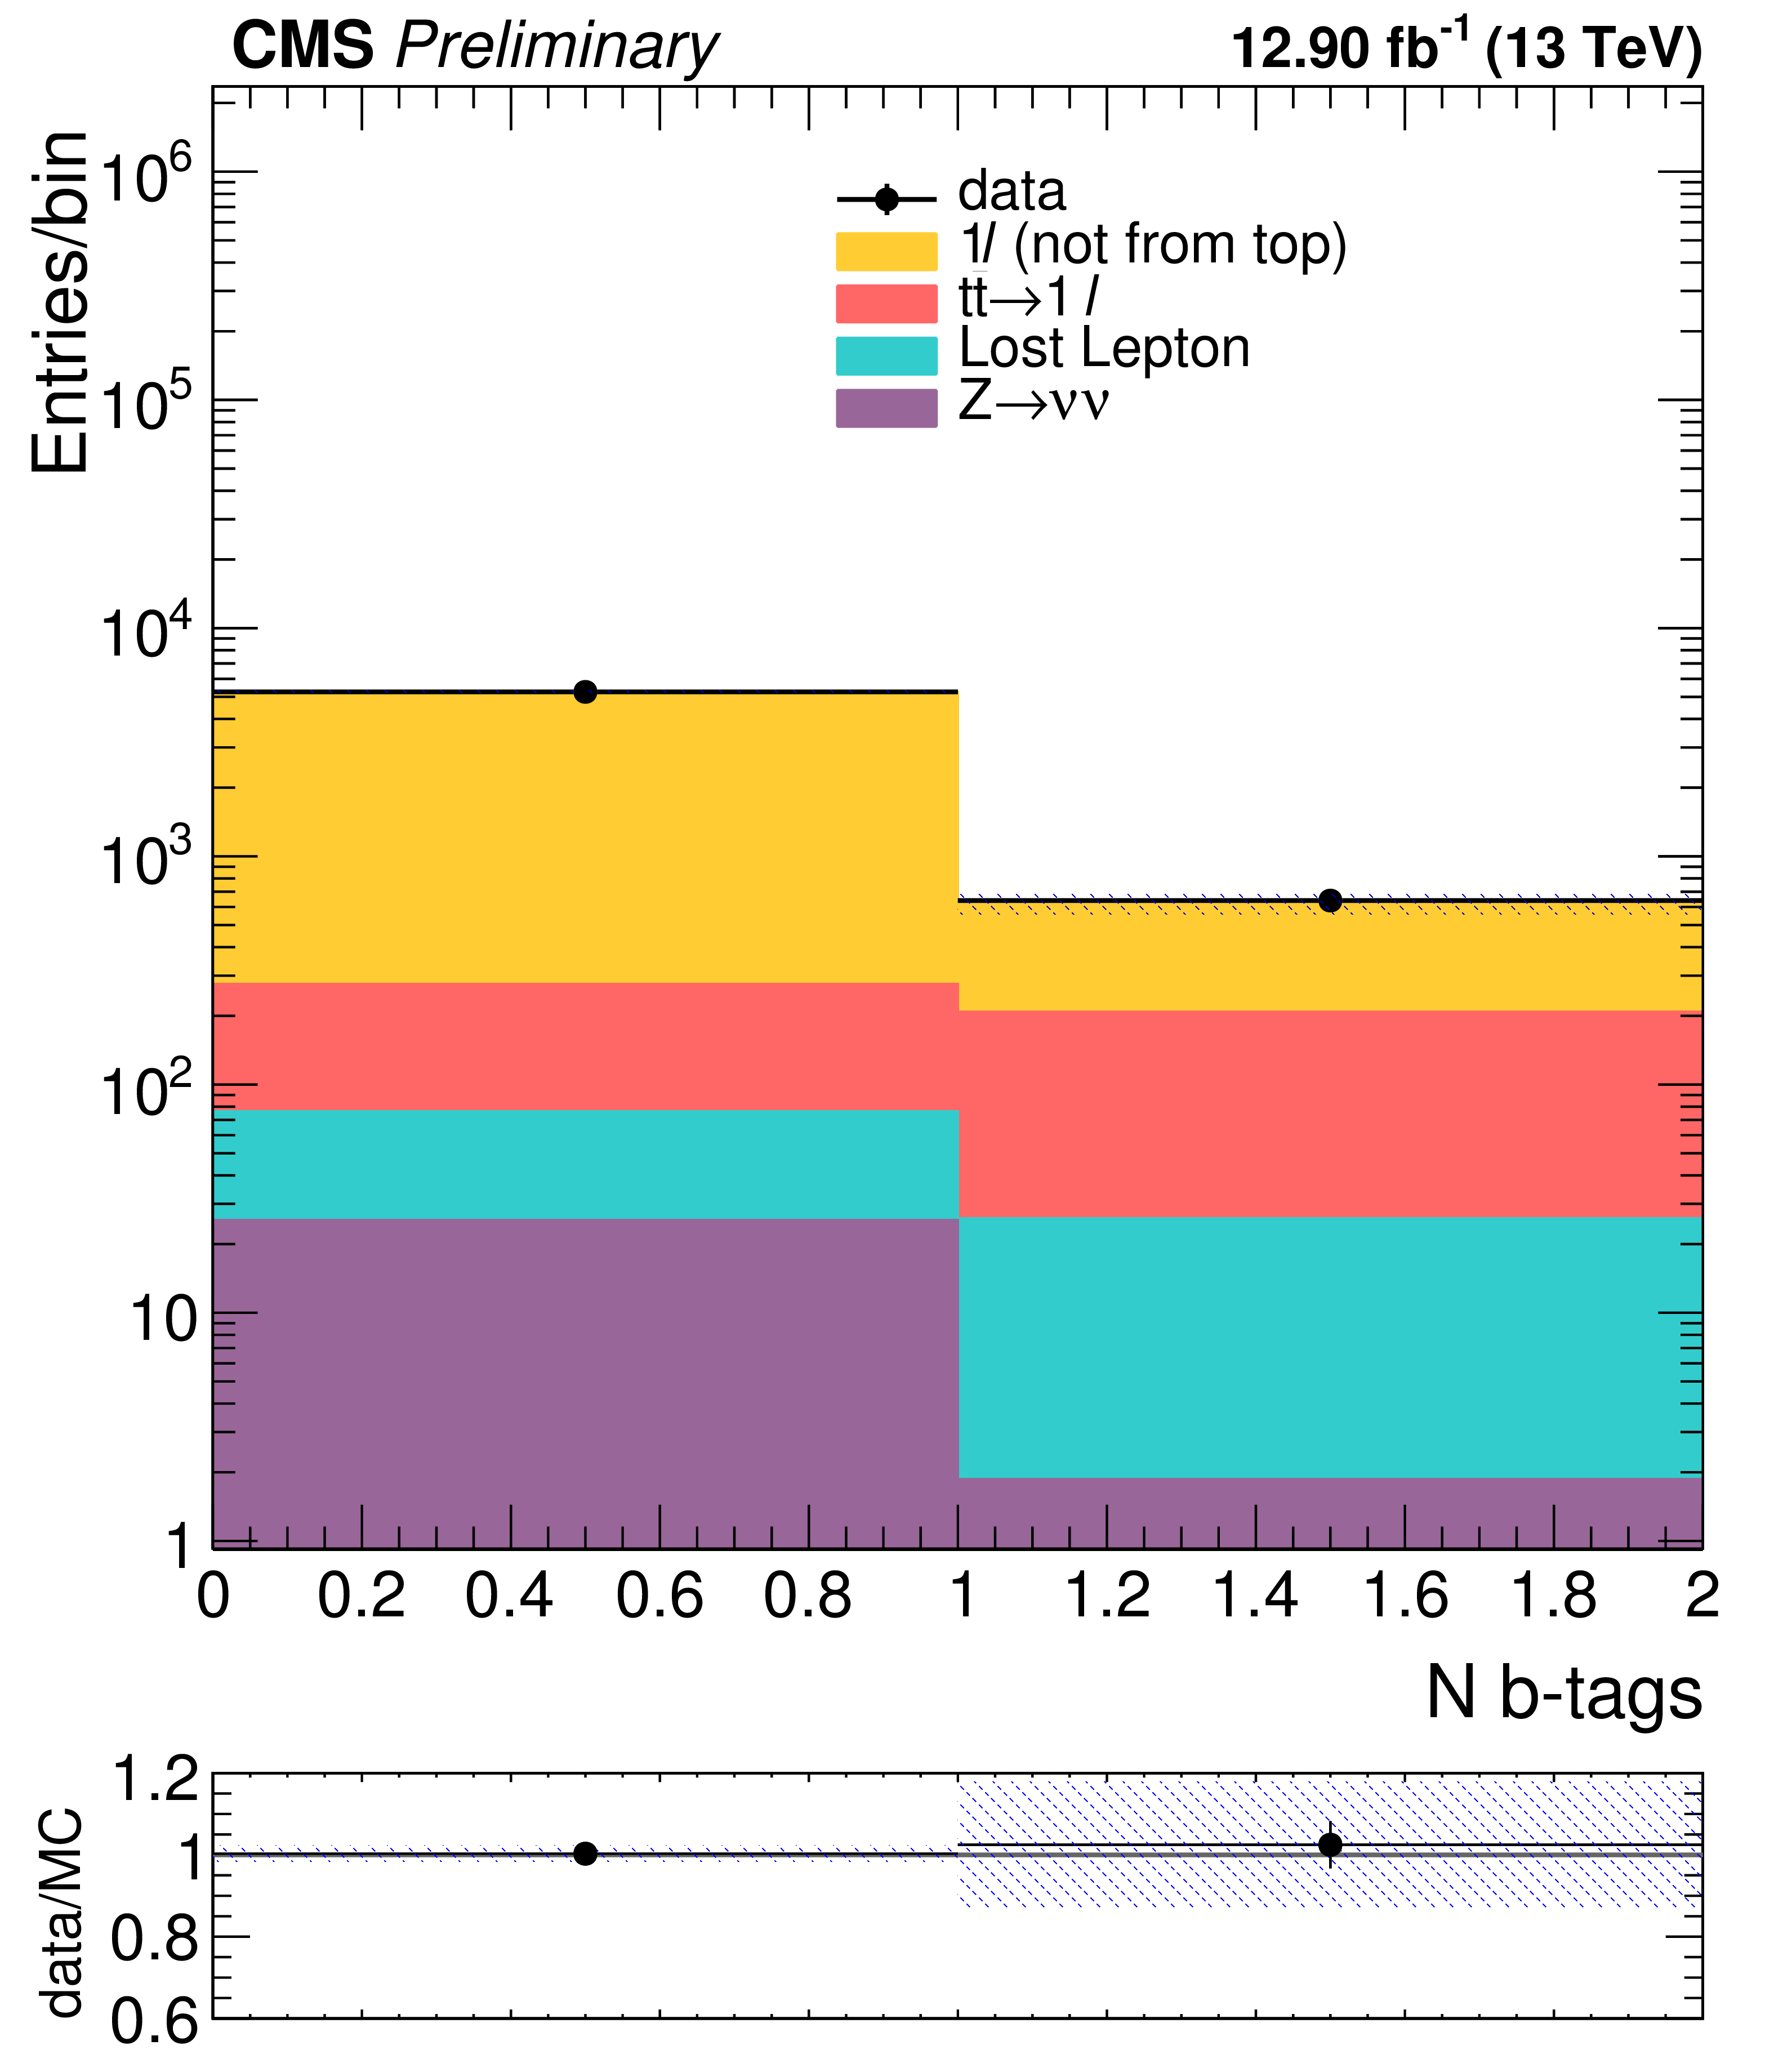
Figure 2-a:
a: Number of b-tagged jets distribution in a control sample with 1 or 2 jets and $ {E_{\mathrm {T}}^{\text {miss}}} > $ 250 GeV. The shaded band shows the uncertainty applied due to a 50% systematic uncertainty on the heavy flavor component of the W+jets sample. Data and simulation agree well within uncertainties. b: Comparison of the ${E_{\mathrm {T}}^{\text {miss}}}$ distribution between data and simulation in the $\gamma $+jets control region. |

png pdf |
Figure 2-b:
a: Number of b-tagged jets distribution in a control sample with 1 or 2 jets and $ {E_{\mathrm {T}}^{\text {miss}}} > $ 250 GeV. The shaded band shows the uncertainty applied due to a 50% systematic uncertainty on the heavy flavor component of the W+jets sample. Data and simulation agree well within uncertainties. b: Comparison of the ${E_{\mathrm {T}}^{\text {miss}}}$ distribution between data and simulation in the $\gamma $+jets control region. |
png pdf |
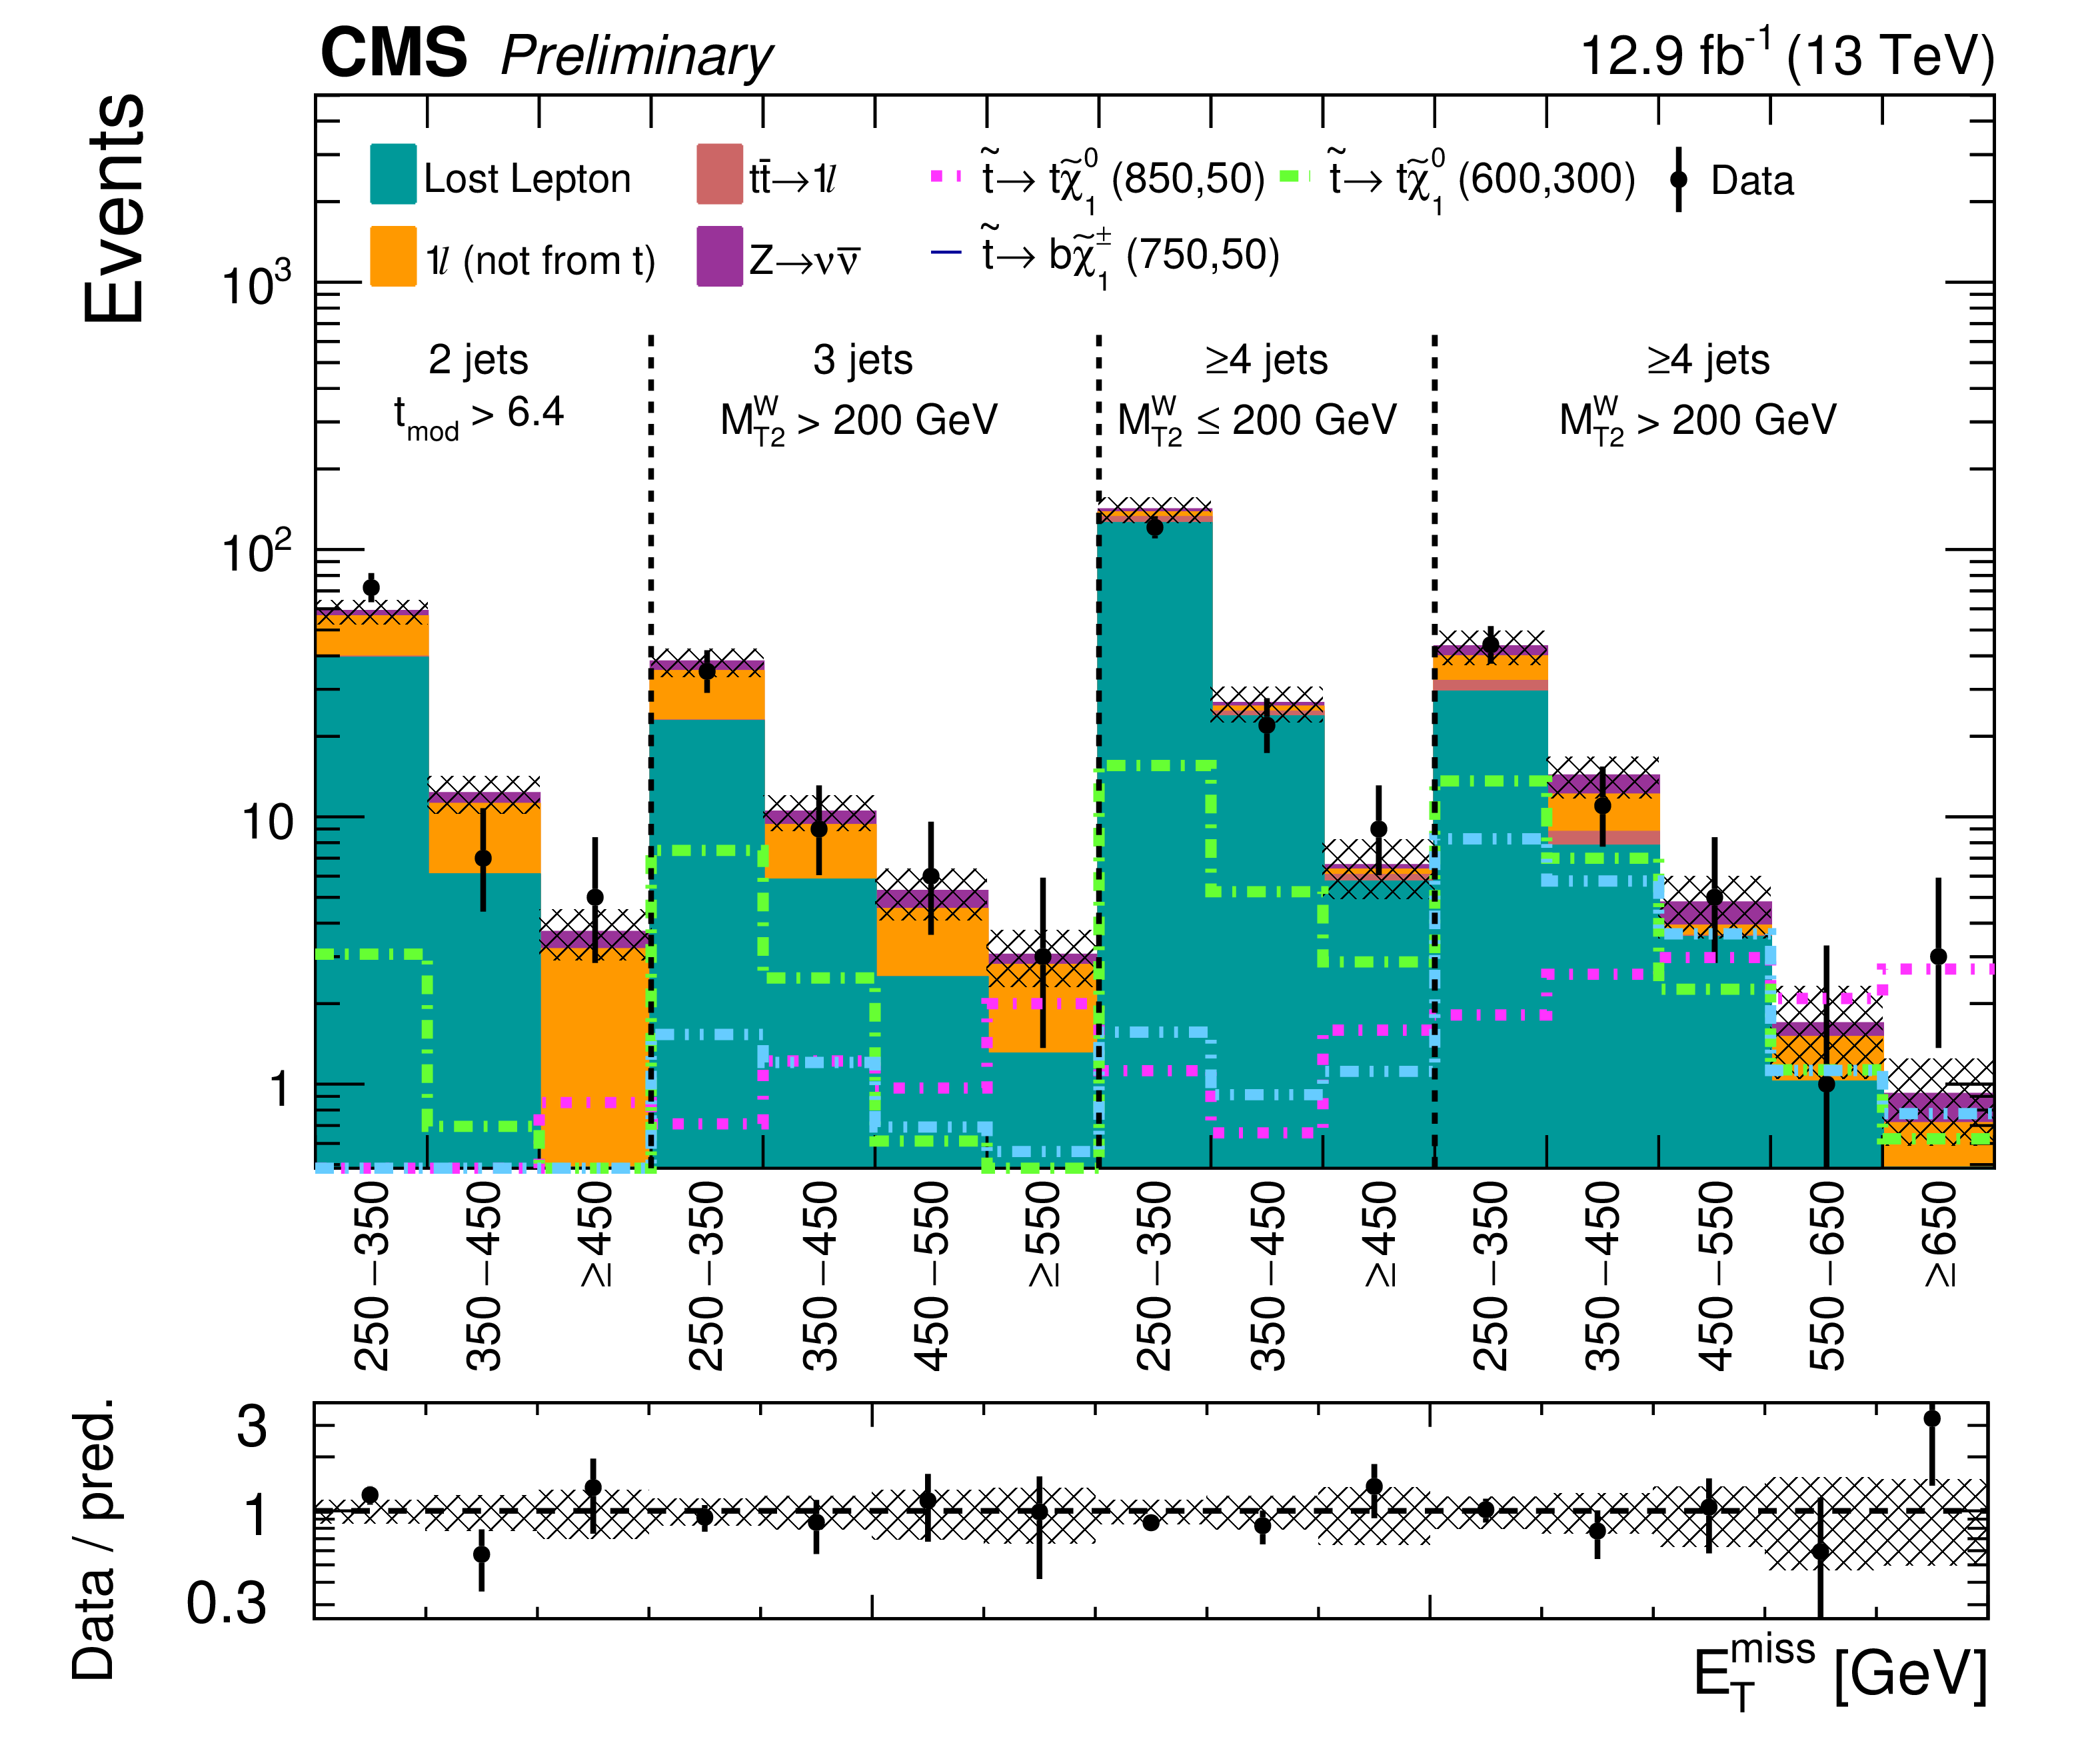
Figure 3:
Data- and simulation-driven background estimates together with the observed data yields in the signal regions, described in Table 3, collected during 2016 pp collisions. The uncertainties, which are the quadratic sums of statistical and systematic uncertainties, are shown as shaded band. Three signal hypotheses are overlaid. |
png pdf |
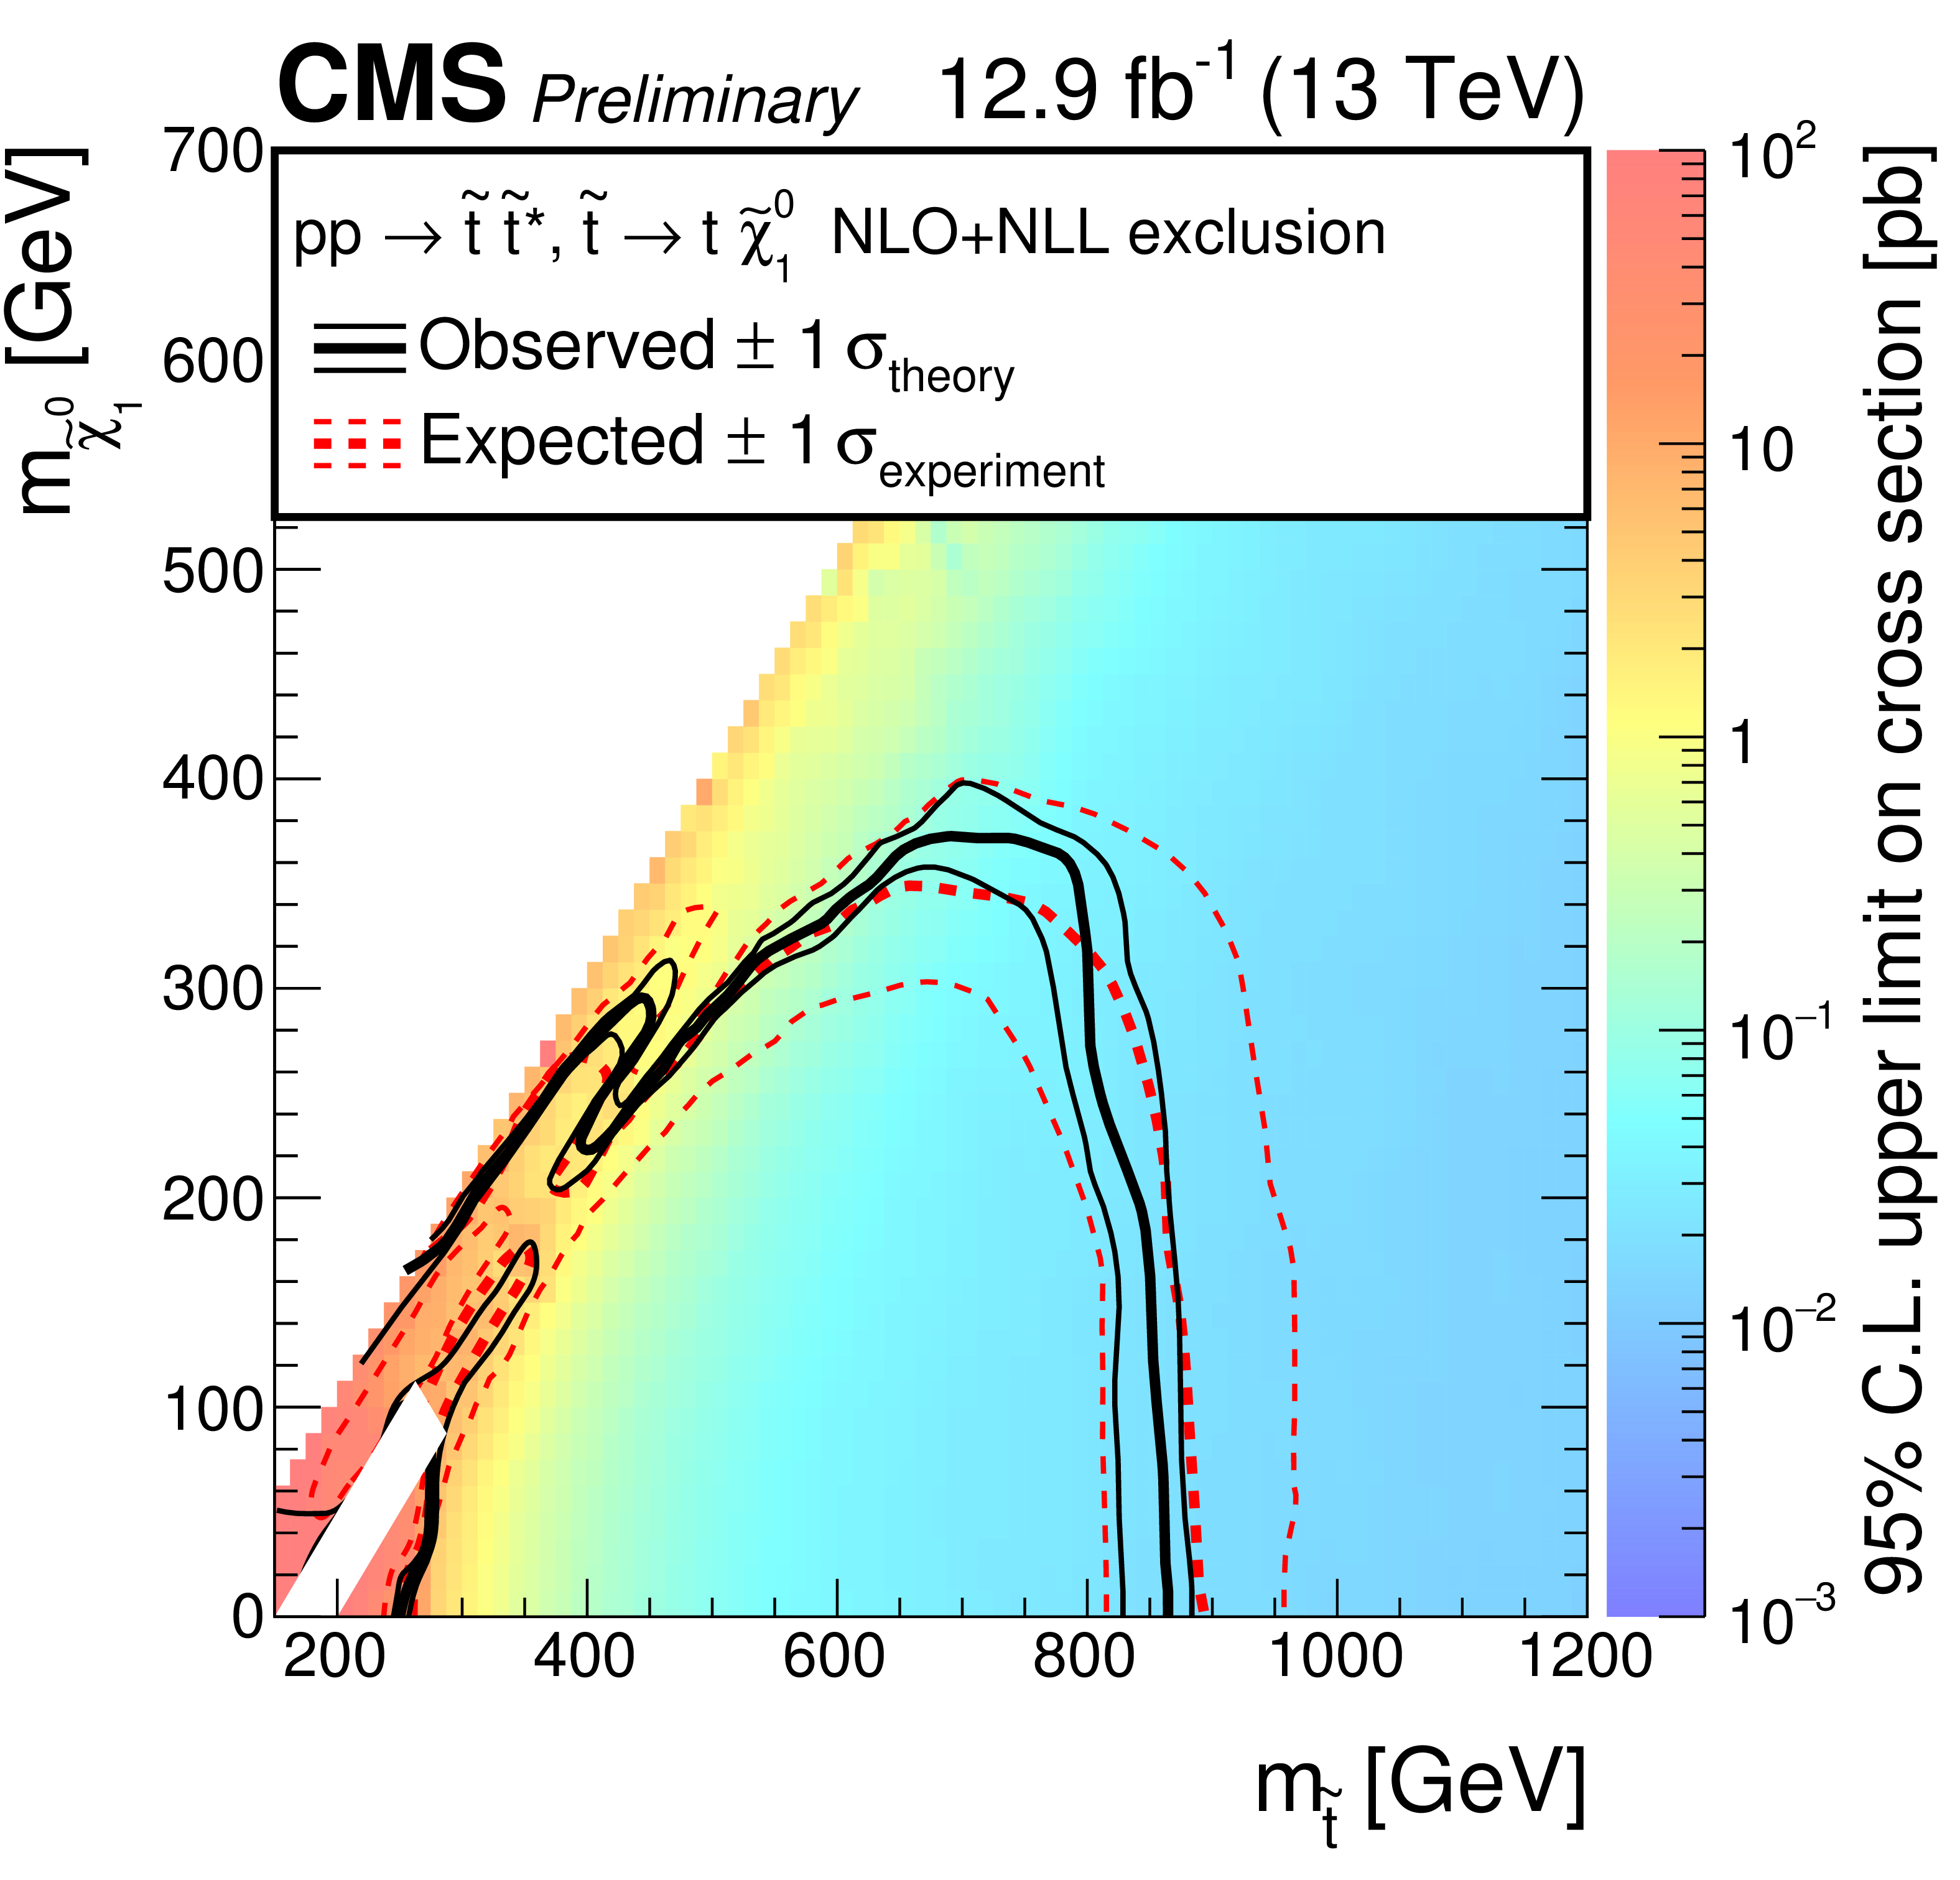
Figure 4:
The exclusion limits at 95% CL for direct top-squark production with decay $ {\tilde{t}_1} \to {\mathrm {t}} {\tilde{\chi}^{0}_{1}} $. The interpretation is done in the two dimensional space of $m_{ {\tilde{t}_1} }$ vs. $m_{ {\tilde{\chi}^{0}_{1}} }$. The color indicates the upper limit (95% CL) on the cross section times branching fraction at each point in the $m_{ {\tilde{t}_1} }$ vs. $m_{ {\tilde{\chi}^{0}_{1}} }$ plane. The area to the left of and below the thick black curve represents the observed exclusion region at 95% CL, while the dashed red lines indicate the expected limit at 95% CL and their $\pm$1$ \sigma $ experiment standard deviation uncertainties. The thin black lines show the effect of the theoretical uncertainties $\sigma _\mathrm {theory}$ on the signal cross section. |

png pdf |
Figure 5:
The exclusion limit at 95% CL for direct top-squark production with decay $ {\mathrm {p}} {\mathrm {p}}\to {\tilde{t}_1} {\tilde{t}_1} ^*\to {\mathrm {b}} {\overline {\mathrm {b}}} {\tilde{\chi}^\pm _{1}} {\tilde{\chi}^\pm _{1}} $, $ {\tilde{\chi}^\pm _{1}} \to {\mathrm {W}} {\tilde{\chi}^{0}_{1}} $. The mass of the chargino is chosen to be $(m_{ {\tilde{t}_1} } + m_{ {\tilde{\chi}^{0}_{1}} })/2$. The interpretation is done in the two dimensional space of $m_{ {\tilde{t}_1} }$ vs. $m_{ {\tilde{\chi}^{0}_{1}} }$. The color indicates the upper limit (95% CL) on the cross section times branching fraction at each point in the $m_{ {\tilde{t}_1} }$ vs. $m_{ {\tilde{\chi}^{0}_{1}} }$ plane. The area to the left of and below the thick black curve represents the observed exclusion region at 95% CL, while the dashed red lines indicate the expected limit at 95% CL and their $\pm$1$ \sigma $ experiment standard deviation uncertainties. The thin black lines show the effect of the theoretical uncertainties $\sigma _\mathrm {theory}$ on the signal cross section. |
| Tables | |
png pdf |
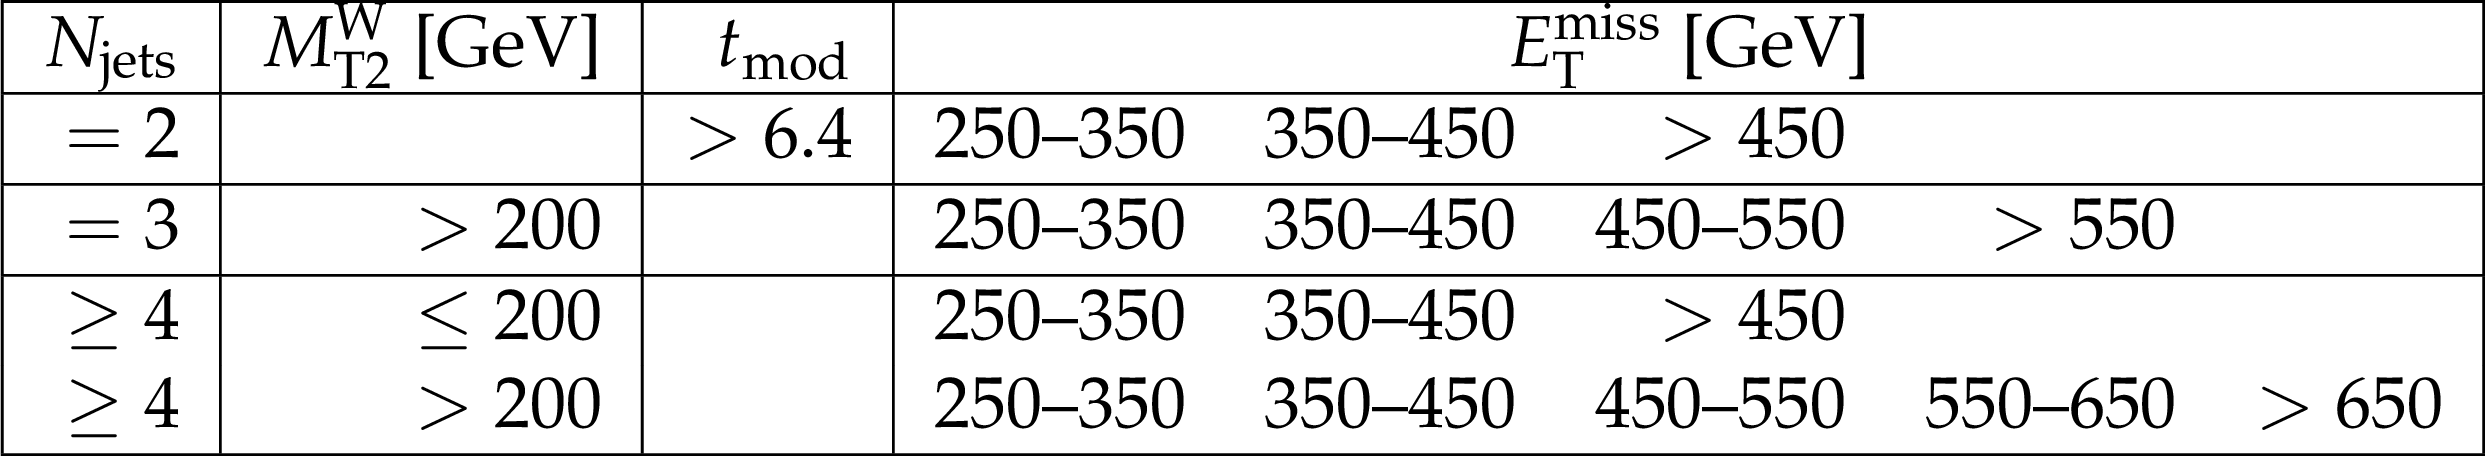
Table 1:
Summary of the signal region definitions. |
png pdf |
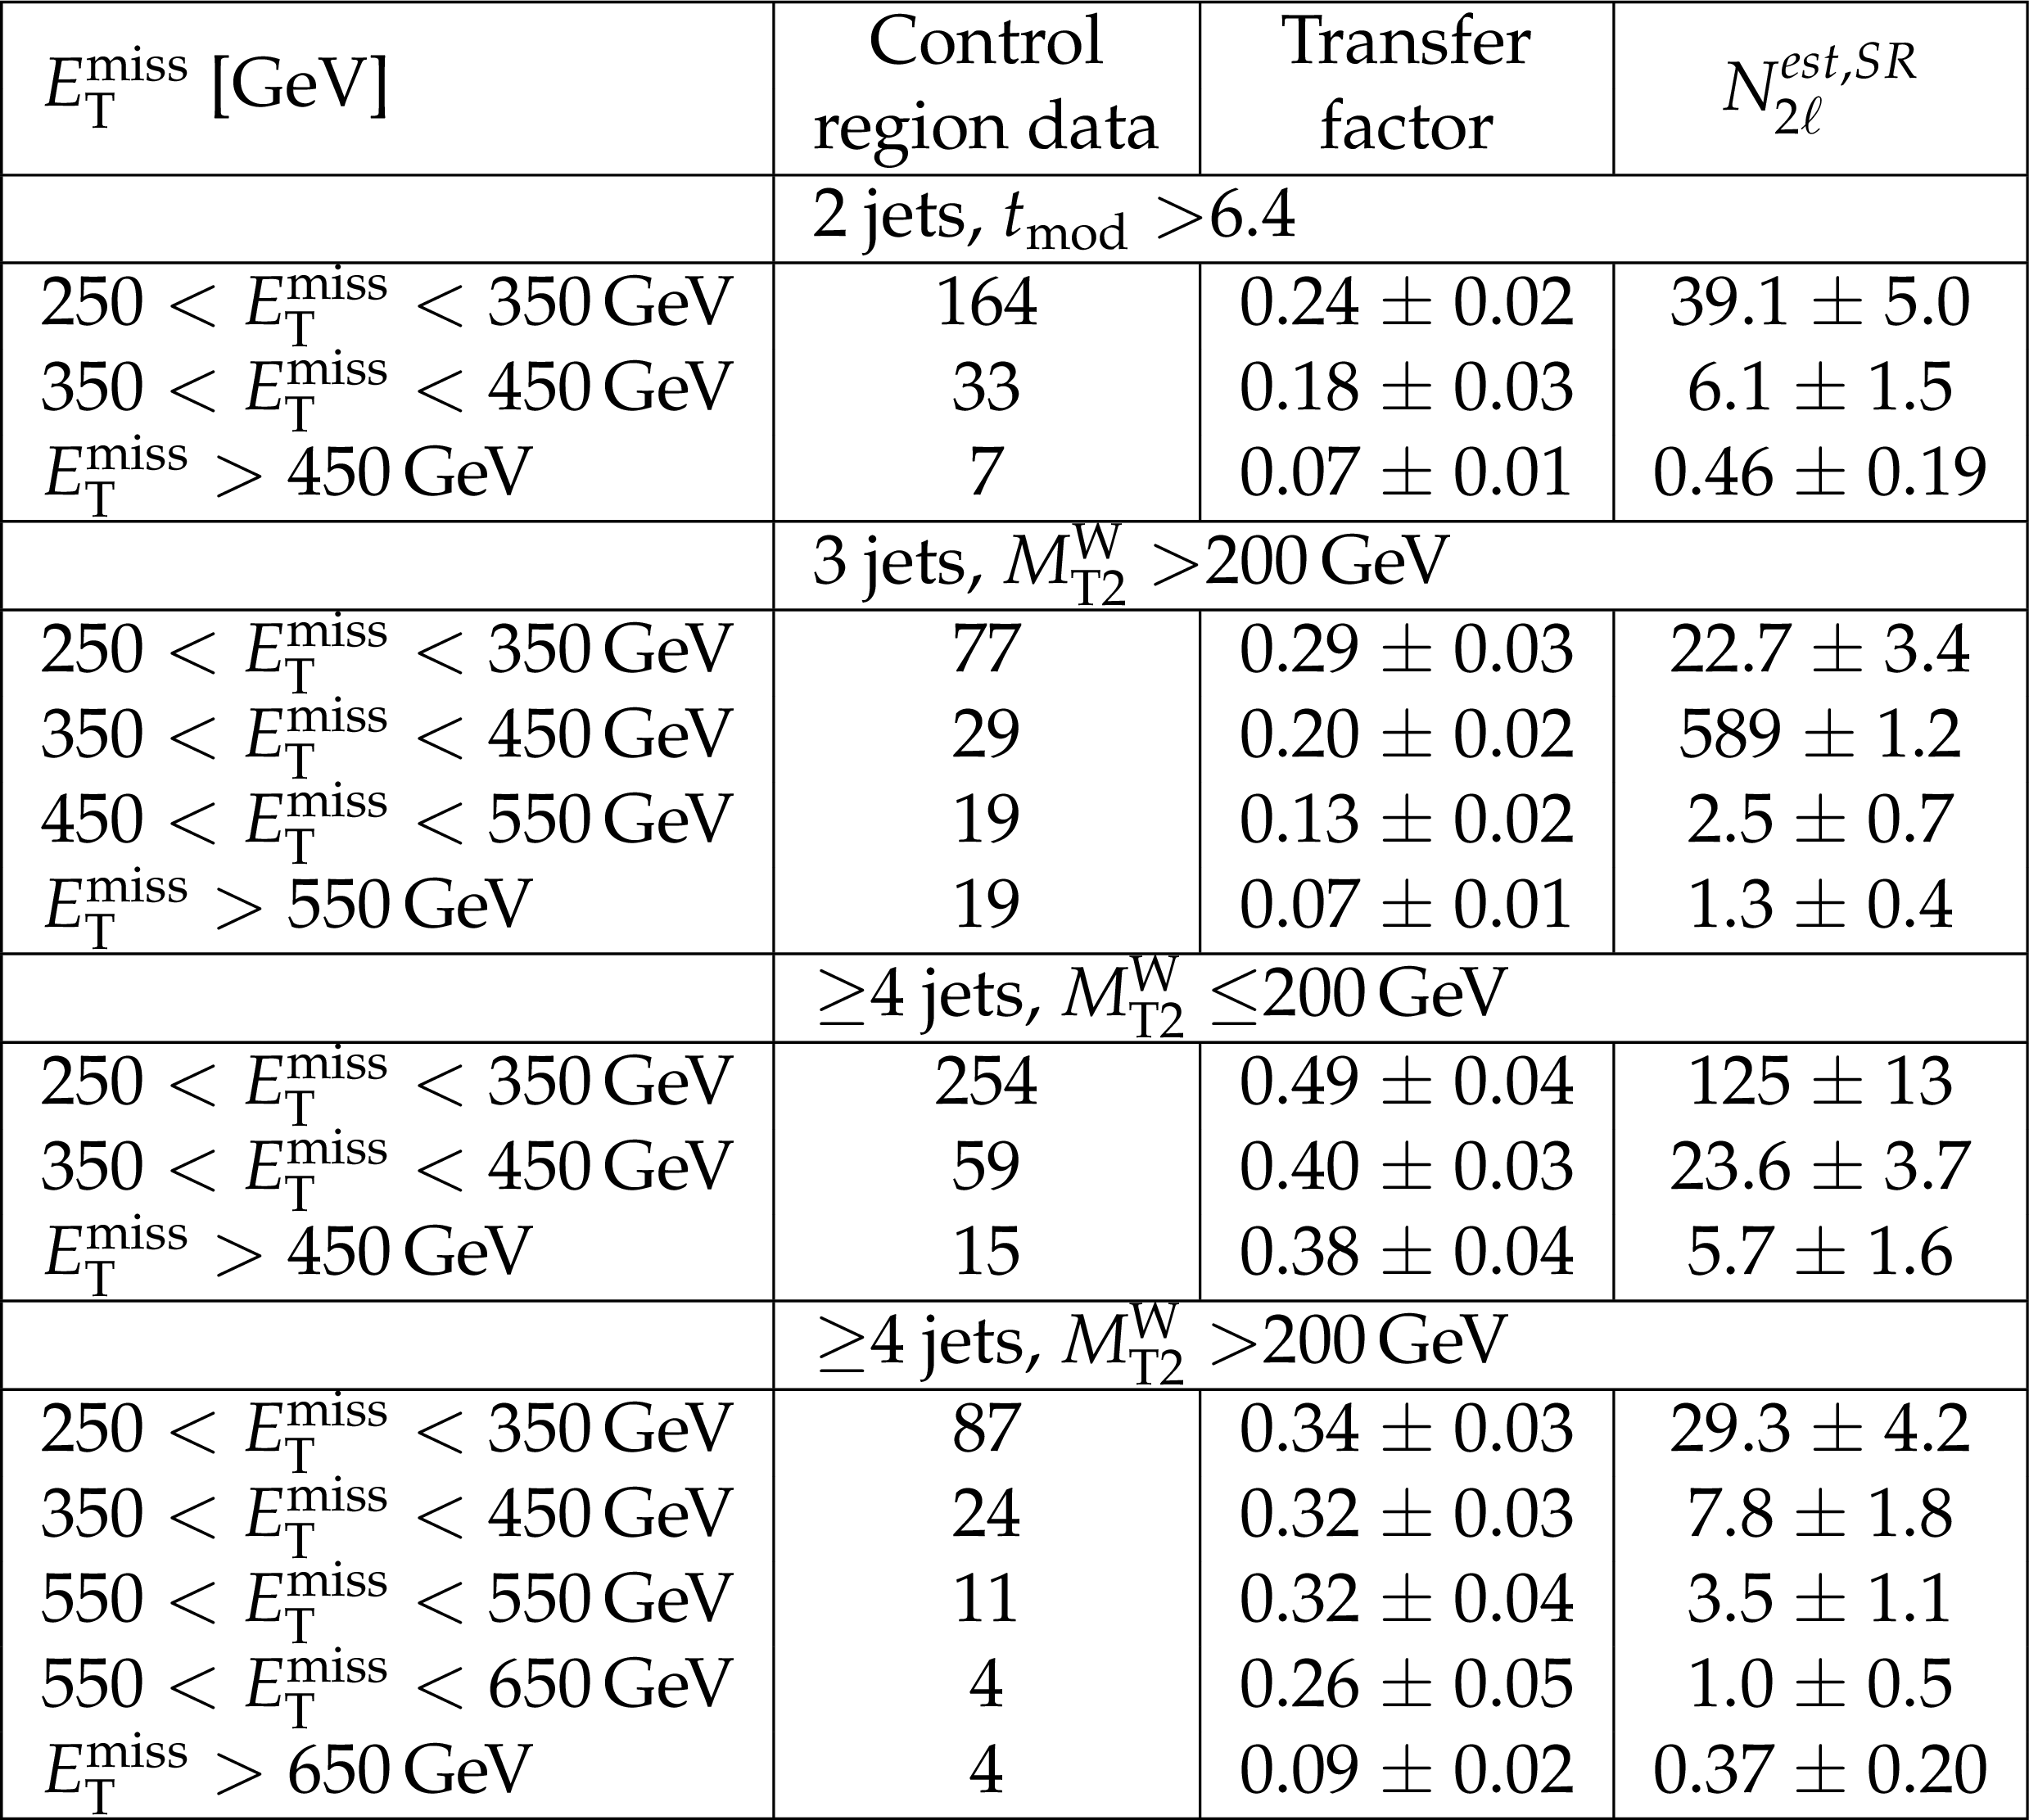
Table 2:
Event yields in data control regions for the lost lepton background and the transfer factor. The last column shows the final background estimate, including all systematic uncertainties. |
png pdf |
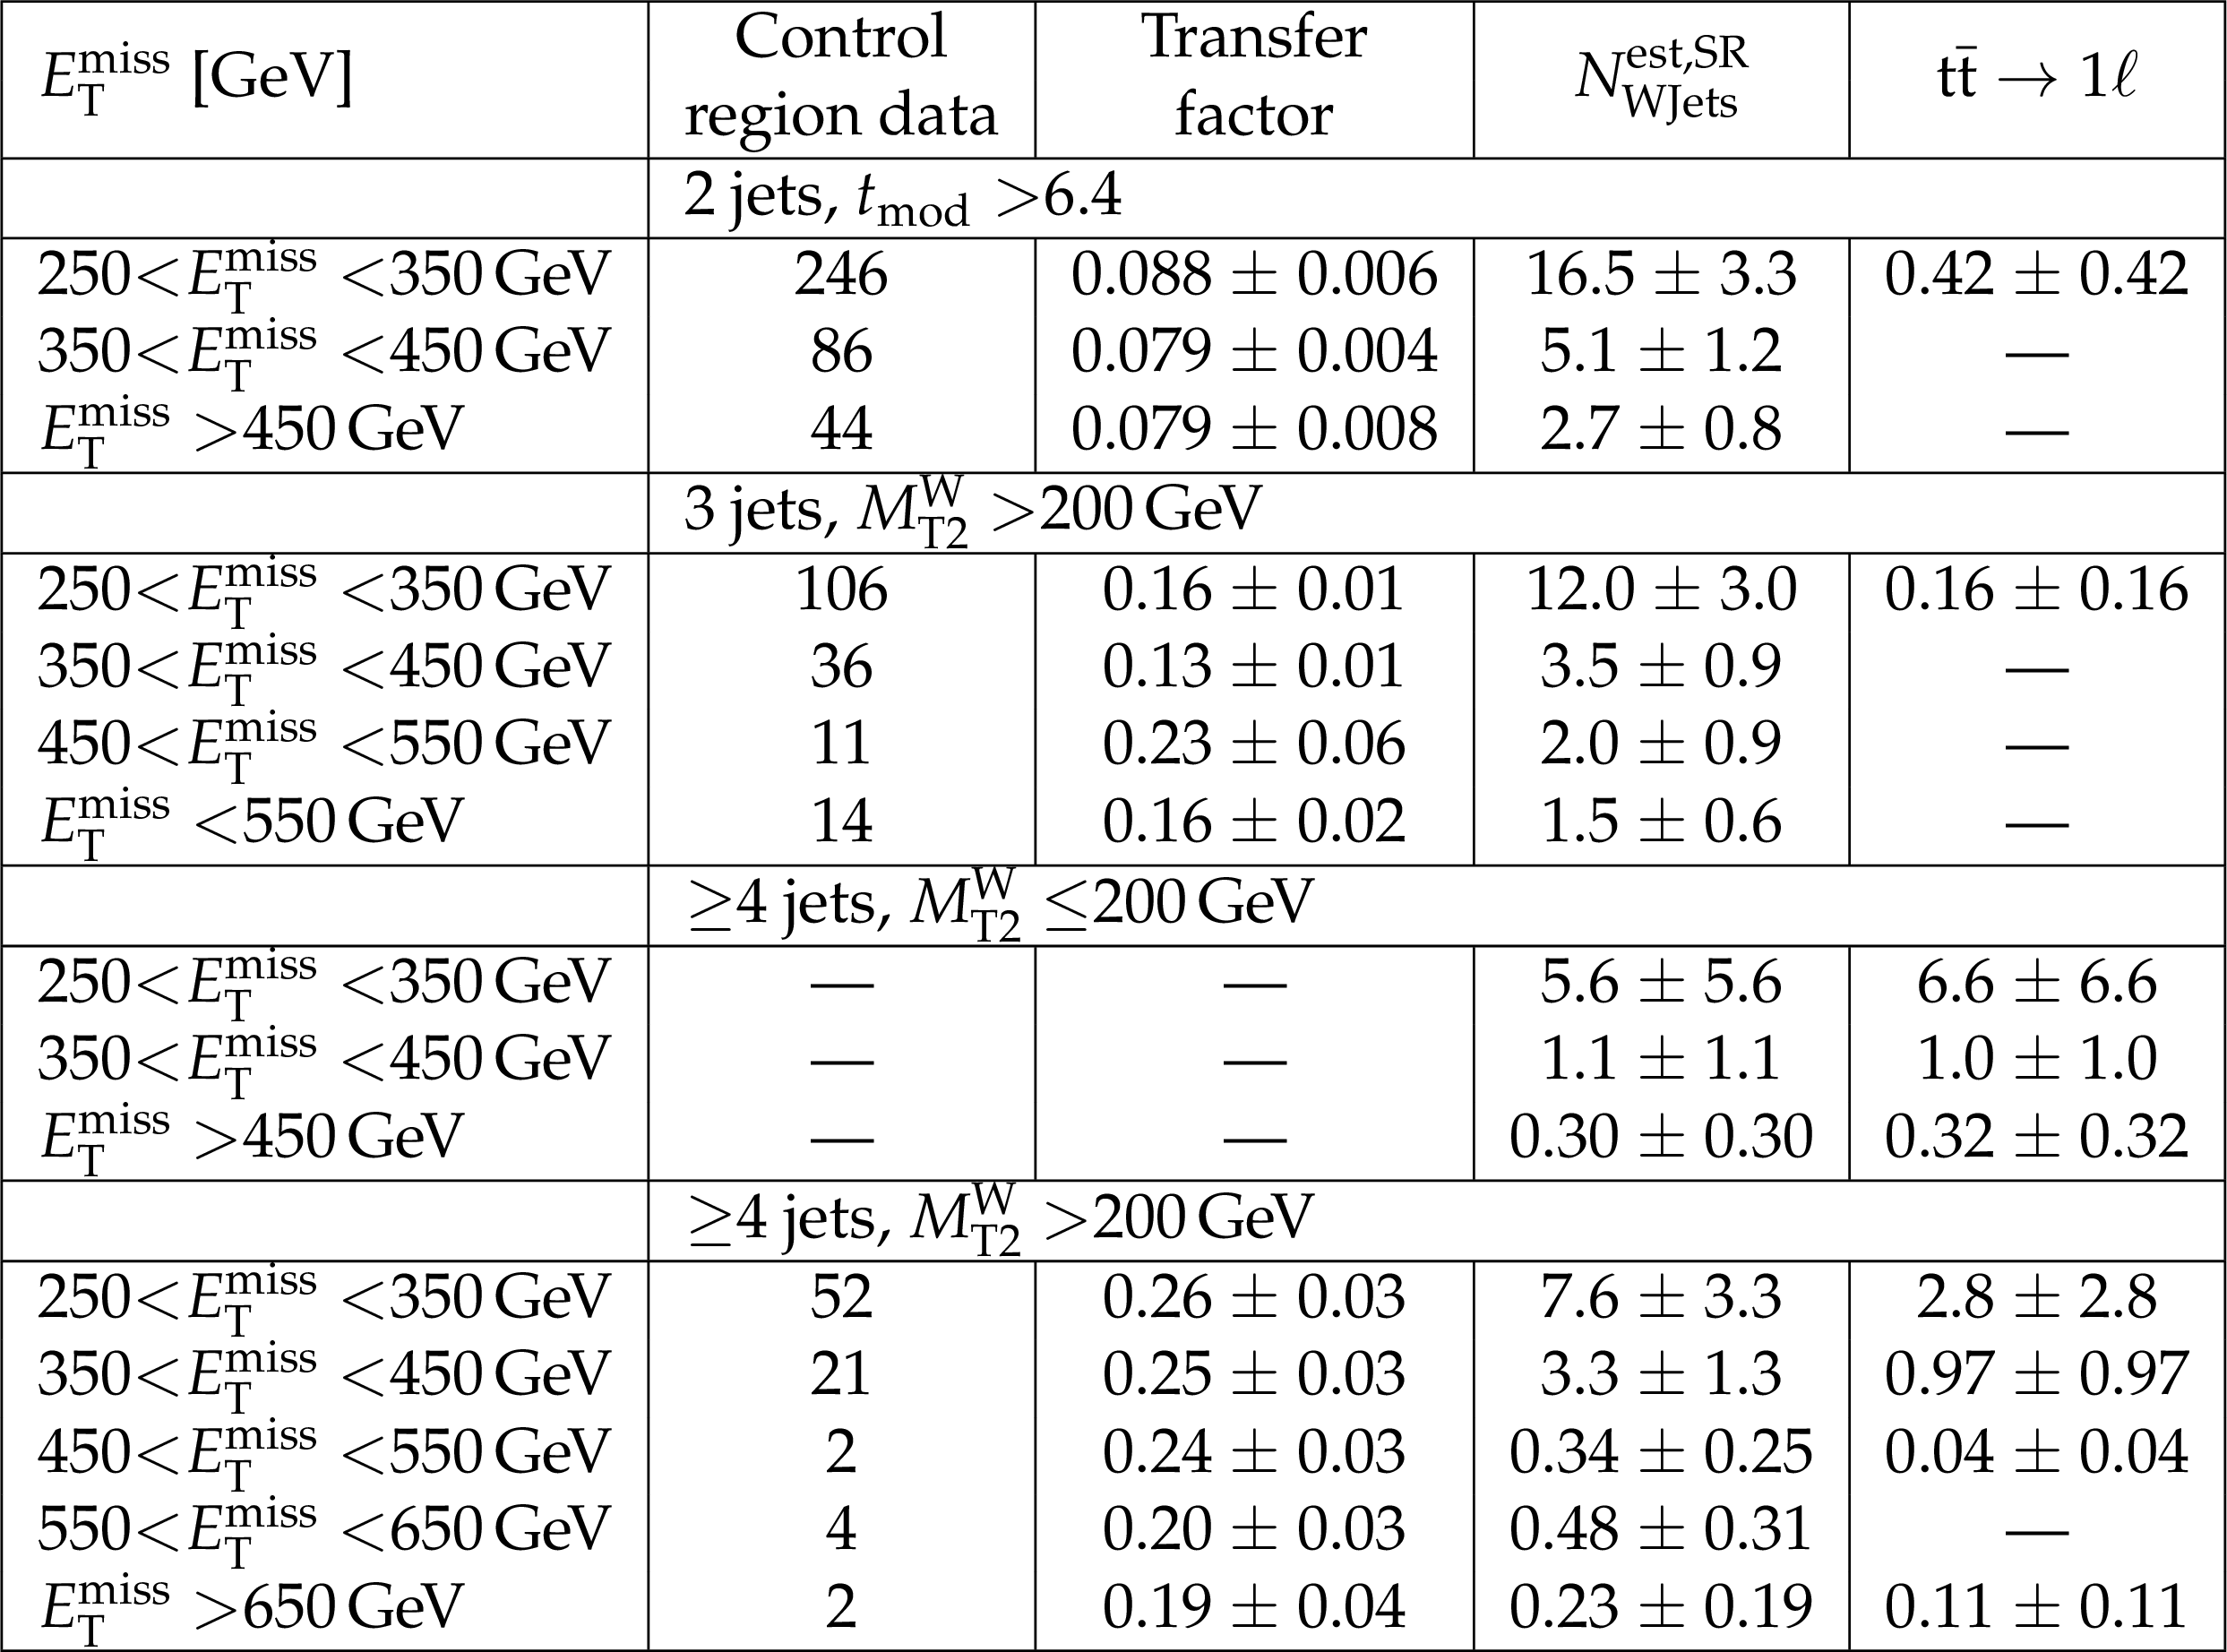
Table 3:
Event yields in the W+jets 0 b-tagged control region and the transfer factors used to estimate the W+jets background. The final W+jets yields and the $ {\mathrm {t}\overline {\mathrm {t}}} \to 1\ell $ estimate from simulation with their combined systematic and statistical uncertainty are shown in the last two colums for ${\mathcal {L}}$ of data. The low ${\Delta }M$ regions are fully estimated from simulation. For the transfer factors only the statistical uncertainty is shown. |
png pdf |
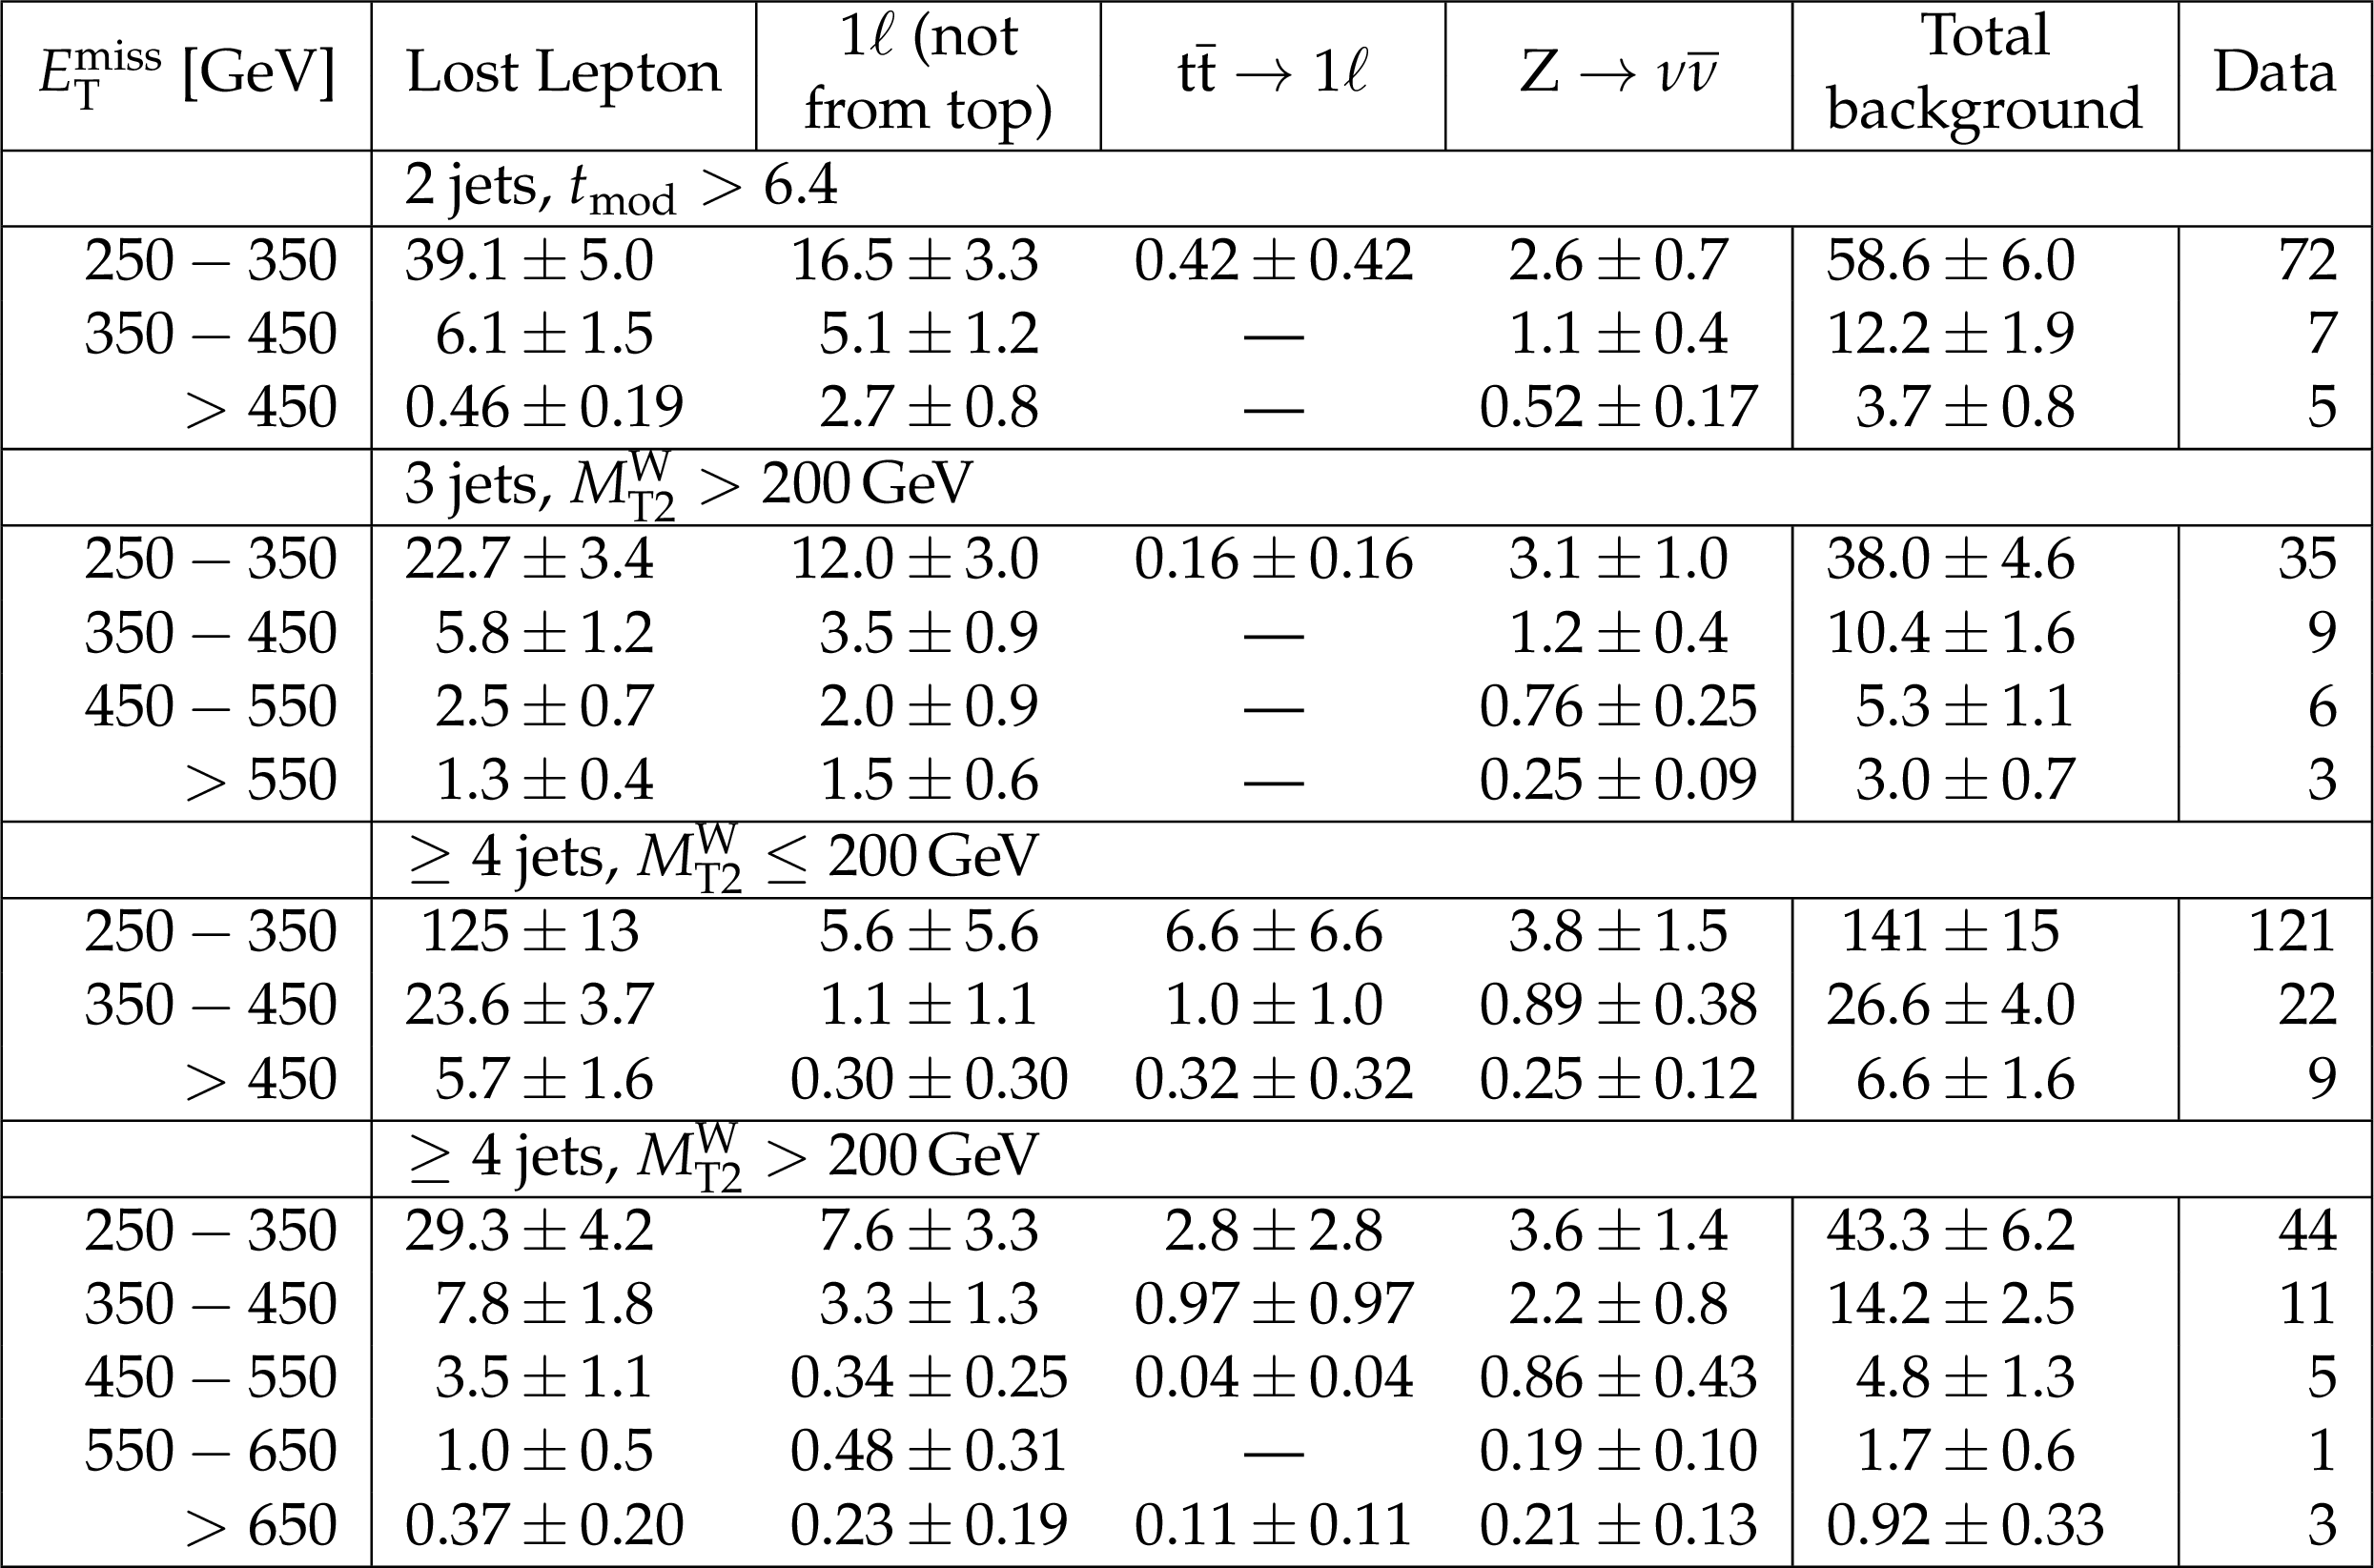
Table 4:
Results of the data- and simulation-driven background estimates together with the observed data yields collected during 2016 pp collisions. The uncertainties are the quadratic sums of statistical and systematic uncertainties. |

png pdf |
Table 5:
Summary of the systematic uncertainties for the signal and background estimates with their typical values in individual signal regions. |
| Summary |
| We presented a search for direct top squark pair production in pp collisions at $ \sqrt{s} = $ 13 TeV in events a single isolated charged electron of muon, jets, and large $E_{\mathrm{T}}^{\text{miss}}$ using 12.9 fb$ {^{-1}}$ of data collected with the CMS detector during the 2016 run of the LHC. No sign of signal is observed and exclusion limits are set in the context of supersymmetric models with pair production of top squarks that decay either to a top quark and a neutralino or to a bottom quark and a chargino. Assuming that all top squarks decay to a top quark and a neutralino, we exclude at the 95% confidence level top squark masses up to 860 GeV for a massless neutralino and neutralino masses up to 380 GeV for a 700 GeV top squark mass. We also show results for the top squark decay to a top quark and a neutralino or a b quark and a chargino, with the chargino mass being the average of the neutralino mass and top squark mass. In that scenario, we exclude at the 95% confidence level top squark masses up to 775 GeV for a massless neutralino and neutralino masses up to 325 GeV for a 700 GeV top squark mass. |
| References | ||||
| 1 | ATLAS Collaboration | Search for top squarks in final states with one isolated lepton, jets, and missing transverse momentum in $ \sqrt{s}=13 $ TeV $ pp $ collisions with the ATLAS detector | 1606.03903 | |
| 2 | CMS Collaboration | Search for direct top squark pair production in the single lepton final state at $ \sqrt{s}=13 \mathrm{TeV} $ | CMS-PAS-SUS-16-002 | CMS-PAS-SUS-16-002 |
| 3 | M. Cacciari, G. P. Salam, and G. Soyez | The anti-$ k_\mathrm{T} $ jet clustering algorithm | JHEP 04 (2008) 063 | 0802.1189 |
| 4 | M. Cacciari and G. P. Salam | Pileup subtraction using jet areas | PLB 659 (2008) 119 | 0707.1378 |
| 5 | CMS Collaboration | Identification of b-quark jets with the CMS experiment | JINST 8 (2013) P04013 | CMS-BTV-12-001 1211.4462 |
| 6 | CMS Collaboration | Missing transverse energy performance of the CMS detector | JINST 6 (2011) P09001 | CMS-JME-10-009 1106.5048 |
| 7 | Y. Bai, H.-C. Cheng, J. Gallicchio, and J. Gu | Stop the Top Background of the Stop Search | JHEP 07 (2012) 110 | 1203.4813 |
| 8 | M. L. Graesser and J. Shelton | Hunting Mixed Top Squark Decays | PRL 111 (2013) 121802 | 1212.4495 |
| 9 | CMS Collaboration | Searches for third-generation squark production in fully hadronic final states in proton-proton collisions at $ \sqrt{s} = 8 $ TeV | JHEP 06 (2015) 116 | CMS-SUS-14-001 1503.08037 |
| 10 | S. Abdullin et al. | The fast simulation of the CMS detector at LHC | J. Phys. Conf. Ser. 331 (2011) 032049 | |
| 11 | GEANT4 Collaboration | GEANT4---a simulation toolkit | NIMA 506 (2003) 250 | |
|
|
Compact Muon Solenoid LHC, CERN |
|

|

|

|

|

|