

Compact Muon Solenoid
LHC, CERN
| CMS-PAS-SUS-17-001 | ||
| Search for direct stop pair production in the dilepton final state at $\sqrt{s}=$ 13 TeV | ||
| CMS Collaboration | ||
| March 2017 | ||
| Abstract: A search for direct top squark production in the opposite-sign dilepton channel is presented, using LHC pp collision data at $\sqrt{s}= $ 13 TeV amounting to 35.9 fb$^{-1}$ collected by the CMS detector in 2016. The search is performed in final states with two leptons, electrons or muons, jets, of which at least one is b-tagged, and missing transverse momentum. Signal regions are defined using transverse mass variables as well as missing transverse energy, which efficiently separate the signal from the dominant top-quark pair background. No significant deviation from the background prediction is observed. Exclusion limits are set in the context of two different simplified supersymmetric models with pair production of top squarks. For top squarks that each decay to a top quark and a neutralino, masses of the lightest top squark below 800 GeV are excluded at a confidence level of 95% for neutralino masses below 350 GeV. Interpreting the results within an alternative model where the top squarks undergo a cascade decay through charginos and sleptons, top squarks with masses up to 1300 GeV are excluded for neutralino masses of 400 GeV. | ||
|
Links:
CDS record (PDF) ;
inSPIRE record ;
CADI line (restricted) ;
These preliminary results are superseded in this paper, PRD 97 (2018) 032009. The superseded preliminary plots can be found here. |
||
| Figures & Tables | Summary | Additional Figures & Tables | References | CMS Publications |
|---|
|
Additional information on efficiencies needed for reinterpretation of
these results are available here. Additional technical material for CMS speakers can be found here. |
| Figures | |
png pdf |
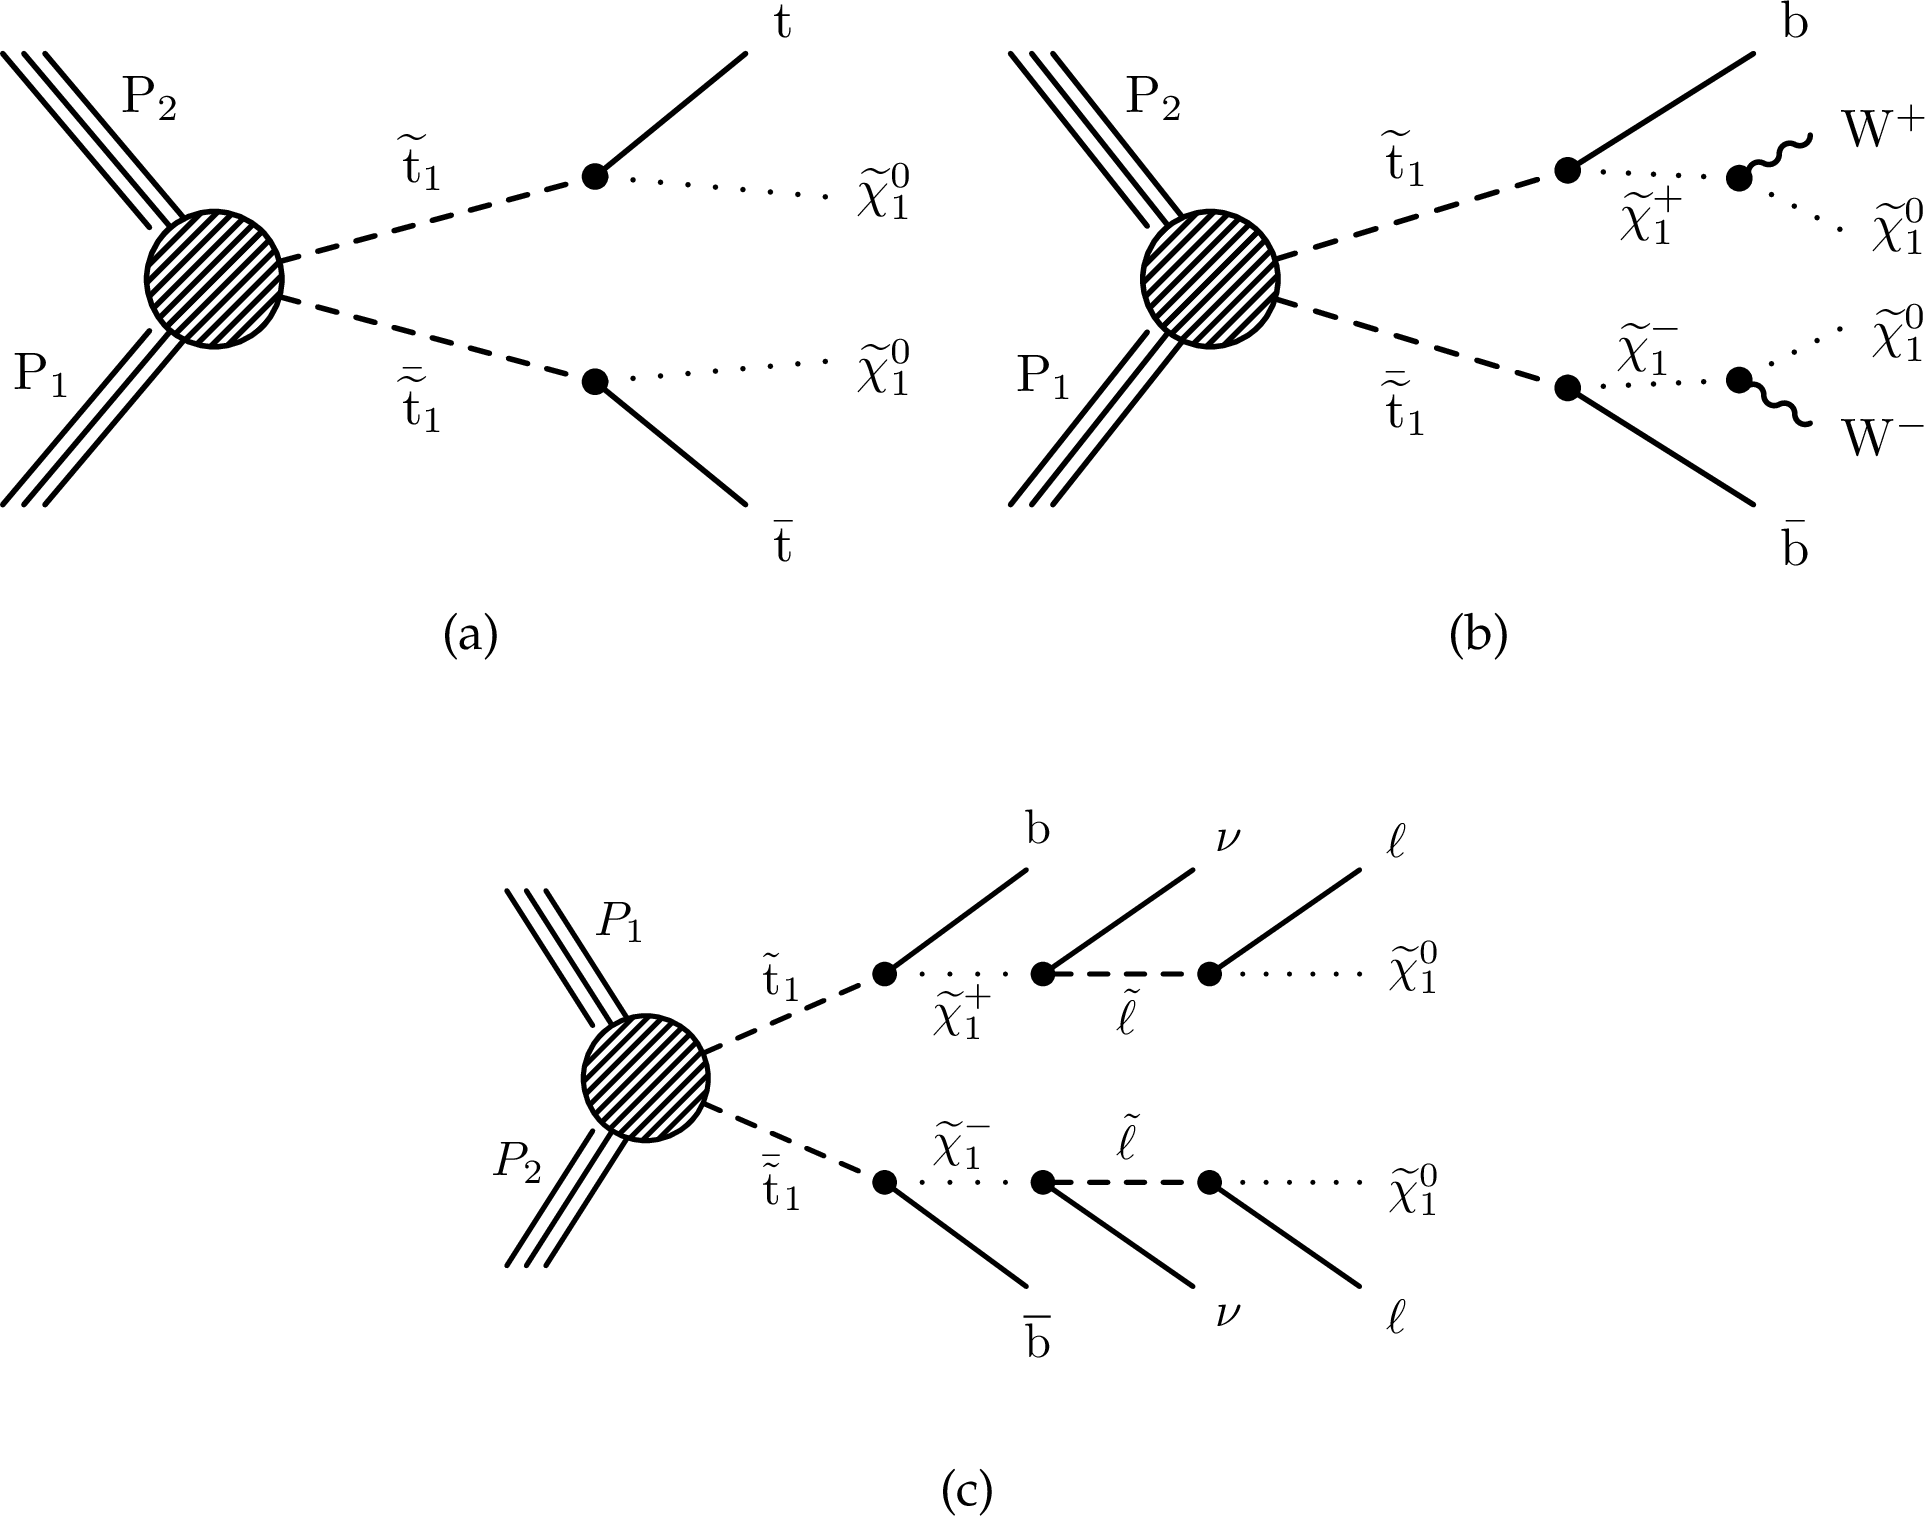
Figure 1:
Strong production of top squark pairs ($\tilde{ \mathrm{ t } } _{1}\overline{ \tilde{\mathrm{t}}}_{1}$) in simplified models. The top squarks either decay directly to a top quark and a neutralino ($\tilde{\chi}^0_1 $), shown in diagram (a), or undergo a cascade decay into a neutralino via an intermediate chargino ($\tilde{\chi}^{{\pm}}_1 $), shown in diagram (b). The decay via an intermediate slepton ($\tilde{\ell }$) to a lepton and the neutralino is shown in diagram (c). |
png pdf |
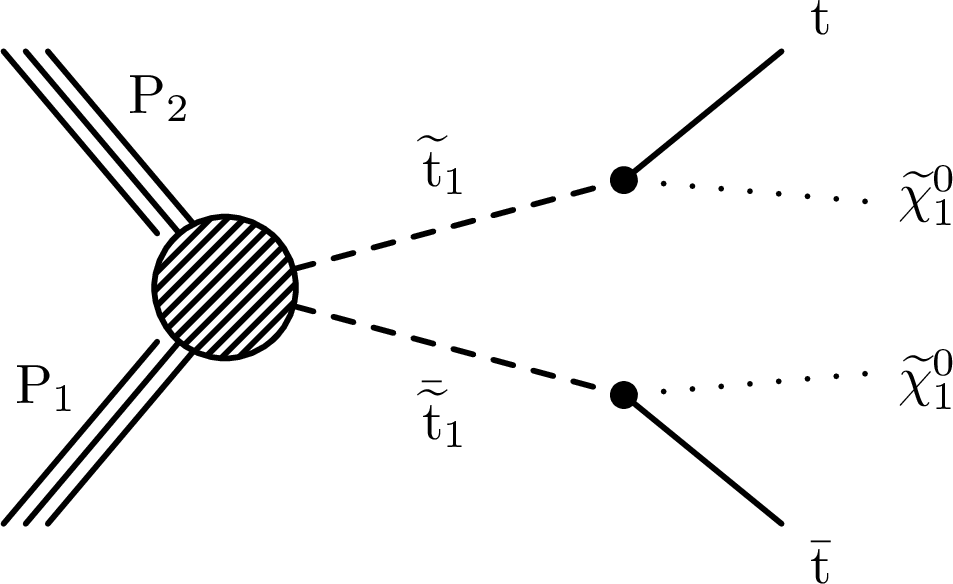
Figure 1-a:
Strong production of top squark pairs ($\tilde{ \mathrm{ t } } _{1}\overline{ \tilde{\mathrm{t}}}_{1}$) in simplified models. In this diagram, the top squarks decay directly to a top quark and a neutralino ($\tilde{\chi}^0_1 $). |
png pdf |
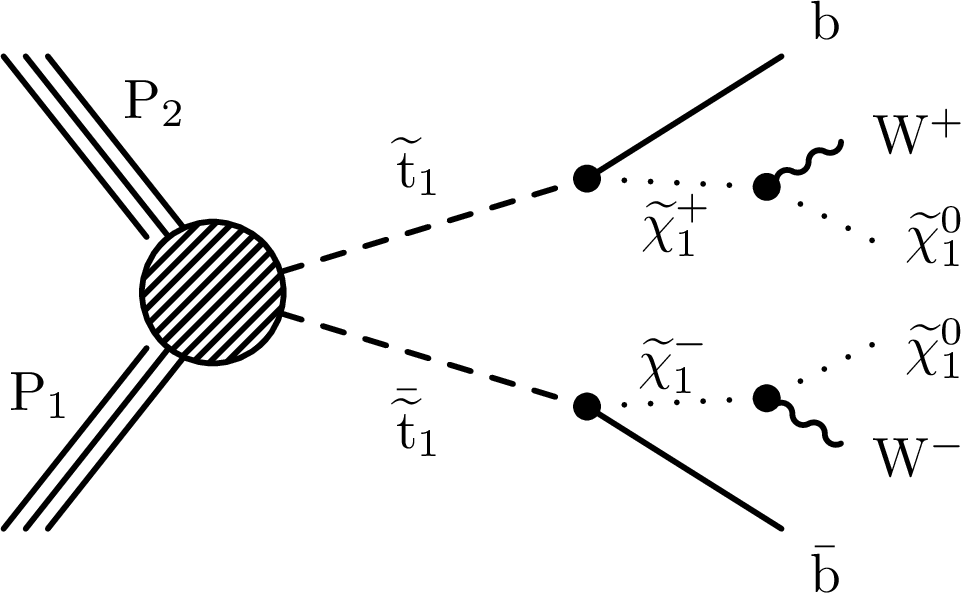
Figure 1-b:
Strong production of top squark pairs ($\tilde{ \mathrm{ t } } _{1}\overline{ \tilde{\mathrm{t}}}_{1}$) in simplified models. In this diagram, the top squarks undergo a cascade decay into a neutralino via an intermediate chargino ($\tilde{\chi}^{\pm}_1 $). |

png pdf |
Figure 1-c:
Strong production of top squark pairs ($\tilde{ \mathrm{ t } } _{1}\overline{ \tilde{\mathrm{t}}}_{1}$) in simplified models. The diagram shows the decay via an intermediate slepton ($\tilde{\ell }$) to a lepton and the neutralino. |
png pdf |
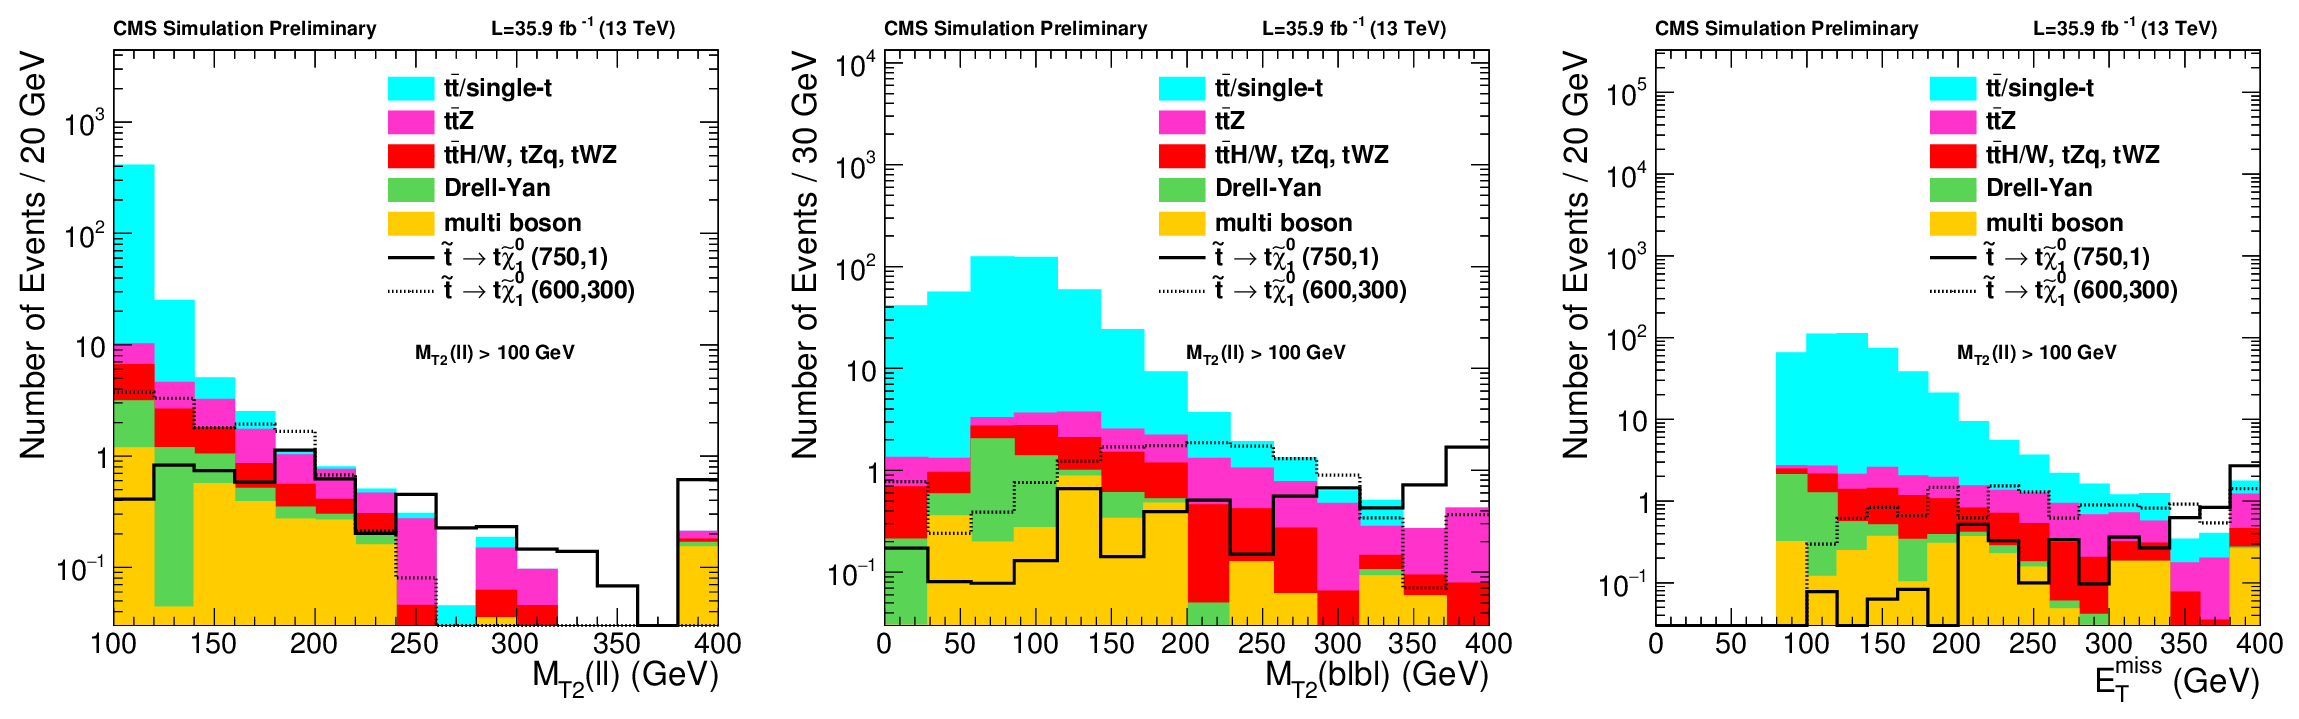
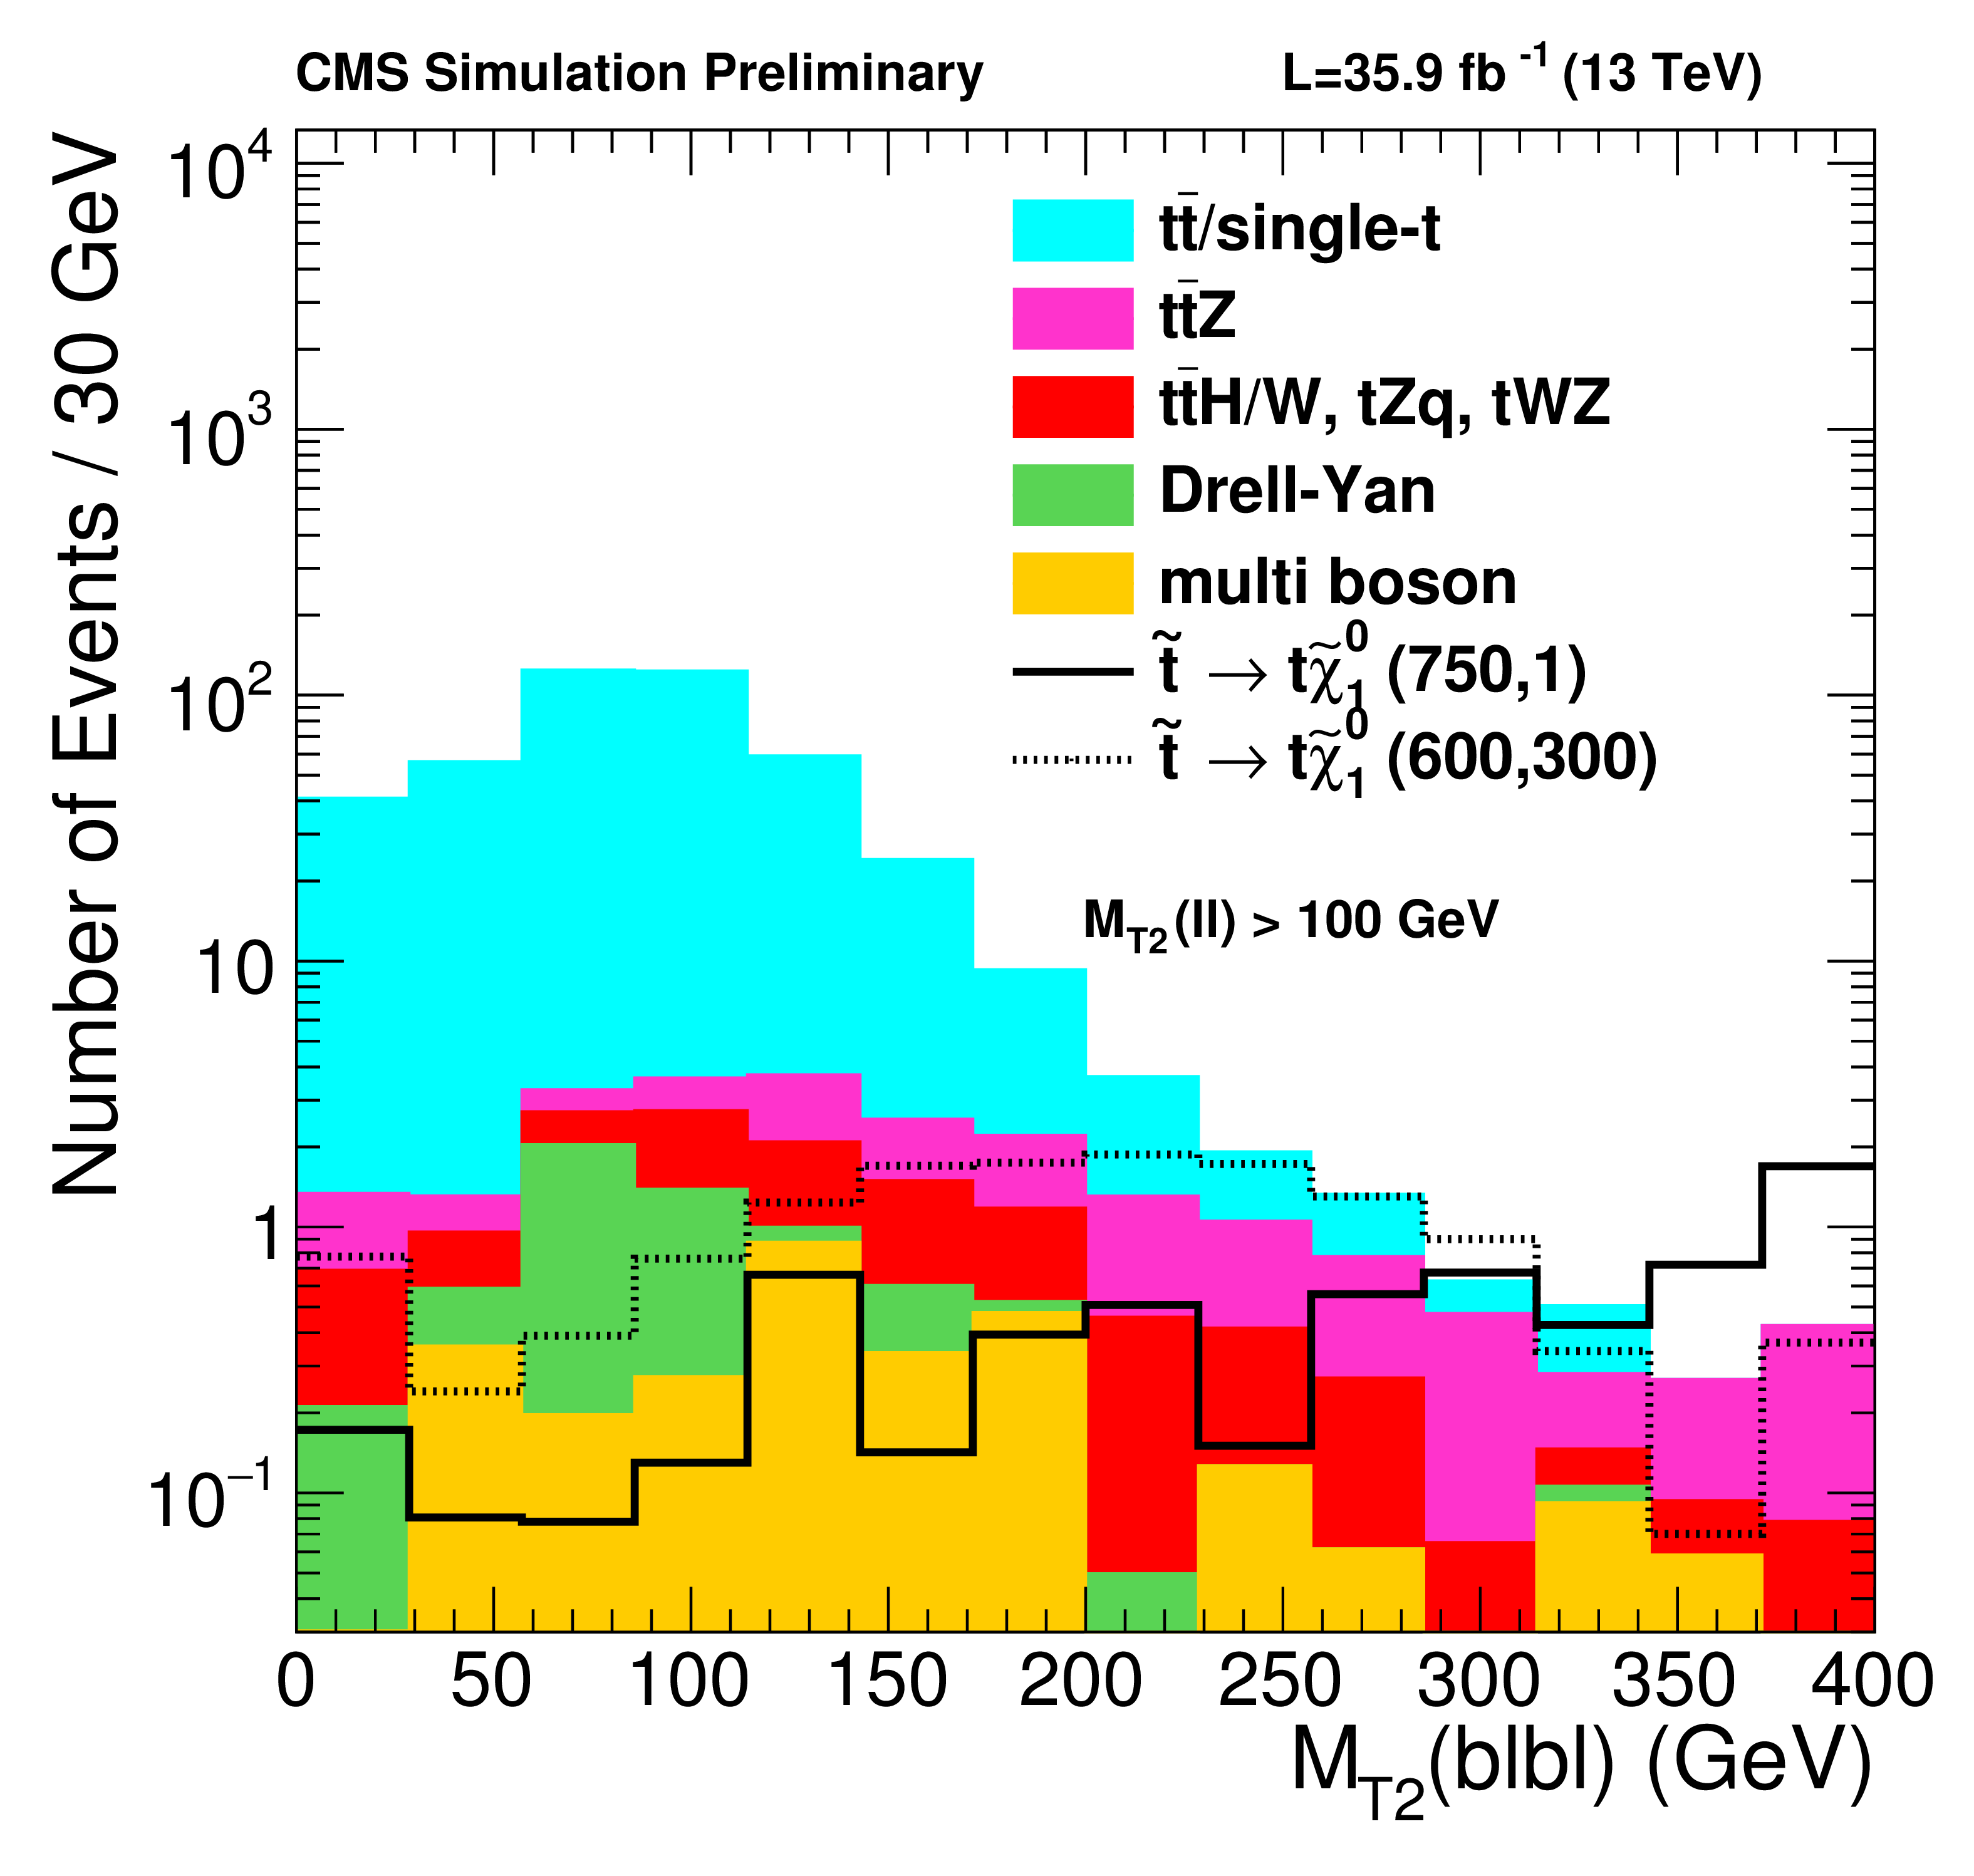
Figure 2:
Distributions of ${M_{T2}(\ell \ell )} $, ${M_{T2}(b\ell b\ell )} $, and ${E_{\mathrm {T}}^{\text {miss}}}$ in simulation after preselection and requiring $ {M_{T2}(\ell \ell )} > $ 100 GeV. |

png pdf |
Figure 2-a:
Distributions of ${M_{T2}(\ell \ell )} $ in simulation after preselection and requiring $ {M_{T2}(\ell \ell )} > $ 100 GeV. |
png pdf |
Figure 2-b:
Distributions of ${M_{T2}(b\ell b\ell )} $ in simulation after preselection and requiring $ {M_{T2}(\ell \ell )} > $ 100 GeV. |

png pdf |
Figure 2-c:
Distributions of ${E_{\mathrm {T}}^{\text {miss}}}$ in simulation after preselection and requiring $ {M_{T2}(\ell \ell )} > $ 100 GeV. |

png pdf |
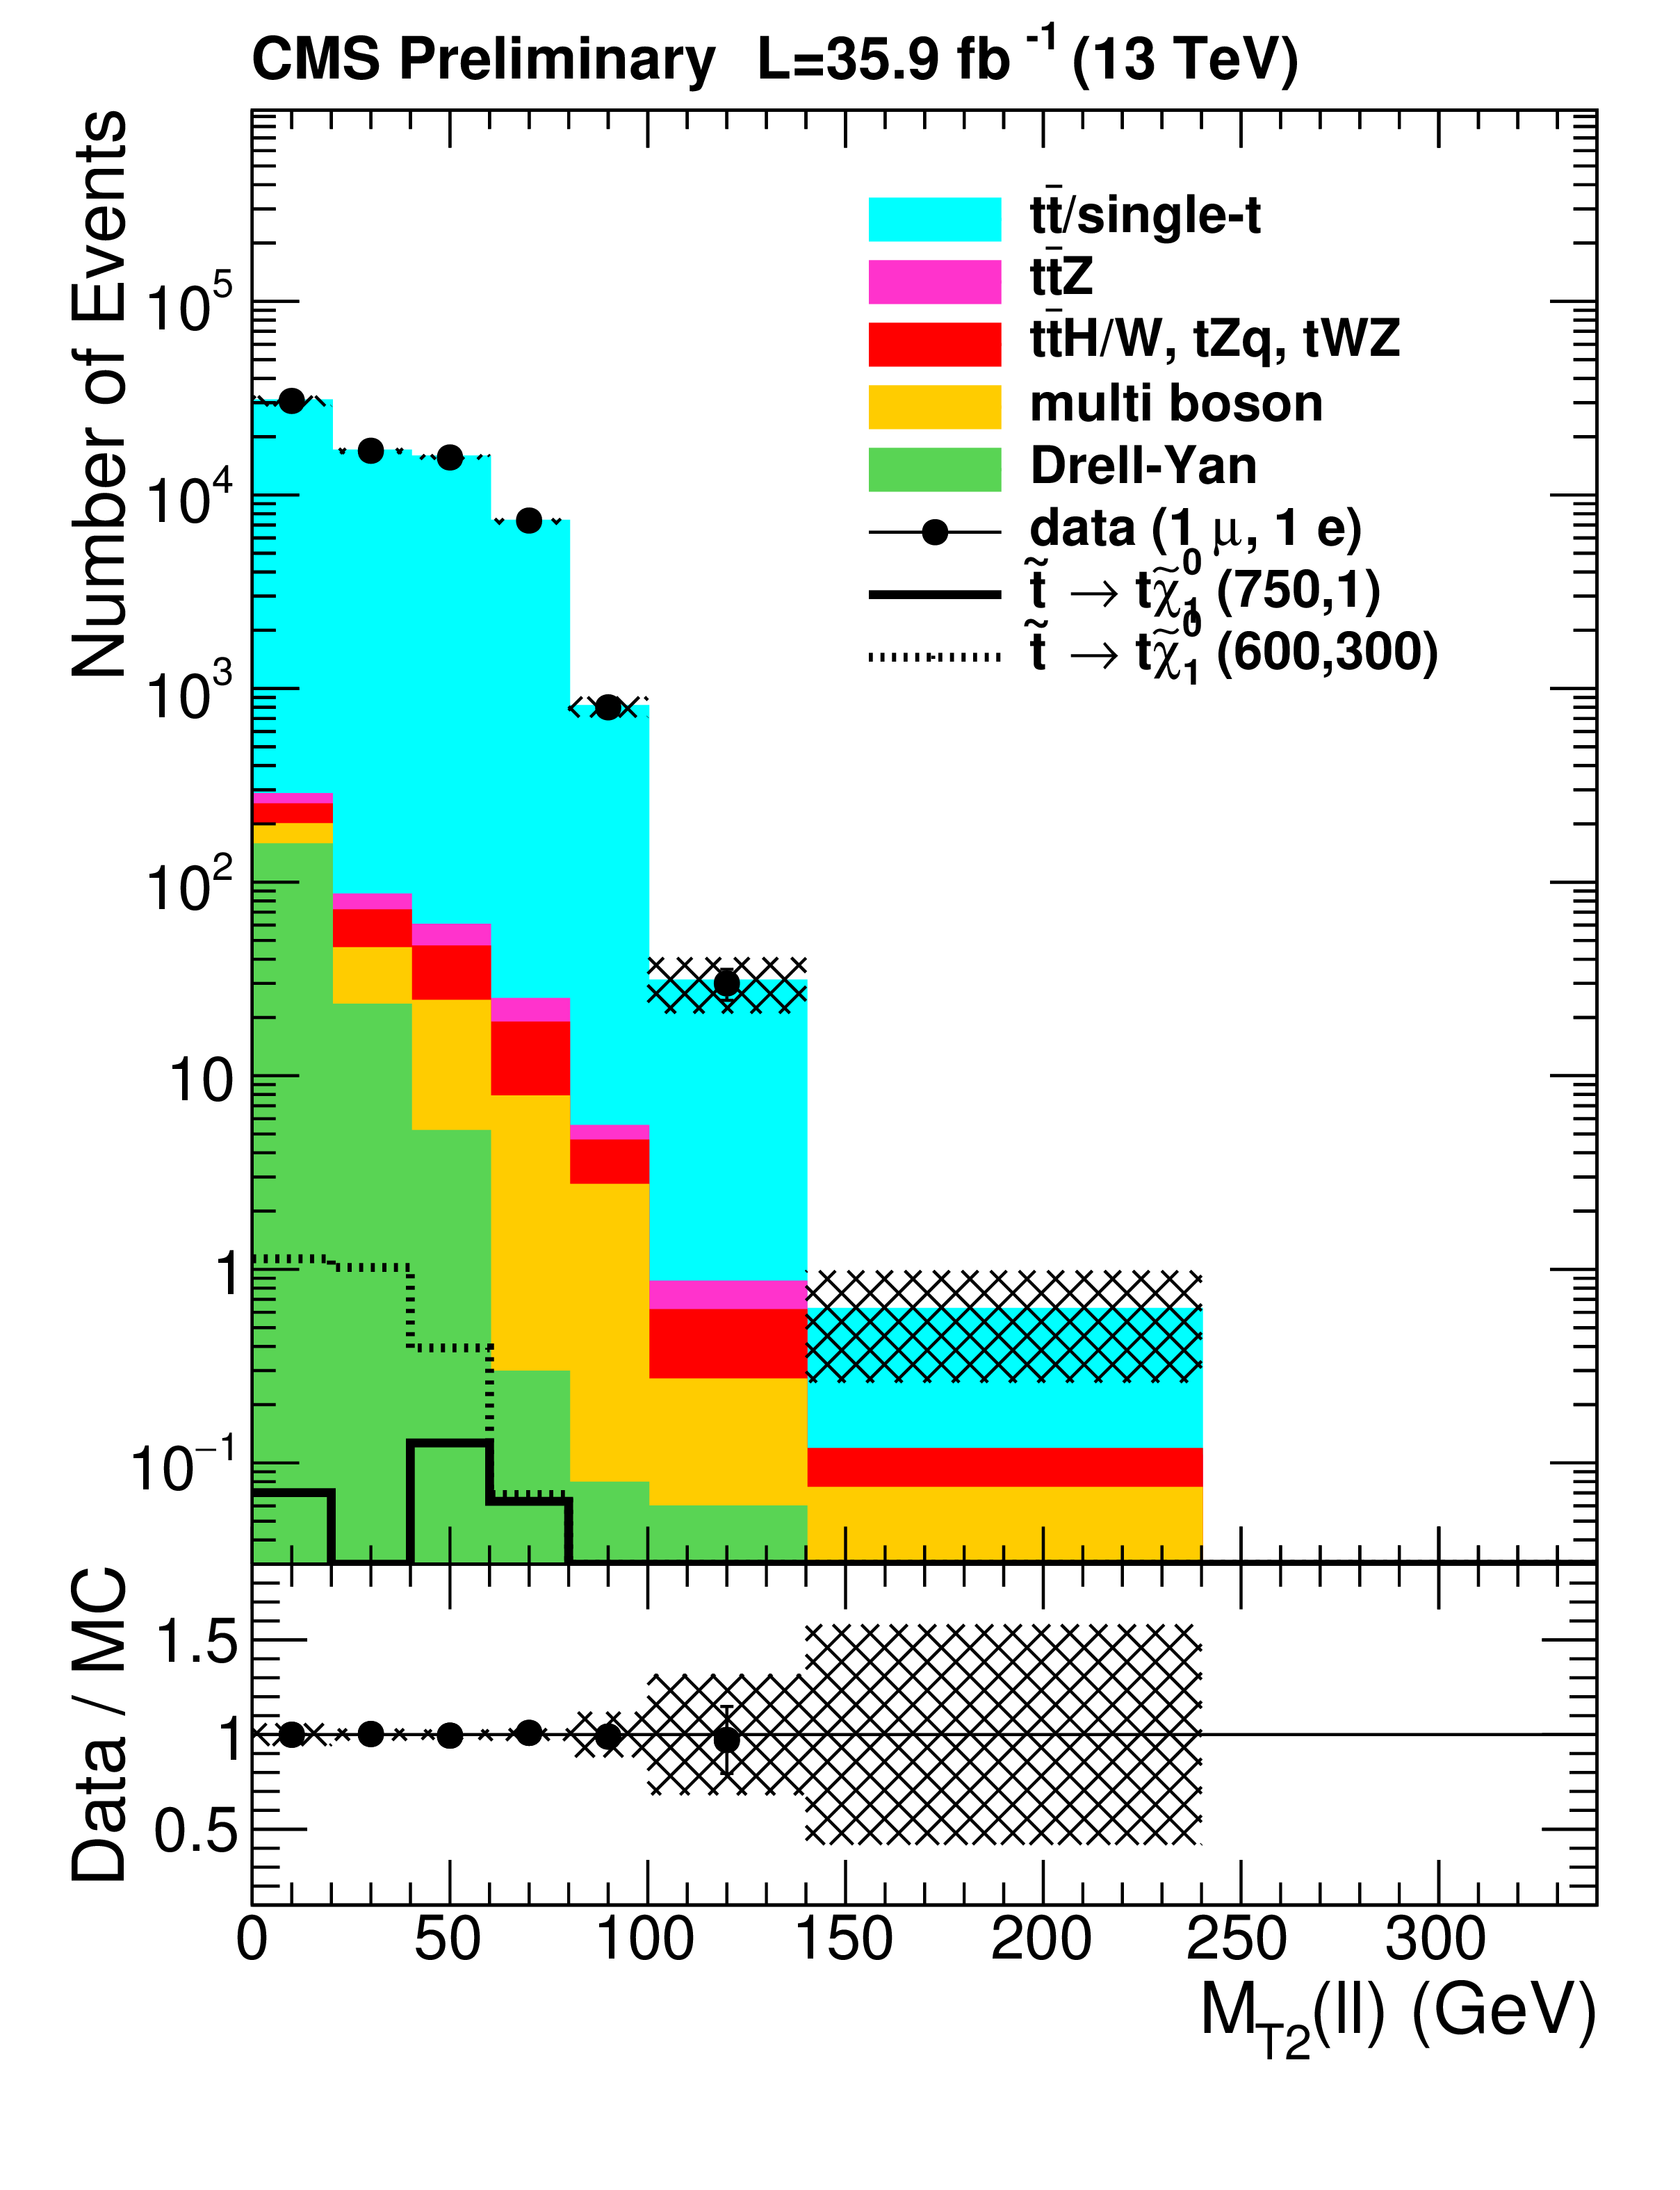
Figure 3:
Distributions of ${M_{T2}(\ell \ell )}$ in a control region enriched with $\mathrm{ t \bar{t} }$ events and defined by $ {N_\text {jets}} \geq $ 2, $ {N_\text {bjets}} \geq $ 1 and $ {E_{\mathrm {T}}^{\text {miss}}} < $ 80 GeV (left). Distribution of ${M_{T2}(\ell \ell )}$ after swapping an isolated lepton with an additional non-isolated lepton as described in the text (right). Simulated yields are normalized to data using the yields at $ {M_{T2}(\ell \ell )} < $ 100 GeV. |
png pdf |
Figure 3-a:
Distributions of ${M_{T2}(\ell \ell )}$ in a control region enriched with $\mathrm{ t \bar{t} }$ events and defined by $ {N_\text {jets}} \geq $ 2, $ {N_\text {bjets}} \geq $ 1 and $ {E_{\mathrm {T}}^{\text {miss}}} < $ 80 GeV. Simulated yields are normalized to data using the yields at $ {M_{T2}(\ell \ell )} < $ 100 GeV. |

png pdf |
Figure 3-b:
Distribution of ${M_{T2}(\ell \ell )}$ after swapping an isolated lepton with an additional non-isolated lepton as described in the text. Simulated yields are normalized to data using the yields at $ {M_{T2}(\ell \ell )} < $ 100 GeV. |

png pdf |
Figure 4:
Expected and observed yields in the 5 ttZ control regions, before (left) and after the fit (right) which are defined by different requirements on the number of reconstructed jets and b-tagged jets. The hatched band contains all uncertainties discussed in the text. |

png pdf |
Figure 4-a:
Expected and observed yields in the 5 ttZ control regions, before the fit, which are defined by different requirements on the number of reconstructed jets and b-tagged jets. The hatched band contains all uncertainties discussed in the text. |

png pdf |
Figure 4-b:
Expected and observed yields in the 5 ttZ control regions, after the fit which, are defined by different requirements on the number of reconstructed jets and b-tagged jets. The hatched band contains all uncertainties discussed in the text. |

png pdf |
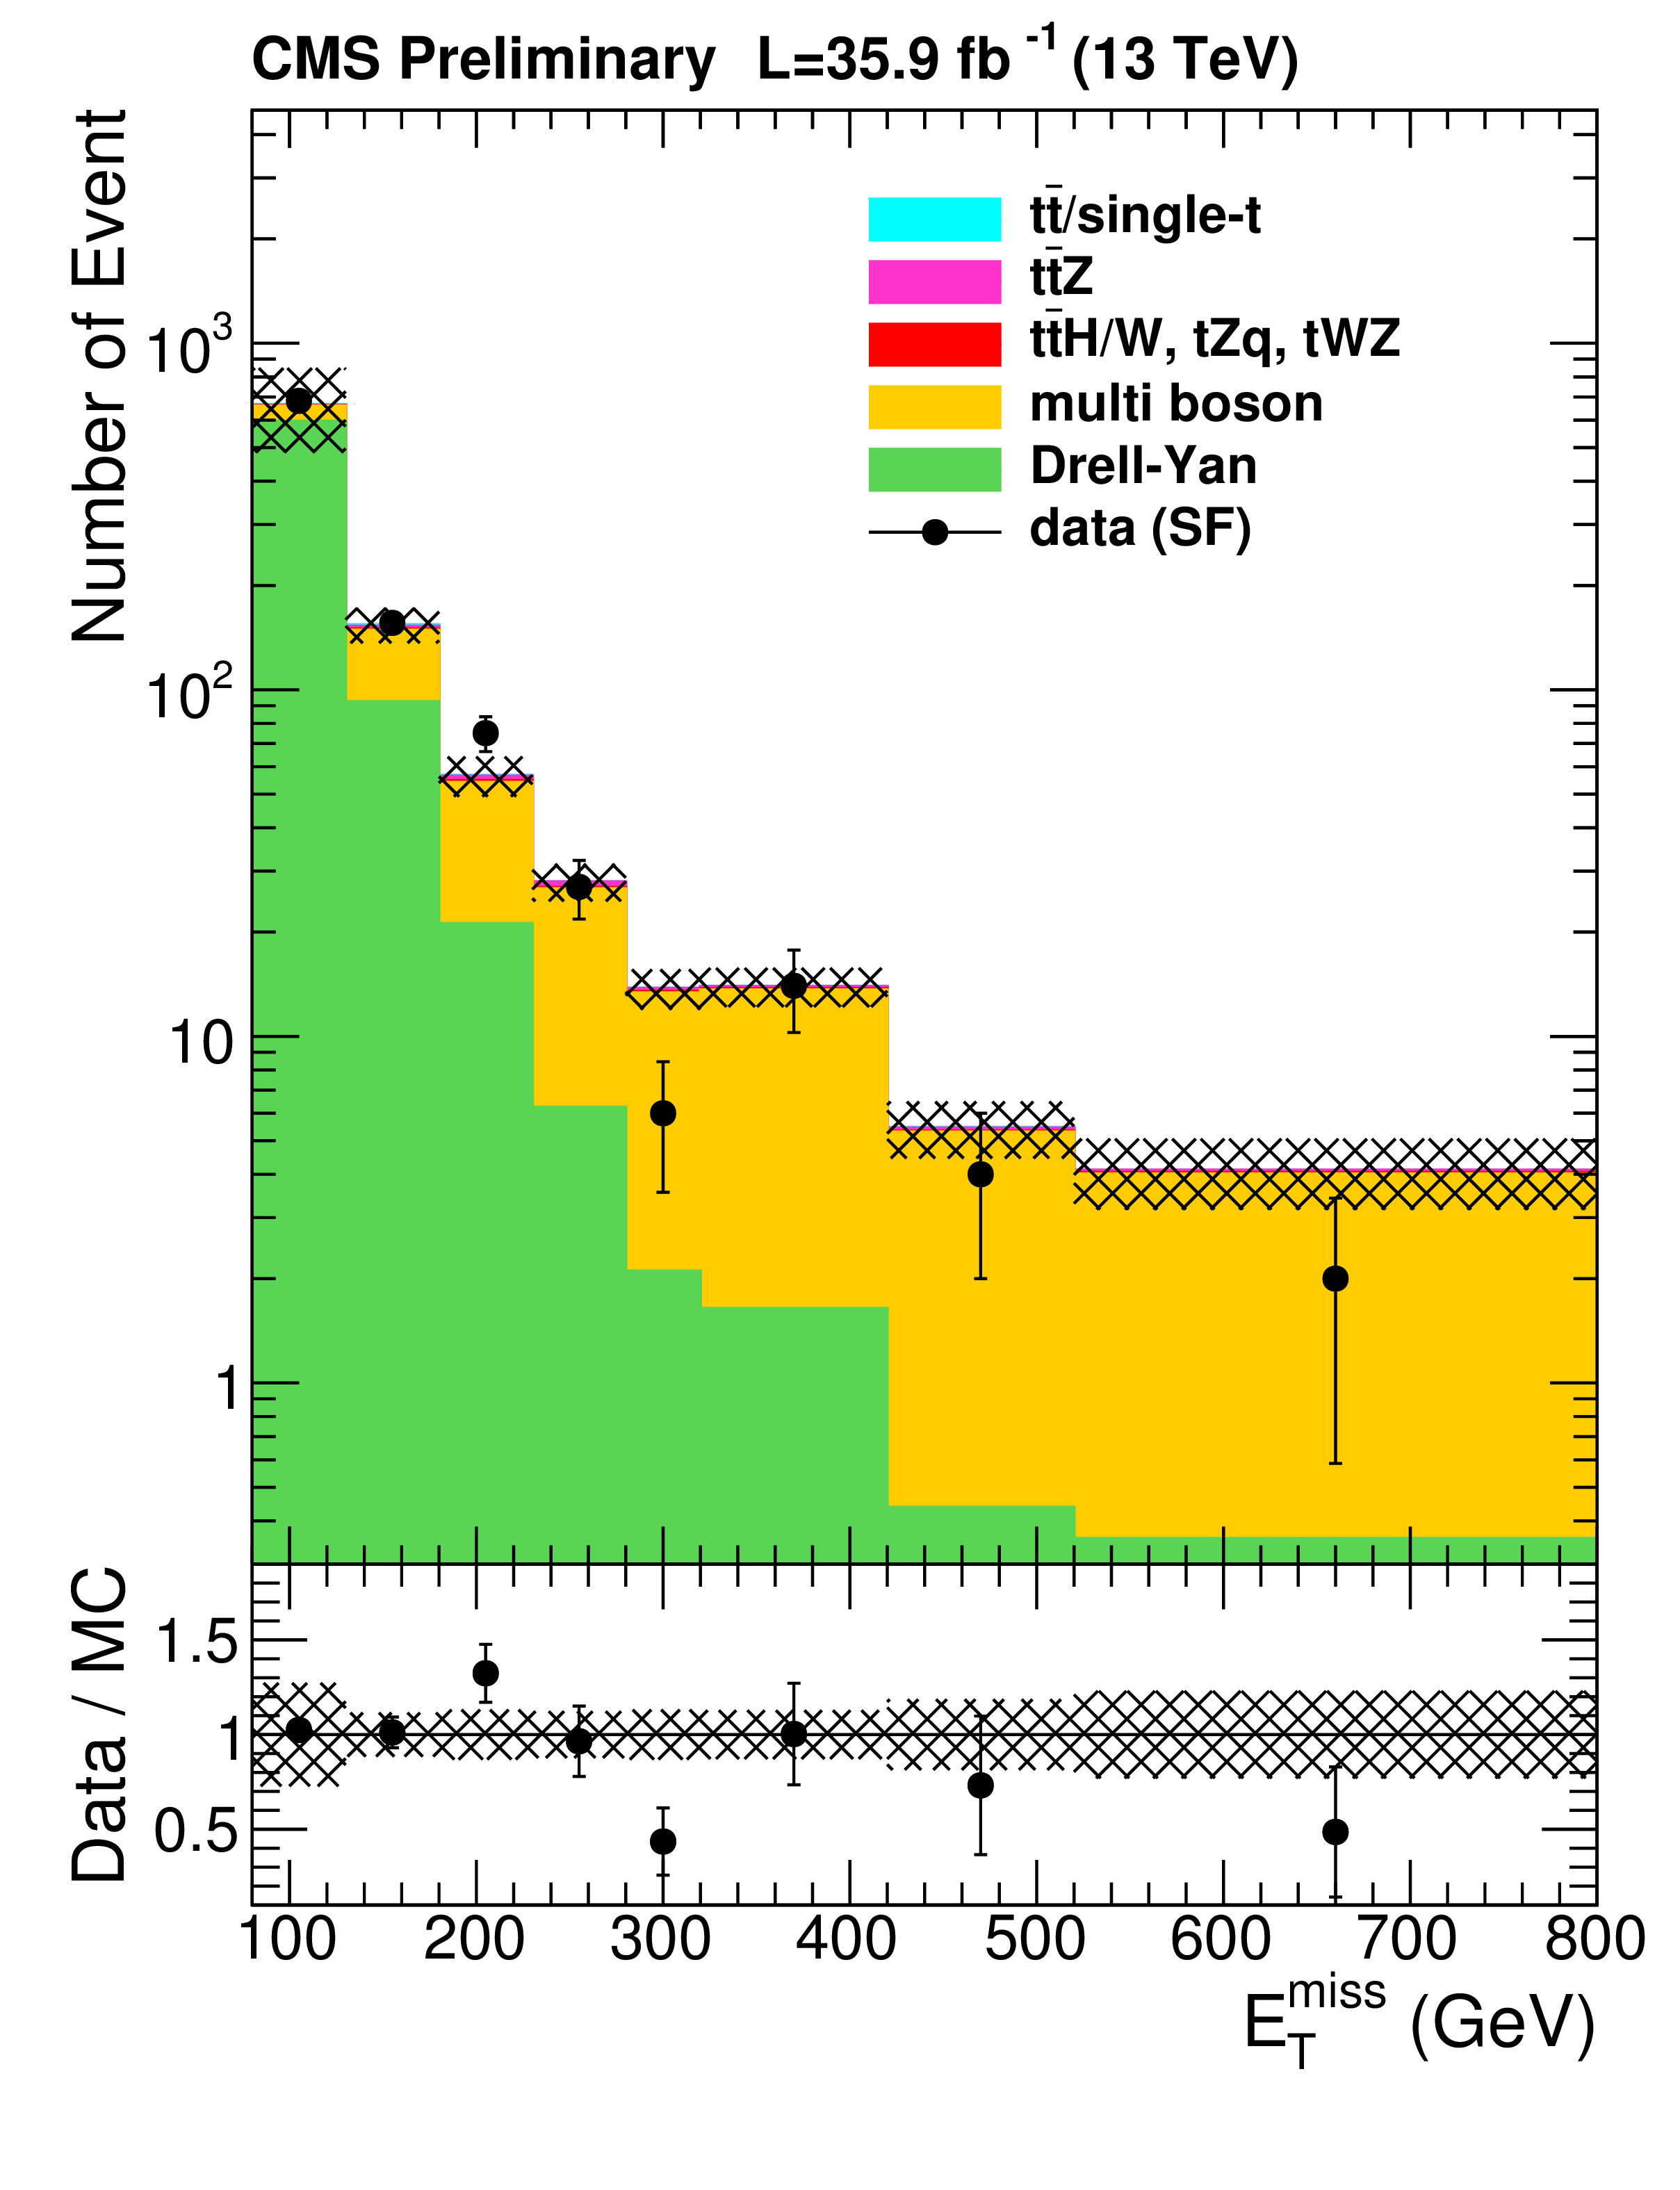
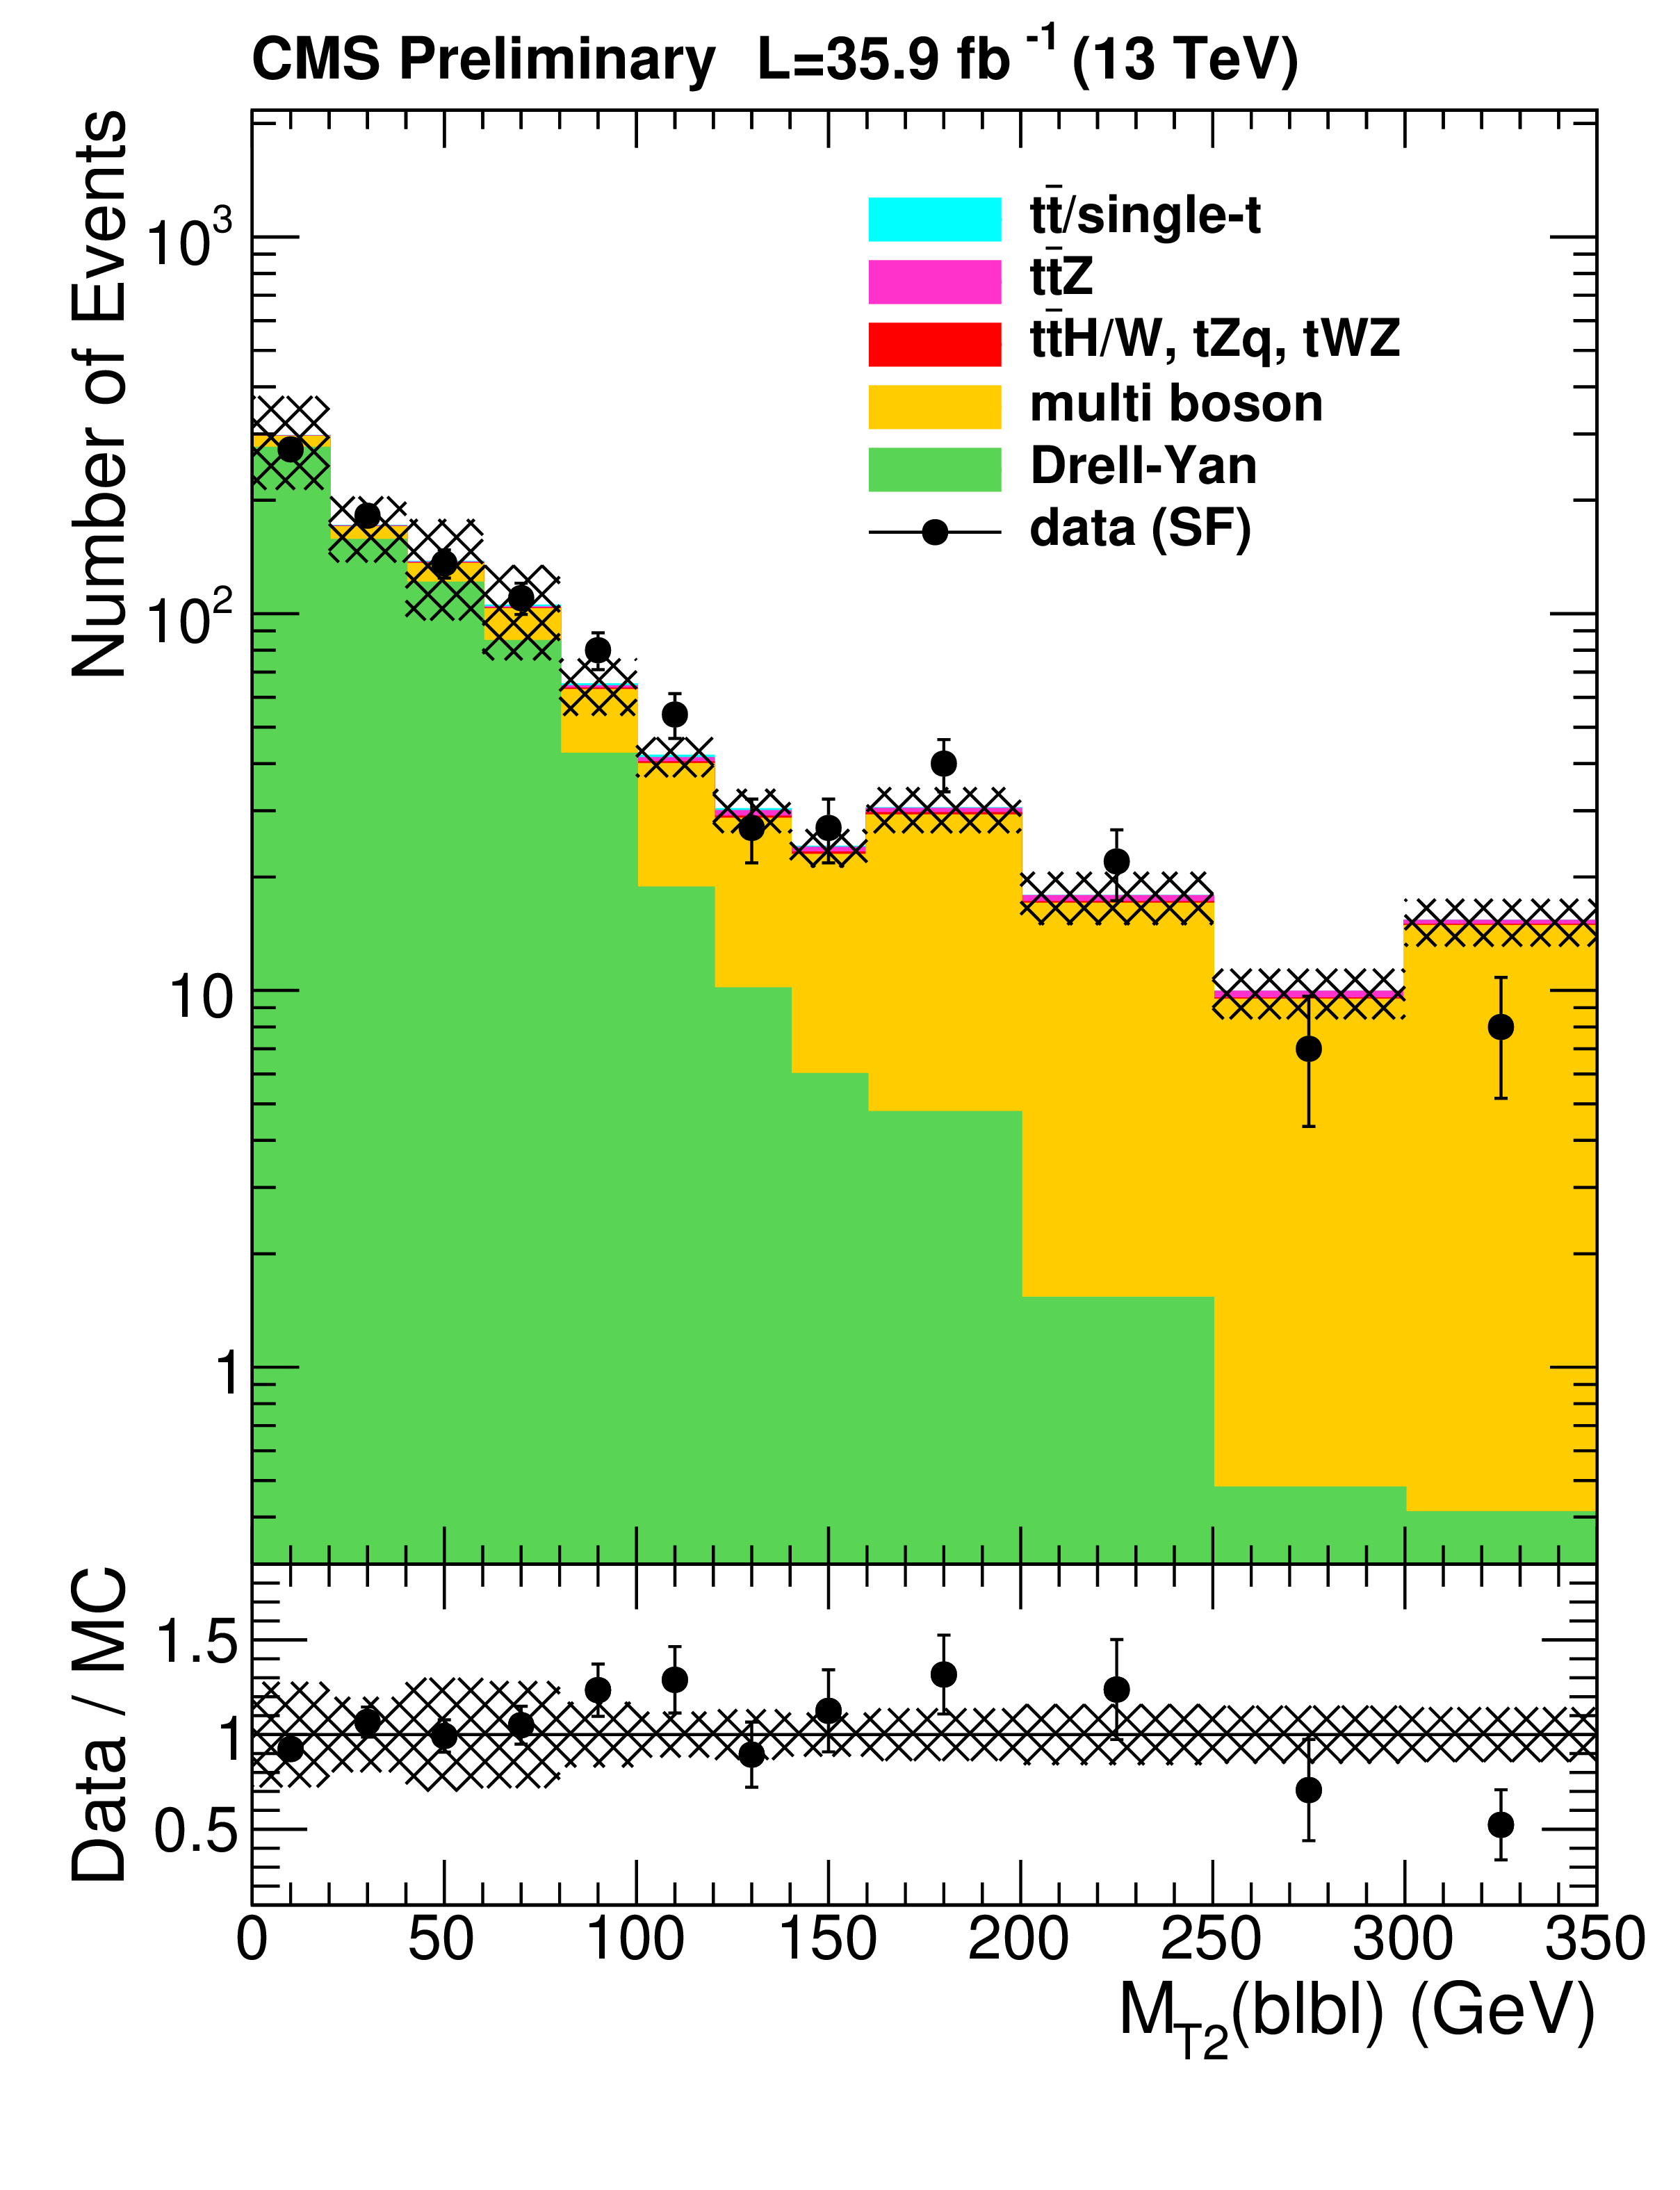
Figure 5:
Distributions of ${M_{T2}(\ell \ell )} $, ${E_{\rm T}^{\rm miss}}$ and ${M_{T2}(b\ell b\ell )}$ for same-flavor (ee/$\mu \mu $) events falling within the Z-mass window, with at least two jets and $ {N_\text {bjets}} = $ 0, $ {E_{\rm T}^{\rm miss}} > $ 80 GeV and $ {M_{T2}(\ell \ell )} > $ 100 GeV. |

png pdf |
Figure 5-a:
Distribution of ${M_{T2}(\ell \ell )} $ for same-flavor (ee/$\mu \mu $) events falling within the Z-mass window, with at least two jets and $ {N_\text {bjets}} = $ 0, $ {E_{\rm T}^{\rm miss}} > $ 80 GeV and $ {M_{T2}(\ell \ell )} > $ 100 GeV. |
png pdf |
Figure 5-b:
Distribution of ${E_{\rm T}^{\rm miss}}$ for same-flavor (ee/$\mu \mu $) events falling within the Z-mass window, with at least two jets and $ {N_\text {bjets}} = $ 0, $ {E_{\rm T}^{\rm miss}} > $ 80 GeV and $ {M_{T2}(\ell \ell )} > $ 100 GeV. |
png pdf |
Figure 5-c:
Distribution of ${M_{T2}(b\ell b\ell )}$ for same-flavor (ee/$\mu \mu $) events falling within the Z-mass window, with at least two jets and $ {N_\text {bjets}} = $ 0, $ {E_{\rm T}^{\rm miss}} > $ 80 GeV and $ {M_{T2}(\ell \ell )} > $ 100 GeV. |
png pdf |
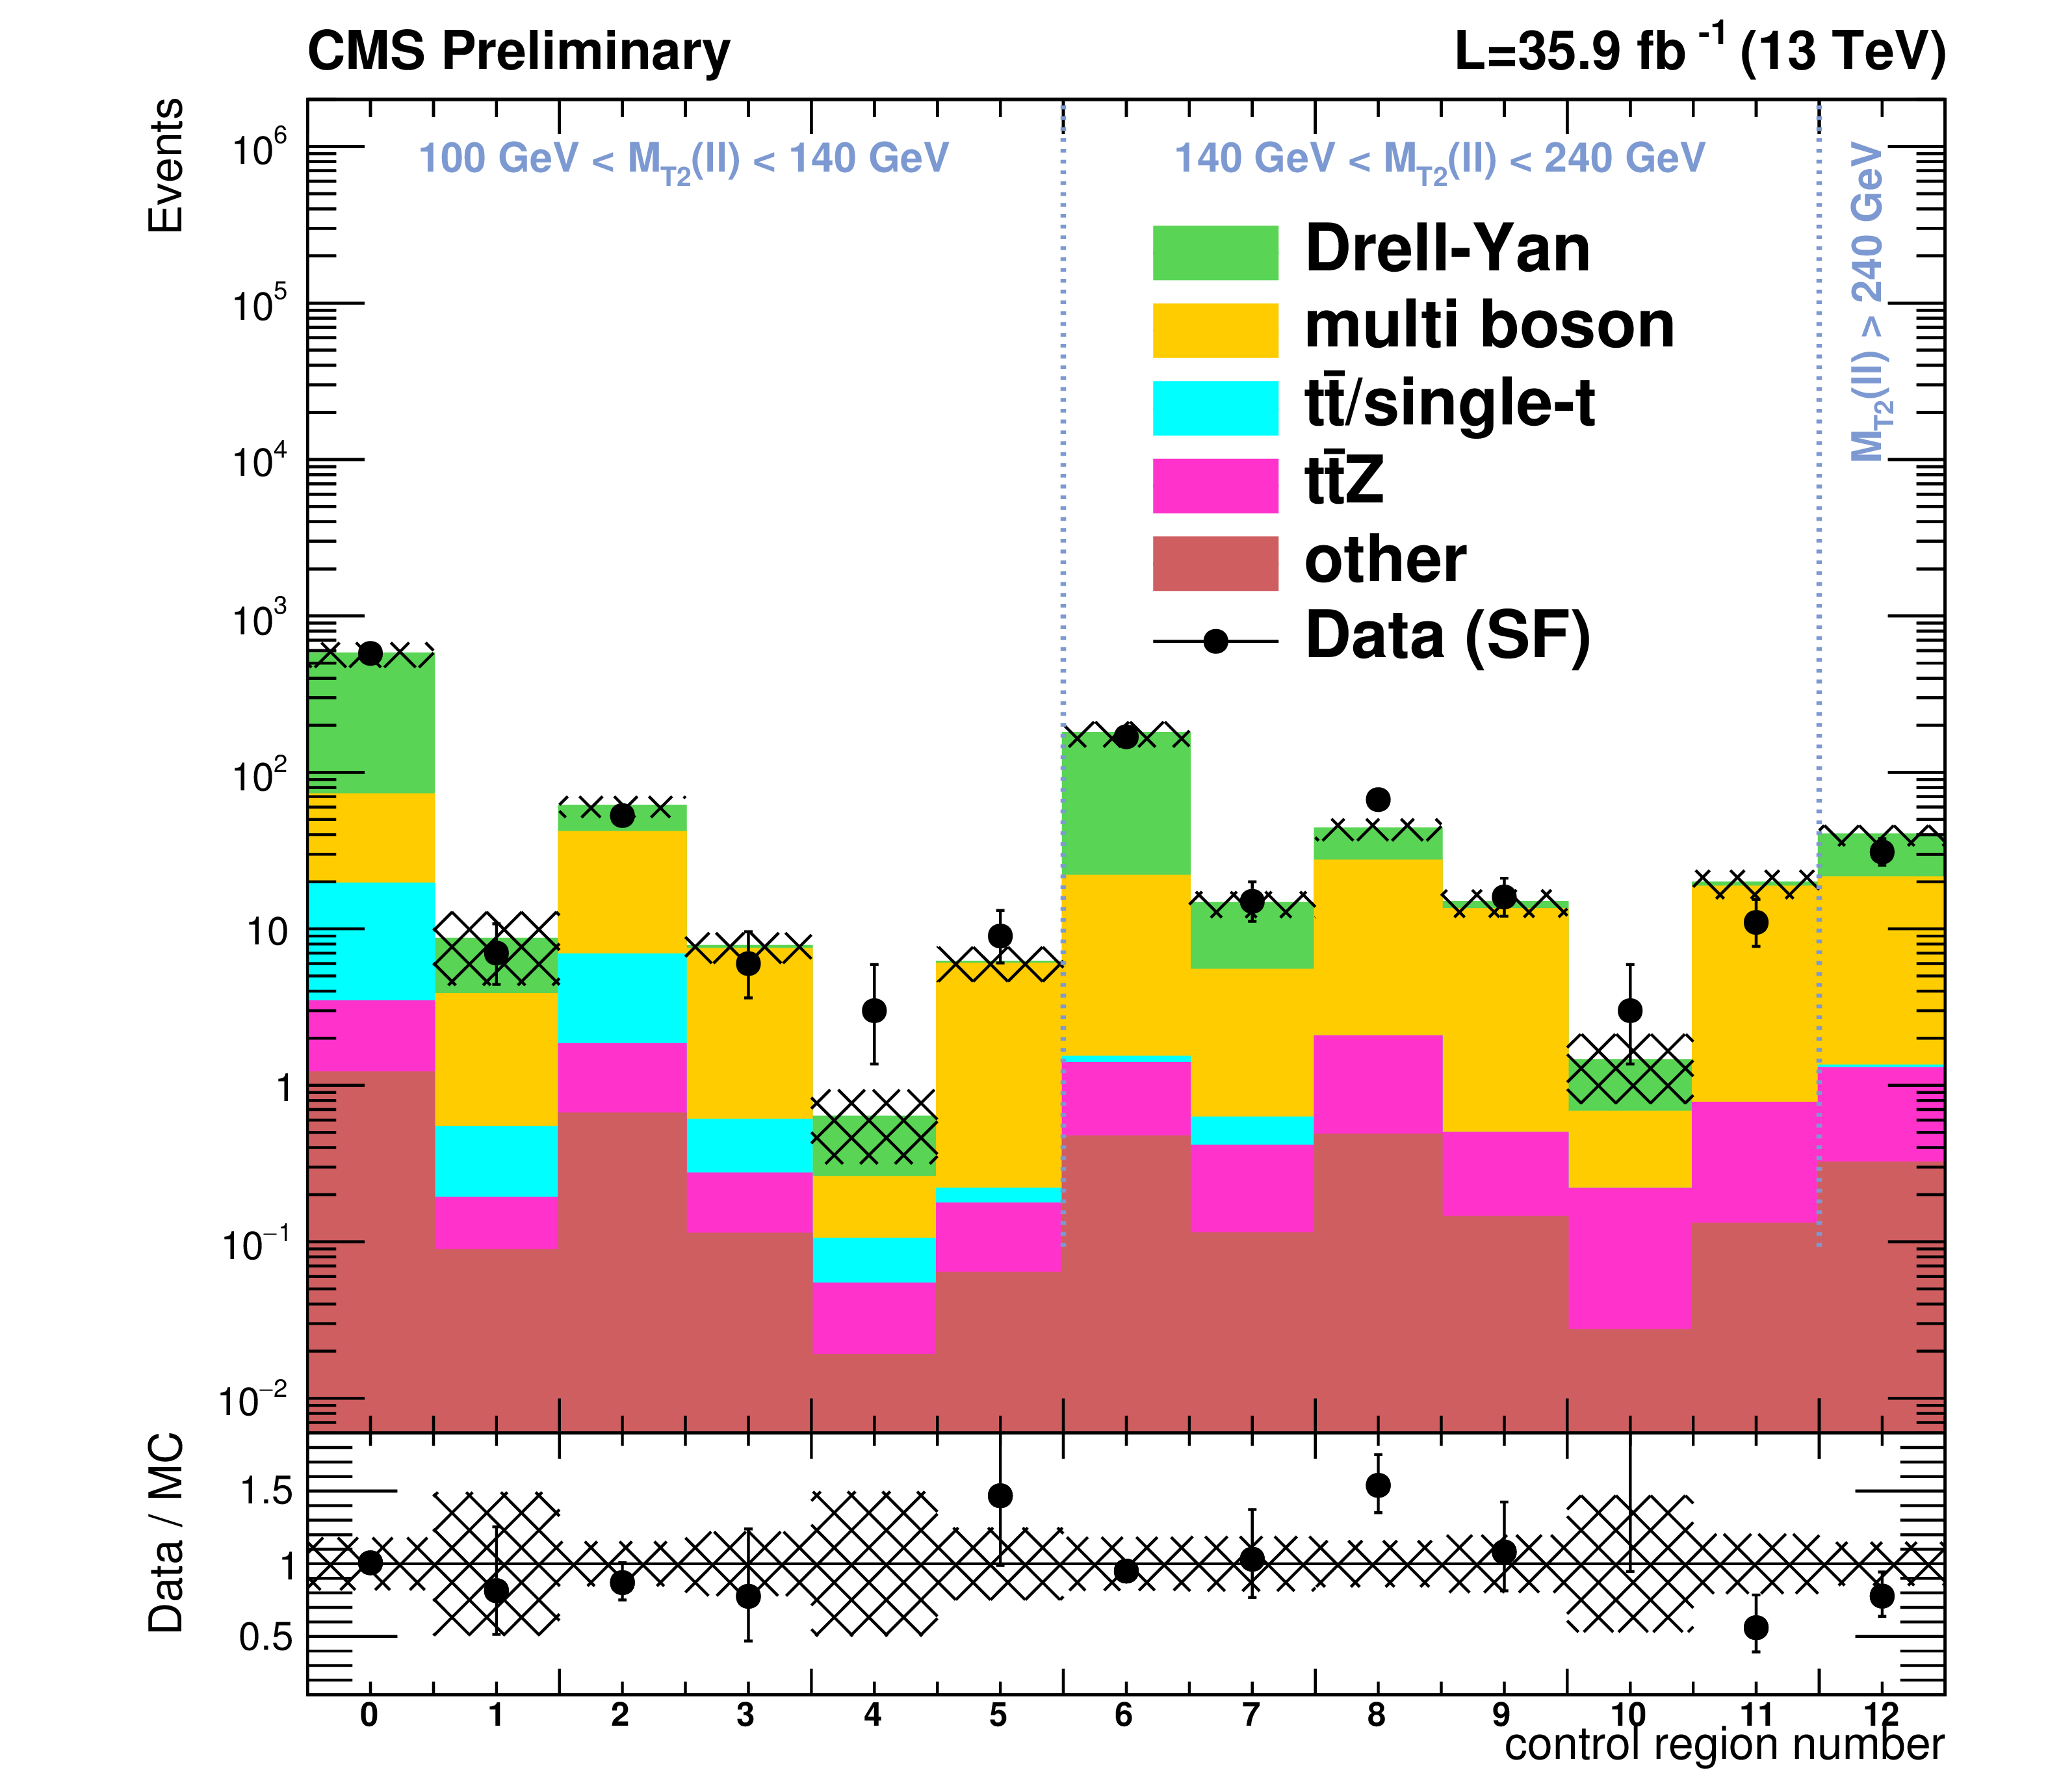
Figure 6:
Event yields in the 13 Drell-Yan and diboson control regions for events with same-flavor leptons falling within the Z-mass window and $ {N_\text {bjets}} = $ 0 after renormalizing with the scale factors obtained from the fit procedure. Requirements of jet-multiplicity, ${E_{\mathrm {T}}^{\text {miss}}} $, ${M_{T2}(\ell \ell )}$ and ${M_{T2}(b\ell b\ell )}$ are aligned with the corresponding signal regions. |

png pdf |
Figure 7:
$ {M_{T2}(\ell \ell )} $ distributions of observed events in $\mu \mu $, ee, e$\mu $ channels compared to the predicted SM backgrounds using simulation in the selection defined in Table 1. The shaded band covers all uncertainties discussed in the text. |

png pdf |
Figure 7-a:
$ {M_{T2}(\ell \ell )} $ distributions of observed events in the $\mu \mu $ channel compared to the predicted SM backgrounds using simulation in the selection defined in Table 1. The shaded band covers all uncertainties discussed in the text. |

png pdf |
Figure 7-b:
$ {M_{T2}(\ell \ell )} $ distributions of observed events in the ee channel compared to the predicted SM backgrounds using simulation in the selection defined in Table 1. The shaded band covers all uncertainties discussed in the text. |

png pdf |
Figure 7-c:
$ {M_{T2}(\ell \ell )} $ distributions of observed events in the e$\mu $ channel compared to the predicted SM backgrounds using simulation in the selection defined in Table 1. The shaded band covers all uncertainties discussed in the text. |

png pdf |
Figure 8:
Distributions of ${M_{T2}(\ell \ell )} $, ${M_{T2}(b\ell b\ell )}$ and ${E_{\mathrm {T}}^{\text {miss}}}$ in all flavor channels for the selection defined in Table 1. For ${M_{T2}(b\ell b\ell )}$ and ${E_{\mathrm {T}}^{\text {miss}}}$ additionally $ {M_{T2}(\ell \ell )} > $ 100 GeV is required. The shaded band covers all uncertainties discussed in the text. |

png pdf |
Figure 8-a:
Distribution of ${M_{T2}(\ell \ell )} $ in all flavor channels for the selection defined in Table 1. The shaded band covers all uncertainties discussed in the text. |

png pdf |
Figure 8-b:
Distribution of ${M_{T2}(b\ell b\ell )}$ in all flavor channels for the selection defined in Table 1. $ {M_{T2}(\ell \ell )} > $ 100 GeV is required. The shaded band covers all uncertainties discussed in the text. |

png pdf |
Figure 8-c:
Distribution of ${E_{\mathrm {T}}^{\text {miss}}}$ in all flavor channels for the selection defined in Table 1. $ {M_{T2}(\ell \ell )} > $ 100 GeV is required. The shaded band covers all uncertainties discussed in the text. |

png pdf |
Figure 9:
Predicted backgrounds and observed yields in each search region. The shaded band covers all uncertainties discussed in the text. |
png pdf |
Figure 9-a:
Predicted backgrounds and observed yields in each search region, $\mu\mu$ and ee channels. The shaded band covers all uncertainties discussed in the text. |

png pdf |
Figure 9-b:
Predicted backgrounds and observed yields in each search region, e$\mu$ channel. The shaded band covers all uncertainties discussed in the text. |

png pdf |
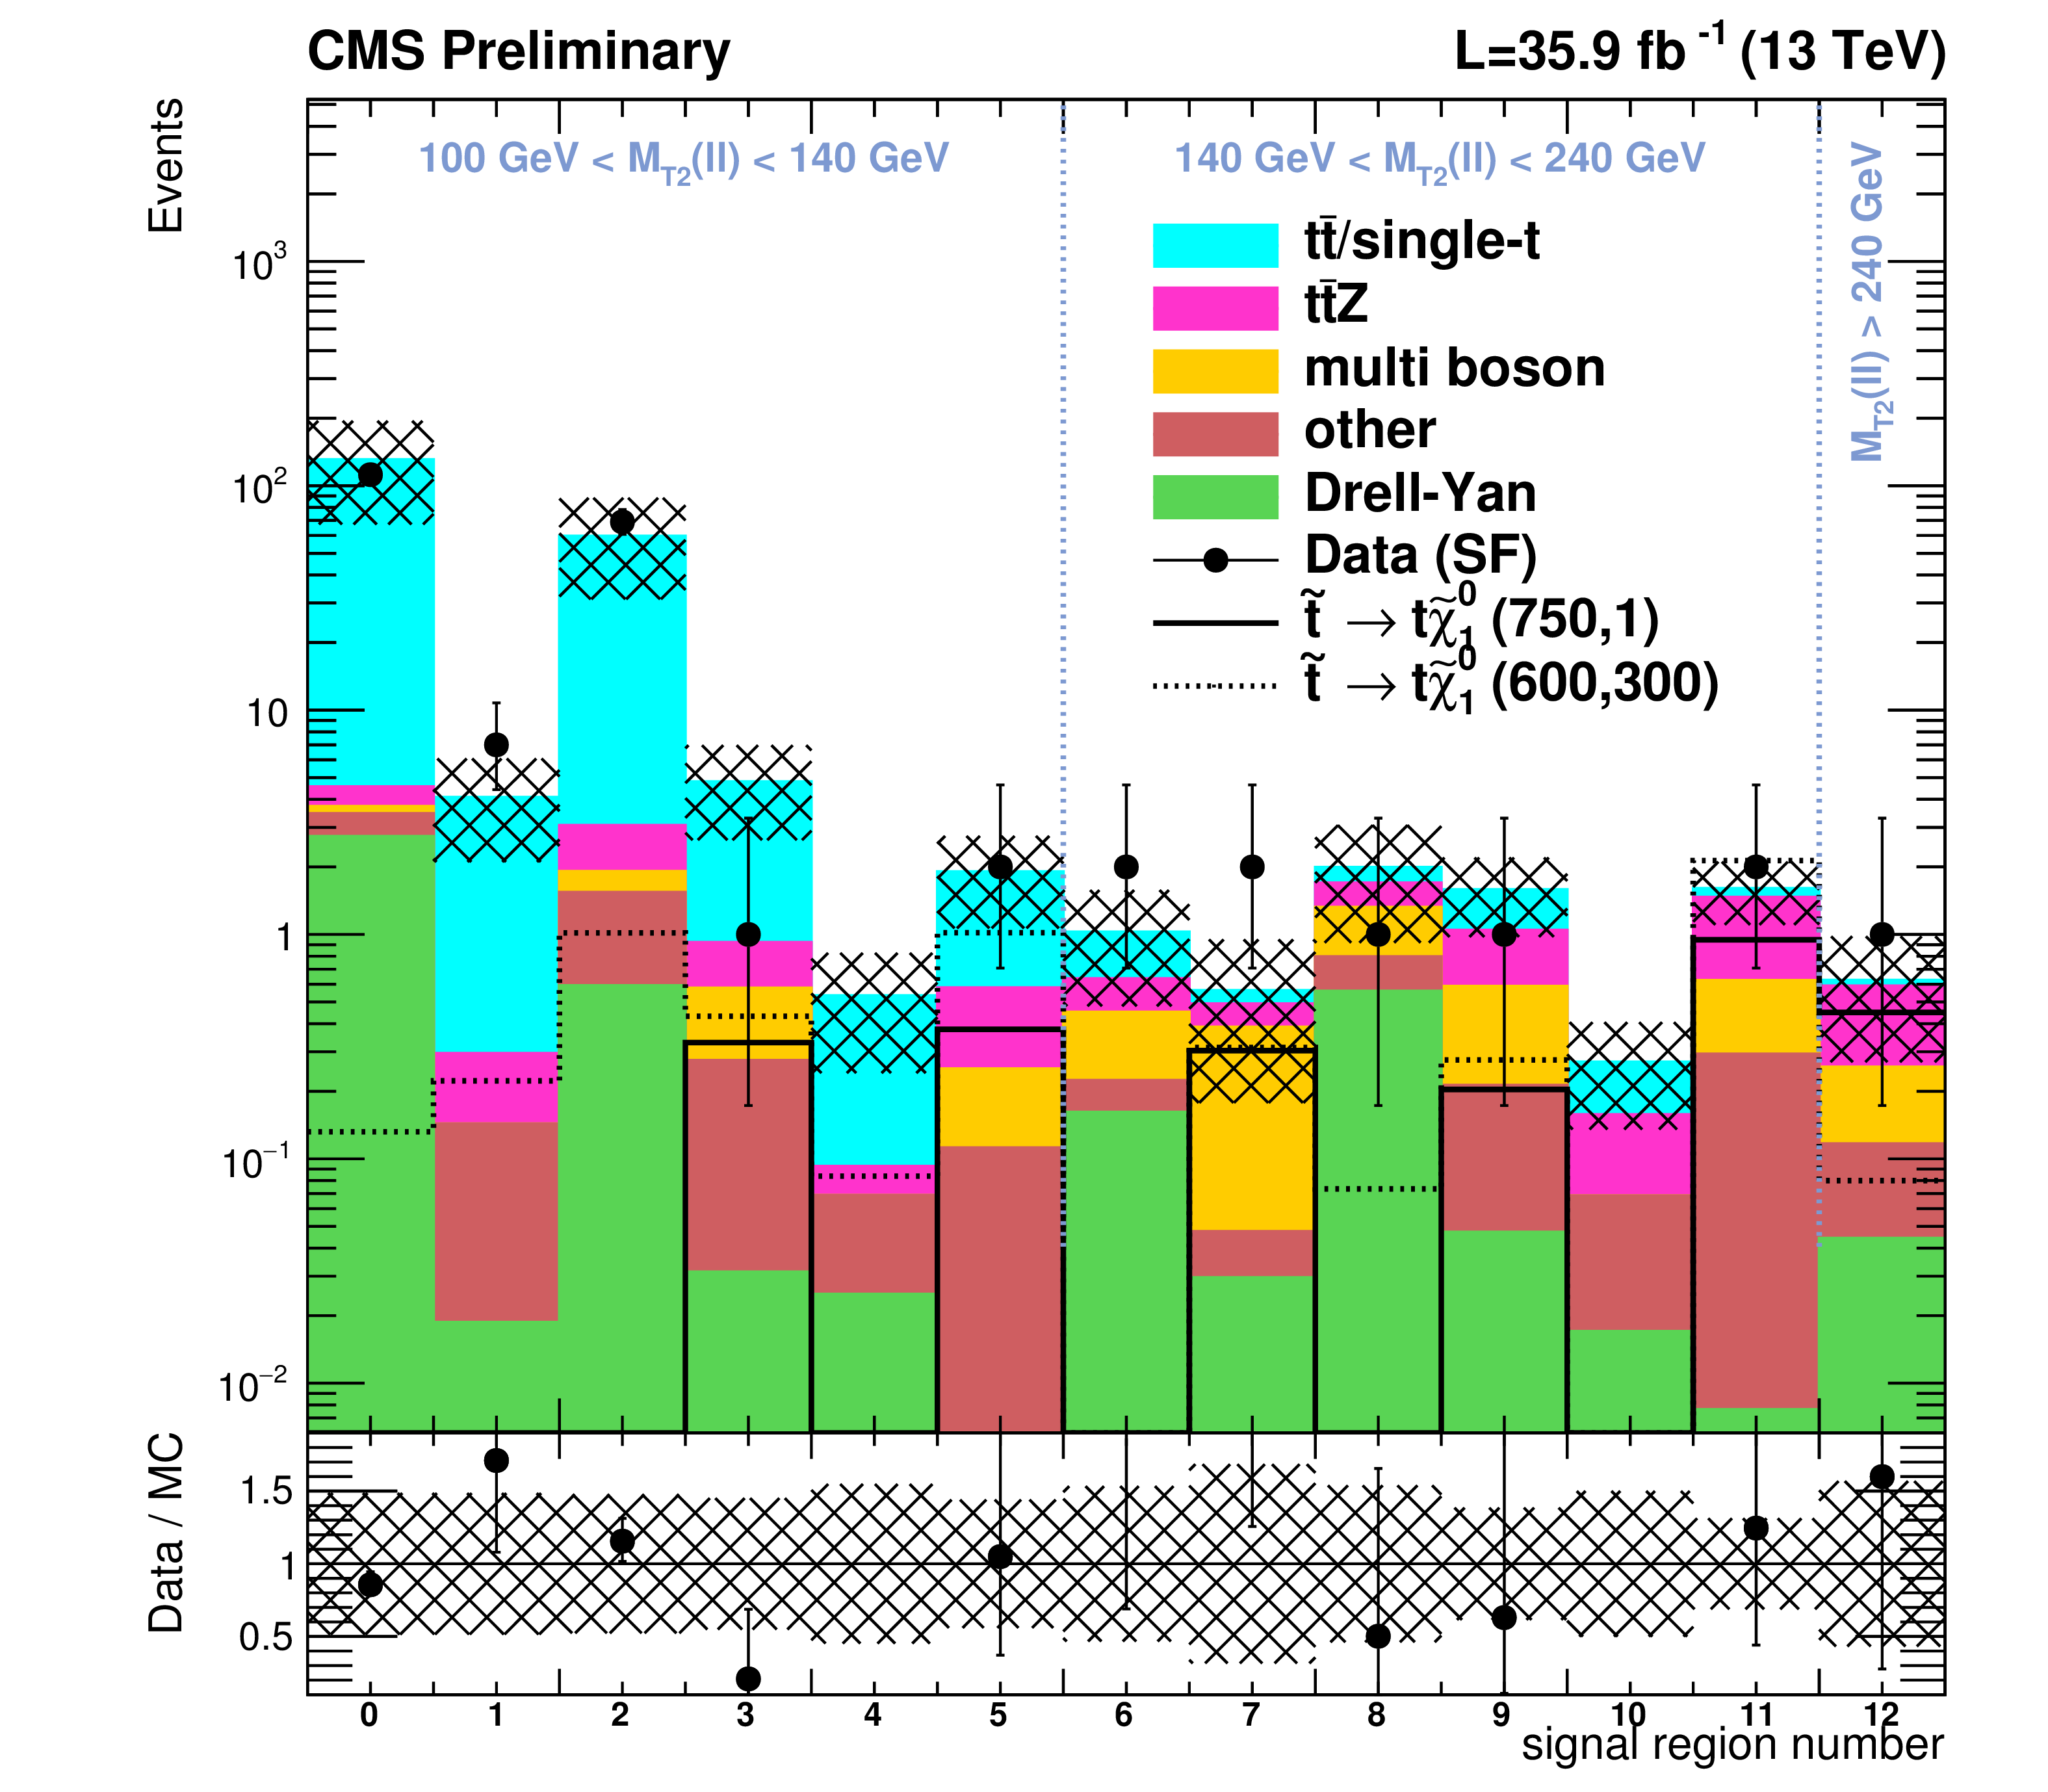
Figure 10:
As Fig. 9, but combining all channels. |

png pdf |
Figure 11:
Expected and observed limits at 95% CL for the "direct decay'' mode $\tilde{ \mathrm{ t } } \to \mathrm{t}\tilde{\chi}^0_1 $ in the $m_{\tilde{ \mathrm{ t } } }$, $m_{\tilde{\chi}^0_1 }$ mass plane (left) and for the "chargino decay'' mode $\tilde{ \mathrm{ t } } \to b\tilde{\chi}^{\pm} \to \mathrm{W}\tilde{\chi}^0_1 $ (right). |

png pdf root |
Figure 11-a:
Expected and observed limits at 95% CL for the "direct decay'' mode $\tilde{ \mathrm{ t } } \to \mathrm{t}\tilde{\chi}^0_1 $ in the $m_{\tilde{ \mathrm{ t } } }$, $m_{\tilde{\chi}^0_1 }$ mass plane. |
png pdf root |
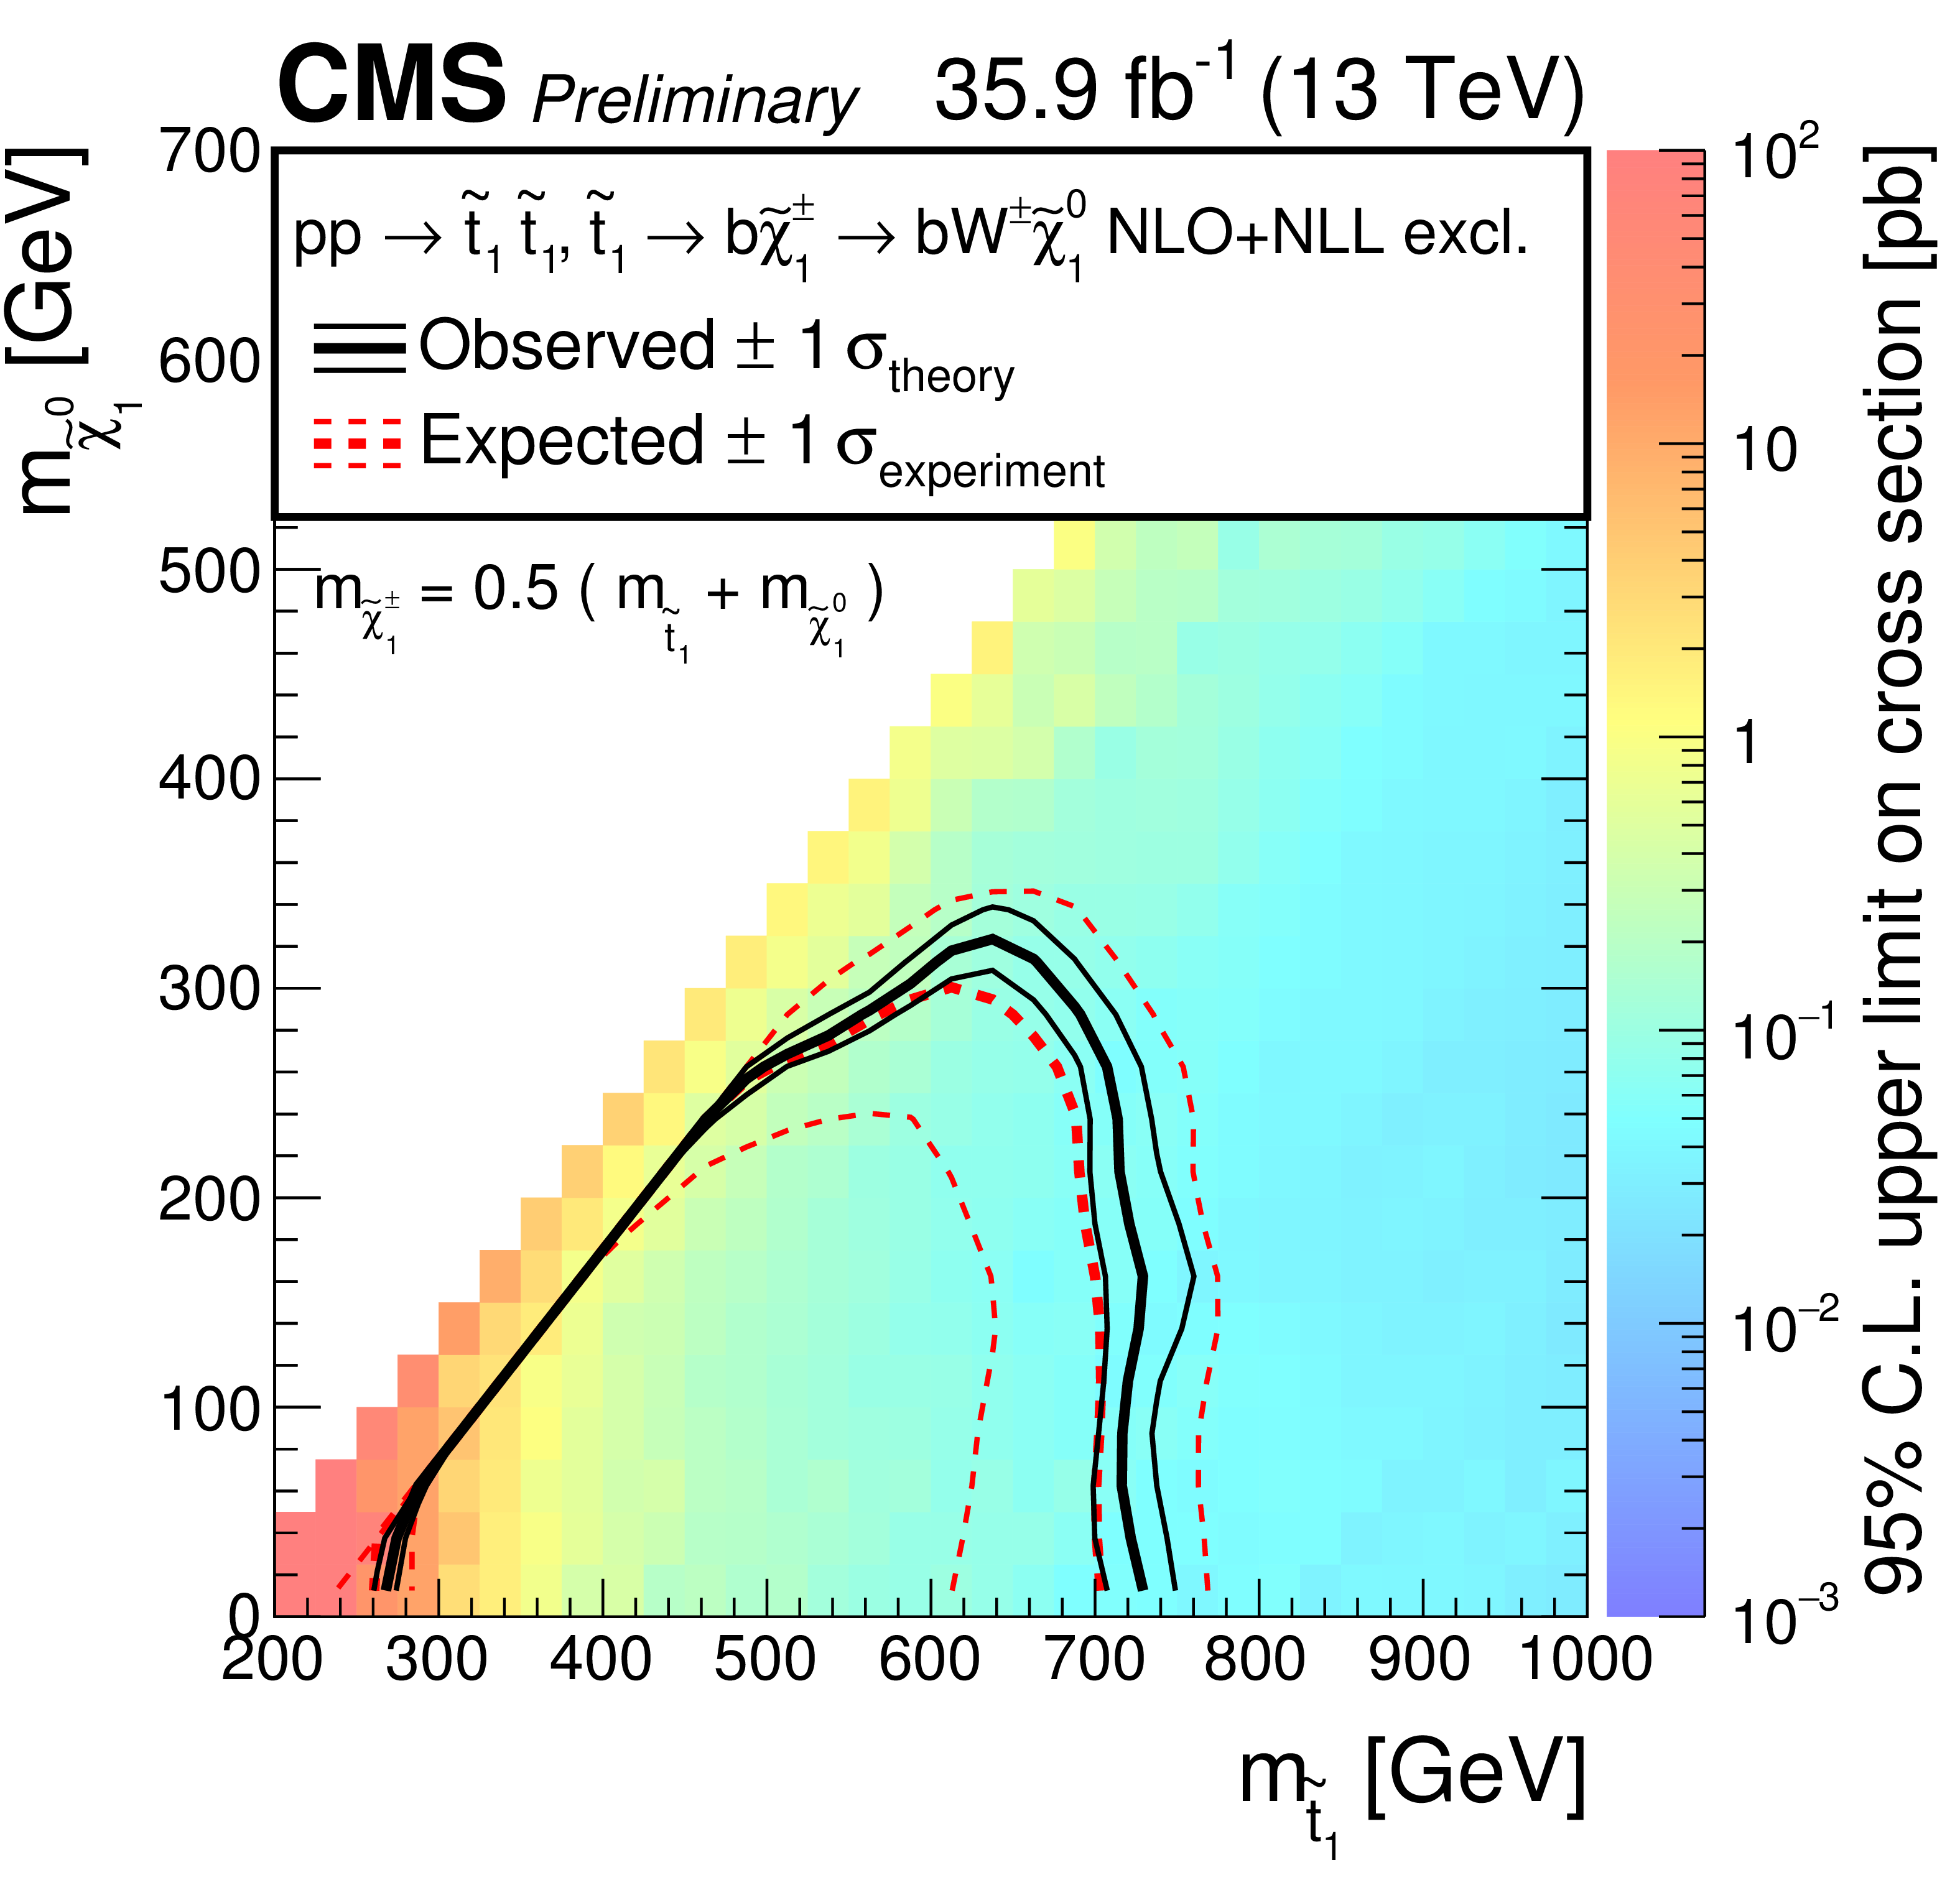
Figure 11-b:
Expected and observed limits at 95% CL for the "chargino decay'' mode $\tilde{ \mathrm{ t } } \to b\tilde{\chi}^{\pm} \to \mathrm{W}\tilde{\chi}^0_1 $. |

png pdf |
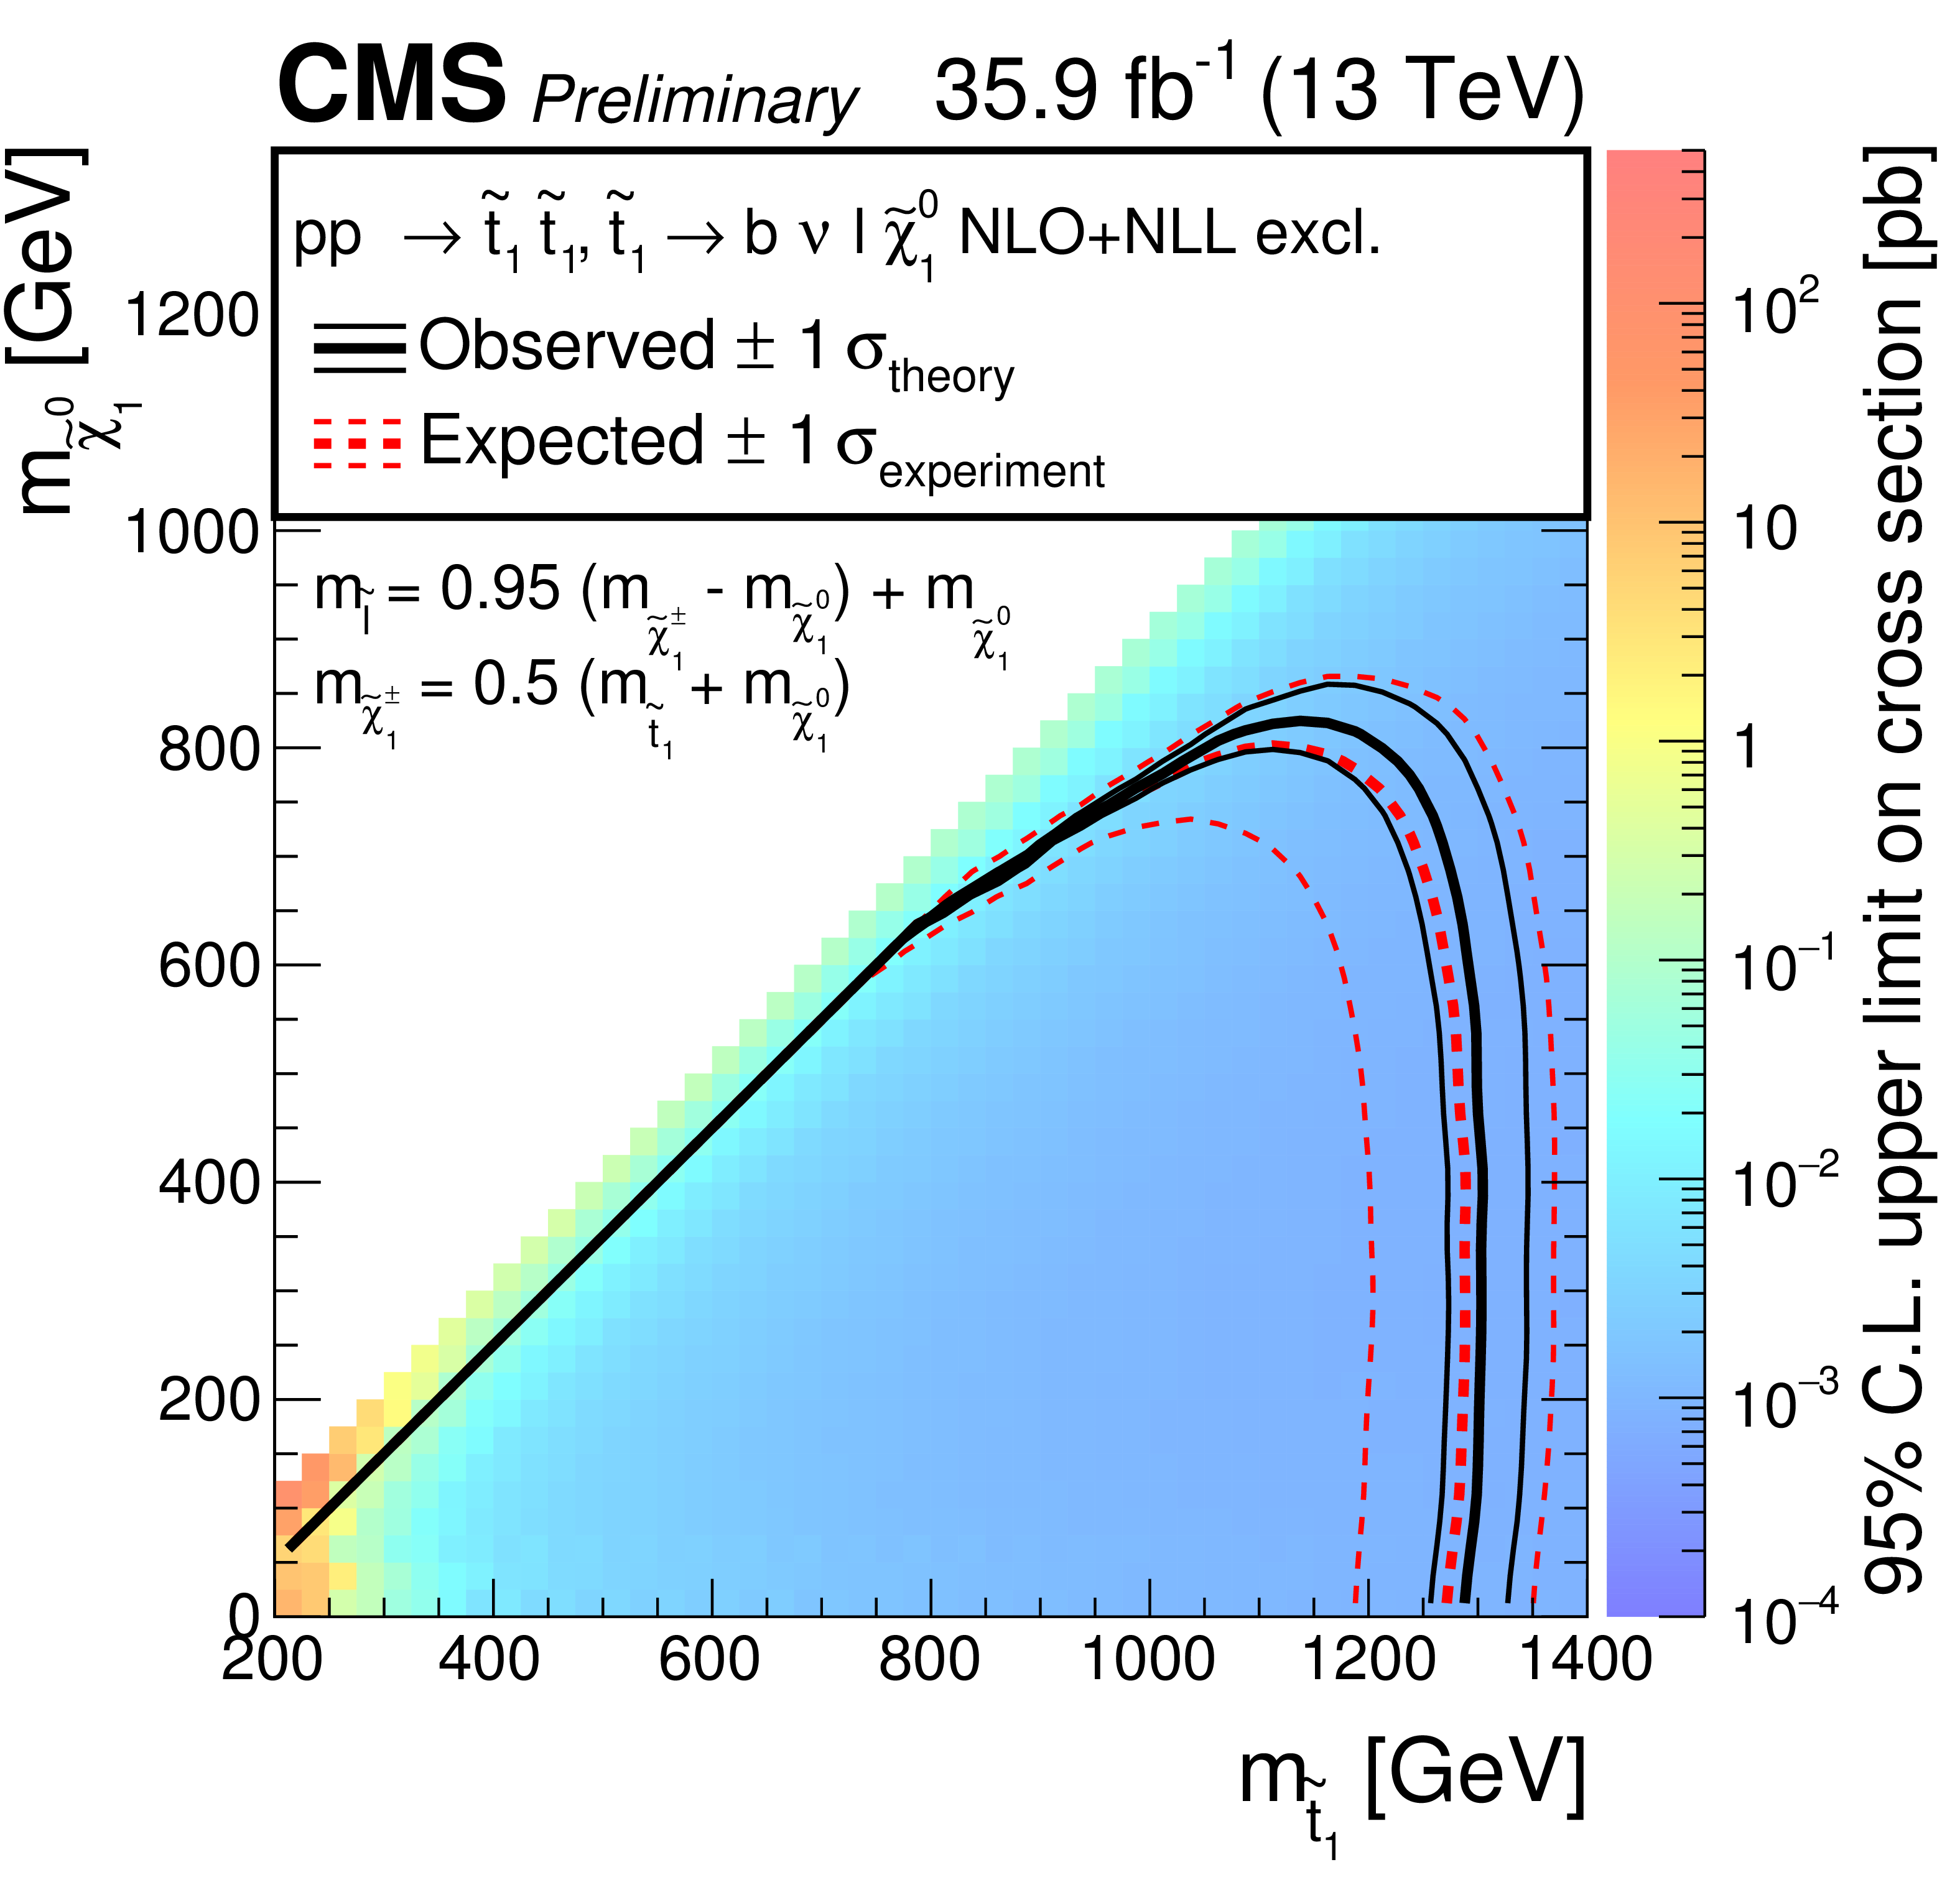
Figure 12:
95% CL expected and observed limits for the "cascade decay'' mode $\tilde{ \mathrm{ t } } \to \mathrm{b}\tilde{\chi}^{\pm} \to \nu \tilde{\ell } \to \ell \tilde{\chi}^0 $ in the $m_{\tilde{ \mathrm{ t } } }$, $m_{\tilde{\chi}^0_1 }$ mass plane. |

png pdf root |
Figure 12-a:
95% CL expected and observed limits for the "cascade decay'' mode $\tilde{ \mathrm{ t } } \to \mathrm{b}\tilde{\chi}^{\pm} \to \nu \tilde{\ell } \to \ell \tilde{\chi}^0 $ in the $m_{\tilde{ \mathrm{ t } } }$, $m_{\tilde{\chi}^0_1 }$ mass plane. |

png pdf root |
Figure 12-b:
95% CL expected and observed limits for the "cascade decay'' mode $\tilde{ \mathrm{ t } } \to \mathrm{b}\tilde{\chi}^{\pm} \to \nu \tilde{\ell } \to \ell \tilde{\chi}^0 $ in the $m_{\tilde{ \mathrm{ t } } }$, $m_{\tilde{\chi}^0_1 }$ mass plane. |
png pdf root |
Figure 12-c:
95% CL expected and observed limits for the "cascade decay'' mode $\tilde{ \mathrm{ t } } \to \mathrm{b}\tilde{\chi}^{\pm} \to \nu \tilde{\ell } \to \ell \tilde{\chi}^0 $ in the $m_{\tilde{ \mathrm{ t } } }$, $m_{\tilde{\chi}^0_1 }$ mass plane. |
| Tables | |

png pdf |
Table 1:
Overview of the preselection. |
png pdf |
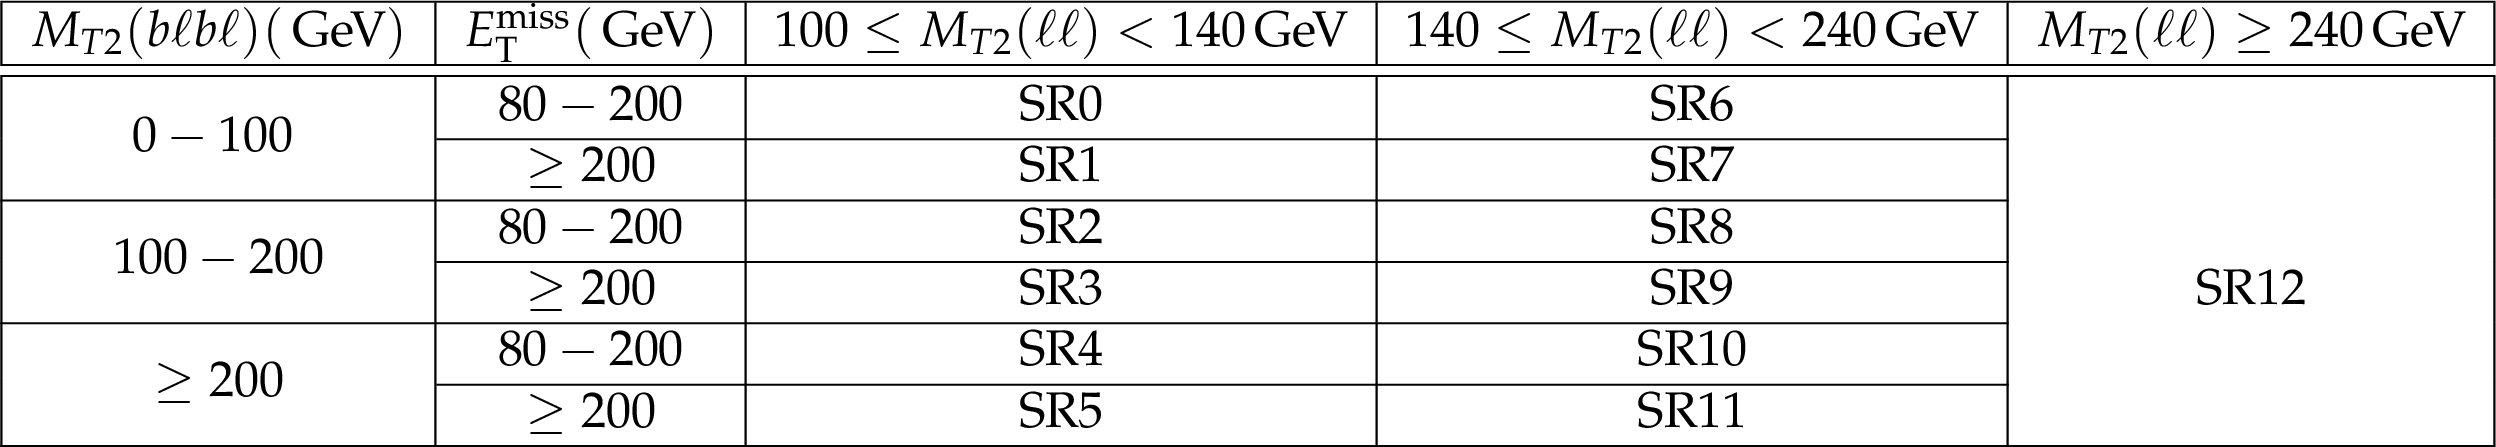
Table 2:
Definition of the signal regions. The regions are furthermore split into opposite-flavor and same-flavor regions. |

png pdf |
Table 3:
Minimal and maximal relative errors for the systematic uncertainties over all signal regions in Fig. 10. Numbers are given relative to the total background contribution per signal region. |

png pdf |
Table 4:
Yields for data and total expected background in each of the signal regions for same-flavor (ee/$\mu \mu $), different-flavor (e$\mu $) and all channels combined with all systematic uncertainties as described in Section 6. |
png pdf |
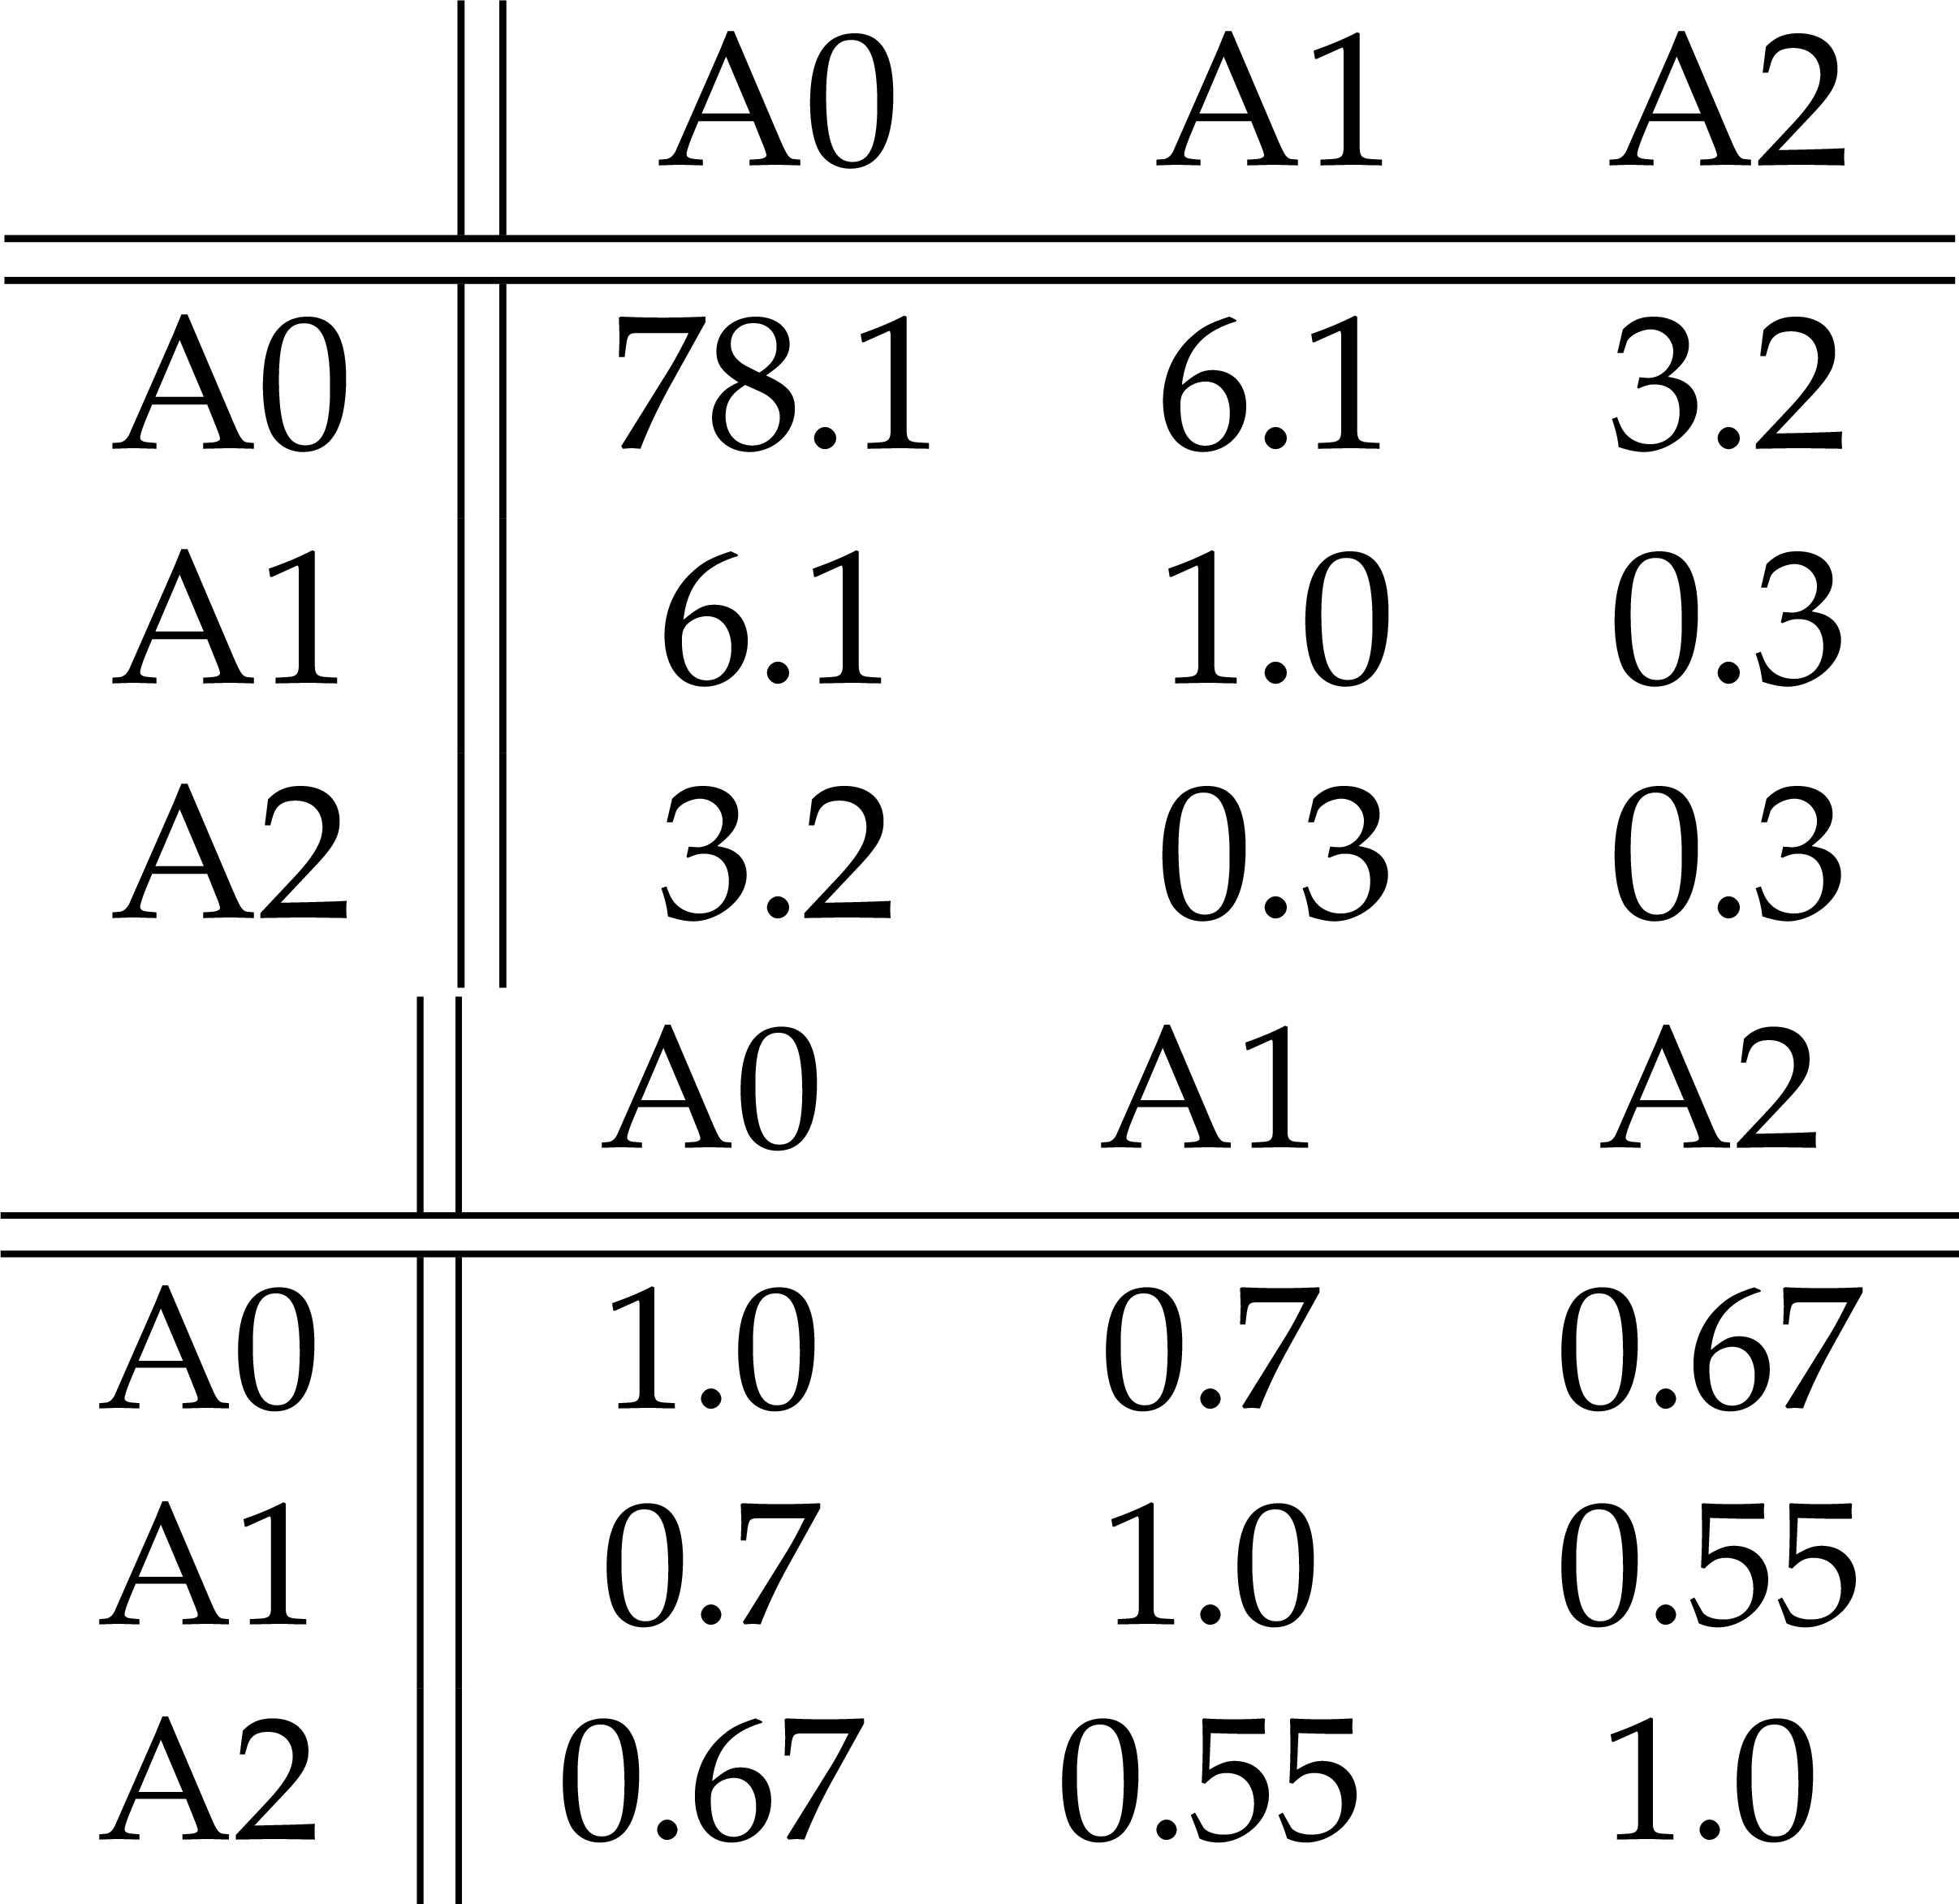
Table 5:
Post-fit covariance (left) and correlation matrix (right) for aggregated signal regions. |
png pdf |
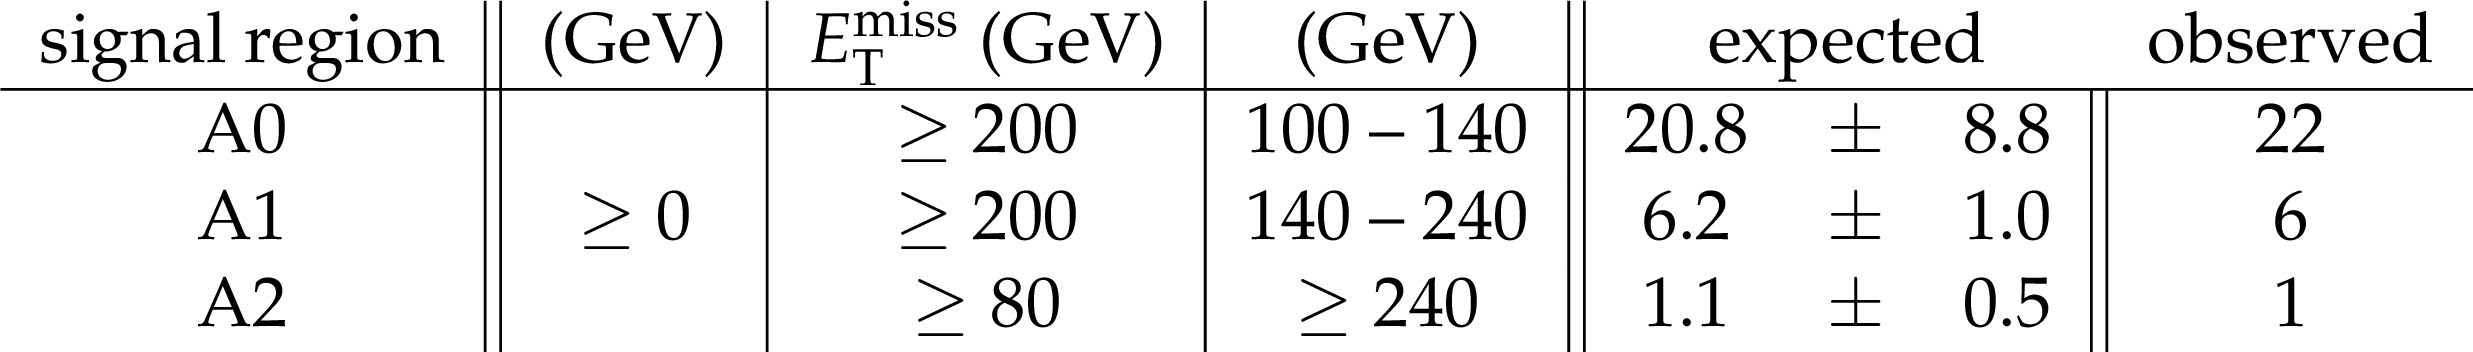
Table 6:
Yields and uncertainties in the aggregated signal regions. |
| Summary |
|
We presented a search for supersymmetry in a final state of two leptons, b jets, and large missing transverse momentum, originating from decays of pair-produced top squarks to two top quarks and neutralinos, with a subsequent fully leptonic decay of the top quarks. We used a data set corresponding to an integrated luminosity of 35.9 fb$^{-1}$ of pp collisions collected in 2016 at a center-of-mass energy of 13 TeV with the CMS detector at the LHC. An efficient background reduction using dedicated kinematical variables was achieved, with in particular the large background of SM dilepton ${\mathrm{ t \bar{t} } }$ events suppressed by several orders of magnitude. We observe no evidence for an excess above the expected background from standard model processes. In the "direct decay" mode, mass configurations with neutralino masses of $ m_{\tilde{\chi}^0_1} \leq $ 1350 GeV and top squark masses of $ m_{\tilde{t}} \leq $ 800 GeV are excluded at a confidence level of 95%. For the "chargino decay" mode, where the chargino mass is assumed to equal the arithmetic mean of the top squark and the lightest neutralino, the corresponding exclusion limit reaches $ m_{\tilde{\mathrm{t}}} \leq $ 750 GeV when the mass of the lightest neutralino is below $ m_{\tilde{\chi}^0_1} \leq $ 300. In the "cascade decay" mode, top squark masses up to $ m_{\tilde{\mathrm{t}}} \leq $ 1200 GeV are excluded for neutralino masses below $ m_{\tilde{\chi}^0_1} \leq $ 400 GeV when the chargino mass is chosen to be half way between stop and neutralino, and the slepton mass half way between chargino and neutralino. If the slepton mass is closer to the mass of the chargino, limits reach even higher top squark and neutralino masses. Otherwise, if the slepton mass is almost degenerate with the neutralino, the limit is considerably weaker. |
| Additional Figures | |

png pdf |
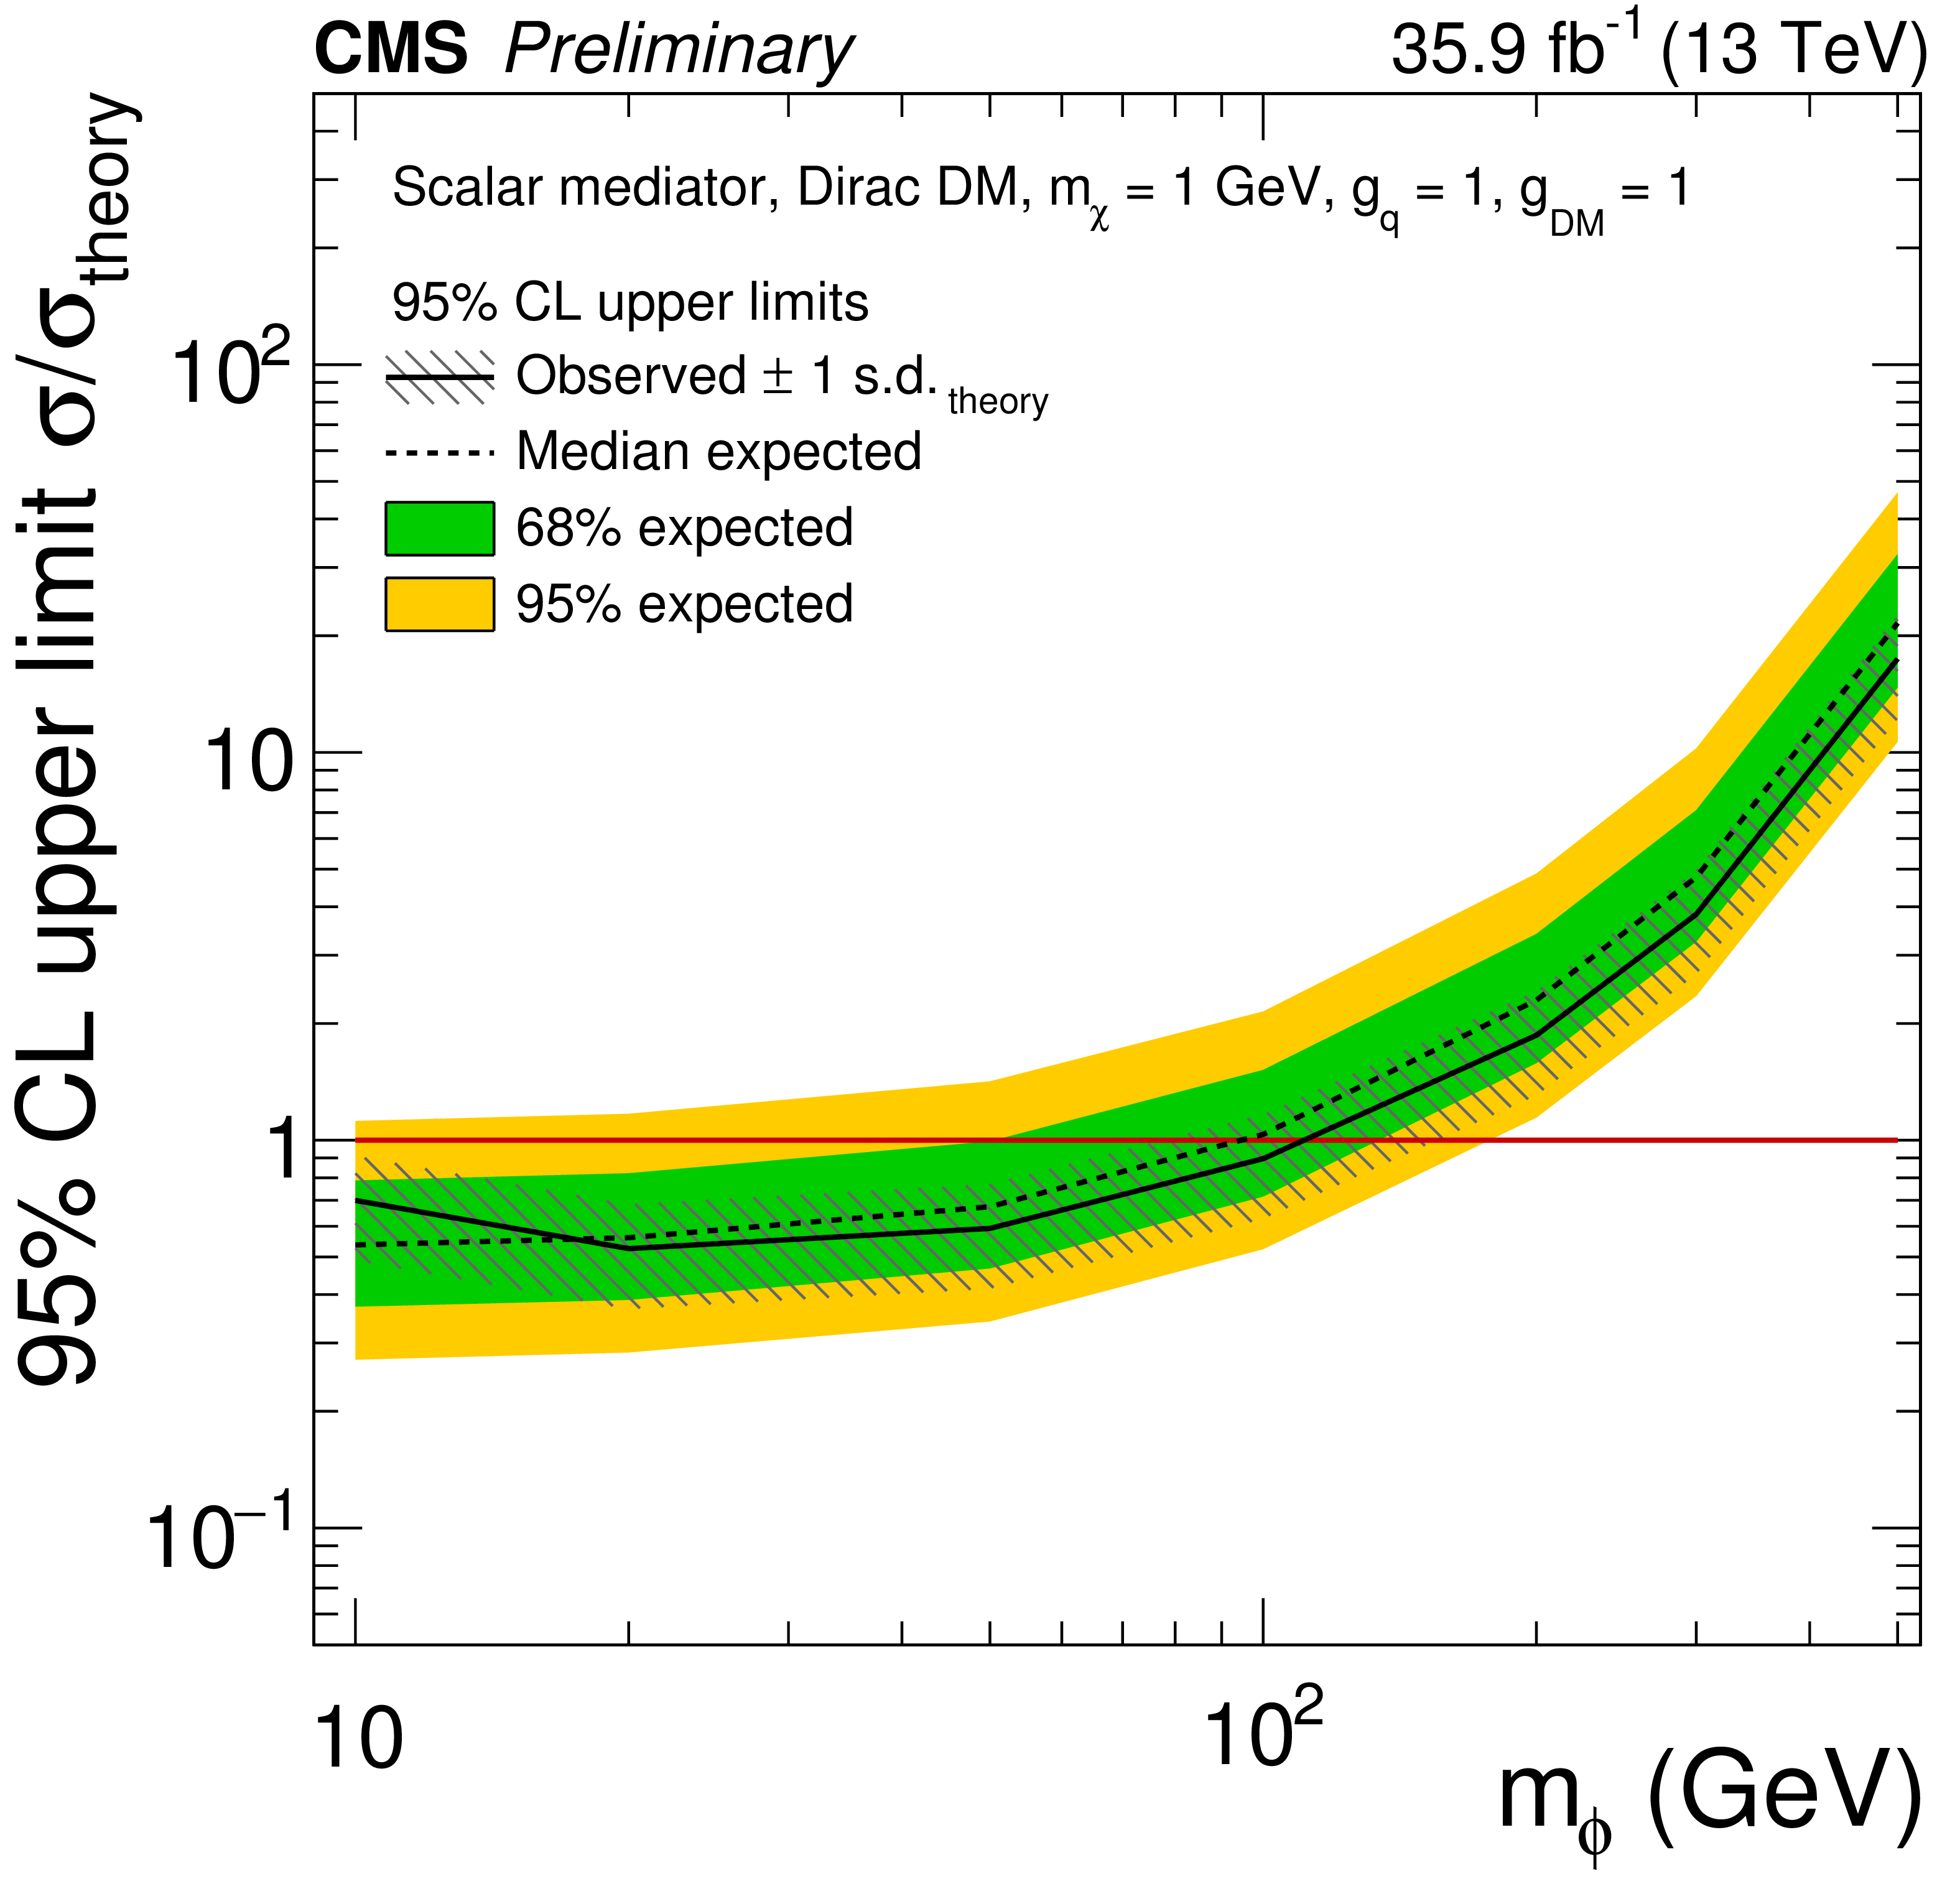
Additional Figure 1:
95% CL expected (dashed line) and observed limits (solid line) on $\mu =\sigma /\sigma _{\textrm {theory}}$ for a fermionic DM particle with $m_{\chi }= $ 1 GeV assuming different scalar (left) and pseudoscalar mediator (right) masses. The green and yellow bands represent the regions containing 68 and 95%, respectively, of the distribution of limits expected under the background-only hypothesis. The horizontal red line indicates $\mu = $ 1. The mediator couplings are set to $g_{\rm q}=g_{\rm DM}= $ 1. The gray hashed band around the observed limit corresponds to a 30% theory uncertainty on the inclusive signal cross section. |
png pdf |
Additional Figure 1-a:
95% CL expected (dashed line) and observed limits (solid line) on $\mu =\sigma /\sigma _{\textrm {theory}}$ for a fermionic DM particle with $m_{\chi }= $ 1 GeV assuming different scalar mediator (masses. The green and yellow bands represent the regions containing 68 and 95%, respectively, of the distribution of limits expected under the background-only hypothesis. The horizontal red line indicates $\mu = $ 1. The mediator couplings are set to $g_{\rm q}=g_{\rm DM}= $ 1. The gray hashed band around the observed limit corresponds to a 30% theory uncertainty on the inclusive signal cross section. |

png pdf |
Additional Figure 1-b:
95% CL expected (dashed line) and observed limits (solid line) on $\mu =\sigma /\sigma _{\textrm {theory}}$ for a fermionic DM particle with $m_{\chi }= $ 1 GeV assuming different pseudoscalar mediator masses. The green and yellow bands represent the regions containing 68 and 95%, respectively, of the distribution of limits expected under the background-only hypothesis. The horizontal red line indicates $\mu = $ 1. The mediator couplings are set to $g_{\rm q}=g_{\rm DM}= $ 1. The gray hashed band around the observed limit corresponds to a 30% theory uncertainty on the inclusive signal cross section. |
| Additional Tables | |

png pdf |
Additional Table 1:
Ratios $\mu =\sigma /\sigma _{\textrm {theory}}$ of the 95% CL expected and observed limits to simplified model expectations for different DM particle masses and mediator masses and for scalar ($\phi $) and pseudoscalar ($a$) mediators under the assumption $g_{\rm q}=g_{\rm DM}=$ 1. The uncertainties reflect the 68% band of the expected limits. |

png pdf |
Additional Table 2:
Cutflow table for two different configurations of T2tt SUSY signal models (left) and DM signal models (right). Numbers are shown for T2tt signals with top squark masses of 750 (600) GeV and LSP masses of 1 (300) GeV, and scalar (pseudoscalar) mediator mass of 10 GeV and DM particle mass of 1 GeV. |
| References | ||||
| 1 | P. Ramond | Dual theory for free fermions | PRD 3 (1971) 2415 | |
| 2 | Y. A. Golfand and E. P. Likhtman | Extension of the algebra of Poincare group generators and violation of P invariance | JEPTL 13 (1971)323 | |
| 3 | A. Neveu and J. H. Schwarz | Factorizable dual model of pions | Nucl. Phys. B 31 (1971) 86 | |
| 4 | D. V. Volkov and V. P. Akulov | Possible universal neutrino interaction | JEPTL 16 (1972)438 | |
| 5 | J. Wess and B. Zumino | A Lagrangian model invariant under supergauge transformations | PLB 49 (1974) 52 | |
| 6 | J. Wess and B. Zumino | Supergauge transformations in four dimensions | Nucl. Phys. B 70 (1974) 39 | |
| 7 | P. Fayet | Supergauge invariant extension of the Higgs mechanism and a model for the electron and its neutrino | Nucl. Phys. B 90 (1975) 104 | |
| 8 | H. P. Nilles | Supersymmetry, supergravity and particle physics | Phys. Rep. 110 (1984) 1 | |
| 9 | G. R. Farrar and P. Fayet | Phenomenology of the production, decay, and detection of new hadronic states associated with supersymmetry | PLB 76 (1978), no. 5, 575 -- 579 | |
| 10 | ATLAS Collaboration | ATLAS Run 1 searches for direct pair production of third-generation squarks at the Large Hadron Collider | EPJC75 (2015), no. 10, 510 | 1506.08616 |
| 11 | ATLAS Collaboration | Search for top squark pair production in final states with one isolated lepton, jets, and missing transverse momentum in $\sqrt{s} = $ 8 TeV $ pp $ collisions with the ATLAS detector | JHEP 11 (2014) 118 | 1407.0583 |
| 12 | ATLAS Collaboration | Search for direct top-squark pair production in final states with two leptons in pp collisions at $ \sqrt{s} = $ 8TeV with the ATLAS detector | JHEP 06 (2014) 124 | 1403.4853 |
| 13 | ATLAS Collaboration | Search for top squarks in final states with one isolated lepton, jets, and missing transverse momentum in $\sqrt{s} = $ 13 TeV $ pp $ collisions with the ATLAS detector | PRD94 (2016), no. 5, 052009 | 1606.03903 |
| 14 | CMS Collaboration | Search for top-squark pair production in the single-lepton final state in pp collisions at $\sqrt{s} = $ 8 TeV | EPJC73 (2013), no. 12 | CMS-SUS-13-011 1308.1586 |
| 15 | CMS Collaboration | Search for direct pair production of scalar top quarks in the single- and dilepton channels in proton-proton collisions at $\sqrt{s} = $ 8 TeV | JHEP 07 (2016) 027 | CMS-SUS-14-015 1602.03169 |
| 16 | CMS Collaboration | Searches for pair production for third-generation squarks in $\sqrt{s} = $ 13 TeV pp collisions | accepted by EPJC (2016) | CMS-SUS-16-008 1612.03877 |
| 17 | C. G. Lester and D. J. Summers | Measuring masses of semiinvisibly decaying particles pair produced at hadron colliders | PLB 463 (1999) 99--103 | hep-ph/9906349 |
| 18 | CMS Collaboration | The CMS experiment at the CERN LHC | JINST 3 (2008) S08004 | CMS-00-001 |
| 19 | S. Alioli et al. | NLO single-top production matched with shower in POWHEG: $ s $- and $ t $-channel contributions | JHEP 09 (2009) 111 | 0907.4076 |
| 20 | S. Alioli et al. | A general framework for implementing NLO calculations in shower Monte Carlo programs: the POWHEG BOX | JHEP 06 (2010) 043 | 1002.2581 |
| 21 | M. Czakon and A. Mitov | Top++: A Program for the Calculation of the Top-Pair Cross-Section at Hadron Colliders | CPC 185 (2014) 2930 | 1112.5675 |
| 22 | M. Aliev et al. | HATHOR: HAdronic Top and Heavy quarks crOss section calculatoR | CPC 182 (2011) 1034--1046 | 1007.1327 |
| 23 | M. Beneke, P. Falgari, S. Klein, and C. Schwinn | Hadronic top-quark pair production with NNLL threshold resummation | Nucl. Phys. B 855 (2012) 695--741 | 1109.1536 |
| 24 | M. Czakon and A. Mitov | NNLO corrections to top-pair production at hadron colliders: the all-fermionic scattering channels | JHEP 12 (2012) 054 | 1207.0236 |
| 25 | M. Czakon and A. Mitov | NNLO corrections to top pair production at hadron colliders: the quark-gluon reaction | JHEP 01 (2013) 080 | 1210.6832 |
| 26 | M. Czakon, P. Fiedler, and A. Mitov | Total Top-Quark Pair-Production Cross Section at Hadron Colliders Through $ \mathcal{O}(\alpha_S^4) $ | PRL 110 (2013) 252004 | 1303.6254 |
| 27 | P. Kant et al. | HatHor for single top-quark production: Updated predictions and uncertainty estimates for single top-quark production in hadronic collisions | CPC 191 (2015) 74--89 | 1406.4403 |
| 28 | J. Alwall et al. | The automated computation of tree-level and next-to-leading order differential cross sections, and their matching to parton shower simulations | JHEP 07 (2014) 079 | 1405.0301 |
| 29 | R. Gavin, Y. Li, F. Petriello, and S. Quackenbush | FEWZ 2.0: A code for hadronic Z production at next-to-next-to-leading order | CPC 182 (2011) 2388--2403 | 1011.3540 |
| 30 | T. Sjostrand, S. Mrenna, and P. Skands | PYTHIA 6.4 physics and manual | JHEP 05 (2006) 026 | hep-ph/0603175 |
| 31 | T. Sjostrand et al. | An Introduction to PYTHIA 8.2 | CPC 191 (2015) 159--177 | 1410.3012 |
| 32 | P. Skands, S. Carrazza, and J. Rojo | Tuning PYTHIA 8.1: the Monash 2013 tune | EPJC 74 (2014) 3024 | 1404.5630 |
| 33 | CMS Collaboration | Event generator tunes obtained from underlying event and multiparton scattering measurements | EPJC 76 (2016) 155 | CMS-GEN-14-001 1512.00815 |
| 34 | GEANT4 Collaboration | $ Geant 4 $ -- a simulation toolkit | NIMA 506 (2003) 250 | |
| 35 | C. Borschensky et al. | Squark and gluino production cross sections in pp collisions at $ \sqrt{s} = $ 13, 14, 33 and 100 TeV | EPJC 74 (2014), no. 12 | 1407.5066 |
| 36 | S. Abdullin et al. | The fast simulation of the CMS detector at LHC | J. Phys. Conf. Ser. 331 (2011) 032049 | |
| 37 | CMS Collaboration | Particle-Flow Event Reconstruction in CMS and Performance for Jets, Taus, and MET | CDS | |
| 38 | CMS Collaboration | Commissioning of the Particle-Flow Reconstruction in Minimum-Bias and Jet Events from $ \mathrm{ p }\mathrm{ p } $ Collisions at 7 TeV | CDS | |
| 39 | M. Cacciari, G. P. Salam, and G. Soyez | The anti-$ k_t $ jet clustering algorithm | JHEP 04 (2008) 063 | 0802.1189 |
| 40 | CMS Collaboration | Jet energy scale and resolution in the CMS experiment in pp collisions at 8 TeV | JINST 12 (2017), no. 02, P02014 | CMS-JME-13-004 1607.03663 |
| 41 | CMS Collaboration | Identification of $ \mathrm{b }-quark $ jets with the CMS experiment | JINST 8 (2013) 04013 | CMS-BTV-12-001 1211.4462 |
| 42 | H.-C. Cheng and Z. Han | Minimal Kinematic Constraints and m(T2) | JHEP 12 (2008) 063 | 0810.5178 |
| 43 | CMS Collaboration | Identification of b-quark jets with the CMS experiment | JINST 8 (2013) P04013 | CMS-BTV-12-001 1211.4462 |
| 44 | CMS Collaboration | Measurement of the differential cross section for top quark pair production in pp collisions at $ \sqrt{s} = $ 8 TeV | EPJC 75 (2015), no. 11, 542 | CMS-TOP-12-028 1505.04480 |
| 45 | S. Catani, D. de Florian, M. Grazzini, and P. Nason | Soft gluon resummation for Higgs boson production at hadron colliders | JHEP 07 (2003) 028 | hep-ph/0306211 |
| 46 | M. Cacciari et al. | The $ \mathrm{ t \bar{t} } $ cross-section at 1.8 TeV and 1.96 TeV: a study of the systematics due to parton densities and scale dependence | JHEP 04 (2004) 068 | hep-ph/0303085 |
| 47 | G. Cowan, K. Cranmer, E. Gross, and O. Vitells | Asymptotic formulae for likelihood-based tests of new physics | EPJC 71 (2011) 1554 | 1007.1727 |
| 48 | T. Junk | Confidence level computation for combining searches with small statistics | Nucl. Instr. and Meth. A 434 (1999) 435 | hep-ex/9902006 |
| 49 | A. L. Read | Presentation of search results: the $ {CL}_s $ technique | JPG 28 (2002) 2693 | |
| 50 | CMS Collaboration | Simplified likelihood for the re-interpretation of public CMS results | CDS | |
|
|
Compact Muon Solenoid LHC, CERN |
|

|

|

|

|

|