

Compact Muon Solenoid
LHC, CERN
| CMS-PAS-TOP-16-022 | ||
| Measurement of the top quark mass with muon+jets final states in pp collisions at $\sqrt{s}= $ 13 TeV | ||
| CMS Collaboration | ||
| March 2017 | ||
| Abstract: The mass of the top quark is measured using a sample of $\rm{t}\bar{\rm t}$ candidate events with one muon and at least four jets in the final state, collected by CMS in pp collisions at $\sqrt{s}= $ 13 TeV at the CERN LHC. The candidate events are selected from data corresponding to an integrated luminosity of 2.2 fb$^{-1}$. For each event the mass is reconstructed from a kinematic fit of the decay products to a $\rm{t}\bar{\rm t}$ hypothesis. The top quark mass is determined simultaneously with an overall jet energy scale factor (JSF), constrained by the known mass of the W boson in $\rm{q}\bar{\rm q}$ decays. The estimator is calibrated on samples simulated at next-to-leading order matched to parton shower. The top quark mass is measured to be 172.62 $\pm$ 0.38 (stat.+JSF) $\pm$ 0.70 (syst.) GeV. | ||
| Links: CDS record (PDF) ; inSPIRE record ; CADI line (restricted) ; | ||
| Figures | |
png pdf |
Figure 1:
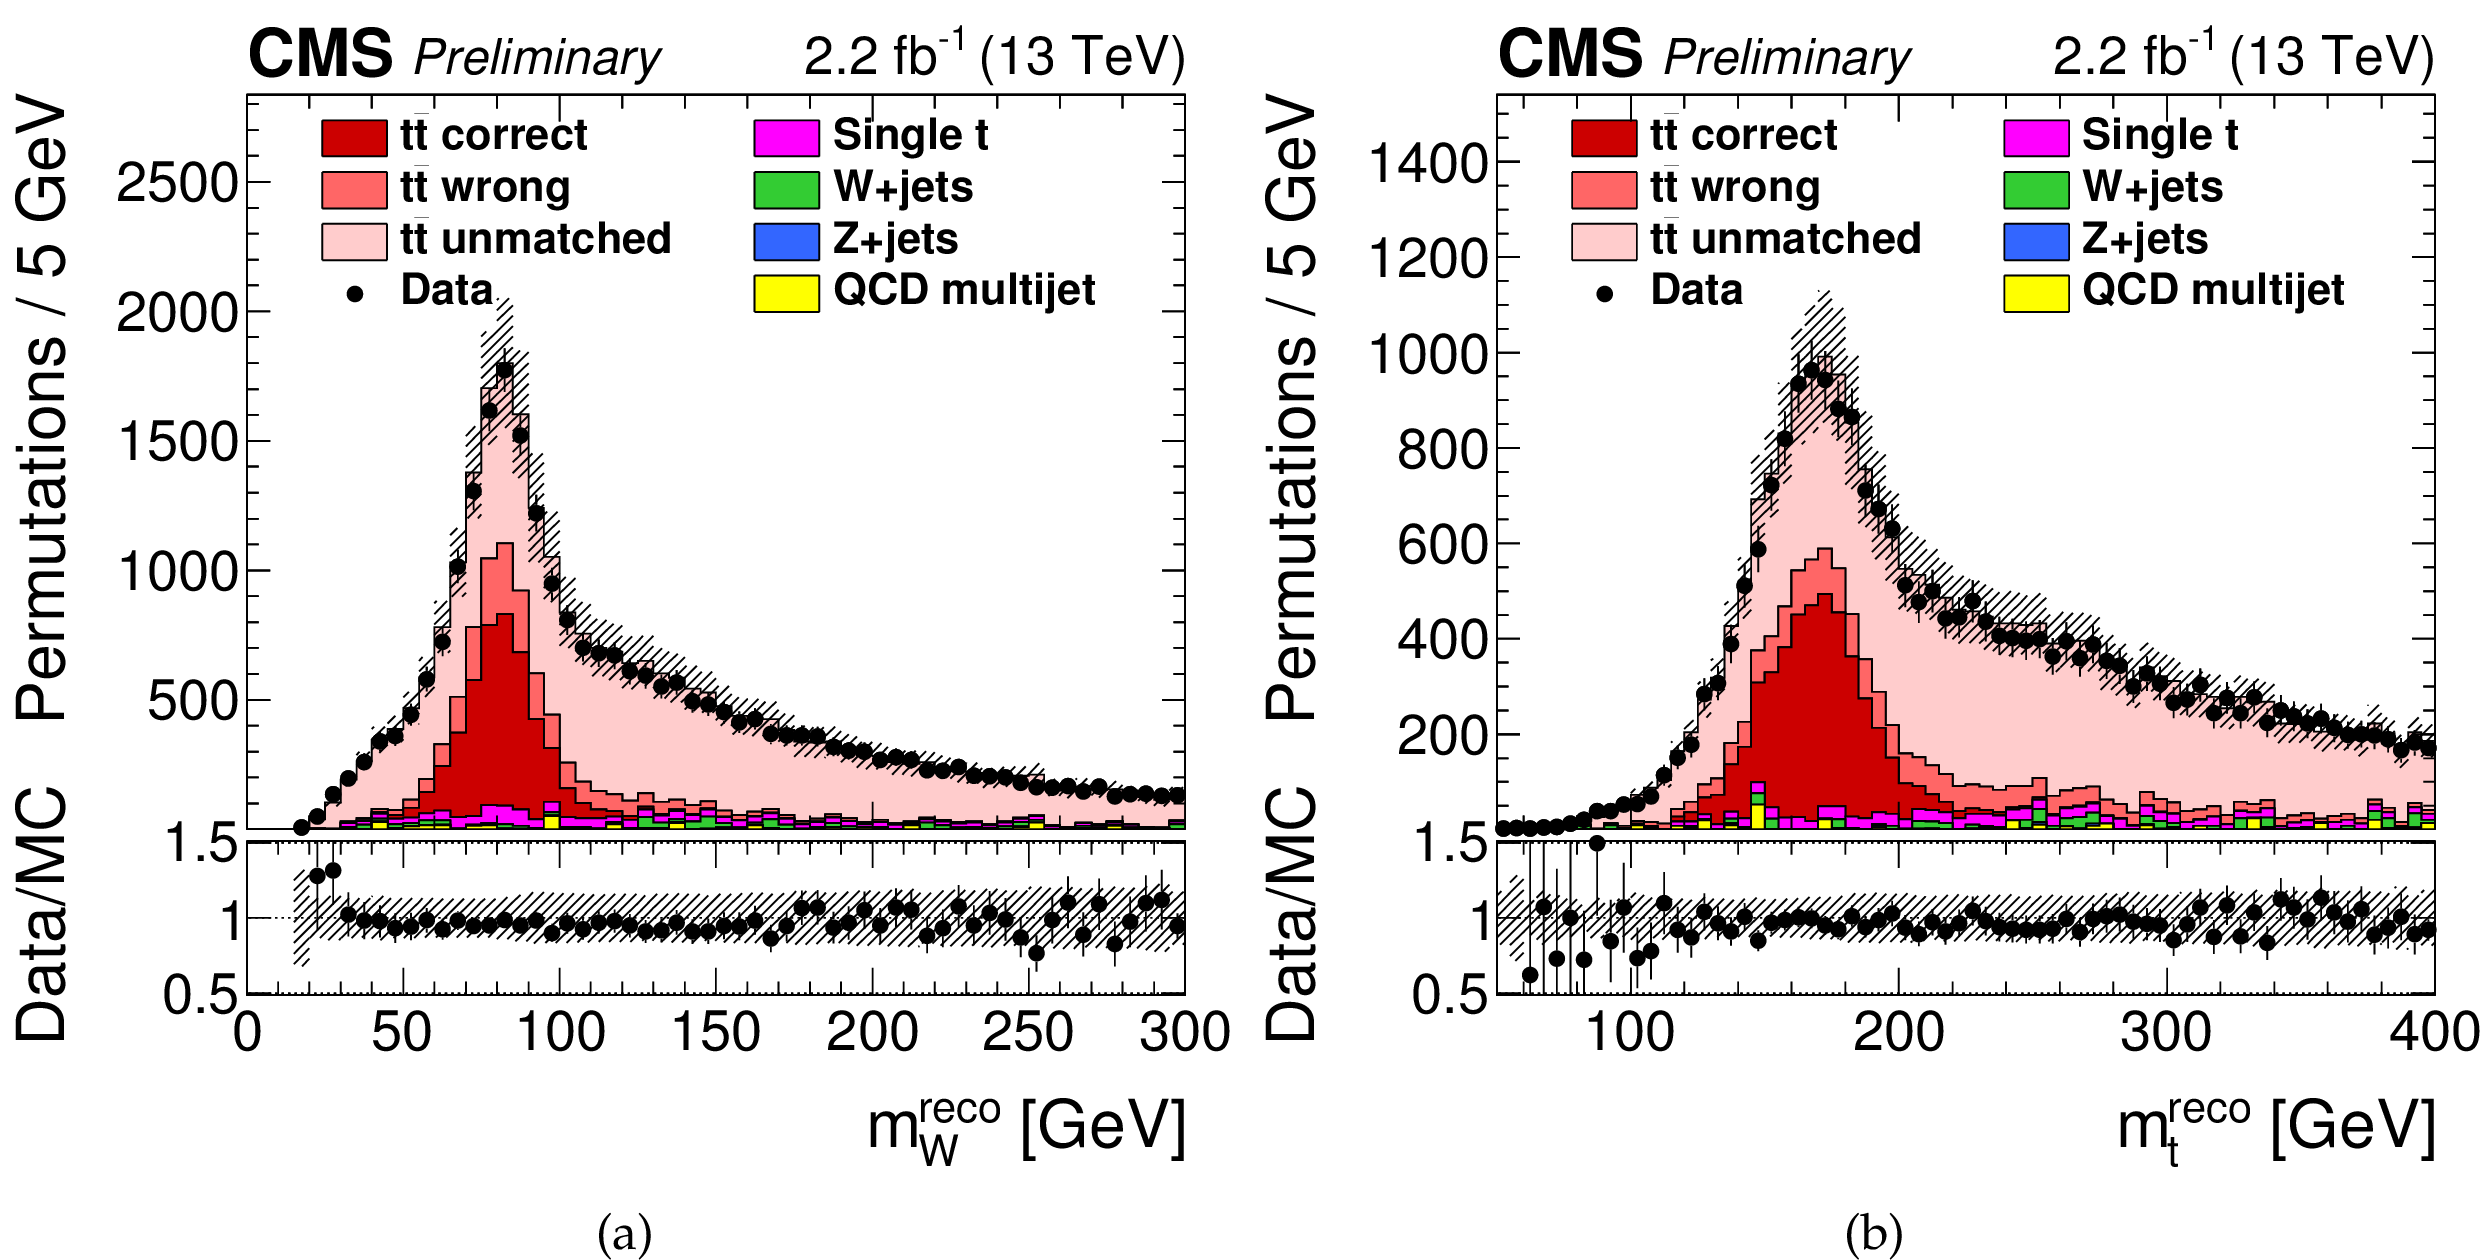
(a) Invariant mass $m_\mathrm{ W } ^\text {reco}$ of the two untagged jets and (b) the invariant mass $ {m_{\mathrm{ t } }} ^\text {reco}$ of the two untagged jets and one of the b-tagged jets after the b tagging requirement. The vertical bars show the statistical uncertainty and the hatched bands show the statistical and systematic uncertainties considered in Sec. 4 added in quadrature. The lower portion of each panel show the ratio of the yields between the collision data and the simulation. The simulations are normalized to the luminosity. |

png pdf |
Figure 1-a:
The invariant mass $m_\mathrm{ W } ^\text {reco}$ of the two untagged jets. The vertical bars show the statistical uncertainty and the hatched bands show the statistical and systematic uncertainties considered in Sec. 4 added in quadrature. The lower portion of the panel shows the ratio of the yields between the collision data and the simulation. The simulations are normalized to the luminosity. |

png pdf |
Figure 1-b:
The invariant mass $ {m_{\mathrm{ t } }} ^\text {reco}$ of the two untagged jets and one of the b-tagged jets after the b tagging requirement. The vertical bars show the statistical uncertainty and the hatched bands show the statistical and systematic uncertainties considered in Sec. 4 added in quadrature. The lower portion of the panel shows the ratio of the yields between the collision data and the simulation. The simulations are normalized to the luminosity. |

png pdf |
Figure 2:
(a) The reconstructed W boson masses $m_\mathrm{ W } ^\text {reco}$ and (b) the fitted top quark masses $ {m_{\mathrm{ t } }} ^\text {fit}$ after the goodness-of-fit selection and the weighting by $P_\mathrm {gof}$. The vertical bars show the statistical uncertainty and the hatched bands show the statistical and systematic uncertainties added in quadrature. The lower portion of each panel show the ratio of the yields between the collision data and the simulation. |

png pdf |
Figure 2-a:
The reconstructed W boson masses $m_\mathrm{ W } ^\text {reco}$. The vertical bars show the statistical uncertainty and the hatched bands show the statistical and systematic uncertainties added in quadrature. The lower portion of the panel shows the ratio of the yields between the collision data and the simulation. |

png pdf |
Figure 2-b:
The fitted top quark masses $ {m_{\mathrm{ t } }} ^\text {fit}$ after the goodness-of-fit selection and the weighting by $P_\mathrm {gof}$. The vertical bars show the statistical uncertainty and the hatched bands show the statistical and systematic uncertainties added in quadrature. The lower portion of the panel shows the ratio of the yields between the collision data and the simulation. |
png pdf |
Figure 3:
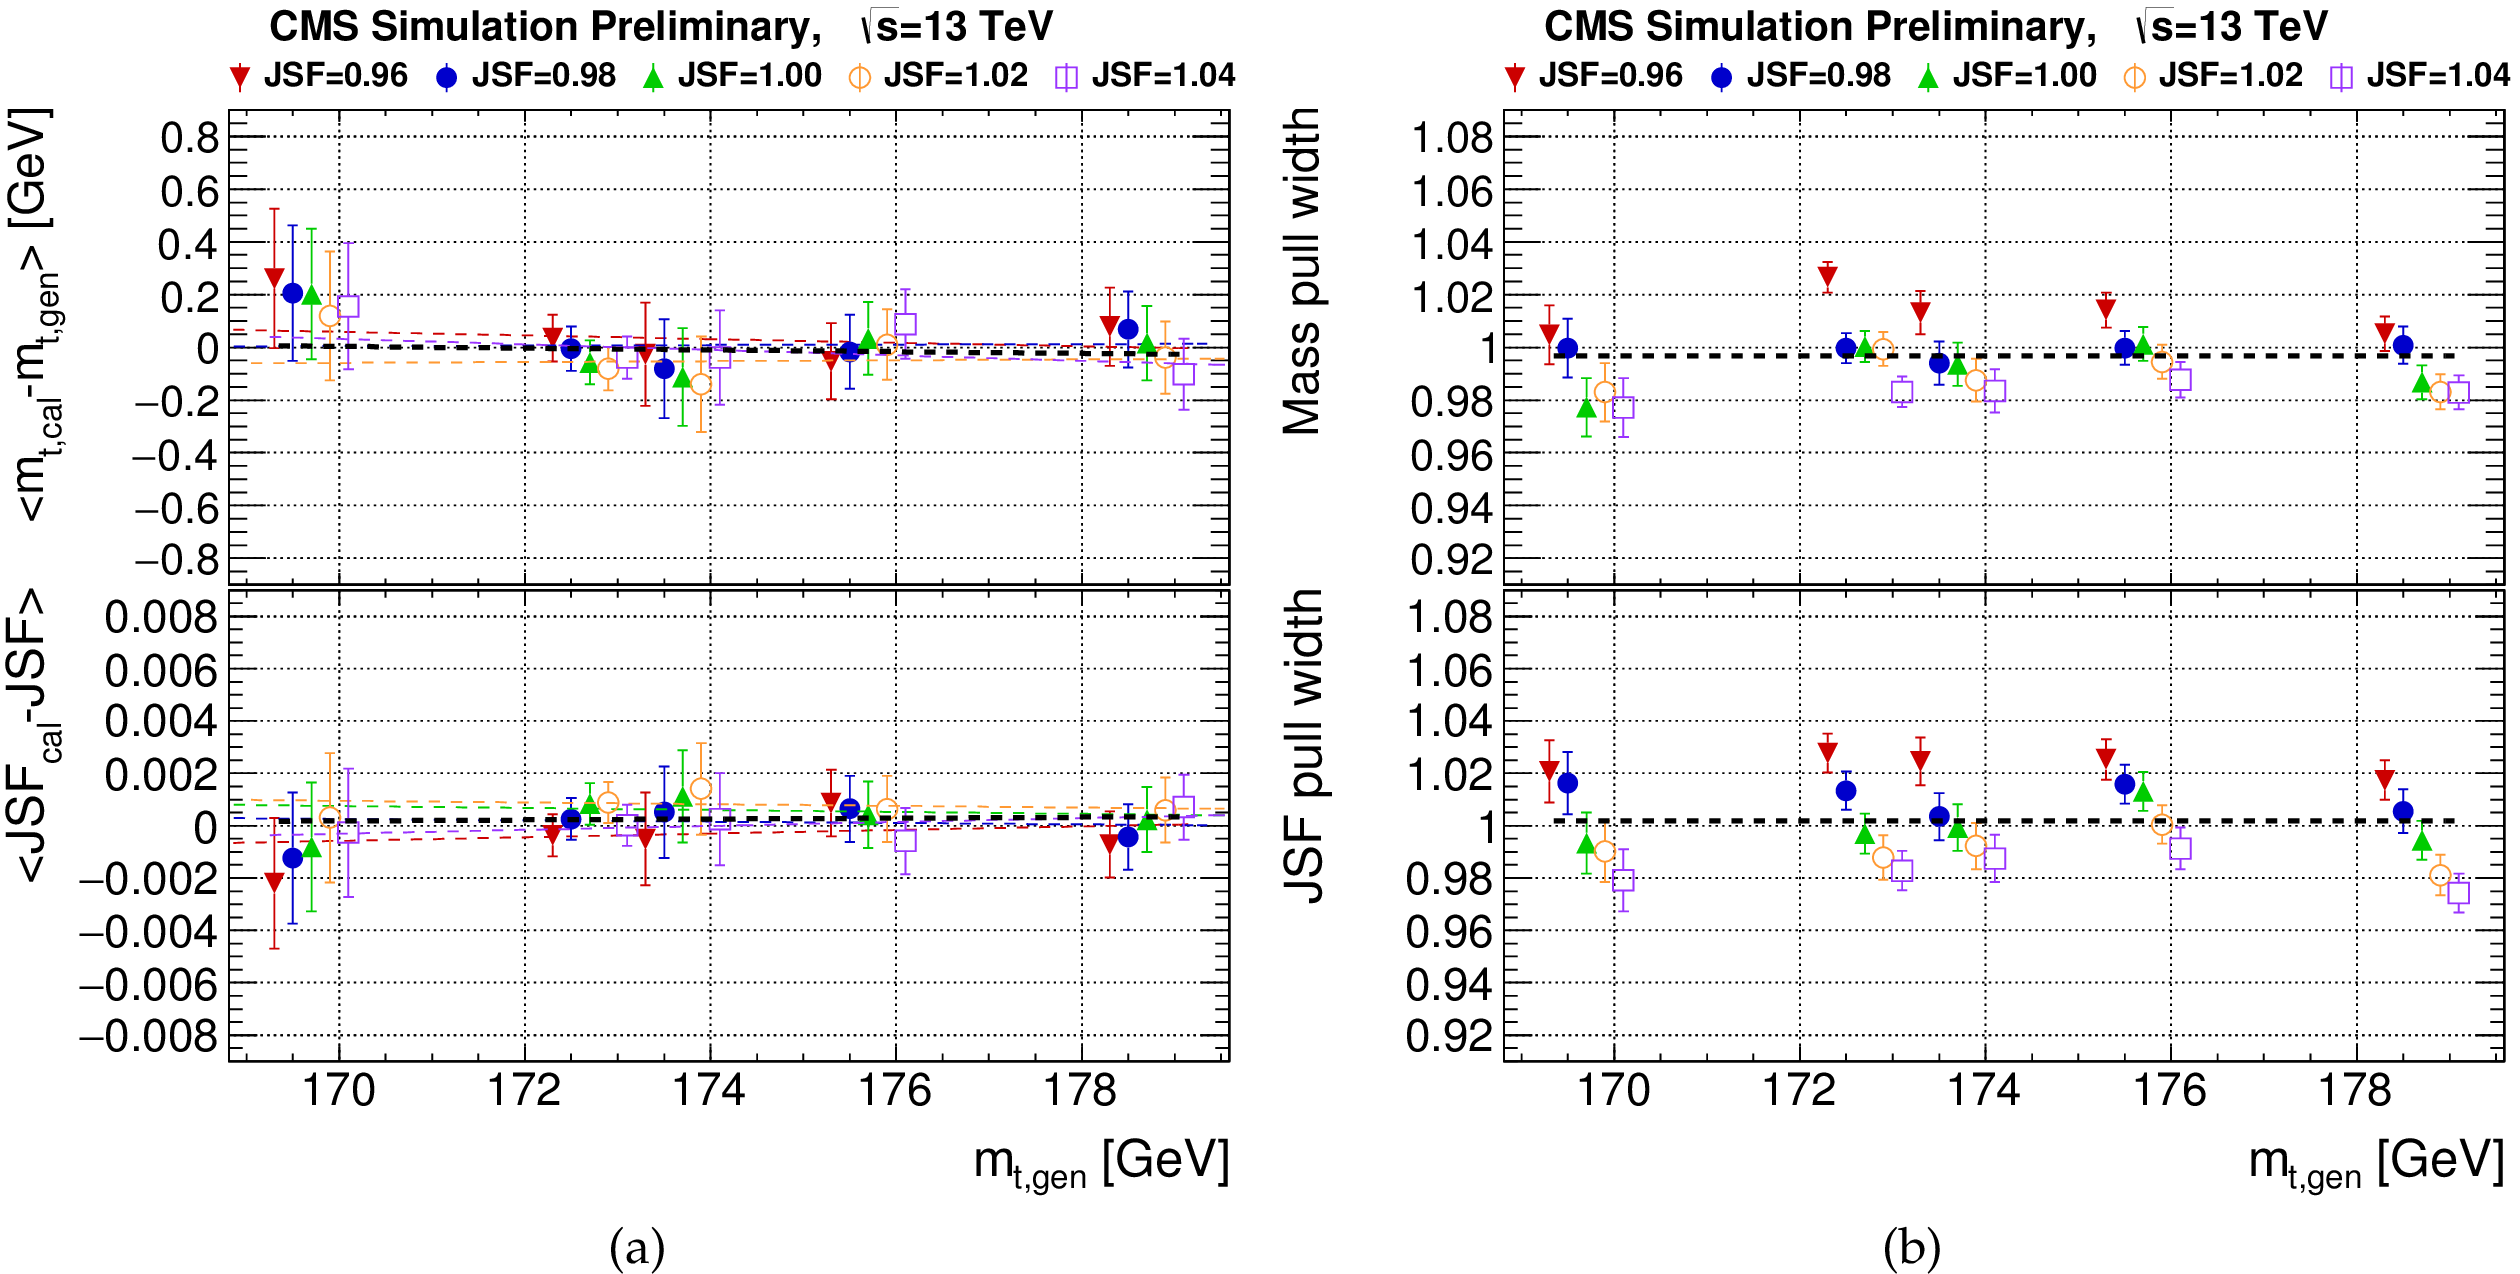
(a) Mean difference between the calibrated and generated values of $ {m_{\mathrm{ t } }} $ and JSF as a function of different generated $m_{\mathrm{ t } ,\text {gen}}$ and five values of JSF; (b) width of the pull distributions after the calibration. The colored dashed lines correspond to straight line fits, the black solid line corresponds to a constant fit to all calibration points. The error bars in (a) indicate the statistical uncertainty on the mean difference. |

png pdf |
Figure 3-a:
Mean difference between the calibrated and generated values of $ {m_{\mathrm{ t } }} $ and JSF as a function of different generated $m_{\mathrm{ t } ,\text {gen}}$ and five values of JSF. The colored dashed lines correspond to straight line fits, the black solid line corresponds to a constant fit to all calibration points. The error bars indicate the statistical uncertainty on the mean difference. |

png pdf |
Figure 3-b:
Width of the pull distributions after the calibration. The colored dashed lines correspond to straight line fits, the black solid line corresponds to a constant fit to all calibration points. The error bars indicate the statistical uncertainty on the mean difference. |

png pdf |
Figure 4:
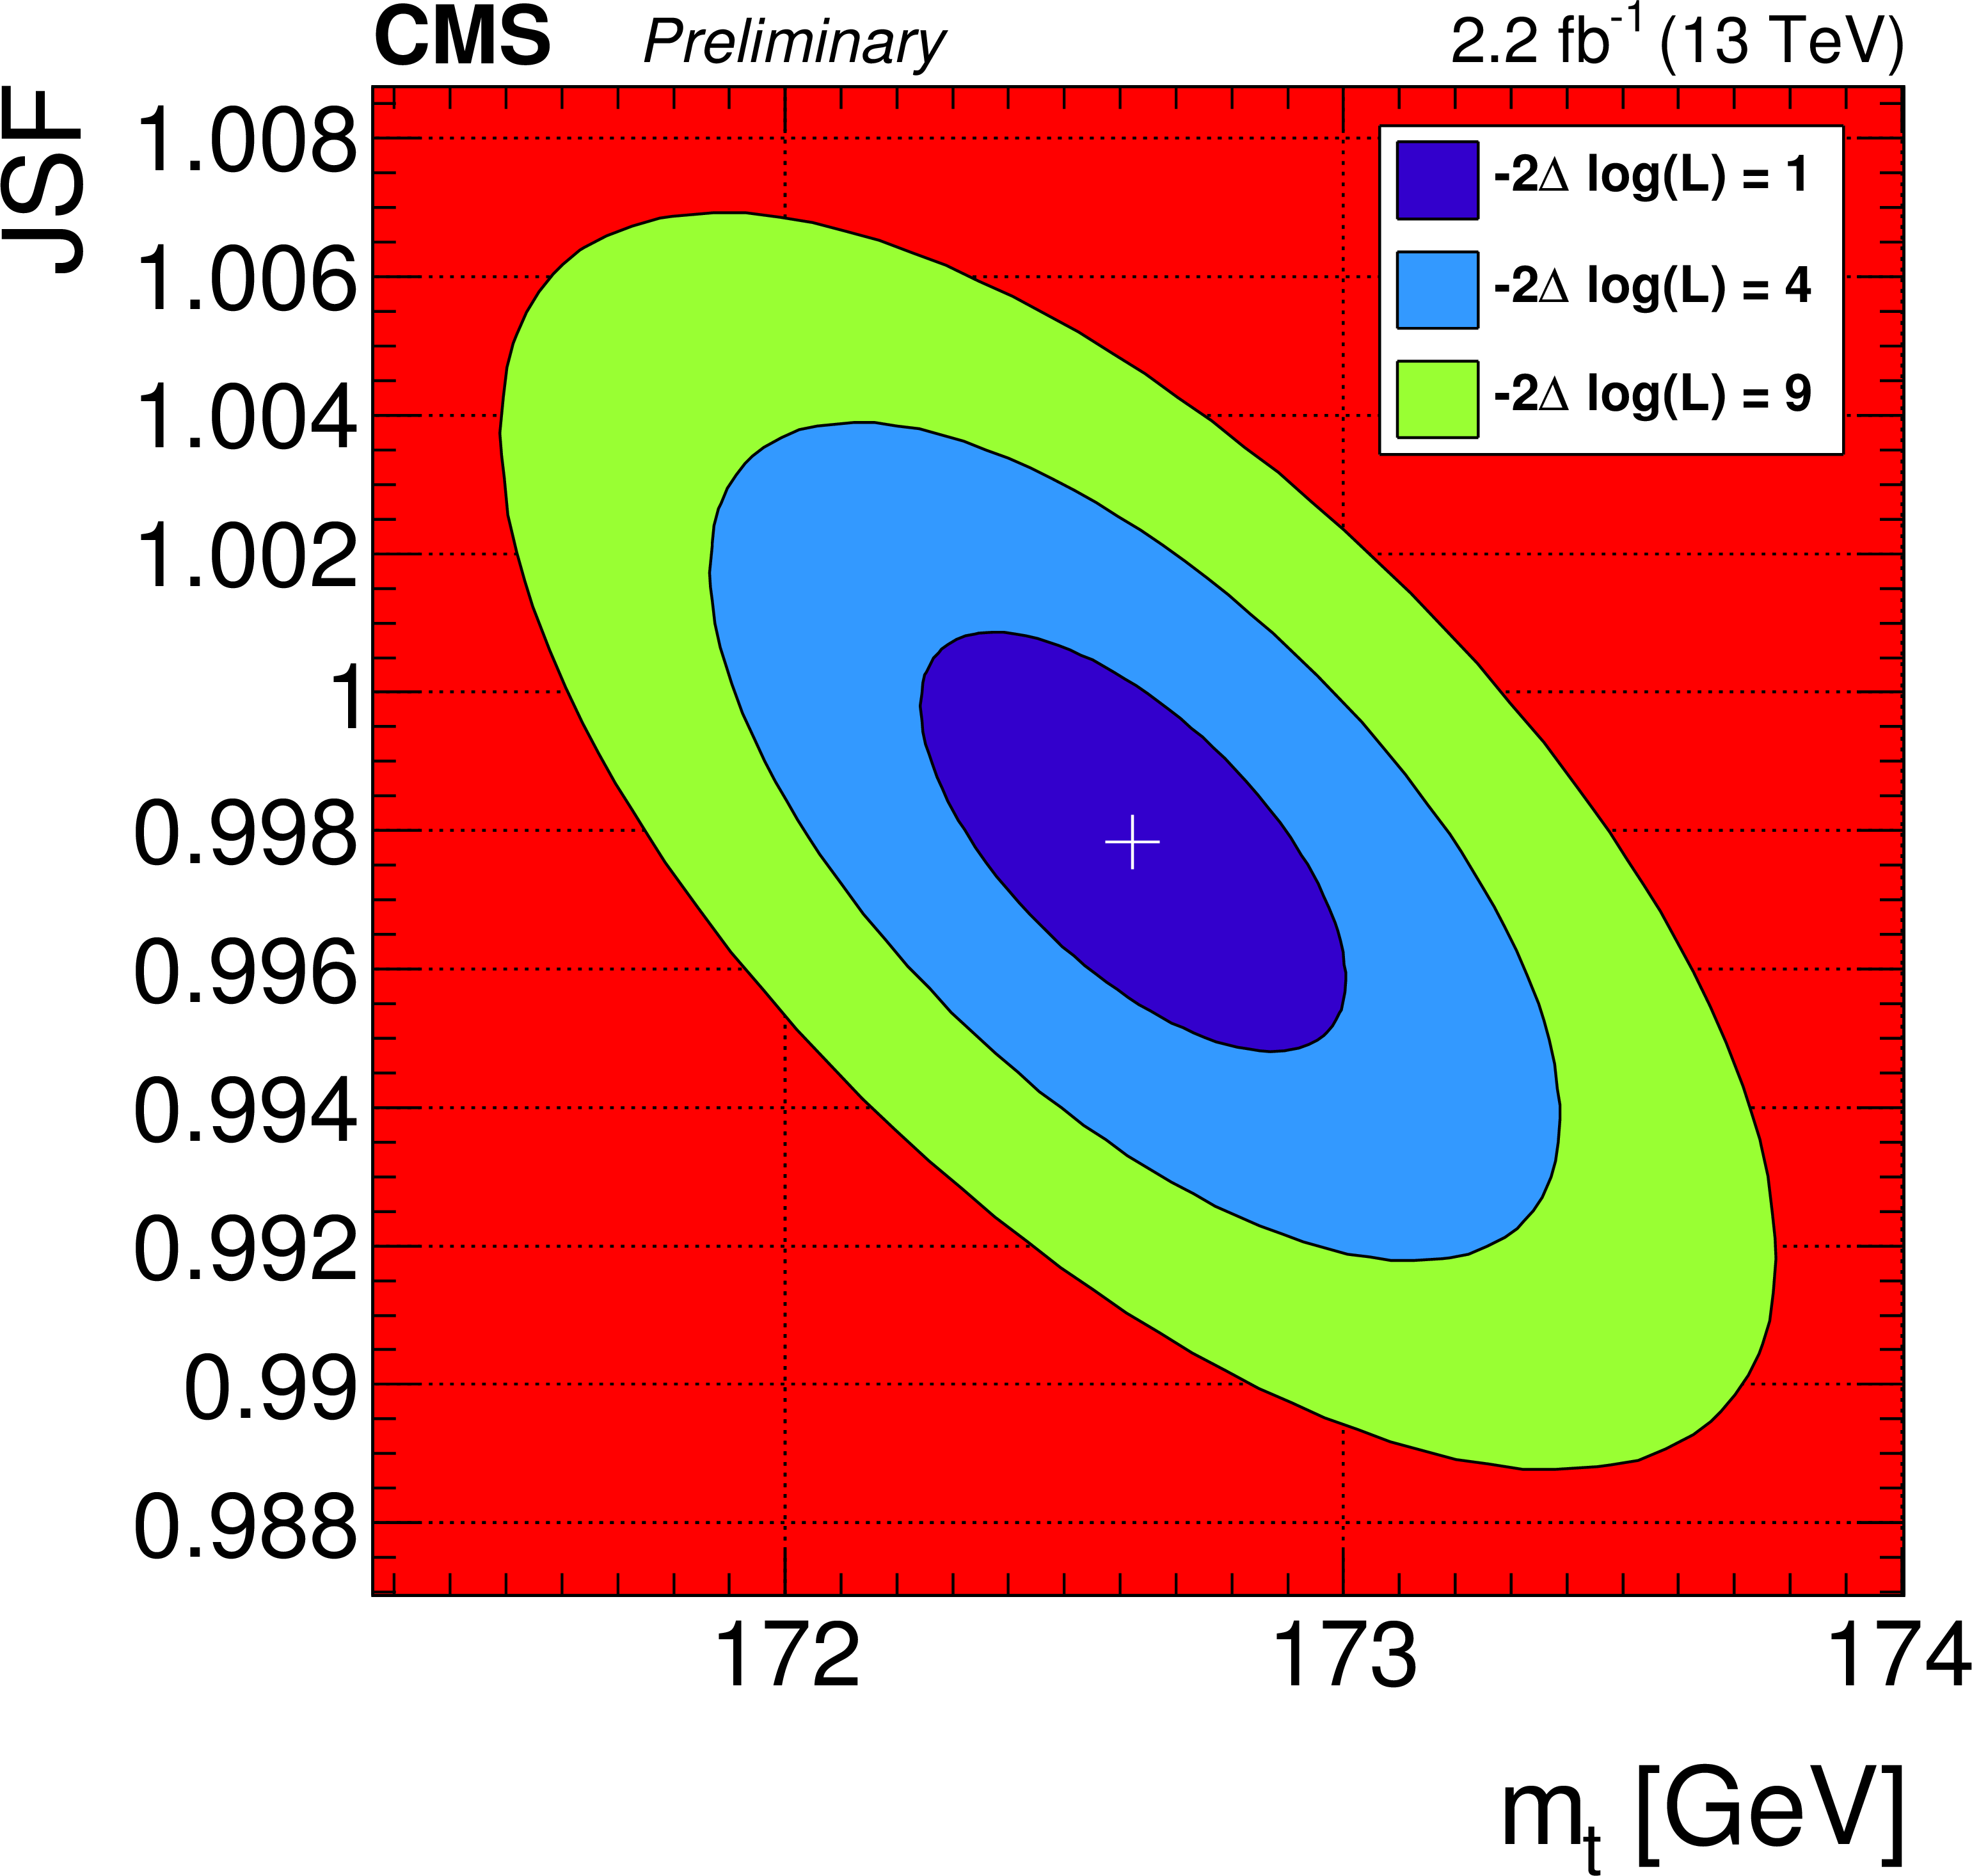
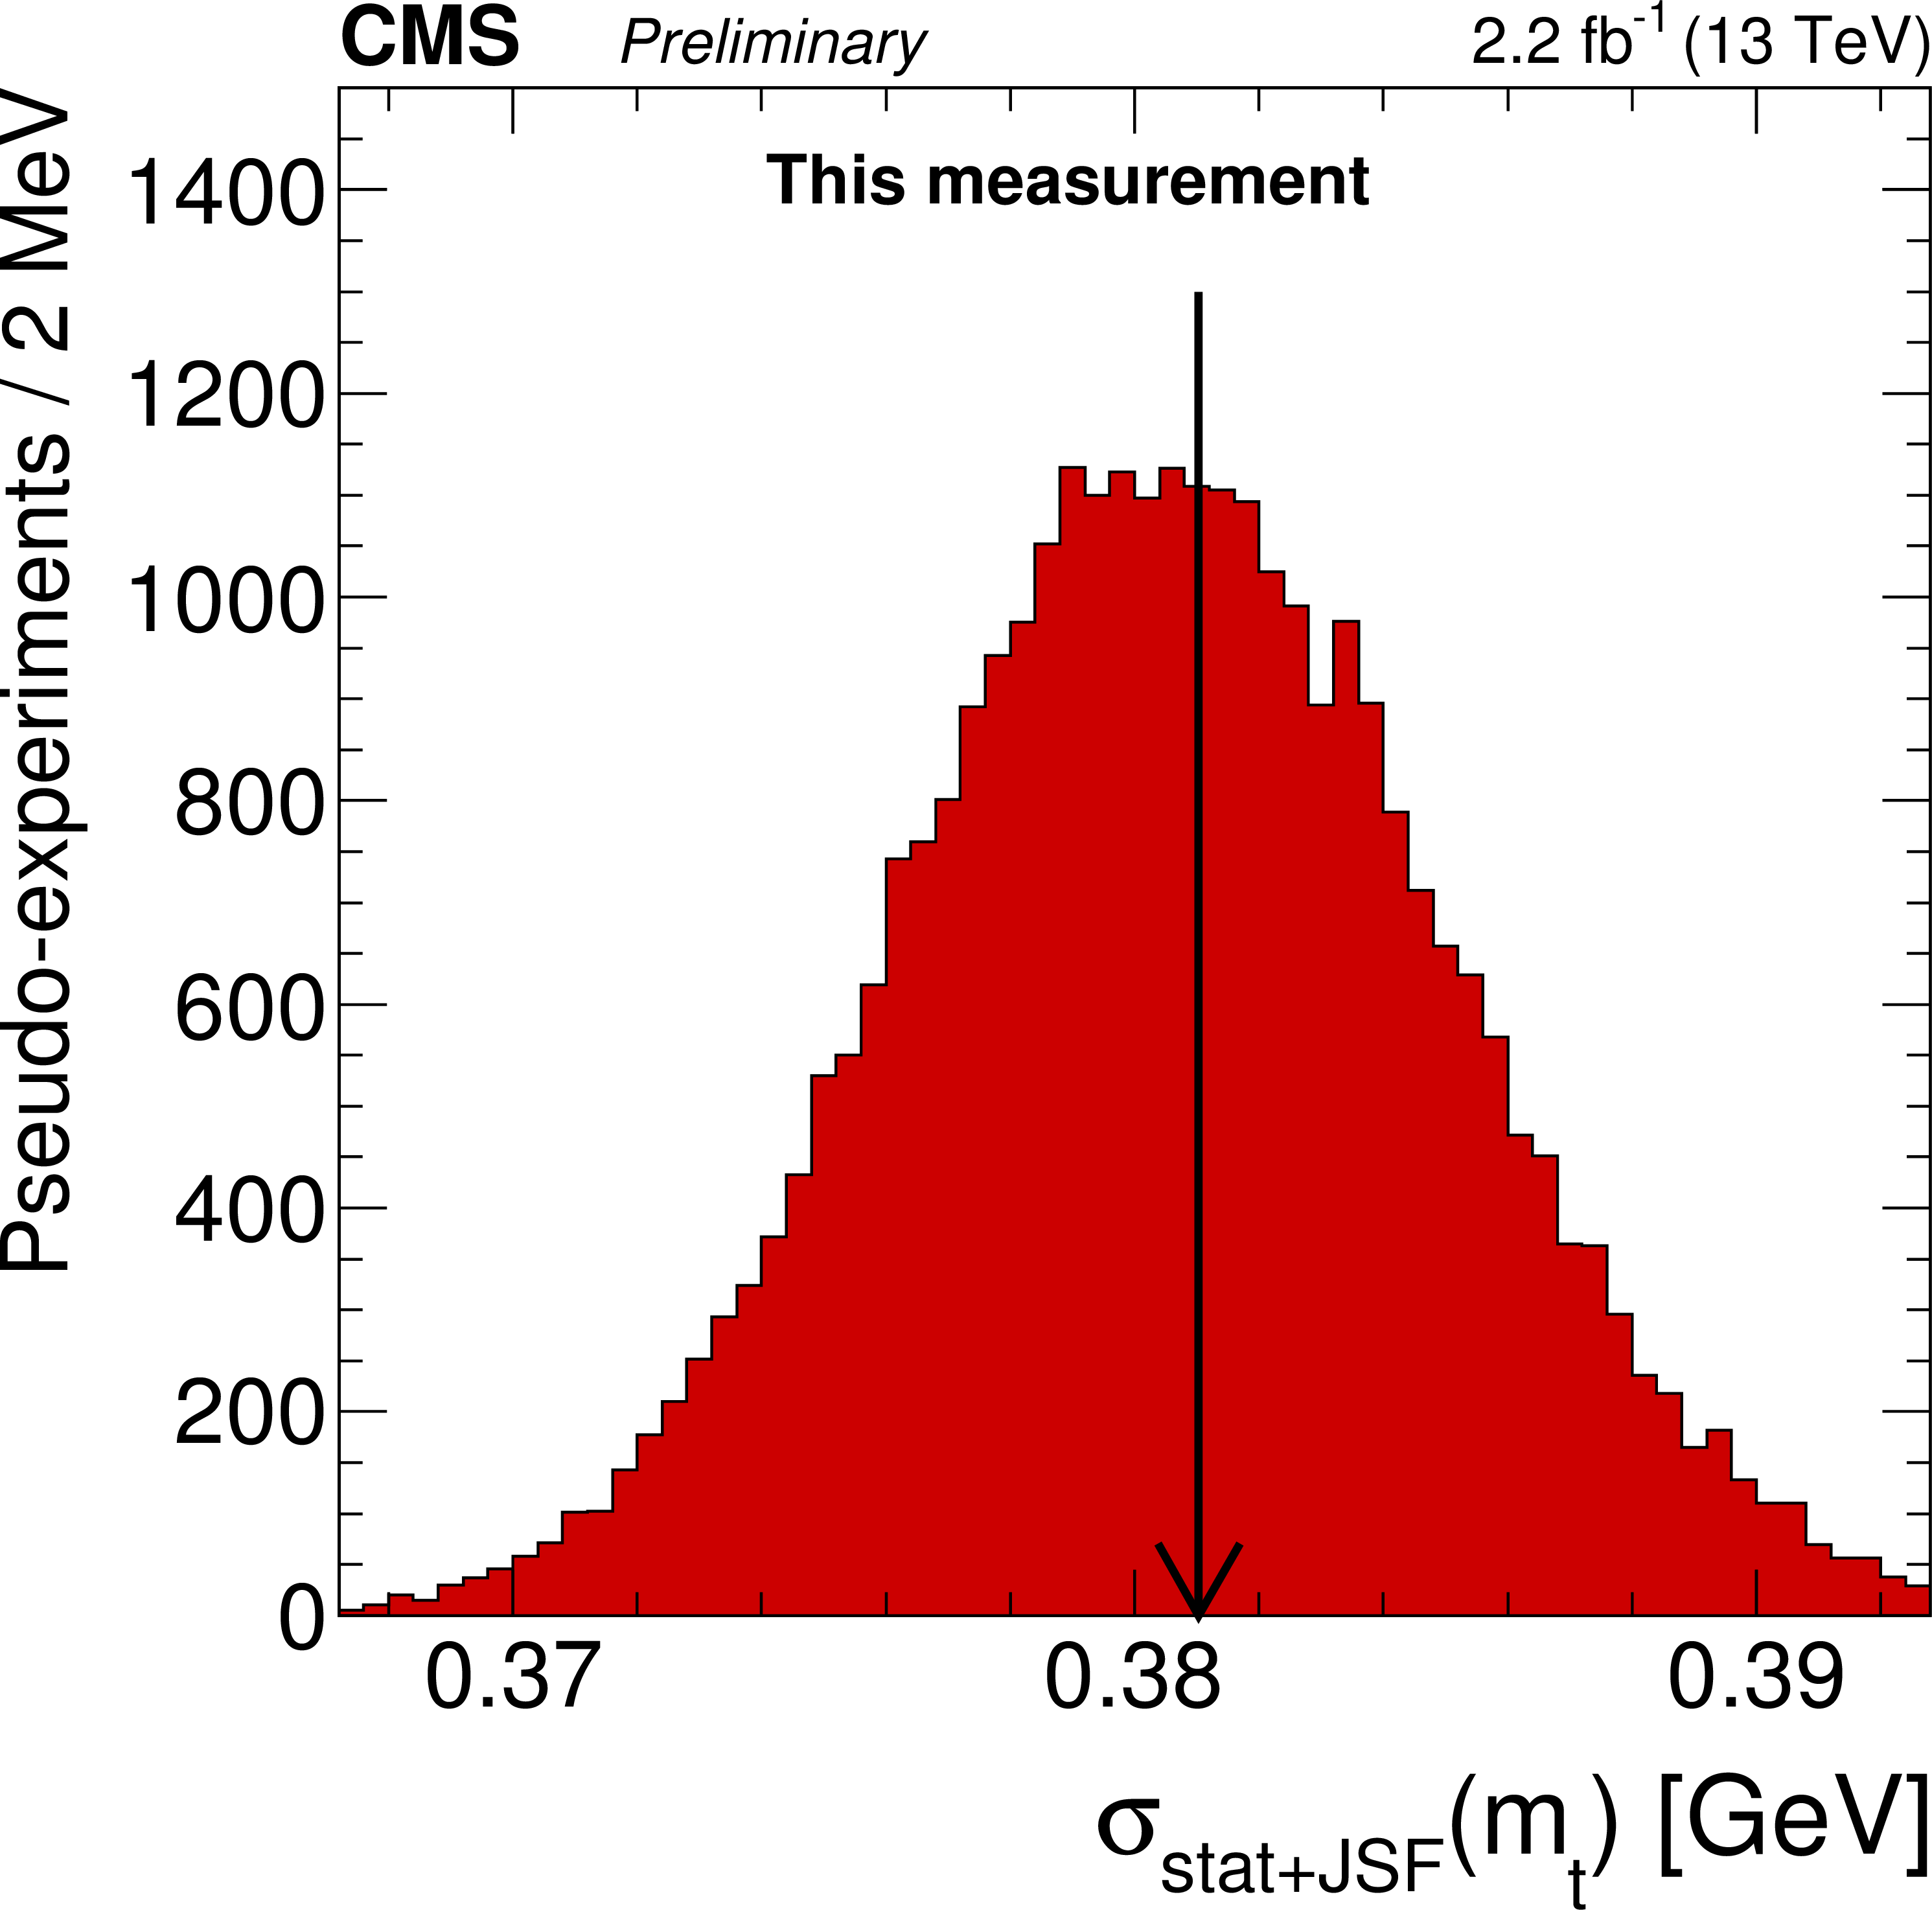
(a) The likelihood ($-2 \Delta \log\left (\mathcal {L}\right )$) measured for the muon+jets final state. The ellipses correspond to contours of $-2 \Delta \log\left (\mathcal {L}\right ) = $ 1 (4, 9) allowing the construction one (two, three) $\sigma $ statistical intervals of $ {m_{\mathrm{ t } }} $. (b) The statistical uncertainty distribution obtained from pseudo-experiments is compared to the uncertainty of the measurement in data. |
png pdf |
Figure 4-a:
The likelihood ($-2 \Delta \log\left (\mathcal {L}\right )$) measured for the muon+jets final state. The ellipses correspond to contours of $-2 \Delta \log\left (\mathcal {L}\right ) = $ 1 (4, 9) allowing the construction one (two, three) $\sigma $ statistical intervals of $ {m_{\mathrm{ t } }} $. |
png pdf |
Figure 4-b:
The statistical uncertainty distribution obtained from pseudo-experiments is compared to the uncertainty of the measurement in data. |
png pdf |
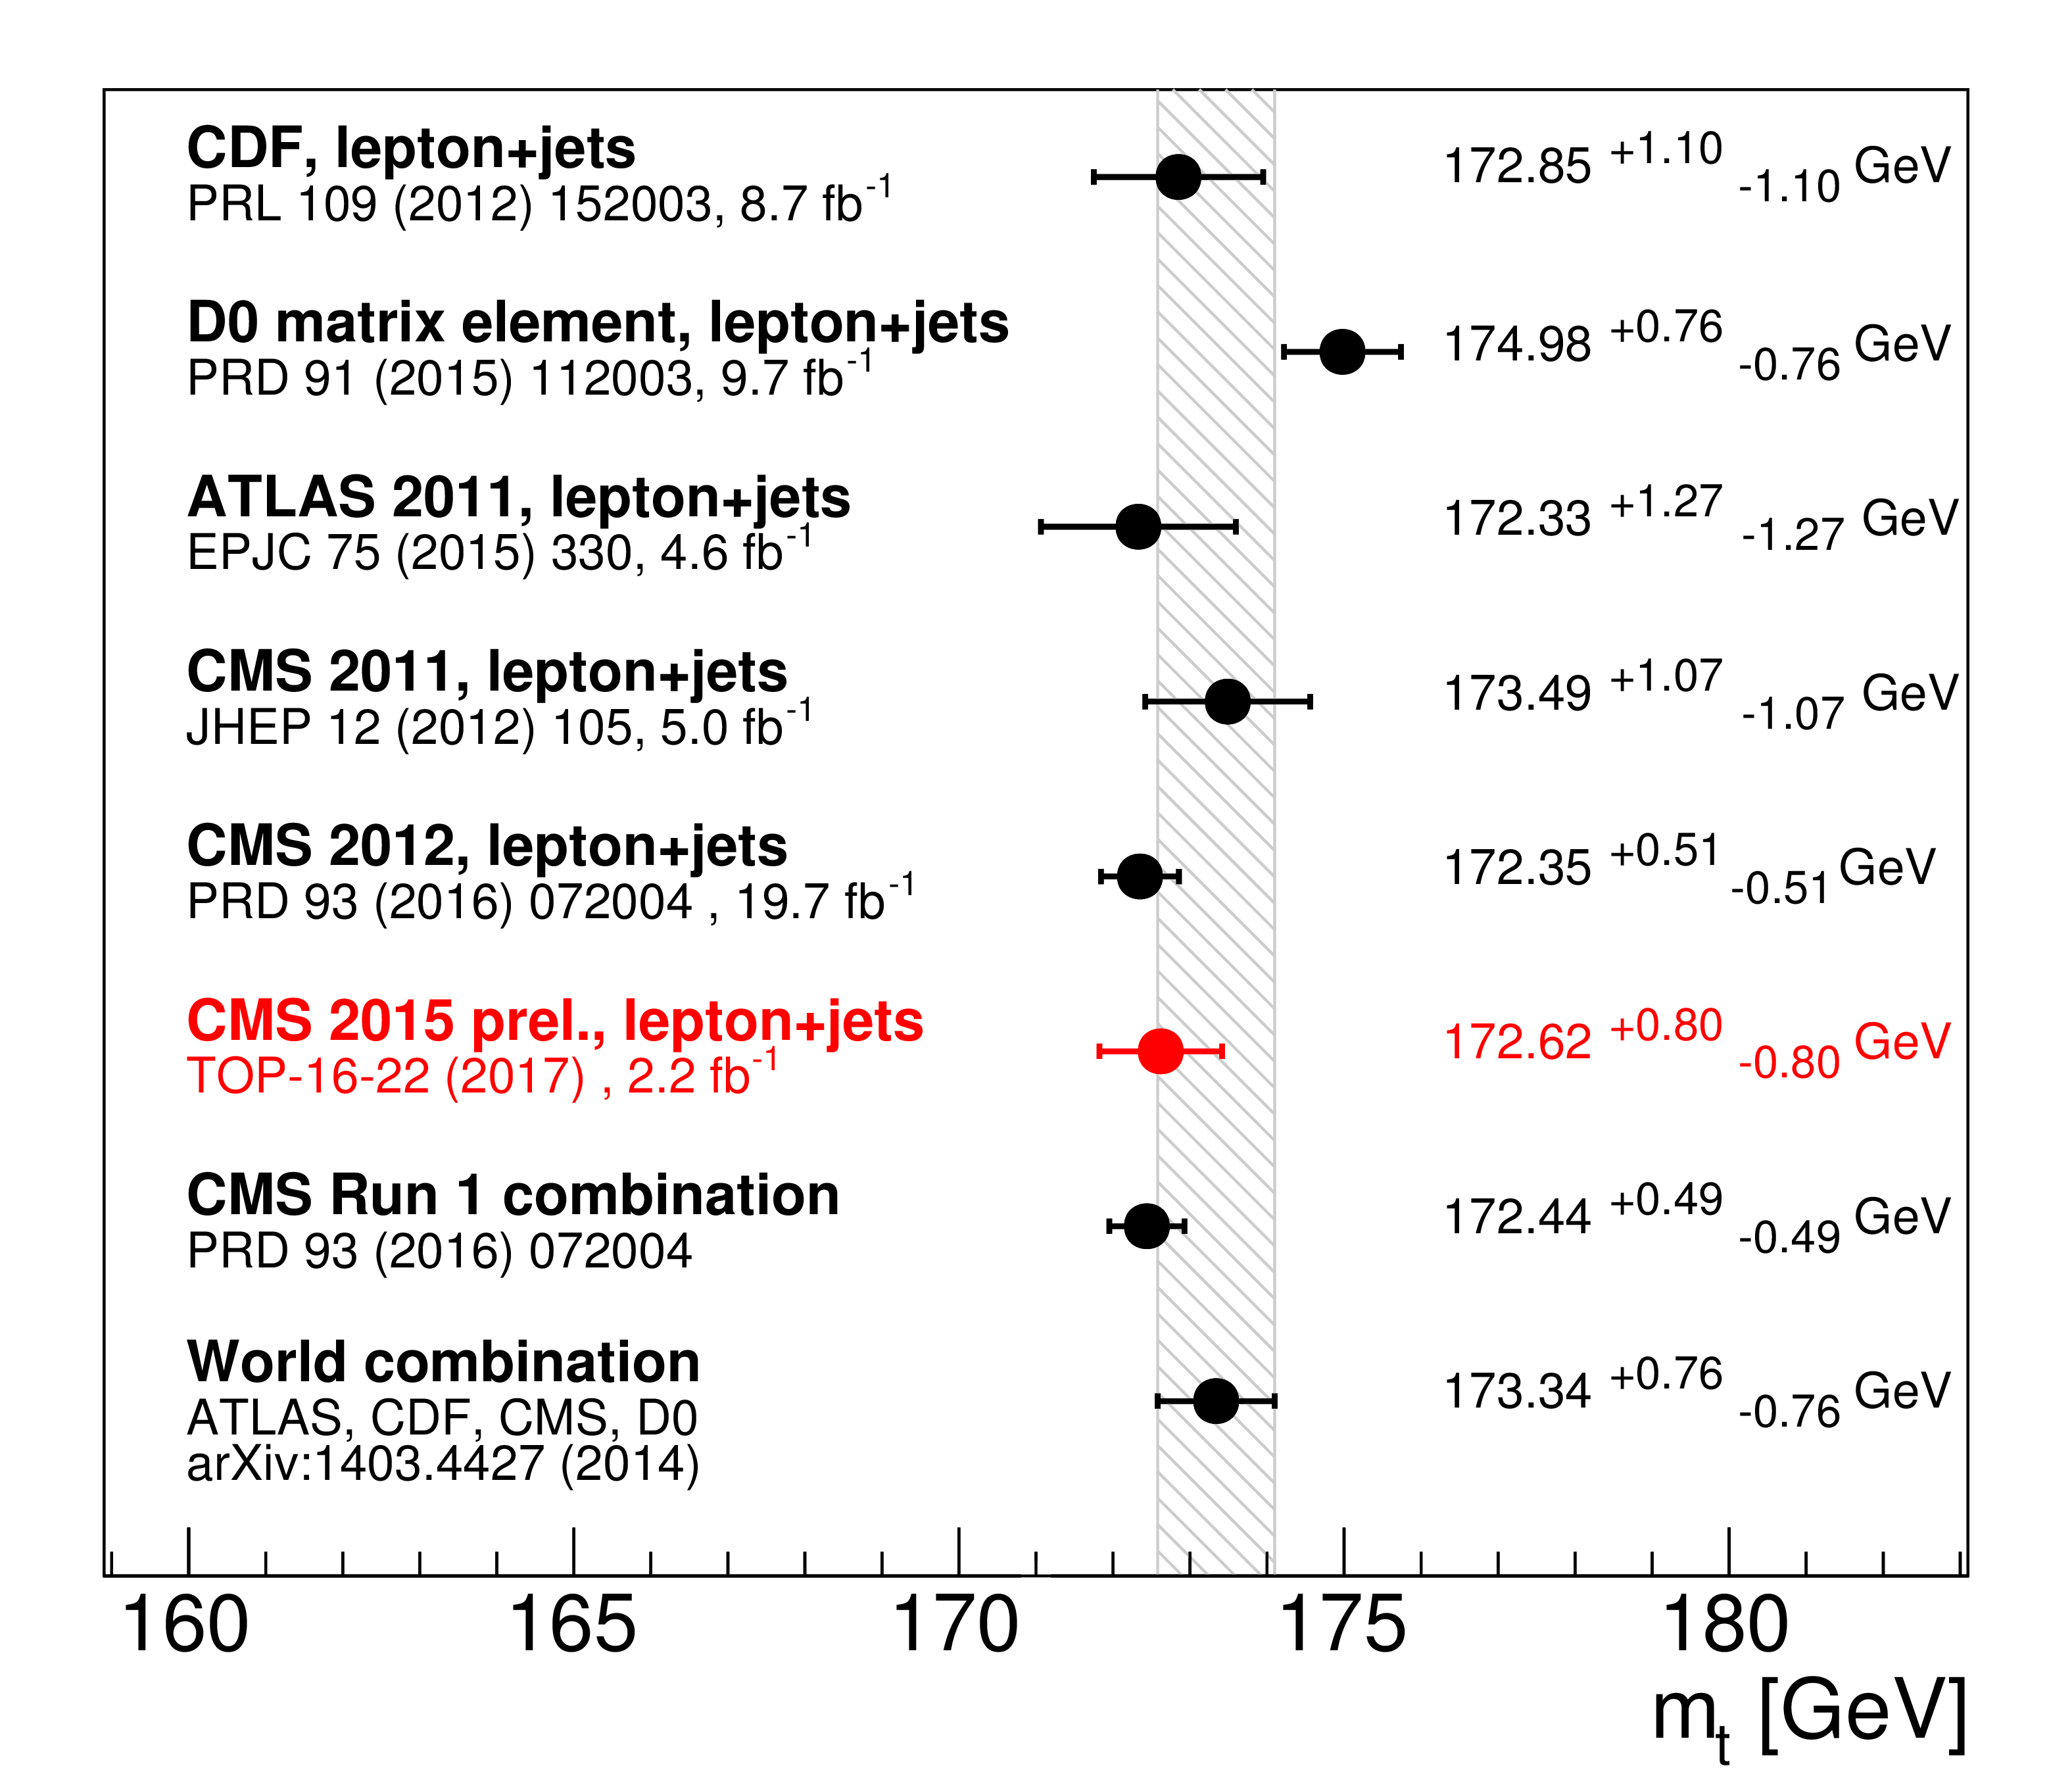
Figure 5:
Comparison of this result (in red) with previous measurements with lepton+jets final states [45,9,46,36,7] and the CMS [7] and world [47] averages. |
| Tables | |
png pdf |
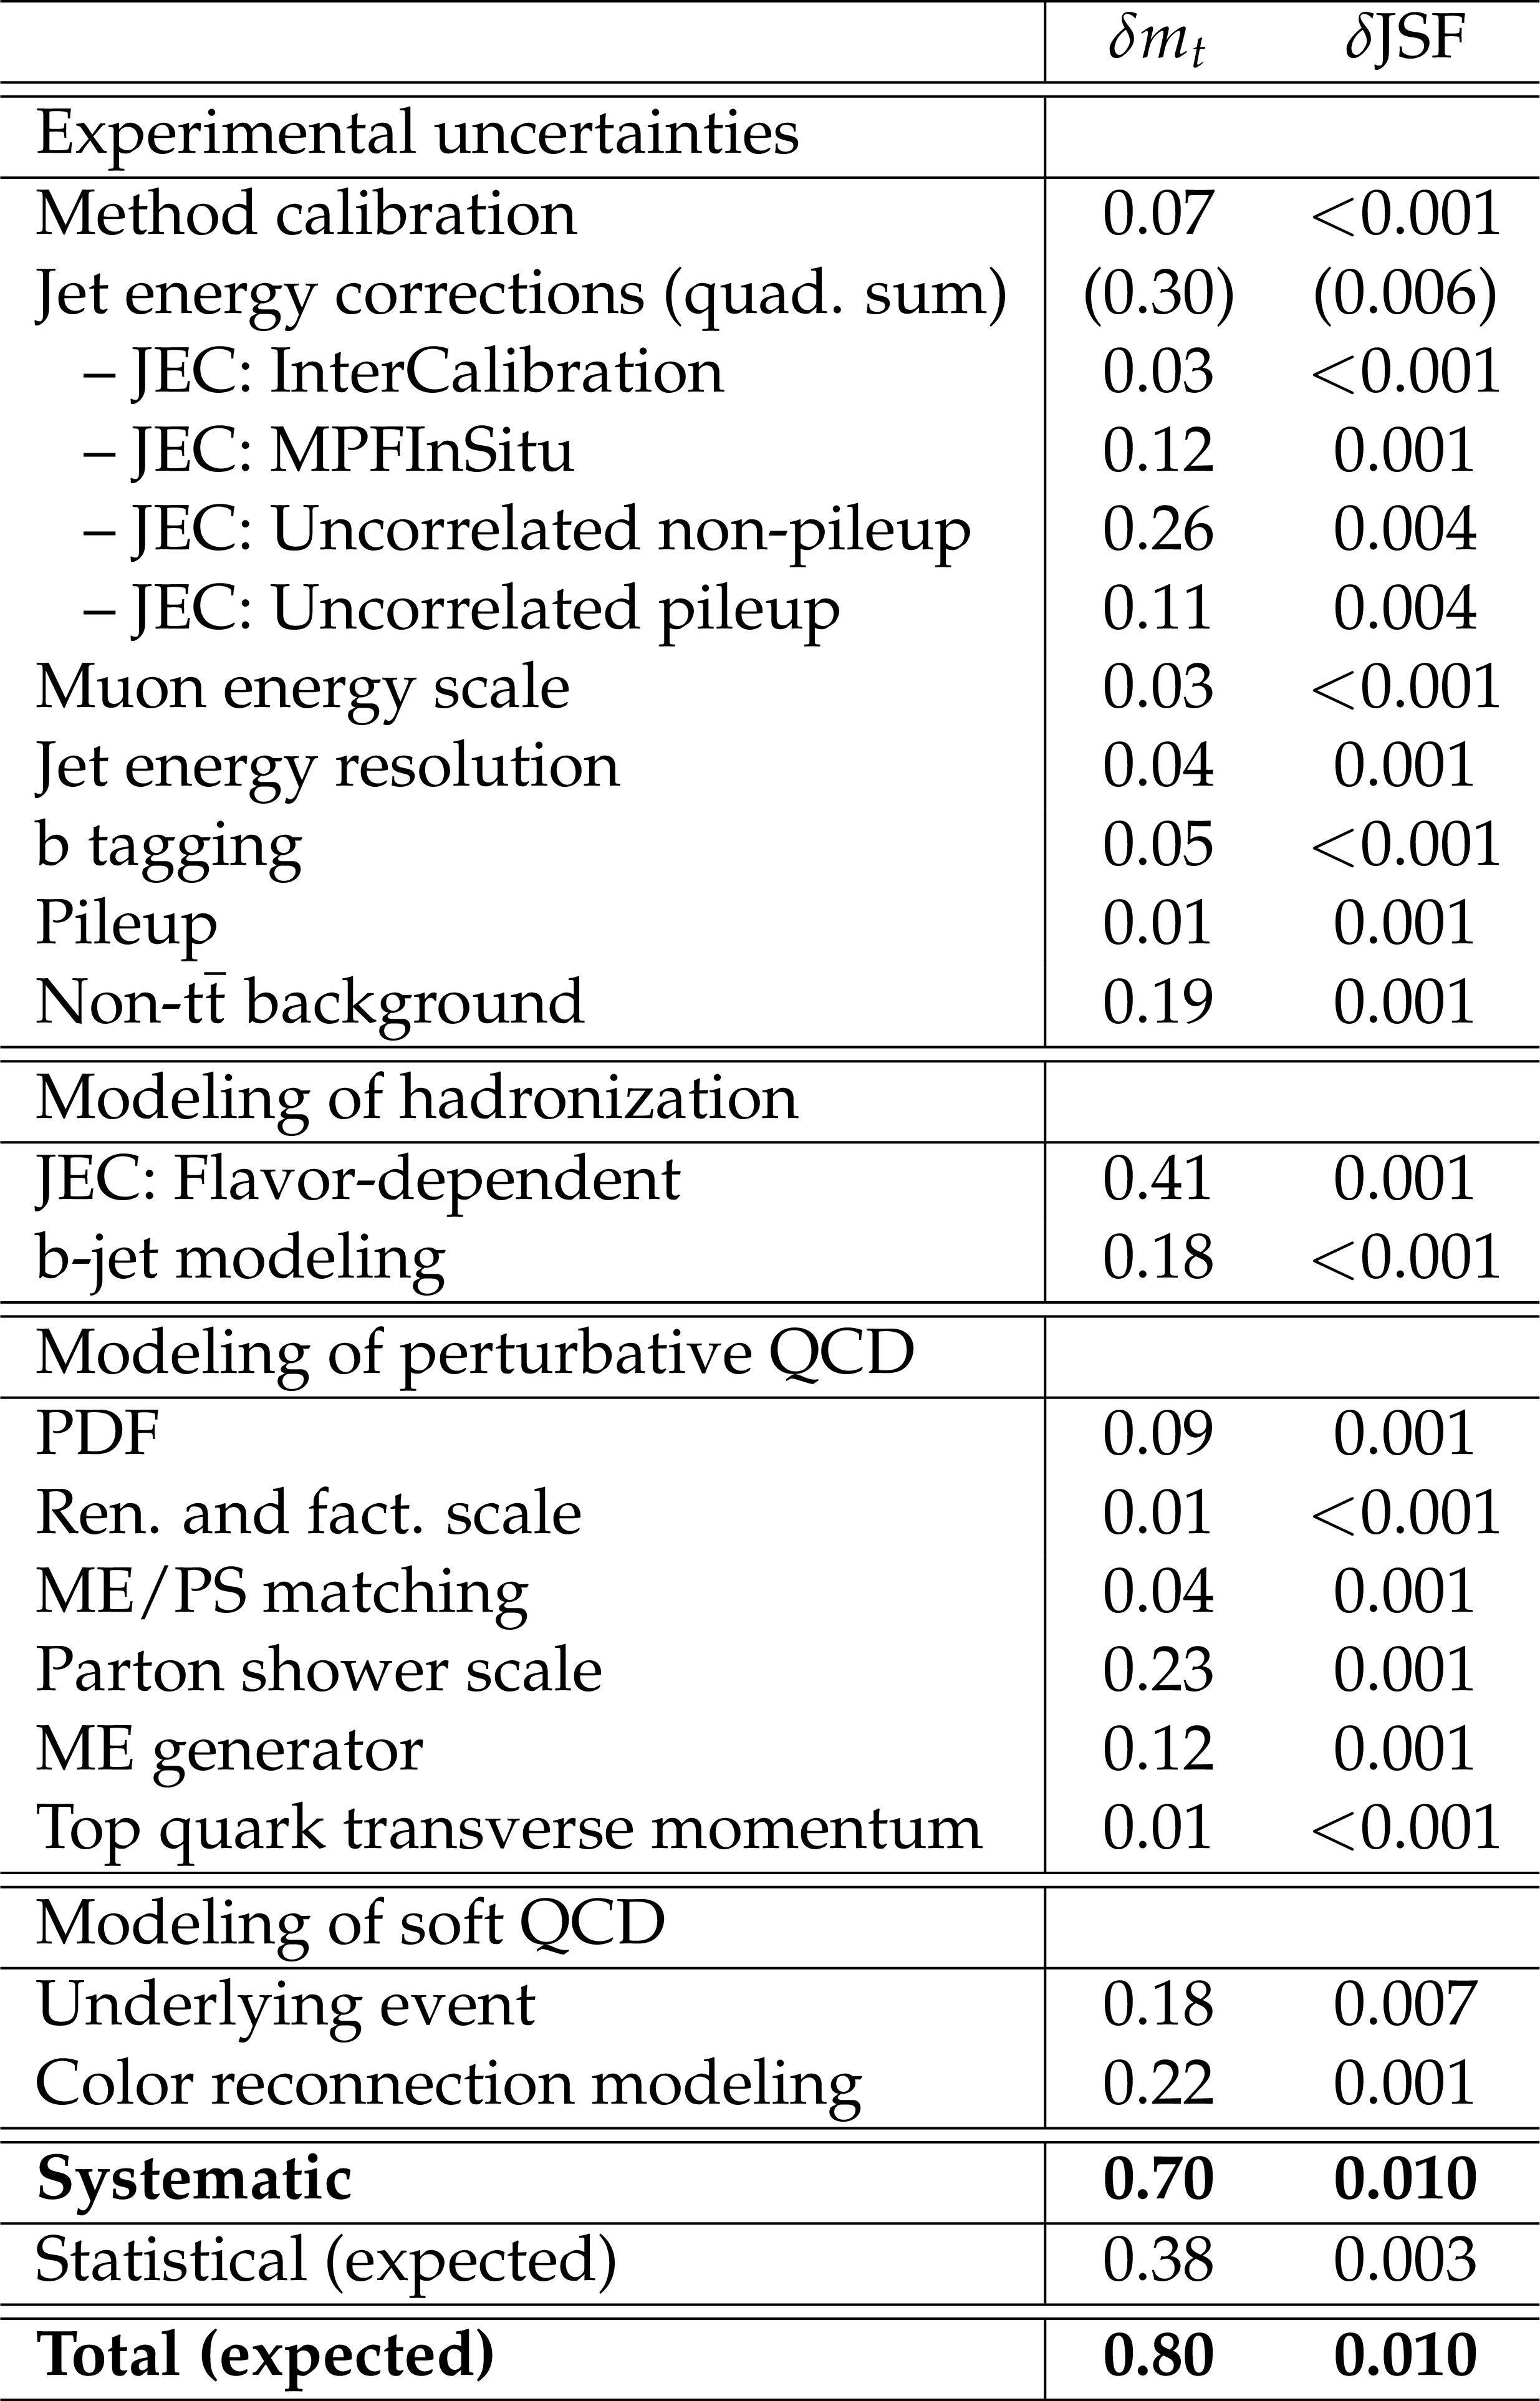
Table 1:
List of systematic uncertainties for the fit to the muon+jets data set. |
| Summary |
| The mass of the top quark has been measured with high precision by CMS in Run 1 of the LHC. The most precise of these measurements is repeated using the first data of Run 2 and POWHEG v2 interfaced to PYTHIA 8 with the CUETP8M1 tune for the simulation. Candidate events are selected from $\sqrt{s}= $ 13 TeV data corresponding to an integrated luminosity of 2.2 fb$^{-1}$ requiring one muon and at least four jets with two b tags in the final state. The top quark mass is measured to be 172.62 $\pm$ 0.38 (stat.+JSF) $\pm$ 0.70 (syst.) GeV from the 5798 selected events. This result is consistent with the CMS measurements of Run 1 and no impact from the new reference generator or changes in the experimental setup is observed. This preliminary measurement will serve as a reference for improved measurements of the top quark mass with the Run 2 data. |
| References | ||||
| 1 | K. A. Olive | Review of Particle Physics | CPC 40 (2016) 100001 | |
| 2 | S. Moch et al. | High precision fundamental constants at the TeV scale | DESY-14-081, MITP-14-036 | 1405.4781 |
| 3 | P. Marquard, A. V. Smirnov, V. A. Smirnov, and M. Steinhauser | Quark Mass Relations to Four-Loop Order in Perturbative QCD | PRL 114 (2015) 142002 | 1502.01030 |
| 4 | G. Corcella | Interpretation of the top-quark mass measurements: a theory overview | in Proceedings, 8th International Workshop on Top Quark Physics (TOP2015): Ischia, Italy | 1511.08429 |
| 5 | M. Beneke, P. Marquard, P. Nason, and M. Steinhauser | On the ultimate uncertainty of the top quark pole mass | DESY-16-082, TTP16-016, TUM-HEP-1044-16 | 1605.03609 |
| 6 | M. Butenschoen et al. | Top Quark Mass Calibration for Monte Carlo Event Generators | IFT-UAM-CSIC-16-069, FTUAM-16-28, MIT-CTP-4820, UWTHPH-2016-13, DESY-16-150 | 1608.01318 |
| 7 | CMS Collaboration | Measurement of the top quark mass using proton-proton data at $ \sqrt{s} = $ 7 and 8 TeV | PRD 93 (2016) 072004 | CMS-TOP-14-022 1509.04044 |
| 8 | CMS Collaboration | Combinations of the CMS alternative technique measurements of the top quark mass | CMS-PAS-TOP-15-012 | CMS-PAS-TOP-15-012 |
| 9 | D0 Collaboration | Precision measurement of the top-quark mass in lepton+jets final states | PRD 91 (2015) 112003 | 1501.07912 |
| 10 | CMS Collaboration | The CMS experiment at the CERN LHC | JINST 3 (2008) S08004 | CMS-00-001 |
| 11 | CMS Collaboration | CMS Luminosity Measurement for the 2015 Data Taking Period | CMS-PAS-LUM-15-001 | CMS-PAS-LUM-15-001 |
| 12 | CMS Collaboration | Measurement of differential cross sections for top quark pair production using the lepton+jets final state in proton-proton collisions at 13 TeV | Accepted for publication in PRD | CMS-TOP-16-008 1610.04191 |
| 13 | P. Nason | A new method for combining NLO QCD with shower Monte Carlo algorithms | JHEP 11 (2004) 040 | hep-ph/0409146 |
| 14 | S. Frixione, P. Nason, and C. Oleari | Matching NLO QCD computations with parton shower simulations: the POWHEG method | JHEP 11 (2007) 070 | 0709.2092 |
| 15 | S. Alioli, P. Nason, C. Oleari, and E. Re | A general framework for implementing NLO calculations in shower Monte Carlo programs: the POWHEG BOX | JHEP 06 (2010) 043 | 1002.2581 |
| 16 | J. M. Campbell, R. K. Ellis, P. Nason, and E. Re | Top-pair production and decay at NLO matched with parton showers | JHEP 04 (2015) 114 | 1412.1828 |
| 17 | T. Sjostrand, S. Mrenna, and P. Z. Skands | PYTHIA 6.4 physics and manual | JHEP 05 (2006) 026 | hep-ph/0603175 |
| 18 | T. Sjostrand, S. Mrenna, and P. Z. Skands | A Brief Introduction to PYTHIA 8.1 | CPC 178 (2008) 852--867 | 0710.3820 |
| 19 | P. Skands, S. Carrazza, and J. Rojo | Tuning PYTHIA 8.1: the Monash 2013 Tune | EPJC 74 (2014) 3024 | 1404.5630 |
| 20 | J. Alwall et al. | The automated computation of tree-level and next-to-leading order differential cross sections, and their matching to parton shower simulations | JHEP 07 (2014) 079 | 1405.0301 |
| 21 | NNPDF Collaboration | Parton distributions for the LHC Run II | JHEP 04 (2015) 040 | 1410.8849 |
| 22 | M. Czakon and A. Mitov | Top++: A Program for the Calculation of the Top-Pair Cross-Section at Hadron Colliders | CPC 185 (2014) 2930 | 1112.5675 |
| 23 | Y. Li and F. Petriello | Combining QCD and electroweak corrections to dilepton production in FEWZ | PRD 86 (2012) 094034 | 1208.5967 |
| 24 | P. Kant et al. | HatHor for single top-quark production: Updated predictions and uncertainty estimates for single top-quark production in hadronic collisions | CPC 191 (2015) 74 | 1406.4403 |
| 25 | N. Kidonakis | NNLL threshold resummation for top-pair and single-top production | Phys. Part. Nucl. 45 (2014) 714 | 1210.7813 |
| 26 | GEANT4 Collaboration | GEANT4---a simulation toolkit | NIMA 506 (2003) 250 | |
| 27 | J. Allison et al. | Geant4 developments and applications | IEEE Trans. Nucl. Sci. 53 (2006) 270 | |
| 28 | CMS Collaboration | Commissioning of the Particle-Flow Reconstruction in Minimum-Bias and Jet Events from pp Collisions at 7 TeV | CDS | |
| 29 | M. Cacciari and G. P. Salam | Dispelling the $ N^{3} $ myth for the $ k_{\rm t} $ jet-finder | PLB 641 (2006) 57 | hep-ph/0512210 |
| 30 | M. Cacciari, G. P. Salam, and G. Soyez | The anti-$ k_{\rm t} $ jet clustering algorithm | JHEP 04 (2008) 063 | 0802.1189 |
| 31 | M. Cacciari, G. P. Salam, and G. Soyez | FastJet user manual | EPJC 72 (2012) 1896 | 1111.6097 |
| 32 | CMS Collaboration | Jet energy scale and resolution in the CMS experiment in pp collisions at 8 TeV | JINST 12 (2017) P02014 | CMS-JME-13-004 1607.03663 |
| 33 | CMS Collaboration | Identification of b quark jets at the CMS experiment in the LHC Run 2 | CMS-PAS-BTV-15-001 | CMS-PAS-BTV-15-001 |
| 34 | \DZERO Collaboration | Direct measurement of the top quark mass at D0 | PRD 58 (1998) 052001 | hep-ex/9801025 |
| 35 | DELPHI Collaboration | Measurement of the mass and width of the W boson in $ {\rm e}^{+}{\rm e}^{-} $ collisions at $ \sqrt{s} = $ 161-209 GeV | EPJC 55 (2008) 1 | 0803.2534 |
| 36 | CMS Collaboration | Measurement of the top-quark mass in $ t\bar{t} $ events with lepton+jets final states in $ pp $ collisions at $ \sqrt{s} = $ 7 TeV | JHEP 12 (2012) 105 | CMS-TOP-11-015 1209.2319 |
| 37 | ATLAS and CMS Collaborations | Jet energy scale uncertainty correlations between ATLAS and CMS at 8 TeV | ATL-PHYS-PUB-2015-049, CMS-PAS-JME-15-001 | |
| 38 | CMS Collaboration | Performance of CMS muon reconstruction in pp collision events at $ \sqrt{s} = $ 7 TeV | JINST 7 (2012) P10002 | CMS-MUO-10-004 1206.4071 |
| 39 | M. Bahr et al. | Herwig++ physics and manual | EPJC 58 (2008) 639 | 0803.0883 |
| 40 | ALEPH Collaboration | Study of the fragmentation of b quarks into B mesons at the Z peak | PLB 512 (2001) 30--48 | hep-ex/0106051 |
| 41 | DELPHI Collaboration | A study of the b-quark fragmentation function with the DELPHI detector at LEP I and an averaged distribution obtained at the Z Pole | EPJC 71 (2011) 1557 | 1102.4748 |
| 42 | CMS Collaboration | Investigations of the impact of the parton shower tuning in Pythia 8 in the modelling of $ \mathrm{t\overline{t}} $ at $ \sqrt{s}= $ 8 and 13 TeV | CMS-PAS-TOP-16-021 | CMS-PAS-TOP-16-021 |
| 43 | M. Czakon, D. Heymes, and A. Mitov | High-precision differential predictions for top-quark pairs at the LHC | PRL 116 (2016) 082003 | 1511.00549 |
| 44 | CMS Collaboration | Measurement of the differential cross section for $ \mathrm{t \bar t} $ production in the dilepton final state at $ \sqrt{s}= $ 13 TeV | CMS-PAS-TOP-16-011 | CMS-PAS-TOP-16-011 |
| 45 | CDF Collaboration | Precision Top-Quark Mass Measurement at CDF | PRL 109 (2012) 152003 | |
| 46 | ATLAS Collaboration | Measurement of the top quark mass in the $ t\bar{t}\rightarrow \text{ lepton+jets } $ and $ t\bar{t}\rightarrow \text{ dilepton } $ channels using $ \sqrt{s}= $ 7 TeV ATLAS data | EPJC 75 (2015) 330 | 1503.05427 |
| 47 | ATLAS, CDF, CMS, \DZERO Collaborations | First combination of Tevatron and LHC measurements of the top-quark mass | ATLAS-CONF-2014-008, CDF-NOTE-11071, CMS-PAS-TOP-13-014, D0-NOTE-6416 | 1403.4427 |
|
|
Compact Muon Solenoid LHC, CERN |
|

|

|

|

|

|